supporting and evaluating broad scale implementation of positive behavior support teri lewis-palmer...
TRANSCRIPT

Supporting and Evaluating Broad Scale Implementation of Positive Behavior Support
Teri Lewis-Palmer
University of Oregon

Acknowledgements
Students, educators, administrators, school staff, families,….
Community of researchers, personnel preparers, system changers, staff developers,….
Offices of Special Education Programs, US Dept. of Ed.

Research to Practice (Wing Institute, 2005)
Efficacy (what works?) Effectiveness (when does it work?) Implementation (how do we make it
work?) Monitoring (is it working?)

Challenges to Implementation(Kratochwill, Albers, & Steele Shernoff, 2004)
Primary focus on education Lack of emphasis on prevention programs Organization impedes collaboration,
working as team Lack of skills, training, resources

Positive Behavior Support (PBS)
PBS is a systems approach to proactive school-wide discipline that is designed to increase the capacity of schools to adopt and sustain research-validated practices for all students. Systems Data Practices

SYST
EMS
PRACTICES
DATASupportingStaff Behavior
SupportingDecisionMaking
SupportingStudent Behavior
PositiveBehaviorSupport OUTCOMES
Social Competence &Academic Achievement

Generic Model School-wide PBS Team
Represent school, meet regularly, etc
Coach Provide technical assistance to school Link school to state
State Leadership Team Guide planning and development Coordinate Training Regional Teams/Structure

Year One Getting Started (Summer/Fall)
Overview, School-wide, Non-classroom, Data Decisions, Team meetings, Team Planning
Expanding Implementation (Winter) Classroom, Escalation Cycle, Team Status Check, Team
planning
Sustaining Efforts (Spring) Individual Student, Targeted-group, Team Planning, Long-term
Action Planning

Year Two
Intensive Behavior Support Linking with other initiatives
(i.e., academics, bullyproofing, RtI) District/Regional Systems Working with Parents and Community Roadblocks and Challenges

Critical Features High status leadership team Active administrator participation High priority in school improvement planning Proactive (positive and preventive) systems approach Data-based decision making Continuum of behavior supports Long term commitment Research validated practices

Nonclass
room
Setting S
ystems
ClassroomSetting Systems
Individual Student
Systems
School-wideSystems
School-wide PositiveBehavior Support
Systems

Emphasis on Prevention
Primary Reduce new cases of problem behavior
Secondary Reduce current cases of problem behavior
Tertiary Reduce complications, intensity, severity of
current cases

Academic Systems Behavioral Systems
1-5% 1-5%
5-10% 5-10%
80-90% 80-90%
Intensive, Individual Interventions•Individual Students•Assessment-based•High Intensity
Intensive, Individual Interventions•Individual Students•Assessment-based•Intense, durable procedures
Targeted Group Interventions•Some students (at-risk)•High efficiency•Rapid response
Targeted Group Interventions•Some students (at-risk)•High efficiency•Rapid response
Universal Interventions•All students•Preventive, proactive
Universal Interventions•All settings, all students•Preventive, proactive
Designing School-Wide Systems for Student Success

School-wide & Classroom-wide Systems
Common approach to discipline
Positive expectations
Teach expected behavior
Encourage expected behavior
Discourage inappropriate behavior
On-going monitoring & evaluation

Classroom Management Systems
Behavior & classroom management Instructional management Environmental management

Specific Setting Systems
Routines Active supervision by all staff
Scan, move, interact Precorrections & reminders Positive reinforcement

Individual Student Systems
Behavioral competence Function-based behavior support planning Team-based model Data-based decision making Comprehensive person-centered planning &
wraparound processes

Maryland Model
Collaboration between schools, MSDE, Sheppard Pratt, and Johns Hopkins Began in 1999 24 local school systems Over 230 schools About 120 coaches State Leadership Team

Maryland Model, cont. State Level
State Leadership Team District/Regional Coordinators
School Level Coaches Teams
Training Summer Institute Regional Trainings

Overview of Evaluation Model
What schools are involved in the implementation?
How well are schools with implementation?
What impact has implementation had on student success?

Who is Implementing?
232 School Teams have completed training (16% of Maryland Schools)
217 Currently active schools Attrition occurred early in the project when
coaches and other regional technical assistance structures were not established

Schools Trained and Active

Expansion Highlights 65% of total schools were trained within the past two
years
35% of total schools were trained last year (summer 2004)
Anne Arundel (Ginny Dolan), Baltimore (Joey Levina-Parr) and Charles (Elsa Velez) Counties all have had rapid expansion as a result of identifying a facilitator (lead coach)

How Well are Schools Implementing?
Systems-wide Evaluation Tool (SET) Annually 7 features of SW implementation Interviews, product review, observations

SET
96 SETs completed during 03-04 SY 50 schools have SETs for 2 years 80% Total score is considered
sustainability level All regions met 80% criterion across
schools This represents a 47% increase

Pre-Post SETs by Region
48 48
25 28
39 42
82 8488
808888
0102030405060708090
100
AnneArundel Central EasternSouthern
Special Western
Pre Post

What is the Impact of Implementation?
Team Checklist Staff Survey Student Behavior (ODR)

Two Levels
Getting Started On-going
Central 67 64Eastern Shore 83 79South 70 55West 77 63Baltimore City 41 11

Staff Survey
Only 7 staff surveys have been turned in Not enough data to make valid summary Only measure that includes staff feedback
and perceptions Piloting on-line entry and summary of
measures
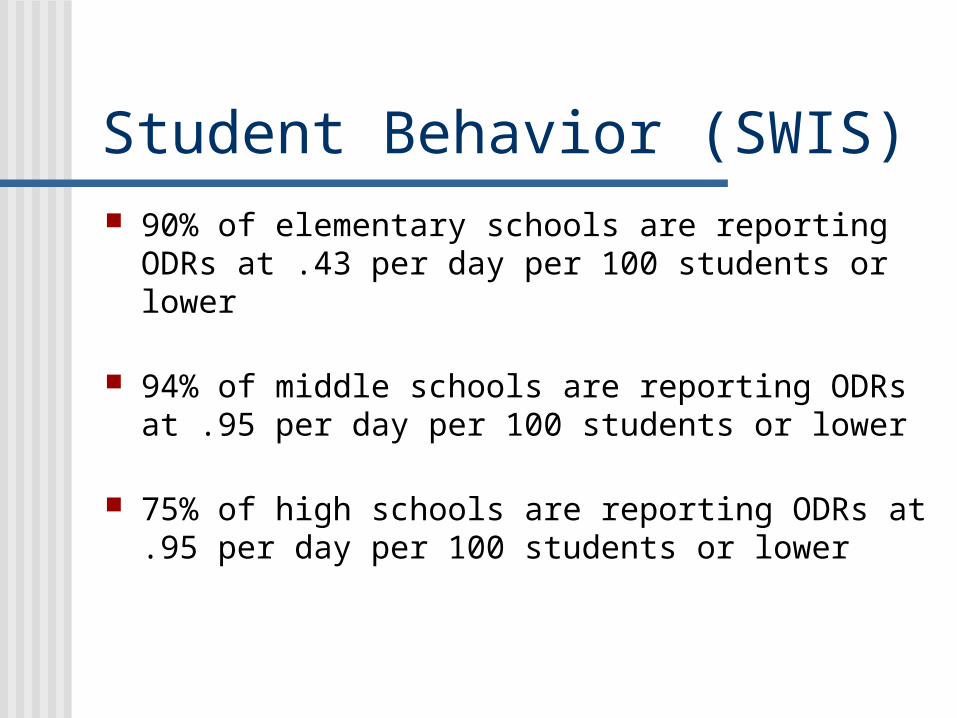
Student Behavior (SWIS) 90% of elementary schools are reporting ODRs at .43
per day per 100 students or lower
94% of middle schools are reporting ODRs at .95 per day per 100 students or lower
75% of high schools are reporting ODRs at .95 per day per 100 students or lower

Fidelity of Data
85% of active schools are returning data to Coaches/State Leadership Team

Sustainability Assumptions
Implemented with high accuracy Sustained to realize durable changes and
expand efforts Implemented by local/natural resources Adapted to “fit” culture Guided by data-based decisions Supported by systems to support staff
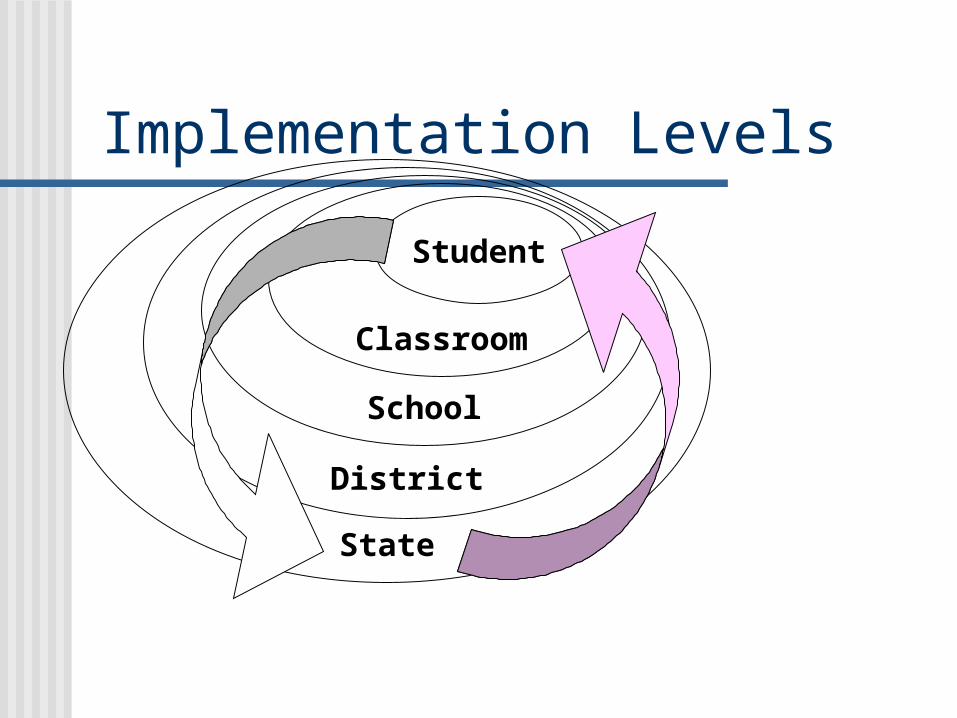
Implementation Levels
Student
Classroom
School
State
District

Leadership Team
FundingVisibility Political
Support
Training Coaching Evaluation
Active Coordination
Local School Teams/Demonstrations
PBS Organizational Logic