supporting information - pnas · supporting information ... each of the four examined acyl-coa...
TRANSCRIPT

Supporting InformationGachon et al. 10.1073/pnas.1002862108SI Experimental ProceduresAnimal Experiments. WY14643 treatment by intraperitoneal injection.Two groups of six proline- and acidic amino acid-richdomain basic leucine zipper (PAR bZip) 3KO male mice wereinjected intraperitoneally at ZT2 with 100 mg∕Kg WY14643(Biomol International) (10 mg∕mL in 50% DMSO) or theequivalent volume of vehicle. Four hours after injection, micewere killed and livers were removed and snap-frozen in liquidnitrogen, or immediately processed for the purification of thenuclear proteins used in the immunoblot experiments.
In vivo siRNA treatment. Chemically modified Stealth RNAi™ siR-NA duplexes (Invitrogen) complementary to the four Acots geneswere complexed with Invivofectamine® 2.0 (Invitrogen) accord-ing to manufacturer recommendation before the injection. Foreach of the four examined acyl-CoA thioesterases (Acots 1–4),six siRNAs with different sequences were tested in two differentmice, and the one yielding maximal suppression was selected forthe experiments shown in Fig. 2C and Fig. S5. The sequences ofthese siRNA are given in Table S1. The solution containing con-trol siRNA (an siRNA with sequences that do not target any geneproduct that have been tested by microarray analysis and shownto have minimal effects on gene expression), individual Acot siR-NAs, or an equimolar mix of the four Acot siRNAs were injectedintravenously through the tail vein of 8-wk-old Balb/c mice atZT12 at a dose of 7 mg∕kg. Forty-eight hours after the injection,mice were killed and livers were removed and snap-frozen inliquid nitrogen, and stored at −70 °C before RNA was extracted.
Calorie restriction. PAR bZip 3KO mice and wild-type siblings(nine KOs and seven wild-type 7—9-wk-old male mice) were fedregular chow (ref 3800 from Provimi Kliba. Diet composition:24% protein, 47.5% carbohydrate, 4.9% fat) ad libitum forat least 3 mo. Mice were then separated (by placing them intoindividual cages) and fed with powdered food that was deliveredby a computer-driven feeding machine (1). Average food con-sumption was determined to be 4.2 g per day, per mouse foranimals fed ad libitum with regular chow, and this value was usedas the normal diet control value in the caloric restriction studies.The animals were then subjected to a calorie diet reduced by 40%(i.e., 2.52 g per day, per animal, distributed into 20 daily portionsdelivered every 30 min between ZT12 and ZT22). The animalswere weighed twice a week in the morning for 11 wk.
Temporally restricted feeding. Servings of 3.4 g powdered chow(80% of the normal diet control value) were offered in 12portions between ZT03 and ZT09 by a computer-driven feedingmachine (1). The wheel-running activities of the animals wererecorded as described previously (2).
Fat-free feeding regimen.Eight-week-old PAR bZip 3KO mice andwild-type siblings (four males and four females of each genotype)were fed with regular chow ad libitum for at least 3 mo. The foodwas then replaced by a fat-free diet (TD.03314 from HarlanTeklad. Diet composition: 20.1% protein, 62.9% carbohydrate,0% fat) for 5 wk.
Electromobility Shift Assay. The radiolabeled probe was preparedby annealing two oligonucleotides encompassing the PAR bZipbinding site present in the Acot genes cluster and by filling inthe 5′ overhang with [α-32P]dCTP and Klenow DNA polymerase.The sequences of these oligonucleotides were 5′-CCATAAAAT-TACATAAG-3′ and 5′-TTGATTACTTATGTAATTTTATGG-3′.Twenty micrograms of liver nuclear extract were incubated with100 fmol of the double-stranded oligonucleotide in a 20-μL reac-tion containing 25 mM Hepes (pH 7.6), 60 mM KCl, 5 mMMgCl2, 0.1 mM EDTA, 7.5% glycerol, 1 mM DTT, 1 μg∕μLsalmon sperm DNA. After an incubation of 10 min at roomtemperature, 2 μL of a 15% Ficoll solution were added, andthe protein–DNA complexes were separated on a 5% polyacry-lamide gel in 0.25 × TBE (90 mM Tris/64.6 mM boric acid/2.5mM EDTA, pH 8.3).
GC-MS Determination of Fatty Acids (FAs) Concentrations. Lipid ex-tracts were taken to dryness in a speed-vac evaporator and resus-pended in 240 μL of 50% wt/vol KOH and 800 μL ethanol for thealkaline hydrolysis of lipids. After a 60-min incubation at 75 °C,FAs were extracted with 1 mL of water and 2 mL of hexane. Thehexane phase was taken to dryness and redissolved in 50 μL of apentafluoro-benzyl bromide solution (3.4% in acetonitrile) and10 μL of N;N-diisopropyl ethanolamine. After 10 min of incuba-tion at room temperature, samples were evaporated under agentle stream of nitrogen and resuspended in 50 μL hexane.
A Trace-DSQ GC-MS (Thermo Scientific) equipped with aTR5MS 30-m column was used for the mass-spectrometric ana-lysis of lipids by gas chromatography. Helium was used as carriergas at 1 mL∕min in splitless mode at 300 °C injector temperature.The initial oven temperature of 150 °C was held for 1 min andthen the temperature first was ramped up to 200 °C at a rateof 25 °C∕min, which was followed by a ramp of 12.5 °C∕minup to 325 °C, where the temperature was held for another 2 min.The mass spectrometer was run in negative ion chemical ioniza-tion mode where the FAs were detected in full scan as carboxy-lates after loss of the pentafluoro-benzyl moiety. Methane wasused as CI gas, the source temperature was set to 250 °C, andthe transfer line temperature was 330 °C. Peak areas for FAs werecalculated by Xcalibur QuanBrowser and related to the internalstandard peak area.
1. van der Veen DR, et al. (2006) Impact of behavior on central and peripheral circadianclocks in the common vole Microtus arvalis, a mammal with ultradian rhythms. ProcNatl Acad Sci USA 103:3393–3398.
2. Lopez-Molina L, Conquet F, Dubois-Dauphin M, Schibler U (1997) The DBP geneis expressed according to a circadian rhythm in the suprachiasmatic nucleus andinfluences circadian behavior. EMBO J 16:6762–6771.
Gachon et al. www.pnas.org/cgi/doi/10.1073/pnas.1002862108 1 of 7

A
B
Fig. S1. Hepatic expression of peroxisome proliferator-activated receptors α (PPARα) target genes in PAR bZip 3KO mice. (A) Microarray data obtained withPAR bZip 3KO mouse liver RNA (1) were compared to data obtained with Pparα KOmouse liver RNA (2). Genes down-regulated in both genotypes with regardto their wild-type counterparts are listed. The table corresponds to the list of genes down-regulated more than 1.25-fold in at least one of the KO genotypes(when compared to strain-matched wild-type mice). (B) Temporal hepatic expression of genes coding for enzymes involved in peroxisomal FA β-oxidation[acyl-CoA oxidase 1 (Acox1) and acyl-CoA acyltransferase 1B or thiolase B (Acaa1b)], mitochondrial FA β-oxidation [carnitine palmitoyltransferase 1 (Cpt1)and mitochondrial medium-chain acyl-CoA dehydrogenase (Acadm)], and FA binding and transport [FA-binding protein 1 (Fabp1) or liver FA-binding protein(L-FABP)] and CD36 (Cd36)] in wild-type and PAR bZip 3KO mice, as determined by real-time RT-PCR. Mean values� SEM obtained from four animals are given(*p ≤ 0.05, **p ≤ 0.01, KO vs. WT, Student’s t test). As for Cyp4a genes, the PPARα target genes coding for enzymes involved in FA β-oxidation are also down-regulated [Acox1, Acaa1b (see also Fig. S1A for these genes) and Cpt1] or not changed (Acadm) in the liver of PAR bZip 3KO mice. Interestingly, the genescoding for proteins involved in the FA transport exhibit an increased expression in PAR bZip 3KO mice, confirming previously published microarray data (1).Similar to what has been observed for Fasn expression, the increased expression of these genes is probably an indirect consequence of the disrupted FAmetabolism in PAR bZip 3KO mice, perhaps to compensate for the deficient import and/or metabolism of lipids absorbed with the food.
1 Gachon F, Fleury Olela F, Schaad O, Descombes P, Schibler U (2006) The circadian PAR-domain basic leucine zipper transcription factors DBP, TEF, and HLF modulate basal and inducible
xenobiotic detoxification. Cell Metab 4:25–36.2 Leuenberger N, Pradervand S, Wahli W (2009) Sumoylated PPARa mediates sex-specific gene repression and protects the liver from estrogen-induced toxicity in mice. J Clin Invest
119:3138–3148.
Gachon et al. www.pnas.org/cgi/doi/10.1073/pnas.1002862108 2 of 7

A
B
Fig. S2. Temporal expression of the PPARα target genes Cyp4a10 and Cyp4a14 in the liver of Pparα KO andwild-type mice. (A) Temporal expression of Cyp4a10and Cyp4a14 in the liver of wild-type and PparαKOmice. (B) Temporal expression ofAcot 1–4, lipoprotein lipase (Lpl), and FA synthase (Fasn) mRNA in wild-typeand Pparα KO mice. Real-time RT-PCR experiments were conducted with whole-cell liver RNAs from four animals for each time point. The zeitgeber times (ZT)at which the animals were killed are indicated. Mean values� SEM obtained from four animals are given (*p ≤ 0.05, **p ≤ 0.01, ***p ≤ 0.001 KO vs. WT,Student’s t test).
Fig. S3. PPARα protein/mRNA ratio after the activation of PPARα by its synthetic ligandWY14643. Six PAR bZip 3KOmice were injected intraperitoneally withDMSO (Left) or PPARα ligand WY14643 (100 mg∕kg) (Right) at ZT2. Livers were harvested 4 h later, and nuclear proteins and whole-cell RNAs were extracted.The PPARα protein levels were quantified byWestern blot experiments (Upper), and PparαmRNAwas quantified by real-time RT-PCR (Center). Individual ratiosbetween liver PPARα protein and Pparα mRNA are plotted in the lower panel. The mean values� SEM are given in Fig. 1E.
Gachon et al. www.pnas.org/cgi/doi/10.1073/pnas.1002862108 3 of 7
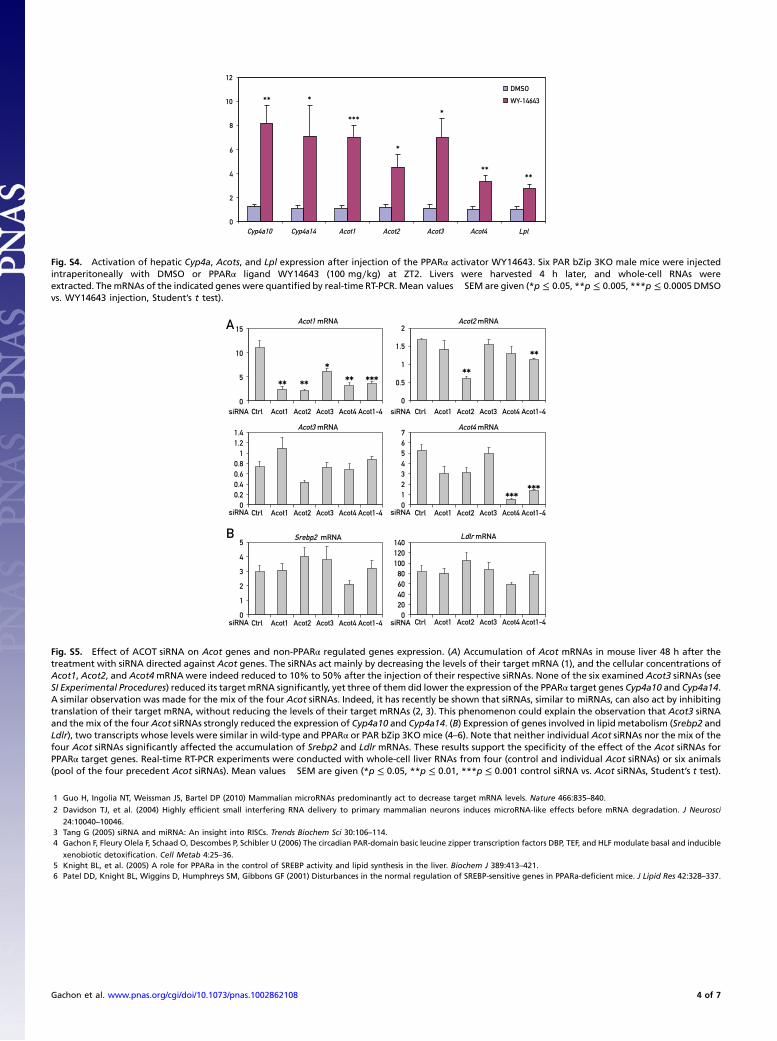
Fig. S4. Activation of hepatic Cyp4a, Acots, and Lpl expression after injection of the PPARα activator WY14643. Six PAR bZip 3KO male mice were injectedintraperitoneally with DMSO or PPARα ligand WY14643 (100 mg∕kg) at ZT2. Livers were harvested 4 h later, and whole-cell RNAs wereextracted. ThemRNAs of the indicated genes were quantified by real-time RT-PCR. Mean values� SEM are given (*p ≤ 0.05, **p ≤ 0.005, ***p ≤ 0.0005DMSOvs. WY14643 injection, Student’s t test).
Fig. S5. Effect of ACOT siRNA on Acot genes and non-PPARα regulated genes expression. (A) Accumulation of Acot mRNAs in mouse liver 48 h after thetreatment with siRNA directed against Acot genes. The siRNAs act mainly by decreasing the levels of their target mRNA (1), and the cellular concentrations ofAcot1, Acot2, and Acot4mRNAwere indeed reduced to 10% to 50% after the injection of their respective siRNAs. None of the six examined Acot3 siRNAs (seeSI Experimental Procedures) reduced its target mRNA significantly, yet three of them did lower the expression of the PPARα target genes Cyp4a10 and Cyp4a14.A similar observation was made for the mix of the four Acot siRNAs. Indeed, it has recently be shown that siRNAs, similar to miRNAs, can also act by inhibitingtranslation of their target mRNA, without reducing the levels of their target mRNAs (2, 3). This phenomenon could explain the observation that Acot3 siRNAand the mix of the four Acot siRNAs strongly reduced the expression of Cyp4a10 and Cyp4a14. (B) Expression of genes involved in lipid metabolism (Srebp2 andLdlr), two transcripts whose levels were similar in wild-type and PPARα or PAR bZip 3KOmice (4–6). Note that neither individual Acot siRNAs nor the mix of thefour Acot siRNAs significantly affected the accumulation of Srebp2 and Ldlr mRNAs. These results support the specificity of the effect of the Acot siRNAs forPPARα target genes. Real-time RT-PCR experiments were conducted with whole-cell liver RNAs from four (control and individual Acot siRNAs) or six animals(pool of the four precedent Acot siRNAs). Mean values� SEM are given (*p ≤ 0.05, **p ≤ 0.01, ***p ≤ 0.001 control siRNA vs. Acot siRNAs, Student’s t test).
1 Guo H, Ingolia NT, Weissman JS, Bartel DP (2010) Mammalian microRNAs predominantly act to decrease target mRNA levels. Nature 466:835–840.
2 Davidson TJ, et al. (2004) Highly efficient small interfering RNA delivery to primary mammalian neurons induces microRNA-like effects before mRNA degradation. J Neurosci
24:10040–10046.3 Tang G (2005) siRNA and miRNA: An insight into RISCs. Trends Biochem Sci 30:106–114.4 Gachon F, Fleury Olela F, Schaad O, Descombes P, Schibler U (2006) The circadian PAR-domain basic leucine zipper transcription factors DBP, TEF, and HLF modulate basal and inducible
xenobiotic detoxification. Cell Metab 4:25–36.5 Knight BL, et al. (2005) A role for PPARa in the control of SREBP activity and lipid synthesis in the liver. Biochem J 389:413–421.6 Patel DD, Knight BL, Wiggins D, Humphreys SM, Gibbons GF (2001) Disturbances in the normal regulation of SREBP-sensitive genes in PPARa-deficient mice. J Lipid Res 42:328–337.
Gachon et al. www.pnas.org/cgi/doi/10.1073/pnas.1002862108 4 of 7

Fig. S6. Response of PAR bZip 3KO mice to caloric restriction. Wild-type (black line) and PAR bZip 3KO (dotted line) animals were fed with a diet containingonly 60% of the normal calorie consumption during 11 consecutive weeks. Animals were weighed twice a week during this period. Mean relative weightchanges� SEM obtained from seven wild-type and nine KO animals are given.
Fig. S7. PAR bZip 3KO mice display normal O2 consumption and CO2 production. Oxygen consumption (VO2) and carbon dioxide production (VCO2) weremeasured by indirect calorimetry with the Comprehensive Lab Animal Monitoring System (Columbus Instruments). After 3 d of accommodation, VO2 (A) andVCO2 (B) were recorded during a 24-h period. Mean values� SD obtained from four animals of each genotype are given.
Gachon et al. www.pnas.org/cgi/doi/10.1073/pnas.1002862108 5 of 7

A
B
C
Fig. S8. Food anticipatory activities (FAA) of wild-type, PAR bZip 3KO, and Pparα KO mice. (A) Examples of FAA recordings of wild-type (Left) and PAR bZip3KO (Right) mice. Animals received 80% of their normal food consumption between ZT3 and ZT9 for the duration of the experiment. (B) Percentage meanactivity during a 24-h period for animals subjected to temporally restricted feeding. Mean values� SEM obtained from four animals of each genotype(recorded between day 10 and day 20 after the onset of restricted feeding) are given. The areas under which values are significantly different (Student’st test p values ≤0.05) between PAR bZip 3KO and wild-type mice are indicated by black lines on top of the figure. (C) Examples of FAA of wild-type (Left)and Pparα KO (Right) mice. Animals received 80% of their normal food consumption between ZT3 and ZT9 for the duration of the experiment.
Gachon et al. www.pnas.org/cgi/doi/10.1073/pnas.1002862108 6 of 7

Fig. S9. Liver FA levels in mice exposed to a fat-free diet. Concentrations of FAs (C16∶0, C18∶0, C18∶1w9, C18∶1w11, C18∶2, and C20∶4) in the liver of wild-typeand PAR bZip 3KOmice at ZT0 and ZT12. Mean values� SEM obtained for four animals are given. In none of the cases did we detect statistically different valueswith regard to either daytime or genotype.
Table S1. Sequences of the primers used for real-time PCR
Gene Forward primer Reverse primer
Pparα intron 1 TGGCCCCAACAGTAGGGTAG TGGAGGGCAGAGACATAGGGCyp4a10 GGAGCTCCAATGTCTGAGAAGAGT TCTCTGGAGTATTCTTCTGAAAAAGGTCyp4a14 TCTCTGGCTTTTCTGTACTTTGCTT CAGAAAGATGAGATGACAGGACACAAcot1 GACTGGCGCATGCAGGAT CCAGTTTCCATAGAACGTGCTTTAcot2 CAAGCAGGTTGTGCCAACAG GAGCGGCGGAGGTACAAACAcot3 GGTGGGTGGTCCTGTCATCT TGTCTTCTTTTTGCCATCCAAATAcot4 GGCCTTGAACTCACAGGGATT AGGTAGGGCCGAGCCTTTAAAcox1 GGATGGTAGTCCGGAGAACA AGTCTGGATCGTTCAGAATCAAGAcaab1 (Thiolase B) TCCAGGACGTGAAGCTAAAGC CATTGCCCACGGAGATGTCCpt1 CCTGGGCATGATTGCAAAG ACGCCACTCACGATGTTCTTCAcadm (Mcad) AGCTGCTAGTGGAGCACCAAG TCGCCATTTCTGCGAGCFabp1 (L-Fabp) CCAGGAGAACTTTGAGCCATTC TGTCCTTCCCTTTCTGGATGACd36 GATGACGTGGCAAAGAACAG TCCTCGGGGTCCTGAGTTATSrebp2 GCGTTCTGGAGACCATGGA ACAAAGTTGCTCTGAAAACAAATCALdlr TGGGCTCCATAGGCTATCTG GCCACCACATTCTTCAGGTT
For the other genes, we used the following designed primers from Applied Biosystems: GapdhMm99999915_g1; Pparα Mm00440939_m1; Lpl Mm00434770_m1; Fasn Mm01253300_g1.
Table S2. Sequences of Acot siRNA
Gene Sequence
Acot1 AGCUCUUCUUGUCUACCAGAGGGCUAcot2 CCCAAGAGCAUAGAAACCAUGCACAAcot3 GAACCCGAACCGGAUGGCACCUACUAcot4 CAACGUCAUAGAAGUGGACUACUUU
Gachon et al. www.pnas.org/cgi/doi/10.1073/pnas.1002862108 7 of 7