supporting information - proceedings of the national ... · pc3 (atcc) and pc3 cells expressing a...
TRANSCRIPT
Supporting InformationGuha et al. 10.1073/pnas.1202653110SI Materials and MethodsCell Culture.Androgen-independent prostate cancer (PCa) cell linePC3 (ATCC) and PC3 cells expressing a luciferase reporter (PC3-Luc) (kind gift from Patrick J. Casey, Duke University, Durham,NC) were cultured in a mixture of DMEM (Sigma) and F-12(Sigma) (1:1) supplemented with 10% (vol/vol) FBS (QualityBiologicals), 100 units/mL penicillin G sodium, and 100 μg/mLstreptomycin sulfate (Sigma). Human umbilical vein endothelialcells (HUVECs) (Lonza) were maintained in EGM2 basal mediumsupplemented with Bullet kit (Lonza). The human T-cell lineMOLT-4 (ATCC), Jurkat (gift of Agnes Azimzadeh, University ofMaryland, Baltimore), and B16 melanoma-specific T-cell transgenicD90.1 CD8+ T cells (pmel T cells) were grown in RPMI medium1640 containing 2 mM glutamine, penicillin-streptomycin, and 10%FBS. All cells were cultured in the presence of 5% CO2 at 37
oC.
Generation of gal3−/− PC3-Luc Cells. Confluent PC3-Luc cells weretreated with hexadimethrine bromide (7 mg/mL) followed by theaddition of 50 mL of galectin-3 MISSION shRNA LentiviralTransduction Particles (SHCLNV-NM_002306; Sigma) or Mis-sion shRNA Control Transduction Particles (SHC002V; Sigma).On the next day, cells were exchanged with fresh medium, anda day later, puromycin selection at a final concentration of0.75 μg/mL was initiated to generate stable gal3 knockout cellline. After 10 d of puromycin selection, gal3 knockout (KO)and negative control KO cells were generated and subjected toWestern blot to investigate gal3 expression.
Purification of Thomsen-Friedenreich disaccharide-Containing Com-pounds from Pacific Cod. Thomsen-Friedenreich disaccharide(TFD)-containing compounds were purified either from extractionof Pacific cod purchased from local store or from cod-derivedantifreeze glycoproteinspurchased fromA/FProtein.Extractionofcod (900 g) was performed in 1 L of Tris-buffered saline (TBS; 50mMTris, 100 mMNaCl, 1 mMCaCl2, 1 mMMgCl2, 1 mMMnCl2at pH 8.0) containing 100 μM PMSF, and after centrifuging at8,000 × g for 30 min at 4 °C, the clear supernatant was passedthrough a column of peanut agglutinin (PNA)-agarose (Sigma)(that was preequilibrated with the TBS). The column was washedwith TBS until no protein was detected in the washing (monitoredat 214 nm), and the bound protein was eluted with 100mM lactosein the TBS. The lactose eluate was dialyzed with water and furtherfractionated by fast performance liquid chromatography (Amer-sham) on a size exclusion column Superdex 75. Inhibitory activityof each peak was investigated on galectin-3 binding to asialofetuinon a 96-well plate (see later). The purified TFD-containing gly-coprotein corresponding to ∼100 kDa (designated as TFD100) wasused in angiogenesis, tumor–endothelial cell interaction, and ap-optosis experiments.Preliminary investigationon thenatureof the carbohydrates and
their activities to inhibit gal3 binding was performed after sizefractionation of crude antifreeze glycoproteins (purchased fromA/F Protein) by using Centricon membrane devices of variousmolecular mass cutoff such as 50 kDa, 30 kDa, 10 kDa, and 3 kDa(2mLof capacity) (Millipore). Briefly, 50mgof crude glycoproteinsin 2 mL of water was taken in a Centricon device of 50-kDa cutoffand centrifuged at 5,000 × g to ∼100 μL (∼1 h) at 4 °C by usingJ20 rotor (Beckman centrifuge). The retentate on the centriconmembrane was diluted to 2 mL with water and recentrifuged. Thisprocess of dilution and centrifugation was continued two more oftimes. At the end of this process, the retentate (designated asfraction 1) was collected and saved for further characterization.
The filtrate was processed for further fractionation on 30-kDamolecular mass cutoff centricon device and so on as describedabove. Thus, the partial purification resulted five fractions (Fr) asfollows: Fr1 (>50 kDa); Fr2 (<50 kDa, but >30 kDa); Fr3 (<30kDa, but >10 kDa); Fr4 (<10 kDa, but >3 kDa); and Fr5 (<3kDa). Each fraction was freeze dried and stored at −20 °C untilfurther characterization. The Fr1 was further purified on a PNA-agarose column (Sigma) as described above.
Biacore Kinetics and Affinity Analysis. The binding kinetics and af-finity of a few carbohydrates for gal3 were measured in surfaceplasmon resonance-based binding assays by using a Biacore T200instrument (GE Healthcare). Biotinylated gal3 was attached toBiacore Sensor Chip SA (GE Healthcare) according to theinstructions. For this purpose, biotinlyated gal3 was diluted intoHBS-EP+ (GE Heathcare) to a concentration of 1 μg/mL andcaptured onto the streptavidin surface to a final level of 1750resonance units (RU). A reference surface was prepared withbiotin captured onto the streptavidin. Binding kinetics and affinityof carbohydrate ligands (such as lactose, N-acetyllactosamine,TFD, and TFD100) were measured by using a titration of con-centrations in twofold dilutions that spanned the dissociationconstant (KD). The binding response of small carbohydrate ligandswere measured in resonance units in real time at 10 Hz. Thesecarbohydrates were injected for 30 s at 50 μL/min, and 30 s ofdissociation data were collected. For TFD100 binding assay, lowerdensity surface of 550 RU of biotinlyated gal3 was prepared. Thebinding of TFD100 exhibited significantly slower kinetics and re-quired injections for 120 s, and collection of 600 s of dissociationdata. The slow dissociation of TFD100 prompted regeneration ofthe gal3 surface by using a 60-s injection of 100 mM lactose. Rawsensorgram data were reference subtracted and blank subtractedbefore kinetic and affinity analysis. Biacore T200 Evaluation soft-ware was used for steady-state affinity analysis and kinetic analysis.The association and dissociation rates for lactose binding ap-proached the resolution limit of the instrument, therefore a plot ofresponse at equilibrium versus concentration was used for steady-state analysis of the KD. The association and dissociation rates, aswell as the KD for TFD100 binding, were determined by usinga simple 1:1 binding model.
Analytical Procedures.Crude, membrane-fractionated, and purifiedTFDcontaining glycoproteinswere investigated for thepresenceofTFD by using a glycan differentiation kit (Roche) following themanufacturer’s instructions. The carbohydrate content (neutralhexose) was measured by phenol-sulfuric acid assay (1). AnalyticalPAGE in the presence of SDS (2%)was carried out on aNuPAGENovex 4–12% Bis-Tris gels (Invitrogen) under reducing or non-reducing conditions as reported (2). The protein content wasmeasured at 214 nm by using BSA as a standard. In some cases,protein concentration was measured with Coomassie blue dye asdescribed (3).
Solid Phase Binding-Inhibition Assay. The inhibitory activity ofTFD100, other TFD-containing fractions, and alkaline treatedTFD100 on gal3 binding was determined by using a solid phaseassay as described (3). Briefly, asialofetuin (0.5 μg/100 μL perwell) in 0.1 M Na2CO3/0.02% NaN3 (pH 9.6) was adsorbed ontothe wells of microtiter plates (Immulon; Dynatech Laboratories)at 37 °C for 3 h, and the bound glycoprotein was fixed with 2%formaldehyde in PBS (10mMphosphate and 140mMNaCl at pH7.5) at 37 °C for 30 min. The plates were washed three times with
Guha et al. www.pnas.org/cgi/content/short/1202653110 1 of 9
PBS (azide-free)/0.05% Tween 20 and incubated with the gal3-biotin conjugate (10 ng/100 μL per well for binding assays) or withpreincubated mixture of equal volume of conjugate and varyingconcentrations of test ligands (for binding-inhibition assays). Afterincubation for 1 h at 4 °C, the plates were washed with ice-coldazide-free PBS-Tween 20, and the bound conjugate was allowed tointeract with peroxidase-labeled streptavidin (0.05 μg/100 μL perwell) in azide-free PBS-Tween for 1 h at 4 °C. The plate was washedwith ice-cold azide free PBS-Tween, and the bound peroxidaseactivity was assayed with peroxidase substrate diammonium 2,2′-azinobis(3-ethylbenzothiazoline-6-sulfonate) (ABTS) (KPL) (3).To prepare gal3-biotin conjugate, 0.5 mg of the purified recombi-nant gal3 as described (4) in 0.5mL of azide-free PBS/0.1M lactosewas mixed with 0.5 mg of EZ-Link Sulfo-NHS-LC-Biotin (ThermoScientific) in 50 μL of PBS. After incubation for 2 h on ice, the mixwas dialyzed with PBS and purified by affinity chromatography onlactosyl-sepharose (3). The purified gal3-biotin conjugate was di-alyzed with PBS and stored in 1%BSA-50% glycerol at−20 °C untilfurther use. For removal ofO-glycan fromTFD100, purified TFD100was subjected to standard β-elimination reaction. Briefly, 100 μL oftheTFD100 (15 μg/mL)was incubatedwith 2M sodiumborohydride(100 μL in 0.1 M sodium hydroxide) at 37 °C for 20 h. The reactionmixture was neutralized with 100 μL of 0.3 M acetic acid, and thecleaved sugars were membrane separated by using Microcon 10.
Binding of TFD100 with Other Galectins. The inhibitory activity ofTFD100 on binding of other galectins, such as gal4, and N-terminalof gal9 was determined on solid phase assay as described above.Briefly, galectin (for binding) or mixture of fixed amount of ga-lectin and varying amount of TFD100 (for binding inhibition) wasadded to asialofetuin-adsorbed wells, and after washing, the boundgalectin was mixed with the antigalectin antibody followed by theaddition of secondary antibody-conjugatedHRP and developmentwith ABTS substrate as above.
Immunoassay to Quantitate gal3 in Normal and PCa Patient Sera(gal3-Containing and gal3-Depleted). For immunoassay, purifiedgal3was coated on a 96-well plate (0.1 μg per well/100 μLof coatingbuffer as described above), and the fixed amount of purified anti-gal3 antibody premixed with varying amount of purified gal3 orunknown sample (normal or patient serum as well as gal3-depletedsera) was then added as described (5). After washing the well, thebound antibody was detected with a secondary antibody conju-gated with horseradish peroxidase followed by addition of ABTSsubstrate (3). The amount of gal3 in the sample was measuredfrom a standard curve. For preparation of gal3-depleted serum,each serum was passed through a column of anti-gal3 antibody-sepharose and flow through was collected.
Histochemical Analyses of Normal and Tumor Prostate Tissues. Im-munohistochemical detection of gal3 using specific anti-gal3 an-tibody was performed on 5-μm-thick paraffin-embedded sectionscontaining the most representative tumor areas. In brief, sectionswere deparaffinized in xylene and hydrated through graded con-centrations of ethanol and then with distilled water. Samples wereheated in a microwave oven in 1× Target Retrieval solution andthen washed with PBS for 5min. All sections were incubated in 3%hydrogen peroxide to inhibit endogenous peroxidase. Protein A-sepharose purified anti-gal3 antibody (10 μg/mL) (4) was appliedto the slides and incubated for 30 min at room temperature ina humidified chamber. Protein A-sepharose purified preimmunerabbit serumwas used as negative control. Sections were incubatedwith postprimary block for 15 min and polymer for 15 min (No-voLink Polymer kit; Novocastra, Vision BioSystems). Staining wasvisualized with the diaminobenzidine chromogen and counter-stained with Mayer’s hematoxylin.To investigate TFD expression, prostate tissue (normal and
tumor) array (US Biomax) was subjected to mouse anti-TFD an-
tibody (Abcam; Ag A78G/A7) followed by anti-mouse IgG-FITCconjugate as described above. Expression of TFD was also in-vestigated by binding with peanut lectin-FITC (EY Laboratories)and, after washing, the binding was visualized under fluorescencemicroscope.
Angiogenesis. In vitro induction of angiogenesis in the presence ofgal3 and the inhibition of angiogenesis in the presence ofTFD100 orlactose were performed by using Chemicon’s In Vitro Angiogen-esis Kit (Millipore) following the manufacturer’s instructions.Briefly, 5 × 10⁴ HUVECs were seeded in matrigel-coated 96 wellsin the presence or absence of gal3, TFD100, or lactose alone or incombination with gal3 + TFD100 or gal3 + lactose. After 5 h, themicrovessel formation was analyzed under phase contrast micro-scope at the 10× magnification. For quantitation of tube forma-tion, the number of branching was counted in six areas (each 25nm2) of each well and an average value was taken.For in vivo induction of blood vessels, black mice (strain C57/
BL6) were administered with 0.5 mL of matrigels in the presenceor absence of gal3 and TFD100 under skin at the abdomen in thefollowing four groups (5 mice per group): Group 1, Matrigel+VEGF (20 ng); Group 2, Matrigel+VEGF (20 ng) + gal3 (500ng); Group 3: Matrigel+VEGF (20 ng) + TFD100 (100 ng); andGroup 4, Matrigel+VEGF (20 ng) + gal3 (500 ng) + TFD100(100 ng). After a week, the matrigel plugs were removed andsectioned (5 μm) for immunostaining with anti-CD31 antibody(BD Biosciences) as described (6).
Extracellular Localization of gal3 and TFD in PC3 Cells and HUVECs.Theextracellular localizationofgal3 in thePC3cellswas investigatedwith anti-gal3 antibody on a flow cytometer (Becton DickinsonFACSCanto II).Briefly, confluent cellswerewashedwithPBS-5mMEDTA, separated from the plate, and incubated with 10 μg/mLprotein A-sepharose purified polyclonal rabbit anti-gal3 antibody(4) for 30 min at 4 °C. After washing with PBS for three times byusing centrifugation (200 × g) for 5 min each, the cells were in-cubated with 0.8 μg/mL DyLight 649 labeled goat anti-rabbit IgG(KPL). The washed cells were then subjected to the flow cytometryand acquired at FL4 channel. The extracellular localization of TFDin the PC3 cells and HUVECs was investigated with PNA-FITC(EY Laboratories) and subjected to the flow cytometry. The cellswere analyzed through FL1 channel. The presence of TFD-con-taining glycoprotein in PC3 cells andHUVECswas also investigatedby using glycan differentiation kit (Roche) as described above.
Tumor–Endothelial Cell Interactions. For adhesion to endothelialcells, HUVECswas grown to confluence and single-cell suspensionof calcein labeled (eBioscience) PC3 cells were allowed to bind toHUVECs in the presence of TFD100, siRNAs, lactose, and variousantibodies as described (7). Inhibition of tumor-endothelial cellswas performed in three different ways. (i) HUVECs were treatedwith various reagents, and the labeled PC3 cells were allowed tobind to the washed HUVECs. (ii) The calcein-labeled PC3 cellswere treated with various reagents and, after washing, the cellswere allowed to bind to HUVECs. (iii) The interaction of labeledPC3 cells to HUVECs was performed in the presence of TFD100and gal3 siRNA.The binding or binding-inhibition in eachwell wasexamined by phase contrast microscopy at 10× magnification andquantitated on a spectrofluorimeter (SpectraMax M5 MultimodeMicroplate Reader fromMolecular Devices) by using calcein AMEx/Em -495/515.
Apoptosis of T Cells (MOLT-4, Jurkat, and CD8+ Cells).Gal3-mediatedapoptosis of MOLT-4 cells in the presence or absence of TFD100was assessed by measuring apoptotic cells by annexin V binding(Oncogene) on a flow cytometer. Jurkat cells were subjected toTUNEL assay.
Guha et al. www.pnas.org/cgi/content/short/1202653110 2 of 9
To investigate whether tumor-associated gal3 can induce tumorspecific CD8+ T cells, we used pmel T cells as a model system(8). After harvesting T cells from mouse spleen, cells were ac-tivated with mouse gp100(25-33) peptide (EGSRNQDWL;GenScript) (8), mixed with a monolayer of B16 melanoma cells,and apoptosis was measured by Annexin V binding after gatingwith anti-CD8 and anti-CD25 antibodies. To investigate whetherpatient serum-associated gal3 could induce apoptosis of acti-vated CD8+ cells, PCa patient serum (wild type or gal3-depleted)was mixed with activated pmel T cells and apoptosis was mea-sured in the presence or absence of TFD100 (1 nM).
Experimental Metastasis Assay. Confluent culture of PC3-Luc orgal3−/− PC3-Luc cells was scraped and resuspended at 1.5 × 10⁷
cells per mL in PBS. Cells (3 × 10⁶ in 200 μL of PBS) were theninjected i.v. into the tail vein of 20 nude mice (3–4 wk old, StrainNCRNU-F, Taconic), 10 mice per cell type, by using tail veininjection apparatus (Braintree Scientific). Mice of each cell typewere separated into two groups. One group received TFD100 (50μg/kg body weight) i.p. twice a week for a period of 5 wk, whereasthe other group received only PBS. Before imaging, mice wereinjected i.p. with Luciferin (150 mg/kg; Xenogen) and returned to
their cages for 5 min to allow for biodistribution. Mice were an-esthetized with 2% isoflurane gas (integrated within the XenognIVIS-200 system) and imaged 5 min for a single-photon emission.Regions of interest were created and measured as area flux, de-fined by radiance (photons per second per square centimeter persteradian) according to the manufacturer’s calibration (Xeno-gen). Total photon flux was calculated and corrected for tissuedepth by spectral imaging by using Living Image 3.0 software(Xenogen). After 5 wk, mice were euthanized and India ink (15%)was injected into their lungs through trachea. The lungs were fixedin Fekete’s solution (100 mL of 70% ethanol, 10 mL of formalin,and 5 mL of glacial acetic acid) and after destaining with Fekete’ssolution, lungs were photographed. For immunohistochemicalanalysis, unstained lungs were sectioned (5 μm) and stained withhematoxylin and eosin (H&E) and anti-human Ki67 antibody(BioLegend), and the sections were examined by light microscopy.
Statistical Analysis. The statistical analyses were performed byusing one-way ANOVA followed by Turkey–Kramer multiplecomparisons (GraphPad InStat, version 3). The differences wereconsidered significant when P < 0.05.
1. Dubois M, Gilles K, Hamilton JK, Rebers PA, Smith F (1951) A colorimetric method forthe determination of sugars. Nature 168(4265):167.
2. Laemmli UK, Favre M (1973) Maturation of the head of bacteriophage T4. I. DNApackaging events. J Mol Biol 80(4):575–599.
3. Ahmed H, Pohl J, Fink NE, Strobel F, Vasta GR (1996) The primary structure andcarbohydrate specificity of a β-galactosyl-binding lectin from toad (Bufo arenarumHensel) ovary reveal closer similarities to the mammalian galectin-1 than to thegalectin from the clawed frog Xenopus laevis. J Biol Chem 271(51):33083–33094.
4. Ahmed H, Cappello F, Rodolico V, Vasta GR (2009) Evidence of heavy methylation inthe galectin 3 promoter in early stages of prostate adenocarcinoma: Development andvalidation of a methylated marker for early diagnosis of prostate cancer. Transl Oncol2(3):146–156.
5. Allen HJ, Sharma A, Ahmed H, Piver MS, Gamarra M (1993) Galaptin and galaptin-binding glycoconjugates in serum and effusions of carcinoma patients. Tumour Biol14(6):360–368.
6. Bagley RG, et al. (2008) Human endothelial precursor cells express tumor endothelialmarker 1/endosialin/CD248. Mol Cancer Ther 7(8):2536–2546.
7. Glinsky VV, et al. (2001) The role of Thomsen-Friedenreich antigen in adhesion of humanbreast and prostate cancer cells to the endothelium. Cancer Res 61(12):4851–4857.
8. Geng D, et al. (2010) Amplifying TLR-MyD88 signals within tumor-specific T cellsenhances antitumor activity to suboptimal levels of weakly immunogenic tumorantigens. Cancer Res 70(19):7442–7454.
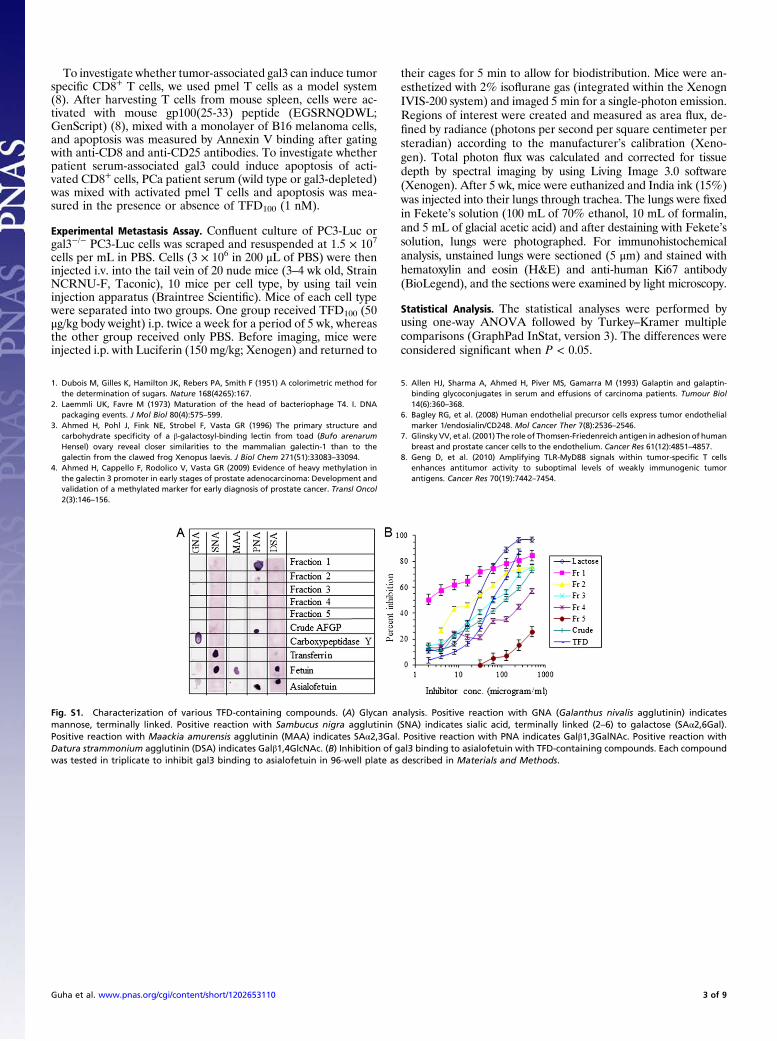
Fig. S1. Characterization of various TFD-containing compounds. (A) Glycan analysis. Positive reaction with GNA (Galanthus nivalis agglutinin) indicatesmannose, terminally linked. Positive reaction with Sambucus nigra agglutinin (SNA) indicates sialic acid, terminally linked (2–6) to galactose (SAα2,6Gal).Positive reaction with Maackia amurensis agglutinin (MAA) indicates SAα2,3Gal. Positive reaction with PNA indicates Galβ1,3GalNAc. Positive reaction withDatura strammonium agglutinin (DSA) indicates Galβ1,4GlcNAc. (B) Inhibition of gal3 binding to asialofetuin with TFD-containing compounds. Each compoundwas tested in triplicate to inhibit gal3 binding to asialofetuin in 96-well plate as described in Materials and Methods.
Guha et al. www.pnas.org/cgi/content/short/1202653110 3 of 9

Fig. S2. Surface plasmon resonance assay on Biacore. Binding kinetics and affinity of lactose (A) and N-acetyllactosamine (B) for gal3 were measured by usinga titration of concentrations in twofold dilutions that spanned the KD. Lactose was measured from 31 μM to 1,000 μM, and the KD was determined to be 1.1e−4
M or 110 μM. N-Acetyllactosamine was measured from 1.56 μM to 100 μM, and the KD was determined to be 2.5e−5 M or 25 μM.
Fig. S3. Expression of gal3 and TFD in prostate tissues from at least four normal individuals and four of each stage of PCa patients. Shown are representativeresults. (A) Expression of gal3 as determined by immunostaining with affinity purified anti-gal3 antibodies. BPH, benign prostatic hyperplasia; stage I, T1N0Mx;stage II, T2N0Mx; stage III, T3N0Mx; and stage IV, T4N1Mx. (Magnification: 400×.) (B and C) Expression of TFD as determined by immunostaining with anti-TFDantibody (B) or binding with PNA-FITC (C). Stage I, T1N0Mx; stage II, T2N0Mx; stage III, T3N0Mx; and stage IV, T4N1Mx. (Magnification: 400×.)
Guha et al. www.pnas.org/cgi/content/short/1202653110 4 of 9

Fig. S4. Quantitation of TFD expression as determined by anti-TFD antibody staining (A) and PNA staining (B). The data are shown as the means ± SD fromthree determinations. ***P < 0.001; **P < 0.01; *P < 0.05; ANOVA. NS, not significant.
Guha et al. www.pnas.org/cgi/content/short/1202653110 5 of 9

Fig. S5. Extracellular localization of gal3 and TFD in PC3 cells (A and B) and HUVECs (C and D). Expression of gal3 in PC3 cells (A) and HUVECs (C). (A) Black,unstained cells, mean fluorescence unit 205; blue, with gal3 Ab, mfu 25851; and red, with preimmune IgG, mfu 759. (C) Red, unstained cells, mfu 97; blue, withgal3 Ab, mfu 296; and green, cells stained with preimmune IgG, mfu 95. Expression of TFD in PC3 cells (B) and HUVECs (D). (B) Black, unstained cells, mfu 183;blue, with PNA-FITC, mfu 59320; and red, with PNA-FITC plus lactose, mfu 8386. (D) Red, unstained cells, mfu 97; blue, with PNA-FITC, mfu 95; and green, withPNA-FITC plus lactose, mfu 97. (E) Glycan differentiation analysis of PC3 (i) and HUVEC (ii) cell extract with PNA binding. (E, iii) Dot blot of HUVEC extract andstandard proteins/glycoproteins stained with Coomassie showing protein/glycoprotein load.
Guha et al. www.pnas.org/cgi/content/short/1202653110 6 of 9

Fig. S6. (A) Apoptosis of MOLT-4 T cells in the presence of gal3 (5 μM), gal3 plus TFD100 (3.5 nM), and gal3 plus lactose (50 μM). (B and C) Apoptosis of Jurkatcells. (B) Gal3-mediated apoptosis of Jurkat cells and their inhibition with 3.5 nM TFD100. (C) Gal3 dose-dependent apoptosis of Jurkat cells. (D) Gal3-mediatedapoptosis of Jurkat cells as measured by TUNEL assay. (DI) Cytogram of untreated Jurkat cells. (D, II) Cytogram of Jurkat cells in the presence of gal3. (D, III)Overlay of cytograms showing TUNEL assays for Jurkat cells in the presence of gal3 or gal3 plus lactose. (E) Statistical analyses of gal3 concentrations in sera ofPCa patients (stage II and III) compared with that from normal serum. ***P < 0.001 ANOVA.
Guha et al. www.pnas.org/cgi/content/short/1202653110 7 of 9
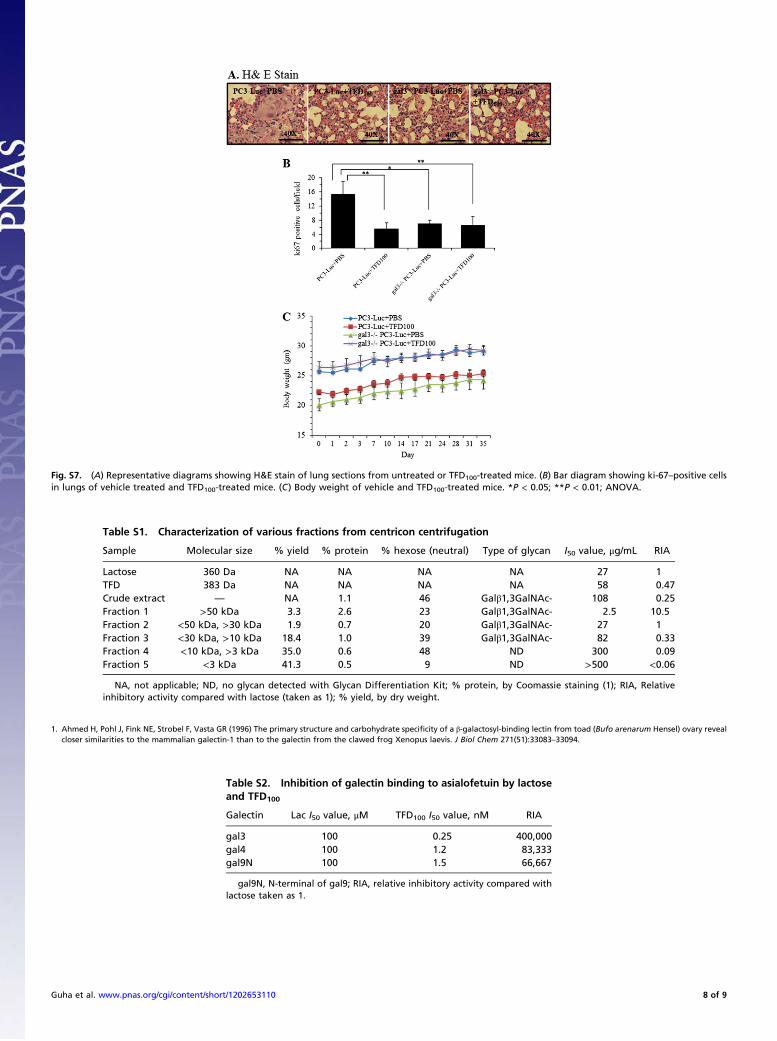
Fig. S7. (A) Representative diagrams showing H&E stain of lung sections from untreated or TFD100-treated mice. (B) Bar diagram showing ki-67–positive cellsin lungs of vehicle treated and TFD100-treated mice. (C) Body weight of vehicle and TFD100-treated mice. *P < 0.05; **P < 0.01; ANOVA.
Table S1. Characterization of various fractions from centricon centrifugation
Sample Molecular size % yield % protein % hexose (neutral) Type of glycan I50 value, μg/mL RIA
Lactose 360 Da NA NA NA NA 27 1TFD 383 Da NA NA NA NA 58 0.47Crude extract — NA 1.1 46 Galβ1,3GalNAc- 108 0.25Fraction 1 >50 kDa 3.3 2.6 23 Galβ1,3GalNAc- 2.5 10.5Fraction 2 <50 kDa, >30 kDa 1.9 0.7 20 Galβ1,3GalNAc- 27 1Fraction 3 <30 kDa, >10 kDa 18.4 1.0 39 Galβ1,3GalNAc- 82 0.33Fraction 4 <10 kDa, >3 kDa 35.0 0.6 48 ND 300 0.09Fraction 5 <3 kDa 41.3 0.5 9 ND >500 <0.06
NA, not applicable; ND, no glycan detected with Glycan Differentiation Kit; % protein, by Coomassie staining (1); RIA, Relativeinhibitory activity compared with lactose (taken as 1); % yield, by dry weight.
Table S2. Inhibition of galectin binding to asialofetuin by lactoseand TFD100
Galectin Lac I50 value, μM TFD100 I50 value, nM RIA
gal3 100 0.25 400,000gal4 100 1.2 83,333gal9N 100 1.5 66,667
gal9N, N-terminal of gal9; RIA, relative inhibitory activity compared withlactose taken as 1.
1. Ahmed H, Pohl J, Fink NE, Strobel F, Vasta GR (1996) The primary structure and carbohydrate specificity of a β-galactosyl-binding lectin from toad (Bufo arenarum Hensel) ovary revealcloser similarities to the mammalian galectin-1 than to the galectin from the clawed frog Xenopus laevis. J Biol Chem 271(51):33083–33094.
Guha et al. www.pnas.org/cgi/content/short/1202653110 8 of 9

Table S3. Summary of gal3 concentration in normal and PCa patients sera
Serum Pathological stage Gleason score Conc of gal3, ng/mLConc of gal3 after gal3
depletion, ng/mL
Normal Not applicable — 1.6 0.01P17 III, pT3bN0Mx 4 + 5 = 9 212 10P19 III, pT3bN0Mx 3 + 5 = 8 237 0P22 III, pT3aN0Mx 4 + 4 = 8 202 0P27 III, pT3aN0Mx 4 + 5 = 9 18 0P42 II, pT2cN0Mx 3 + 4 = 7 16 0P50 II, pT2cN0Mx 4 + 5 = 9 36 0P56 II, pT2cN0Mx 3 + 4 = 7 40 0
Table S4. Serum chemistry of the TFD100-treated mice
Test Result value Normal rangeUnit ofmeasure
Albumin 3.03 ± 0.05 2.5–4.6 g/dLAlanine aminotransferase 51.33 ± 2.51 35–222 U/LTotal bilirubin 0.1 ± 0.00 0.0–0.9 mg/dLCalcium 10.83 ± 1.19 6.0–13.0 mg/dLTotal protein 4.76 ± 0.20 3.9–6.4 g/dLBlood urea nitrogen 23.33 ± 5.50 9–33 mg/dL
Guha et al. www.pnas.org/cgi/content/short/1202653110 9 of 9