supporting information - semantic scholar information wiley-vch 2013 ... pe (green). a) incubated at...
TRANSCRIPT
Supporting Information
� Wiley-VCH 2013
69451 Weinheim, Germany
A Programmable Sensor to Probe the Internalization of Proteins andNanoparticles in Live Cells**Haiyin Liu and Angus P. R. Johnston*
ange_201301243_sm_miscellaneous_information.pdf
SUPPORTING INFORMATION
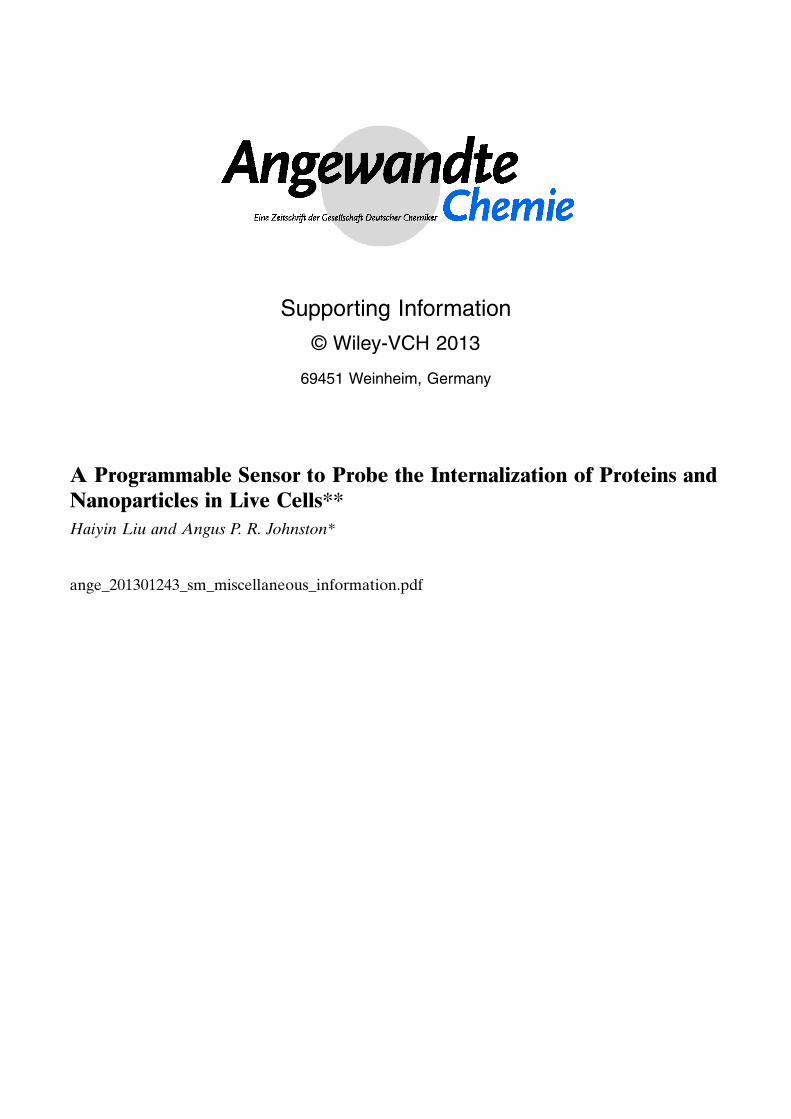
Figure S1. QPM does not quench the fluorescence of TfFIP-Cy5. Fluorescence microscopy images of CEM-NKR cells incubated with TfFIP-Cy5 (red) and phenotyped with CD4PE (green). a) Incubated at 4ºC for 30 min, b) incubated at 37º C for 10 min. 100 nM QPC was added after the Tf incubation period.
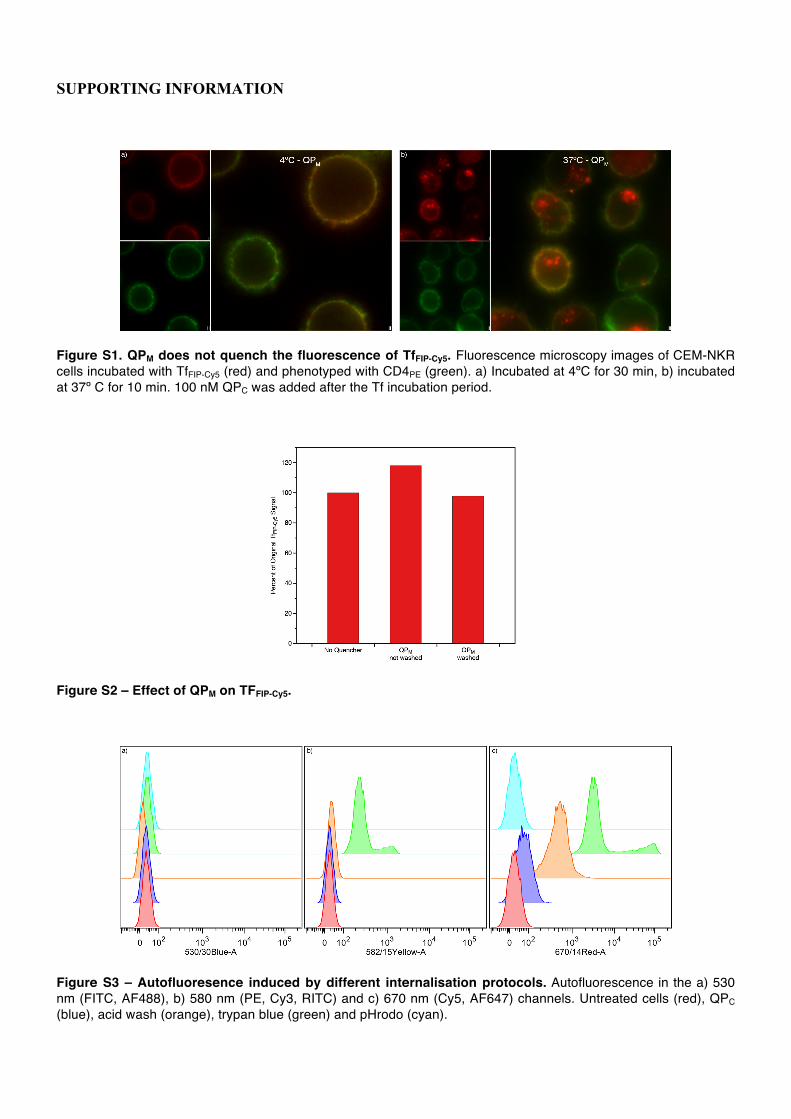
Figure S2 – Effect of QPM on TFFIP-Cy5.
Figure S3 – Autofluoresence induced by different internalisation protocols. Autofluorescence in the a) 530 nm (FITC, AF488), b) 580 nm (PE, Cy3, RITC) and c) 670 nm (Cy5, AF647) channels. Untreated cells (red), QPC (blue), acid wash (orange), trypan blue (green) and pHrodo (cyan).
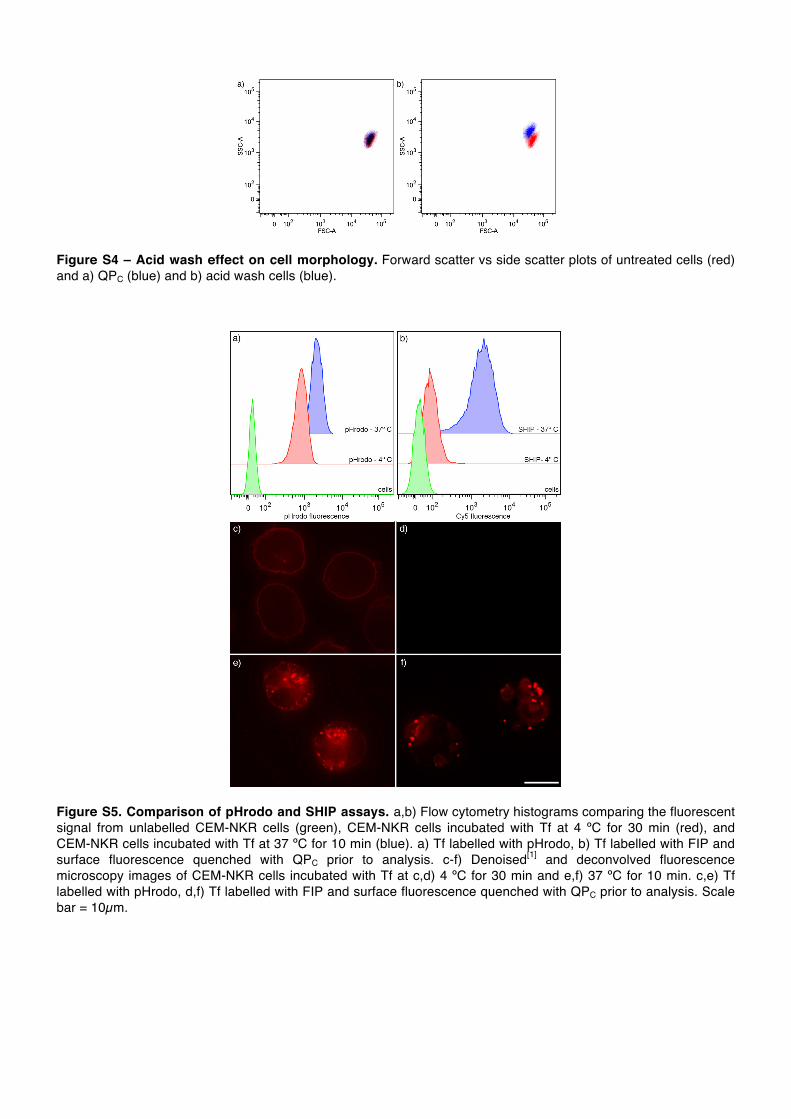
Figure S4 – Acid wash effect on cell morphology. Forward scatter vs side scatter plots of untreated cells (red) and a) QPC (blue) and b) acid wash cells (blue).
Figure S5. Comparison of pHrodo and SHIP assays. a,b) Flow cytometry histograms comparing the fluorescent signal from unlabelled CEM-NKR cells (green), CEM-NKR cells incubated with Tf at 4 ºC for 30 min (red), and CEM-NKR cells incubated with Tf at 37 ºC for 10 min (blue). a) Tf labelled with pHrodo, b) Tf labelled with FIP and surface fluorescence quenched with QPC prior to analysis. c-f) Denoised[1] and deconvolved fluorescence microscopy images of CEM-NKR cells incubated with Tf at c,d) 4 ºC for 30 min and e,f) 37 ºC for 10 min. c,e) Tf labelled with pHrodo, d,f) Tf labelled with FIP and surface fluorescence quenched with QPC prior to analysis. Scale bar = 10µm.
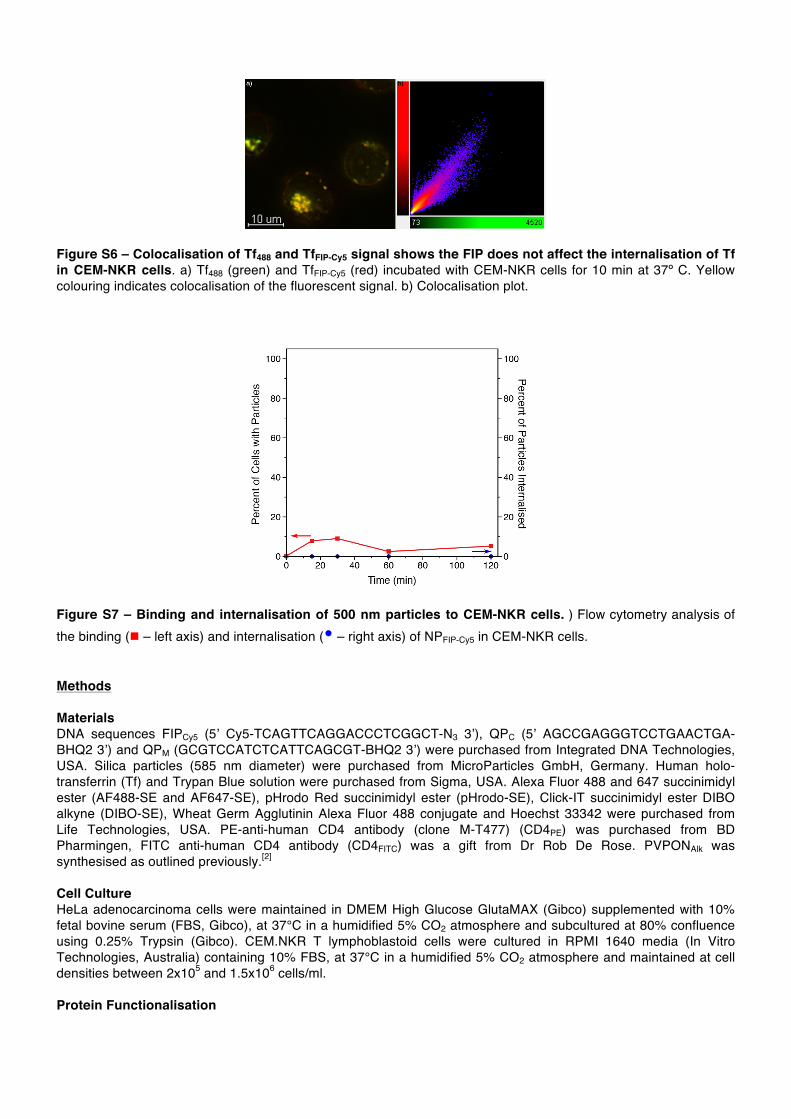
Figure S6 – Colocalisation of Tf488 and TfFIP-Cy5 signal shows the FIP does not affect the internalisation of Tf in CEM-NKR cells. a) Tf488 (green) and TfFIP-Cy5 (red) incubated with CEM-NKR cells for 10 min at 37º C. Yellow colouring indicates colocalisation of the fluorescent signal. b) Colocalisation plot.
Figure S7 – Binding and internalisation of 500 nm particles to CEM-NKR cells. ) Flow cytometry analysis of the binding (n – left axis) and internalisation (� – right axis) of NPFIP-Cy5 in CEM-NKR cells. Methods Materials DNA sequences FIPCy5 (5’ Cy5-TCAGTTCAGGACCCTCGGCT-N3 3’), QPC (5’ AGCCGAGGGTCCTGAACTGA-BHQ2 3’) and QPM (GCGTCCATCTCATTCAGCGT-BHQ2 3’) were purchased from Integrated DNA Technologies, USA. Silica particles (585 nm diameter) were purchased from MicroParticles GmbH, Germany. Human holo-transferrin (Tf) and Trypan Blue solution were purchased from Sigma, USA. Alexa Fluor 488 and 647 succinimidyl ester (AF488-SE and AF647-SE), pHrodo Red succinimidyl ester (pHrodo-SE), Click-IT succinimidyl ester DIBO alkyne (DIBO-SE), Wheat Germ Agglutinin Alexa Fluor 488 conjugate and Hoechst 33342 were purchased from Life Technologies, USA. PE-anti-human CD4 antibody (clone M-T477) (CD4PE) was purchased from BD Pharmingen, FITC anti-human CD4 antibody (CD4FITC) was a gift from Dr Rob De Rose. PVPONAlk was synthesised as outlined previously.[2] Cell Culture HeLa adenocarcinoma cells were maintained in DMEM High Glucose GlutaMAX (Gibco) supplemented with 10% fetal bovine serum (FBS, Gibco), at 37°C in a humidified 5% CO2 atmosphere and subcultured at 80% confluence using 0.25% Trypsin (Gibco). CEM.NKR T lymphoblastoid cells were cultured in RPMI 1640 media (In Vitro Technologies, Australia) containing 10% FBS, at 37°C in a humidified 5% CO2 atmosphere and maintained at cell densities between 2x10⁵ and 1.5x10⁶ cells/ml. Protein Functionalisation
50 µl of human holo-transferrin (5 mg ml-1 in PBS buffer) was functionalised with dye-SE (1 mg ml-1 in DMSO) or DIBO-SE (10 mg ml-1 in DMSO) by incubating with equimolar amounts of SE-coupled dyes (AF488-SE, AF647-SE, pHrodo-SE), or with 10-fold molar excess of DIBO-SE, for 2 hours at 4°C. An additional 16.5 µl of DMSO was added to the DIBO-SE to aid solubility of the linker. Functionalised transferrin was purified using a 7K MWCO Zeba spin desalting column (Thermo Scientific). DIBO-functionalised transferrin was further functionalised by adding 10 µl of FIPCy5 (150 µM) to 50 µl of TfDIBO (2.5 mg/ml in PBS buffer) for 2 hours at 4°C, and purified using a 40k MWCO Zeba spin desalting column. Degrees of functionalisation were 0.88 (TF488), 0.7 (TF647), 0.46 (TFpHrodo), and 1.05 (TFFIP-Cy5) respectively, as measured on a NanoDrop 1000 UV-Vis spectrophotometer. Nanoparticle Coating and Functionalisation 50 µl of silica particles (50 mg ml-1) were coated with poly(vinylpyrrolidone)-alkyne (PVPONAlk) by incubating with 100 µl of 1 mg ml-1 PVPONAlk in 10mM sodium acetate buffer (pH 4) for 15 min. at room temperature. Coated particles were washed three times with PBS, resuspended in 50 µl PBS and functionalised with FIPCy5 by the addition of 10 µl of FIPCy5 probe (150 µM), 10 μl of sodium ascorbate (4.4 mg ml-1), 10 μl of copper sulfate (1.8 mg ml-1), and 10 μl of tris[(4-carboxyl-1-benzyl-1H-1,2,3- triazol-4-yl)methyl]amine (4.89 mg ml-1 in DMSO).[3] The particles were incubated for 2 hours at 4°C then washed three times with PBS. CEM.NKR Internalisation Assay Transferrin Binding: 5 x 10⁵ CEM.NKR cells were pelleted for 5 min. at 300 rcf and resuspended in DMEM containing 0.1% FBS. Labelled Tf (Tf488, Tf647, TfFIP-Cy5 or TfpHrodo) was added at a final concentration of 75 µg ml-1 and incubated either for 30 min at 4 ºC (to suppress transferrin internalisation) or 10 min at 37 ºC (to promote internalisation). After incubation, cells were washed twice with cold PBS and resuspended in 100 µl of cold PBS. CEM.NKR Phenotyping: Phenotyping was performed by incubating cells with CD4FITC (1:100 dilution, pHrodo assay) or CD4PE (1:50 dilution, all other samples) for 15 min at 4 ºC, followed by washing twice with cold PBS. SHIP: A final concentration of 100 nM QPC or QPM was added to the TfFIP-Cy5 treated cells. The quencher was added to the cells after phenotyping and was allowed to hybridise for 5 min prior to analysis. Trypan Blue: A final concentration of 1 mM trypan blue was added to the Tf488 treated cells. The quencher was added to the cells after phenotyping and was allowed to incubate for 5 min prior to analysis. Acid Wash: Prior to phenotyping, cells incubated with Tf647 were resuspended in 1ml ice cold 0.2M acetic acid solution (pH 3) containing 0.5M NaCl for 10 min. at 4 ºC. The cells were then washed two times with cold PBS and phenotyped as outlined above. pHrodo: Cells treated with TfpHrodo were analysed after phenotyping without any further modification. Flow Cytometry: 1 x 10⁴ cells were analysed using a BD LSRFortessa, with 488 nm, 568 nm and 647 nm excitation lasers, and 530/30 (AF488, FITC), 582/15 (PE, pHrodo) and 670/14 (AF647, Cy5) emission filters respectively. Autofluorescence was corrected by subtracting the fluorescence signal of untreated cells from all samples. The quenching efficiency of SHIP, Trypan Blue and Acid Wash assays was determined by taking the ratio of Tf fluorescence of untreated versus treated cells at 4 ºC. Percent of original phenotyping signal was determined by taking the ratio of CD4 fluorescence of treated versus untreated cells at 4 ºC. Microscopy: Live cell imaging was performed on a DeltaVision (Applied Precision) microscope with a 60x 1.42 NA oil objective with a standard TRITC/CY5 filter set. Images were de-noised with the nd-Safir algorithm,[1] deconvolved using SoftWorX and processed using Imaris. Internalisation Kinetics of Nanoparticles Flow Cytometry: HeLa cells were seeded at 1 x 10⁵ cells/well into a 24-well dish and allowed to adhere overnight. Cells were washed with DMEM containing 0.1% FBS, followed by incubation with FIPCy5-labelled silica particles at 37 ºC with final NPFIP-Cy5 concentration of 7.5 µg ml-1. After 5, 15, 30, 60 or 120 min., cells were washed twice with PBS and harvested by trypsinisation followed by centrifugation at 300 rcf for 5 min. The pellet was resuspended in PBS and subjected to the SHIP assay with QPC. 1 x 10⁴ cells were analysed with flow cytometry (BD LSRFortessa) and the percentage of internalised particles was calculated as the fluorescence ratio of untreated versus treated cells.
Live cell microscopy: To visualise the nanoparticle internalisation by HeLa using the SHIP assay, cells were seeded at 5 x 10⁴ cells/well into an 8-well Lab-Tek I chambered coverglass slide (Thermo Fisher Scientific) and allowed to adhere overnight. Cells were washed with DMEM containing 0.1%FBS and incubated with FIPCy5-labelled silica particles at 37ºC with final NPFIP-Cy5 concentration of 7.5 µg ml-1. After 2 hours, cells were washed twice with PBS and stained with Alexa Fluor 488 conjugated wheat germ agglutinin (plasma membrane) and Hoechst (nucleus) stains, according to the manufacturers protocols. Live cell imaging was performed on a DeltaVision (Applied Precision) microscope with a 60x 1.42 NA oil objective with a standard DAPI/FITC/CY5 filter set. Images were de-noised with the nd-Safir algorithm,[1] deconvolved using SoftWorX and processed using Imaris. References [1] J. Boulanger, C. Kervrann, P. Bouthemy, IEEE T Pattern Anal 2007, 29, 1096–1102. [2] C. R. Kinnane, G. K. Such, G. Antequera-Garcia, Y. Yan, S. J. Dodds, L. M. Liz-Marzan, F. Caruso,
Biomacromolecules 2009, 10, 2839–2846. [3] M. M. J. Kamphuis, A. P. R. Johnston, G. K. Such, H. H. Dam, R. A. Evans, A. M. Scott, E. C. Nice, J. K.
Heath, F. Caruso, J. Am. Chem. Soc. 2010, 132, 15881–15883.