supporting information with tc conjugates and their use in ... · unidad de biofísica de...
TRANSCRIPT

1
Supporting Information
Synthesis of hydrophilic HYNIC-[1,2,4,5]tetrazine conjugates and their use in antibody pretargeting
with 99mTcMaría Fernanda García, *a Fabio Gallazzi, b Mara de Souza Junqueira, c Marcelo Fernández, a Ximena Camacho, a Janio da Silva Mororó, c Daniele Faria, d Camila de Godoi Carneiro, d Marcos Couto, e Federico Carrión, f Otto Pritsch, f,g Roger Chammas, d Thomas Quinn, b Pablo Cabral a and Hugo Cerecetto a†.
a. Centro de Investigaciones Nucleares, Facultad de Ciencias, Universidad de la República, Mataojo 2055, 11400 Montevideo, Uruguay.
b. Department of Biochemistry, University of Missouri, Columbia, MO 65201, USA.
c. Centro de Investigação Translacional em Oncologia, Instituto do Câncer do Estado de São Paulo, Faculdade de Medicina, Universidade de São Paulo, Brazil
d. Medicina Nuclear, Faculdade de Medicina, Universidade de São Paulo, Brazil.
e. Laboratorio de Química Orgánica, Facultad de Ciencias, Universidad de la República, Iguá 4225, 11400 Montevideo, Uruguay.
f. Unidad de Biofísica de Proteínas, Institut Pasteur de Montevideo, Mataojo 2020, 11400, Montevideo, Uruguay
g. Depto. Inmunobiología, Facultad de Medicina, Universidad de la República, Av. Gral. Flores 2125, 11200, Montevideo, Uruguay
† correspondence,[email protected]
Table of contents
Scheme S1. Synthesis of compound 1 and 2.................................................................................2
RP-HPLC control of 99mTc radiolabeled TZ .....................................................................................3
Reaction Kinetics ...........................................................................................................................418FDG PET imaging.........................................................................................................................599mTc SPECT-CT pretargeted imaging ……………………………………………………………………………..……6
HPLC (UV detection) profile of compound 1 .................................................................................8
NMR Spectroscopy of compound 1...............................................................................................8
Mass Spectrometry of compound 1............................................................................................10
HPLC (UV detection) profile of compound 2 ...............................................................................11
Mass Spectrometry of compound 2............................................................................................11
Electronic Supplementary Material (ESI) for Organic & Biomolecular Chemistry.This journal is © The Royal Society of Chemistry 2018

2
Scheme S1. Synthesis of compound 1 and 2
1
NN
NN
OO
OO
NH
O
N
HNNH
CF3ONN
NN
OO
OO
NH2.HCl
+
CF3
OHNNH
N
O
O
O
O
N
NN
N NHNO
O
O
O
O
O
OO
NO
O
Et3N
HNN
H
O
O
N
HN
NH
O
F
FF
O
NH
HN NH2
HNN
H
O
O OH
HN
O
HN
NHH2N
NH
O
HO O
H2N
O
NH
2a
DIPEA
O
HN
NH
O
O
N
HN
NH
O
F
FF
O
NH
HN NH2
HN
NH
O
O OH
HN
O
HN
NHH2N
NH
O
HO O
H2N
O
O
NHONH
NN
NN
2
+
5

3
RP-HPLC control of 99mTc radiolabeled TZ
Figure S1: RP-HPLC analysis of 99mTc-1. UV profile (top) and radiochromatogram profile (bottom).
Figure S2: RP-HPLC analysis of 99mTc-2. UV profile (top) and radiochromatogram profile (bottom).

4
Reaction Kinetics
Figure S3: Kinetic studies of the reaction between (E)-cyclooctene-system (TCO) and 99mTc-2 in PBS at 25 °C.

5
18FDG PET imaging
Figure S4: 18FDG PET imaging in B16F10 melanoma tumour bearing mice. White cross indicates the tumour location.

6
99mTc SPECT-CT pretargeted imaging
Figure S5: Pretargeted VEGF tumour imaging. SPECT-CT imaging A) 1 h and B) 4 h post 99mTc-2 administration in mice pretargeted with bevacizumab-TCO. Control SPECT-CT imaging C) 1 h and D) 4 h post 99mTc-2 administration in mice pretargeted with non-conjugated bevacizumab. White arrow indicates tumor location.

7
Figure S6: Examples of tumour uptake after 24 h of 99mTc-2 for two mice. White arrow indicates tumour location.
Figure S7: SPECT imaging in control mice blocked with 5 mg of bevacizumab after 1 h of injection of 99mTc-2. White arrow indicates tumour location.

8
HPLC (UV detection) profile of compound 1
Figure S8: Reverse phase -HPLC analysis of derivative 1 (detection UV 280 nm).
NMR Spectroscopy of compound 1
Figure S9: 1H-NMR spectrum of derivative 1 (400 MHz, 303 K, MeOH-d4:D2O). *MeOH and water (residual solvent peaks).
9
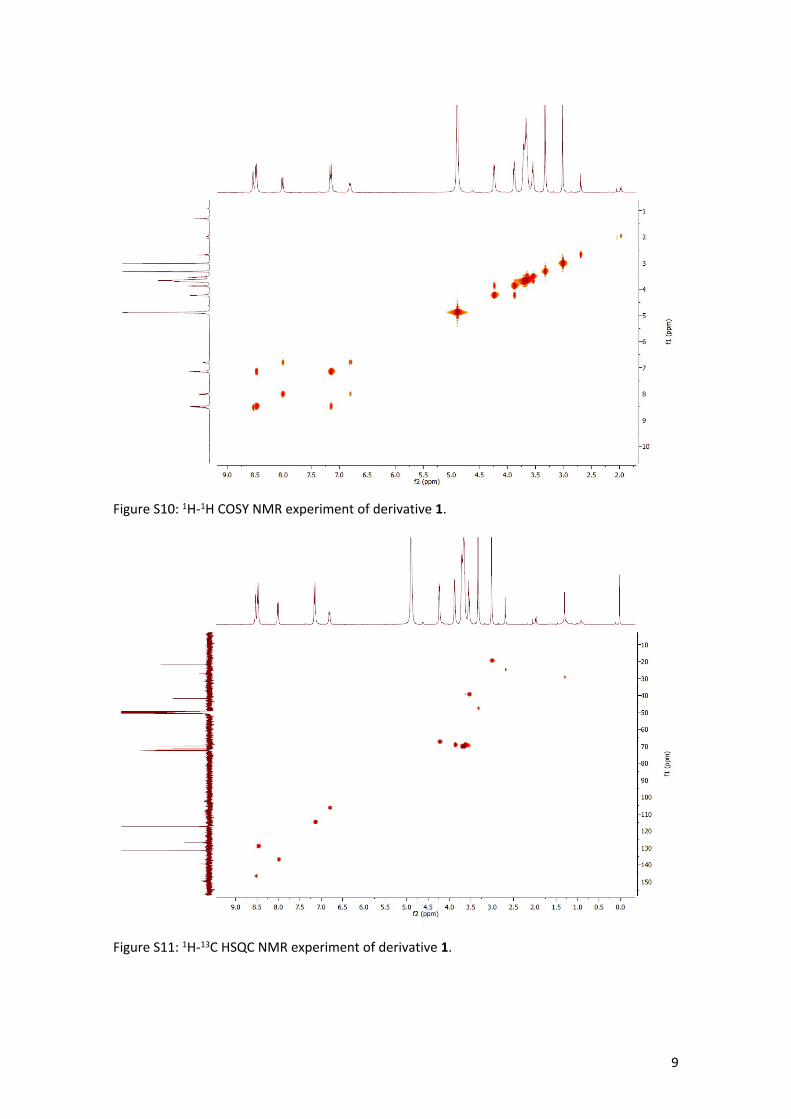
Figure S10: 1H-1H COSY NMR experiment of derivative 1.
Figure S11: 1H-13C HSQC NMR experiment of derivative 1.

10
Figure S 13: Full MS scan of derivative 1.
Figure S12: 1H-13C HSBC NMR experiment of derivative 1.
Mass Spectrometry of compound 1

11
HPLC (UV detection) profile of compound 2
Figure S14: Reverse phase -HPLC analysis of derivative 2 (UV detection, 280 nm).
Mass Spectrometry of compound 2
Figure S15: Full MS scan of derivative 2.