supporting report ii (feasibility study) paper iii flood
TRANSCRIPT

SUPPORTING REPORT II (FEASIBILITY STUDY)
PAPER III
Flood Warning and Forecasting System


The Study on Flood and Debris Flow in the Caspian Coastal Area focusing on the Flood-hit Region in Golestan Province
Supporting Report II (Feasibility Study)Paper III
Flood Warning and Forecasting System
JICA CTI Engineering International Co., Ltd. III - i
THE STUDY ON FLOOD AND DEBRIS FLOW IN THE CASPIAN COASTAL AREA
FOCUSING ON THE FLOOD-HIT REGION IN GOLESTAN PROVINCE
SUPPORTING REPORT II (FEASIBILITY STUDY)
PAPER III FLOOD WARNING AND FORECASTING SYSTEM
TABLE OF CONTENTS
Page
CHAPTER 1 PRESENT CONDITIONS ....................................................... III-1
1.1 Organization for Flood Management in Golestan Province........ III-1
1.1.1 Overall organization for flood management .................. III-1 1.1.2 Present flood information flow ...................................... III-1 1.1.3 Province Disaster Management Center (PDMC)........... III-2 1.1.4 Activities for related agencies........................................ III-2
1.2 Existing Online Data Collection System..................................... III-3
1.2.1 MOG system .................................................................. III-3 1.2.2 MOE system................................................................... III-4
1.3 Data Processing system............................................................... III-4
1.3.1 MOG system .................................................................. III-4 1.3.2 MOE System.................................................................. III-4
1.4 Telecommunication condition in study area ............................... III-5
1.4.1 Fixed telephone service................................................ III-5 1.4.2 Mobile telephone service ............................................... III-5 1.4.3 Radio Communications.................................................. III-5
1.5 Electrical condition ..................................................................... III-5
1.5.1 Power distribution condition.......................................... III-5 1.5.2 Power failure in the river basin ...................................... III-5
1.6 Major problems ........................................................................... III-6
CHAPTER 2 STUDIES OF PRIORITY PROJECT .................................... III-7
2.1 Identification of High Risk Areas ............................................... III-7
2.1.1 Disaster Characteristics.................................................. III-7

Supporting Report II (Feasibility Study) Paper III Flood Warning and Forecasting System
The Study on Flood and Debris Flowin the Caspian Coastal Area focusing on
the Flood-hit Region in Golestan Province
III - ii CTI Engineering International Co., Ltd. JICA
2.1.2 Selection of High Risk Areas......................................... III-8
2.2 Improvement Plan....................................................................... III-8
2.2.1 Proposed New Flood Information Flow ........................ III-8 2.2.2 Establishment of Flood Forecasting and Warning
Center (FFWC) .............................................................. III-9 2.2.3 Hydrological Observation and Data Collection............. III-9 2.2.4 Data Analysis and Forecasting ...................................... III-11 2.2.5 Setting of Warning Level............................................... III-13 2.2.6 Flood Warning Issuance ................................................ III-14 2.2.7 Flood Warning Dissemination ....................................... III-15
2.3 Conceivable Options................................................................... III-16
2.3.1 Three Options for Hydrological Observation and Data Collection .............................................................. III-16
2.3.2 Three Options for Data Analysis, Forecasting and Data Distribution ........................................................... III-18
2.3.3 Three Options for Warnings Dissemination .................. III-20
2.4 Selection of Optimum System .................................................... III-22
2.4.1 Setting up Alternatives................................................... III-22 2.4.2 Selection of Optimum System ....................................... III-22
CHAPTER 3 EQUIPMENT PLAN................................................................ III-23
3.1 System Summary ........................................................................ III-23
3.2 Telemetry Data Collection Subsystem........................................ III-25
3.2.1 Real time Data Collection PC........................................ III-26 3.2.2 Rainfall Gauging Station ............................................... III-26 3.2.3 Water Level Gauging Station ........................................ III-27
3.3 Data Processing & Monitoring Subsystem ................................. III-27
3.3.1 Data Processing Equipment ........................................... III-27 3.3.2 Flood Information Monitoring Equipment .................... III-28
3.4 Flood Warning Subsystem.......................................................... III-28
3.4.1 Warning method ............................................................ III-28 3.4.2 Equipment configuration ............................................... III-28 3.4.3 Warning Operation ........................................................ III-29 3.4.4 Flood Warning Post ....................................................... III-29

The Study on Flood and Debris Flow in the Caspian Coastal Area focusing on the Flood-hit Region in Golestan Province
Supporting Report II (Feasibility Study)Paper III
Flood Warning and Forecasting System
JICA CTI Engineering International Co., Ltd. III - iii
CHAPTER 4 COST ESTIMATE.................................................................... III-30
CHAPTER 5 IMPLEMENTATION PLAN................................................... III-31
CHAPTER 6 OPERATION AND MAINTENANCE ................................... III-32
6.1 Necessity of the operation and maintenance............................... III-32
6.2 Maintenance for the System........................................................ III-32
6.3 Operation and Maintenance Man Power..................................... III-33
6.4 Cost for Operation and Maintenance .......................................... III-33
LIST OF TABLES
Table 1.1 List for Major Members of Disaster Management Committee ............. III-1
Table 1.2 Inventory of existing online gauging station of MOG .......................... III-4
Table 1.3 Inventory of existing online gauging station of MOE........................... III-4
Table 2.1 Selected High Risk Areas...................................................................... III-8
Table 2.2 Deployment Plan of Rainfall and Water level Gauging Stations .......... III-10
Table 2.3 Information from Related Organization ................................................ III-11
Table 2.4 Data to be collected from Telemetry Gauging Station.......................... III-12
Table 2.5 Presentation of Processed Data ............................................................. III-12
Table 2.6 Temporary Warning Rainfall Level Setting.......................................... III-13
Table 2.7 Flood Notices ........................................................................................ III-13
Table 2.8 Pre-alert and Alert Rainfall ................................................................... III-14
Table 2.9 Flood Information/Notices Distribution................................................ III-14
Table 2.10 Definition of Flood Warnings ............................................................... III-15
Table 2.11 Recipients of Flood Warning ................................................................ III-16
Table 2.12 Comparison of Four Alternatives.......................................................... III-22
Table 3.1 System Summary .................................................................................. III-25
Table 3.2 Functions of Data Collection PC Equipment ........................................ III-26
Table 3.3 Functions of Rainfall Observation Equipment...................................... III-26
Table 3.4 Function of Rainfall & Snow Gauging Equipment ............................... III-27
Table 3.5 Function of Water Level Gauging Equipment ...................................... III-27
Table 3.6 Functions of Data Processing Equipment ............................................. III-28
Table 3.7 Function of Flood Monitoring Equipment ............................................ III-28
Table 3.8 Functions of Flood Warning Equipment ............................................... III-29
Table 4.1 Cost Estimate for Priority Project ......................................................... III-30
Table 5.1 Implementation Plan for Priority Project .............................................. III-31
Supporting Report II (Feasibility Study) Paper III Flood Warning and Forecasting System
The Study on Flood and Debris Flowin the Caspian Coastal Area focusing on
the Flood-hit Region in Golestan Province
III - iv CTI Engineering International Co., Ltd. JICA
Table 6.1 Summary of System Maintenance ........................................................ III-32
Table 6.2 Required Staff ....................................................................................... III-33
Table 6.3 Operation and Maintenance Cost Estimate ........................................... III-34
LIST OF FIGURES
Figure 1.1 Present Flood information flow ............................................................ III-2
Figure 2.1 Proposed Flood Information Flow ........................................................ III-8
Figure 2.2 Location Map for Proposed gauging station and Flood Warning post . III-10
Figure 2.3 Issuance of Flood Warning ................................................................... III-15
Figure 2.4 Conceptual Network for Option A........................................................ III-17
Figure 2.5 Conceptual Network for Option B ........................................................ III-17
Figure 2.6 Conceptual Network for Option C ........................................................ III-18
Figure 2.7 Schematic Diagram for Option A ......................................................... III-18
Figure 2.8 Schematic Diagram for Option B.......................................................... III-19
Figure 2.9 Schematic Diagram for Option C.......................................................... III-20
Figure 2.10 Conceptual Network for Option A........................................................ III-20
Figure 2.11 Conceptual Network for Option B ........................................................ III-21
Figure 2.12 Conceptual Network for Option C ........................................................ III-21
Figure 3.1 Overall Schematic Diagram for Priority Project ................................... III-24

The Study on Flood and Debris Flow in the Caspian Coastal Area focusing on the Flood-hit Region in Golestan Province
Supporting Report II (Feasibility Study)Paper III
Flood Warning and Forecasting System
JICA CTI Engineering International Co., Ltd. III- 1
CHAPTER 1 PRESENT CONDITIONS
1.1 Organization for Flood Management in Golestan Province
1.1.1 Overall organization for flood management
Present organization setup for the disaster prevention in Golestan province is as follows. Highest decision-making organization for disaster in the Golestan province is the Provincial Disaster Management Center under the command of the General PDMC of Golestan Province. General PDMC succeeded the existing organization of Mazandaran Province to organize Golestan Disaster Management Committee among the government agencies. 27 provincial and governmental agencies are member of committee. The major committee members concerning flood management is shown in Table 1.1 List for Major Members of Disaster Management Committee.
Table 1.1 List for Major Members of Disaster Management Committee Organization in Province Code
PDMC General (Chairmanship) GG
Managing Director of the Red Crescent Society in Province PDMC
General Managing Road and Transportation in Province. RTP
General Managing of MOE in Province MOE
General Managing of Meteorological Office in Province MOG
General Managing of DOE, Golestan Park Office DOE
Commander of the Disciplinary Region in Province. DRP
Commander of Traffic Police, Golestan Province RCG
Senior Commander of the Army in Region ARMY
General Managing Voice and Vision of the Islamic Republic of Iran (Radio &TV) RADIO/TV
Chairmanship of MOJA in Province. NOJA
Chairmanship of the Municipals Organization in Province. MOP
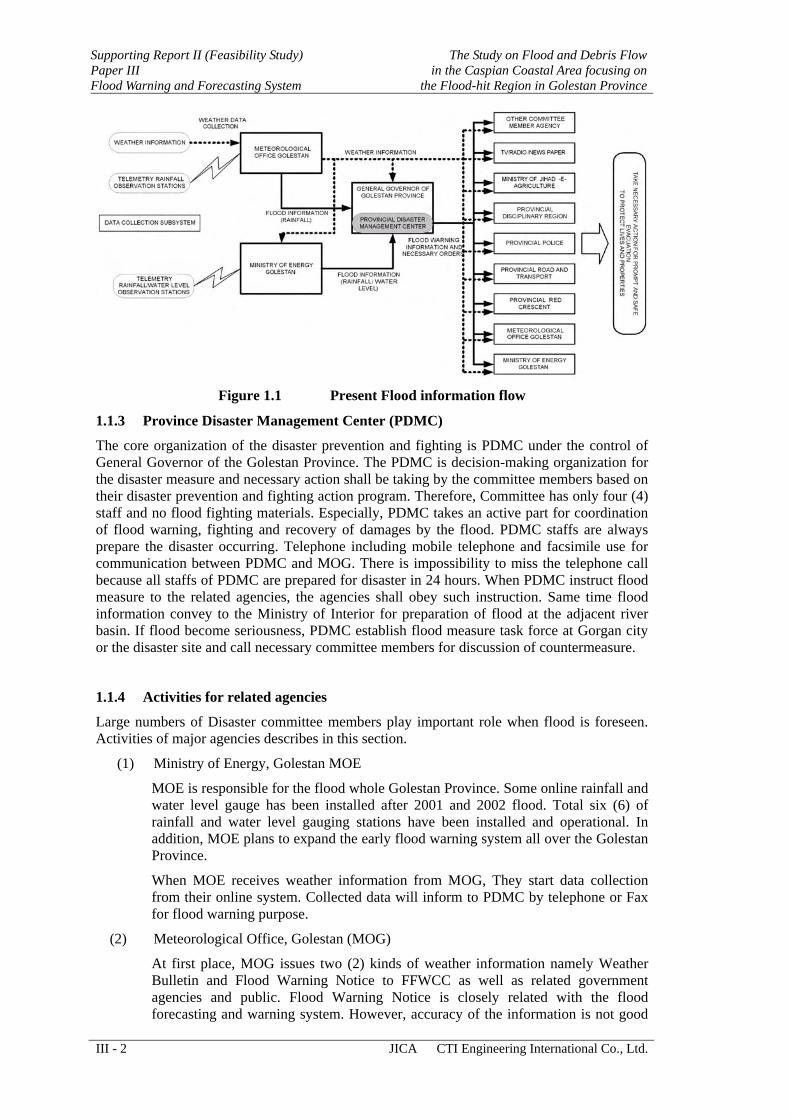
1.1.2 Present flood information flow
Figure 1.1 shows present flood information flow. All flood information is concentrated into the Province Disaster Management Center (hereinafter calls PDMC). PDMC will issue necessary instruction and order to related agencies as well as inhabitants in disaster area. Initial information of the flood comes from Meteorological Office, Golestan (hereinafter calls MOG) to PDMC formed by a weather bulletin and flood warning notice. Same time, Ministry of Energy, Golestan (hereinafter calls MOE) also send hydrological information concerning the flood to PDMC. PDMC issue an order to take action for flood to all concerning agencies based on such collected information.
Supporting Report II (Feasibility Study) Paper III Flood Warning and Forecasting System
The Study on Flood and Debris Flow in the Caspian Coastal Area focusing on
the Flood-hit Region in Golestan Province
III - 2 JICA CTI Engineering International Co., Ltd.
Figure 1.1 Present Flood information flow
1.1.3 Province Disaster Management Center (PDMC)
The core organization of the disaster prevention and fighting is PDMC under the control of General Governor of the Golestan Province. The PDMC is decision-making organization for the disaster measure and necessary action shall be taking by the committee members based on their disaster prevention and fighting action program. Therefore, Committee has only four (4) staff and no flood fighting materials. Especially, PDMC takes an active part for coordination of flood warning, fighting and recovery of damages by the flood. PDMC staffs are always prepare the disaster occurring. Telephone including mobile telephone and facsimile use for communication between PDMC and MOG. There is impossibility to miss the telephone call because all staffs of PDMC are prepared for disaster in 24 hours. When PDMC instruct flood measure to the related agencies, the agencies shall obey such instruction. Same time flood information convey to the Ministry of Interior for preparation of flood at the adjacent river basin. If flood become seriousness, PDMC establish flood measure task force at Gorgan city or the disaster site and call necessary committee members for discussion of countermeasure.
1.1.4 Activities for related agencies
Large numbers of Disaster committee members play important role when flood is foreseen. Activities of major agencies describes in this section.
(1) Ministry of Energy, Golestan MOE
MOE is responsible for the flood whole Golestan Province. Some online rainfall and water level gauge has been installed after 2001 and 2002 flood. Total six (6) of rainfall and water level gauging stations have been installed and operational. In addition, MOE plans to expand the early flood warning system all over the Golestan Province.
When MOE receives weather information from MOG, They start data collection from their online system. Collected data will inform to PDMC by telephone or Fax for flood warning purpose.
(2) Meteorological Office, Golestan (MOG)
At first place, MOG issues two (2) kinds of weather information namely Weather Bulletin and Flood Warning Notice to FFWCC as well as related government agencies and public. Flood Warning Notice is closely related with the flood forecasting and warning system. However, accuracy of the information is not good

The Study on Flood and Debris Flow in the Caspian Coastal Area focusing on the Flood-hit Region in Golestan Province
Supporting Report II (Feasibility Study)Paper III
Flood Warning and Forecasting System
JICA CTI Engineering International Co., Ltd. III- 3
enough from viewpoint of flood forecasting system that makes based on global weather information. Increase of accuracy for spot weather forecasting is not easy. To increase accuracy of forecasting, it will require three hourly weather forecasts and the Radar Rain gauge system etc.
Weather Bulletin
MOG issue the weather bulletin address to members of Province Disaster Management Committee when stormy weather especially heavy rainfall is foreseen. The general weather situation will describes on the bulletin at least 48 hours to one week ahead of the occurrence of phenomenon.
Flood Warning Notice
After weather bulletin issued, if the probability of flood occurrence will be increased within short period by their weather forecasting, MOG shall diffuse the flood warning notice to the PDMC and Disaster Management Committee members to recommend the preparation of flood warning, evacuation and fighting.
(3) Red Crescent Society
This organization is most organized and powerful for disaster prevention operation. They have enough experience staffs and relief goods. Red Crescent Society Golestan has responsibility to act necessary prevention, evacuation and rescue before, during and after against disaster. There is Red Crescent Society Road Center in Gorgan City and Major Township has branch offices in province that is mainly work on traffic accident rescue. When disaster occurs, Road center has function of local disaster rescue center. At first, Red Crescent Society receives weather bulletin and flood notice from MOG. Then Red Crescent Society receives dispatch order to the disaster site from PDMC. Nearest branch office staff of Red Crescent Society, including flood specialist and volunteers dispatch to the disaster site for flood evacuation and fighting aid to coordinate with Village chief. In this action, young volunteers play main role of the action. Therefore, Red Crescent Society promotes [one from one family program] to increase numbers of volunteers.
(4) Traffic Police
Traffic Police shall excite the traffic control in corporation with Ministry of Road and Transport, Golestan. When MOG issues weather information, the Disciplinary Region (kind of army) that is upper organization of the police, will order to traffic police to close the gate of Golestan Forest National Park Road. The Disciplinary Region will the receive recommendation for road closing from MORT too. After an order for road closed, No one can pass the road except the concerning officials. An order shall remain force until disaster is over.
1.2 Existing Online Data Collection System
1.2.1 MOG system
MOG, under I.R. Iranian Meteorological Organization installed three (3) climatologic and rain gauge stations and those stations are located within Madarsoo River and adjacent river basin. Rainfall gauge at Golestan National Park Climatologic and Dasht is operational. Golestan Forest National Park rain data is one of the important data for flood forecasting purpose. All online station connects with MOE through telephone line and GSM MODEM. Furthermore, the MOG plans to expand four (4) more rainfall gauging stations.

Supporting Report II (Feasibility Study) Paper III Flood Warning and Forecasting System
The Study on Flood and Debris Flow in the Caspian Coastal Area focusing on
the Flood-hit Region in Golestan Province
III - 4 JICA CTI Engineering International Co., Ltd.
Table 1.2 Inventory of existing online gauging station of MOG Location (Deg. Min) Station Class Long. E Lat. N
Elevation River Basin Remarks
Golestan Park Climatologic 55.47 37.24 460 Madarsoo Existing Dasht Climatologic 56.00 37.18 1,005 Madarsoo Existing Farsian Farang Rain gauge 55.37 37.13 670 Oghan Existing Hossein Abad Kalposh Climatologic 55.45 37.13 1,540 Oghan planning
Ghaleh Ghafeh Rain gauge 55.29 37.03 1,200 Chehl Chay planning Bidak Rain gauge Madarsoo planning Dasht Shad Rain gauge Madarsoo planning
1.2.2 MOE system
Ministry of Energy, Golestan office installed online observation stations for flood monitoring and warning after 2001 and 2002 floods. The four (4) stations out of six (6) are located in Madarsoo river basin. The all stations are connected to MOE-Gorgan office through the telephone network.
The existing online station inventory for MOG and MOE is attached as Table 1.3
Table 1.3 Inventory of existing online gauging station of MOE
Location (Deg. Min) Station Class Long. E Lat. N
Elevation River Basin Remarks
Tangrah Water level 55.44 37.27 330 Madarsoo Dasht Water level 1,005 Madarsoo Galikesh Rain gauge 55.27 37.15 250 Oghan Dasht Rain gauge Madarsoo Narab Rain gauge Tillabad Dashy Shad Rain gauge 55.55 37.16 1540 Madarsoo
1.3 Data Processing system
The personal computer based data collection system for both MOG and MOE is operational.
1.3.1 MOG system
MOG online data collection system software, made by German Mevis T. version 1.7 UMAD has an automatic observation function. One of control function is polling instant value (ON/OFF) and can be set any time interval including online mode. This shall use for automatic observation of online station every one-hour data collection. System has two inputs, one is GSM MODEM and other is public telephone network MODEM. In case of flood event, both lines shall connect as online bases. Therefore, real time online observation data for two stations can be received. As the output of data processing, several kind of graphics and table can be displayed and printout.
1.3.2 MOE System
MOE data collection system software, made by OTT [HIDLAS] has function for automatic data collection. This function dose not use so far. It shall use for automatic observation of station every one-hour data collection. System has one inputs by public telephone network MODEM.

The Study on Flood and Debris Flow in the Caspian Coastal Area focusing on the Flood-hit Region in Golestan Province
Supporting Report II (Feasibility Study)Paper III
Flood Warning and Forecasting System
JICA CTI Engineering International Co., Ltd. III- 5
1.4 Telecommunication condition in study area
1.4.1 Fixed telephone service
Golestan Telephone Company gives telephone service in Golestan province having 378,715 lines against 1,426,288 population equivalent 26 lines /100 persons. There are 1,055 villages within Golestan Telephone Company responsible area. Telephone lines already install at 977 villages out of 1,055 and remaining 980 villages is under expansion of telephone lines using WLL technology. Fixed telephone service among the Madarsoo River is well installed and nominal 56kbs quality is guaranteed. However, actual transmission speed is more less 23kbs due to long telephone line between exchange and subscriber. Telecommunication Company has basic policy to install the public telephone exchange those village living inhabitants over the 100 population. Village telephone exchange has Microwave network or fiber optical cable network to connect nearest bigger telephone exchange and distribute to village subscribers through electronics switch.
1.4.2 Mobile telephone service
There is only one service provider for mobile telephone, Mobile telephone Company belonging to the Iranian Telephone Company that is one of government enterprise. 6,681,554 sets of hand terminal are operational in Iran that is equivalent 36 sets/100 persons. About 64,670 sets hand terminal are operational within Golestan territories that is equivalent 4.5 sets/100 persons and 116 mobile base stations were installed in the area. Semens GSM model 900 is installed. Installation of mobile base station in urban area employed micro cellular that have many base station in short distance. However, mountainous area dose not have such plural base station. It has installed on the top of mountain to keep wide propagation. It can cover huge service area. However, mobile telephone service is not covering all area due to obstruction of the mountain. Therefore, this service is not covered entire project site. Many blind service areas are found, especially Golestan Forest National Park Area.
1.4.3 Radio Communications
Radio Communication Regulatory of Iran (RCRI) is implementing agency for the management and control of the telecommunication in the I.R. Iran. Frequency allocation of radiotelephone network shall apply to the Radio Communication Regulatory of Iran, address to Shariati Avenue, near Seed khan Dan Bridge, Hoveizeh Streets, Sahand Ally, Teheran.
1.5 Electrical condition
1.5.1 Power distribution condition
The power distribution system among the river basin has two (2) types of power line. One is 4,400V middle voltage 3 phases line and other one is 220V low voltage 3 phases or 5 phases line. 4,400V is step down by the transformer that is installed depending on the demand of the customers. Voltage fluctuation is quite huge.
1.5.2 Power failure in the river basin
The power supply within the river basin is stable. Planed power down is announced to the public prior to the installation. However, power failure during the flood is another story. In accordance with previous disaster management survey, power failure occurred in very early stage of flood on 2001. Lower middle basin area started power failure 30 minutes after starting the flood. Even lower basin area, after one (1) hour of starting the flood, power failure started and Mosque loudspeaker could not work. Therefore, power back-up system for the flood warning equipment is essentially needed.

Supporting Report II (Feasibility Study) Paper III Flood Warning and Forecasting System
The Study on Flood and Debris Flow in the Caspian Coastal Area focusing on
the Flood-hit Region in Golestan Province
III - 6 JICA CTI Engineering International Co., Ltd.
1.6 Major problems
On site survey was conducted to obtain the evidence of the condition for existing online data collection system. Both MOG and MOE data collection system are not prepared in order to the flood forecasting and warning purpose. In view of such point, the following problems are discovered. Possible solution must find out and reflects in the system design.
(1) The blind area of Hydrological and Meteorological Data.
There is no rainfall and water level gauging station installation at upper stream of Madarsoo river cause rainfall and water level data lacking.
(2) No real time data collection
Both MOG and MOE online data collection system is not real time data collection system.
MOG system collected past 1 hour, 3 hours, 6 hours and 24 hours data for weather forecasting purpose in normal condition. Once rainfall starts, MOG will connect particular station as online bases to obtain real time data. However, it is not automatic real time observation mode. MOE system collected past 2 hours data for hydrological data collection purpose. The flood forecasting and warning system shall require to measure real time rainfall and water level data at least every 1-hour interval.
(3) No data exchange
There is no data exchange between MOG and MOE. In addition, MOE and MOG gauging station duplicated at same place such as Dasht and Tangrah and near future Dasht Shad. Unified data at same place will be necessary. For such reason, data exchange system shall be needed.
(4) Data transmission line problems
The data transmission network by the public telephone is not keep high reliability. It easily disconnected especially during heavy rain and flood.
(5) Poor installation
Tangrah water level gauging station is not prepared for serious flood situations. Height of water level gauge container is lower than previous 2001 flood water level mark. Extension of well and support material will be necessary.
Dasht Bridge water level station The telephone pole installed in a riverbed easily wash away when flood coming. As result, telephone pole near the station washed away and cut out telephone line on August 10, 2005 flood.
(6) No power back up
Both water level stations of MOE needs battery charger by solar panel. Existing station will exchange the battery for charging when it exhausts power. Solar panel can be charged all the time to keep operational condition always and solve battery-charging work.
(7) Flood warning post does not exist.
There is no flood warning post installed. The flood warning dissemination is made only telephone and acquired at second hand.
(8) Common rule for data collection system is not established.
(9) Criteria of flood are not established yet even it was some idea of warning rainfall and water level. Warning level for rainfall and water level for each gauging station is not fixed.

The Study on Flood and Debris Flow in the Caspian Coastal Area focusing on the Flood-hit Region in Golestan Province
Supporting Report II (Feasibility Study)Paper III
Flood Warning and Forecasting System
JICA CTI Engineering International Co., Ltd. III- 7
CHAPTER 2 STUDIES OF PRIORITY PROJECT
2.1 Identification of High Risk Areas
The Study Area extends from the North of Khorasan Province to the Golestan dam, covering a total of 2,340km2. There are hundreds of villages scattered over the river basin, and thousands of tourists gather at Golestan Forest National Park in summer. There are many passengers are passing through National Park Road forward to Mashhad. On the other hand, a considerable number of villages, the roads along the Madarsoo River and the tourist spots are exposed to a rain-induced disaster such as flood, due to its topographical, geological and meteorological conditions.
The purpose of FFWS is to evacuate those inhabitants and tourists in the potential disaster areas safely during such a disaster. However, the problem is how to deal with those potential disaster areas scattered all over the Study Area within a limited investment. Therefore, prioritization is inevitable to maximize the benefits from the Master Plan by investing more to high risk areas that is named priority project in F/S study. In this sense, such high risk areas must be identified through a comprehensive examination on past disasters and damage potentials comprehensively.
2.1.1 Disaster Characteristics
In accordance with the Meteorological and hydrological study and report of 2001 and 2002 disaster, report prepared by Iranian Red Crescent Society, characteristics of disaster shall seek. The past disaster experience shall be served as lessons to learn and shall reflects to system design.
(1) Flood occurred during Summer Season
Based on 1975 to 2002 rainfalls records of Tangrah, November to May are wet months and June to October are dry months and March is the highest rainfall month in the basin. Maximum monthly rainfall falls on March. However, it will not cause flood. Small rainfall will falls continuously throughout the month. Then cumulative rainfall becomes huge amount. However, this rainfall could not cause flood. The flood mainly occurs on Summer time especially August due to a localized torrential downpour by monsoon rain.
(2) Flood victims concentrated at Golestan Forest National Park Area
The August 2001 flood that killed some 254 people and August 2002 flood that killed 54 people is unforgettable by a result of flood. About 76% on 2001 flood and 81% of victims on 2002 flood has been concentrated within the National Park Area. The elevation of the road of Golestan Forest National Park that runs along the river is very low in several stretches. Total 25km of the road is vulnerable to inundation. Besides, many tourists gather at other low places on the river that is easy to access from the road but vulnerable to a flood. It can be said that flood damage potential is still very high in spite of all the efforts made by the government after the disaster.
(3) Maximum rainfall at Tangrah
On 2001, 2002 and 2005 flood, maximum rainfall has been recorded at Tangrah, where locate at middle reaches of Madarsoo River.
(4) Flood occurred at nighttime
Based on the experiences of the flood from 2001 to 2005, it is recorded that all of the flood occurred during nighttime only. Mainly rainfall starts from evening up to the midnight.

Supporting Report II (Feasibility Study) Paper III Flood Warning and Forecasting System
The Study on Flood and Debris Flow in the Caspian Coastal Area focusing on
the Flood-hit Region in Golestan Province
III - 8 JICA CTI Engineering International Co., Ltd.
2.1.2 Selection of High Risk Areas
Based on the above discussion, high risk areas that will be targeted for the priority project are tentatively selected and summarized as follows:
Table 2.1 Selected High Risk Areas High Priority Area River
Basin Area Subsystem Golestan Forest National Park Flood warning Madarsoo Whole Madarsoo river basin Flood forecasting
In the following Chapter, improvement of the priority project of FFWS is studied, concentrating on protection of the selected high risk areas.
2.2 Improvement Plan
This section describes major points of improvement proposed in the Priority Project
2.2.1 Proposed New Flood Information Flow
To reinforce the existing flood information dissemination organization, the following flood information organization is proposed. Main points of reinforcement are:
Reinforcement of data collection network
Establishment of Flood Forecasting and Warning Center (FFWC)
Improvement of the data processing process
Establishment of the flood information monitoring network
Installation of the flood warning posts.
To consider the abovementioned indispensable points, new flood information flow is proposed as the following Figure 2.1. Existing organization and action shows blue column. New organization and system shows in orange column and the portion to be needed modification shows yellow column.
Figure 2.1 Proposed Flood Information Flow

The Study on Flood and Debris Flow in the Caspian Coastal Area focusing on the Flood-hit Region in Golestan Province
Supporting Report II (Feasibility Study)Paper III
Flood Warning and Forecasting System
JICA CTI Engineering International Co., Ltd. III- 9
2.2.2 Establishment of Flood Forecasting and Warning Center (FFWC)
As mentioned on section 1.1.2, there is two online systems are operational for deferent purpose. In view of the FFWS establishment, collected data integration is urgently needed. In this connection, establishment of FFWC is proposed at PDMC. Main purpose of FFWC is to disseminate reliable flood warning information to the PDMC as earlier than possible. FFWC shall receive telemetry rain gauge/ water level data from MOG and MOE and data processing, editing, and store the processed data into the Web server for disseminating flood information for concerning agencies. Once FFWC is established, stability and reliability of the system is necessary to avoid lacking of information during the flood.
PDMC dose not has any kind of engineer at present. In order to establishment of unified flood management, PDMC shall employ the hydrological and electronics engineers together with disaster prevention staff after reinforcement of organization.
2.2.3 Hydrological Observation and Data Collection
(1) Improvement of Telemetry Gauging Station Network
There are generally two directions towards improvement of the present online data collection system. The first one is extension of the covering area, which will be attained by adding rainfall and water level gauging stations. The second one is modernization of equipment including a telemetry system.
(a) Installation of New Gauging Stations
Installation of new gauging stations is essential to minimize the blind areas. It brings more flood information and leads to enhancement of reliability of the system. However, the more stations, the more it will cost. The number of the new stations should be limited at the minimum, considering hydrological requirements and locations of the selected high-risk areas. In this sense, the following criteria are proposed to establish a deployment plan of rainfall and water level gauging stations:
(i) Criteria for Rainfall Station
• There was no rain gauge station exist on the Upper Madarsoo River and its tributary. At least 4 new gauging stations shall be necessary to ensure more accurate FFWS operation, and
• To avoid robbery of equipment and to ease maintenance works, rainfall stations must be located in Climatic observation station of MOG.
(ii) Criteria for Water Level Station
• At least tow water level station must be installed upstream of every high risk area for river flood,
• A new water level station must be installed at least 10 km upstream from the corresponding high priority area to ensure minimum leading time of one hour that allows consecutive actions from observation and data collection to evacuation, and
• To avoid robbery of equipment and to ease maintenance works, water level stations must be installed in well protected station housing in principle.
Based on the above criteria, a deployment plan comprised of seven rainfall gauging and four water level gauging stations are tentatively proposed as below. Table 2.2 shows Deployment Plan of Rainfall and Water level Gauging stations and Figure 2.2 shows Location Map of Proposed Gauging

Supporting Report II (Feasibility Study) Paper III Flood Warning and Forecasting System
The Study on Flood and Debris Flow in the Caspian Coastal Area focusing on
the Flood-hit Region in Golestan Province
III - 10 JICA CTI Engineering International Co., Ltd.
station.
Table 2.2 Deployment Plan of Rainfall and Water level Gauging Stations Number of Rainfall Station Number of Water Level Station Agency
Existing New Total Existing New Total MOE 2 0 2 2 2 4 MOG 2 4 6 0 0 0 Total 4 (3) 4(4) 8(7) 2 (2) 2(2) 4(4)
Note: Note: Number in parentheses is actual number of stations. MOE and MOG installed a duplicate rain gauge station at Dasht.
Figure 2.2 Location Map for Proposed gauging station and Flood Warning post
(b) Modernization of Equipment
Existing online data collection system is one of the telemetry data collection system. However, it is true that a big gap still exists between the present manual online system and the fully automatic system in terms of technology and cost. The present system has commenced in the Madarsoo River Basin just a few years before, and it seems to be very early to introduce a fully automatic system. In this regard, three options from the existing manual system to a fully automatic system are conceived and compared for determining the development level of the hydrological observation, data collection and flood warning subsystem in Section 1.3.
(2) Information exchange between Related Organizations
MOE and MOG have their own hydrological and meteorological observation networks, telecommunication measures and/or technology and equipment for data analyses. These organizations could provide to FFWC useful information on

The Study on Flood and Debris Flow in the Caspian Coastal Area focusing on the Flood-hit Region in Golestan Province
Supporting Report II (Feasibility Study)Paper III
Flood Warning and Forecasting System
JICA CTI Engineering International Co., Ltd. III- 11
weather, rainfall, river condition and disaster that helps FFWC forecast a flood very much. In this study, inter-organization collaboration with these organizations is discussed to maximize utilization of information available among them, taking into account institutional arrangement. It is also noted that these collaborations must be made in a reciprocal manner. The digital data exchange will be made.
Table 2.3 Information from Related Organization Organization Possible Information
MOG Weather Forecast, Alert Message, Rainfall data MOE Rainfall and water level data, Flood notice
(a) Collaboration with MOG
MOG is an only organization that is responsible for weather forecasting in the country. The information from this organization is very precious for FFWS. In this context, collaboration with MOG should be strengthened to collect more information including satellite pictures. In return, FFWC can provide their real-time hydrological data that must be valuable to MOG too.
(b) Information exchange with related Organizations
Traffic Police, Red Crescent Society, DOE National Park Office and Ministry of Road and Transport can possibly play a role of telemetry gauging function. They are equipped with a VHF radiotelephone. These organizations shall exchange the river and road condition including flood information with FFWC each other in a flood.
FFWC shall prepare the flood information and distribute above mentioned organization via Internet.
2.2.4 Data Analysis and Forecasting
The present early flood warning system remains very far from a satisfactory level, and no scientific analysis other than conversion from water level to discharge has been done. Thus, upgrading of this subsystem is of first priority. Data processing and analysis for flood forecasting shall be installed at FFWC in PDMC.
(1) Data Analysis
Data analysis includes the following functions:
• Data processing, • Data storage, and • Visualization of processed data
(a) Data Processing
Rainfall data are automatically processed into accumulated rainfalls, rainfall intensities and basin mean rainfalls, and water level data are also automatically converted to discharges based on the Mannings’ Formula.

Supporting Report II (Feasibility Study) Paper III Flood Warning and Forecasting System
The Study on Flood and Debris Flow in the Caspian Coastal Area focusing on
the Flood-hit Region in Golestan Province
III - 12 JICA CTI Engineering International Co., Ltd.
Table 2.4 Data to be collected from Telemetry Gauging Station Data No. of Data Collection Frequency Information
Rainfall 7
Usually, the data collection interval is every an hour. The interval can be changed to every 10 or 30 minutes.
• Time of observation: year, month, day, hour, minute.
• Total rainfall from the previous observation.
Water Level 4
Usually, the data collection interval is every hour. The interval can be changed to every 10 or 30 minutes.
• Time of observation: year, month, day, hour, minute.
• Peak discharge from the previous observation.
(b) Data Storage
The processed data are automatically stored in a database together with the measurement time. The database is renewed every time new data are collected from the stations.
(c) Visualization of Processed Data
The processed data are automatically visualized in a variety of maps, graphs and summarized as Table 2.5 below:
Table 2.5 Presentation of Processed Data
No Item Information Included
1 Flood Status Map Rainfall intensities and water levels are classified into a few status according to their magnitude.
2 Flood Status Diagram
Current rainfall intensities and discharges on the schematic diagram of Madarsoo River.
3 Rainfall Graph (All Stations) Rainfall at all the rainfall stations for last 24 hours.
4 Rainfall Graph (Each Station) Rainfall at each rainfall station for last 24 hours.
5 Discharge Graph (All Stations) Discharges at all the water level stations for last 24 hours.
6 Discharge Graph (Each Station)
Discharge, water level and basin mean rainfall at each water level station.
7 Rainfall Table Rainfall intensity and accumulated rainfall in last 24 hours.
8 Water Level and Discharge Table Water Level and discharge in last 24 hours
In these maps and graphs, the processed rainfalls and discharges are compared with two alert levels to categorize seriousness of the flood in terms of magnitude of rainfall as described subsection in 2.2.5 Flood Notices of this subsection. The two levels are Pre-alert and Alert rainfalls that are used for judgment of announcement of the flood notices.
(2) Flood Forecasting
First of all, it is stressed that forecasting of flood for the river basin is very hard. Rainfall is so intensive in space and time, and a phenomenon is changeable so fast. Available data is also very scarce. Under these difficulties, a forecasting model can be elaborated for the flood. However, it is dangerous to rely on the forecasting models. Therefore, the actual observed data not forecasted results should be used for decision-making such as announcement of flood notices.

The Study on Flood and Debris Flow in the Caspian Coastal Area focusing on the Flood-hit Region in Golestan Province
Supporting Report II (Feasibility Study)Paper III
Flood Warning and Forecasting System
JICA CTI Engineering International Co., Ltd. III- 13
2.2.5 Setting of Warning Level
The setting of warning level is basic issue of the FFWS. Warning water level and rainfall can be detected by the telemetry data collection PC and give alarm on the display and sound. Gelman Darreh, Dasht Bridge and Tangrah Water level gauging station where located along with Madarsoo River have relative water level. However, water run-off time from Gelman Darrh to Dasht Bridge (2.5 hours) and to Tangrah (around 4 hours) is short. It is not enough time for evacuation operation. Therefore, warning rainfall level will employ for flood forecasting. The figure of pre-alarm and alarm rainfall level temporary set based on the mean level of rainfall at sub-basin reported by hydrological study. However, the value shall be calibrated actual warning rainfall level after the every flood. The temporary warning rainfall level is shown in Table 2.6.
Table 2.6 Temporary Warning Rainfall Level Setting
Sub-basin Station Pre-Alert Level Alert level
Sub-basin 1 Narden 5 mm 15 mm
Sub-basin 1 Haghalkhajeh 5 mm 15 mm
Sub-basin 1 Sefid Dally 5 mm 15 mm
Sub-basin 1 Gelman Darre 5 mm 15 mm
Sub-basin 3 Dasht 7 mm 20 mm
Sub-basin 4 Dasht-e-Shad 10 mm 30 mm
Sub-basin 5 Tangrah (National Park) 10 mm 30 mm
(1) Flood Notice
In addition to the processed flood information, FFWC is supposed to distribute flood notices in the FFWC Guideline for flood management. This Study proposes definition of the flood notices that has not been clearly described in the guideline, considering characteristics of disasters in the Study Area.
(a) Definition of Flood Notices
Three kinds of flood notices are proposed for each of flood. They are Pre-flood Notice, Flood Notice, and Cancellation of Flood Notice, as defined below.
Table 2.7 Flood Notices
Type of Disaster Flood Notice Definition
Pre-flood Notice To notify relevant organizations that rainfall and/or discharge has exceeded the Pre-Alert Level and situation is expected to further worsen.
Flood Notice To notify relevant organization that rainfall and/or discharge has exceeded the Alert Level and situation is expected to further worsen.
River Flood
Cancellation of Flood Notice
To notify relevant organizations that rainfall and/or discharge has decreased below the Alert Level and situation is expected to settle.
The Pre-flood Notice aims to notify relevant organizations that a symptom of disaster has been perceived, while the Flood Notice aims to notify them that a serious situation including losses of human lives is expected. Cancellation of these notices aims to notify them that the situation is improving.

Supporting Report II (Feasibility Study) Paper III Flood Warning and Forecasting System
The Study on Flood and Debris Flow in the Caspian Coastal Area focusing on
the Flood-hit Region in Golestan Province
III - 14 JICA CTI Engineering International Co., Ltd.
These flood notices are value-added flood information that is extremely close to flood warnings that the PDMC of a province/prefecture issues. The final judgment for the issuance of warnings is to be made by the PDMC mainly based on these flood notices.
(b) Definition of Alert Rainfall
To assist FFWC personnel to announce the flood notices objectively and promptly, two alert levels of rainfall are defined at every gauging station. Concrete values of these levels will be determined upon due consideration of results of the hydrological and hydraulic studies and experiences in Japan.
Table 2.8 Pre-alert and Alert Rainfall Alert Level Consideration for Determination of Values
Pre-alert rainfall The minimum level that needs preparedness for evacuation. Alert rainfall The minimum level that needs immediate evacuation.
(4) Distribution of Flood Information/Notice
Processed flood information and flood notice is basically distributed to related organizations in accordance with the authorized routes as shown in Figure 2.3.:
Table 2.9 Flood Information/Notices Distribution Information/Notice Content Recipient
Flood Notice Pre-flood Notice, Flood Notice, and Cancellation of Notices
Flood Information Visualized Information (Table 2.4)
PDMC, MOE, MOG, Red Crescent Society, Traffic Police, MORT, MOJA,
Processed flood information is very helpful to understand the flood notices for the related organizations. Shearing of the same information among these execution organizations contributes to more effective interventions against a flood disaster. The reason why the flood information is given directly to PDMC members authorities not via PDMC is that utilization of a computer network is considered as a communication measure to ensure prompt and accurate transmission of enormous graphic data. The chief of PDMC is to issue flood warnings mainly based on the flood notices.
Regarding the configuration of the information distribution system, three options are compared in Section 2.3.
2.2.6 Flood Warning Issuance
The PDMC is responsible for security of inhabitants and tourists in his jurisdiction. The PDMC finally give the flood warning for evacuation, based on collected information including the flood notices from FFWC. To assist the PDMC to judge the issuance of warnings promptly, a guideline is proposed in this Study.
(1) Definition of Flood Warnings
Three kinds of warnings, Flood Caution, Direction of Evacuation, and Cancellation of Evacuation are defined as follows:

The Study on Flood and Debris Flow in the Caspian Coastal Area focusing on the Flood-hit Region in Golestan Province
Supporting Report II (Feasibility Study)Paper III
Flood Warning and Forecasting System
JICA CTI Engineering International Co., Ltd. III- 15
Table 2.10 Definition of Flood Warnings Flood Warning Definition
Flood Caution To warn inhabitants and tourists that a flood is expected.
Direction of Evacuation To direct inhabitants and tourists to evacuate to designated places immediately.
Cancellation of Evacuation To notice inhabitants and tourists that the Direction of Evacuation has been cancelled.
(2) Issuance of Flood Warnings
To judge the issuance of the warnings, technical information is indispensable. In addition, the judgment must be made appropriately and promptly. In this context, the flood notices announced by FFWC should be referred and connected to the flood warnings as follows:
Figure 2.3 Issuance of Flood Warning
With the above relation, the PDMC will be able to judge the issuance of the warnings promptly based on the flood notices. For example, upon receiving Flood Notice, the PDMC can issue Direction of Evacuation for the relevant high risk area immediately. Nevertheless, the flood notices are not directions from FFWC to the PDMC. It is of course that the final decision whether to issue flood warnings or not is made by the PDMC. The notices are a kind of advice from FFWC, and the PDMC is still responsible for the warning issuance.
2.2.7 Flood Warning Dissemination
Flood warnings must be promptly and precisely disseminated to inhabitants and tourists in dangerous areas. At the same time, the warnings shall be diffused to relevant organizations that might be involved in relief activities as well as Ministry of Interior.
(1) Recipients of Flood Warnings
In addition to inhabitants and tourists in dangerous areas, the following organizations are conceived as recipients of flood warnings:

Supporting Report II (Feasibility Study) Paper III Flood Warning and Forecasting System
The Study on Flood and Debris Flow in the Caspian Coastal Area focusing on
the Flood-hit Region in Golestan Province
III - 16 JICA CTI Engineering International Co., Ltd.
Table 2.11 Recipients of Flood Warning Classification Conceivable Recipients
Individuals Inhabitants and Tourists/Passengers
Local Authorities Villages chief
Other Related Government Organization
Traffic Police, Red Crescent Society, Ministry of Road and Transport, DOE and other organizations involved in Disaster Management Committee
Broadcasting Mass Media TV and Radio
Mass media such as TV and radio is very effective to diffuse information to numerous individuals at a same time. FFWC should release necessary flood information to the Medias to be involved in the warning dissemination.
(2) Dissemination Measures
Ordinary telecommunication measures such as telephone and fax and mobile telephone can be applied for the related governmental organizations and mass media that are far from the disaster areas. For the lower local authorities, the relevant villages and tourists, the patrol car from the police, Red Crescent Society and DOE Park office may give them flood information using their VHF radiotelephone network.
As repeatedly pointed out, the problem is the lacking of telecommunication measures to the most important recipients, namely inhabitants and tourists whom a disaster is threatening. An appropriate communication measure including a voice amplifier with a loudspeaker (Warning Post) to diffuse a warning to inhabitants and tourists must be introduced to the selected high risk area. Three options of the warning dissemination system are conceived and compared in Subsection 2.3.3.
2.3 Conceivable Options
As described in Section 2.2, conceivable equipment options for each of the hydrological observation and data collection subsystem, the data analysis, forecasting, transmission subsystem, and the flood warning subsystem are discussed in this section.
Three different development levels are basically considered: namely Option-A is a manual system, Option-B is a semi-automatic system and Option-C is a fully automatic system. For each of the three subsystems of the proposed FFWS, three options of different development level is conceived as follows:
2.3.1 Three Options for Hydrological Observation and Data Collection
(1) Option-A (Reinforcement of Existing system)
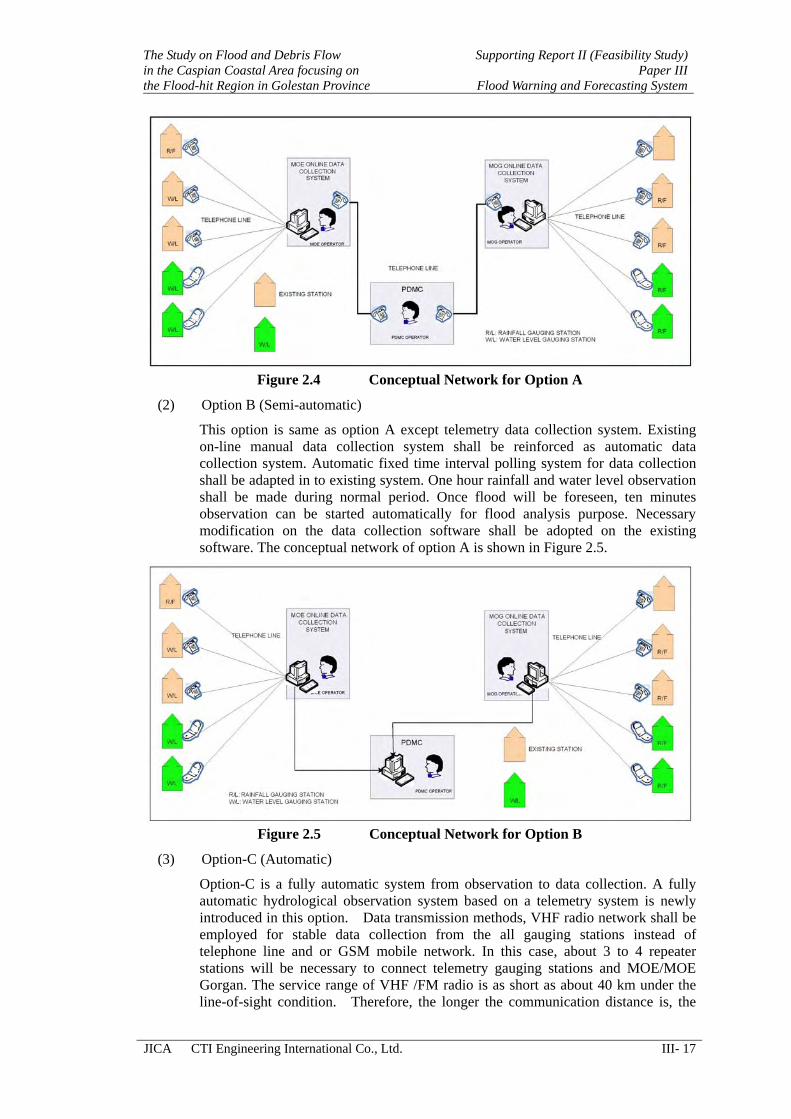
This option is a kind of spatial expansion of the existing online system. The blind areas of hydrological observation network can be reduced with the new stations. GSM mobile network shall be used as much as possible. However, some blind area of GSM mobile network service area is existing. The telephone network will be applicable for such gauging station. The hydrological sensors such as a tipping bucket type rainfall gauge and a float type water level gauge are installed at the new stations to expand the coverage areas. Existing on-line manual data collection will be remaining as it is. The conceptual network of option A is shown in Figure 2.4.
The Study on Flood and Debris Flow in the Caspian Coastal Area focusing on the Flood-hit Region in Golestan Province
Supporting Report II (Feasibility Study)Paper III
Flood Warning and Forecasting System
JICA CTI Engineering International Co., Ltd. III- 17
Figure 2.4 Conceptual Network for Option A
(2) Option B (Semi-automatic)
This option is same as option A except telemetry data collection system. Existing on-line manual data collection system shall be reinforced as automatic data collection system. Automatic fixed time interval polling system for data collection shall be adapted in to existing system. One hour rainfall and water level observation shall be made during normal period. Once flood will be foreseen, ten minutes observation can be started automatically for flood analysis purpose. Necessary modification on the data collection software shall be adopted on the existing software. The conceptual network of option A is shown in Figure 2.5.
Figure 2.5 Conceptual Network for Option B
(3) Option-C (Automatic)
Option-C is a fully automatic system from observation to data collection. A fully automatic hydrological observation system based on a telemetry system is newly introduced in this option. Data transmission methods, VHF radio network shall be employed for stable data collection from the all gauging stations instead of telephone line and or GSM mobile network. In this case, about 3 to 4 repeater stations will be necessary to connect telemetry gauging stations and MOE/MOE Gorgan. The service range of VHF /FM radio is as short as about 40 km under the line-of-sight condition. Therefore, the longer the communication distance is, the

Supporting Report II (Feasibility Study) Paper III Flood Warning and Forecasting System
The Study on Flood and Debris Flow in the Caspian Coastal Area focusing on
the Flood-hit Region in Golestan Province
III - 18 JICA CTI Engineering International Co., Ltd.
more relay stations are required, resulting in an increase of the initial cost. Nevertheless, VHF/FM radio communication is generally recognized to be the most suitable for low speed data communication such as a hydrological telemetry system. Small running cost is also attractive. The conceptual network of option A is shown in Figure 2.6.
Figure 2.6 Conceptual Network for Option C
2.3.2 Three Options for Data Analysis, Forecasting and Data Distribution
(1) Option-A (Existing system)
This option follows the existing manual data processing. Collected hydrological data through a telephone from the online stations are compiled and recorded in a PC memory. Water level-discharge conversion is also made manually based on previously prepared conversion tables. Data visualization and forecasting is also made manually. Distribution of flood data/information is made through a telephone or a fax as currently made.
Figure 2.7 Schematic Diagram for Option A

The Study on Flood and Debris Flow in the Caspian Coastal Area focusing on the Flood-hit Region in Golestan Province
Supporting Report II (Feasibility Study)Paper III
Flood Warning and Forecasting System
JICA CTI Engineering International Co., Ltd. III- 19
(2) Option-B (Automatic Processing)
A computerized system is introduced in this option to speed up the procedure and to avoid human errors.
(a) Equipment for Data Analysis and Forecasting
The following criteria are assumed for designing of the configuration of equipment:
• Data storage capacity for two year hydrological data, • Operation System of Windows 2000 and XP Professional • Installation of application software for hydrological data processing and
visualization and forecasting, • Dual mode operation of PC servers for the backup purpose, • Display and print distribution in Web style, • Ethernet LAN network, and • Easiness of future expansion.
A LAN is established in FFWC for data exchange among the computers. This total computer network consists of one set of PC for telemetry gauging station data collection, data analysis and processing as telemetry control, one PC for Web server a remote access server for data communication with related organizations, one PC for the data display and Plasma display panel and peripheral equipment. An UPS is provided to every server and PC against sudden interruption of the commercial power supply.
(b) Data Distribution
As explained in Section 2.2, visualized flood information is distributed to PDMC to share the information among FFWC and them. A personal computer as data monitoring equipment that is connected to a data processing server of FFWC via telephone line through dial-up router is installed at PDMC. The lines between FFWC and PMDC are usually off but can be on by dialing FFWC from the monitoring stations when necessary.
Figure 2.8 Schematic Diagram for Option B

Supporting Report II (Feasibility Study) Paper III Flood Warning and Forecasting System
The Study on Flood and Debris Flow in the Caspian Coastal Area focusing on
the Flood-hit Region in Golestan Province
III - 20 JICA CTI Engineering International Co., Ltd.
(3) Option-C (Internet Option)
Internet is added to Option-B to deal with many monitoring stations. A homepage of FFWC is open at a reliable provider. Reliability of Internet providers is still doubtful at present, but it can be optimistically anticipated that the remarkably developing Information Technology can overcome this problem very soon. The monitoring stations can access the FFWC homepage through the Internet when necessary. Figure 2.9 shows the hardware configuration of the proposed network.
Figure 2.9 Schematic Diagram for Option C
2.3.3 Three Options for Warnings Dissemination
(1) Option-A (Manual Operation)
This option is a manual operation warning post equipment including a voice amplifier with a loudspeaker for broadcasting warnings that is installed at three (3) locations as shown in Figure. 2.2. Receiving a flood warning from the PDMC through the existing telephone and radiotelephone network of police and DOE, relevant office are to broadcast the warning message to inhabitants and/or tourists. Figure 2.10 shows conceptual network for flood warning system option A.
Figure 2.10 Conceptual Network for Option A

The Study on Flood and Debris Flow in the Caspian Coastal Area focusing on the Flood-hit Region in Golestan Province
Supporting Report II (Feasibility Study)Paper III
Flood Warning and Forecasting System
JICA CTI Engineering International Co., Ltd. III- 21
(2) Option-B (Remote Operation from FWC))
In this option, warning control and supervisory equipment that enables remote control of warning posts is additionally installed at Flood Warning Center (FWC) offices. Warning dissemination between the PDMC and the FWC office will be made by the telephone or VHF radiotelephone. The warning broadcasting is made remotely from the FWC offices through new independent VHF radio networks. These radio networks require non-noise circuit of which the Signal to Noise Ratio is less than -40dB, and at least three relay stations are to be newly installed for the VHF networks. Figure 2.11 shows conceptual network for flood warning system option B.
Figure 2.11 Conceptual Network for Option B
(3) Option-C (Direct Remote Control Operation)
This option is an on-line direct dissemination system from the PDMC to the warning posts not via FWC offices to reduce transmission time and to avoid man-made errors. Warning supervisory and control equipment is installed at the province/prefecture office. Once the PDMC has decided to issue a flood warning, recorded or live voice-messages can be sent through new independent VHF radio networks directly up to the warning posts without any human interface. This system requires radio propagation of such a high quality as the Option-B. At least five new relay stations are necessary for this system. A schematic diagram of the VHF/FM radio network. Figure 2.12 shows conceptual network for flood warning system option C.
Figure 2.12 Conceptual Network for Option C

Supporting Report II (Feasibility Study) Paper III Flood Warning and Forecasting System
The Study on Flood and Debris Flow in the Caspian Coastal Area focusing on
the Flood-hit Region in Golestan Province
III - 22 JICA CTI Engineering International Co., Ltd.
2.4 Selection of Optimum System
2.4.1 Setting up Alternatives
Several alternatives of combinations of the three options conceived for each of the three subsystems are considered for the Priority Project. In this Study, to facilitate the selection of optimum one, four typical alternatives are set up and presented in summary as follows:
Table 2.12 Comparison of Four Alternatives
2.4.2 Selection of Optimum System
The conclusion for selection of an optimum plan from the economic aspect has not been obtained yet. However, judging from damage data during past floods, the direct damage, which can be estimated in the monetary term, is not quite large, so that any alternative may not be viable from the economic point of view.
The necessity of the system is clear, since the flood damage involves loss of human lives, which are hardly evaluated in monetary term. Therefore, it is not preferable to select the optimum plan not only from the economic aspect, but also from considering the other aspects.
In this study, it is considered that the Alternative-4 based on the semi-automatic system is applied to the Priority Project in the following reasons:
Improvement of data collection subsystem by economical way, maximum use of existing facilities
The system of alternative-1 based on manual operation is not preferable when the necessary time for system operation from observation to evacuation is limited. However, flood warning system will be manual operation comparing the big gap of cost between remote control system.
Flood warning post is first introduction for study area and numbers of warning post is only three (3). Therefore, manual operation system is most suitable from the economic and technical point of view.
Common understanding of the flood situation among concerning agencies is most important. Flood information shall be monitored at agencies concern. As for the alternative-4, there is much gap in the cost in comparison with alternative-2, while there will not be much difference in accuracy and necessary time for system operation. Especially, the necessary time for operation can be remarkably shorten, so that effectiveness of flood forecasting and warning system can be enhanced.
Data Collection Subsystem
Option
Data Processing Subsystem
Option
Flood Warning Subsystem
Option
Subsystem
Alternative
A B C A B C A B C
Cost (million Rials)
Warning Accuracy
Alternative-1 � � � 1,450 Low Alternative-2 � � � 5,000 Medium high Alternative-3 � � � 5,912 High Alternative-4 � � � 2,360 Medium

The Study on Flood and Debris Flow in the Caspian Coastal Area focusing on the Flood-hit Region in Golestan Province
Supporting Report II (Feasibility Study)Paper III
Flood Warning and Forecasting System
JICA CTI Engineering International Co., Ltd. III- 23
CHAPTER 3 EQUIPMENT PLAN
3.1 System Summary
After the study of the selection of optimum system, the following subsystem is proposed for the priority project. The outline of the FFWS in the Priority Project is as follows:
(1) Telemetry Real time rain and water level gauge station reinforcement
(2) Improvement of existing rain and water level gauging station
(3) Improvement of data collection control system including software reinforcement.
(4) Improvement of data processing and transmission equipment
(5) New installation of FFWS equipment at PMDC
(6) New installation of five (5) flood monitoring equipment
(7) New installation of three (3) Flood Warning Post
The locations of the telemetry gauging stations are shown in Figure 2.2 and a schematic diagram of the Total system is as shown in Figure 3.1. The hardware configuration of the system for the data process, analysis and data distribution is as shown in Figure 2.9.

Supporting Report II (Feasibility Study) Paper III Flood Warning and Forecasting System
The Study on Flood and Debris Flow in the Caspian Coastal Area focusing on
the Flood-hit Region in Golestan Province
III - 24 JICA CTI Engineering International Co., Ltd.
Figure 3.1 Overall Schematic Diagram for Priority Project

The Study on Flood and Debris Flow in the Caspian Coastal Area focusing on the Flood-hit Region in Golestan Province
Supporting Report II (Feasibility Study)Paper III
Flood Warning and Forecasting System
JICA CTI Engineering International Co., Ltd. III- 25
The functions of stations and the responsible agencies for the improving Flood Forecasting and Warning System Project are listed in Table 3.1.
Table 3.1 System Summary
Station Function Organization in charge
1. MOG data collection Station 1.1 Telemetry Real time data
collection equipment 1.1 Flood monitoring equipment 1.2 Data Display Equipment
• Real time data collection • Data processing • Transmit collected data to the FFWC
system. • Access the FFWC Web server to receive
flood information
Meteorological Office
2. MOG Met. data gauging station 2.1 Golestan Forest National Park 2.2 Nardin 2.3 Soodaghlan 2.4 Haghaikhajeh 2.5 Sefid Dally
Automatic rainfall data observation
Improvement and additional of the equipment
3. MOE data collection station 3.1 Telemetry Real time data
collection equipment Real time data collection
3.2 Data Display Equipment Display the flood information on the Plasma Display
MOE
4. MOE Hydro data gauging station 4.1 Tangrah Water level 4.2 Dasht Water level 4.3 Dasht Rainfall 4.4 Dasht Shad Rainfall 4.5 Gelman Darreh water level 4.6 Ghyz Galeh water level
Automatic real time gauging station including 2 new water level gauging stations
Improvement and additional of the equipment
5. PDMC FFWC Equipment 5.1 Flood Forecasting & Warning
Center equipment Receive telemetry data from MOE and MOG. Data processing.
5.2 Web Server Equipment Dissemination of flood information to related agencies by Internet.
5.3 Data Display Equipment Display the flood information on the Plasma Display
FFWC
6. Flood Monitoring Station 6.1 PC and peripherals Access to FFWC Web server to receive
flood information Related five agencies.
7. Flood Warning Post 7.1 WP-1: Ghazel Police Police 7.2 WP-2: Waterfall Park DOE 7.3 WP-3: Tangrah
Flood warning equipment by loudspeaker Police
3.2 Telemetry Data Collection Subsystem
The data collection subsystem consists of two (2) groups, MOG System and MOD system as described system summary. In total seven (7) rainfall gauging stations and four (4) water level gauging stations will be operational. Data collection PC at MO and MOE will collect data automatically from each rain and water level gauging station. The data collection PC at MO and MOE provides automatic observation of hydrological and meteorological data in the intervals of 10 min., 30 min. and one hour. The gauging equipment is not only capable of transmitting observed data in response to the observation command, but also has an

Supporting Report II (Feasibility Study) Paper III Flood Warning and Forecasting System
The Study on Flood and Debris Flow in the Caspian Coastal Area focusing on
the Flood-hit Region in Golestan Province
III - 26 JICA CTI Engineering International Co., Ltd.
event-actuated function to automatically send a start request signal to the data collection PC at the start of rainfall and when the water level reaches the levels of caution and warning. When MO and MOE receive the start request signal, the start command is sent to all the gauging stations, which start observations. The data collection PC calculates the hourly and 3-hour rainfall data and checks the correlations between the rainfall data and the water level data. If the data reaches a warning value, the PC issues a warning. The warning display will be installed in MO, MOE and PDMC in order to display the same information on the PC display.
3.2.1 Real time Data Collection PC
The main component and functions of the observation data collection system to be installed in MOG and MO are tabulated in Table 3.2.
Table 3.2 Functions of Data Collection PC Equipment Equipment Function Quantity
PC type Operation Console
PC type operation console provide for data collection. Gauging station calling time is every 10, 30 and 60 minutes. Process data display on graphics and table and transfer to the Web server automatically. Data processing and display of processed data
1
Telephone/GSM MODEM
To connect public telephone line or GSM mobile base station for online operation 1
Telemetry data collection software
To improve the existing data collection software, modification on the existing software 1
Printer Pinter will print data table, graphics of hydrological data by color. 1
DC Power Supply Unit
DC power supply unit provide the DC power to supervisory and control equipment and radio equipment. The unit can be operational about 10 minutes during power failure.
1
3.2. 2 Rainfall Gauging Station
The component equipment and functions of the rainfall gauging station are tabulated in Table 3.3. and 3.4.
Table 3.3 Functions of Rainfall Observation Equipment Equipment Function Quantity
Remote Terminal Unit (Data Logger)
Data logger stores water level data every 10 minutes and sends out collected data according to the observation command from the data collection station. In addition, it detects the signal when reaching danger level and it informs a data collection station.
1
Telephone/GSM MODEM
To connect public telephone line or GSM mobile base station for online operation 1
Tipping Bucket Rainfall Gauge
Tipping Bucket Rainfall Gauge measures and it sends out the rainfall of 1 mm of 1 tip to the observation equipment by the pulse signal.
1
Solar panel and distribution board Solar panel makes charging to the battery. 1
Battery Battery secures operation without 7 days of sunshine as the power of the above equipment. 1

The Study on Flood and Debris Flow in the Caspian Coastal Area focusing on the Flood-hit Region in Golestan Province
Supporting Report II (Feasibility Study)Paper III
Flood Warning and Forecasting System
JICA CTI Engineering International Co., Ltd. III- 27
Table 3.4 Function of Rainfall & Snow Gauging Equipment Equipment Function Quantity
Remote Terminal Unit (Data Logger)
Data logger stores water level data every 10 minutes and sends out collected data according to the observation command from the data collection station. In addition, it detects the signal when reaching danger level and it informs a data collection station.
1
Telephone/GSM MODEM
To connect public telephone line or GSM mobile base station for online operation 1
Tipping Bucket Rainfall and Snow Gauge
Tipping Bucket Rainfall Gauge measures and it sends out the rainfall of 1 mm of 1 tip to the observation equipment by the pulse signal. Electric heater melt snow and measure snow water.
1
DC power supply Input 220V Output DC48V 1
Battery Battery secures operation without 3 days of supply power as the power of the above equipment. 1
3.2.3 Water Level Gauging Station
The component equipment and functions of the water level gauging station are tabulated in Table 3.5.
Table 3.5 Function of Water Level Gauging Equipment Equipment Function Quantity
Remote Terminal Unit (Data Logger)
Data logger stores water level data every 10 minutes and sends out collected data according to the observation command from the data collection station. In addition, it detects the signal when reaching danger level and it informs a data collection station.
1
Telephone/GSM MODEM
To connect public telephone line or GSM mobile base station for online operation 1
Float type water level gauge
Float type water level gauge measures and sends out the water level of the 1 cm unit to the observation equipment as the BCD signal.
1
Solar panel and distribution board Solar panel makes charging to the battery. 1
Battery Battery secures operation without 7 days of sunshine as the power of the above equipment. 1
3.3 Data Processing & Monitoring Subsystem
The data processing/transmission subsystem consists of the data processing equipment to be installed at FFWC, the flood information monitoring equipment to be installed at PDMC and five related agencies to be connected to the above equipment through digital telephone network.
3.3.1 Data Processing Equipment
The functions of the data processing equipment to be installed with the telemetry supervisory and control equipment at FFWC are tabulated in Table 3.6 and the hardware configuration of the data processing equipment in Figure 2.9. The equipment is used to create the database based on the hydrological observation data and to process the data.

Supporting Report II (Feasibility Study) Paper III Flood Warning and Forecasting System
The Study on Flood and Debris Flow in the Caspian Coastal Area focusing on
the Flood-hit Region in Golestan Province
III - 28 JICA CTI Engineering International Co., Ltd.
Table 3.6 Functions of Data Processing Equipment Equipment Function Quantity
Flood Monitoring PC Receiving the telemetry data from MOG and MOE. Data process and analysis for flood forecasting 1
Web Server Store and distribution of the Processed data from data collection PC to monitoring station as Web information 1
Network Devices LAN network composed by Hub 1
Data Display PC PC for flood information display and drive the Plasma display unit 1
Plasma Display Unit Large screen Plasma display unit display the flood information by the out put of data processing PC 1
Laser Printer Color laser printer for print out of processed flood information 1
Dial-up Router For the connection of Digital telephone network to the monitoring station 1
UPS Short period stand by power supply unit for server, web server and data display PC during power interruption. 2
3.3.2 Flood Information Monitoring Equipment
The flood information monitoring equipment will be installed at PDMC, MOG and five related agencies. The flood information is stored in the WEB server at MOE, and each monitoring station can access to the information, if it is necessary. Each monitoring station is connected individually to the WEB server through the public digital network. Once it is connected, the monitoring station can monitor the real-time flood information that is updated in 10-minute intervals. The equipment composition for the
Table 3.7 Function of Flood Monitoring Equipment Equipment Function Quantity
Dial up router To access the Web server at MOE to obtain details flood information in graphs and table 1
Switching HUB Connection of PC and router 1
Client PC Display the contents of Web server 1
Jet ink Printer Print necessary data 1
UPS Uninterrupted power supply for client PC and server will provide for power interruption. 1
3.4 Flood Warning Subsystem
3.4.1 Warning method
The warning post will install a voice amplifier and loudspeaker to be generated artificial siren sound.
3.4.2 Equipment configuration
Warning post will equip the voice amplifier, loudspeakers and tape recorder. Recorded tape contain of artificial siren sound and announcement for flood warning and evacuation instruction play back by the tape recorder. In addition, necessary information for flood will broadcast through microphone.

The Study on Flood and Debris Flow in the Caspian Coastal Area focusing on the Flood-hit Region in Golestan Province
Supporting Report II (Feasibility Study)Paper III
Flood Warning and Forecasting System
JICA CTI Engineering International Co., Ltd. III- 29
Commercial power line will get damage and power failure will occurs during flood. Therefore, voice amplifier back up with DC power supply unit is used. It can be operated around two (2) days without power supply. Sound reach distance of the loudspeaker is more less 300m radius. Two (2) loudspeakers will install between 600m distance in the village if necessary.
3.4.3 Warning Operation
When receiving flood information from PDMC, send out the flood or evacuation warning in accordance with its flood operation rule through the public telephone line. Based on this warning order, each warning post start operation in any of the following patterns that are so simple for people to easily understand the meanings of the sounds:
For flood warning: five repetitions of a sounding for 10 sec. and a pause for 5 sec.
For evacuation warning: five repetitions of a sounding for 50 sec. and a pause for 10 sec.
For warning release: The siren does not sound, but it will broadcast when a flood danger has gone.
3.4.4 Flood Warning Post
The main equipment and functions of the warning station is described in Table RJ.22 and the hardware configuration of the station is shown in Figure RJ.19.
Table 3.8 Functions of Flood Warning Equipment Equipment Function Quantity
Voice Amplifier Voice amplifier broadcast tape message and voice message for flood warning. The equipment operates by manual operation by the operator.
1
Tape Recorder Three (3) kinds of siren pattern and message will record and broadcast for each occasion. 1
Loudspeaker Loudspeaker will make blowing artificial siren sound broadcast warning announcement. 1
DC Power Supply Unit with battery
The unit converts AC power to DC power to supply all equipment. It can give the power to equipment around 3 days commercial power failure.
1

Supporting Report II (Feasibility Study) Paper III Flood Warning and Forecasting System
The Study on Flood and Debris Flow in the Caspian Coastal Area focusing on
the Flood-hit Region in Golestan Province
III - 30 JICA CTI Engineering International Co., Ltd.
CHAPTER 4 COST ESTIMATE
The direct cost estimate for the improvement of the flood forecasting and warning system for Golestan Forest National Park Disaster Management Plan (Priority project) equipment is made as following. Basically, equipment will procure from Iranian market as much as possible. Foreign country made equipment will be purchase from authorized dealer in Iran. Land acquisition for gauging station housing is not required. All gauging station will install at existing or within government properties. However, two new water level gauging well and steel cabinet will construct. All taxes are not included. Such cost will quote separately. Table 4.1 presents cost estimate for Golestan Forest National Park Disaster Management Plan (Priority project).
Table 4.1 Cost Estimate for Priority Project
Work Item Quantity Unit Unit Price
(Rials) Amount (1,000
Rials)
I Construction Base Cost
1. Preparatory Work 1 L.S 219,088
2. Equipment
a. Additional Rain Gauge Station Equipment 4 set 63,595,000 254,380
b. Additional Water Level Gauging Station Equipment 2 set 83,720,000 167,440
c. Improvement work for Existing Rain Gauging station Equipment 3 set 78,890,000 236,670
d. Improvement work for Existing Water Level Gauging station Equipment 2 set 83,720,000 167,440
e. Improvement of Data Collection Equipment at MOE 1 set 82,110
f. Improvement of Data Collection Equipment at MOG 1 set 203,665
g. FFWC Equipment for PDMC 1 set 231,840
h. Flood Monitoring Equipment for five Agencies 5 set 22,057,000 110,285
i. Flood Warning Posts 3 set 96,600,000 289,800
j. Miscellaneous (Installation materials, Spars) 1 L.S 545,720
Total for Equipment 2,361,000
3. Equipment Installation Work 1 L.S 363,148
4. Water Level gauging Well and Cabinet 2 ST 80,100,000 160,200
GRAND TOTAL 3,035,789

The Study on Flood and Debris Flow in the Caspian Coastal Area focusing on the Flood-hit Region in Golestan Province
Supporting Report II (Feasibility Study)Paper III
Flood Warning and Forecasting System
JICA CTI Engineering International Co., Ltd. III- 31
CHAPTER 5 IMPLEMENTATION PLAN
Total period for the implementation of priority project will be executed 26 months tentatively. Engineering work including detailed design and preparation of tender documents will go ahead. It will take about 8 months. Tender process, contract, purchase, and manufacturing of equipment will be taken about 9 months. Construction and installation work for water level gauge and all equipment will be taken around 8 months. Finally, On-the-JOB Training for system operation will take one month.
Table 5.1 Implementation Plan for Priority Project Work Item 1st Year 2nd Year 3rd Year
Total period 1. Detailed Design and
preparation of Tender Documents
2. Tender and equipment purchase
3. Ancillary work and Equipment installation
4. On the Job Training
5. Commencement of Operation
8 months
9 months
8 months
1 month
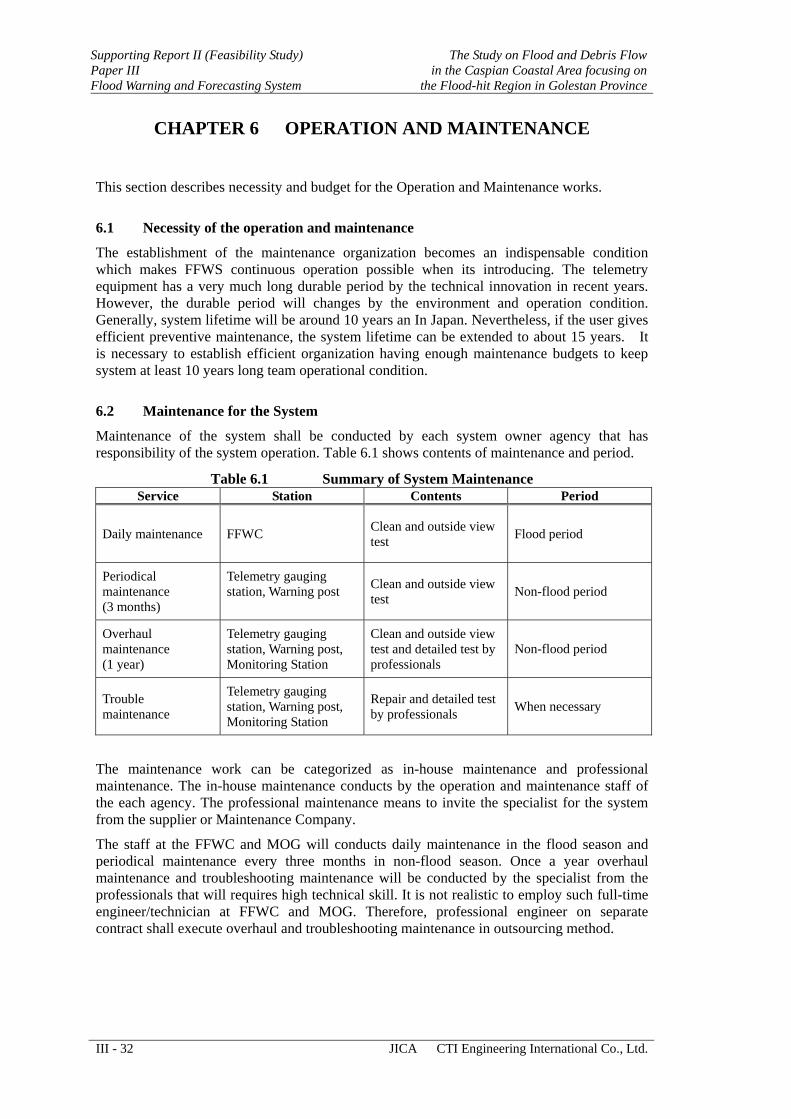
Supporting Report II (Feasibility Study) Paper III Flood Warning and Forecasting System
The Study on Flood and Debris Flow in the Caspian Coastal Area focusing on
the Flood-hit Region in Golestan Province
III - 32 JICA CTI Engineering International Co., Ltd.
CHAPTER 6 OPERATION AND MAINTENANCE
This section describes necessity and budget for the Operation and Maintenance works.
6.1 Necessity of the operation and maintenance
The establishment of the maintenance organization becomes an indispensable condition which makes FFWS continuous operation possible when its introducing. The telemetry equipment has a very much long durable period by the technical innovation in recent years. However, the durable period will changes by the environment and operation condition. Generally, system lifetime will be around 10 years an In Japan. Nevertheless, if the user gives efficient preventive maintenance, the system lifetime can be extended to about 15 years. It is necessary to establish efficient organization having enough maintenance budgets to keep system at least 10 years long team operational condition.
6.2 Maintenance for the System
Maintenance of the system shall be conducted by each system owner agency that has responsibility of the system operation. Table 6.1 shows contents of maintenance and period.
Table 6.1 Summary of System Maintenance Service Station Contents Period
Daily maintenance FFWC Clean and outside view test Flood period
Periodical maintenance (3 months)
Telemetry gauging station, Warning post
Clean and outside view test Non-flood period
Overhaul maintenance (1 year)
Telemetry gauging station, Warning post, Monitoring Station
Clean and outside view test and detailed test by professionals
Non-flood period
Trouble maintenance
Telemetry gauging station, Warning post, Monitoring Station
Repair and detailed test by professionals When necessary
The maintenance work can be categorized as in-house maintenance and professional maintenance. The in-house maintenance conducts by the operation and maintenance staff of the each agency. The professional maintenance means to invite the specialist for the system from the supplier or Maintenance Company.
The staff at the FFWC and MOG will conducts daily maintenance in the flood season and periodical maintenance every three months in non-flood season. Once a year overhaul maintenance and troubleshooting maintenance will be conducted by the specialist from the professionals that will requires high technical skill. It is not realistic to employ such full-time engineer/technician at FFWC and MOG. Therefore, professional engineer on separate contract shall execute overhaul and troubleshooting maintenance in outsourcing method.

The Study on Flood and Debris Flow in the Caspian Coastal Area focusing on the Flood-hit Region in Golestan Province
Supporting Report II (Feasibility Study)Paper III
Flood Warning and Forecasting System
JICA CTI Engineering International Co., Ltd. III- 33
6.3 Operation and Maintenance Man Power
Flood forecasting and warning operation shall utilize three (3) months from July to September in a year. At least two engineers require staying at FFWC for 24-hours stand-by, especially monitoring for flood by a localized torrential downpour during flood season.
Proposed manpower for operation and maintenance at FFWC, MOE, MOG and related agencies are shown in Table 6.2.
Table 6.2 Required Staff
Organization Office in
charge and assistant
Hydrological engineer
Electronics engineer Subject Equipment
MOE 2 persons 1 persons 1 person Telemetry data collection, Data process and transmission
MOG 2 persons - 1 person Telemetry data collection
PDMC 2 person 2 persons 1 person Flood monitoring Flood warning
MOJA, MORT,DOE, Traffic Police
and Red Crescent
1 person each - - Flood monitoring
6.4 Cost for Operation and Maintenance
Maintenance cost will not be constant figure in view of long-term operation. It depends on the period of the equipment lifetime. In addition, initial maintenance cost within one year after the installation mainly free of charge by means of free guarantee contract by the supplier. This warrantee contract is very important. The initial defectives of the system will occur by miss design, miss installation and miss operation within one year after the installation together. The supplier has responsible to solve such troubles within warrantee period free of charge. Therefore, first year maintenance cost after system establishment becomes the personnel expenses and the electric bill. On the other hand, the mechanical parts such as the hard disk drive, the CD drive, the display in the computer equipment and materials exchange becomes necessary from three (3) to five (5) years. The rough maintenance cost is estimated to be 2.9 % for ten (10) years average; first's three (3) years are estimated to be 0.56 % and from four (4) to ten (10) years are estimated to be 3.9 % of the equipment cost. Therefore, maintenance cost will be prepared into two categories, “Initial maintenance cost” and “Maintenance cost after 3 years operation”. On the other hand, operation cost will consists of electric fee, telephone subscription fee and consumable spare such as ink cartridge, toner and copy paper. Table 6.3, O/M cost is including the following item;
Spare Parts and unit
Operation cost such as electric fee, telephone subscription fee and Consumable spare such as ink cartridge, toner and copy paper.
The outsourcing charge for equipment supplier
Salary and allowance is not included. This cost will quote in the administrative cost separately.

Supporting Report II (Feasibility Study) Paper III Flood Warning and Forecasting System
The Study on Flood and Debris Flow in the Caspian Coastal Area focusing on
the Flood-hit Region in Golestan Province
III - 34 JICA CTI Engineering International Co., Ltd.
Table 6.3 Operation and Maintenance Cost Estimate
Organization Necessary Staff for one year operation
Initial O/M cost for 1st to 3rd year
(x 1,000 Rials)
O/M cost for 4th to 10th year
(x 1,000 Rials) MOE 15 men/months 23,800 51,600
MOG 9 men/months 20,000 50,200
PDMC 6 men/month 15,700 31,900
MOJA 3 men/month 5,100 6,000
MORT 3 men/month 5,100 6,000
DOE 3 men/month 5,100 6,000
Traffic Police 3 men/month 5,100 6,000
Red Crescent 3 men/month 5,100 6,000
TOTAL 42 men/months 85,000 163,700

SUPPORTING REPORT II (FEASIBILITY STUDY)
PAPER IV
Disaster Management


The Study on Flood and Debris Flow in the Caspian Coastal Area focusing on the Flood-hit Region in Golestan Province
Supporting Report II (Feasibility Study)Paper IV
Disaster Management
JICA CTI Engineering International Co., Ltd. IV - i
THE STUDY ON FLOOD AND DEBRIS FLOW IN THE CASPIAN COASTAL AREA
FOCUSING ON THE FLOOD-HIT REGION IN GOLESTAN PROVINCE
SUPPORTING REPORT II (FEASIBILITY STUDY)
PAPER IV DISASTER MANAGEMENT
TABLE OF CONTENTS
Page
CHAPTER 1 VULNERABILITY AND CAPACITY OF VILLAGES IN THE STUDY AREA............................................................ IV-1
1.1 Social structure............................................................................ IV-1
1.2 Local Organization and Cohesion............................................... IV-2
1.3 Disaster Experience..................................................................... IV-2
1.4 Disaster Knowledge .................................................................... IV-5
1.5 Participation ................................................................................ IV-5
1.6 Notable Characteristics ............................................................... IV-6
CHAPTER 2 PILOT ACTIVITIES................................................................ IV-8
2.1 Purpose and Targets .................................................................... IV-8
2.2 Formation.................................................................................... IV-8
2.3 Risk Management Framework .................................................... IV-8
2.4 Process of Disaster Risk Management Activities ....................... IV-9
2.5 Schedule...................................................................................... IV-10
2.6 Village Plan................................................................................. IV-10
2.7 Outcome of the Pilot Activities................................................... IV-15
CHAPTER 3 DISASTER RISK MANAGEMENT IN VILLAGES............ IV-16
3.1 Principles of Village Resilience .................................................. IV-16
3.2 Master Plan for Village-based Disaster Risk Management ........ IV-17
3.3 Action Planning........................................................................... IV-24

Supporting Report II (Feasibility Study) Paper IV Disaster Management
The Study on Flood and Debris Flowin the Caspian Coastal Area focusing on
the Flood-hit Region in Golestan Province
IV - ii CTI Engineering International Co., Ltd. JICA
LIST OF TABLES
Table 1.1 General Household Characteristics ....................................................... IV-1
Table 1.2(1/2) Emergency Response and Recovery Work ........................................... IV-3
Table 1.2(2/2) Emergency Response and Recovery Work ........................................... IV-4
Table 1.3 Questionnaire Survey Results ............................................................... IV-6
Table 1.4 General Vulnerability and Capacity in Villages ................................... IV-7
Table 2.1 Stage-wise Activity ............................................................................... IV-9
Table 2.2 Schedule of Village Activities .............................................................. IV-10
Table 2.3 Current Problems and Future Actions................................................... IV-11
Table 2.4 Responsibility of Village Disaster Risk Management Committee........ IV-12
Table 2.5 Stage-wise actions by villagers ............................................................. IV-12
Table 2.6 Schedule of Drill (Dasht) ...................................................................... IV-14
Table 3.1(1/3) Recommended Task Target Matrix....................................................... IV-21
Table 3.1(2/3) Recommended Task Target Matrix....................................................... IV-22
Table 3.1(3/3) Recommended Task Target Matrix....................................................... IV-23
Table 3.2 Action Plan Matrix................................................................................ IV-24
LIST OF FIGURES
Figure 2.1 Formation of Implementing Pilot Activities ......................................... IV-8
Figure 2.2 Disaster Risk Management Framework (AS/NZS 4360:1999)............. IV-8
Figure 2.3 Process of Pilot Activities ..................................................................... IV-9
Figure 3.1 Collaboration among Public, Community, and Private ........................ IV-16
Figure 3.2 Model Flow of Village Risk Management Activities ........................... IV-25
Figure 3.3 Steps of Village Risk Management Activity......................................... IV-26

The Study on Flood and Debris Flow in the Caspian Coastal Area focusing on the Flood-hit Region in Golestan Province
Supporting Report II (Feasibility Study)Paper IV
Disaster Management
JICA CTI Engineering International Co., Ltd. IV - 1
CHAPTER 1 VULNERABILITY AND CAPACITY OF VILLAGES IN THE STUDY AREA
1.1 Social structure (1) Village Structure
Total population of the surveyed 30 villages along the Madarsoo river basin amounts to 6,894 families, equivalent to 32,449 persons. The average household members are 4.7 persons. The population level differs considerably, minimum from 193 to maximum 3200. The average village population is 1,082, which is the manageable size as unit.
Population ratio by age groups is; 0-14years is 34%, 15-64 years is 60.5%, and over 65 years is 5.5%. Children under 15 years old, considered as a vulnerable group, which forms one third of the population.
(2) Household Characteristics
The following table illustrates the general characteristics of the households in the villages.
Table 1.1 General Household Characteristics Category Characteristics
Family type Nuclear # of Children 4 plus (50%)
Housing unit 235 sq m (average) Single-floor (90%)
Land ownership Self-own (96%)
Income 500,000-1,500,000 Rls
Ethnic group Turkmen (47%) Fars (23.5%) Kurd (13.0%)
Occupation Farming Animal husbandry
Majority of families are nuclear family, and nearly half of the family has more than 4 children, among them 28% of the family has more than 6 children. The size of housing unit is mostly above 100 square meters, and the average is 235 square meters. Most (more than 90%) housing units are single floor. Majority of people (96%) own the land. Monthly income is between 500,000 to 1,500,000 rials. Turkmen families account for nearly half, followed by Fars (one-forth) and Kurds (one-eighth).
(2) Occupation
Majority (one-third) of the villagers are farmers. Animal husbandry of sheep and cow accounts for 8%. Public officials including teachers are 6%. Nearly 5% is unemployed. Others are workers and clerks.
(3) Lifestyle
Comparative numbers of villagers in the study area were once nomad and started to settle down after the land reform in 1962 and the Islamic Revolution in 1979. Most

Supporting Report II (Feasibility Study) Paper IV Disaster Management
The Study on Flood and Debris Flow in the Caspian Coastal Area focusing on
the Flood-hit Region in Golestan Province
IV - 2 CTI Engineering International Co., Ltd. JICA
people work within the village but have urban behavioral pattern, it is probably because the area is not far from city. The mode of life varies throughout the year. Spring, summer, and autumn are basically the season for cultivation and harvesting, while winter is the time of vacation. More labor is concentrated in the dry and warm summer season, which flood is most susceptible.
1.2 Local Organization and Cohesion (1) Organization
Village based organizations that can be commonly found are agricultural cooperation, Basij, Imam Khomeini’s foundation and Red Crescent Society. They have not only locally based, but also nation-wide networks. These organizations have played a role of rescue and relief operations.
(2) Meeting place
Common meeting place for villagers are mosques. They also serve as cultural center. For small private gathering, houses of council members, white-beard, local people are occasionally used. But most times, village councilors hold meetings at mosques. For holding workshops for villagers, mosques provide screens, audio system, and comfortable atmospheres.
(3) Mutual Cooperation
Bond of family, bond of neighborhoods is tight. Villagers frequently visit each other’s houses. In some village like Dasht, most villagers marry within village, thus village itself is bonded with family ties and function as extended family. In other villages, people know each other that live where and where the elderly and handicapped lives. People help each other and share information on regular basis. At the time of flood, evacuated people took shelter at houses on the high elevation in the villages, and helped each other. Before flood, information of possible flood was informed to those who may not access to such information by local initiatives by using mostly motorbikes.
(4) Village Actors
Village actors related to decision-making are primary village councilors. Within the council, dehiyar who is elected by the council is responsible for financial administrations. Whereas, white-beard elderly, Imam of the mosque, teachers, and young educated are also influential figures in villages. It is notable that councilors and dehiyars are young, mostly 30-40s, and some are in 20s.
(5) Decision –making System
Village council is the final authority to decide village matters, however, the white-beard of elderly and respected, Imam, teachers are also respective figures for consulting various matters. Nowadays, white-beard sometimes gets opinions from young educated people in the village. Village councilors are elected by villagers. Annual council meeting are held for council members. Also most village councilors hold informal meetings at mosque to consults with village members.
1.3 Disaster Experience (1) Flood situation
In severely damaged villages, most people evacuated to elevated site being wet. Electricity went off due to heavy rain, sooner, their houses are inundated more than 1meter or even washed away. Some farmland was damaged of itself or of its irrigation pipelines. Nearby civil structures and public facilities, such as bridge, school, police station are damaged. Some people are injured by falling rubles due to

The Study on Flood and Debris Flow in the Caspian Coastal Area focusing on the Flood-hit Region in Golestan Province
Supporting Report II (Feasibility Study)Paper IV
Disaster Management
JICA CTI Engineering International Co., Ltd. IV - 3
debris flow. Electric devises like TVs, refrigerators and furniture are damaged. Some villages incurred casualties. Most victims were women and children.
(2) Past Disaster Response
Many people got information from the regular TV news program. Some conveyed this information to villagers by motorbikes. Some village councilors could inform villagers about the possible flood before critical situation. Due to power failure, mosque speakers could not work to inform. Nobody instructed the evacuation beforehand, thus most people evacuated by their own decision, facing dangers of inundation of their houses, to the elevated site. Most village councilors informed the related public authorities but they could not reach villages because of the inaccessibility of roads and bridges. Official relief by helicopter was failed because of the heavy rain; the relief could reach the next morning.
Following table describes natural phenomena, emergency actions taken by public and villagers of flood occurred on August 11th in 2001 in time sequence.
Table 1.2(1/2) Emergency Response and Recovery Work Natural Phenomena Villager’s actions
Time Lower middle basin
Lower basin
Public actions Lower middle basin
(Dasht)
Lower basin (Loveh, Beshoilli, Terjenli, Tangrah)
8 pm Nothing outside
Watching succor match on TV
9 pm 9:30 pm
Houses started to be flooded Electricity went off
Village councilors informed the situation by phone to Min. of Information, Provincial office and this office informed Min. of Interior, disaster management office Red Crescent Society, District (Mantage) No body directed to evacuate Villagers by themselves started to evacuate to higher places
10 pm Some houses are flooded up to 0.7-1m
People helped each other to find safe places (higher place) Evacuated in houses on high hill and natural hill
Most villagers are sleeping
11 pm Maximum height went up to 1-2 m
Electricity went off Houses started to be flooded
Stayed in evacuated place
0 am Bridge and road to Dasht were collapsed
Some village heads announced the emergency by firing guns Mosque speaker did not work due to power failure Youth are dispatched to announce the emergency to each house Some village could not do anything
Source: Village meetings and workshops conducted by JICA Study Team

Supporting Report II (Feasibility Study) Paper IV Disaster Management
The Study on Flood and Debris Flow in the Caspian Coastal Area focusing on
the Flood-hit Region in Golestan Province
IV - 4 CTI Engineering International Co., Ltd. JICA
Table 1.2(2/2) Emergency Response and Recovery Work Natural Phenomena Villager’s actions
Time Lower middle basin
Lower basin
Public actions Lower middle basin
(Dasht)
Lower basin (Loveh, Beshoilli, Terjenli, Tangrah)
1-2 am Water level started to decrease
Due to bad weather, helicopter could not reach
People could not sleep
Next morning 7 am 10 am
Due to road damages to Dasht, Khorason Provincial government, emergency management official arrived in Dasht by helicopter with relief goods
People started to go back home Most found that fridge, TV were damaged and could not repair About ten families found no house If the overflowing current ran the north part, the entire village must have been washed away.
2 days after Emergency Operation started Red Crescent could reach Dasht with doctors, medicine, foods, clothes, blanket and tents Army searched missing and dead All public officials such as MOJA, MoRT, MoI, MoEnergy first tried to find missing people and returned to their responsibility
Neighboring villagers came and helped
Later days MoEnvironment Khorason province constructed dike MoJA collected 2000 dead animals, compensated for farm land MoRT repaired roads MoI gave loans MoEnergy repaired water and power supply
10 % of the villagers stayed in the tent site, compound of semi-gov. oil seeds storage company, continued for 10 months Compensation of 1-1.5 million rial/house was given to repair houses Other small compensation was given, too
Public facilities such as clinic, school, mosque was upgraded or newly constructed after the disaster Survey is on going
Source: Village meetings and workshops conducted by JICA Study Team

The Study on Flood and Debris Flow in the Caspian Coastal Area focusing on the Flood-hit Region in Golestan Province
Supporting Report II (Feasibility Study)Paper IV
Disaster Management
JICA CTI Engineering International Co., Ltd. IV - 5
(3) Information Distribution System
The common way of distributing information is through the mosque speaker. No bulletin board was used. Mouth to mouth informal communication is commonly used and useful. School children are good information media to transmit information to other family members. In case of past floods, firing guns that informs extraordinary situation was used by council members.
1.4 Disaster Knowledge (1) Risk Perception of Flood and Debris flow
Majority of people in the flood experienced villages think the hazard of flood and debris flow is dangerous and that it is hard to cope with such disasters. Thus, the awareness of such disaster is very high. The risk perception of flood is higher than debris flow.
(2) Disaster Knowledge
Nearly half of the respondents have little knowledge about disasters; meaning of flood and debris flow, mechanism and countermeasures of them. Nearly 80% of villagers think that disaster education is necessary. According to the survey, there is no school education on this, and information source of disaster is mainly mass media, books and magazines.
(3) Identifying Evacuation Sites
First of all, majority of people (90%) know where they should evacuate, however, several percents of the respondents do not know the evacuation place. Some people went to see the water level of the river to inform the villagers. Accurate flood monitoring system that can inform early warnings is very much expected by the villagers. Person and criteria for giving direction of evacuation was not clarified, but in the pilot villages, it was defined at the village participatory workshops. Identifying the evacuation sites need to be analyzed by hydrological experts at first, and later discussed among villagers to consider social environmental local conditions to finalize the evacuation sites.
1.5 Participation (1) Interest to Disaster Risk Management
Nearly 80% of the respondents want to attend the disaster risk management activities. Type of activities they want to participate was positive; to become a member of the rescue team counted most, and to receive rescue training, evacuation training, to become a member of disaster management committee follows.
In most villages, there are unwritten social and moral rules and obligation to participation. Those who refuse to participate are sometimes isolated from others.
(2) Self-help Attitude
Villagers have notion that public facilities are provided by the public sectors. Actually the system has been as such. However, villagers have experienced labor contribution such as constructing mosques, roads. Survey shows that the villagers have motivation of flood risk management. The past disaster made them motivated to react by their own of what they can do. Through workshops of disaster risk management in villages, the role of villagers, public sectors, local organizations can be delineated and self-help attitude can be enhanced.

Supporting Report II (Feasibility Study) Paper IV Disaster Management
The Study on Flood and Debris Flow in the Caspian Coastal Area focusing on
the Flood-hit Region in Golestan Province
IV - 6 CTI Engineering International Co., Ltd. JICA
(3) Consideration to Women
Workshops for villagers need to be conducted separately for women to encourage their active participation, since they are reserved in the mixed meeings. Illiteracy rate of women are higher than that of men. Village organizations like Basij have separate body for women. In some villages, there are mosques only for women, but women can gather in men’s mosques. Red Crescent society can hold joint workshops. Based on the village survey, 5 % answered that the decision are left for the head of the family. However, women usually have complete decision-making power regarding their personal life.
1.6 Notable Characteristics Notable results of the social Awareness Survey is listed below. Top three answers are listed.
Table 1.3 Questionnaire Survey Results Question Main Answers
Very dangerous Dangerous Occasionally dangerous Level of Hazards 83% 11% 4% A little bit hard Hard Easy Level of Coping with Floods 51% 39% 7% By neighbors By self TV and Radio Information Source of Flood
Occurrence 37% 20% 17% Mosque speaker Mouth to mouth Neighborhood leaders Information source of ordinary
time 36% 13% 11% Mosque speaker No source Rescue team Information source at Disaster
time 65% 34% 1%
Elevated place Neighbor’s, relative’s house
Open space Evacuation Place in the past
57% 8% 3% No Request Request of financial help Request of Disaster
prevention Requesting Assistance to Shora 85% 9% 3%
Willing to participate by myself
Willing to, but head of the family will participate
Depend on activities Willingness to participate risk management activities
66% 16% 7% Literate Illiterate No answer Literacy rate 87% 12% 1%
Not reliable takes time for doing things
No dependence Villagers need to act for prevention and Preparedness
Trust/Dependence to public authorities
36% 26% 23% Village council Red Crescent Society MOJA Organizations for asking help 57% 28%. 25%.
Red Crescent Society Charity Organizations Imam Khomeini Foundation Organizations that helped
83% 54%. 37% A little knowledge
Almost correct 70-80% perfect Knowledge about flood and
debris flow 48% 36%. 9% Necessary It is good It is a matter of public
authority Necessity of disaster education 77% 15% 7% Planting trees Public education Early warning Necessary preparation for
disaster (non-structural) 21% 17% 16% Become a member of rescue volunteer Receive rescue training Evacuation training Interested Disaster Management
Activities 27% 14% 12%

The Study on Flood and Debris Flow in the Caspian Coastal Area focusing on the Flood-hit Region in Golestan Province
Supporting Report II (Feasibility Study)Paper IV
Disaster Management
JICA CTI Engineering International Co., Ltd. IV - 7
Vulnerability and capacity of the general surveyed villages are summarized in the following table.
Table 1.4 General Vulnerability and Capacity in Villages Category Items Vulnerability Capacity
Land Low productivity in dry land Land is personal ownership Climate Climate is favorable Environment Health Resource
Only health center exist. Shelter is lacking, evacuation route needs to be constructed Flood season is the busiest.
National park is near Villagers’ are all healthy Vehicles, motorcycles are of personal ownership and can be hired.
Physical Material
Labor Skills & Technology Infrastructure Housing Finance Knowledge
Some houses need repairing No capacity of savings Disaster knowledge is poor
Agriculture, construction skills Lifelines are all available Houses are big enough
Organization of society
In village, local organization are limited to agricultural cooperatives, Basij, Imam Khomeini Foundation, Red Crescent Volunteer groups Only quarter of the families belong to local organizations.
Local organizations are ready to assist in disaster time.
Common values positive aspiration and goals Information channel
In regular time, speaker of the mosque is the source of information, but during heavy rain the volume may not be enough to be heard, during power failure it does not work.
Due to the past disaster experience, most people have same notion of disaster preparedness for safer village
Social network Partnership Population Growth
Partnership with public sector is lacking Annual population growth rate in the survey area is about 1.8% and young generation under 16 years old, which are vulnerable group accounts for one third.
People have good cooperative networks
Social Organizatio-nal
Internal conflicts Leadership Management style Political structure (formal / informal)
There are usually no conflicts Village councilors are relatively young, mostly in 30-40s and motivated. Councilors have development visions and plans, and call for a meeting for discussion at mosques. Villagers often write letters or come to talk to village councilors. There is no active political parties in villages, which causes conflicts or hindrance for cooperation
Self –confidence Ideology
Most villagers think that to cope with flood and debris flow is very difficult
Disaster preparedness is one of the priority in village development
Experience of cooperation
Public participation before the flood was limited to mosque construction and distribution of donated supplies. Participation to planning or construction in the villages limits to half of the respondents.
Motivational Attitudinal
Fatalism Dependence
Villagers do not attribute disasters just as god’s will, and have positive attitude of disaster management by themselves

Supporting Report II (Feasibility Study) Paper IV Disaster Management
The Study on Flood and Debris Flow in the Caspian Coastal Area focusing on
the Flood-hit Region in Golestan Province
IV - 8 CTI Engineering International Co., Ltd. JICA
CHAPTER 2 PILOT ACTIVITIES
2.1 Purpose and Targets Pilot activities are conducted to test the plan of village disaster risk management activities on site and get feedback and revise the original plan. This plan aimed to be served as a template for other vulnerable villages to conduct similar activities.
The village workshops were conducted under the following targets
Knowledge development and awareness raising of possible flood damages
Knowledge that leads to Action (Just Knowledge does not save your life!)
Nourish mutual help, self help attitude and actual individual preparation
Develop village based disaster management plans
Implementation of the village plans
Training
2.2 Formation Dasht and Terjenly villages were selected as pilot activity sites. Pilot villages serve as demonstration sites of activities which are observed by other vulnerable village councils. Advisory committee was held among related public organizations and Red Crescent Society to share the experiences in the pilot villages, lessons learned, to review master plan and action plans of village disaster risk management. The JICA study team has assisted to such activities.
Advisory CommitteeExhibition Site
Sharing experienceLessons learned
Getting advise
JICA Study Teamexperts
Pilot Villages
Demonstration Sites
support
•PDMC, Housing Foundation, DoE•Military Police•RCS, NGOs, C ivil Society rep.
•Dasht•Terjenly
ObserversCouncilors of 24 Vulnerable Villages
Figure 2.1 Formation of Implementing Pilot Activities
2.3 Risk Management Framework The following figure shows the risk management framework. Village activities are planned according to the framework. Activities are categorized in the table below.
Figure 2.2 Disaster Risk Management Framework (AS/NZS 4360:1999)

The Study on Flood and Debris Flow in the Caspian Coastal Area focusing on the Flood-hit Region in Golestan Province
Supporting Report II (Feasibility Study)Paper IV
Disaster Management
JICA CTI Engineering International Co., Ltd. IV - 9
Table 2.1 Stage-wise Activity Stage Activities
Establish the Context Discussion with public officials, Strategic meeting with village council
Identify, Analyze, Evaluate Risk Social Survey, Risk and Resource Mapping
Treat Risk Village based Disaster Risk Management Planning
Communicate & Consult Advisory Committee, Forum, Educational Materials
Monitoring & Review Drill, Map Maneuver
2.4 Process of Disaster Risk Management Activities The village activities started from understanding villages by reconnaissance survey, followed by vulnerability and capacity assessment. Based on the assessment, pilot villages which had high vulnerable and willingness were selected.
Vulnerability & Capacity
Assessment
Understand Villages
Vulnerability and Capacity Assessment
Participatory Risk Management Planning
Drill & Critics
Formation of Village Disaster Risk Management
Committee
Monitoring &
Evaluation
Village Managed implementation
Selecting Pilot Villages
Village Watching & Mapping
Disaster Education
Figure 2.3 Process of Pilot Activities
In the pilot villages, several workshops were held where disaster education, Village Watching which is a walking tour of the village, and mapping exercise of risk and resources were conducted before planning. The contents of the education were as follows.
Mechanism of Flood Debris Flow
Situation of Past Disasters
Weather Information
Warning System
Evacuation Criteria and Evacuation Order

Supporting Report II (Feasibility Study) Paper IV Disaster Management
The Study on Flood and Debris Flow in the Caspian Coastal Area focusing on
the Flood-hit Region in Golestan Province
IV - 10 CTI Engineering International Co., Ltd. JICA
Self-help & Mutual-help attitude
Preparation for Disasters
Rules to observe during disaster
Risk and Resources
After that, risk management plan was formulated in participatory manner. In the meantime, village disaster risk management committees in the village councils have been established. Based on the plan, drills and critics were conducted, and necessary revisions have been made. This is the feed back process of the plan. After that villagers have started to implement their plans by the initiative of newly formulated Committee members.
Scenario of the drill was prepared in the workshops, and councilors decided to conduct annual drills to modify such scenario.
2.5 Schedule Vulnerability and capacity assessment was conducted from January 2005 to May2005 in 33 vulnerable villages along Madarsoo river basin. In August -September 2005, based on the assessment result, two pilot villages was selected and preliminary activities of Village Watching and Mapping has been conducted. In February to March 2006, workshops were conducted every week at each village. The workshop schedule is shown in the following table.
Table 2.2 Schedule of Village Activities
ActivityJan 29-Feb 3
Feb 4-10
Feb 11-17
Feb 18-24
Feb 25-Mar 5
Consensus building with Public officials
Strategic Meeting with Council
Mapping
Village Plan
Educational Materials for villagers andPassengers
Writing Scenario for Drill
Drill and Critic
Documentation of village DM activities
Advisory Committee for review
2.6 Village Plan Based on the discussion in the workshops, current problems and future actions were identified and described in Table 2.3.

The Study on Flood and Debris Flow in the Caspian Coastal Area focusing on the Flood-hit Region in Golestan Province
Supporting Report II (Feasibility Study)Paper IV
Disaster Management
JICA CTI Engineering International Co., Ltd. IV - 11
Table 2.3 Current Problems and Future Actions Items Current Problems Future Actions
There is no information regarding disasters from public authorities. Means of communication within the public authorities are either by phone or fax. In case of power failure, the system will not function.
Establish operational disaster information system within public authorities. Establish disaster information system between public authorities and village councils. To enhance telecommunication fail-safe operational system.
There is an Information route from public authorities to Red Crescent Society (RCS) to villagers but it is not functioning well.
To establish collaborative information sharing networks among public authorities, RCS, NGOs, CBOs.
The only reliable source of information is weather report which announce every one hour or so by TV and radio. The program does not correspond to special announcements for sudden change of weather. The accuracy of information is low.
Run a telop and broadcasting irregular programs of disaster information, collaborated with TV and radio. Develop accuracy of weather information.
Information Distribution
Village has traditional way of information distribution, such as mosque speaker, and mouth to mouth direct communication. Mosque speaker cannot be used during power failure.
Establish organized information distribution and operation system by utilizing traditional information distribution methods. Establish information distribution system which utilize siren that can function during power failure. To install generator or solar battery in Mosque speaker.
Evacuation Method
Judgment of evacuation is based on individual experience, and possibility of causing human loss is high. There is no plan of assisting evacuation of elderly and handicapped.
Secure several evacuation routes. Secure options for evacuation modes (such as foot, tractor, bike) To establish evacuation methods of elderly and handicapped. Conduct regular evacuation drills. Establish criteria of evacuation by experts referring to weather information, rainfalls, river conditions.
Evacuation sites are cemetery on a hill and farmland.
Several evacuation sites shall be designated officially. Evacuation site
and equipments Neither shelter nor equipments are installed
at evacuation sites. Install shelters and equipments at evacuation sites
Disaster Education
Villagers have high motivation of awareness raising, but not enough education has been conducted. The necessary education is listed below. ・ Basic knowledge of flood disaster ・ Organized method of information distribution ・ Criteria of evacuation ・ Organized method of evacuation ・ Training of disaster risk managers ・ Collaborative network of public authorities, NGOs,RCS,CBOs
Dispatch disaster managers to educate villagers and school children. Conduct pilot activities for community based disaster management activities (such as information distribution and evacuation) and disaster education programs. Prepare awareness raising leaflets for tourists. Prepare signboards of awareness raising for tourists in Golestan National Park. Train local disaster managers. To publish and circulate documentation of past disasters (books, videos)
Disaster management Plan and Evacuation Plan
Evacuation methods are not organized by plans but based on individual judgment
Evacuation methods shall be planned by villagers. Periodical evacuation drill shall be conducted. Review of evacuation plan occasionally.
Note: Short term(2006- 2010), Mid term(2011-2015), Long term(2016-2025)

Supporting Report II (Feasibility Study) Paper IV Disaster Management
The Study on Flood and Debris Flow in the Caspian Coastal Area focusing on
the Flood-hit Region in Golestan Province
IV - 12 CTI Engineering International Co., Ltd. JICA
Positions, role of emergency time and ordinary time were planned. It is important to decide roles in ordinary time to be reminded of emergency roles from the ordinary time. Village head serves as an Incident Commander, and other council members are mainly designated to other positions.
Table 2.4 Responsibility of Village Disaster Risk Management Committee Position Role emergency time Role in ordinary time
Incident Commander
Coordination, Contact with outside Reviewing disaster risk management plan
Monitoring Monitor water level of river Learn vulnerability and characteristics of flooding in village
Information Contact with responsible persons Give information of guidance to villagers
Awareness raising and Disaster education to villagers
Evacuation Give evacuation order Guide villagers to safe places
Check safety of evacuation site and routes, security check
Rescue and First Aid
help people, injured people- old and unable people
Store Medical kits
Stockpile Move stockpiles to evacuation site preparation of blanket, tent, heater, fuel, food including red meat, medical kits, clothes and shelter, tools for cooking warm foods construct Shelter that can stay 24-48 hours
Transportation Move people to evacuation place preparation of vehicle 4 big trucks
Village based emergency management plan were delineated. Some of the results are shown below.
Table 2.5 Stage-wise actions by villagers Stage Criteria Public Actions Village Action
Pre-Warning Weather bulletin from Meteorological office
• Meteorological office transmit weather information to MoE, PDMC, mass media, and relevant organizations
• All villagers check weather information
Warning More than 1mm rain at any station of MoE
• MoE gives PDMC Warning of flood.
• PDMC transmits flood warning information and necessary orders to relevant organizations.
• Persons-in-charge of monitoring go to riverside to monitor water level and report to village head.
Evacuation Rain reached warning level at any rain gauge station 15 mm/h: Nardin, Safid Dali Hagholkhajeh 20mm/h :Dasht 30mm/h : Dasht-eShah, Tangrah
• Township disaster management office issues evacuation order to village councils
• Persons-in-charge of information distribution transmit evacuation order.
• Persons-in-charge of evacuation alarm the warning post.
• Persons-in-charge of stockpiles load tools and foods in truck
• Persons-in-charge of transportation bring tools and the weak people to evacuation sites
• Person in charge of evacuation check missing people
• Person in charge of first aid treats injured
Dismissal About three hours after rain stops
• PDMC issues dismissal to village councils
• Village head calls off evacuation order

The Study on Flood and Debris Flow in the Caspian Coastal Area focusing on the Flood-hit Region in Golestan Province
Supporting Report II (Feasibility Study)Paper IV
Disaster Management
JICA CTI Engineering International Co., Ltd. IV - 13
Scenario of drills was prepared and drills were conducted to review the plans.
The scenario will be modified at each occasion by accumulated experience. Following scenario is the one developed in Dasht village.
Disaster Scenario
Weather forecast on TV reports that there is a chance of very heavy rain in Madarsoo river basin, and may cause flood and debris flow. There is a phone call from township disaster management office to village council head Mr. to pay attention to situation of rain. Because there are 1mm rain at many MOE stations. This is Warning stage. Village council members make telephone calls to village disaster risk management members to be ready for their own responsibilities. Person in charge of monitoring went to check the condition of river. The level has become three times of the ordinary level and reported to the council head. One hour passed and the rain has become like waterfalls. The persons in charge of monitoring checked the water level again and talked to village council head. They discussed that all villagers need to evacuate. Sooner, township disaster management office gave village council head a telephone call, and ordered villagers to evacuate to the evacuation sites. The water level of Nardin has become 15mm/hour. This is Evacuation stage. Village council head talked with persons in charge of Information distribution and evacuation to distribute evacuation order to all villagers. One person in charge evacuation went to sound warning alarm at warning post. Other persons in charge of Information distribution and evacuation start to distribute evacuation order to all villagers, based on the information distribution plan. They conveyed the following messages; the water level of Nardin has become 15mm/hour. We have danger of flood and debris flow, so we have to immediately evacuate with emergency kit bags. (Count how many minutes it takes to inform all villagers) Other persons in charge of Information distribution and evacuation informed teachers to guide children to evacuate. Persons in charge of stockpiles loaded tents, water, food and stoves in the trucks. Persons in charge of transportation loaded weak persons and started to evacuation sites with persons in charge of stockpiles. Villagers started to evacuate with emergency kit bags. They all evacuated with families and neighbors. At the evacuation sites, most villagers have already arrived. Person in charge of information distribution and evacuation checked who is missing. 3 children and 1 elderly were still in the farmland. Person in charge of rescue went to bring them. Some villagers were injured by the fallen objects. Person in charge of first aid treated them.

Supporting Report II (Feasibility Study) Paper IV Disaster Management
The Study on Flood and Debris Flow in the Caspian Coastal Area focusing on
the Flood-hit Region in Golestan Province
IV - 14 CTI Engineering International Co., Ltd. JICA
Table 2.6 Schedule of Drill (Dasht) Time Situation Action By who 01:30 Water becomes like
waterfalls Monitoring of water level of rivers Monitoring
1. 2.
01:40 Water is increasing rapidly and need evacuation
Monitoring person report to village headThey discussed that evacuation is needed.
01:42 Town ship disaster management office gave telephone call to village head
Village head issues evacuation order to mosque Evacuation person (1) informs Information persons (4) to order villagers to evacuate to mosque
Evacuation person 1. informs Information persons 1. 2. 3. 4.
01:45 Evacuation person goes to alarm warning post, and announce by mosque speaker
Evacuation person 1.
Information persons Give information to all houses by motorbikes
Information persons 1. 2. 3. 4.
02:00 Villagers prepare emergency kit bags and evacuate with them. School children evacuate by teachers’ guidance.
02:15 Information persons Check missing people by units Information persons compile all unit information to chief information leader. Information person report to village head
Information person 1.Chief 2. 3. 4.
02:20 Monitoring person went to check water level Report to village head about serious situation
Monitoring persons 1. 2.
02:30 Severe rain still continues
Village head announce to evacuate to southern height. Evacuation persons announce to all villagers. Villagers start to move
Evacuation persons 1.
Stockpile persons load stockpile to a carTransportation person transport stockpiles and Disable persons to final evacuation site, the southern height
Stockpile persons 1. Transportation person 1.
03:00 Information persons check missing persons Information persons compile all unit information to chief information leader. Information person report to village head
Information persons 1.Chief 2. 3. 4.
two persons were missing and rescue persons went to rescue him
Rescue persons 1. 2. 3.
03:10 First–aid person treated injured persons First-aid persons 1. 2. 3.
03:20 First-Aid and Rescue Demonstration by Red Crescent Society
03:40 Critic Chair persons: Village Councilors

The Study on Flood and Debris Flow in the Caspian Coastal Area focusing on the Flood-hit Region in Golestan Province
Supporting Report II (Feasibility Study)Paper IV
Disaster Management
JICA CTI Engineering International Co., Ltd. IV - 15
2.7 Outcome of the Pilot Activities Since the duration of village activity has limited, there are constrains to do everything. However, lots of endeavor was made to have outcomes of the activities. They are listed as below.
Safer Village for all villagers started to establish
Greater participation of villagers were promoted in decision making process while developing Village Based Disaster Management Plan
Mutual Cooperation Network with public sector and civil organizations has been strengthening and expanding
Capacity of Village Council has been enhanced

Supporting Report II (Feasibility Study) Paper IV Disaster Management
The Study on Flood and Debris Flow in the Caspian Coastal Area focusing on
the Flood-hit Region in Golestan Province
IV - 16 CTI Engineering International Co., Ltd. JICA
CHAPTER 3 DISASTER RISK MANAGEMENT IN VILLAGES
3.1 Principles of Village Resilience (1) Principle of village based disaster risk management
Civic construction to mitigate flood and debris flow has been planned. However, there is limitation of such mitigating measures for overwhelming level of hazards. To mitigate only by structural measures is unrealistic in respect to cost and duration of construction.
To prepare for such overwhelming disasters that mitigation measures cannot prevent, it is necessary to establish risk management system which villagers and passengers can access to appropriate information about floods and debris flows and immediately evacuate in coordination with the concerned public authorities.
The mitigation measures of structures and such community resilience is the two major components of the holistic disaster risk management, and they are complimentary to each other for establishing safer community. For this reason, establishment of village based risk management system, which is autonomously conducted by villagers are essential.
Actors at each level, such as public officials, village community, and individuals are all responsible for disaster risk management. Actions by public sector, community, individuals are called public help, mutual help, and self help. Public sectors give support the activities of village community and individuals. Village community and individuals cooperate with public officials. Through these activities, capacity of disaster management is enhanced.
CommunityCouncil, NGO,VBO
etc.
PrivateResidents
Passenger etc.
Collaboration
PublicDisaster
ManagementCommittee
Enhancing capacity of disaster management system in village.
Support SupportSupport Support
Public Help
Self HelpMutual Help
Figure 3.1 Collaboration among Public, Community, and Private
(2) Goal and Target Groups
The goal of the disaster risk management is to stop human loss and reduce property damages. Target groups are villagers of hazardous areas in Madarsoo river basin. In the river basin, population ratio of less than 15 years old is approximately one third and majority of victims in the past disasters are children. For this reason, school children are focal target along with villagers. Public officials, tourists, passenger of Golestan National Park are also included as important target groups.
Individual

The Study on Flood and Debris Flow in the Caspian Coastal Area focusing on the Flood-hit Region in Golestan Province
Supporting Report II (Feasibility Study)Paper IV
Disaster Management
JICA CTI Engineering International Co., Ltd. IV - 17
(3) Strategy
(a) Encourage Self-help
To establish village based risk management system, it is important for villagers and tourists to understand the basic concept that each individual has to have self- help attitude that your life should be protected by yourselves. It is also important that everyone has to have proper knowledge about disaster risk management, and identify the risk judging by information of mass media such as TV and radio, and decide evacuation actions accordingly. Such information and evacuation system need to be established. There is an indigenous way of communication within the village, therefore such system needs to be enhanced for development.
(b) Enhance mutual help and cooperation network
To establish such system, it is important to develop the system not only by self-help endeavor but also by mutual help, in cooperation with local communities, such as village council, non-governmental organizations, village based organizations, and local public authorities. The role of the public authorities is to give necessary support to the village community. Major role of the public authorities are to establish systems of proper information distribution and evacuation order within public authorities and to village council. Disaster risk management is not enough just at village level, it is necessary to have joint efforts, among villagers, local communities, and public authorities. It is also effective to go through participatory planning process to build confidence, trust, and capacity.
(c) Step by step process
To establish this system requires time, so things that can easily be accomplished may conduct first as step by step process. According to the JICA Study provision, three terms has been set; short term from 2006 to2010, mid term from 2011 to 2015, and finally the long term from 2016 to 2025. Detail plans were delineated in these three stages.
3.2 Master Plan for Village-based Disaster Risk Management Based on the vulnerability and capacity assessment, and village pilot activities, task targets and target groups have become clear. Task targets are 1) Risk communication, 2) Public Awareness raising, 3) Human resource development, 4) Organizational capacity development, 5) preparation of equipments and construction. As for target groups, public sector, villagers, school children, and tourists and passengers are considered to be important figures.
Plans are explained based on this task target categories.
(1) Risk Communication
(a) Disseminate Accurate Weather Information
Accurate timely weather information needs to be transmitted from Meteorological office to mass media. TV telop need to run to give timely warning of heavy rain. Villagers also need to be conscious about weather information.
(b) Promoting Hazard Map
Hazard map prepared by JICA team need to be authorized by the Golestan provincial government. Red Crescent Society trainers explain about the hazard map during village workshops. It is used for mapping exercise. Based on this, villagers understand possible inundation area, vulnerable areas, evacuation sites and routes.

Supporting Report II (Feasibility Study) Paper IV Disaster Management
The Study on Flood and Debris Flow in the Caspian Coastal Area focusing on
the Flood-hit Region in Golestan Province
IV - 18 CTI Engineering International Co., Ltd. JICA
(c) Village Watching and Risk and Resource Mapping
Villagers conduct Village Watching, which is a walking tour of village, to understand the location and size of the risk and resources in villages. The surveyed information will be included in the village risk and resource map.
Since the prepared hazard map covers wide area, villagers will prepare village focused big scale map during workshops. Same exercise can be done at school. Red Crescent Society trainers will be facilitator. Scale of the base map is recommended to be at least 1/5,000. Housing Foundation usually have base map (scale 1/2,000) of the villages.
(2) Public Awareness Raising
(a) Public Information Dissemination
It is important to utilize mass media; TV, radio, and newspapers for disseminating disaster mitigation information, introducing activities of public authorities.
To promote preparedness, it is necessary to produce leaflets, pamphlets, booklets of disseminating disaster knowledge for villagers, passengers, and tourists in the National Park.
Disaster Management Center and Red Crescent Society have important role in the dissemination of useful information to the general public.
(b) School Education
School children which accounts for one third of the population are the most vulnerable groups. It is needless to say that children are the future citizens and the most valuable part of the community, partly because they are immature in judgments. School children have far-reaching impacts on the villages as great potential for the next generations, and through the children, we can reach their parents and a larger section of the village. In this regard, it is important to put emphasis on disaster education for school children.
Besides the need for effective action during the emergency, it is also important to understand the nature of the disaster to avoid unnecessary panic. Thus, school curricula should be developed which will state the nature and cause of disasters and what to do before, during and after a disaster. The curricula will depend on the respective education level and will vary from elementary to high schools, and needs authorization as national standard.
Schools located in vulnerable villages need to conduct tentative programs urgently.
(c) Signboard of Flood Risk for Tourists and Passengers
Signboards that inform flood risk in the Golestan National Park will be installed. Small exhibition area to inform flood risk will be provided in museum of the National Park by DOE. Past disaster situation, disaster experience, and damage photos are recommended to be displayed.
(d) Holding Seminars, Conferences
Seminars, conferences will be held for raising awareness of the general public.

The Study on Flood and Debris Flow in the Caspian Coastal Area focusing on the Flood-hit Region in Golestan Province
Supporting Report II (Feasibility Study)Paper IV
Disaster Management
JICA CTI Engineering International Co., Ltd. IV - 19
(3) Human Resource Development
(a) Administrator Training
Public administrators will be trained to gain knowledge for daily services. Expert of Red Crescent Society will be re-trained for village council members and village leaders to train as trainers. For school disaster education, training of school teachers is the primary things to conduct. For school teachers, it is essential to have an emergency response manual, which defines teachers’ response and leadership, direction during the emergency situation, information dissemination, and linkages between the relevant organizations.
(b) Training of Local Leaders
Village council members and voluntary leaders in the villages will be trained to have specific and practical knowledge and to lead the village based disaster risk management activities such as planning, information dissemination, issuing evacuation order, rescue, first-aid, and relief in the emergency situation. Red Crescent Society will train village leaders.
(c) Conducting Village Workshops by Village Leaders
It is always the case that immediately after a disaster, we cannot expect normal public services. Thus, it is necessary for villagers to prepare for disasters in order to increase resilience in the villages. If villagers unite and cooperate with each other, they can protect more lives and properties, since it is the villager who know their neighborhood very well and can respond effectively in the disaster situation. It is important for the local residents to know the conditions of their surroundings, and understand what the real hazards would be in disaster situations.
Trained village council members and voluntary members will hold village workshops to plan village disaster risk management, educate disaster knowledge, train emergency responses, and conduct drills by support of Red Crescent Society.
Red Crescent Society have eight hour basic disaster management course that provide emergency trainings such as first-aid, rescue, etc. It is effective to take this course at lease one person at one family.
(d) Conducting Annual Drills
To obtain first-hand experience of disasters, it is recommended to have annual drills for all villagers and village based organizations such as Basij, RCS volunteers, Imam Khomeini Foundations. These drills are regarded as one of the best training and education media, to understand different elements like evacuation, first aid, etc. Yearly drill including school will be conducted by the initiative of village disaster risk management committee. Joint drill in wide area, including relevant authorities such as township and provincial disaster management center, police and Red Crescent Society can be held.
(4) rganizational Capacity Development
(a) Formulation of Disaster Management Committee
Disaster management committee will be formed at each village to promote understanding and responsibilities before, during and after disasters. Such responsibilities as information distribution, monitoring, evacuation, transportation, stockpile, rescue and first-aid will be designated and trained.

Supporting Report II (Feasibility Study) Paper IV Disaster Management
The Study on Flood and Debris Flow in the Caspian Coastal Area focusing on
the Flood-hit Region in Golestan Province
IV - 20 CTI Engineering International Co., Ltd. JICA
The head of the committee plays an incident commander and make contacts with outside organizations. Red Crescent Society will give support to conduct workshops.
(b) Enhance Emergency Response
Red Crescent Society will give training for villagers to upgrade organizational skills and capacity for emergency response including monitoring, information distribution, evacuation, rescue, first-aid etc..
(c) Strengthening Coordination
Proper coordination with different organizations is necessary to effectively use the available resources. The capacity, expertise and resources of different organizations can be utilized at the maximum level if there is a prior communication among all these organizations. This will minimize the duplication of efforts and will be able to serve the people who need it the most. For strengthening such capacity, Role Play Exercises would be effective along with regular on the job trainings.
Close linkage between the community and public authorities will minimize the risks and damages. In normal times, public authorities and Red Crescent Society support locally based risk management activities. In emergency situations, Village Disaster Risk Management Committees would be an information source; they would collect information and convey information to the public authorities. Public authorities also convey necessary information through these Committees.
For the first step of coordination, disaster management data at each village are compiled at relevant offices, which is effective during emergency situations. In ordinary time, at yearly drills, relevant organizations will co-organize the activities. Emphasis is given to establish linkage and coordination among these organizations.
(4) reparation of Equipments and Construction
(a) Preparation of Equipments
Village will prepare necessary tools and equipments for emergency by subsidies of local government. Those items are recommended to be used in ordinary time and maintained by village disaster risk management committee.
(b) Construction of Shelter cum Village Cultural Center
Village cultural center which can be used as shelter will be constructed. In vulnerable villages, no cultural facilities exist. Labor for construction is provided by villagers. Housing Foundation will discuss the construction plan with villagers. In most vulnerable villages, in-door sports facilities fr youth are commonly requested.
(c) Construction of Mitigating Measures
To enhance mitigation capacity of flood and debris flow, planned engineering works will be discussed with villagers. In the construction program, including villager’s labor contribution is feasible.
Task target of village disaster risk management is compiled in the following matrix identifying target groups.
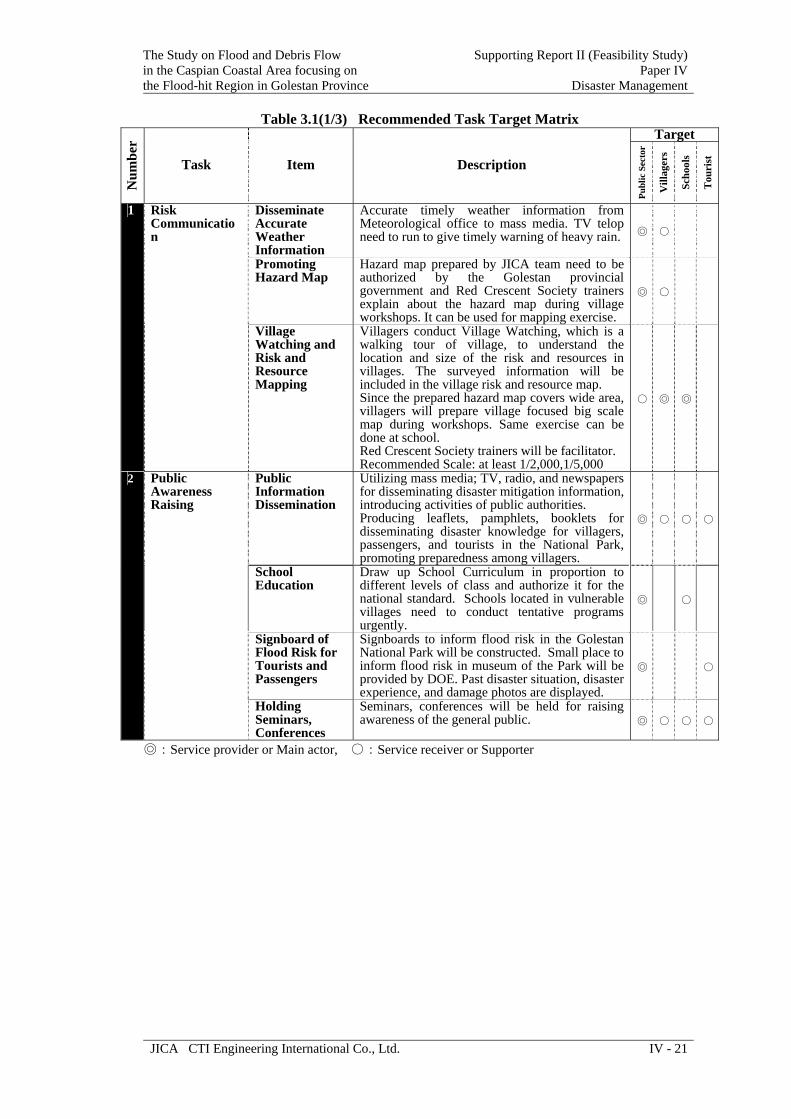
The Study on Flood and Debris Flow in the Caspian Coastal Area focusing on the Flood-hit Region in Golestan Province
Supporting Report II (Feasibility Study)Paper IV
Disaster Management
JICA CTI Engineering International Co., Ltd. IV - 21
Table 3.1(1/3) Recommended Task Target Matrix Target
Num
ber
Task Item Description
Publ
ic S
ecto
r
Vill
ager
s
Scho
ols
Tou
rist
Disseminate Accurate Weather Information
Accurate timely weather information from Meteorological office to mass media. TV telop need to run to give timely warning of heavy rain.
◎ ○
Promoting Hazard Map
Hazard map prepared by JICA team need to be authorized by the Golestan provincial government and Red Crescent Society trainers explain about the hazard map during village workshops. It can be used for mapping exercise.
◎ ○
1 Risk Communication
Village Watching and Risk and Resource Mapping
Villagers conduct Village Watching, which is a walking tour of village, to understand the location and size of the risk and resources in villages. The surveyed information will be included in the village risk and resource map. Since the prepared hazard map covers wide area, villagers will prepare village focused big scale map during workshops. Same exercise can be done at school. Red Crescent Society trainers will be facilitator. Recommended Scale: at least 1/2,000,1/5,000
○ ◎ ◎
Public Information Dissemination
Utilizing mass media; TV, radio, and newspapers for disseminating disaster mitigation information, introducing activities of public authorities. Producing leaflets, pamphlets, booklets for disseminating disaster knowledge for villagers, passengers, and tourists in the National Park, promoting preparedness among villagers.
◎ ○ ○ ○
School Education
Draw up School Curriculum in proportion to different levels of class and authorize it for the national standard. Schools located in vulnerable villages need to conduct tentative programs urgently.
◎ ○
Signboard of Flood Risk for Tourists and Passengers
Signboards to inform flood risk in the Golestan National Park will be constructed. Small place to inform flood risk in museum of the Park will be provided by DOE. Past disaster situation, disaster experience, and damage photos are displayed.
◎ ○
2 Public Awareness Raising
Holding Seminars, Conferences
Seminars, conferences will be held for raising awareness of the general public. ◎ ○ ○ ○
◎:Service provider or Main actor, ○:Service receiver or Supporter

Supporting Report II (Feasibility Study) Paper IV Disaster Management
The Study on Flood and Debris Flow in the Caspian Coastal Area focusing on
the Flood-hit Region in Golestan Province
IV - 22 CTI Engineering International Co., Ltd. JICA
Table 3.1(2/3) Recommended Task Target Matrix Target
Num
ber
Task Item Description
Publ
ic S
ecto
r
Vill
ager
s
Scho
ols
Tou
rist
Administrator Training
Training administrators to gain knowledge for daily services. Expert of Red Crescent Society will be trained for village council members and village leaders to train as trainers.
◎
Training of Local Leaders
Training village council members and voluntary leaders in the villages with specific and practical knowledge to lead the village based disaster risk management activities such as planning, information dissemination, issuing evacuation order, rescue, first-aid, and relief in the emergency situation. Red Crescent Society will train village leaders.
◎ ○
Conducting Village Workshops by Village Leaders
Trained village council members and voluntary members will hold village workshops to plan village disaster risk management, educate disaster knowledge, train emergency responses, and conduct drills by support of Red Crescent Society.
○ ◎
3 Human Resource Development
Conducting Annual Drill
Yearly drill including school will be conducted by the initiative of village disaster risk management committee. Joint drill in wide area, including relevant authorities such as township and provincial disaster management center, police and Red Crescent Society can be held.
○ ◎
Formulation of Disaster Management Committee
Disaster management committee will be formed at each village to promote understanding and responsibilities before, during and after disasters. Such responsibilities as information distribution, monitoring, evacuation, transportation, stockpile, rescue and first-aid will be designated and trained. The head of the committee plays an incident commander and make contacts with outside organizations. Red Crescent Society will give support to conduct workshops.
○ ◎
Enhance Emergency Response
Upgrading organizational skills and capacity for emergency response including monitoring, information distribution, evacuation, rescue, first-aid etc. Red Crescent Society will give training for villagers.
○ ◎
4
Organizational Capacity Development
Strengthening Coordination
Information database of each vulnerable village will be kept at relevant organizations, which is effective during emergency situations. In ordinary time, at yearly drills, relevant organizations will co-organize the activities. Emphasis will be given to establish linkage and coordination among these organizations.
◎ ◎
◎:Service provider or Main actor, ○:Service receiver or Supporter

The Study on Flood and Debris Flow in the Caspian Coastal Area focusing on the Flood-hit Region in Golestan Province
Supporting Report II (Feasibility Study)Paper IV
Disaster Management
JICA CTI Engineering International Co., Ltd. IV - 23
Table 3.1(3/3) Recommended Task Target Matrix Target
Num
ber
Task Item Description
Publ
ic S
ecto
r
Vill
ager
s
Scho
ols
Tou
rist
Preparation of Equipments
Village will prepare necessary tools and equipments for emergency by subsidies of local government. Those items are recommended to be used ordinary time and maintained by village council.
◎ ◎
Construction of Shelter cum Village Cultural Center
Village cultural center which can be used as shelter will be constructed. In vulnerable villages, no cultural facilities exist. Labor for construction is provided by villagers. Housing Foundation will discuss the construction plan with villagers.
◎ ◎
5 Preparation of Equipment and Construction
Construction of Mitigating Measures
To enhance mitigation capacity of flood and debris flow, planned engineering works will be discussed with villagers. In the construction program, including villager’s labor contribution is feasible.
◎ ◎
◎:Service provider or Main actor, ○:Service receiver or Supporter

Supporting Report II (Feasibility Study) Paper IV Disaster Management
The Study on Flood and Debris Flow in the Caspian Coastal Area focusing on
the Flood-hit Region in Golestan Province
IV - 24 CTI Engineering International Co., Ltd. JICA
3.3 Action Planning Responsible authorities and implementing stages were identified in the following matrix. Three stages were set; short term 2006-2010, mid term 2011-2015, and long term 2016-2025.
Table 3.2 Action Plan Matrix
Task Item Action by Short Term
2006- 2010
Mid Term
2011- 2015
Long Term
2016- 2025
Disseminate Accurate Weather Information
Meteorological office Mass media
Promoting Hazard Map
DMC RCS
Risk Communi-cation
Village Watching and Risk and Resource Mapping
RCS
Public Information Dissemination
DMC Mass Media
School Education Ministry of education DMC RCS
Signboard of Flood Risk for Tourists and Passengers
DOE
Public Awareness Raising
Holding Seminars, Conferences
DMC RCS
Administrator Training
DMC RCS
Training of Local Leaders
DMC RCS
Conducting Village Workshops by Village Leaders
DMC RCS
Human Resource Development
Conducting Annual Drill
DMC RCS
Formulation of Disaster Management Committee
RCS
Enhance Emergency Response
DMC RCS
Organizational Capacity Development
Strengthening Coordination
DMC RCS
Preparation of Equipments
DMC RCS
Construction of Shelter cum Village Cultural Center
Housing Foundation DMC
Preparation of Equipment and Construction
Construction of Mitigating Measures
MOJA MORT

The Study on Flood and Debris Flow in the Caspian Coastal Area focusing on the Flood-hit Region in Golestan Province
Supporting Report II (Feasibility Study)Paper IV
Disaster Management
JICA CTI Engineering International Co., Ltd. IV - 25
Model activities in villages are shown in the following figure.
Plan disaster risk management in village using map to know spatial distance
Mapping
Risk and Resources Evacuation site, route,
inundation area
■ Vulnerability and Capacity Assessment
■Reviewing To Acquire direct experience and training
Social Awareness Survey For households
Village Inventory Survey For Village representatives
Technical Equipments Public facilities Communication system Village economy Local organizations Disaster experience Risk perception Disaster knowledge
- Reviewing Scenario - Reviewing Plan
Critic
■Treat Risks Think and plan countermeasures among villagers
- Information distribution - Evacuation training - First Aid training etc.
Drill
Monitoring
(by Com
mittee)
Risk perception Level of disaster knowledge Mutual cooperation Willingness of participation Decision making system Trust to public officials Joint village activities Local leadership
Walking tour of the villages to identify resources and risks
Village Watching
Planning on Map (Map Maneuver)
Figure 3.2 Model Flow of Village Risk Management Activities

Supporting Report II (Feasibility Study) Paper IV Disaster Management
The Study on Flood and Debris Flow in the Caspian Coastal Area focusing on
the Flood-hit Region in Golestan Province
IV - 26 CTI Engineering International Co., Ltd. JICA
Proposed steps of village activities are shown as below. It is recommended to have two targets; school children and villagers, and joint drill will be conducted.
Training School Teachers
School Children
Disaster education and mapping
Conduct village Kick off meeting
Participatory vulnerability and
capacity assessment
Transect walk and Risk Mapping
Village disaster risk management plan
Preparation of educational materials
Red Crescent
Training Red Crescent village volunteers as
facilitators
Villagers
Drill & Critics For Reviewing Plans
Figure 3.3 Steps of Village Risk Management Activity

SUPPORTING REPORT II (FEASIBILITY STUDY)
PAPER V
Institutional and Regal Study


The Study on Flood and Debris Flow in the Caspian Coastal Area focusing on the Flood-hit Region in Golestan Province
Supporting Report II (Feasibility Study)Paper V
Institutional and Regal Study
JICA CTI Engineering International Co., Ltd. V - i
THE STUDY ON FLOOD AND DEBRIS FLOW IN THE CASPIAN COASTAL AREA
FOCUSING ON THE FLOOD-HIT REGION IN GOLESTAN PROVINCE
SUPPORTING REPORT II (FEASIBILITY STUDY)
PAPER V INSTITUTIONAL AND REGAL STUDY
TABLE OF CONTENTS
Page
CHAPTER 1 GENERAL................................................................................. V-1
1.1 Scope of work ............................................................................. V-1
1.2 Overall strategy for flood prevention.......................................... V-1
CHAPTER 2 PROCESS OF STUDY ............................................................. V-2
CHAPTER 3 STATUS OF FLOOD EARLY WARNING ........................... V-3
3.1 Laws related to flood warning .................................................... V-3
3.2 Institutional division of role in flood warning ............................ V-3
CHAPTER 4 FLOOD CHARACTERISTICS AND STRATEGY OF FFWS
..................................................................................................... V-6
4.1 Nature of Floods in Golestan ...................................................... V-6
4.2 Principles of flood forecasting and warning in Golestan ............ V-6
CHAPTER 5 PROBLEMS IN FLOOD WARNING SYSTEM ................... V-7
5.1 Problems in laws ......................................................................... V-7
5.2 Problems in monitoring............................................................... V-7
5.3 Problems in Institutions .............................................................. V-8
CHAPTER 6 PROPOSAL FOR FLOOD FORECASTING AND
WARNING IN GOLESTAN NATIONAL PARK ................. V-9
6.1 Draft proposal on new agreement ............................................... V-9
6.2 Proposal for Institutional Coordination....................................... V-9
6.3 Implementation steps .................................................................. V-11
Supporting Report II (Feasibility Study) Paper V Institutional and Regal Study
The Study on Flood and Debris Flowin the Caspian Coastal Area focusing on
the Flood-hit Region in Golestan Province
V - ii CTI Engineering International Co., Ltd. JICA
CHAPTER 7 SUMMARY ............................................................................... V-12
ANNEX 1 A DRAFT AGREEMENT ON FLOOD FORECAST AND WARNING IN GOLESTAN.................................................... V-13
LIST OF TABLES
Table 1.1 Measures for Flood disaster prevention and its implementation institutions............................................................................................. V-1
Table 2.1 Institutions visited for hearing .............................................................. V-2
Table 3.1 Present division of role for Flood Forecast and Warning ..................... V-4
Table 5.1 Criteria of rainfall for flood warning among different institutions ....... V-7
Table 5.2 Number of staffs for monitoring ........................................................... V-8
Table 5.3 Route and date of issue of rain forecast among institutions.................. V-8
Table 6.1 Proposed division of role for flood forecast and warning..................... V-10
Table 6.2 Member of FFWC................................................................................. V-11
Table 6.3 Implementation schedule ...................................................................... V-11
Table 7.1 Summary of status, problem, and proposal for FFWS.......................... V-12
LIST OF FIGURES
Figure 6.1 Outline of agreement............................................................................. V-9
Figure 6.2 Proposed organization structure of FFWC............................................ V-11

The Study on Flood and Debris Flow in the Caspian Coastal Area focusing on the Flood-hit Region in Golestan Province
Supporting Report II (Feasibility Study)Paper V
Institutional and Regal Study
JICA CTI Engineering International Co., Ltd. V - 1
CHAPTER 1 GENERAL
Flood disaster does not come without precursor. Acquisition of reliable and timely meteorological and hydrological information can help forecast flood in advance. Sharing such data among responsible institutions for warning can be a great help for to reduce possible human and property loss.
Flood forecast and warning does not work successfully by technology alone. Rather, it also requires a rule, coordination, and continuous improvement.
This study tries to find necessary elements for from legal and institutional point of view.
1.1 Scope of work
In the previous phase, a master plan with seven components was proposed in JICA study, including Golestan National Park disaster management for the middle reaches and flood preparedness plan for entire area. Among them, flood forecast and warning system in Golestan National Park is selected as one of priority projects to study its feasibility. In this phase, following items are studied for legal and institutional component.
To understand status in flood forecast and warning.
To find out problems in flood forecast and warning.
To propose improvement in flood forecast and warning.
1.2 Overall strategy for flood prevention
There are many measures for flood disaster prevention, and they can be implemented in various institutions, as shown in Table 1-1. Information provided in hazard map can be a used to for other measures as well. For the details of each measure, see related section of the final report.
Table 1.1 Measures for Flood disaster prevention and its implementation institutions
Measures Implementation institutions
Hazard map MOJA, PDMC
Flood plain management Housing Foundation, MOJA, MORT, MOE, MPO
Education IRCS, MOJA
Forecast & warning MO, MOE, Police, MORT, DOE, MOJA
Flood Insurance Agriculture Insurance, MOJA

Supporting Report II (Feasibility Study) Paper V Institutional and Regal Study
The Study on Flood and Debris Flow in the Caspian Coastal Area focusing on
the Flood-hit Region in Golestan Province
V - 2 CTI Engineering International Co., Ltd. JICA
CHAPTER 2 PROCESS OF STUDY
Hearings and workshops were made to key persons related to flood warning in Golestan and in
Tehran as listed in Table 2.1. Following points were questioned to understand present status and
their opinions.
Legal basis for flood warning.
Roles of institutions for flood warning.
Flow of information for flood warning.
Response activities during floods in 2005.
Recent changes in flood warning system, if any.
Opinions about improvement in flood warning.
Table 2.1 Institutions visited for hearing Date Institution Name Position
1/18 PDMC Mr. Safabi Director of Gorgan Province
1/21 Mo Mr. Ghasemi Director of Gorgan Office
1/23 MOJA Mr. Ahmadi Watershed Management Office
1/24 MOE Dr. Yakkesi Deputy of Gogran office
1/24 IRCS Dr. Hamid Estiri
1/25 Military Police Deputy in Tangrah office
1/25 IRCS Deputy in Tangrah office
2/02 Various Officials Technical Committee members in
Golestan
2/06 MOJA Officials Watershed Management Department
in Tehran

The Study on Flood and Debris Flow in the Caspian Coastal Area focusing on the Flood-hit Region in Golestan Province
Supporting Report II (Feasibility Study)Paper V
Institutional and Regal Study
JICA CTI Engineering International Co., Ltd. V - 3
CHAPTER 3 STATUS OF FLOOD EARLY WARNING
3.1 Laws related to flood warning
Flood has been mostly regarded as precious water resource in Iran. For this reason, flood has not been defined as disaster in the terms of law. Accordingly, a law that specifically aims to prevent flood disaster does not exist.
However, due to the recent increase of natural disaster in Iran, “The Integrated Disaster Plan of Iran” (Decree of the council of Ministers, No. 24412T/2283) was established in 2003 by Disaster Task Force, MOI. The article 35 of the Plan defines that “specialized work group of prevention and calamities (hazards) management is to be formed in each level of local administration”, such as province, district, and city.
According to the Plan, Different organization is assigned as primarily responsible for different kind of disaster. For Floods and River Floods, specialized work group is defined as under the responsibility of the Ministry of Energy. In provincial level, the committee is formed under the PDMC.
For flood warning, there are several different criteria by experience in different institutions such as MO, MOE, and PDMC. But they are not actually applied to the forecast.
Though MOE and MOJA are responsible for structural measures such as river works and dams, and need to report the damages after flood disaster, they are not involved during the period of flood disaster.
3.2 Institutional division of role in flood warning
Present division of roles to flood forecast and warning among institutions is studied by interviews and summarized in Table 3.1.

Supporting Report II (Feasibility Study) Paper V Institutional and Regal Study
The Study on Flood and Debris Flow in the Caspian Coastal Area focusing on
the Flood-hit Region in Golestan Province
V - 4 CTI Engineering International Co., Ltd. JICA
Table 3.1 Present division of role for Flood Forecast and Warning Institution Before flood Just before flood After flood
MO Weather forecast
Rainfall monitoring
Report to PDMC
Monitor rainfall Report Rainfall
MOE Monitor rain & water Monitor rain & water Report monitoring
MOJA Check dam, forestation Damage survey
PDMC Issue warning Command Compile damage
Military
police
Traffic control Command local offices
for response
Command
Police Traffic control Close gate Search & rescue
MORT Road management Patrol for evacuation Search & rescue
DOE Park management Patrol for evacuation Search & rescue
IRCS Education & training Patrol for evacuation Search & rescue
(1) MO
MO provides weather forecast provided from Tehran, and PDMC issues warning based on the forecast. MOE is to provide data later on. Hourly rain fall amount is used for issuing criteria. However, neither MO nor MOE do not observe rainfall every hour, besides, their data are not available real time manner. MO has criteria for forecasting as follows. However, these criteria are based on hourly rainfall data, which is measured but not available in real time.
(2) MOE
MOE monitors water level of the river, but their data is not used for flood warning and disaster prevention purposes. The monitoring is made every two hours only during office hours. This is because the object of monitoring at MOE has been water resources.
(3) PDMC
PDMC has limited number of staffs, and main task is to transfer warning upon the reception of letter from MO.
(4) Military Police
Military Police is the key institution in village level that commands Police, ministry offices such as MORT, DOE, and Red Crescent.

The Study on Flood and Debris Flow in the Caspian Coastal Area focusing on the Flood-hit Region in Golestan Province
Supporting Report II (Feasibility Study)Paper V
Institutional and Regal Study
JICA CTI Engineering International Co., Ltd. V - 5
(5) Police
Police will close the entrance to Golestan National Park upon receiving order from military police. Police has telephone, fax, and radio communication equipment.
(6) Iranian Red Crescent Society (IRCS)
IRCS plays an important role for evacuation when warning is issued. In Golestan, they have 12 local offices, including 3 road offices. Near Golestan National park, they have offices in Tangrah and Ghazal, with a patrol car. The number of staffs in offices are five and changes in every ten days. In case of emergency, more members come from other offices to help.
(7) MOJA
MOJA is not involved in the flood warning process. They received monitoring data after flood by visiting MO and MOE office.

Supporting Report II (Feasibility Study) Paper V Institutional and Regal Study
The Study on Flood and Debris Flow in the Caspian Coastal Area focusing on
the Flood-hit Region in Golestan Province
V - 6 CTI Engineering International Co., Ltd. JICA
CHAPTER 4 FLOOD CHARACTERISTICS AND STRATEGY OF FFWS
4.1 Nature of Floods in Golestan
Recently, major floods had occurred repeatedly in Golestan Province. By the experience, it is found that they have some common features as follows.
Floods occurred in special period in dry season.
Floods occurred once or none in a year.
Floods occurred during night time.
Most rainfall occurred in Golestan National Park.
Major victims in local tourists in Golestan National Park.
4.2 Principles of flood forecasting and warning in Golestan
Based on the observed common features, following principles can be made.
Intensive monitoring in dry season is economically feasible.
Staffs standing by for 24 hours is necessary for dry season.
Rainfall data observed in real time should be used as principal data, and water level can be used as a reference.
Main target of flood warning should be local tourists in Golestan National Park. For this purpose, one gate at the Tangrah (lower reach) and another gate at Dasht upper reach) must be closed, and passengers and local tourists in the Park must be evacuated.

The Study on Flood and Debris Flow in the Caspian Coastal Area focusing on the Flood-hit Region in Golestan Province
Supporting Report II (Feasibility Study)Paper V
Institutional and Regal Study
JICA CTI Engineering International Co., Ltd. V - 7
CHAPTER 5 PROBLEMS IN FLOOD WARNING SYSTEM
5.1 Problems in laws
Presently, there is no law that mentions the flood disaster prevention, nor forecast and warning. This can be a fundamental problem to promote preventive measures for flood as an institution.
MOE is not involved in flood forecasting and warning, though MOE is the legally assigned as a leading institution for flood disaster. This is critical for flood forecast, because MOE is the institution with technical capacity in hydrology. PDMC does not have technical staffs. The main task of MO is in meteorology.
A law that requires proper installation and maintenance does not exists. Accordingly, installed monitoring instruments did not function well during the past flood.
There are several criteria of rainfall for flood warning among different institutions as shown in Table 5.1. In practice, none are practically used for warning issue, because rainfall data is not available in real time.
Table 5.1 Criteria of rainfall for flood warning among different institutions Institution Rainfall Area Action
80- 90mm/4 hours Golestan Issue warning PDMC
20 mm/hour Khorasan &
Semnan
Issue warning
20 mm/hour Golestan Park Order evacuation
40 mm/hour Golestan Park Order evacuation to Red Crescent
and MORT office
60 mm/hour Golestan Park Order evacuation by speaker to
everybody.
MO
70 mm/hour Golestan Park Order to stop all activities for
evacuation.
5.2 Problems in monitoring
Weather forecast information from MO, based on satellite data is used for flood warning. Present warning information does not specify areas, and hit ratio is not high. Annually, about 15 to 20 warnings has been issued. However, flood actually occurred no more than twice. This situation may decrease the credibility of warning in the log run.
Monitoring data of rain and river water are not retrieved real-time manner, and as such, they cannot be used for flood forecast.

Supporting Report II (Feasibility Study) Paper V Institutional and Regal Study
The Study on Flood and Debris Flow in the Caspian Coastal Area focusing on
the Flood-hit Region in Golestan Province
V - 8 CTI Engineering International Co., Ltd. JICA
5.3 Problems in Institutions
Present number of staff for monitoring in related institutions is tabulated in Table 5-2. MO has sufficient number of staffs for 24 hours of monitoring. However, the number of staffs for 24 hours monitoring in MOE and PDMC is limited, because the number of total staff is limited. Besides, no night shift system exists in MOE at present, because purpose of monitoring in MOE is for water resource.
Recent floods in Golestan occurred during night time. No staffs are available in MOE, and acquisition of observed data is made only during office hour in MOE.
There are no data exchange between MOE and Meteorology, though flood forecasting requires close works between hydrology with meteorology. Further, data is not shared among related institution.
Table 5.2 Number of staffs for monitoring Institutions Number Work hours
MO 6 staffs urgent time in Gorgan
1 staff night shift in Gorgan
MOE 4 staffs Gorgan and Gonbat
PDMC 4 staffs Total staff in Gorgan
1 staff Stand by for 24 hours
Route and time lead of rain forecast among institutions during 2005 August 10 flood, as revealed by interview, is shown in Table 5-3. Though there are redundant route of communication, all the provided information is the same contents, before 3 days of the flood.
Table 5.3 Route and date of issue of rain forecast among institutions Institution Date of issue Route of communication
PDMC 3 days before
flood
MO in Gorgan
IRCS in Gorgan 3 days before
flood
MO in Tehran, MO in Golestan, Natinal DMC in Tehran,
PDMC in Golestan
Military Police in
Tabgrah
3 days before
flood
MO in Gorgan -> Military Office in Gorgan ->
Minudasht Local office
IRCS in Tangrah 3 days before
flood
MO -> Red Crescent in Gorgan -> Red Crescent in
Minudasht

The Study on Flood and Debris Flow in the Caspian Coastal Area focusing on the Flood-hit Region in Golestan Province
Supporting Report II (Feasibility Study)Paper V
Institutional and Regal Study
JICA CTI Engineering International Co., Ltd. V - 9
CHAPTER 6 PROPOSAL FOR FLOOD FORECASTING AND WARNING IN GOLESTAN NATIONAL PARK
Herein an establishment of FFWC is proposed, with draft agreement among institution, organization, number of staffs, and division of role among institutions.
6.1 Draft proposal on new agreement
An agreement on flood forecast and warning system among institution should be established. The outline of agreement is shown in Figure 6.1, and its content is shown in the Appendix. The agreement should include objective of the system, definition of criteria, establishment of FFWC and its role, and role of evacuation activities among institutions. This can be a special agreement designed for flood forecast and warning. The agreement shall be signed and ratified in provincial disaster management committee.
1. General 1.1 Definition of terms 1.2 Definition 2. Institutions included 3. Flood forecast and warning center 3.1 Establishment of FFWC 3.2 Function of FFWC 4. Role of each institution during normal time 4.1 Installation of instruments 4.2 Maintenance of instruments 4.3 Setting criteria of rain and water levels 4.4 Evacuation plan 4.5 Installation of warning plates 5. Role of each institution during rain time 5.1 Intensive monitoring 5.2 Data transmission 5.3 Data sharing 5.4 Issuing of warning 5.5 Evacuation operation 6. Improvement of criteria and evacuation plan
Figure 6.1 Outline of agreement
6.2 Proposal for Institutional Coordination
Proposed division of role for Flood Warning among institutions is summarized in Table 6.1. The major change to the present system is the establishment of Flood Forecast and Warning Center (FFWC) in MOE.

Supporting Report II (Feasibility Study) Paper V Institutional and Regal Study
The Study on Flood and Debris Flow in the Caspian Coastal Area focusing on
the Flood-hit Region in Golestan Province
V - 10 CTI Engineering International Co., Ltd. JICA
This is because MOE is designated as a leading institution for flood disaster by law. However, FFWC can be transferred to PDMC when PDMC acquired sufficient fund and technical staffs. Since it is found that major flood occurred only in dry season, and the number of staffs available for night shift monitoring in MOE is very limited, the period for intensive monitoring shall be limited to dry season only.
Table 6.1 Proposed division of role for flood forecast and warning Organization Before flood Just before flood After flood
MO Add new stations
Maintain instruments
Weather forecast
Monitor rainfall
Real time monitoring
Data transmission to
MOE
Report to PDMC
Monitoring Rainfall
MOE Add new stations
Maintain instruments
Monitor rain & water
Define criteria
Real-time monitoring
Data sharing
Report to PDMC
Damage survey
Document damage
MOJA Provide hazard map Damage survey
Document damage
PDMC Set warning standard
Make response plan
Issue warning by MOE’s
report
Coordinate search &
rescue
Military
police
Make response plan Command local offices
for response
Command
Police Make response plan
Control traffic
Close gate Search & rescue
DOE, MORT,
IRCS
Make response plan
Install warning plates
Evacuation training
Evacuate local tourists
from Park
Search & rescue
The staff for the FFWC are assigned from MOE, and its organization structure can be as illustrated in Figure 6.2. Note that no new staffs will be recruited, but present staffs in MOE work for the positions.

The Study on Flood and Debris Flow in the Caspian Coastal Area focusing on the Flood-hit Region in Golestan Province
Supporting Report II (Feasibility Study)Paper V
Institutional and Regal Study
JICA CTI Engineering International Co., Ltd. V - 11
MOE Golestan office
Hydrological Resource Department
FFWC
Director
Monitoring Operation Staffs
Data Server Operation Staffs
Support Engineer
Figure 6.2 Proposed organization structure of FFWC
Table 6.2 Member of FFWC Position Number of staff Source of recruit
Director 1 Staff in MOE
Monitoring operation 2 Staffs in MOE
Data server operation 2 Staffs in MOE
Support Engineers 1 Staff in MOE
6.3 Implementation steps
Implementation schedule for is shown in Table 6.3. Agreement should be established at first. Forecast criteria, evacuation plan should be established once FFWC is installed.
Table 6.3 Implementation schedule
Year 1 2 to X X+1 X+2 X+3
Establishment of agreement XX
Installation of FFWC hardware XX
Establishment of forecast criteria XX
Establishment of evacuation plan XX
Start of operation XX

Supporting Report II (Feasibility Study) Paper V Institutional and Regal Study
The Study on Flood and Debris Flow in the Caspian Coastal Area focusing on
the Flood-hit Region in Golestan Province
V - 12 CTI Engineering International Co., Ltd. JICA
CHAPTER 7 SUMMARY
A summary of status, problem, and proposal for FFWS is tabulated in Table 7-1. In summary, better rescue can happen before flood disaster, by people working together with new technology and rule.
Table 7.1 Summary of status, problem, and proposal for FFWS Status Problem Proposal
Law -No law for flood disaster.
-MOE is legally assigned as leader for flood.
-Different forecast criteria exist, but are not used.
-Flood disaster prevention is not legalized.
-MOE’s role in flood forecast is not defined.
-Real time data is lacking to use forecast criteria.
- Establish a law for flood forecast and warning.
- MOE works as flood forecast authority.
-Define warning criteria by past records and hydrological analysis.
Monitoring -MO’s satellite data is used for flood warning for wide area.
-Rain and water level data are retrieved
after flood.
-Accuracy and reliability of forecast is not so high.
-Monitoring data cannot be used for forecast and warning.
-Acquire rain and water level data in real time manner using new monitoring system.
Institution -MOE is not involved in flood forecast.
-Very limited human resource in PDMC and MOE.
-No hydrological information is used for flood forecasting.
-A year round intensive monitoring is difficult.
-Establish FFWC in MOE.
-Execute intensive monitoring only in dry season.
Coordination - Monitoring data is not shared among institutions.
- Evacuation is made by local observation without rainfall data.
-Reliability of evacuation order is not so high.
-Share monitoring data by internet server in FFWC.
-Refer warning for evacuation activity.

The Study on Flood and Debris Flow in the Caspian Coastal Area focusing on the Flood-hit Region in Golestan Province
Supporting Report II (Feasibility Study)Paper V
Institutional and Regal Study
JICA CTI Engineering International Co., Ltd. V - 13
ANNEX 1 A DRAFT AGREEMENT ON FLOOD FORECAST AND WARNING IN GOLESTAN
Note: Following texts are provided only to serve as a draft of a proposal. It is expected to be reviewed and revised through discussion among involved institutions.
Submitted by PDMC
Signed by
Director of PDMC in Golestan
Director of MOE in Golestan Provincial Office
Director of MO in Golestan Provincial Office
Director of MORT in Golestan Provincial Office
Director of DOE in Golestan Provincial Office
Director of MOJA in Golestan Provincial Office
Director of I. R. Iranian Red Crescent in Golestan Provincial Office
Director of I. R. Iranian Broadcasting in Golestan Provincial Office
Date : 138X/**/**
0 Preamble
Recently major flood disaster occurred repeatedly in Golestan province, killing many people and causing significant damages to properties. It is expected that similar flood may happen again in the future. In order to ensure the evacuation to minimize human loss, with the memory of past experiences, the improved use of meteorological and hydrological monitoring data, and better preparation among institution, this agreement is established.
1 General
1.1. Objectives
The object of this agreement is to reduce human loss in Golestan Province, especially in National
Park.
1.2 Definition of terms
“Flood disaster” means disaster caused by mass of increased water due to heavy rain or snow in river that cause damage to human and properties.
“Monitoring data” means meteorological and hydrological data obtained by monitoring instruments.

Supporting Report II (Feasibility Study) Paper V Institutional and Regal Study
The Study on Flood and Debris Flow in the Caspian Coastal Area focusing on
the Flood-hit Region in Golestan Province
V - 14 CTI Engineering International Co., Ltd. JICA
“Flood forecast” means to forecast flood disaster, prior to its occurrence.
“Flood warning” means advice or order to evacuate from flood disaster.
“Warning criteria” means certain level of rainfall over specified time period or water level in river to evaluate decide flood disaster will occur.
2 Institutional arrangement
2.1 Institutions included
Parties included in this agreement in Golestan Province are Meteorology Organization, Ministry
of Energy, Provincial Disaster Management Center, Ministry of Road and Transportation, Police,
Red Crescent, I. R. Iran Broadcasting, and other necessary institutions.
3 Flood Forecast and Warning Center
3.1 Establishment of FFWC
Flood Warning Center shall be established in MOE. This is because MOE is designated as the
leading organization for flood disaster prevention in “Integrated national disaster prevention law”.
This center shall be transferred to PDMC when PDMC acquires sufficient fund, instruments, and
staffs with technical capability.
3.2 Resources in FFWC
FFWC has staffs for intensive monitoring, online data acquisition, internet servers, and
communication system to related institutions.
3.3 Function of FFWC
FFWC shall collect data from MO and MOE during rainy season by intensive monitoring in both
institutions. The common format for data sharing shall be agreed between MO and MOE.
Collected data shall be shared by internet server. When rainfall and water level reaches to the
criteria level, FFWC shall issue warning to related institutions.
4 Role of each institution during normal time
4.1 Installation of instruments
MO and MOE shall properly plan and install necessary monitoring equipment to ensure the
monitoring for the purpose of flood forecast and warning. Proper location and protection of
instruments shall be considered prior to the installation.
4.2 Maintenance of instruments
MO and MOE shall maintain monitoring equipment to ensure the monitoring for the purpose of
flood forecast and warning. The maintenance work shall be made periodically and preventively.

The Study on Flood and Debris Flow in the Caspian Coastal Area focusing on the Flood-hit Region in Golestan Province
Supporting Report II (Feasibility Study)Paper V
Institutional and Regal Study
JICA CTI Engineering International Co., Ltd. V - 15
4.3 Setting criteria of rain and water levels
MOE shall define criteria of rain and water levels for warning. The past monitoring results in
Golestan and results of JICA study and shall be used as a reference. The criteria shall be reported
to PDMC and be notified to related institutions.
4.4 Establishing an preparedness plan
Each organization shall establish a plan of emergency activities referring to the level of warning.
4.5 Installation of warning plates
MORT and DOE shall design and install warning plates in Golestan National Park to inform
passengers and tourists visiting the Park. The contents of the plate and location of the installation
shall be decided upon the consultation of PDMC.
5 Role of each institution during rain time
5.1 Intensive monitoring
MO and MOE start intensive monitoring during dry season in Golestan. Intensive monitoring
requires stand by of monitoring staffs in Gorgan office in MO and MOE, and data acquisition in
every hour by on-line. When rainfall starts, the time interval of monitoring shall be reduced to 10
minutes.
5.2 Data transmission
MO shall send rain data every 1 hour automatically to MOE.
5.3 Data sharing
MOE shall upload the monitoring data to the web server, and publish monitoring data via internet
to related organizations.
5.4 Issuing warning
When rainfall reaches the level specified in warning criteria, MOE shall report to PDMC. Then,
PDMC shall issue warning to related institutions.
5.5 Evacuation
Upon reception of warning from PDMC, related institutions shall start its assigned work for
evacuation.
6 Improvement of criteria and emergency plan
By accumulation and analysis of monitoring data, MOE shall revise the criteria to issues warning,
and notify the member institution at the provincial disaster management committee. Every
institution shall review its emergency plan once a year, and revise it if necessary.

SUPPORTING REPORT II (FEASIBILITY STUDY)
PAPER VI
Hydraulic Modeling


The Study on Flood and Debris Flow in the Caspian Coastal Area focusing on the Flood-hit Region in Golestan Province
Supporting Report II (Feasibility Study)Paper VI
Hydraulic Modeling
JICA CTI Engineering International Co., Ltd. VI - i
THE STUDY ON FLOOD AND DEBRIS FLOW IN THE CASPIAN COASTAL AREA
FOCUSING ON THE FLOOD-HIT REGION IN GOLESTAN PROVINCE
SUPPORTING REPORT II (FEASIBILITY STUDY)
PAPER VI HYDRAULIC MODELING
TABLE OF CONTENTS
Page
CHAPTER 1 INTRODUCTION..................................................................... VI-1
CHAPTER 2 OBJECTIVES ........................................................................... VI-1
CHAPTER 3 APPROACH.............................................................................. VI-2
CHAPTER 4 DATA COLLECTION ............................................................. VI-3
4.1 Digital Elevation Model (DEM) ................................................. VI-3
4.1.1 History of the DEM in the Project ................................. VI-4
4.2 Satellite Imagery ......................................................................... VI-5
4.3 Field Trips................................................................................... VI-5
4.3.1 Field Trip February 11 2005 .......................................... VI-5 4.3.2 Field Trip 14 August 2005 ............................................. VI-6
4.4 Cross-section Data and River Path from MoE............................ VI-8
4.4.1 Inconsistencies in the Elevations ................................... VI-8 4.4.2 Meeting with MoE 13 February 2005............................ VI-9 4.4.3 Omission of the MOE Data............................................ VI-10
4.5 Sediment Data ............................................................................. VI-11
4.6 Bridge Data ................................................................................. VI-13
CHAPTER 5 DEBRIS FLOW ........................................................................ VI-15
5.1 Calculation of the Debris Yield using the Los Angeles District Debris Method ........................................................................................ VI-17
5.2 Ribution in Time of the Debris Flow .......................................... VI-19
5.3 Particle Size Distribution of the Debris Flow ............................. VI-20
5.4 Timing of the Debris Flow and the Madarsoo Hydrograph ........ VI-20

Supporting Report II (Feasibility Study) Paper VI Hydraulic Modeling
The Study on Flood and Debris Flowin the Caspian Coastal Area focusing on
the Flood-hit Region in Golestan Province
VI - ii CTI Engineering International Co., Ltd. JICA
5.4.1 Longitudinal Distribution of the Debris......................... VI-21
CHAPTER 6 HYDRAULIC AND MORPHOLOGICAL MODELS.......... VI-24
6.1 Network ...................................................................................... VI-24
6.2 Cross-sections ............................................................................. VI-25
6.3 Boundary Conditions .................................................................. VI-26
6.3.1 Reservoir Water Level ................................................... VI-27
6.4 Bridges ........................................................................................ VI-27
6.5 Flow Resistance Calibration ....................................................... VI-29
6.6 Local Morphological Model ....................................................... VI-30
6.6.1 Local Boundary Conditions ........................................... VI-30 6.6.2 Simulation Period .......................................................... VI-31 6.6.3 Debris Inflow Source Points .......................................... VI-32 6.6.4 Sediment Transport Modeling and Calibration.............. VI-32
CHAPTER 7 SCENARIO SIMULATIONS.................................................. VI-34
7.1 Overall Flood Simulations .......................................................... VI-34
7.1.1 Flood Maps and Extent .................................................. VI-34 7.1.2 Animation of the 100 Year Flood .................................. VI-39
7.2 Local Debris Model Simulations ................................................ VI-39
7.2.1 Bed Levels and Water Levels ........................................ VI-39 7.2.2 Temporal Development of Debris Dams ....................... VI-41 7.2.3 Discharges; the Surging Effect ...................................... VI-42 7.2.4 Flood Maps and Comparison Maps 25, 50, 100 year .... VI-42 7.2.5 Animation of the 100 Year Flood .................................. VI-44 7.2.6 Uncertainties in the Morphological Model .................... VI-46
CHAPTER 8 CONCLUSIONS ................................................................................. VI-47
8.1 Task 1: Obtain and Review Data ................................................ VI-47
8.2 Task 2: Preliminary 1D Hydraulic Modeling ............................. VI-48
8.3 Task 3: Rainfall Runoff Modeling.............................................. VI-48
8.4 Task 4: Tributary Sediment Supply ............................................ VI-48
8.5 Task 5: 1D Hydraulic and Sediment Modeling .......................... VI-48
REFERENCES .................................................................................................... VI-50
LIST OF TERMS AND ABBREVIATIONS ............................................................. VI-51

The Study on Flood and Debris Flow in the Caspian Coastal Area focusing on the Flood-hit Region in Golestan Province
Supporting Report II (Feasibility Study)Paper VI
Hydraulic Modeling
JICA CTI Engineering International Co., Ltd. VI - iii
LIST OF TABLES
Table 4.1: Classification of the particle size distribution curves into three families. It is noted that our classification here is “ad hoc”. It is not the standard sizes for sand and gravel, but more tailored to what this particular study calls for.................................................................................................. VI-13
Table 4.2: Bridge geometries estimated from photos and drawings. ..................... VI-14
Table 5.1: Calculated debris yields (2001 flood) for the selected debris flow prone tributaries. ................................................................................... VI-18
Table 5.2: Calculated debris yield for each of the selected debris prone tributaries for the five different events (2001, 2005, 25, 50, 100 year).................. VI-18
Table 6.1: The 19 bridges included in the hydraulic model; road elevations and culvert inverts estimated from cross-sections. ...................................... VI-29
Table 7.1: Flooded area and volume in the flood maps.......................................... VI-34
LIST OF FIGURES
Figure 4.1: DEM provided by Iran Systems. The DEM is on a 5 m grid with grid sizes 12,606 x 2,709 grid cells, here divided into upstream and downstream parts for better graphical representation. .......................... VI-3
Figure 4.2: The DEM that was available when the DHI expert arrived in Gorgan in January 2005. The DEM has a grid cell size of 85.2019 m and 1429 x 976 grid cells. ............................................................................ VI-4
Figure 4.3: (top) 742 satellite image with a pixel size of 28.5 m and (bottom) Quick Bird satellite image with a pixel size of 60 cm........................... VI-5
Figure 4.4: 20 locations were obtained with GPS on the field trip conducted 11 February 2005. ...................................................................................... VI-5
Figure 4.5: View in upstream direction from Besholy Bridge (11 February 2005). The two classes of sediment are seen clearly here. ............................... VI-6
Figure 4.6: Field trip conducted on 14 August 2005. .............................................. VI-6
Figure 4.7: MoE survey data in the form of cross-sections and river path. There are 949 cross-sections and a length of the river of 91,592 m...... VI-8
Figure 4.8: Minimum bed levels from the MoE data and the Iran Systems DEM as function of chainage.......................................................................... VI-9
Figure 4.9: Sediment sample locations that could be identified from the report (JWRC, 2004). ...................................................................................... VI-11
Figure 4.10: Particle size distribution curves eyeballed from the sediment report by JWRC. The three families of curves are shown in thick lines.......... VI-12

Supporting Report II (Feasibility Study) Paper VI Hydraulic Modeling
The Study on Flood and Debris Flowin the Caspian Coastal Area focusing on
the Flood-hit Region in Golestan Province
VI - iv CTI Engineering International Co., Ltd. JICA
Figure 4.11: Median grain sizes of the (162) samples reported by JWRC after exclusion of the cohesive material (d<0.07 mm). ................................. VI-13
Figure 5.1: The area from Besholy and into Golestan Forest where the 11 debris flow prone tributaries are located. The applied DEM is the 25k DEM that was applied in the hydrological model, but not in the hydraulic models or flood mapping procedure. The isohyets applied in the hydrological model are also shown, and the coinciding high rainfall and debris flow proneness is obvious. .................................................................... VI-15
Figure 5.2: Debris yield for each drainage for the five scenarios (2001, 2005, 25, 50, 100 year). ............................................................. VI-19
Figure 5.3: Debris flow rates calculated with a=0.8 for the 2001 flood. ................. VI-19
Figure 5.4: Depth-Width curves for the cross-sections that the debris prone tributaries enter in the Madarsoo network (Iran Systems version). ...... VI-21
Figure 5.5: Calculated height of the debris deposit for each tributary for all five scenarios by assuming a triangular shape (a=6).................................... VI-22
Figure 6.1: The models employed in the study. The hydrological model ............... VI-24
(blue network) covers the whole catchment, while the hydraulic model (green network) covers the reach from Dasht to Golestan reservoir, and the morphological model (red network) covers a 21 km reach from middle of Golestan Forest to downstream of Besholy.......................................................... VI-24
Figure 6.2: Network and cross-sections used for the overall hydraulic model, extending from Dasht to Golestan reservoir. ........................................ VI-25
Figure 6.3: Minimum and maximum bed level in all 553 cross-sections from upstream to downstream (also shown are the locations of villages in this network). .................................................................................... VI-25
Figure 6.4: Locations of boundary conditions divided into open boundaries, tributary inflows and lateral inflows. .................................................... VI-26
Figure 6.5: Downstream cross-section and downstream water level ...................... VI-27
boundary condition. ........................................................................................................ VI-27
Figure 6.6: Backwater at 14 Metry Bridge, photo from 10 August 2005................ VI-28
Figure 6.7: Locations of the 19 bridges in the MIKE 11 model.............................. VI-28
Figure 6.8: Flood marker comparison (older version of the 50 year flood map). The flood markers cannot be used for calibration of the hydraulic model..................................................................................................... VI-30
Figure 6.9: Local morphological model here shown with network, cross-sections (same as for overall model), boundary conditions (same lateral inflows
The Study on Flood and Debris Flow in the Caspian Coastal Area focusing on the Flood-hit Region in Golestan Province
Supporting Report II (Feasibility Study)Paper VI
Hydraulic Modeling
JICA CTI Engineering International Co., Ltd. VI - v
as overall model) and 11 sediment inflow locations (F102B, F102, F03, F101B, F02, F01, T01, T03, T04, T06, T07)........ VI-30
Figure 6.10: Inflow time-series for each of the considered events at the upstream end of the local morphological model................................................... VI-31
Figure 6.11: Rating curve at the downstream end of the debris model. .................... VI-31
Figure 7.1: Division into three parts, from left “Floodplain”, “Valley” and “Golestan Forest”. ................................................................................. VI-34
Figure 7.2: Flood map for the 25 year event............................................................ VI-35
Figure 7.3: Flood map for the 50 year event............................................................ VI-36
Figure 7.4: Flood map for the 100 year event.......................................................... VI-37
Figure 7.5: Flood extent for each of the events. ...................................................... VI-38
Figure 7.6: Sequential development of the 100 year flood during 24 hours; maximum inundation shown at the bottom. .......................................... VI-39
Figure 7.7: Profile of simulated (100 year event) maximum water level and bed level with and without debris flow included. ........................................ VI-40
Figure 7.8: Simulated development of the debris deposit at F102B during the 100 year flood, shown at 1-hour intervals in the period from 9 August 22:00 to 10 August 06:00, bed levels in solid line, water levels in dashed lines with same color............................................................. VI-41
Figure 7.9: Time-series of simulated (100 year flood) debris deposit height (bed level - initial level) in the 11 debris deposits. ............................... VI-41
Figure 7.10: The simulated surging effect of the debris deposits for the 25, 50 and 100 year events...................................................................................... VI-42
Figure 7.11: Flood maps for each event with debris flow included, from top 25, 50 and 100 year flood event. ...................................................................... VI-43
Figure 7.12: Comparison maps (debris impact) for each flood event, from top 25, 50 and 100 year flood event. ...................................................................... VI-44
Figure 7.13: Dynamic development (4-hour interval) of the flood depth for the 100 year flood with debris flow included..................................................... VI-45
Figure 7.14: Dynamic development (4-hour interval) of the flood depth difference caused by debris for the 100 year flood, at the bottom corresponding to maximum inundation. Blue areas denote areas that are flooded when debris flow is included (“induced flooding”), while the darker red is for bigger difference.............................................................................. VI-45

The Study on Flood and Debris Flow in the Caspian Coastal Area focusing on the Flood-hit Region in Golestan Province
Supporting Report II (Feasibility Study)Paper VI
Hydraulic Modeling
JICA CTI Engineering International Co., Ltd. VI - 1
CHAPTER 1 INTRODUCTION
The present report is the Final Report for the Hydraulics and Sediment part of the Study.
CHAPTER 2 OBJECTIVES
The objectives of the DHI model study are to:
Construct a MIKE 11 hydraulic model that can dynamically simulate flashfloods taking place in the Madarsoo River from Dasht village to Golestan reservoir.
Apply the hydraulic model to produce flood maps for the 25 year, 50 year and 100 year flood events in the Madarsoo River from Dasht village to Golestan reservoir.
Quantify the hydraulic impact (extend of flood and flood depth) of debris flow in relevant tributaries along the Madarsoo River.

Supporting Report II (Feasibility Study) Paper VI Hydraulic Modeling
The Study on Flood and Debris Flowin the Caspian Coastal Area focusing on
the Flood-hit Region in Golestan Province
VI - 2 CTI Engineering International Co., Ltd. JICA
CHAPTER 3 APPROACH
To meet the objectives, we employ the following approach:
A MIKE 11 model network is defined for routing the floodwaters down through the Madarsoo. This network should represent the path of the floodwaters rather than the path of the river. In addition the DEM is not consistent with the available Quick Bird satellite images, so we chose to define the river network to be consistent with the DEM.
Cross-sections for the MIKE 11 model were drawn on top of the DEM using the river network and an extreme flood extend calculated with a 2D model. Survey cross-sections from MoE have to be omitted because the elevations are incompatible with the elevations in the DEM. The MIKE 11 model is hence purely based on the DEM.
Boundary conditions for the MIKE 11 hydraulic model have been calculated with a hydrological model (MIKE SHE) using rainfall and topography as well as routing through a MIKE 11 network. Boundary conditions were produced for the 25 year, 50 year, 100 year, 2001 and 2005 floods.
Calibration is very difficult for this model because it has to be used for extreme flood conditions where there is no water level data because the gauges are destroyed during these events. Calibration is therefore based on estimated values for the Manning n in a river and floodplain like this one.
Debris flow has been handled by using empirical formulas for the debris yield combined with assumptions about the distribution in time of the debris flow, resulting in time-series for the debris inflow, which are added as sediment point sources at the junctions with the debris carrying tributaries. The MIKE 11 model is then extended to include sediment transport, which results in the formation and erosion of debris deposits that impact the hydraulics. The impact of debris flow is quantified with this approach.
Flood maps are generated in MIKE 11 GIS, which translates the 1D hydraulic model into 2D maps of the floods. Flood maps are delivered for the 25 year, 50 year and 100 year floods, and local flood maps in the debris prone reach of the Madarsoo River are delivered along with comparison maps to quantify the hydraulic impact of debris flow.

The Study on Flood and Debris Flow in the Caspian Coastal Area focusing on the Flood-hit Region in Golestan Province
Supporting Report II (Feasibility Study)Paper VI
Hydraulic Modeling
JICA CTI Engineering International Co., Ltd. VI - 3
CHAPTER 4 DATA COLLECTION
4.1 Digital Elevation Model (DEM) The most important part of the data in a flood mapping project is the Digital Elevation Model (DEM) for the area to be mapped.
Figure 4.1: DEM provided by Iran Systems.
The DEM is on a 5 m grid with grid sizes 12,606 x 2,709 grid cells, here divided into upstream and downstream parts for better graphical representation.
The DEM that is used in the project is shown in Figure 4.1. The DEM was delivered by Iran Systems, and it was based on topographic maps combined with DGPS surveys taken in the downstream end (downstream of Kalaleh Bridge). Originally the DEM was supposed to have been made from the Quick Bird satellite images, but Iran Systems preferred to use a topographic map instead. Needless to say, the quality of the DEM is not at a level that would normally be demanded for flood mapping. Plenty of examples of the less satisfying quality can be found by inspecting the DEM in detail:
Discrepancy in the river path when comparing with satellite images
Presence of holes in the DEM in Golestan Forest (resulting in lakes formed in the forest)
Areas where there is no river
The shortcomings were discussed in progress reports written by the DHI expert, and there will be plenty of examples in this final report as well. However, this DEM is the best we have, and we will go with it.
10 examples of shortcomings in the DEM are given in Appendix A.

Supporting Report II (Feasibility Study) Paper VI Hydraulic Modeling
The Study on Flood and Debris Flowin the Caspian Coastal Area focusing on
the Flood-hit Region in Golestan Province
VI - 4 CTI Engineering International Co., Ltd. JICA
4.1.1 History of the DEM in the project
Other DEM versions were used in the project, and in the following will be given the DEM history for the project.
Figure 4.2: The DEM that was available when the DHI expert arrived
in Gorgan in January 2005. The DEM has a grid cell size of 85.2019 m and 1429 x 976 grid cells.
When the DHI expert arrived in Gorgan for the first input in January 2005, the only available DEM was an older MOJA DEM with a grid size of 85.2019 m, see Figure 4.2. This DEM was created from 20 m contours, which are of course much to coarse for flood mapping, but the DEM is still very impressive in terms of what it does resolve; it just does not resolve enough.
When the hydrologist from DHI arrived in June 2005 the old DEM had been replaced by a DEM apparently based on 1:25,000 maps. The DEM has some major deficiencies (among other things a major lake in the downstream end situated away from the terrace floodplain), and Iran Systems advised against using it. This DEM covers the whole basin (while the Iran Systems DEM only covers from Dasht and downstream), which is why it was the best choice for the hydrological modeling. Figures of this DEM can be found throughout this report; whenever a DEM shows the whole basin.
Iran Systems delivered their DEM on 22 August 2005. The DEM was analyzed by the DHI expert who concluded that the terrace floodplain was completely missing from the downstream end. Iran Systems had a survey team in the area, and they surveyed the terrace and came with a much improved DEM on 12 September 2005. This was the final DEM that was applied in the modeling work.

The Study on Flood and Debris Flow in the Caspian Coastal Area focusing on the Flood-hit Region in Golestan Province
Supporting Report II (Feasibility Study)Paper VI
Hydraulic Modeling
JICA CTI Engineering International Co., Ltd. VI - 5
4.2 Satellite imagery Two sets of satellite imagery are available, namely a set henceforth called “742” with pixel size 28.5 m and a new Quick Bird satellite image with pixel size 60 cm.
Figure 4.3: (top) 742 satellite image with a pixel size of 28.5 m and (bottom) Quick
Bird satellite image with a pixel size of 60 cm.
The images are shown in Figure 4.3.
4.3 Field trips The DHI expert participated in three field trips; though the first one was right on his very first day in Iran, and no data was collected. Field trips were conducted on 11 February and 14 August.
4.3.1 Field trip February 11 2005
The first field trip was conducted on February 11 2005. The locations visited are shown in Figure 4.4. Due to the snow cover in Golestan Forest, we could not get really good pictures of debris. We could not make specific estimates on the size of the material in the debris deposits. The material is clearly coarse, and the 54 mm that we have found from the sediment data may work satisfactorily.
Figure 4.4: 20 locations were obtained with GPS on the field trip
conducted 11 February 2005.
It was the intention to drive up to Dasht and start mapping the bridges from Dasht Bridge. However, the weather was bad, and supposedly with 2 meters of snow in the Dasht village. The police also patrolled the road up to Dasht in Golestan Forest and refused to let people pass without snow chains on the car.

Supporting Report II (Feasibility Study) Paper VI Hydraulic Modeling
The Study on Flood and Debris Flowin the Caspian Coastal Area focusing on
the Flood-hit Region in Golestan Province
VI - 6 CTI Engineering International Co., Ltd. JICA
Therefore the six upstream bridges could not be checked and verified. However, the AutoCAD files seem to be accurate in Golestan Forest, so we choose to take the six upstream bridges as correct.
Figure 4.5: View in upstream direction from Besholy Bridge (11 February 2005).
The two classes of sediment are seen clearly here.
The riverbed material has been confirmed divided into two classes, as the sediment data from JWRC (2004) also show, see Figure 4.5.
4.3.2 Field trip 14 August 2005
A second field trip was conduced on 14 August 2005 with the objectives:
Obtain location and geometry for Ajen Ghare Khajeh Bridge, which was not included in earlier versions.
Inspect the first bridge in Golestan Forest (from Tangrah).
Check other bridges along the way.
Obtain the location of the Madarsoo River in the downstream end along with estimated water levels (by GPS).
Obtain water levels as well as spillway levels in the reservoir to use for estimation of the error in the GPS elevations. This will allow a more accurate determination of the correct water levels and hence topography in the downstream end of the Madarsoo.
We also wanted to obtain the correct location of the river in the upstream part of Golestan Forest where the DEM and the survey data are very inconsistent. However, the road through Golestan Forest had only just been reopened, and it was only a temporary road, so this plan had to be abandoned.
Figure 4.6: Field trip conducted on 14 August 2005.
Sand/mud
Gravel

The Study on Flood and Debris Flow in the Caspian Coastal Area focusing on the Flood-hit Region in Golestan Province
Supporting Report II (Feasibility Study)Paper VI
Hydraulic Modeling
JICA CTI Engineering International Co., Ltd. VI - 7
The MoE river survey data seems to be generally accurate in the horizontal locations. However, the elevations in the downstream end cannot possibly be correct, and the explanation given by MoE in February 2005 (that the surveyed part of the river was part of the reservoir) was clearly not true. In fact, it seems in general that elevations in the downstream end go up and down almost randomly in the different data sources. This is clearly an area where we cannot trust any of the data sources. It is not known why it is so chronically difficult to measure elevations in the downstream end of Madarsoo.
Kalaleh Road from Tangrah Road up to Kalaleh Bridge was mapped with GPS on the way. The GPS mapping shows consistency between the road in shape format and the road as measured. The roads in general seem to be accurately mapped.
We arrived at Kalaleh Bridge and took GPS points at each end, though these GPS points have been taken before. Kalaleh Bridge withstood the onslaught from the 10 August 2005 flood, and we took three photos from the bridge.
From Kalaleh to Ajen Ghare Khajeh Bridge was a gravel road running fairly close to and parallel to Madarsoo River. Shape files are available with this road, and we confirm the accuracy of the road path in digital form.
Ajen Ghare Khajeh Bridge was not mapped in the field survey conducted 11 February 2005; it was assumed that there were no bridges between 14 Metry and Kalaleh. The existence of this bridge was confirmed, and we took the GPS point for the southern end (left bank of Madarsoo) and the middle of the bridge. The northern end of the bridge was destroyed during the flood, and a temporary road was under construction when we visited the site.
The gravel road down to Tangrah Road from Ajen Ghare Khajeh Bridge was mapped and the mapping was found to be consistent with the existing digital format that we have for this road.
GPS points were taken along Tangrah road, and again we conclude that there is consistency with the road that we already have in digital form.
In Golestan Forest GPS points were again consistent with the road that we have in digital form. The location of a debris fan was marked for future reference (MIKE 11 modeling).
In an attempt to reach the downstream part of Madarsoo, we ended in the downstream part of Golestan reservoir; at Golestan Dam. This turned out to not be such a bad idea after all, as we could obtain elevations of the spillway and reservoir water level. The GPS readings were:
Reservoir water level according to GPS 67 m
Spillway level according to GPS 73 m
The GPS is not very accurate on the elevation, but the error seems to be consistent and about 10 m (the GPS elevation is about 10 m too high). The actual elevation of the spillway is 63 m, and the water level is being obtained from MoE, which had not been received yet as this report was submitted; this data was never received.
We had to turn back to Kalaleh Bridge from the Golestan Dam, cross the bridge and drive towards the downstream end of Madarsoo along the right bank of the river. The road was mapped along the way, and again we found consistency.
The most important objective of this field trip was to verify that the MoE cross-section elevations in the downstream end were incorrect. Locations were visited in the downstream end, as shown in Figure 4.6, and we found no indication that the downstream end would be part of the reservoir. Elevations from the GPS, albeit uncertain, confirmed this. The field trip lead safely to the conclusion that the MoE cross-section elevations are wrong, and that the MoE data should be discarded, as explained in the following section.

Supporting Report II (Feasibility Study) Paper VI Hydraulic Modeling
The Study on Flood and Debris Flowin the Caspian Coastal Area focusing on
the Flood-hit Region in Golestan Province
VI - 8 CTI Engineering International Co., Ltd. JICA
4.4 Cross-section data and river path from MoE The MoE data (AutoCAD and Excel format) was among the first data sets received by the DHI expert in the project. The AutoCAD data (Figure 4.7) was transformed to dxf format and then imported to ArcView, while the distance-level tables for the cross-sections were provided in several Excel sheets that were imported by writing a small program that took the tables from Excel through html to a cross-section ASCII file compatible with MIKE 11.
Figure 4.7: MoE survey data in the form of cross-sections and river path.
There are 949 cross-sections and a length of the river of 91,592 m.
The MoE cross-section survey was fairly detailed with 949 cross-sections obtained along the Madarsoo, and the cross-sections contained both river channel and part of the floodplain. Figure 4.7 shows the cross-section lines and the network extracted from the MoE data.
4.4.1 Inconsistencies in the elevations
The MoE cross-sections gave rise to some in-depth analyses, as the minimum bed level in the downstream end was about 46 m according to the data, while the spillway elevation for Golestan Dam is 62 m. Hence, according to the MoE data, the river bed is 16 m below the spillway elevation in the downstream end of Madarsoo. Furthermore the water level in Golestan reservoir during the 2001 flood varied from 57-63 m, and all elevations in the downstream end of Madarsoo are below 57 m according to the MoE data.
An old DEM was available at that time, and it was found that the elevations in that DEM matched well with the reservoir elevation data. Hence there was a clear discrepancy between the DEM and the MoE data. This analysis was conducted also for the final DEM from Iran Systems, and with the same conclusion.

The Study on Flood and Debris Flow in the Caspian Coastal Area focusing on the Flood-hit Region in Golestan Province
Supporting Report II (Feasibility Study)Paper VI
Hydraulic Modeling
JICA CTI Engineering International Co., Ltd. VI - 9
0100200300400500600700800900
1,000
0 20,000 40,000 60,000 80,000
Chainage (m)
Ele
vatio
n (m
)
-50-40-30-20-1001020304050
Diff
eren
ce (m
)
MoE sections from Final5mMoE Min Level (m)Difference (m)
Figure 4.8: Minimum bed levels from the MoE data and the Iran Systems DEM
as function of chainage.
Comparison between the MoE cross-section elevations and the elevations in the Iran Systems DEM is given in Figure 4.8. The discrepancy is significant with the Iran Systems (DGPS) elevations up to 30 m higher than the MoE elevations in the downstream end (and a generally large discrepancy).
4.4.2 Meeting with MoE 13 February 2005
A meeting was held with MoE on 13 February 2005:
The JICA study team (Mr. Morishita and Dr. Søren Tjerry) explained the discrepancy between the DEM and the x-sections, and how the water level in the reservoir combined with the horizontal area of the reservoir strongly suggest that the x-section elevations are incorrect.
MoE correctly pointed out that the resolution (85 m cell size, 20 m contours) in the DEM is poor. We can only agree to this, but the resolution is good enough to capture the downstream wide floodplain with at least 10 grid points across.
The reservoir water level from 57-63 m during the 2001 flood was agreed upon, and MoE further provided the information that the spillway level for the reservoir is 62 m.
The JICA team explained that the reservoir level of 57-63 m matches with the DEM such that x-sections extracted from the DEM will have dry floodplains before the 2001 flood and inundated floodplains during the flood peak of 2001.
MoE claim that the x-sections from D6091-D6041 are in fact in the reservoir, and therefore under water, also before the 2001 flood peak.
This we were not able to dispute at this stage of the project, and we would therefore have to return to this issue later, when we got a better DEM. We were very surprised to hear this because none of the data we have available suggest that it be the case. For instance the Golestan reservoir can be seen clearly from the satellite images we have, and it does not migrate up into the Madarsoo, which can of course be explained by a low water level in the reservoir when the survey was done. Also, the Madarsoo River is marked very clearly in the downstream end where MoE claim it is in fact reservoir. We find if difficult to believe that a x-section survey would actually be performed in the manner it has been performed, and that the river course would be mapped clearly, if the area is in reality reservoir.
Supporting Report II (Feasibility Study) Paper VI Hydraulic Modeling
The Study on Flood and Debris Flowin the Caspian Coastal Area focusing on
the Flood-hit Region in Golestan Province
VI - 10 CTI Engineering International Co., Ltd. JICA
There are several other approaches we can take for clarifying the situation: Aerial photos, reservoir water level over a longer time period, reservoir level-area characteristics, field visit to the D6041 x-section location etc.
However, we would wait for the new DEM before we could pursue this issue. Needless to say, it would be by far the most optimal situation if the x-section survey elevations are indeed correct, and the (temporary) DEM incorrect.
Later analyses showed that it was the MoE cross-section data that had the wrong elevations. In fact the downstream part of Madarsoo seems to be notorious in terms of elevation errors.
4.4.3 Omission of the MoE data
It is not a difficult decision to make that the MoE data should be discarded in the modeling work:
Such large elevation discrepancies are unacceptable in flood mapping, and we do not have a DEM that matches the MoE data, while we can produce cross-sections (from the DEM) that match the DEM.
The MoE cross-sections do not cover the whole floodplain, so they do not account for the whole conveyance anyway.
The MoE location of the river is not consistent with the DEM, i.e. the low elevations in the DEM (where the river is located according to the DEM) do not match with the locations in the MoE data.
Instead of using the MoE data, we will extract cross-sections from the Iran Systems DEM, which gives full consistency between the DEM and cross-sections and allows covering the whole floodplain. In addition the river network was digitized from the DEM to ensure consistency. It is at this point irrelevant whether the MoE data or the Iran Systems data is wrong (at least one of the data sets is wrong, perhaps both); the primary issue is to have consistency between the DEM and cross-sections, and that can only be achieved by omitting the MoE data.

The Study on Flood and Debris Flow in the Caspian Coastal Area focusing on the Flood-hit Region in Golestan Province
Supporting Report II (Feasibility Study)Paper VI
Hydraulic Modeling
JICA CTI Engineering International Co., Ltd. VI - 11
4.5 Sediment data A report from “Jahad Water and Watershed Management Company” (JWRC, 2004) was received on 8 February 2005.
Figure 4.9: Sediment sample locations that could be identified from the report
(JWRC, 2004). The sediment sample locations that could be identified from the report are shown in Figure 4.9. Series Ko is taken just upstream of Kalaleh Bridge, series D at 14 Metry Bridge, series S at the diversion (intake), series T at Tergily and series P at Tangrah. None of the sediment samples seem to be riverbed samples. The samples seem to be all borehole samples, taken at different depth, and indeed the report is about geo-technical issues. The sample locations are mostly riverbank and floodplain. We could not detect any general difference between samples taken in the riverbank and from the floodplain. Some sediment samples contain a lot of cohesive material, which we will ignore in this study because the cohesive material will only be eroded, and transported downstream (and deposited in Golestan reservoir). Maps are given with locations of sample series P, T, A, Ko, S, SH, D, GH, see Figure 4.9. Some of these are with poor reference of the coordinate system (A, SH, D, GH). No locations are given for sample series L and K.

Supporting Report II (Feasibility Study) Paper VI Hydraulic Modeling
The Study on Flood and Debris Flowin the Caspian Coastal Area focusing on
the Flood-hit Region in Golestan Province
VI - 12 CTI Engineering International Co., Ltd. JICA
0
10
20
30
40
50
60
70
80
90
100
0.01 0.1 1 10 100 1000d (mm)
Perc
ent
A-1-1 A-1-2 A-1-3 A-1-4 A-1-5 A-1-6A-1-7 A-1-8 A-1-9 A-1-10 A-2-1 A-2-2A-2-3 A-2-4 A-3-1 A-3-2 A-3-3 A-3-4A-3-5 A-3-6 A-3-7 A-3-8 A-3-9 A-3-10A-4-1 A-4-2 A-4-3 A-4-4 A-4-5 A-4-6A-5-1 A-5-2 A-5-3 A-5-4 A-6-1 A-6-2A-6-3 A-6-4 A-6-5 A-6-6 A-6-7 A-6-8A-7-1 A-7-2 A-7-3 A-7-4 A-7-5 A-7-6A-7-7 D-1-1 D-1-2 D-1-3 D-1-4 D-1-5D-2-1 D-2-2 D-2-3 D-2-4 D-2-5 D-3-1D-3-2 D-3-3 D-3-4 D-3-5 D-4-1 D-4-2D-4-3 D-4-4 D-5-1 D-5-2 D-5-3 D-5-4D-6-1 D-6-2 D-6-3 GH-1-1 GH-1-2 GH-1-3GH-2-1 GH-2-2 GH-2-3 GH-3-1 GH-3-2 K-1-B-1K-1-B-2 K-2-B-1 K-2-B-2 Ko-1-1 Ko-1-2 Ko-1-3Ko-1-4 Ko-1-5 Ko-1-6 Ko-2-1 Ko-2-2 Ko-2-3Ko-2-4 Ko-2-5 Ko-2-6 Ko-2-7 Ko-2-B-1 Ko-2-B-2L-1-B-1 L-1-B-2 L-2-B-1 L-2-B-2 P-1-1 P-1-2P-1-3 P-1-4 P-1-5 P-1-6 P-1-7 P-2-1P-2-2 P-2-3 P-3-1 P-3-2 P-3-3 P-4-1P-4-2 P-4-3 S-1-1 S-1-2 S-2-1 S-2-2S-2-3 S-3-1 S-3-2 S-3-3 SH-1-1 SH-1-2SH-2-1 SH-2-2 SH-2-3 SH-2-4 SH-2-5 SH-3-1SH-4-1 SH-4-2 T-1-1 T-1-2 T-1-3 T-1-4T-1-5 T-1-6 T-1-7 T-1-8 T-1-9 T-1-10T-1-11 T-1-B-1 T-1-B-2 T-2-1 T-2-2 T-2-3T-2-4 T-2-5 T-2-B-1 T-2-B-2 T-3-1 T-3-2Sand Coarse sand Gravel
Figure 4.10: Particle size distribution curves eyeballed from the sediment report
by JWRC. The three families of curves are shown in thick lines.
The particle size distribution curves were roughly estimated from the report; see Figure 4.10. The curves clearly fall in two primary categories:
Large cohesive fraction, non-cohesive material is sand with median grain size 0.1-0.2 mm
No (or very little) cohesive material, non-cohesive material is gravel (cobble is not very frequent) with median grain size from 5-300 mm
A third family of curves is found with mixtures of these two main variations. This third family does not occur as frequently, as the two main variations.

The Study on Flood and Debris Flow in the Caspian Coastal Area focusing on the Flood-hit Region in Golestan Province
Supporting Report II (Feasibility Study)Paper VI
Hydraulic Modeling
JICA CTI Engineering International Co., Ltd. VI - 13
0.1
1
10
100
1000
0 20 40 60 80 100 120 140 160
Sample (#)
Med
ian
grai
n si
ze (m
m)
A D GH K Ko L P S SH T
Figure 4.11: Median grain sizes of the (162) samples reported by JWRC after
exclusion of the cohesive material (d<0.07 mm). Table 4.1: Classification of the particle size distribution curves into three families.
It is noted that our classification here is “ad hoc”. It is not the standard sizes for sand and gravel, but more tailored to what this particular study calls for.
Class Size range Samples Median
Fine-medium sand < 1 mm 54% 0.17 mm
Medium-coarse sand to fine gravel 1 – 10 mm 8% 4.2 mm
Fine-coarse gravel to cobble > 10 mm 38% 54 mm
The median grain size for each sample was derived for the non-cohesive part, and plotted for each sample (with sample number on the x-axis) in Figure 4.11. As already found from the particle size distribution curves, there are two primary families of curves, which yield two distinct median grain sizes. First grain size is below 1 mm size, second above 10 mm, while a third (less pronounced) median grain size is found with sizes in the range 1-10 mm. The median grain sizes are reasonably subjected to averaging in the families; see Table 4.1.
It is noted that we have chosen a classification based on the data rather than on standard limits. If e.g. putting all that classifies as sand into one group, the average grain size for the sand fraction would become 0.69 mm, which is not reasonable considering that the data shows very clearly that the grain sizes from 0.1-0.2 mm are very dominating.
At this point in the study it is suggested to discard the coarse sand fraction, as it does not come out clearly from the median grain size curve. It is especially the T-series (Tergily village) that contains the coarse sand.
4.6 Bridge data Bridges geometries were estimated from photos, MoE AutoCAD drawings and MoE cross-section. Elevations (riverbed and deck) were estimated from the DEM to ensure compatibility. Bridge deck elevations could have been obtained from e.g. the MoE AutoCAD

Supporting Report II (Feasibility Study) Paper VI Hydraulic Modeling
The Study on Flood and Debris Flowin the Caspian Coastal Area focusing on
the Flood-hit Region in Golestan Province
VI - 14 CTI Engineering International Co., Ltd. JICA
drawings, but this would have resulted in incompatible elevations, resulting in either no or overestimated backwater.
Table 4.2: Bridge geometries estimated from photos and drawings. Name
Length (m)
Amount
Diameter (m)
Width (m)
Height (m)
Dasht Bridge 14 10 1 Existing Bridge 14 10 1 Existing Bridge 14 10 1 Existing Bridge 14 10 1 Existing Bridge 14 10 1 Existing Bridge 14 10 1 Existing Bridge 14 10 1 Existing Bridge 14 10 1 Existing Bridge 14 10 1 Existing Bridge 14 10 1 Existing Bridge 14 10 1 Mosque Bridge 6 1 20 5 Besholy Bridge 5 2 5 5 Loveh Bridge 6 1 30 5 Agha Mish Bridge 6 1 15 5 14 Metry Bridge 12 1 Arch 7 Culverts 10 7 1.2 2 Ajen Ghare Khajeh 6 4 10 4 Kalaleh Bridge 12 4 14 6
A special procedure was applied at 14 Metry Bridge to ensure proper description of the arch opening in the bridge.

The Study on Flood and Debris Flow in the Caspian Coastal Area focusing on the Flood-hit Region in Golestan Province
Supporting Report II (Feasibility Study)Paper VI
Hydraulic Modeling
JICA CTI Engineering International Co., Ltd. VI - 15
CHAPTER 5 DEBRIS FLOW
Takahashi (1991) gives the theoretical background for debris flow, but for the practical application in this project a literature search using Google was preferred.
The calculation of debris flow is given as Task 3 in the Scope of Work (Appendix A). Originally it was anticipated that the calculation would be carried out with MIKE Basin. However, the methods available in MIKE Basin are for finer sediments, and not the very coarse material that characterizes debris flow.
Figure 5.1: The area from Besholy and into Golestan Forest where the 11 debris
flow prone tributaries are located. The applied DEM is the 25k DEM that was applied in the hydrological model, but not in the hydraulic models or flood
mapping procedure. The isohyets applied in the hydrological model are also shown, and the coinciding high rainfall and debris flow proneness is obvious.
The objectives are to produce debris flow time-series for use in sediment point sources in the MIKE 11 ST model, while the particle size distribution was determined from the sediment samples in Section 4.5. To meet the objectives the following approach was taken:
Identify all tributaries that can produce debris flow. The classification applied here is simply that any tributary with a history of debris flow is debris prone.
For each debris flow prone tributary, determine debris total volume for each event (m3) from an accepted empirical formula and translate it to a debris flow time-series (m3/s), assuming some relation to the tributary discharge.
Add the debris flow time-series to a point source in the MIKE 11 ST model.
Assume that the given debris yield for a tributary will always apply, i.e. a debris prone tributary will always give exactly the debris volume calculated with the selected empirical formula for the considered flood event.

Supporting Report II (Feasibility Study) Paper VI Hydraulic Modeling
The Study on Flood and Debris Flowin the Caspian Coastal Area focusing on
the Flood-hit Region in Golestan Province
VI - 16 CTI Engineering International Co., Ltd. JICA
Figure 5.1 shows the eleven locations where debris flow took place during the 2001 flood. These eleven tributaries were selected as debris prone, and debris flow time-series were calculated for each tributary.
For the debris location at the junction with Kondoskooh River we will assume that the debris flow takes place in the F101B tributary, and for T01 and T02 we will assume that the debris flow originates in T01. However, for the sake of completeness we calculate the debris flow for all relevant tributaries in the debris flow range, except for Kondoskooh River.
The approach we apply is essentially to assume that any tributary with a history of debris flow will produce debris flow in each of the scenarios, and it will produce debris flow according to a deterministic formula. We are hence producing the “worst case” map for the flooding impact of debris flow. The debris events are, however, to a large degree independent, and hence there is no accumulated worst case effect, except on the surging discharge.
According to the literature on the subject, debris flow contains 75% gravels and boulders. This excludes the use of a soil erosion model (MIKE BASIN), which was originally intended for the study. Instead we pursued the possibility of using simpler catchment erosion formulas or whatever we can find to calculate the sediment yield.
The occurrence of debris flow in a tributary is a highly stochastic event, which depends on things like the catchment size, slope, rainfall, geology, and the history of events in the tributary catchment.
The material that is blown out of a tributary during a debris flow event has been collected over time in the lower reaches of the catchment. Therefore a specific debris flow event may not be dependent on the sediment yield of the tributary, though a higher yield will increase the frequency and/or magnitude of debris flow events. A specific debris flow event would in fact be more a function of the debris storage capacity in the catchment.
There are several tributaries that can produce debris flow along the Madarsoo. The stochastic nature of the debris flow calls for attention in the modeling process. However, we can make reasonable assumptions about the debris flow events.
Debris flow events are obviously functions of what happens in the local tributary catchment. Hence, debris flow events are independent occurrences, though it is likely that they occur simultaneously (namely during floods). But they do not occur simultaneously because of any interdependency.
The hydraulic impacts of debris flow events are also independent for another reason. We will assume that the debris flow events are so localized that the associated flooding does not reach any other debris flow event area. This is obviously a fully reasonable assumption for this study, and it means that we do not have to ever consider different combinations of debris flow events in the modeling process. Such combinations, though they sound intriguing, are simply a waste of time because the combination will have the same result as the combination of the individual events. Due to this there are only two combinations in total to consider for the modeling work:
All tributaries blow out
No tributaries blow out
Combinations where some tributaries blow out, while others do not, are not necessary to consider because that particular combination is already implicitly contained in the combined results for the two considered cases.
It is noted that even in the advent that debris flow events were dependent, while the associated flooding were independent, the dependency would still be ignored because the flooding associated with each blow out could still be treated as separate.

The Study on Flood and Debris Flow in the Caspian Coastal Area focusing on the Flood-hit Region in Golestan Province
Supporting Report II (Feasibility Study)Paper VI
Hydraulic Modeling
JICA CTI Engineering International Co., Ltd. VI - 17
It is envisaged that time-series be created for each tributary with (as shown by Mr. Kawakami a tributary is traditionally on the “debris flow list” if it has had debris flow events in the past, and then it stays on the “list”) debris flow record. Some variation in the debris flow can be added each tributary, so more events can be simulated, i.e. low, normal and extreme debris flow event. Still, the events can be treated in groups, e.g. no tributary blow out, all blow out, all blow out with extreme events, and all blow out with low events.
A lesser degree of this pure independency may be applied if we find that some tributaries are very close in proximity. In that case the very closely spaced tributaries may produce interdependent flooding that becomes worse if the two tributaries blow out simultaneously (never the case for independent blow outs), which can be handled by adding combinations only with the adjacent tributaries, while keeping all other tributaries independent. We do not expect to find any cases of this.
It was argued that debris flow events are independent events for two reasons. First of all the debris flow in a tributary does obvious not depend on what happens in other, even adjacent, tributaries. Second, and most important, the flooding (backwater) associated with a tributary blow out will be considered isolated from the rest of the flooding. This is a very good assumption on a steep river like Madarsoo. This independency means that we can treat tributary debris flow events in “groups”. In the basic approach there are only two such groups: 1) All tributaries blow out and 2) No tributaries blow out. These two groups contain implicitly all combinations of events. The impact of this independency in terms of modeling work is enormous, as combinations of tributary events do not have to be considered.
5.1 Calculation of the debris yield using the Los Angeles District Debris Method
The Los Angeles District (February 2000) Debris Method is described in the document www.spl.usace.army.mil/resreg/htdocs/DebrisMethod.pdf. The Los Angeles District debris yield formula is given for different catchment areas, but most of the debris flow prone tributaries fall within the 3-10 mi2 (7.8-25.9 km2) range where the formula is given by:
FFARRQDy 22.0log04.0log53.0log85.0log 10101010 +++= Where: Dy Debris yield (yd3/mi2) Q Unit peak runoff (ft3/s/mi2) RR Relief ratio (ft/mi) A Drainage area (acres) FF Fire factor
The formula can be rewritten into the perhaps easier to understand expression: 04.053.085.066.1 ARRQDy FF=
The expression does not imply a highly non-linear phenomenon; the debris flow is close to (not even) proportional to the discharge, which is the only parameter that will vary between different scenarios (same slope, drainage and fire factor). The US Army Corps points out that the formula is only fully valid for California. However, we will assume that the order of magnitude is accurate enough for Madarsoo river basin.
The formula is only valid for drainage areas 3-10 mi2. A separate formula is given for watersheds smaller than 3 mi2, but it is based on the maximum 1-hour precipitation rather than the unit discharge, and we know almost nothing about the maximum 1-hour precipitation. Therefore we will allow the 3-10 mi2 formula to be applied for all watersheds in the catchment.
The Fire Factor is very important for debris flow in California. We will assume that fire has no impact on the debris flow in the Madarsoo river basin, which is reasonable, and use a fire

Supporting Report II (Feasibility Study) Paper VI Hydraulic Modeling
The Study on Flood and Debris Flowin the Caspian Coastal Area focusing on
the Flood-hit Region in Golestan Province
VI - 18 CTI Engineering International Co., Ltd. JICA
factor of 3 everywhere (3 seems to be the lowest value). The Fire Factor can vary from 3-6, and the equation shows that a Fire Factor of 4 yields 1.66 (100.22) times more debris flow than a Fire Factor of 3.
As is also evident from the Los Angeles Debris Method the primary factors in the debris yield are the peak discharge and slope. Translating this to the Madarsoo River we find that the debris prone tributaries are concentrated in the area with intense rainfall and high slope.
Table 5.1: Calculated debris yields (2001 flood) for the selected debris flow prone tributaries.
Drainage 2001 peak (m3/s)
Area (km2)
Max elev.(m)
Min elev.(m)
Length (m)
Yield (m3)
F102B 25 13.7 1,680 578 6,876 70,557 F102 31 12.7 1,943 546 8,717 83,524 F03 31 16.1 1,870 498 8,390 88,306 F02 8 4.9 1,092 500 3,119 24,099 F01 6 2.9 913 487 2,311 16,838 T03 2 0.5 714 432 1,242 5,287 T04 4 2.1 1,078 423 2,401 13,807 T06 7 3.6 1,150 389 3,301 22,501 T07 9 8.1 1,080 369 4,671 26,079 T02 34 23.9 1,448 600 8,737 78,098 T01 32 28.5 1,447 440 12,835 68,507 F101B 26 10.0 1,270 488 7,807 53,596 F101A 15 6.6 1,806 620 4,698 50,641
Table 5.2: Calculated debris yield for each of the selected debris prone
tributaries for the five different events (2001, 2005, 25, 50, 100 year).
Drainage 25 year (m3)
50 year (m3)
100 year (m3)
2001 (m3)
2005 (m3)
F102B 55,877 67,426 82,385 70,557 50,836 F102 64,807 80,537 98,861 83,524 60,712 F03 68,517 84,660 102,637 88,306 63,675 F02 18,871 24,610 30,366 24,099 18,871 F01 14,421 18,023 21,731 16,838 13,434 T03 4,140 5,197 6,391 5,287 3,904 T04 10,812 14,392 17,819 13,807 11,117 T06 18,330 23,318 29,430 22,501 17,762 T07 20,550 25,338 31,645 26,079 19,777 T02 61,156 75,356 92,138 78,098 56,848 T01 53,646 66,682 81,757 68,507 50,398 F101B 42,883 52,543 64,620 53,596 40,317 F101A 41,892 51,501 62,741 50,641 38,605
The formula was applied for the 2001 flood in which we extracted the peak flow from the MIKE 11 hydraulic results, estimated the catchment area in ArcView, and found the elevations and length in the MIKE 11 network. The data was inserted into a spreadsheet, and the debris yield was calculated for each of the tributaries.
The resulting debris yields for the 2001 flood are shown in Table 6.1. The debris yield ranges from 5-88 thousand m3, where the upper values of the yield correspond to what we have calculated that the debris yield should be to have a significant impact on the Madarsoo flood maps.

The Study on Flood and Debris Flow in the Caspian Coastal Area focusing on the Flood-hit Region in Golestan Province
Supporting Report II (Feasibility Study)Paper VI
Hydraulic Modeling
JICA CTI Engineering International Co., Ltd. VI - 19
0
20,000
40,000
60,000
80,000
100,000
F102B
F102
F03 F02 F01 T03 T04 T06 T07 T02 T01
F101B
F101A
Drainage
Deb
ris y
ield
(m3 )
25 year
50 year debris
100 year debris
2001 debris
2005 debris
Figure 5.2: Debris yield for each drainage for the five scenarios
(2001, 2005, 25, 50, 100 year).
Table 5.2 shows the tabulated debris yields for each tributary and each scenario, while the same is shown in a bar graph in Figure 5.2.
5.2 ribution in time of the debris flow The distribution in time of the debris flow was modeled by assuming that the debris flow rate (m3/s) could be related to the water flow rate (m3/s), i.e. Qdebris = f(Qwater). The distribution in time has some influence on how much the debris flow will impact flooding; clearly a debris flow very concentrated in time will result in more flooding, but it should also be realistic. The debris flow rate was assumed to relate to the discharge in the manner:
))1(
)(,0max()(
max
max
QaaQtQ
tQs −−
≈
Where Qmax is the peak discharge and Q(t) the hydrograph. This is simply a scaling where we assume that the debris flow is proportional to the discharge minus “a” times the peak discharge; it concentrates the debris flow in the time period where the discharge is above “a” times the peak flow. The maximum of the given function is unity (when Q(t)=Qmax), and the debris flow rate is scaled to match the debris yield.
02468
1012
10-Aug21:00
10-Aug22:00
10-Aug23:00
11-Aug00:00
11-Aug01:00
11-Aug02:00
11-Aug03:00
11-Aug04:00
Date (2001)
Deb
ris fl
ow ra
te (m
3 /s)
020040060080010001200
Dis
char
ge (m
3/s)
F102Bm F102m F03m F101BmF02m F01m T01m T03mT04m T06m T07m 2001 upstream
Figure 5.3: Debris flow rates calculated with a=0.8 for the 2001 flood.

Supporting Report II (Feasibility Study) Paper VI Hydraulic Modeling
The Study on Flood and Debris Flowin the Caspian Coastal Area focusing on
the Flood-hit Region in Golestan Province
VI - 20 CTI Engineering International Co., Ltd. JICA
The debris flow time-series calculated with the method are shown for the 2001 flood in Figure 5.3. It is seen that the debris flow rate goes up to about 11 m3/s, which is of course for the F03 tributary. A value of a=0.8 was used for the calculations of debris flow.
The inflow at the upper boundary (Dasht) is also shown for reference. The timing is seen to be different (the debris flow arrives before the main flood peak), which has important implications for how to model the debris deposits, which is explained in a later section.
5.3 Particle size distribution of the debris flow We will assume that the debris flow has the average particle size distribution that we found from the analysis of the sediment data (JWRC, 2004), which resulted in:
58% sand 0.17 mm
42% gravel 54 mm
These were also reported by DHI (February 2005).
For the present application the debris is assumed to be only the coarse sediment, while the fine fraction is available in the river channel.
5.4 Timing of the debris flow and the Madarsoo hydrograph The debris flow prone tributaries in the Tangrah area have their peak about 2 hours before the Madarsoo, see Figure 5.3. This has major implications for how to model the debris flow.
The first point we need to make clear is that the debris flow will surely be timed with the flow in the tributary from which it originates. Therefore the debris flow will take place before the Madarsoo discharge peaks, and hence there will be a deposit of rocks and boulders created in the river valley before the Madarsoo flood peak arrives.
As described by DHI (February 2005) the grid spacing is not important, as long as the grid is fine enough, when the debris deposit is eroded right when it enters the Madarsoo. The reason is that the local sediment transport will instantly adjust to be able to transport the debris flow due to the lower water depth (that will keep decreasing until the transport capacity is up to the debris inflow).
However, the situation is different than originally anticipated. The debris deposit is not eroded immediately because the Madarsoo discharge is still fairly low when the debris flow arrives. The debris deposit is therefore not likely to be eroded much initially, and therefore the grid spacing will have a decisive impact on the height of the debris deposit.
What is missing here is the initial longitudinal shaping of the deposit. Clearly the debris will not form a tower with the width (W) of the river, a longitudinal extend equal to the grid spacing (Δx), and a height of H=Volume/W/Δx, as will be the case when the debris deposit is added as a point source. For a grid spacing of 10 m and a width of 200 m, a debris deposit of 100,000 m3 would be 50 m tall. Again, this would not be an issue if the debris flow was timed with the Madarsoo hydrograph, as we demonstrated earlier.
There is also a numerical perspective involved here. The simulations with all debris flow added to one single point show the debris input literally acts as a shock in the numerical solution, and it was very difficult to avoid this behavior. The tendency was that the debris would form a plug that the river could not follow and the result would be no sediment transport locally at the debris deposit and hence the deposit would grow and grow. This is a numerical problem, but it is nonetheless very relevant in the model application.
Physically it is not reasonable to have a deposit that is only (Δx=) 10 m wide, as the width of the tributary itself will distribute the sediment longitudinally in Madarsoo along with sliding of the sediment.

The Study on Flood and Debris Flow in the Caspian Coastal Area focusing on the Flood-hit Region in Golestan Province
Supporting Report II (Feasibility Study)Paper VI
Hydraulic Modeling
JICA CTI Engineering International Co., Ltd. VI - 21
5.4.1 Longitudinal distribution of the debris
A reasonable shape of the debris deposit is a triangular shape in the longitudinal direction with height H, width W and length L. The volume of the debris deposit hence becomes:
HWLVol21
=
The Length/Height ratio is now called α, and we rewrite the equation into:
WVolHα2
=
It is the Length/Height ratio that becomes unrealistic when adding all the sediment to a single point when the grid spacing is low (which it needs to be). Therefore we now instead take direct control of the Length/Height ratio.
In the following the formula is applied for all the debris tributaries in an iterative calculation.
0
100
200
300
400
500
0 2.5 5 7.5 10 12.5 15 17.5 20
Depth (m)
Wid
th (m
)
F102B F102 F03F101B F02 F01T01 T03 T04T06 T07
Figure 5.4: Depth-Width curves for the cross-sections that the debris
prone tributaries enter in the Madarsoo network (Iran Systems version).
The width is determined from the cross-sections located at the connections to the Madarsoo. Figure 5.4 shows the depth-width curves for all these sections. The width is calculated as function of the height (=depth) of the debris deposit, which requires iteration:
)(2
HWVolH
α=
It is not fully correct to assume that the maximum depth is equal to the height of the debris deposit (only true for a rectangular cross-section shape). The purpose here is, however, to distribute the debris volume over a distance, while the actual height is of less importance (it will come out from the model).

Supporting Report II (Feasibility Study) Paper VI Hydraulic Modeling
The Study on Flood and Debris Flowin the Caspian Coastal Area focusing on
the Flood-hit Region in Golestan Province
VI - 22 CTI Engineering International Co., Ltd. JICA
0
2
4
6
8
10
12
F102B F102 F03 F101B F02 F01 T01 T03 T04 T06 T07
Tributary
Dep
osit
heig
ht (m
)
25y 50y 100y 2001 2005
Figure 5.5: Calculated height of the debris deposit for each tributary for all five
scenarios by assuming a triangular shape (α=6).
Figure 5.5 shows the calculated heights of the debris deposits with a triangular shape (all tributaries and all five scenarios). It is again noted that this is not the height that the debris deposit will reach; it will used for calculating a distribution function.
The length of the debris deposit is given by L=αH, which shows that the length will vary from about 20-70 m for the triangular shaped deposits, which also seems like a very reasonable range considering the width of the tributaries. With a grid spacing of 10 m it means the debris should be distributed over 2-7 grid points, i.e. 2-7 point sources. In order to achieve some uniformity in handling this many point sources, each debris inflow is distributed over 5 grid points with a distribution key explained in the following.
In the central source point the debris inflow is simply:
),max(0 xWHVolV Δ=
In other words the volume that matches the height of the triangle over the length Δx, not to exceed the total volume. This is then subtracted from the total volume, and the remaining volume is distributed among the five remaining grid points with 1/3 in each of the two grid points adjacent to the central point and 1/6 in each of the two outer grid points (1/3+1/3+1/6+1/6=1). The actual distribution key is not as important as the fact that we have now distributed the debris inflow over some distance.

The Study on Flood and Debris Flow in the Caspian Coastal Area focusing on the Flood-hit Region in Golestan Province
Supporting Report II (Feasibility Study)Paper VI
Hydraulic Modeling
JICA CTI Engineering International Co., Ltd. VI - 23