supporting the preparation of tanzania’s second five …
TRANSCRIPT
SUPPORTING THE PREPARATION OF TANZANIA’S SECOND FIVE YEAR DEVELOPMENT PLAN (FYDP II) 2016/17 – 2020/21
Final Report
May 2016
SUPPORTING THE PREPARATION OF TANZANIA’S SECOND FIVE YEAR DEVELOPMENT PLAN (FYDP II) 2016/17 – 2021/22
ii
© SUPPORTING ECONOMIC TRANSFORMATION.
The views presented in this publication are those of the author(s) and do not necessarily represent the views of DFID or ODI.
ODI’s Supporting Economic Transformation (SET) programme is supported by the UK Department for International Development. All views expressed are those of the authors alone and do not reflect DFID or ODI views.
Acknowledgements
This is a draft final report for a study commissioned and guided by the President’s Office Planning Commission (POPC), which was subsequently incorporated into the Ministry of Finance to form the Ministry of Finance and Planning, following in-depth discussions in Dar es Salaam in February, April and December 2015, and a stakeholder consultation in October 2015. This study was led by Dirk Willem te Velde (ODI) and undertaken by researchers from ODI (including Neil Balchin, Alberto Lemma, Tim Kelsall, Max Mendez-Parra and Leah Worrall) and REPOA (Sam Wangwe, Donald Mmari, Blandina Kilama). It was undertaken over May 2015 – March 2016 in close co-ordination with the MOFP. We are very grateful for the excellent support, comments and guidance from the MOFP, especially from Dr Mpango and Dr Kessy, including during three review meetings on 26 June 2015, 6 and 7 October 2015 and 15 December 2015 in Dar es Salaam. We also thank the Tanzania Private Sector Foundation (TPSF) for organising a consultation with business on 13 July 2015; Stuart Tibbs, John-Paul Fanning and Eileen Rafferty of DFID, Thomas Baunsgaard of the International Monetary Fund, Justin Lin and Maggie McMillan for comments; the participants of the stakeholder consultation in October 2015 for their useful input; and representatives of the Bank of Tanzania, Tanzania Revenue Authority, Ministry of Finance in the Government of Tanzania, TPSF, TIB Development Bank and the National Development Corporation for sharing information during meetings in Dar es Salaam on 8 and 9 October 2015.
iii
TABLE OF CONTENTS
List of tables _____________________________________________________ 1
List of figures ____________________________________________________ 2
Acronyms _______________________________________________________ 5
1. Introduction and approach to the study ______________________________ 8
PART I: TANZANIA’S ECONOMIC AND POLICY BACKGROUND IN A COMPARATIVE CONTEXT ________________________________________ 11
2. The policy context for industrialisation in Tanzania ____________________ 12
2.1 THE BROAD POLICY CONTEXT __________________________________________ 12
2.2 EVOLUTION OF INDUSTRIALISATION POLICY AND STRATEGY ________________ 14
3. Recent economic development in Tanzania __________________________ 18
3.1 ECONOMIC GROWTH AND ECONOMIC STRUCTURES _______________________ 18
3.2 TRADE AND DIVERSIFICATION __________________________________________ 21
3.3 EMPLOYMENT ________________________________________________________ 25
3.4 LABOUR PRODUCTIVITY AND ECONOMIC TRANSFORMATION ________________ 27
3.5 PERFORMANCE AGAINST FYDP I TARGETS _______________________________ 33
3.6 CONCLUSIONS _______________________________________________________ 34
4. Benchmarking Tanzania’s economic transformation ___________________ 36
4.1 CHANGES IN THE PRODUCTION STRUCTURE _____________________________ 36
4.2 DETERMINANTS OF ECONOMIC TRANSFORMATION ________________________ 41
4.3 SECTORAL COMPARISON ACROSS COUNTRIES ___________________________ 49
4.4 CONCLUSION _________________________________________________________ 52
PART II: SHAPING THE FYDP II – IDENTIFYING FUTURE SECTORS AND CONSTRAINTS _________________________________________________ 54
5. What industries or subsectors should Tanzania prioritise? ______________ 55
5.1 TANZANIA’S STRENGTHS _______________________________________________ 55
5.2 REVIEWING PRIORITY SECTORS IN EXISTING STRATEGIES AND ANALYSES ___ 58
5.3 QUANTITATIVE ANALYSIS ______________________________________________ 67
5.4 STAKEHOLDER INTERVIEWS AND CONSULTATIONS ________________________ 73
5.5 SUMMARY: PRIORITY SECTORS FOR ECONOMIC TRANSFORMATION _________ 74
SUPPORTING THE PREPARATION OF TANZANIA’S SECOND FIVE YEAR DEVELOPMENT PLAN (FYDP II) 2016/17 – 2021/22
iv
6. Economic and policy Constraints to Sectoral Growth ___________________ 77
PART III: IMPLEMENTING THE FYDP II – POLICY SUGGESTIONS, FINANCING OPTIONS, PREPAREDNESS AND WAYS OF WORKING ________________ 82
7. Policy suggestions to nurture an industrial economy ___________________ 83
7.1 CROSS SECTORAL POLICY SUGGESTIONS _______________________________ 84
7.2 SECTOR SPECIFIC POLICY SUGGESTIONS ________________________________ 86
7.3 CONSULTATIONS: SUGGESTED POLICIES ________________________________ 87
7.4 CONCLUSIONS _______________________________________________________ 87
8. Mobilising and using finance effEctively for FYDP II ___________________ 89
8.1 RECENT TRENDS IN FINANCE FLOWS IN TANZANIA ________________________ 89
8.2 A GENERAL FINANCE AND POLICY FRAMEWORK TO MOBILISE FINANCE AND USE IT EFFECTIVELY IN TANZANIA ______________________________________________ 92
8.3 FINANCE FOR DEVELOPING LIGHT MANUFACTURING ______________________ 94
8.4 THE OIL AND NATURAL GAS SECTOR AS A CATALYST FOR INDUSTRIALISATION _______________________________________________________________________ 104
8.5 SUMMARY: A FINANCE AND POLICY FRAMEWORK MATRIX FOR ECONOMIC TRANSFORMATION AND VALUE CHAIN DEVELOPMENT IN LIGHT MANUFACTURING _______________________________________________________________________ 111
9. Policy preparedness and ways of working __________________________ 114
9.1 PRIORITY POLICY AND FINANCE AREAS _________________________________ 114
9.2 THE CHALLENGES OF IMPLEMENTING INDUSTRIAL POLICY IN TANZANIA _____ 114
9.3 MOVING FORWARD ___________________________________________________ 117
9.4 DOING PLANNING AND DEVELOPMENT DIFFERENTLY _____________________ 117
9.5 SUMMARISING PRIORITIES AND WAYS OF WORKING ______________________ 119
10. Targets, monitoring and learning in FYDP II ________________________ 122
11. Conclusions ________________________________________________ 125
References ____________________________________________________ 127
Appendix A – Data sources _______________________________________ 138
Appendix B – Using a social accounting matrix to calculate output and employment effects in Tanzania ______________________________________________ 144
Appendix C – Value addition in exports ______________________________ 153
Appendix D – Firm-level productivity analysis _________________________ 159
Appendix E – Hausmann product space analysis for Tanzania ____________ 165
Appendix F – Explanations on productivity decomposition ________________ 182
Appendix G – Tanzania and the IPOA index for structural transformation ____ 183
SUPPORTING THE PREPARATION OF TANZANIA’S SECOND FIVE YEAR DEVELOPMENT PLAN (FYDP II) 2016/17 – 2021/22
v
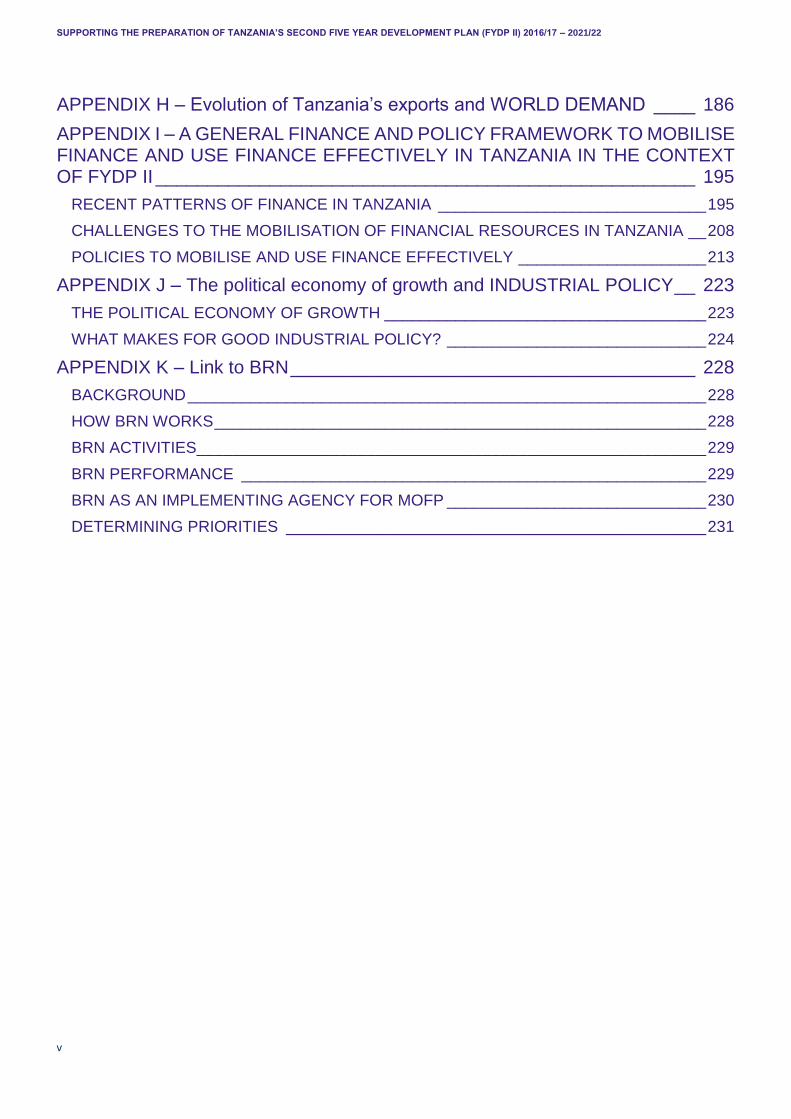
APPENDIX H – Evolution of Tanzania’s exports and WORLD DEMAND ____ 186
APPENDIX I – A GENERAL FINANCE AND POLICY FRAMEWORK TO MOBILISE FINANCE AND USE FINANCE EFFECTIVELY IN TANZANIA IN THE CONTEXT OF FYDP II ____________________________________________________ 195
RECENT PATTERNS OF FINANCE IN TANZANIA ______________________________ 195
CHALLENGES TO THE MOBILISATION OF FINANCIAL RESOURCES IN TANZANIA __ 208
POLICIES TO MOBILISE AND USE FINANCE EFFECTIVELY _____________________ 213
APPENDIX J – The political economy of growth and INDUSTRIAL POLICY __ 223
THE POLITICAL ECONOMY OF GROWTH ____________________________________ 223
WHAT MAKES FOR GOOD INDUSTRIAL POLICY? _____________________________ 224
APPENDIX K – Link to BRN _______________________________________ 228
BACKGROUND __________________________________________________________ 228
HOW BRN WORKS _______________________________________________________ 228
BRN ACTIVITIES _________________________________________________________ 229
BRN PERFORMANCE ____________________________________________________ 229
BRN AS AN IMPLEMENTING AGENCY FOR MOFP _____________________________ 230
DETERMINING PRIORITIES _______________________________________________ 231
SUPPORTING THE PREPARATION OF TANZANIA’S SECOND FIVE YEAR DEVELOPMENT PLAN (FYDP II) 2016/17 – 2021/22
1
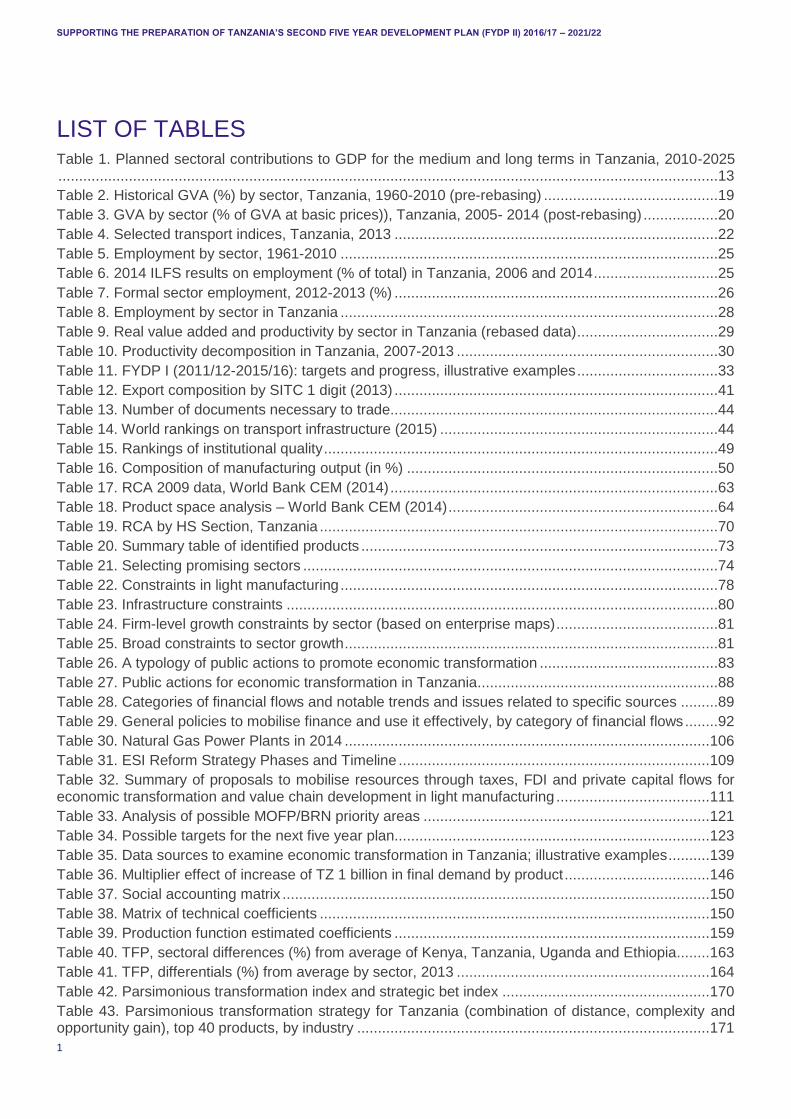
LIST OF TABLES Table 1. Planned sectoral contributions to GDP for the medium and long terms in Tanzania, 2010-2025 ...............................................................................................................................................................13
Table 2. Historical GVA (%) by sector, Tanzania, 1960-2010 (pre-rebasing) ..........................................19
Table 3. GVA by sector (% of GVA at basic prices)), Tanzania, 2005- 2014 (post-rebasing) ..................20
Table 4. Selected transport indices, Tanzania, 2013 ..............................................................................22
Table 5. Employment by sector, 1961-2010 ...........................................................................................25
Table 6. 2014 ILFS results on employment (% of total) in Tanzania, 2006 and 2014 ..............................25
Table 7. Formal sector employment, 2012-2013 (%) ..............................................................................26
Table 8. Employment by sector in Tanzania ...........................................................................................28
Table 9. Real value added and productivity by sector in Tanzania (rebased data) ..................................29
Table 10. Productivity decomposition in Tanzania, 2007-2013 ...............................................................30
Table 11. FYDP I (2011/12-2015/16): targets and progress, illustrative examples ..................................33
Table 12. Export composition by SITC 1 digit (2013) ..............................................................................41
Table 13. Number of documents necessary to trade...............................................................................44
Table 14. World rankings on transport infrastructure (2015) ...................................................................44
Table 15. Rankings of institutional quality ...............................................................................................49
Table 16. Composition of manufacturing output (in %) ...........................................................................50
Table 17. RCA 2009 data, World Bank CEM (2014) ...............................................................................63
Table 18. Product space analysis – World Bank CEM (2014) .................................................................64
Table 19. RCA by HS Section, Tanzania ................................................................................................70
Table 20. Summary table of identified products ......................................................................................73
Table 21. Selecting promising sectors ....................................................................................................74
Table 22. Constraints in light manufacturing ...........................................................................................78
Table 23. Infrastructure constraints ........................................................................................................80
Table 24. Firm-level growth constraints by sector (based on enterprise maps) .......................................81
Table 25. Broad constraints to sector growth ..........................................................................................81
Table 26. A typology of public actions to promote economic transformation ...........................................83
Table 27. Public actions for economic transformation in Tanzania..........................................................88
Table 28. Categories of financial flows and notable trends and issues related to specific sources .........89
Table 29. General policies to mobilise finance and use it effectively, by category of financial flows ........92
Table 30. Natural Gas Power Plants in 2014 ........................................................................................ 106
Table 31. ESI Reform Strategy Phases and Timeline ........................................................................... 109
Table 32. Summary of proposals to mobilise resources through taxes, FDI and private capital flows for economic transformation and value chain development in light manufacturing ..................................... 111
Table 33. Analysis of possible MOFP/BRN priority areas ..................................................................... 121
Table 34. Possible targets for the next five year plan............................................................................ 123
Table 35. Data sources to examine economic transformation in Tanzania; illustrative examples .......... 139
Table 36. Multiplier effect of increase of TZ 1 billion in final demand by product ................................... 146
Table 37. Social accounting matrix ....................................................................................................... 150
Table 38. Matrix of technical coefficients .............................................................................................. 150
Table 39. Production function estimated coefficients ............................................................................ 159
Table 40. TFP, sectoral differences (%) from average of Kenya, Tanzania, Uganda and Ethiopia........ 163
Table 41. TFP, differentials (%) from average by sector, 2013 ............................................................. 164
Table 42. Parsimonious transformation index and strategic bet index .................................................. 170
Table 43. Parsimonious transformation strategy for Tanzania (combination of distance, complexity and opportunity gain), top 40 products, by industry ..................................................................................... 171
SUPPORTING THE PREPARATION OF TANZANIA’S SECOND FIVE YEAR DEVELOPMENT PLAN (FYDP II) 2016/17 – 2021/22
2
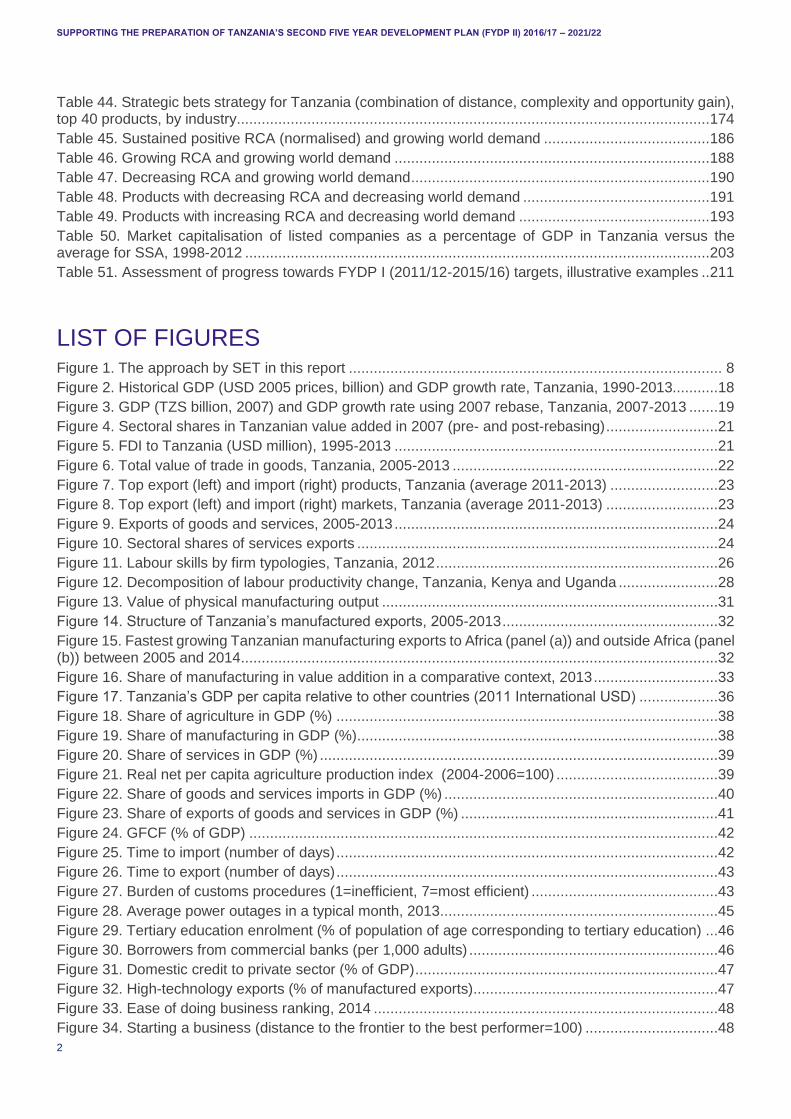
Table 44. Strategic bets strategy for Tanzania (combination of distance, complexity and opportunity gain), top 40 products, by industry.................................................................................................................. 174
Table 45. Sustained positive RCA (normalised) and growing world demand ........................................ 186
Table 46. Growing RCA and growing world demand ............................................................................ 188
Table 47. Decreasing RCA and growing world demand ........................................................................ 190
Table 48. Products with decreasing RCA and decreasing world demand ............................................. 191
Table 49. Products with increasing RCA and decreasing world demand .............................................. 193
Table 50. Market capitalisation of listed companies as a percentage of GDP in Tanzania versus the average for SSA, 1998-2012 ................................................................................................................ 203
Table 51. Assessment of progress towards FYDP I (2011/12-2015/16) targets, illustrative examples .. 211
LIST OF FIGURES Figure 1. The approach by SET in this report .......................................................................................... 8
Figure 2. Historical GDP (USD 2005 prices, billion) and GDP growth rate, Tanzania, 1990-2013...........18
Figure 3. GDP (TZS billion, 2007) and GDP growth rate using 2007 rebase, Tanzania, 2007-2013 .......19
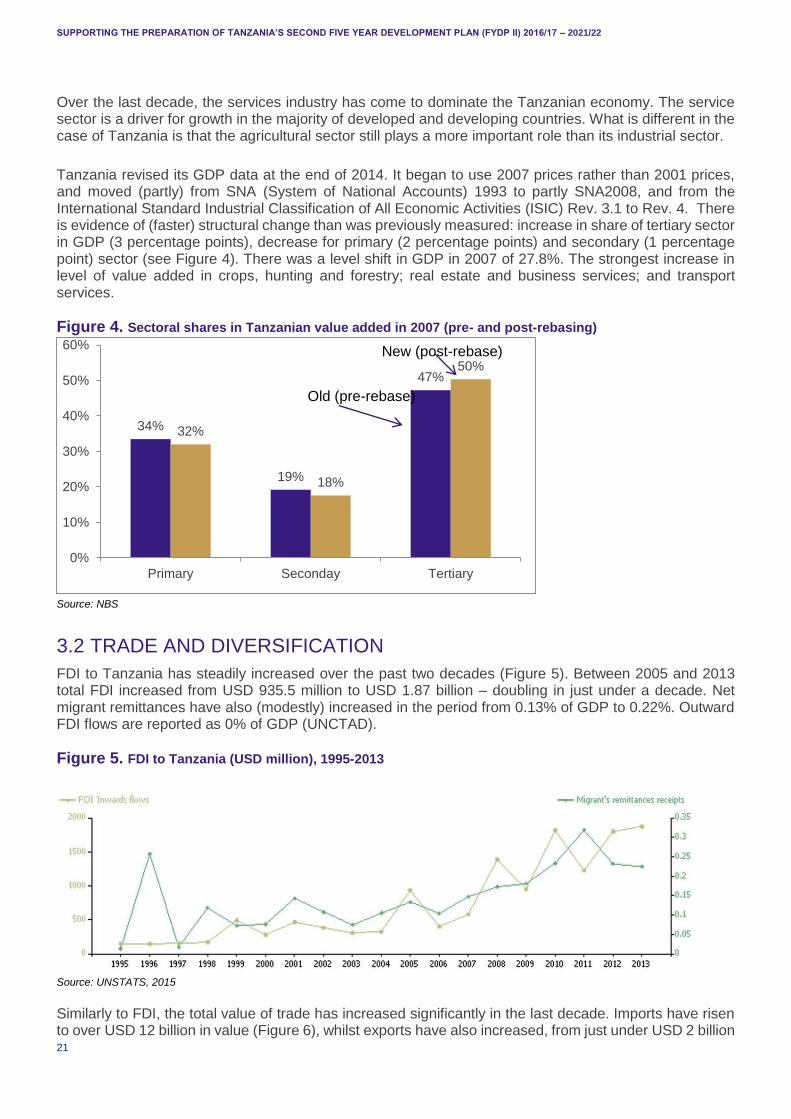
Figure 4. Sectoral shares in Tanzanian value added in 2007 (pre- and post-rebasing) ...........................21
Figure 5. FDI to Tanzania (USD million), 1995-2013 ..............................................................................21
Figure 6. Total value of trade in goods, Tanzania, 2005-2013 ................................................................22
Figure 7. Top export (left) and import (right) products, Tanzania (average 2011-2013) ..........................23
Figure 8. Top export (left) and import (right) markets, Tanzania (average 2011-2013) ...........................23
Figure 9. Exports of goods and services, 2005-2013 ..............................................................................24
Figure 10. Sectoral shares of services exports .......................................................................................24
Figure 11. Labour skills by firm typologies, Tanzania, 2012 ....................................................................26
Figure 12. Decomposition of labour productivity change, Tanzania, Kenya and Uganda ........................28
Figure 13. Value of physical manufacturing output .................................................................................31
Figure 14. Structure of Tanzania’s manufactured exports, 2005-2013 ....................................................32
Figure 15. Fastest growing Tanzanian manufacturing exports to Africa (panel (a)) and outside Africa (panel (b)) between 2005 and 2014 ...................................................................................................................32
Figure 16. Share of manufacturing in value addition in a comparative context, 2013 ..............................33
Figure 17. Tanzania’s GDP per capita relative to other countries (2011 International USD) ...................36
Figure 18. Share of agriculture in GDP (%) ............................................................................................38
Figure 19. Share of manufacturing in GDP (%).......................................................................................38
Figure 20. Share of services in GDP (%) ................................................................................................39
Figure 21. Real net per capita agriculture production index (2004-2006=100) .......................................39
Figure 22. Share of goods and services imports in GDP (%) ..................................................................40
Figure 23. Share of exports of goods and services in GDP (%) ..............................................................41
Figure 24. GFCF (% of GDP) .................................................................................................................42
Figure 25. Time to import (number of days) ............................................................................................42
Figure 26. Time to export (number of days) ............................................................................................43
Figure 27. Burden of customs procedures (1=inefficient, 7=most efficient) .............................................43
Figure 28. Average power outages in a typical month, 2013 ...................................................................45
Figure 29. Tertiary education enrolment (% of population of age corresponding to tertiary education) ...46
Figure 30. Borrowers from commercial banks (per 1,000 adults) ............................................................46
Figure 31. Domestic credit to private sector (% of GDP) .........................................................................47
Figure 32. High-technology exports (% of manufactured exports)...........................................................47
Figure 33. Ease of doing business ranking, 2014 ...................................................................................48
Figure 34. Starting a business (distance to the frontier to the best performer=100) ................................48
SUPPORTING THE PREPARATION OF TANZANIA’S SECOND FIVE YEAR DEVELOPMENT PLAN (FYDP II) 2016/17 – 2021/22
3
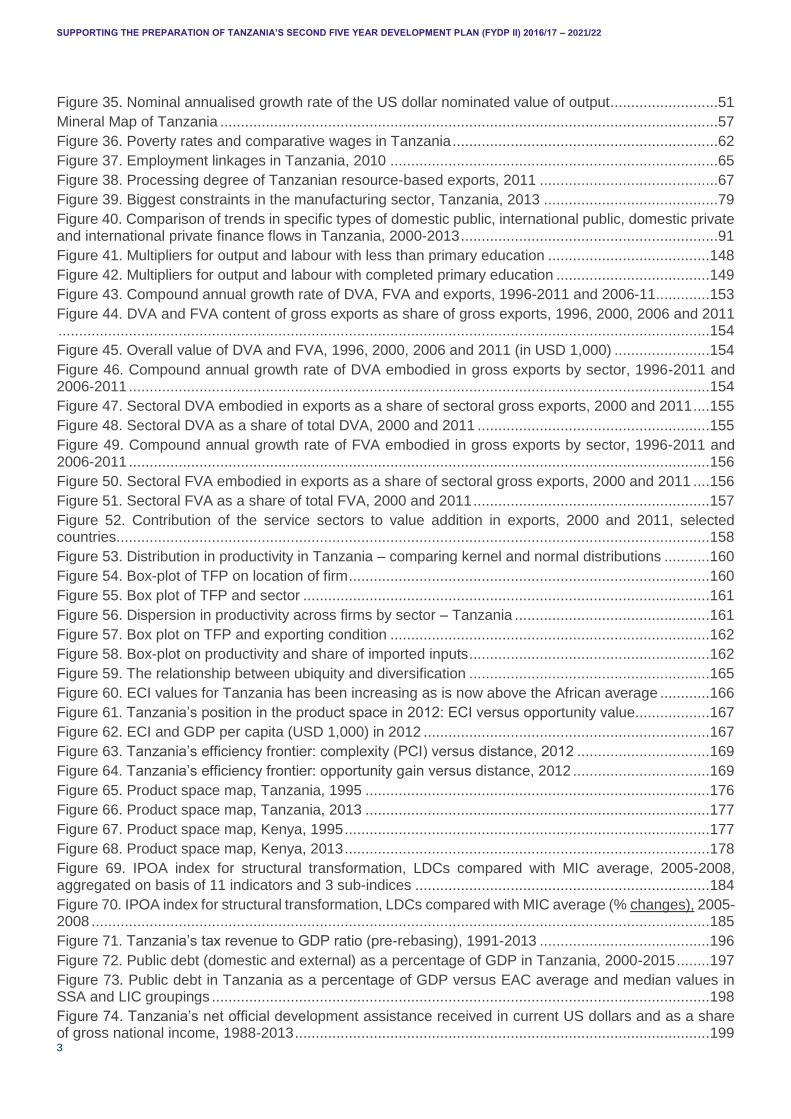
Figure 35. Nominal annualised growth rate of the US dollar nominated value of output ..........................51
Mineral Map of Tanzania ........................................................................................................................57
Figure 36. Poverty rates and comparative wages in Tanzania ................................................................62
Figure 37. Employment linkages in Tanzania, 2010 ...............................................................................65
Figure 38. Processing degree of Tanzanian resource-based exports, 2011 ...........................................67
Figure 39. Biggest constraints in the manufacturing sector, Tanzania, 2013 ..........................................79
Figure 40. Comparison of trends in specific types of domestic public, international public, domestic private and international private finance flows in Tanzania, 2000-2013 ..............................................................91
Figure 41. Multipliers for output and labour with less than primary education ....................................... 148
Figure 42. Multipliers for output and labour with completed primary education ..................................... 149
Figure 43. Compound annual growth rate of DVA, FVA and exports, 1996-2011 and 2006-11 ............. 153
Figure 44. DVA and FVA content of gross exports as share of gross exports, 1996, 2000, 2006 and 2011 ............................................................................................................................................................. 154
Figure 45. Overall value of DVA and FVA, 1996, 2000, 2006 and 2011 (in USD 1,000) ....................... 154
Figure 46. Compound annual growth rate of DVA embodied in gross exports by sector, 1996-2011 and 2006-2011 ............................................................................................................................................ 154
Figure 47. Sectoral DVA embodied in exports as a share of sectoral gross exports, 2000 and 2011 .... 155
Figure 48. Sectoral DVA as a share of total DVA, 2000 and 2011 ........................................................ 155
Figure 49. Compound annual growth rate of FVA embodied in gross exports by sector, 1996-2011 and 2006-2011 ............................................................................................................................................ 156
Figure 50. Sectoral FVA embodied in exports as a share of sectoral gross exports, 2000 and 2011 .... 156
Figure 51. Sectoral FVA as a share of total FVA, 2000 and 2011 ......................................................... 157
Figure 52. Contribution of the service sectors to value addition in exports, 2000 and 2011, selected countries ............................................................................................................................................... 158
Figure 53. Distribution in productivity in Tanzania – comparing kernel and normal distributions ........... 160
Figure 54. Box-plot of TFP on location of firm ....................................................................................... 160
Figure 55. Box plot of TFP and sector .................................................................................................. 161
Figure 56. Dispersion in productivity across firms by sector – Tanzania ............................................... 161
Figure 57. Box plot on TFP and exporting condition ............................................................................. 162
Figure 58. Box-plot on productivity and share of imported inputs .......................................................... 162
Figure 59. The relationship between ubiquity and diversification .......................................................... 165
Figure 60. ECI values for Tanzania has been increasing as is now above the African average ............ 166
Figure 61. Tanzania’s position in the product space in 2012: ECI versus opportunity value.................. 167
Figure 62. ECI and GDP per capita (USD 1,000) in 2012 ..................................................................... 167
Figure 63. Tanzania’s efficiency frontier: complexity (PCI) versus distance, 2012 ................................ 169
Figure 64. Tanzania’s efficiency frontier: opportunity gain versus distance, 2012 ................................. 169
Figure 65. Product space map, Tanzania, 1995 ................................................................................... 176
Figure 66. Product space map, Tanzania, 2013 ................................................................................... 177
Figure 67. Product space map, Kenya, 1995 ........................................................................................ 177
Figure 68. Product space map, Kenya, 2013 ........................................................................................ 178
Figure 69. IPOA index for structural transformation, LDCs compared with MIC average, 2005-2008, aggregated on basis of 11 indicators and 3 sub-indices ....................................................................... 184
Figure 70. IPOA index for structural transformation, LDCs compared with MIC average (% changes), 2005-2008 ..................................................................................................................................................... 185
Figure 71. Tanzania’s tax revenue to GDP ratio (pre-rebasing), 1991-2013 ......................................... 196
Figure 72. Public debt (domestic and external) as a percentage of GDP in Tanzania, 2000-2015 ........ 197
Figure 73. Public debt in Tanzania as a percentage of GDP versus EAC average and median values in SSA and LIC groupings ........................................................................................................................ 198
Figure 74. Tanzania’s net official development assistance received in current US dollars and as a share of gross national income, 1988-2013 .................................................................................................... 199
SUPPORTING THE PREPARATION OF TANZANIA’S SECOND FIVE YEAR DEVELOPMENT PLAN (FYDP II) 2016/17 – 2021/22
4
Figure 75. Net official development assistance received as a share of gross national income in Tanzania versus SSA and LIC averages, 1988-2013 ........................................................................................... 200
Figure 76. Gross and net other official flows to Tanzania, 1980-2013 ................................................... 201
Figure 77. Gross fixed capital formation by the private sector in Tanzania, 2000-2013 ......................... 202
Figure 78. Domestic credit provided to the private sector by banks as a percentage of GDP in Tanzania and SSA and LIC comparators, 1988-2014 .......................................................................................... 203
Figure 79. Level of personal remittances received in Tanzania and as a percentage of GDP versus SSA and LIC averages, 1995-2013 .............................................................................................................. 204
Figure 80. Net inflows of FDI (BoP) into Tanzania, 1980-2013 ............................................................. 205
Figure 81. Net FDI inflows as a percentage of GDP in Tanzania versus SSA and LIC averages, 1988-2013 ............................................................................................................................................................. 206
Figure 82. Net value of commercial bank lending and other private credits in Tanzania, 1980-2013 .... 207
Figure 83. Non-FDI private inflows (portfolio and private lending) to Tanzania as a percentage of GDP versus SSA and LIC averages, 1975-2007 ........................................................................................... 207
SUPPORTING THE PREPARATION OF TANZANIA’S SECOND FIVE YEAR DEVELOPMENT PLAN (FYDP II) 2016/17 – 2021/22
5
ACRONYMS 3ADI African Agriculture and Agro-Industries Development Initiative
ACP African, Caribbean and Pacific
AfDB African Development Bank
AGOA African Growth and Opportunity Act
ASIP Annual Survey of Industry Production
ATIA Africa Trade Insurance Agency
AU African Union
BIS Basic Industrial Strategy
BOT Build–Operate–Transfer or Build–Own–Transfer
BSM Business Sophistication Measure
CA Comparative Advantage
CAS Country Assistance Strategy
CEM Country Economic Memorandum
CIP Competitive Industrial Performance
DBSA Development Bank of Southern Africa
DEGRP DFID-ESRC Growth Research Programme
DRC Domestic Resource Cost
DFI Development Finance Institution
DFID Department for International Development
DHS Demographic and Health Survey
DVA Domestic Value Added
DWT Deadweight Tonnage
EAC East African Community
EBA Everything But Arms
ECI Economic Complexity Index
EPZ Export Processing Zone
ERP Economic Recovery Programme
ERS Export Rebate System
ESRC Economic and Social Research Council
EU European Union
EWURA Electricity and Water Utilities Regulatory Authority
FAO Food and Agricultural Organization
FDI Foreign Direct Investment
FEES Formal Employment and Earning Survey
FFYP First Five Year Plan
FVA Foreign Value Added
FYDP Five Year Development Plan
GCI Global Competitiveness Index
GDP Gross Domestic Product
GET Global Employment Trends
GFCF Gross Fixed Capital Formation
GGDC Groningen Growth and Development Centre
GIIP Gas Initially in Place
GRS General Retention Scheme
GVA Gross Value Added
HT High Technology
SUPPORTING THE PREPARATION OF TANZANIA’S SECOND FIVE YEAR DEVELOPMENT PLAN (FYDP II) 2016/17 – 2021/22
6
ICR Industrial Competitiveness Report
ICT Information and Communication Technology
IFI International Financial Institution
IFPRI International Food Policy Research Institute
IIDS Integrated Industrial Development Strategy
ILFS Integrated Labour Force Survey
ILO International Labour Organization
IMF International Monetary Fund
IPOA Istanbul Programme of Action
IPP Independent Power Producer
ISI Import Substitution Industrialisation
ISIC International Standard Industrial Classification of All Economic Activities
ITC International Trade Centre
JICA Japan International Cooperation Agency
LDC Least Developed Country
LNG Liquefied Natural Gas
LT Low Technology
LTPP Long-Term Perspective Plan
M&E Monitoring and Evaluation
MCC Millennium Challenge Corporation
MIC Middle-Income Country
MIGA Multilateral Investment Guarantee Agency
MIT Ministry of Industry and Trade
MKUKUTA/NGRP National Strategy for Growth and Reduction of Poverty
MMSCFD Million Standard Cubic Feet per Day
MOFP Ministry of Finance and Planning
MSME Micro, Small, Medium Enterprise
MT Medium Technology
MVA Manufacturing Value Added
NBS National Bureau of Statistics
NDC National Development Corporation
NEPAD New Economic Partnership for Africa’s Development
NICTBB National ICT Back Bone
ODI Overseas Development Institute
PCI Product Complexity Index
POPC President’s Office Planning Commission
PPP Public–Private Partnership
PRSP Poverty Reduction Strategy Paper
PURA Petroleum Upstream Regulatory Authority
R&D Research and Development
RB Resource Based
REPOA Research on Poverty Alleviation
RHS Right Hand Side
RLP Relative Labour Productivity
SADC Southern Africa Development Community
SAGCOT Southern Agricultural Growth Corridor of Tanzania
SAM Social Accounting Matrix
SBRs State–Business Relations
SUPPORTING THE PREPARATION OF TANZANIA’S SECOND FIVE YEAR DEVELOPMENT PLAN (FYDP II) 2016/17 – 2021/22
7
SDG Sustainable Development Goal
SET Supporting Economic Transformation
SEZ Special Economic Zone
SIDP Sustainable Industrial Development Policy
SITC Standard International Trade Classification
SME Small and Medium Enterprises
SMEDP SME Development Policy
SNA System of National Accounts
SOE State-Owned Enterprise
STC State Trading Corporation
STEM Science, Technology, Engineering and Mathematics
TANESCO Tanzania Electric Supply Company
TDV Tanzania Development Vision
TEU Twenty-Foot Equivalent Unit
TFP Total Factor Productivity
TIC Tanzania Investment Centre
TMTP Tanzania Mini Tiger Plan
TPDC Tanzania Petroleum Development Corporation
TRA Tanzania Revenue Authority
TVET Technical and Vocational Education and Training
TYP Three Year Plan
UK United Kingdom
UN United Nations
UNCTAD UN Conference on Trade and Development
UNDP UN Development Programme
UNIDO UN Industrial Development Organization
URT United Republic of Tanzania
US United States
WBES World Bank Enterprise Survey
WDI World Development Indicators
WEF World Economic Forum
WTO World Trade Organization
SUPPORTING THE PREPARATION OF TANZANIA’S SECOND FIVE YEAR DEVELOPMENT PLAN (FYDP II) 2016/17 – 2021/22
8
1. INTRODUCTION AND APPROACH TO THE STUDY The Government of Tanzania, through the Ministry of Finance and Planning (MOFP), has begun the process of preparing the second Five Year Development Plan (FYDP II), 2016/17 – 2020/21 focusing on the theme “Nurturing Industrialization for Economic Transformation and Human Development”. The plan is set for implementation in an international environment – characterised by rapidly growing African markets and rising Asian wages – that offers exciting opportunities for African industrialisation. Rebalancing in China, strong regional growth, and the potential for offshoring manufacturing jobs away from China, all provide opportunities for African countries to gain manufacturing market share, and countries such as Ethiopia have been proactive in looking to seize the opportunity. The approach adopted in FYDP II towards economic transformation and human development in Tanzania is likely to play an important role in determining whether or not the country is able to successfully seize the opportunities for industrialisation on offer in the rapidly evolving domestic and international environment.
The MOFP requested analytical support from the Overseas Development Institute (ODI) through its Supporting Economic Transformation (SET) Programme to inform the preparation of FYDP II, specifically in the following areas:
1. Harvest available statistics to take stock of Tanzania’s industrialisation record, policies and strategies and subsequently discern niches and pre-requisites for nurturing and leap-frogging to a semi-industrialised economy. This involves prioritisation and sequencing of particular industries and subsectors (underpinned by sound economic analysis);
2. Identify clear measurable targets for the next five-year plan by benchmarking with other middle-income countries (MICs);
3. Identify substantive sources for resource mobilisation (domestic and foreign, public and private) and propose a strategy to tap such resources so as to ensure successful implementation of FYDP II; and
4. Undertake a more in-depth look at the emerging natural gas sub-sector and its linkages with key sectors of the Tanzanian economy and propose key milestones to hasten the development of natural gas-based industries.
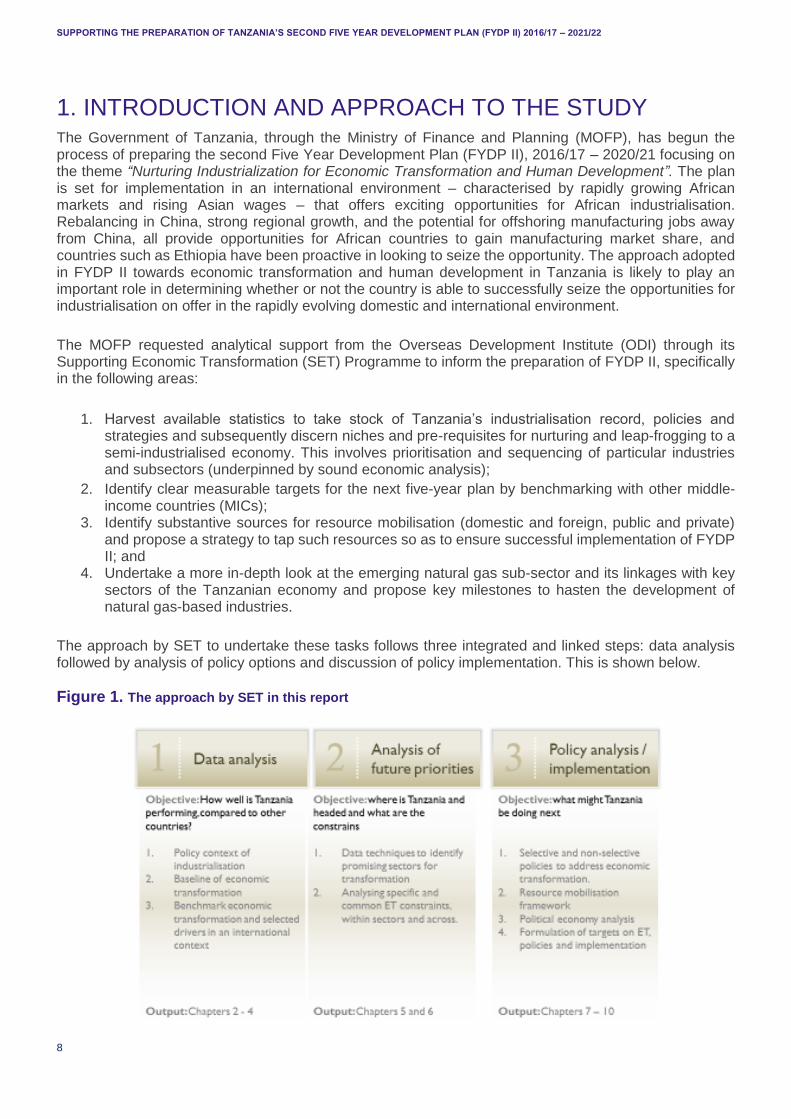
The approach by SET to undertake these tasks follows three integrated and linked steps: data analysis followed by analysis of policy options and discussion of policy implementation. This is shown below.
Figure 1. The approach by SET in this report
SUPPORTING THE PREPARATION OF TANZANIA’S SECOND FIVE YEAR DEVELOPMENT PLAN (FYDP II) 2016/17 – 2021/22
9
In Part I (Chapters 2, 3 and 4) we analyse policy and economic trends and ask how well Tanzania is performing, compared to other countries. We:
Review the policy context of industrialisation in Tanzania;
Provide a baseline of economic transformation more generally; and
Benchmark economic transformation and selected drivers in an international context.
In Part II (Chapters 5 and 6) we examine promising sectors in Tanzania and identify the constraints to development of these promising sectors. We:
Use a range of criteria and innovative data techniques to identify promising sectors for transformation; and
Identify specific and common constraints for each of the promising sectors.
In Part III we look at implementation (Chapters 7, 8, 9 and 10) and discuss what Tanzania might be doing next in terms of policy formulation, designing a resource mobilisation framework, ways of working and target setting. We:
Review policy suggestions to overcome constraints for economic transformation;
Examine how financial resources can be mobilised and used effectively to achieve the objectives of FYDP II;
Suggest innovative ways in which priority policy and finance can be implemented; and
Formulate targets on economic transformation, policy and finance priorities and ways of working in the FYDP II.
This report focuses on industrial development and economic transformation, what needs to be done and how to make it happen. But there are obvious, wider development implications. The Government of Tanzania decided to merge the FYDP and National Strategy for Growth and Reduction of Poverty (NSGRP) planning frameworks (the Kiswahili term is MKUKUTA). The current priority FYDP focus on industrial development in economic transformation therefore also needs to be explained in terms of human development. Broad-based sectoral improvements (including agriculture and services) remain important for economic transformation and human development, but traditionally industrial development has a special relationship with human development over the longer term. Industrial development has three types of linkages with human development. Firstly, it leads to wealth creation and greater incomes throughout the economy. As this report shows, productivity is higher in manufacturing than in agriculture or in many service sectors and it grows faster than in other sectors, making its contribution to aggregate productivity growth more important than its share in employment would suggest. Faster technology adoption and innovation raises aggregate labour productivity and reduces prices, which raises real incomes and profits that allows faster investment. The rapid promotion of exports of manufacturing is also one of a few proven routes to sustained job creation, with more, and higher quality, jobs increasing aggregate incomes. When manufacturing is further linked with other sectors, for instance when it adds value by processing agricultural and other commodities, it creates multiplier linkages throughout the economy and, hence, induced effects on human development. Secondly, manufacturing growth builds resilience against external shocks by diversification out of commodities, and manufacturing exports provide much needed foreign exchange. Resilience to shocks protects the livelihoods of the poorest. Thirdly, industrial development based on broad-based private sector development often goes hand in hand with increased tax revenues, which helps to provide the budget to promote human development.
SUPPORTING THE PREPARATION OF TANZANIA’S SECOND FIVE YEAR DEVELOPMENT PLAN (FYDP II) 2016/17 – 2021/22
10
As there are strong linkages between industrial development, economic transformation and human development over the mid to long term, the FYDP also relates well to the Sustainable Development Goals (SDGs). Industrialisation and productivity change are directly linked to the economic SDGs such as SDG 2 and 9 and indirectly to the social SDGs (SDGs 1-5). Further, Tanzania’s vision of natural resource based industrialisation depends strongly on the sustainable management of natural resources (water, energy, land etc.). The adoption of environmentally friendly techniques could be a win-win for Tanzania.
The chapters in the report are structured as follows. Chapter 2 reviews the policy context around industrialisation in Tanzania, which provides the background to this study on informing the design of the second five year plan from 2016 to 2021. It discusses, for example, the changing role of the public sector in promoting industrialisation.
Chapter 3 reviews Tanzania’s economic development progress in an historical context, where feasible with a focus on the last five years (although this is hampered by the availability of data), and with a section on industrialisation in particular. It also examines briefly the record of achievement on the targets in the first FYDP. Chapter 4 analyses Tanzania’s performance in an international context. This helps in the formulation of feasible targets in Chapter 10. Chapter 5 discusses industries that Tanzania could prioritise, using a range of new data techniques as well as existing analyses. We do not push one view or one sector, but identify three priority types of sectors (including light manufacturing) that most studies and analyses would agree on.
Chapter 6 identifies specific and common constraints across the promising sectors. Chapter 7 reviews general policy suggestions to overcome the common constraints discussed earlier. The emphasis is on identifying those policies that help Tanzania’s aim of economic transformation through industrialisation in particular.
Chapter 8 discusses a resource mobilisation framework that can be used to mobilise and use finance for achieving the objectives of the FYDP II and industrialisation in particular (Appendix I does this also in general). Chapter 9 brings together the priorities identified in Chapters 7 and 8 around five priorities. The rest of the Chapter analyses the challenges that Tanzania has faced in the past when implementing industrial policies and uses that analysis to suggest different ways of working around these priorities.
All of these chapters build up to Chapter 10 on target setting around the objectives of economic transformation which can reasonably be attained in the FYDP, targets for supportive policies and targets for supportive ways of working. These targets should be considered targets for initial discussion and require wider consultation. Overall, we argue that there are some early signs of structural transformation in Tanzania. Tanzania needs to build on these by addressing generally agreed policy options. It can best do this in practical terms by implementing a number of collaborative projects that would illustrate how it can nudge the economy further onto a more transformational path. Chapter 11 concludes. We argue that Tanzania needs a radically different approach in the coming five years in order to seize the opportunities for industrialisation in a rapidly evolving environment.
SUPPORTING THE PREPARATION OF TANZANIA’S SECOND FIVE YEAR DEVELOPMENT PLAN (FYDP II) 2016/17 – 2021/22
11
PART I: TANZANIA’S ECONOMIC AND POLICY BACKGROUND IN A COMPARATIVE CONTEXT
SUPPORTING THE PREPARATION OF TANZANIA’S SECOND FIVE YEAR DEVELOPMENT PLAN (FYDP II) 2016/17 – 2021/22
12
2. THE POLICY CONTEXT FOR INDUSTRIALISATION IN TANZANIA
2.1 THE BROAD POLICY CONTEXT
It is important to set the FYDP II in the context of past attempts to develop the Tanzanian economy because it shows how the policy stance changes over time and that past attempts of industrialisation have not always been successful. The transition from a colonial state to a centrally planned economy and then towards a market and private-sector-led economy has been characterised by a complex historical process of economic change in Tanzania. Economic changes were shaped by the incentives structure and varying perceptions, behaviour and norms regarding market imperfections and failures. In the course of history since independence, the state redefined its functions and that of the private sector in ways which varied according to the ideological orientation during the respective periods.
Importantly, between 1961 and 1967, the policy framework was defined by the introduction of the Three Year Development Plan (TYP 1961-1964) with a focus on promoting growth mainly through increasing investments in activities that were expected to bring quick and high returns and the FFYP (1964-1969) introducing a growth agenda where emphasis was placed on import substitution starting with simple consumer goods. Adopting a mixed economy and promoting private domestic and international investment in the economy, the response was below expectations leading to a rethinking of the role of the state in economic development. In 1967 the Arusha Declaration was introduced in which the principles of socialism and self-reliance led to widespread nationalisation of major means of production and most major subsequent investments were made in the public enterprises until the mid-1980s.
The reversal of the socialist policies and substantial state control of the economy was triggered by the economic crisis of the 1980s resulting in the adoption of the structural adjustment programme under the supervision of the international financial institutions (IFIs) opening the economy to economic liberalisation where the state controlled economy gave way to market oriented and private sector led economy. From the mid-1990s the policy stance changed and brought back the question of longer-term development agenda in the context of market orientation and private sector led development.
The return to concerns over the long-term development agenda were articulated in the Tanzania Development Vision (TDV) 2025 that was adopted in 2000.
TDV 2025 embodies Tanzania’s aspirations with respect to development, which inter alia sets the target of economic growth rate of at least 8 percent per annum. Such growth rates are considered necessary for reducing poverty and propelling Tanzania from a least developed country to an MIC with a high level of human development. TDV 2025 envisioned a strong, diversified and competitive economy regionally and globally. It envisioned an economy that is transformed from a predominantly low productivity agricultural economy to high productivity agriculture as a basis for a diversified and semi-industrialised economy. This implies priority on science and technology and innovations to raise productivity in agriculture with priority to value addition by moving up the value chain in agriculture and promoting linkages with other sectors.
The implementation of TDV was slowed down by attention given to poverty reduction strategy papers (PRSPs) from 2000 and began to pick up with the introduction of the second generation of PRSPs (MKUKUTA) in which the issues of growth featured more conspicuously. The National Strategy for Growth and Reduction of Poverty (NGRP), or MKUKUTA (2005-2010), is a medium-term framework for implementing vision 2025. NGRP is organised around the three clusters:
Cluster 1: Growth and poverty-reduction
Cluster 2: Improved quality of life and social well-being and
Cluster 3: Governance and accountability.
SUPPORTING THE PREPARATION OF TANZANIA’S SECOND FIVE YEAR DEVELOPMENT PLAN (FYDP II) 2016/17 – 2021/22
13
The strategy, especially in its cluster 1, is output oriented providing more emphasis on the development of economic productive sectors and the private sector, in particular the agriculture and small and medium enterprises (SME) sectors, in order to accelerate economic growth (gross domestic product (GDP) growth target of 6-8% per annum).
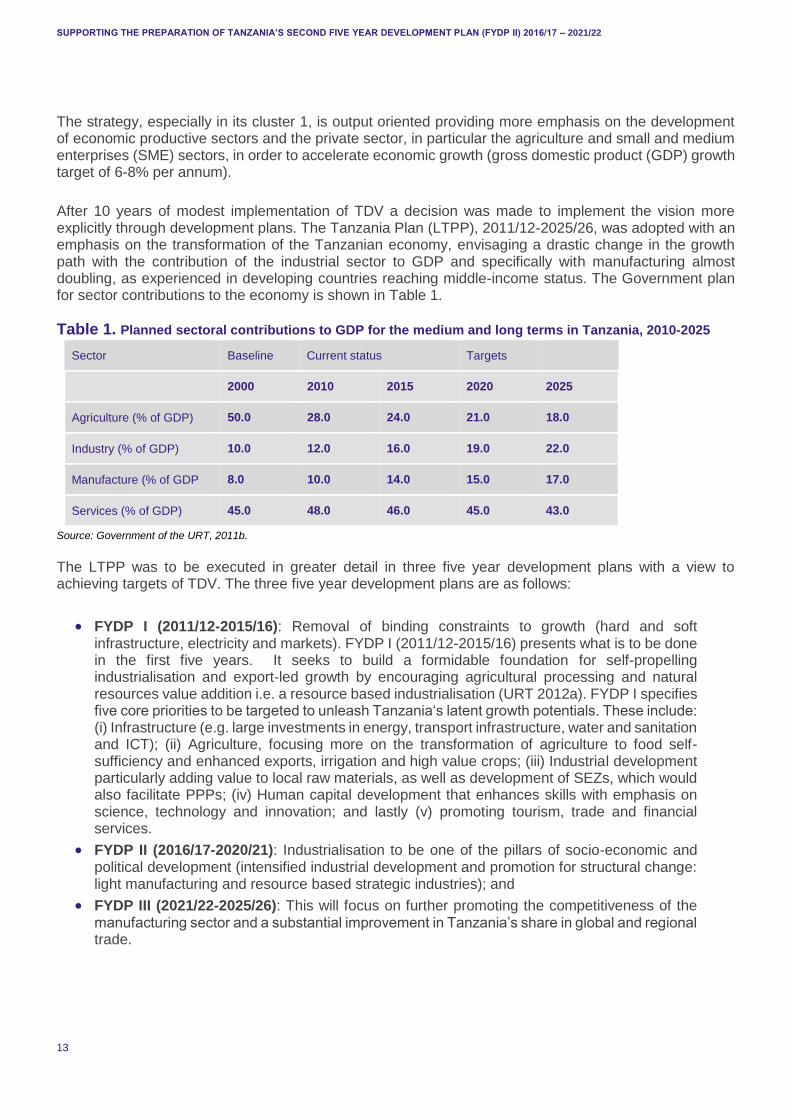
After 10 years of modest implementation of TDV a decision was made to implement the vision more explicitly through development plans. The Tanzania Plan (LTPP), 2011/12-2025/26, was adopted with an emphasis on the transformation of the Tanzanian economy, envisaging a drastic change in the growth path with the contribution of the industrial sector to GDP and specifically with manufacturing almost doubling, as experienced in developing countries reaching middle-income status. The Government plan for sector contributions to the economy is shown in Table 1.
Table 1. Planned sectoral contributions to GDP for the medium and long terms in Tanzania, 2010-2025
Sector Baseline Current status Targets
2000 2010 2015 2020 2025
Agriculture (% of GDP) 50.0 28.0 24.0 21.0 18.0
Industry (% of GDP) 10.0 12.0 16.0 19.0 22.0
Manufacture (% of GDP 8.0 10.0 14.0 15.0 17.0
Services (% of GDP) 45.0 48.0 46.0 45.0 43.0
Source: Government of the URT, 2011b.
The LTPP was to be executed in greater detail in three five year development plans with a view to achieving targets of TDV. The three five year development plans are as follows:
FYDP I (2011/12-2015/16): Removal of binding constraints to growth (hard and soft infrastructure, electricity and markets). FYDP I (2011/12-2015/16) presents what is to be done in the first five years. It seeks to build a formidable foundation for self-propelling industrialisation and export-led growth by encouraging agricultural processing and natural resources value addition i.e. a resource based industrialisation (URT 2012a). FYDP I specifies five core priorities to be targeted to unleash Tanzania‘s latent growth potentials. These include: (i) Infrastructure (e.g. large investments in energy, transport infrastructure, water and sanitation and ICT); (ii) Agriculture, focusing more on the transformation of agriculture to food self-sufficiency and enhanced exports, irrigation and high value crops; (iii) Industrial development particularly adding value to local raw materials, as well as development of SEZs, which would also facilitate PPPs; (iv) Human capital development that enhances skills with emphasis on science, technology and innovation; and lastly (v) promoting tourism, trade and financial services.
FYDP II (2016/17-2020/21): Industrialisation to be one of the pillars of socio-economic and political development (intensified industrial development and promotion for structural change: light manufacturing and resource based strategic industries); and
FYDP III (2021/22-2025/26): This will focus on further promoting the competitiveness of the manufacturing sector and a substantial improvement in Tanzania’s share in global and regional trade.
SUPPORTING THE PREPARATION OF TANZANIA’S SECOND FIVE YEAR DEVELOPMENT PLAN (FYDP II) 2016/17 – 2021/22
14
2.2 EVOLUTION OF INDUSTRIALISATION POLICY AND STRATEGY
The transition from a colonial state to a centrally planned economy and then towards a market and private-sector-led economy has been characterised by a complex historical process of economic change in Tanzania. These changes are reflected in the policies and institutional framework for industrialisation in the country. Economic changes were shaped by the incentives structure and varying perceptions, behaviour and norms regarding market imperfections and failures. In the course of history since independence, the state redefined its functions and that of the private sector in ways that varied according to the ideological orientation during the respective periods. To better capture the development of the industrial sector, one should contextualise this in four different ideological/development philosophy epochs:
The early years of independence (1961-1966)
The socialist era (1967-1985)
Structural adjustment and liberalisation phase (1986-1995)
Return to the development agenda and industrialisation (1996-2015)
2.2.1 INDUSTRIALISATION FROM INDEPENDENCE (1961-1966)
In the early 1960s, the national economic agenda focused on growth with little attention to structural change or ownership. The colonial pattern of import substitution, which was largely characterised by processing industries and simple consumer goods, was continued. Indeed, following the 1961 independence, production activities in Tanganyika (now Tanzania) were extensively rooted in labour-intensive primary commodities reflecting the colonial legacy on industrial policies. At that point, the industrial sector contributed about 4 percent to GDP with a large part of the manufacturing sector consisting of primary processing and simple consumer goods.
Importantly, between 1961 and 1967, industrial development in Tanzania was defined by the introduction of the TYP between 1961 and 1964 followed by the FFYP between 1964 and 1969. The TYP aimed at promoting growth mainly through increasing investments in activities that were expected to bring quick and high returns. The strategy implicit in the first development plans after independence, focused on the growth agenda with emphasis placed on import substitution starting with simple consumer goods. However, this import substitution model was adopted rather uncritically within the colonial pattern of industrial development. Indeed, the investment programme proposed in the early 1960s was to be implemented through enhancing local and foreign private investment.
A relatively low degree of regulatory control was exercised to promote private domestic and international investment in the economy. Specifically, the Foreign Investment Protection Act of 1963 was aimed at attracting foreign direct investment (FDI). Tax incentives were provided and existing investment opportunities publicised in a bid to expand the pool of capital inflows. The aim here was to use foreign capital to solve what was seen as the problem of scarcity of capital.
In 1965 the government made a decision to play an important role in investment in industrial development. In this context the National Development Corporation (NDC) was established as a key institutional framework for spearheading development predominantly industrial development.
2.2.2 INDUSTRIALISATION IN THE SOCIALIST ERA (1967-1985)
In 1967 the Arusha Declaration was introduced in which the principles of socialism and self-reliance were enunciated. The main consequence of the Arusha Declaration was the change in the ownership pattern whereby the major means of production were nationalized and most major subsequent investments were made in the public enterprises under the NDC. The Arusha Declaration introduced state-led import substitution, state-led expansion of manufacturing and a revision of ownership and management of established entities in favour of direct ownership and management of state organisations. Foreign investors participated through management agreements and as suppliers of equipment for industries.
SUPPORTING THE PREPARATION OF TANZANIA’S SECOND FIVE YEAR DEVELOPMENT PLAN (FYDP II) 2016/17 – 2021/22
15
Direct regulatory control in manufacturing was then consolidated through the establishment of the NDC while trade was largely operating under the State Trading Corporation (STC).
Increased state control in manufacturing saw the introduction of an industrial licensing procedure under the National Industries Licensing and Registration Act of 1967. The Arusha Declaration also saw an increased role of the government in setting, implementing and monitoring monetary and exchange rate policies.
During this period the government formulated a long-term industrial strategy covering 20 years (1975-95). The formulation of the long-term industrial strategy involved three main elements: Identification of national goals that could be achieved through industrial development, allocation of resources (human, capital, foreign exchange and natural resources) and selection of priority industrial activities. The long-term industrial strategy was based on the Basic Industrial Strategy (BIS), which was deemed to effect structural change and self-reliance. Industrial goods were to meet basic needs of the population and intermediate and capital goods were to be produced to meet domestic demand.
Furthermore, in the early 1980s currency overvaluation was depressing the export sector and shortage of foreign exchange and imported intermediate inputs was adversely affecting industrial performance. One response to this situation was the introduction of the Export Rebate System (ERS) in 1981 to serve as an export subsidy for producers of horticultural goods, alongside a General Retention Scheme (GRS) for exporters to deposit part of their foreign exchange earnings for the purpose of importing inputs. However, it did not reverse the foreign exchange shortage as chronic economic malaise continued to persist.
The economic crisis in Tanzania continued into the mid-1980s in a difficult environment for industrial development characterized by excessive controls including import licensing, exchange controls and price controls. These controls created a business environment that did not facilitate the industrial sector to build capabilities to compete.
2.2.3 STRUCTURAL ADJUSTMENT AND LIBERALISATION PHASE (1986-1995)
After a long debate with the IFIs the persistence of the economic crisis especially shortage of foreign exchange forced the government of Tanzania to adopt the policy package under structural adjustment programmes of the IFIs in 1986. Specifically, the Economic Recovery Programme (ERP) was adopted with the objective of restoring economic stability and accelerating structural reforms in order to create sustainable position of country’s balance of payment, correcting budget deficits, cutting down inflation, reforming microeconomic framework of policies and increasing incentives to agricultural producers.
One implicit assumption of economic reforms and industrial restructuring was that enterprise-level inefficiencies are a reflection of distorted or inappropriate macroeconomic policies. It was assumed that if appropriate adjustments could be put in place at macro level, enterprises would receive the right signals through the market. Trade liberalisation was adopted presumably to force enterprises to compete with imports.
As Tanzania negotiated a deal with the IFIs and opened up its economy to economic liberalisation, the state controlled industrialisation was gradually giving way to market led industrialisation under what has been called the structural adjustment programmes exhibiting trade liberalisation and privatisation. Following trade liberalisation in the mid-1980s, there was an increase of imports of industrial goods which were of better quality and more competitive prices than locally produced products which had been nurtured under a protective environment with import controls, foreign exchange controls and cost-plus pricing which guaranteed profitability irrespective of the level of efficiency. The structural adjustment programmes marked by macroeconomic reforms, privatisation and trade liberalisation led to deindustrialisation as reforms eroded several industrial capacities (by 1990, 22 out of 24 textile factories had closed). Indeed this was a period of widespread deindustrialisation.
SUPPORTING THE PREPARATION OF TANZANIA’S SECOND FIVE YEAR DEVELOPMENT PLAN (FYDP II) 2016/17 – 2021/22
16
2.2.4 RETURN TO THE DEVELOPMENT AGENDA AND INDUSTRIALISATION (1996-2015)
From the mid-1990s the policy stance changed and brought the question of industrial development back to the development agenda in the context of market orientation and private sector led development.
In 1996, a 25 year Sustainable Industrial Development Policy for Tanzania (SIDP 2020) began to be implemented with the aim of enhancing sustainable development of industrial sector. For the period 1996-2020 the government aimed at achieving sustainable growth in the industrial sector in order to create favourable levels of employment, economic transformation, equitable development, import substitution and export promotion. The implementation of SIDP was to be done through industrial rehabilitation and consolidation and creation of new industrial capacities for producing not only consumer goods but also intermediate and capital goods. Identification of priorities would be based on profitability and detailed industrial studies to identify opportunities for developing competitive industry based on domestic resources. The private sector would be promoted to take the lead in industrialisation while the government will be responsible for putting in place a conducive policy and regulatory environment and the requisite infrastructure. The government would only invest directly in industrial activities that are strategic and of critical national economic importance such as iron and steel industry.
SIDP accorded priority to employment creation, economic transformation, and equitable development and seeks to strike an appropriate balance between import substitution and export orientation. The strategy was to be implemented in three phases. Phase I (1996-2000) was for short-term programme to rehabilitate and consolidate existing industrial capacities. Phase II (2000-2010) was for a medium-term programme to create new capacities in areas with potential for creating competitive advantage through use of efficient technology and learning process. In this phase emphasis was put on initiating production of intermediate goods and light capital. Phase III (2010-2020) is for a long term programme to achieve major investments in basic capital goods industries to ensure consolidation of the industrial structures developed in the first two phases.
The SIDP would adopt fiscal and monetary incentive policy packages and regulatory measures that would enable removal of operational constraints and create an enabling environment for efficient operation of industrial enterprises. Selective protection of domestic industry would be applied within the framework of World Trade Organization (WTO) rules.
Industrial financing would be promoted through consolidation of capital and securities markets, consolidating financial sector reforms to further broaden access to financial services and establishing specialised institutions for industrial financing.
Development of competitive industries would be promoted by adopting incentives for consolidating and strengthening basic scientific research, technology and research and development (R&D) activities and promoting standards and quality assurance, technological institutions would be strengthened through rationalisation, providing adequate finance, human resources and infrastructure and promotion of closer linkages between the R&D activities and the productive sector. More specifically, export industries would be promoted through incentives to encourage exporting.
In June 2010, an Integrated Industrial Development Strategy (IIDS) 2025 was also adopted for the purpose of promoting the efforts of achieving the SIDP goal of bringing an economy to a state of sustainable industrial development. The IIDS 2025 (June 2010) was formulated with a view to providing concrete strategies to implement SIDP 2020 and build a competitive industrial sector by putting in place a competitive business environment and improving existing development corridors – concentrated infrastructure development and promoting agriculture-led industrialisation. Manufactured value added was projected to grow at 15 percent per annum. The main output of IIDS will be the construction of an industrial foundation in Tanzania that will provide a proper business base for foreign and local investors to establish an export oriented manufacturing sector.
SUPPORTING THE PREPARATION OF TANZANIA’S SECOND FIVE YEAR DEVELOPMENT PLAN (FYDP II) 2016/17 – 2021/22
17
The IIDS responds to the need for a dynamic strategy to guide the process of resource-based industrialisation. The IIDS reviews its current performance status and analyses its potential in the context of natural resources endowment and location. Early realisation of the strategy includes the identification of a few priority sub-sectors to serve as the nucleus of industrialisation.
The IIDS 2025 was also adopted for the purpose of promoting the efforts of achieving the SIDP goal of bringing an economy to a state of accelerating industrialisation and to provide concrete strategies to implement SIDP 2020. The IIDS 2025 aims to build an internationally competitive business environment, through formation of and industrial stock accumulation, strengthening the back-up institutional framework, bringing about concentrated infrastructure development, and promoting internationally competitive industries and enterprises, all of which, together, will make the industrial sector the real engine of economic growth. Under the IIDS acceleration of industrial development expected with manufacturing value added (MVA) projected to grow at 15 percent per annum.
The export processing zone (EPZ)/special economic zone (SEZ) concept was introduced under the SIDP and elaborated in IIDS. The objectives of EPZ were to attract and promote investments for an export-led industrialisation. The EPZ/SEZ concept was the core of the Tanzania Mini Tiger Plan (TMTP) 2020 with the intention to make Tanzania a fast growing economy in Africa, using SEZs as its main policy tool. The main intention of the plan is to fast track the realisation of TDV 2025.
The EPZ Act was passed in April 2002 and its implementation started effectively in March 2003. The plan focuses on Primary Commodity SEZ, Industry SEZ, Tourism SEZ and SME SEZ. These were intended to promote exports, create employment and create favourable conditions for domestic and foreign investment.
The IIDS envisages a gateway port improvement for the region and the promotion of Economic Development Zones for growth and infrastructure development. The IIDS envisages contributing to making Tanzania the industrial and logistics hub of the Eastern and Central African region, through extension and improvement of existing development corridors. Major instruments include the accumulation and concentration of industrial firms through cluster development, supported by SEZs. Three waterfront SEZs are planned: one for Dar es Salaam linked with the Central Railway Line to the “Logistics Corridor” and TAZARA to constitute the “Agricultural Corridor”; Mtwara SEZ which is being developed as the “Minerals Corridor” and the Tanga corridor to serve the areas of northern and north-western Tanzania up to and including Rwanda. At the regional and district level, these corridors will link Regional SEZs and Micro Industrial Parks at the district level with the domestic and regional markets.
IIDS also articulates an industrial village concept whereby opportunities are created for the growth of micro and small enterprises. The development of SMEs is guided by the SME Development Policy (SMEDP), which was formulated in 2003 with the objectives of promoting employment creation, income generation, poverty reduction and as well as a base for industrial development. The policy commits the government to support SME development. The constraints, specific to SMEs, justified the preparation of a National SME Policy in order to tap the full potential of this emerging private sector that constitutes the base for private sector-led growth in Tanzania. This policy specifically acknowledged the special role of SMEs industrialisation in the country and aims to address the constraints to development of SME industries. However, many constraints to SME development persist. The result is frustration and losing out in the domestic markets. Consequently, a review of this policy is in progress with the expectation to improve the effectiveness of the policy.1 The strategy targeted six sub-sectors: Agroprocessing, Textiles, Leather, Fertiliser and chemicals, Light machinery and Iron and steel.
1 A rapid review of the SME Development Policy undertaken by UNIDO and the Ministry of Trade and Industry in 2013, ten years after its inception, noted that inadequate financial resource mobilisation and a weak implementation framework had hampered its effectiveness. An absence of stand-alone legal instruments had also affected implementation. Furthermore, it noted that the definition of SMEs used in the policy was unclear, which created difficulties in operationalising the policy.
SUPPORTING THE PREPARATION OF TANZANIA’S SECOND FIVE YEAR DEVELOPMENT PLAN (FYDP II) 2016/17 – 2021/22
18
3. RECENT ECONOMIC DEVELOPMENT IN TANZANIA The chapter examines the recent economic record in Tanzania in order to understand how well Tanzania has performed, including in recent years, setting the background for future target setting in chapter 10. It looks through the lens of GDP, FDI, gross value added (GVA) by sector, trade measures and the current employment situation. Tanzania has grown rapidly over the last decade, with increased inward FDI but an ever-widening gap between (both increasing) imports and exports and weak manufacturing. We discuss the following areas of economic activity relevant for economic transformation:
Economic growth and economic structures (3.1)
FDI and trade (3.2)
Employment (3.3)
Labour productivity and economic transformation (3.4)
In this context, we also consider some illustrative examples of Tanzania’s recent performance against key target areas in the FYDP I (section 3.5). Section 3.6 concludes.
3.1 ECONOMIC GROWTH AND ECONOMIC STRUCTURES
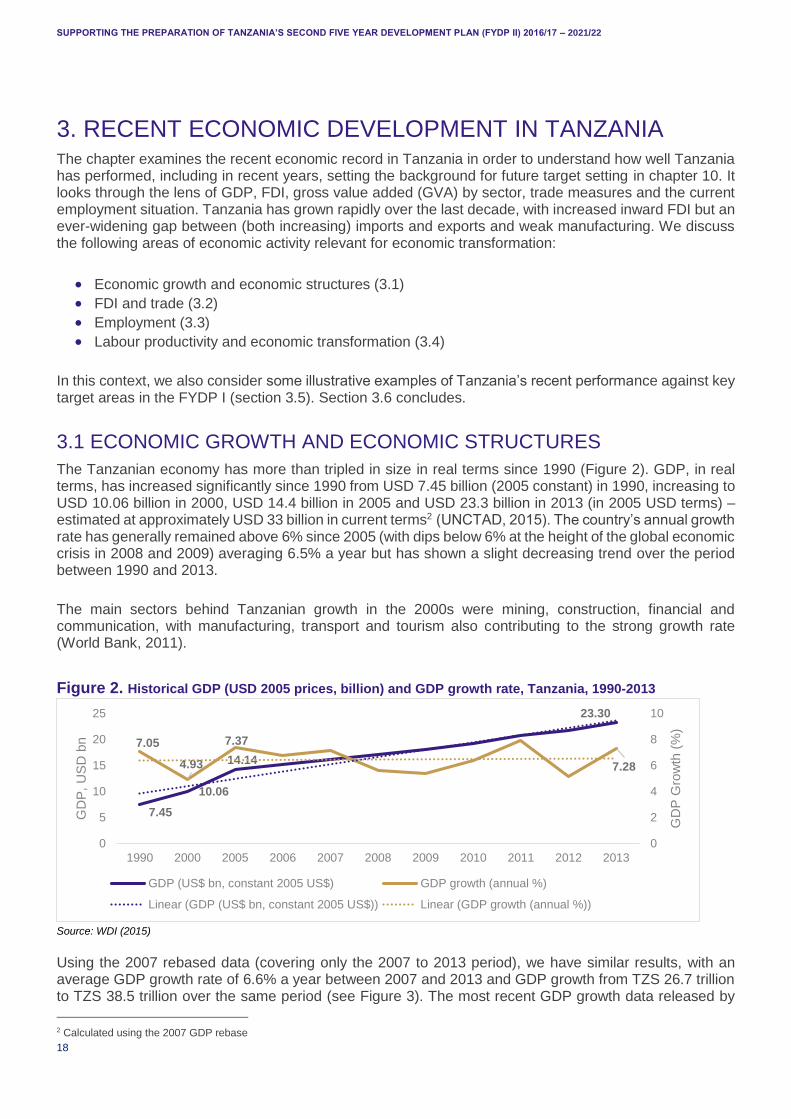
The Tanzanian economy has more than tripled in size in real terms since 1990 (Figure 2). GDP, in real terms, has increased significantly since 1990 from USD 7.45 billion (2005 constant) in 1990, increasing to USD 10.06 billion in 2000, USD 14.4 billion in 2005 and USD 23.3 billion in 2013 (in 2005 USD terms) – estimated at approximately USD 33 billion in current terms2 (UNCTAD, 2015). The country’s annual growth rate has generally remained above 6% since 2005 (with dips below 6% at the height of the global economic crisis in 2008 and 2009) averaging 6.5% a year but has shown a slight decreasing trend over the period between 1990 and 2013.
The main sectors behind Tanzanian growth in the 2000s were mining, construction, financial and communication, with manufacturing, transport and tourism also contributing to the strong growth rate (World Bank, 2011).
Figure 2. Historical GDP (USD 2005 prices, billion) and GDP growth rate, Tanzania, 1990-2013
Source: WDI (2015)
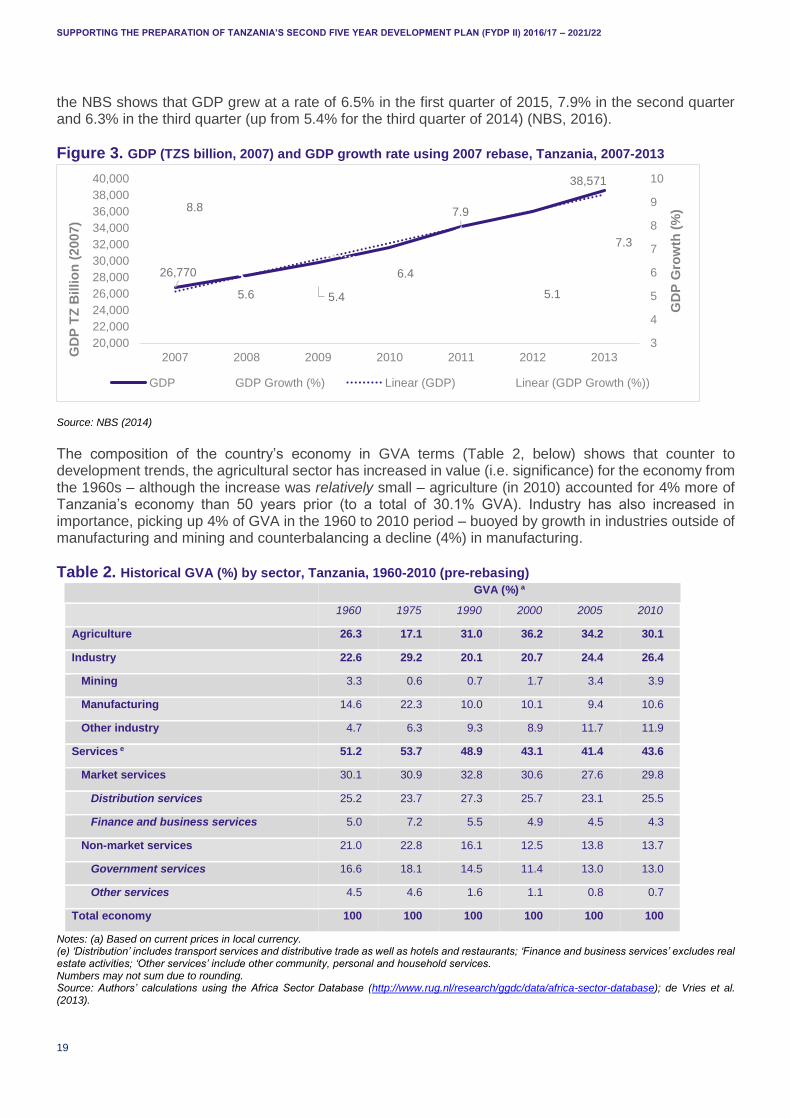
Using the 2007 rebased data (covering only the 2007 to 2013 period), we have similar results, with an average GDP growth rate of 6.6% a year between 2007 and 2013 and GDP growth from TZS 26.7 trillion to TZS 38.5 trillion over the same period (see Figure 3). The most recent GDP growth data released by
2 Calculated using the 2007 GDP rebase
7.45
10.06
14.14
23.30
7.05
4.93
7.37
7.28
0
2
4
6
8
10
0
5
10
15
20
25
1990 2000 2005 2006 2007 2008 2009 2010 2011 2012 2013
GD
P G
row
th (
%)
GD
P,
US
D b
n
GDP (US$ bn, constant 2005 US$) GDP growth (annual %)
Linear (GDP (US$ bn, constant 2005 US$)) Linear (GDP growth (annual %))
SUPPORTING THE PREPARATION OF TANZANIA’S SECOND FIVE YEAR DEVELOPMENT PLAN (FYDP II) 2016/17 – 2021/22
19
the NBS shows that GDP grew at a rate of 6.5% in the first quarter of 2015, 7.9% in the second quarter and 6.3% in the third quarter (up from 5.4% for the third quarter of 2014) (NBS, 2016).
Figure 3. GDP (TZS billion, 2007) and GDP growth rate using 2007 rebase, Tanzania, 2007-2013
Source: NBS (2014)
The composition of the country’s economy in GVA terms (Table 2, below) shows that counter to development trends, the agricultural sector has increased in value (i.e. significance) for the economy from the 1960s – although the increase was relatively small – agriculture (in 2010) accounted for 4% more of Tanzania’s economy than 50 years prior (to a total of 30.1% GVA). Industry has also increased in importance, picking up 4% of GVA in the 1960 to 2010 period – buoyed by growth in industries outside of manufacturing and mining and counterbalancing a decline (4%) in manufacturing.
Table 2. Historical GVA (%) by sector, Tanzania, 1960-2010 (pre-rebasing)
GVA (%) a
1960 1975 1990 2000 2005 2010
Agriculture 26.3 17.1 31.0 36.2 34.2 30.1
Industry 22.6 29.2 20.1 20.7 24.4 26.4
Mining 3.3 0.6 0.7 1.7 3.4 3.9
Manufacturing 14.6 22.3 10.0 10.1 9.4 10.6
Other industry 4.7 6.3 9.3 8.9 11.7 11.9
Services e 51.2 53.7 48.9 43.1 41.4 43.6
Market services 30.1 30.9 32.8 30.6 27.6 29.8
Distribution services 25.2 23.7 27.3 25.7 23.1 25.5
Finance and business services 5.0 7.2 5.5 4.9 4.5 4.3
Non-market services 21.0 22.8 16.1 12.5 13.8 13.7
Government services 16.6 18.1 14.5 11.4 13.0 13.0
Other services 4.5 4.6 1.6 1.1 0.8 0.7
Total economy 100 100 100 100 100 100
Notes: (a) Based on current prices in local currency. (e) ‘Distribution’ includes transport services and distributive trade as well as hotels and restaurants; ‘Finance and business services’ excludes real estate activities; ‘Other services’ include other community, personal and household services. Numbers may not sum due to rounding. Source: Authors’ calculations using the Africa Sector Database (http://www.rug.nl/research/ggdc/data/africa-sector-database); de Vries et al. (2013).
26,770
38,571
8.8
5.6 5.4
6.4
7.9
5.1
7.3
3
4
5
6
7
8
9
10
20,000
22,000
24,000
26,000
28,000
30,000
32,000
34,000
36,000
38,000
40,000
2007 2008 2009 2010 2011 2012 2013
GD
P G
row
th (
%)
GD
P T
Z B
illio
n (
2007)
GDP GDP Growth (%) Linear (GDP) Linear (GDP Growth (%))
SUPPORTING THE PREPARATION OF TANZANIA’S SECOND FIVE YEAR DEVELOPMENT PLAN (FYDP II) 2016/17 – 2021/22
20
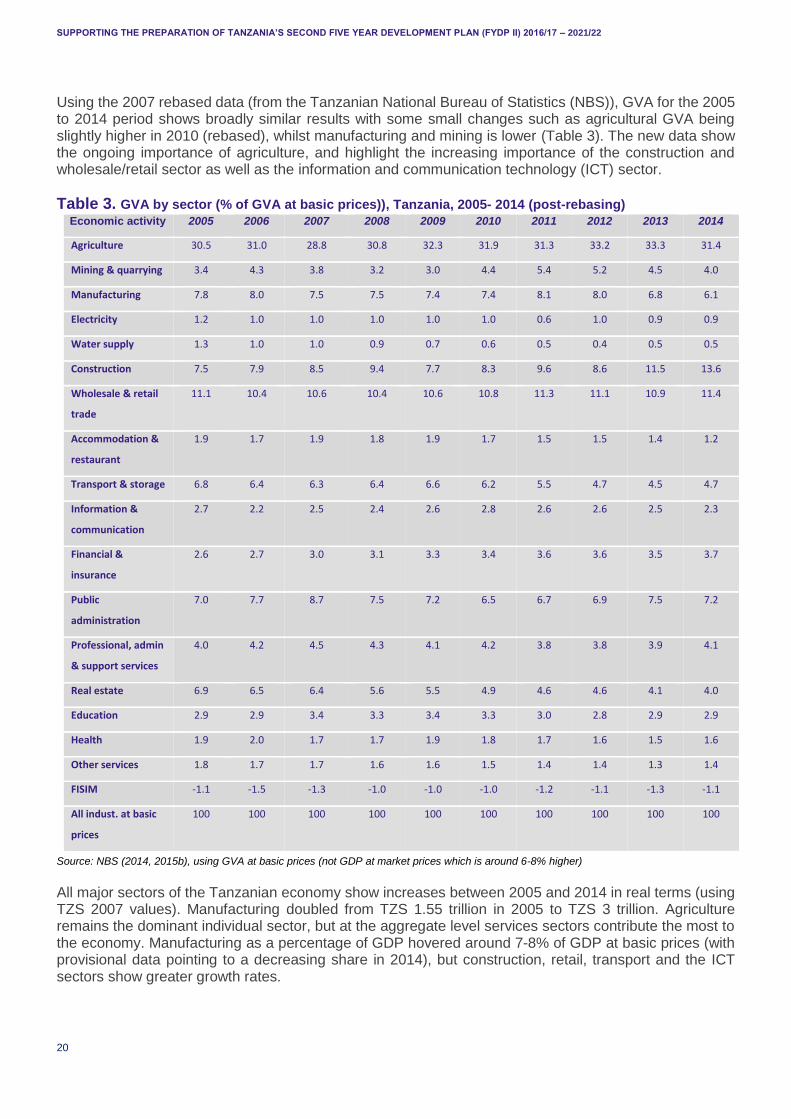
Using the 2007 rebased data (from the Tanzanian National Bureau of Statistics (NBS)), GVA for the 2005 to 2014 period shows broadly similar results with some small changes such as agricultural GVA being slightly higher in 2010 (rebased), whilst manufacturing and mining is lower (Table 3). The new data show the ongoing importance of agriculture, and highlight the increasing importance of the construction and wholesale/retail sector as well as the information and communication technology (ICT) sector.
Table 3. GVA by sector (% of GVA at basic prices)), Tanzania, 2005- 2014 (post-rebasing)
Economic activity 2005 2006 2007 2008 2009 2010 2011 2012 2013 2014
Agriculture 30.5 31.0 28.8 30.8 32.3 31.9 31.3 33.2 33.3 31.4
Mining & quarrying 3.4 4.3 3.8 3.2 3.0 4.4 5.4 5.2 4.5 4.0
Manufacturing 7.8 8.0 7.5 7.5 7.4 7.4 8.1 8.0 6.8 6.1
Electricity 1.2 1.0 1.0 1.0 1.0 1.0 0.6 1.0 0.9 0.9
Water supply 1.3 1.0 1.0 0.9 0.7 0.6 0.5 0.4 0.5 0.5
Construction 7.5 7.9 8.5 9.4 7.7 8.3 9.6 8.6 11.5 13.6
Wholesale & retail
trade
11.1 10.4 10.6 10.4 10.6 10.8 11.3 11.1 10.9 11.4
Accommodation &
restaurant
1.9 1.7 1.9 1.8 1.9 1.7 1.5 1.5 1.4 1.2
Transport & storage 6.8 6.4 6.3 6.4 6.6 6.2 5.5 4.7 4.5 4.7
Information &
communication
2.7 2.2 2.5 2.4 2.6 2.8 2.6 2.6 2.5 2.3
Financial &
insurance
2.6 2.7 3.0 3.1 3.3 3.4 3.6 3.6 3.5 3.7
Public
administration
7.0 7.7 8.7 7.5 7.2 6.5 6.7 6.9 7.5 7.2
Professional, admin
& support services
4.0 4.2 4.5 4.3 4.1 4.2 3.8 3.8 3.9 4.1
Real estate 6.9 6.5 6.4 5.6 5.5 4.9 4.6 4.6 4.1 4.0
Education 2.9 2.9 3.4 3.3 3.4 3.3 3.0 2.8 2.9 2.9
Health 1.9 2.0 1.7 1.7 1.9 1.8 1.7 1.6 1.5 1.6
Other services 1.8 1.7 1.7 1.6 1.6 1.5 1.4 1.4 1.3 1.4
FISIM -1.1 -1.5 -1.3 -1.0 -1.0 -1.0 -1.2 -1.1 -1.3 -1.1
All indust. at basic
prices
100 100 100 100 100 100 100 100 100 100
Source: NBS (2014, 2015b), using GVA at basic prices (not GDP at market prices which is around 6-8% higher)
All major sectors of the Tanzanian economy show increases between 2005 and 2014 in real terms (using TZS 2007 values). Manufacturing doubled from TZS 1.55 trillion in 2005 to TZS 3 trillion. Agriculture remains the dominant individual sector, but at the aggregate level services sectors contribute the most to the economy. Manufacturing as a percentage of GDP hovered around 7-8% of GDP at basic prices (with provisional data pointing to a decreasing share in 2014), but construction, retail, transport and the ICT sectors show greater growth rates.
SUPPORTING THE PREPARATION OF TANZANIA’S SECOND FIVE YEAR DEVELOPMENT PLAN (FYDP II) 2016/17 – 2021/22
21
Over the last decade, the services industry has come to dominate the Tanzanian economy. The service sector is a driver for growth in the majority of developed and developing countries. What is different in the case of Tanzania is that the agricultural sector still plays a more important role than its industrial sector.
Tanzania revised its GDP data at the end of 2014. It began to use 2007 prices rather than 2001 prices, and moved (partly) from SNA (System of National Accounts) 1993 to partly SNA2008, and from the International Standard Industrial Classification of All Economic Activities (ISIC) Rev. 3.1 to Rev. 4. There is evidence of (faster) structural change than was previously measured: increase in share of tertiary sector in GDP (3 percentage points), decrease for primary (2 percentage points) and secondary (1 percentage point) sector (see Figure 4). There was a level shift in GDP in 2007 of 27.8%. The strongest increase in level of value added in crops, hunting and forestry; real estate and business services; and transport services.
Figure 4. Sectoral shares in Tanzanian value added in 2007 (pre- and post-rebasing)
Source: NBS
3.2 TRADE AND DIVERSIFICATION
FDI to Tanzania has steadily increased over the past two decades (Figure 5). Between 2005 and 2013 total FDI increased from USD 935.5 million to USD 1.87 billion – doubling in just under a decade. Net migrant remittances have also (modestly) increased in the period from 0.13% of GDP to 0.22%. Outward FDI flows are reported as 0% of GDP (UNCTAD).
Figure 5. FDI to Tanzania (USD million), 1995-2013
Source: UNSTATS, 2015
Similarly to FDI, the total value of trade has increased significantly in the last decade. Imports have risen to over USD 12 billion in value (Figure 6), whilst exports have also increased, from just under USD 2 billion
34%
19%
47%
32%
18%
50%
0%
10%
20%
30%
40%
50%
60%
Primary Seconday Tertiary
Old (pre-rebase)
New (post-rebase)
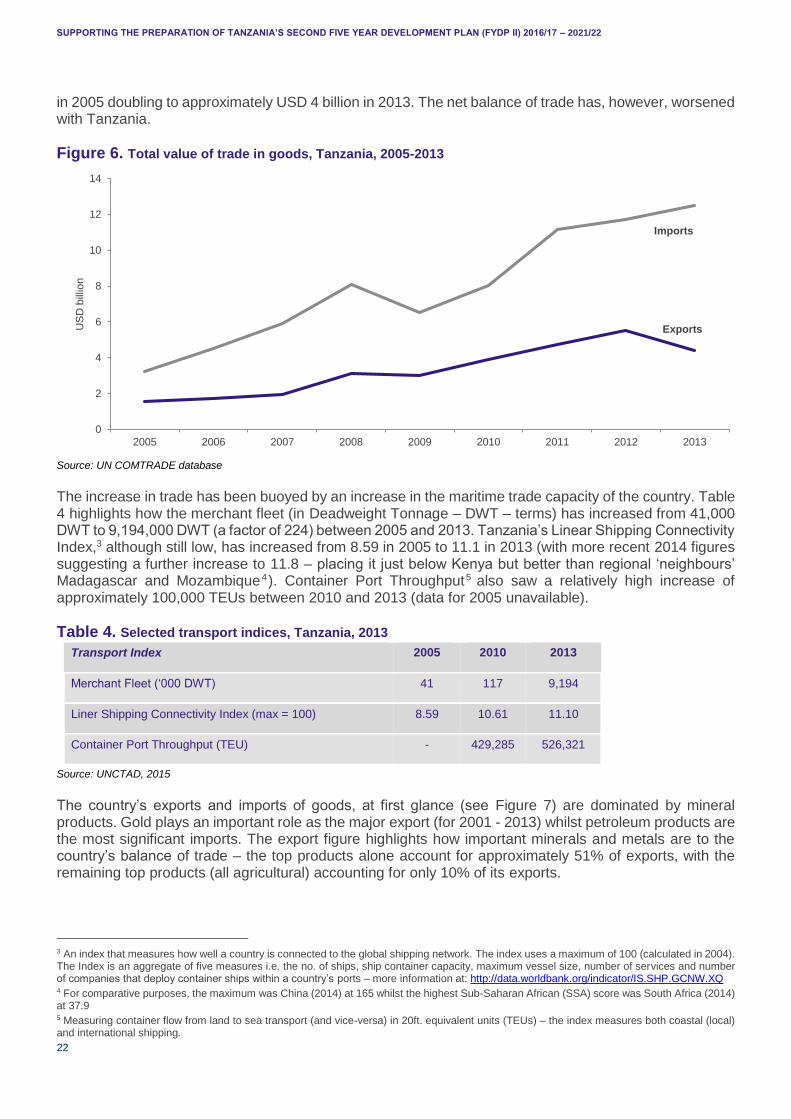
SUPPORTING THE PREPARATION OF TANZANIA’S SECOND FIVE YEAR DEVELOPMENT PLAN (FYDP II) 2016/17 – 2021/22
22
in 2005 doubling to approximately USD 4 billion in 2013. The net balance of trade has, however, worsened with Tanzania.
Figure 6. Total value of trade in goods, Tanzania, 2005-2013
Source: UN COMTRADE database
The increase in trade has been buoyed by an increase in the maritime trade capacity of the country. Table 4 highlights how the merchant fleet (in Deadweight Tonnage – DWT – terms) has increased from 41,000 DWT to 9,194,000 DWT (a factor of 224) between 2005 and 2013. Tanzania’s Linear Shipping Connectivity Index,3 although still low, has increased from 8.59 in 2005 to 11.1 in 2013 (with more recent 2014 figures suggesting a further increase to 11.8 – placing it just below Kenya but better than regional ‘neighbours’ Madagascar and Mozambique4). Container Port Throughput5 also saw a relatively high increase of approximately 100,000 TEUs between 2010 and 2013 (data for 2005 unavailable).
Table 4. Selected transport indices, Tanzania, 2013
Transport Index 2005 2010 2013
Merchant Fleet (‘000 DWT) 41 117 9,194
Liner Shipping Connectivity Index (max = 100) 8.59 10.61 11.10
Container Port Throughput (TEU) - 429,285 526,321
Source: UNCTAD, 2015
The country’s exports and imports of goods, at first glance (see Figure 7) are dominated by mineral products. Gold plays an important role as the major export (for 2001 - 2013) whilst petroleum products are the most significant imports. The export figure highlights how important minerals and metals are to the country’s balance of trade – the top products alone account for approximately 51% of exports, with the remaining top products (all agricultural) accounting for only 10% of its exports.
3 An index that measures how well a country is connected to the global shipping network. The index uses a maximum of 100 (calculated in 2004). The Index is an aggregate of five measures i.e. the no. of ships, ship container capacity, maximum vessel size, number of services and number of companies that deploy container ships within a country’s ports – more information at: http://data.worldbank.org/indicator/IS.SHP.GCNW.XQ 4 For comparative purposes, the maximum was China (2014) at 165 whilst the highest Sub-Saharan African (SSA) score was South Africa (2014) at 37.9 5 Measuring container flow from land to sea transport (and vice-versa) in 20ft. equivalent units (TEUs) – the index measures both coastal (local) and international shipping.
Exports
Imports
0
2
4
6
8
10
12
14
2005 2006 2007 2008 2009 2010 2011 2012 2013
US
D b
illio
n

SUPPORTING THE PREPARATION OF TANZANIA’S SECOND FIVE YEAR DEVELOPMENT PLAN (FYDP II) 2016/17 – 2021/22
23
Figure 7. Top export (left) and import (right) products, Tanzania (average 2011-2013)
Note: At Harmonised System 6-digit level.
Source: Authors’ calculations using data from the UN’s COMTRADE database.
The country’s main export partners (between 2011 and 2013) are India, Switzerland, the European Union (EU) and China as well as export presence in the Middle-East and regional trading partners (see Figure 8). The import situation is similar, although South Africa is the main partner.
Figure 8. Top export (left) and import (right) markets, Tanzania (average 2011-2013)
Note: At Harmonised System 6-digit level.
Source: Authors’ calculations using data from the UN’s COMTRADE database.
It is further important to realise that services exports have grown fast in recent years, and now amounts to USD 3.2 billion or 38% of total exports of goods and services. The growth of exports of goods and services in Tanzania between 2005 and 2013 is outlined in Figure 9.
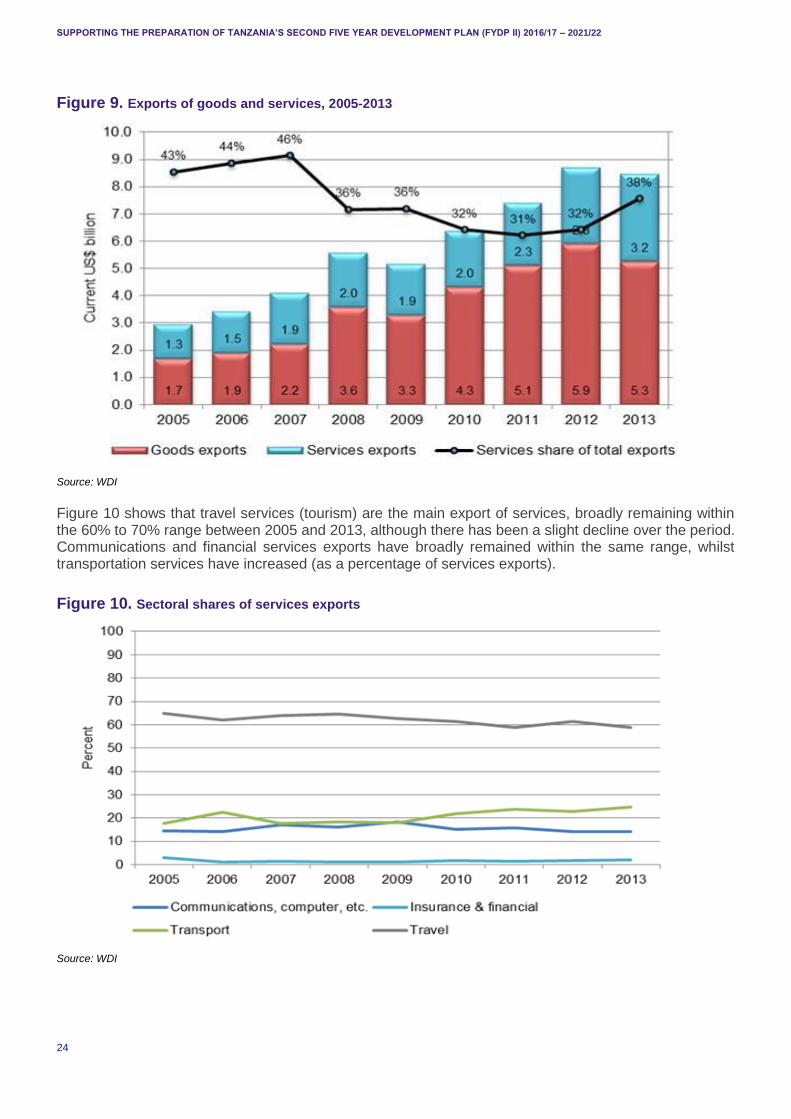
SUPPORTING THE PREPARATION OF TANZANIA’S SECOND FIVE YEAR DEVELOPMENT PLAN (FYDP II) 2016/17 – 2021/22
24
Figure 9. Exports of goods and services, 2005-2013
Source: WDI
Figure 10 shows that travel services (tourism) are the main export of services, broadly remaining within the 60% to 70% range between 2005 and 2013, although there has been a slight decline over the period. Communications and financial services exports have broadly remained within the same range, whilst transportation services have increased (as a percentage of services exports).
Figure 10. Sectoral shares of services exports
Source: WDI
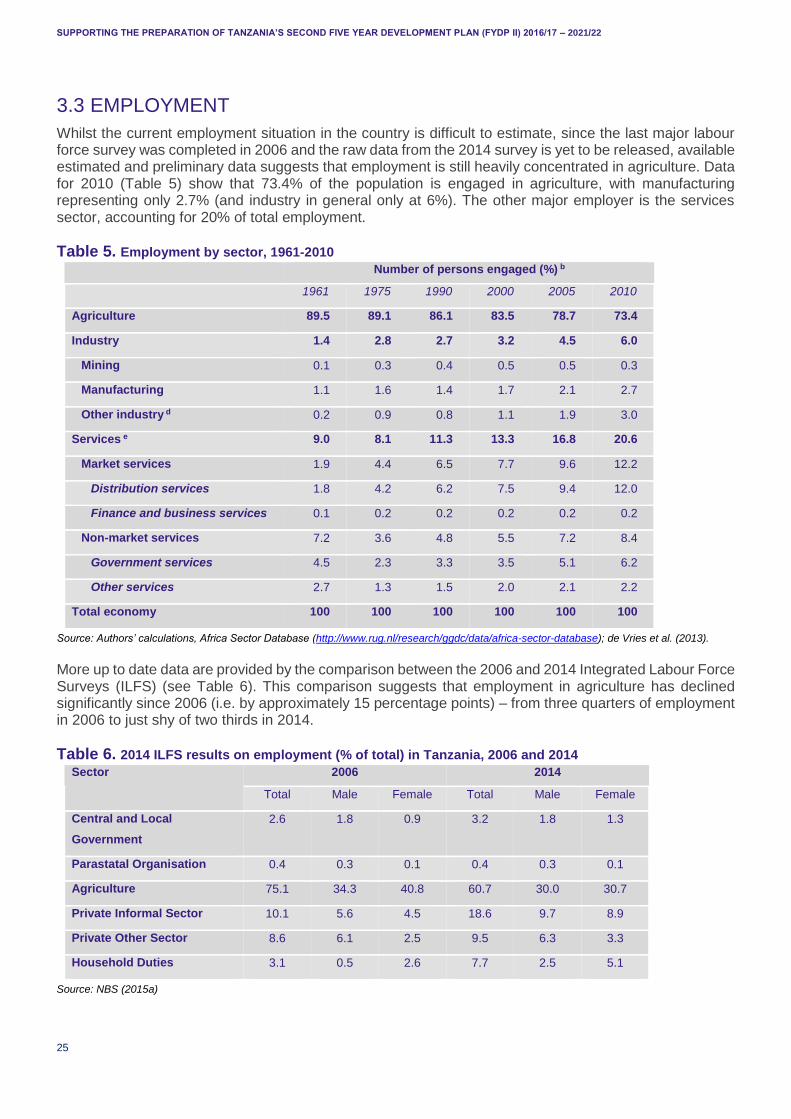
SUPPORTING THE PREPARATION OF TANZANIA’S SECOND FIVE YEAR DEVELOPMENT PLAN (FYDP II) 2016/17 – 2021/22
25
3.3 EMPLOYMENT
Whilst the current employment situation in the country is difficult to estimate, since the last major labour force survey was completed in 2006 and the raw data from the 2014 survey is yet to be released, available estimated and preliminary data suggests that employment is still heavily concentrated in agriculture. Data for 2010 (Table 5) show that 73.4% of the population is engaged in agriculture, with manufacturing representing only 2.7% (and industry in general only at 6%). The other major employer is the services sector, accounting for 20% of total employment.
Table 5. Employment by sector, 1961-2010
Number of persons engaged (%) b
1961 1975 1990 2000 2005 2010
Agriculture 89.5 89.1 86.1 83.5 78.7 73.4
Industry 1.4 2.8 2.7 3.2 4.5 6.0
Mining 0.1 0.3 0.4 0.5 0.5 0.3
Manufacturing 1.1 1.6 1.4 1.7 2.1 2.7
Other industry d 0.2 0.9 0.8 1.1 1.9 3.0
Services e 9.0 8.1 11.3 13.3 16.8 20.6
Market services 1.9 4.4 6.5 7.7 9.6 12.2
Distribution services 1.8 4.2 6.2 7.5 9.4 12.0
Finance and business services 0.1 0.2 0.2 0.2 0.2 0.2
Non-market services 7.2 3.6 4.8 5.5 7.2 8.4
Government services 4.5 2.3 3.3 3.5 5.1 6.2
Other services 2.7 1.3 1.5 2.0 2.1 2.2
Total economy 100 100 100 100 100 100
Source: Authors’ calculations, Africa Sector Database (http://www.rug.nl/research/ggdc/data/africa-sector-database); de Vries et al. (2013).
More up to date data are provided by the comparison between the 2006 and 2014 Integrated Labour Force Surveys (ILFS) (see Table 6). This comparison suggests that employment in agriculture has declined significantly since 2006 (i.e. by approximately 15 percentage points) – from three quarters of employment in 2006 to just shy of two thirds in 2014.
Table 6. 2014 ILFS results on employment (% of total) in Tanzania, 2006 and 2014
Sector 2006 2014
Total Male Female Total Male Female
Central and Local
Government
2.6 1.8 0.9 3.2 1.8 1.3
Parastatal Organisation 0.4 0.3 0.1 0.4 0.3 0.1
Agriculture 75.1 34.3 40.8 60.7 30.0 30.7
Private Informal Sector 10.1 5.6 4.5 18.6 9.7 8.9
Private Other Sector 8.6 6.1 2.5 9.5 6.3 3.3
Household Duties 3.1 0.5 2.6 7.7 2.5 5.1
Source: NBS (2015a)

SUPPORTING THE PREPARATION OF TANZANIA’S SECOND FIVE YEAR DEVELOPMENT PLAN (FYDP II) 2016/17 – 2021/22
26
The gender division in employment shows that by 2014 there was a similar representation of males and females across most sectors (i.e. around 30% of both males and females work in agriculture, a slightly greater percentage of males than females work in central and local government, parastatal organisations, and the private informal sector. The difference is starker in the case of other private sectors, while more than double the share of females compared to males undertake household duties. The paper by Fox (2016) examined the position of women in more detail.
When looking at formal employment (Table 7), manufacturing becomes the largest employment source, whilst agriculture falls to third place with public sector employment in second place. This confirms the fact that a large percentage of employment in agriculture is within the informal sector, whilst employment in manufacturing tends to occur on a more formal basis.
Table 7. Formal sector employment, 2012-2013 (%)
2012 2013
Agriculture, Forestry and Fisheries 9.2 11.3
Manufacturing 24.9 28.0
Wholesale and Retail Trade 11.6 10.2
Financial and Insurance Activities 2.7 2.3
Public Administration and Defence 27.4 22.6
Education 24.3 25.4
Source: NBS (2014b)
Finally, a breakdown of employment (Figure 11) by skill levels, broadly confirms that the majority (53%) of employment in Tanzania is undertaken by low skilled workers. The highest percentage of low skilled workers are those in the low-technology industries.
Figure 11. Labour skills by firm typologies, Tanzania, 2012
Note: Sector classification is as follows LT = Low Technology; RB = Resource Based; MT = Medium Technology and HT = High Technology
Source: UNIDO (2012)
SUPPORTING THE PREPARATION OF TANZANIA’S SECOND FIVE YEAR DEVELOPMENT PLAN (FYDP II) 2016/17 – 2021/22
27
3.4 LABOUR PRODUCTIVITY AND ECONOMIC TRANSFORMATION
We triangulate around three sources to understand growth in labour productivity and its sectoral components. All of the data sources suggest that in recent years structural changes across sectors have contributed around three quarters of productivity change.
First of all, Diao et al (2015) use GDP and employment data from the census in 2002 and 2012. They find that labour productivity, measured as GDP per worker, has grown by 4.1% annually on average over 2002-2012, compared to 1.5% annually over 1988-2002. The new data also show that structural change has actually been rapid in the recent decade. Between 2002 and 2012, agricultural employment grew at 0.4% average per year, while non-agricultural employment grew at 8.8%.
Growth in GDP and aggregated labour productivity over 2002-2012 was the result of both rapid expansion of non-agriculture (some 80% of economy-wide labour productivity growth results from structural change) and within agricultural sector’s labour productivity growth (although there was little growth in non-agricultural sector’s productivity). The annual growth rate of labour productivity for manufacturing is 0.4% and 0.9% for the trade services.
Labour productivity in the manufacturing sector is around 7-10 times higher than in agriculture. In 2002-2012, the annual growth rate of manufacturing GDP and employment is 8.4% and 8.0%, respectively, a doubling compared to 4.4% over 1988-2002. The manufacturing sector accounted for 13% of the economy’s labour productivity growth in 2002-2012.
Secondly, we have used International Labour Organization (ILO) and UN data on sector employment and value added data to undertake our own analysis to gain a recent picture of labour productivity change. Figure 12 shows that the employment share of agriculture is still declining, but that of wholesale, retail and hotels for example is increasing. The share of some high productivity sectors such as transport, storage and communication and construction is also increasing, contributing further to productivity enhancing structural change.
Over 2010-2013, two thirds of productivity change was due to structural change and one third due to within sector change (Figure 12). This is remarkable in two respects. This is higher than for any other period in Tanzania and it is greater than Uganda and Kenya over that period. Moreover, overall labour productivity change is more than twice as fast as Uganda and Kenya over 2010-2013.
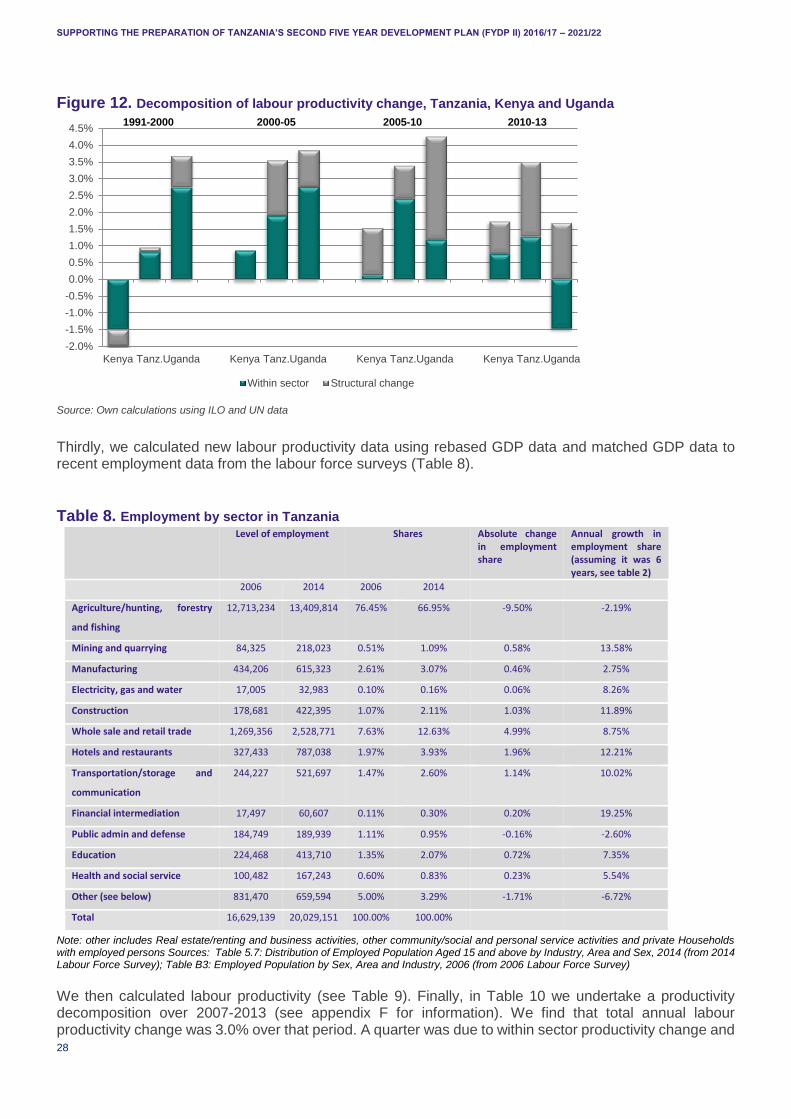
SUPPORTING THE PREPARATION OF TANZANIA’S SECOND FIVE YEAR DEVELOPMENT PLAN (FYDP II) 2016/17 – 2021/22
28
Figure 12. Decomposition of labour productivity change, Tanzania, Kenya and Uganda
Source: Own calculations using ILO and UN data
Thirdly, we calculated new labour productivity data using rebased GDP data and matched GDP data to recent employment data from the labour force surveys (Table 8).
Table 8. Employment by sector in Tanzania Level of employment Shares Absolute change
in employment share
Annual growth in employment share (assuming it was 6 years, see table 2)
2006 2014 2006 2014
Agriculture/hunting, forestry
and fishing
12,713,234 13,409,814 76.45% 66.95% -9.50% -2.19%
Mining and quarrying 84,325 218,023 0.51% 1.09% 0.58% 13.58%
Manufacturing 434,206 615,323 2.61% 3.07% 0.46% 2.75%
Electricity, gas and water 17,005 32,983 0.10% 0.16% 0.06% 8.26%
Construction 178,681 422,395 1.07% 2.11% 1.03% 11.89%
Whole sale and retail trade 1,269,356 2,528,771 7.63% 12.63% 4.99% 8.75%
Hotels and restaurants 327,433 787,038 1.97% 3.93% 1.96% 12.21%
Transportation/storage and
communication
244,227 521,697 1.47% 2.60% 1.14% 10.02%
Financial intermediation 17,497 60,607 0.11% 0.30% 0.20% 19.25%
Public admin and defense 184,749 189,939 1.11% 0.95% -0.16% -2.60%
Education 224,468 413,710 1.35% 2.07% 0.72% 7.35%
Health and social service 100,482 167,243 0.60% 0.83% 0.23% 5.54%
Other (see below) 831,470 659,594 5.00% 3.29% -1.71% -6.72%
Total 16,629,139 20,029,151 100.00% 100.00%
Note: other includes Real estate/renting and business activities, other community/social and personal service activities and private Households with employed persons Sources: Table 5.7: Distribution of Employed Population Aged 15 and above by Industry, Area and Sex, 2014 (from 2014 Labour Force Survey); Table B3: Employed Population by Sex, Area and Industry, 2006 (from 2006 Labour Force Survey)
We then calculated labour productivity (see Table 9). Finally, in Table 10 we undertake a productivity decomposition over 2007-2013 (see appendix F for information). We find that total annual labour productivity change was 3.0% over that period. A quarter was due to within sector productivity change and
-2.0%
-1.5%
-1.0%
-0.5%
0.0%
0.5%
1.0%
1.5%
2.0%
2.5%
3.0%
3.5%
4.0%
4.5%
Kenya Tanz.Uganda Kenya Tanz.Uganda Kenya Tanz.Uganda Kenya Tanz.Uganda
Within sector Structural change
1991-2000 2000-05 2005-10 2010-13
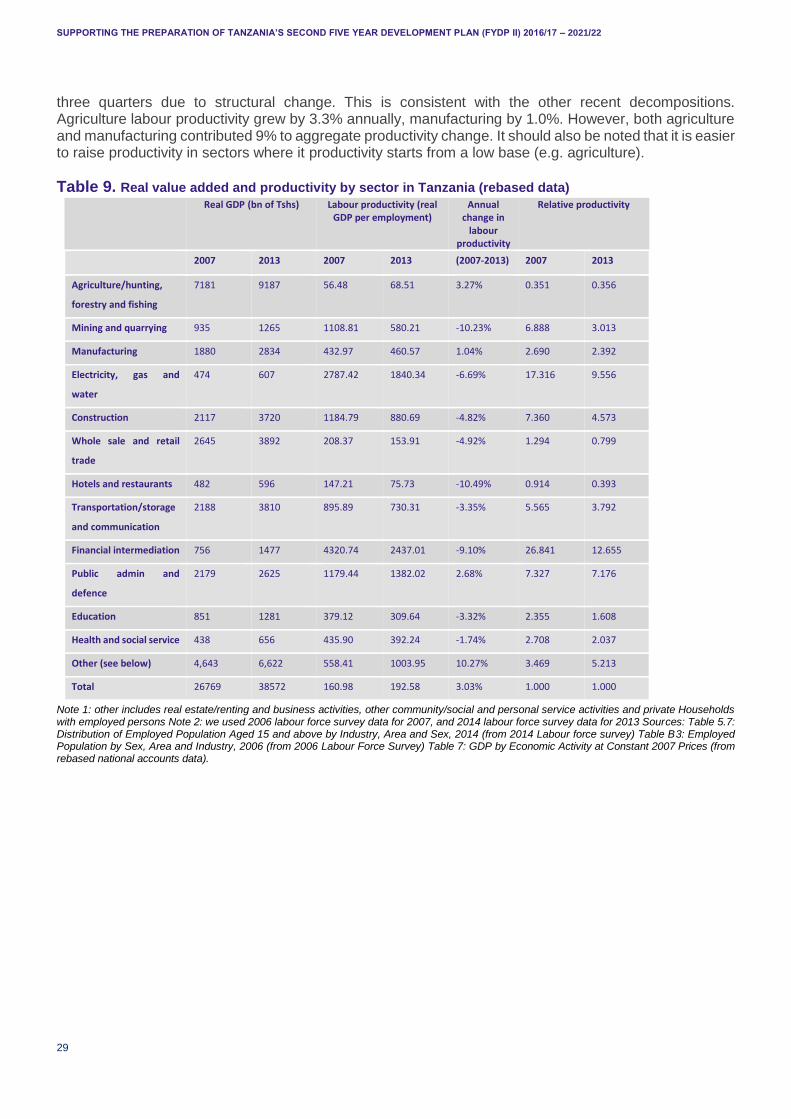
SUPPORTING THE PREPARATION OF TANZANIA’S SECOND FIVE YEAR DEVELOPMENT PLAN (FYDP II) 2016/17 – 2021/22
29
three quarters due to structural change. This is consistent with the other recent decompositions. Agriculture labour productivity grew by 3.3% annually, manufacturing by 1.0%. However, both agriculture and manufacturing contributed 9% to aggregate productivity change. It should also be noted that it is easier to raise productivity in sectors where it productivity starts from a low base (e.g. agriculture).
Table 9. Real value added and productivity by sector in Tanzania (rebased data)
Real GDP (bn of Tshs) Labour productivity (real GDP per employment)
Annual change in
labour productivity
Relative productivity
2007 2013 2007 2013 (2007-2013) 2007 2013
Agriculture/hunting,
forestry and fishing
7181 9187 56.48 68.51 3.27% 0.351 0.356
Mining and quarrying 935 1265 1108.81 580.21 -10.23% 6.888 3.013
Manufacturing 1880 2834 432.97 460.57 1.04% 2.690 2.392
Electricity, gas and
water
474 607 2787.42 1840.34 -6.69% 17.316 9.556
Construction 2117 3720 1184.79 880.69 -4.82% 7.360 4.573
Whole sale and retail
trade
2645 3892 208.37 153.91 -4.92% 1.294 0.799
Hotels and restaurants 482 596 147.21 75.73 -10.49% 0.914 0.393
Transportation/storage
and communication
2188 3810 895.89 730.31 -3.35% 5.565 3.792
Financial intermediation 756 1477 4320.74 2437.01 -9.10% 26.841 12.655
Public admin and
defence
2179 2625 1179.44 1382.02 2.68% 7.327 7.176
Education 851 1281 379.12 309.64 -3.32% 2.355 1.608
Health and social service 438 656 435.90 392.24 -1.74% 2.708 2.037
Other (see below) 4,643 6,622 558.41 1003.95 10.27% 3.469 5.213
Total 26769 38572 160.98 192.58 3.03% 1.000 1.000
Note 1: other includes real estate/renting and business activities, other community/social and personal service activities and private Households with employed persons Note 2: we used 2006 labour force survey data for 2007, and 2014 labour force survey data for 2013 Sources: Table 5.7: Distribution of Employed Population Aged 15 and above by Industry, Area and Sex, 2014 (from 2014 Labour force survey) Table B3: Employed Population by Sex, Area and Industry, 2006 (from 2006 Labour Force Survey) Table 7: GDP by Economic Activity at Constant 2007 Prices (from rebased national accounts data).

SUPPORTING THE PREPARATION OF TANZANIA’S SECOND FIVE YEAR DEVELOPMENT PLAN (FYDP II) 2016/17 – 2021/22
30
Table 10. Productivity decomposition in Tanzania, 2007-2013 Productivity due to Sector % contribution to total labour
productivity change
Within sector
changes
Between
sector
changes
total Within sector
changes
Between
sector
changes
total
Agriculture/hunting,
forestry and fishing
0.9% -0.6% 0.3% 30.1% -20.8% 8.9%
Mining and quarrying -0.4% 0.4% 0.1% -12.3% 14.6% 2.3%
Manufacturing 0.1% 0.2% 0.3% 2.5% 6.7% 8.8%
Electricity, gas and
water
-0.1% 0.1% 0.0% -4.1% 4.7% 0.6%
Construction -0.4% 0.9% 0.5% -13.1% 30.7% 16.9%
Whole sale and retail
trade
-0.5% 0.8% 0.3% -16.7% 28.2% 11.1%
Hotels and restaurants -0.2% 0.2% 0.0% -6.5% 6.8% 0.3%
Transportation/storage
and communication
-0.3% 0.8% 0.5% -9.4% 27.2% 17.1%
Financial
intermediation
-0.3% 0.5% 0.2% -8.8% 17.0% 7.8%
Public admin and
defence
0.2% -0.2% 0.0% 7.5% -7.5% 0.0%
Education -0.1% 0.2% 0.1% -3.6% 7.8% 4.0%
Health and social
service
0.0% 0.1% 0.1% -1.0% 3.1% 2.0%
Other (see below) 1.8% -1.3% 0.5% 61.1% -44.1% 16.3%
Total 0.8% 2.2% 3.0% 25.8% 74.2% 100.0%
Note: other includes real estate/renting and business activities, other community/social and personal service activities and private Households with employed persons Sources: Table 5.7: Distribution of Employed Population Aged 15 and above by Industry, Area and Sex, 2014 (from 2014 Labour Force Survey) Table B3: Employed Population by Sex, Area and Industry, 2006 (from 2006 Labour Force Survey) Table 7: GDP by Economic Activity at Constant 2007 Prices (from rebased national accounts data)
Turning our focus to the manufacturing sector, we now consider trends in MVA in the post-independence period. In the early post-independence period (1961-66), the rate of growth of MVA was high, but started from a very low base (Skarstein and Wangwe, 1986, Rweyemamu, 1973). On the back of high levels of state investment, the ratio of manufacturing MVA to GDP increased from 7.8% in 1966 to 10.2% in 1978, before declining thereafter due to the economic crisis. This disappointing performance persisted into the reform period starting in 1986, reflected in a period of deindustrialisation whereby the ratio of manufacturing MVA to GDP declined over time.
During the last decade, however, Tanzania’s manufacturing sector has recovered, with steady growth in the sector largely due to new investments by the private sector and the inflow of FDI. Tanzania’s MVA as a share of GDP has averaged around 7% over the last decade. It has also grown significantly – at around 8%, on average, per annum – over this period, rising from USD 894 million in 2000 to USD 1,992 million in 2010. This has been accompanied by strong economic growth – averaging 7% over the decade. However, in contrast to most other comparator countries (including Ethiopia, Zambia, Mozambique and Kenya) MVA growth has slowed noticeably since 2010, averaging 5.8% per year between 2010 and 2013 (UNIDO, 2015). This is generating concern that the gap between Tanzania’s capacity to produce manufactures and that in competitors such as Zambia and Vietnam will continue to grow, and those with lower production capacities (such as Rwanda and Ethiopia) will start to catch up with Tanzania (ibid.).

SUPPORTING THE PREPARATION OF TANZANIA’S SECOND FIVE YEAR DEVELOPMENT PLAN (FYDP II) 2016/17 – 2021/22
31
Moreover, Tanzania’s industrial base remains low, with MVA per capita of USD 46 (compared to USD 59 in Kenya and USD 238 in Vietnam) and even lower in Zanzibar at USD 18.5 in 2013 (ibid.). In addition, despite the growth in MVA, it is concentrated in a few low-tech sectors, with food and beverages accounting for nearly half of total MVA, followed by non-metallic mineral products (11%), tobacco (7%) and textiles (5%).6
Figure 13. Value of physical manufacturing output
0
2
4
6
8
10
12
0
200,000
400,000
600,000
800,000
1,000,000
1,200,000
1,400,000
1,600,000
1,800,000
2,000,000
1999 2000 2001 2002 2003 2004 2005 2006 2007 2008 2009 2010 2011
Gro
wth
rate
(%
)
TS
h. M
illi
on
Manufacturing Growth rate Source: NBS
The general improvements in MVA (albeit with slower growth since 2010) have been accompanied by a marginal increase in Tanzania’s impact in world production (measured as the country’s share in global MVA) between 2010 and 2013. Tanzania has also registered growth in manufactured exports, which increased from USD 129.1 million in 2000 to USD 1,903.6 million in 2010 at an average annual rate of 31% (outpacing comparator countries such as Burundi, Ethiopia, Kenya, Mozambique, Rwanda and Uganda), before dropping back to USD 1.62 billion in 2013 (UNIDO, 2015). Starting from a very low base, Tanzania has achieved a marked increase in the share of manufactures in total exports from 19.7% in 2000 to 48.5% in 2010.
Much of this growth has been fuelled by expansion in exports of resource-based manufactured products with low levels of value addition (Kahyarara, 2013). Almost half of the country´s manufactured exports in 2010 were base and precious metal ore – resource based products and the rising prices of gold accounted for a substantial share of the Tanzanian growth. As of 2013, medium- and high-tech products accounted for just 25% of Tanzania’s total manufactured exports (UNIDO, 2015). Even so, it is evident that that deepening of the Tanzanian export structure is occurring. For instance, medium-tech export growth increased from 7.3% to 13.6% between 2000 and 2010. Moreover, since 2010 the share of Tanzania’s medium- and high-tech manufacturing exports in total manufacturing exports has increased (see Figure 14), although this is due to both growth in Tanzania’s medium- and high-tech exports – at an average annual rate of 12% between 2010 and 2013 – and declining growth rates of exports of resource-based (by 10%) and low tech products (3%) over the same period (ibid.).
6 Tanzania Industrial Competitive Report for 2012.
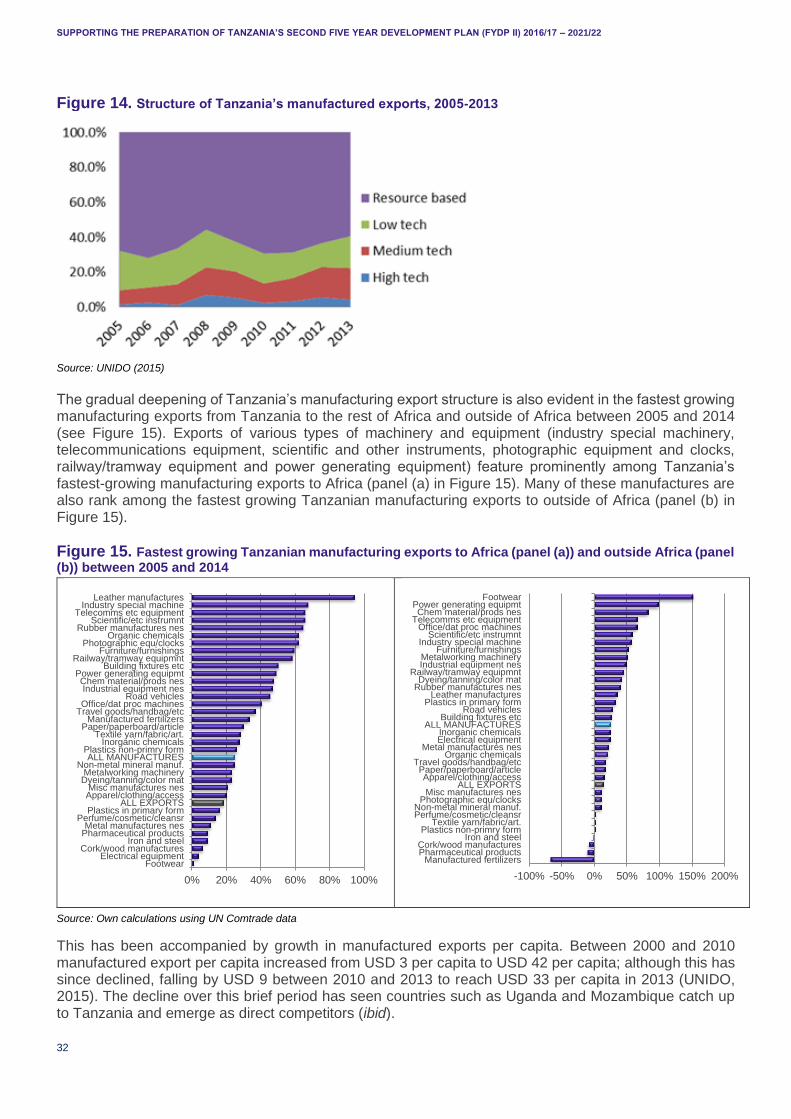
SUPPORTING THE PREPARATION OF TANZANIA’S SECOND FIVE YEAR DEVELOPMENT PLAN (FYDP II) 2016/17 – 2021/22
32
Figure 14. Structure of Tanzania’s manufactured exports, 2005-2013
Source: UNIDO (2015)
The gradual deepening of Tanzania’s manufacturing export structure is also evident in the fastest growing manufacturing exports from Tanzania to the rest of Africa and outside of Africa between 2005 and 2014 (see Figure 15). Exports of various types of machinery and equipment (industry special machinery, telecommunications equipment, scientific and other instruments, photographic equipment and clocks, railway/tramway equipment and power generating equipment) feature prominently among Tanzania’s fastest-growing manufacturing exports to Africa (panel (a) in Figure 15). Many of these manufactures are also rank among the fastest growing Tanzanian manufacturing exports to outside of Africa (panel (b) in Figure 15).
Figure 15. Fastest growing Tanzanian manufacturing exports to Africa (panel (a)) and outside Africa (panel (b)) between 2005 and 2014
Source: Own calculations using UN Comtrade data
This has been accompanied by growth in manufactured exports per capita. Between 2000 and 2010 manufactured export per capita increased from USD 3 per capita to USD 42 per capita; although this has since declined, falling by USD 9 between 2010 and 2013 to reach USD 33 per capita in 2013 (UNIDO, 2015). The decline over this brief period has seen countries such as Uganda and Mozambique catch up to Tanzania and emerge as direct competitors (ibid).
0% 20% 40% 60% 80% 100%
FootwearElectrical equipment
Cork/wood manufacturesIron and steel
Pharmaceutical productsMetal manufactures nes
Perfume/cosmetic/cleansrPlastics in primary form
ALL EXPORTSApparel/clothing/accessMisc manufactures nes
Dyeing/tanning/color matMetalworking machinery
Non-metal mineral manuf.ALL MANUFACTURES
Plastics non-primry formInorganic chemicals
Textile yarn/fabric/art.Paper/paperboard/article
Manufactured fertilizersTravel goods/handbag/etcOffice/dat proc machines
Road vehiclesIndustrial equipment nes
Chem material/prods nesPower generating equipmt
Building fixtures etcRailway/tramway equipmnt
Furniture/furnishingsPhotographic equ/clocks
Organic chemicalsRubber manufactures nes
Scientific/etc instrumntTelecomms etc equipment
Industry special machineLeather manufactures
-100% -50% 0% 50% 100% 150% 200%
Manufactured fertilizersPharmaceutical productsCork/wood manufactures
Iron and steelPlastics non-primry form
Textile yarn/fabric/art.Perfume/cosmetic/cleansrNon-metal mineral manuf.
Photographic equ/clocksMisc manufactures nes
ALL EXPORTSApparel/clothing/access
Paper/paperboard/articleTravel goods/handbag/etc
Organic chemicalsMetal manufactures nes
Electrical equipmentInorganic chemicals
ALL MANUFACTURESBuilding fixtures etc
Road vehiclesPlastics in primary form
Leather manufacturesRubber manufactures nesDyeing/tanning/color mat
Railway/tramway equipmntIndustrial equipment nesMetalworking machinery
Furniture/furnishingsIndustry special machine
Scientific/etc instrumntOffice/dat proc machines
Telecomms etc equipmentChem material/prods nes
Power generating equipmtFootwear
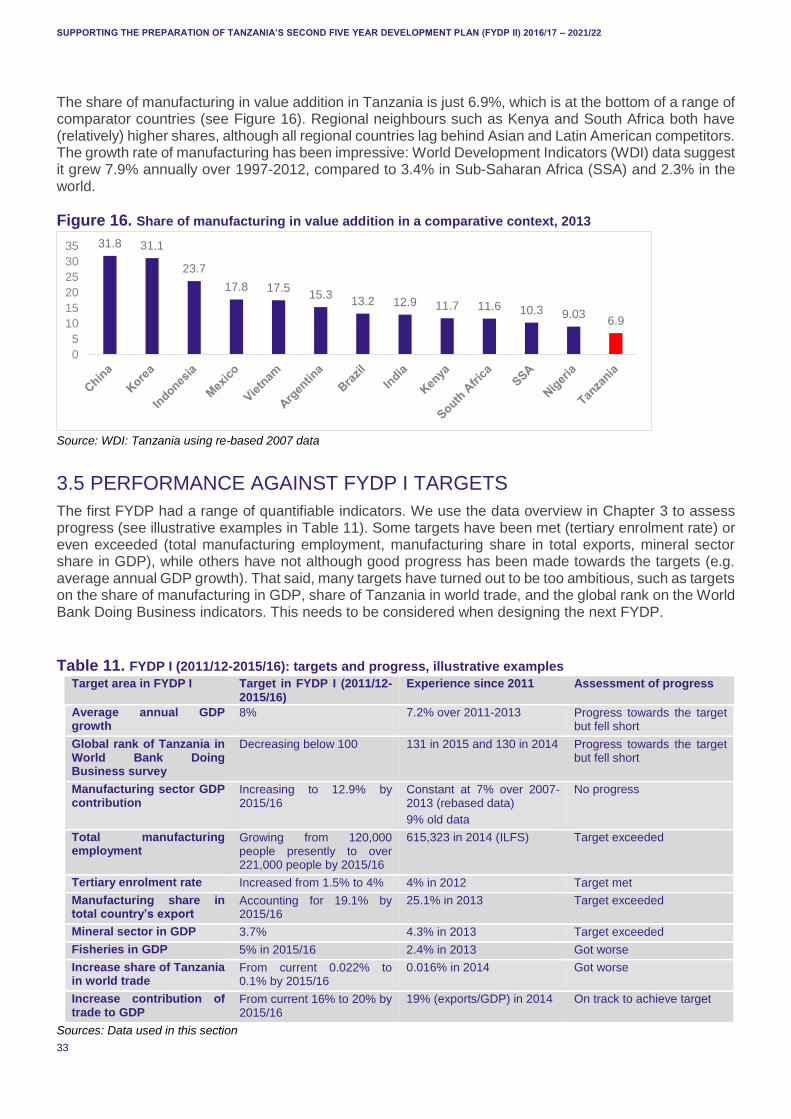
SUPPORTING THE PREPARATION OF TANZANIA’S SECOND FIVE YEAR DEVELOPMENT PLAN (FYDP II) 2016/17 – 2021/22
33
The share of manufacturing in value addition in Tanzania is just 6.9%, which is at the bottom of a range of comparator countries (see Figure 16). Regional neighbours such as Kenya and South Africa both have (relatively) higher shares, although all regional countries lag behind Asian and Latin American competitors. The growth rate of manufacturing has been impressive: World Development Indicators (WDI) data suggest it grew 7.9% annually over 1997-2012, compared to 3.4% in Sub-Saharan Africa (SSA) and 2.3% in the world.
Figure 16. Share of manufacturing in value addition in a comparative context, 2013
Source: WDI: Tanzania using re-based 2007 data
3.5 PERFORMANCE AGAINST FYDP I TARGETS
The first FYDP had a range of quantifiable indicators. We use the data overview in Chapter 3 to assess progress (see illustrative examples in Table 11). Some targets have been met (tertiary enrolment rate) or even exceeded (total manufacturing employment, manufacturing share in total exports, mineral sector share in GDP), while others have not although good progress has been made towards the targets (e.g. average annual GDP growth). That said, many targets have turned out to be too ambitious, such as targets on the share of manufacturing in GDP, share of Tanzania in world trade, and the global rank on the World Bank Doing Business indicators. This needs to be considered when designing the next FYDP.
Table 11. FYDP I (2011/12-2015/16): targets and progress, illustrative examples
Target area in FYDP I Target in FYDP I (2011/12-2015/16)
Experience since 2011 Assessment of progress
Average annual GDP growth
8% 7.2% over 2011-2013 Progress towards the target but fell short
Global rank of Tanzania in World Bank Doing Business survey
Decreasing below 100 131 in 2015 and 130 in 2014 Progress towards the target but fell short
Manufacturing sector GDP contribution
Increasing to 12.9% by 2015/16
Constant at 7% over 2007-2013 (rebased data)
9% old data
No progress
Total manufacturing employment
Growing from 120,000 people presently to over 221,000 people by 2015/16
615,323 in 2014 (ILFS) Target exceeded
Tertiary enrolment rate Increased from 1.5% to 4% 4% in 2012 Target met
Manufacturing share in total country’s export
Accounting for 19.1% by 2015/16
25.1% in 2013 Target exceeded
Mineral sector in GDP 3.7% 4.3% in 2013 Target exceeded
Fisheries in GDP 5% in 2015/16 2.4% in 2013 Got worse
Increase share of Tanzania in world trade
From current 0.022% to 0.1% by 2015/16
0.016% in 2014 Got worse
Increase contribution of trade to GDP
From current 16% to 20% by 2015/16
19% (exports/GDP) in 2014 On track to achieve target
Sources: Data used in this section
31.8 31.1
23.7
17.8 17.515.3
13.2 12.9 11.7 11.6 10.3 9.036.9
0
5
10
15
20
25
30
35
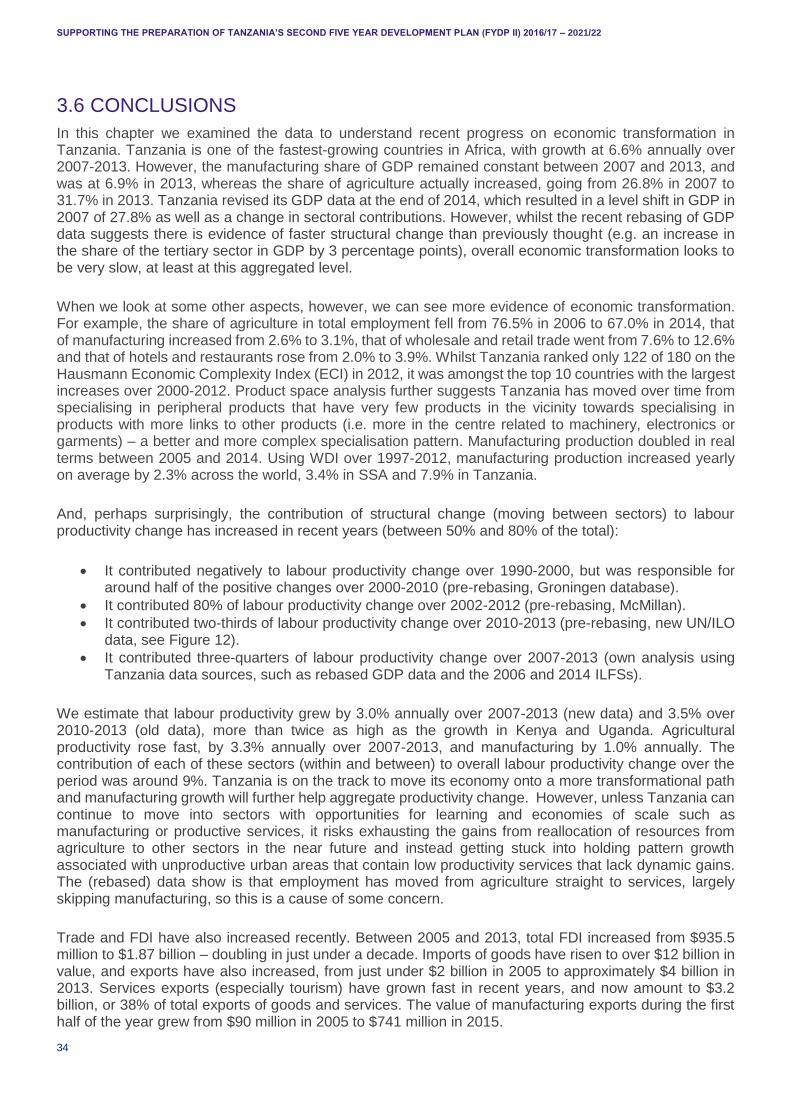
SUPPORTING THE PREPARATION OF TANZANIA’S SECOND FIVE YEAR DEVELOPMENT PLAN (FYDP II) 2016/17 – 2021/22
34
3.6 CONCLUSIONS
In this chapter we examined the data to understand recent progress on economic transformation in Tanzania. Tanzania is one of the fastest-growing countries in Africa, with growth at 6.6% annually over 2007-2013. However, the manufacturing share of GDP remained constant between 2007 and 2013, and was at 6.9% in 2013, whereas the share of agriculture actually increased, going from 26.8% in 2007 to 31.7% in 2013. Tanzania revised its GDP data at the end of 2014, which resulted in a level shift in GDP in 2007 of 27.8% as well as a change in sectoral contributions. However, whilst the recent rebasing of GDP data suggests there is evidence of faster structural change than previously thought (e.g. an increase in the share of the tertiary sector in GDP by 3 percentage points), overall economic transformation looks to be very slow, at least at this aggregated level.
When we look at some other aspects, however, we can see more evidence of economic transformation. For example, the share of agriculture in total employment fell from 76.5% in 2006 to 67.0% in 2014, that of manufacturing increased from 2.6% to 3.1%, that of wholesale and retail trade went from 7.6% to 12.6% and that of hotels and restaurants rose from 2.0% to 3.9%. Whilst Tanzania ranked only 122 of 180 on the Hausmann Economic Complexity Index (ECI) in 2012, it was amongst the top 10 countries with the largest increases over 2000-2012. Product space analysis further suggests Tanzania has moved over time from specialising in peripheral products that have very few products in the vicinity towards specialising in products with more links to other products (i.e. more in the centre related to machinery, electronics or garments) – a better and more complex specialisation pattern. Manufacturing production doubled in real terms between 2005 and 2014. Using WDI over 1997-2012, manufacturing production increased yearly on average by 2.3% across the world, 3.4% in SSA and 7.9% in Tanzania.
And, perhaps surprisingly, the contribution of structural change (moving between sectors) to labour productivity change has increased in recent years (between 50% and 80% of the total):
It contributed negatively to labour productivity change over 1990-2000, but was responsible for around half of the positive changes over 2000-2010 (pre-rebasing, Groningen database).
It contributed 80% of labour productivity change over 2002-2012 (pre-rebasing, McMillan).
It contributed two-thirds of labour productivity change over 2010-2013 (pre-rebasing, new UN/ILO data, see Figure 12).
It contributed three-quarters of labour productivity change over 2007-2013 (own analysis using Tanzania data sources, such as rebased GDP data and the 2006 and 2014 ILFSs).
We estimate that labour productivity grew by 3.0% annually over 2007-2013 (new data) and 3.5% over 2010-2013 (old data), more than twice as high as the growth in Kenya and Uganda. Agricultural productivity rose fast, by 3.3% annually over 2007-2013, and manufacturing by 1.0% annually. The contribution of each of these sectors (within and between) to overall labour productivity change over the period was around 9%. Tanzania is on the track to move its economy onto a more transformational path and manufacturing growth will further help aggregate productivity change. However, unless Tanzania can continue to move into sectors with opportunities for learning and economies of scale such as manufacturing or productive services, it risks exhausting the gains from reallocation of resources from agriculture to other sectors in the near future and instead getting stuck into holding pattern growth associated with unproductive urban areas that contain low productivity services that lack dynamic gains. The (rebased) data show is that employment has moved from agriculture straight to services, largely skipping manufacturing, so this is a cause of some concern.
Trade and FDI have also increased recently. Between 2005 and 2013, total FDI increased from $935.5 million to $1.87 billion – doubling in just under a decade. Imports of goods have risen to over $12 billion in value, and exports have also increased, from just under $2 billion in 2005 to approximately $4 billion in 2013. Services exports (especially tourism) have grown fast in recent years, and now amount to $3.2 billion, or 38% of total exports of goods and services. The value of manufacturing exports during the first half of the year grew from $90 million in 2005 to $741 million in 2015.

SUPPORTING THE PREPARATION OF TANZANIA’S SECOND FIVE YEAR DEVELOPMENT PLAN (FYDP II) 2016/17 – 2021/22
35
We have used the data analysis to check progress against FYDP I targets and find that some targets have been far too ambitious. But others looked fine.
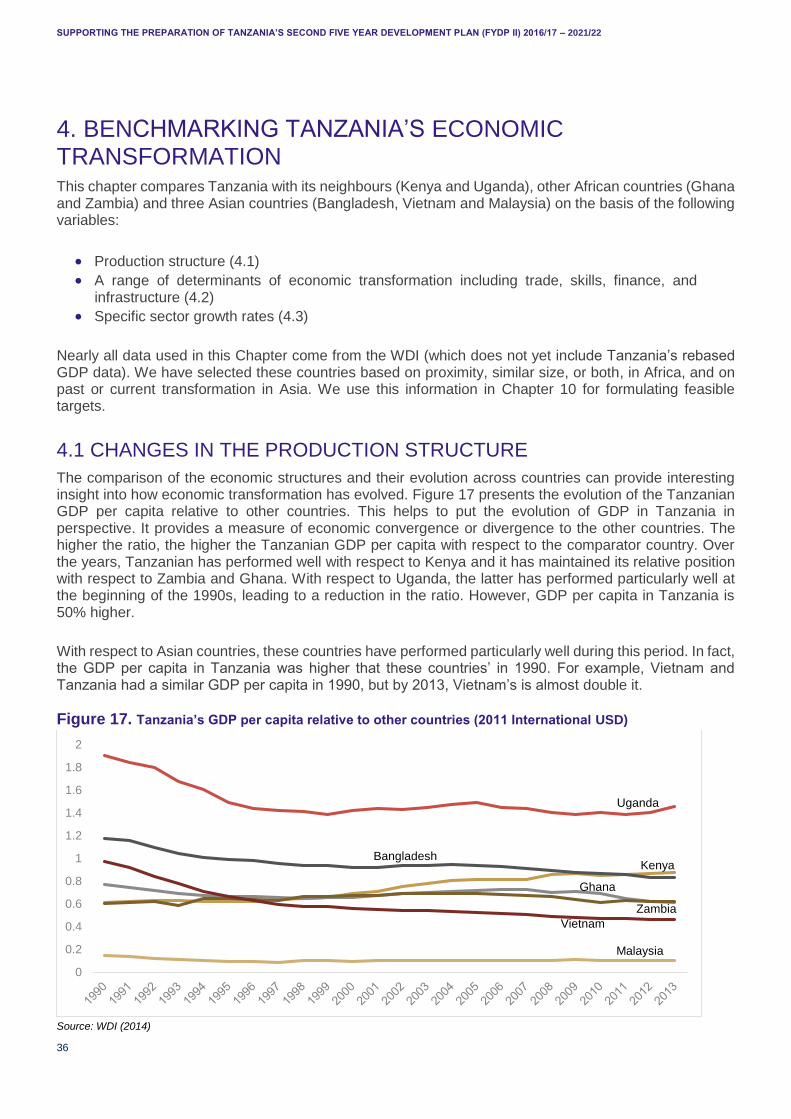
SUPPORTING THE PREPARATION OF TANZANIA’S SECOND FIVE YEAR DEVELOPMENT PLAN (FYDP II) 2016/17 – 2021/22
36
4. BENCHMARKING TANZANIA’S ECONOMIC TRANSFORMATION This chapter compares Tanzania with its neighbours (Kenya and Uganda), other African countries (Ghana and Zambia) and three Asian countries (Bangladesh, Vietnam and Malaysia) on the basis of the following variables:
Production structure (4.1)
A range of determinants of economic transformation including trade, skills, finance, and infrastructure (4.2)
Specific sector growth rates (4.3)
Nearly all data used in this Chapter come from the WDI (which does not yet include Tanzania’s rebased GDP data). We have selected these countries based on proximity, similar size, or both, in Africa, and on past or current transformation in Asia. We use this information in Chapter 10 for formulating feasible targets.
4.1 CHANGES IN THE PRODUCTION STRUCTURE
The comparison of the economic structures and their evolution across countries can provide interesting insight into how economic transformation has evolved. Figure 17 presents the evolution of the Tanzanian GDP per capita relative to other countries. This helps to put the evolution of GDP in Tanzania in perspective. It provides a measure of economic convergence or divergence to the other countries. The higher the ratio, the higher the Tanzanian GDP per capita with respect to the comparator country. Over the years, Tanzanian has performed well with respect to Kenya and it has maintained its relative position with respect to Zambia and Ghana. With respect to Uganda, the latter has performed particularly well at the beginning of the 1990s, leading to a reduction in the ratio. However, GDP per capita in Tanzania is 50% higher.
With respect to Asian countries, these countries have performed particularly well during this period. In fact, the GDP per capita in Tanzania was higher that these countries’ in 1990. For example, Vietnam and Tanzania had a similar GDP per capita in 1990, but by 2013, Vietnam’s is almost double it.
Figure 17. Tanzania’s GDP per capita relative to other countries (2011 International USD)
Source: WDI (2014)
0
0.2
0.4
0.6
0.8
1
1.2
1.4
1.6
1.8
2
Uganda
BangladeshKenya
Ghana
Zambia
Vietnam
Malaysia
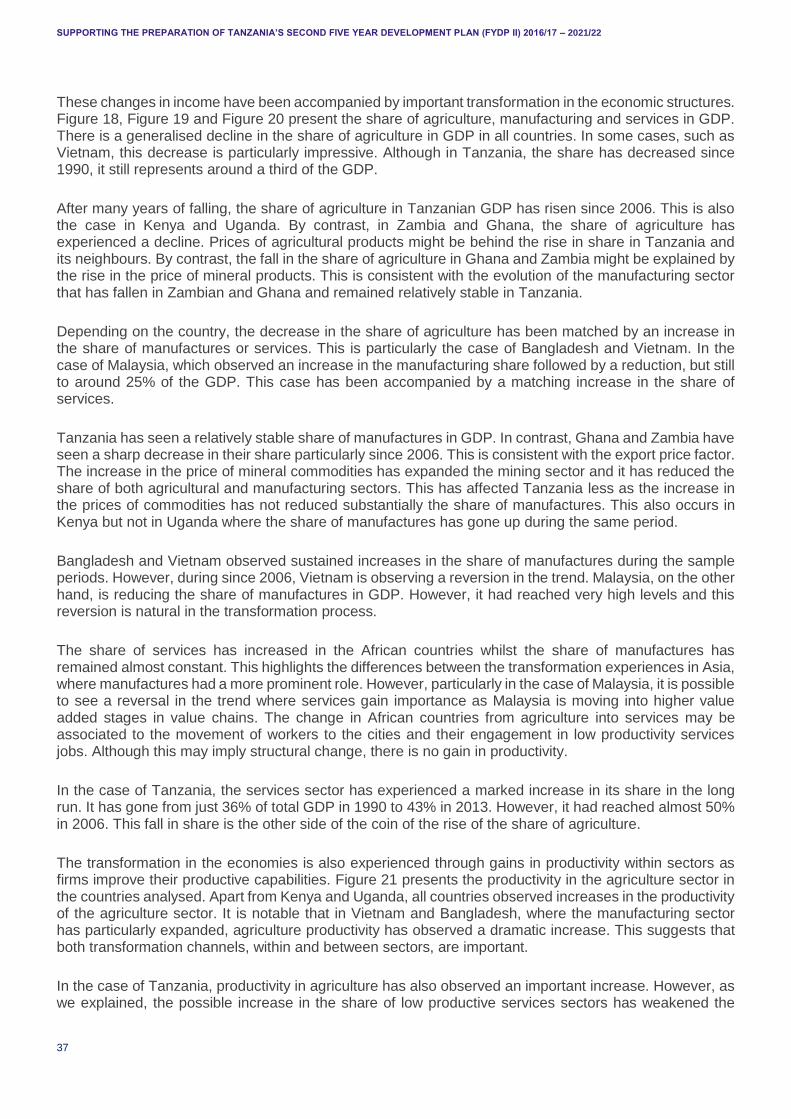
SUPPORTING THE PREPARATION OF TANZANIA’S SECOND FIVE YEAR DEVELOPMENT PLAN (FYDP II) 2016/17 – 2021/22
37
These changes in income have been accompanied by important transformation in the economic structures. Figure 18, Figure 19 and Figure 20 present the share of agriculture, manufacturing and services in GDP. There is a generalised decline in the share of agriculture in GDP in all countries. In some cases, such as Vietnam, this decrease is particularly impressive. Although in Tanzania, the share has decreased since 1990, it still represents around a third of the GDP.
After many years of falling, the share of agriculture in Tanzanian GDP has risen since 2006. This is also the case in Kenya and Uganda. By contrast, in Zambia and Ghana, the share of agriculture has experienced a decline. Prices of agricultural products might be behind the rise in share in Tanzania and its neighbours. By contrast, the fall in the share of agriculture in Ghana and Zambia might be explained by the rise in the price of mineral products. This is consistent with the evolution of the manufacturing sector that has fallen in Zambian and Ghana and remained relatively stable in Tanzania.
Depending on the country, the decrease in the share of agriculture has been matched by an increase in the share of manufactures or services. This is particularly the case of Bangladesh and Vietnam. In the case of Malaysia, which observed an increase in the manufacturing share followed by a reduction, but still to around 25% of the GDP. This case has been accompanied by a matching increase in the share of services.
Tanzania has seen a relatively stable share of manufactures in GDP. In contrast, Ghana and Zambia have seen a sharp decrease in their share particularly since 2006. This is consistent with the export price factor. The increase in the price of mineral commodities has expanded the mining sector and it has reduced the share of both agricultural and manufacturing sectors. This has affected Tanzania less as the increase in the prices of commodities has not reduced substantially the share of manufactures. This also occurs in Kenya but not in Uganda where the share of manufactures has gone up during the same period.
Bangladesh and Vietnam observed sustained increases in the share of manufactures during the sample periods. However, during since 2006, Vietnam is observing a reversion in the trend. Malaysia, on the other hand, is reducing the share of manufactures in GDP. However, it had reached very high levels and this reversion is natural in the transformation process.
The share of services has increased in the African countries whilst the share of manufactures has remained almost constant. This highlights the differences between the transformation experiences in Asia, where manufactures had a more prominent role. However, particularly in the case of Malaysia, it is possible to see a reversal in the trend where services gain importance as Malaysia is moving into higher value added stages in value chains. The change in African countries from agriculture into services may be associated to the movement of workers to the cities and their engagement in low productivity services jobs. Although this may imply structural change, there is no gain in productivity.
In the case of Tanzania, the services sector has experienced a marked increase in its share in the long run. It has gone from just 36% of total GDP in 1990 to 43% in 2013. However, it had reached almost 50% in 2006. This fall in share is the other side of the coin of the rise of the share of agriculture.
The transformation in the economies is also experienced through gains in productivity within sectors as firms improve their productive capabilities. Figure 21 presents the productivity in the agriculture sector in the countries analysed. Apart from Kenya and Uganda, all countries observed increases in the productivity of the agriculture sector. It is notable that in Vietnam and Bangladesh, where the manufacturing sector has particularly expanded, agriculture productivity has observed a dramatic increase. This suggests that both transformation channels, within and between sectors, are important.
In the case of Tanzania, productivity in agriculture has also observed an important increase. However, as we explained, the possible increase in the share of low productive services sectors has weakened the
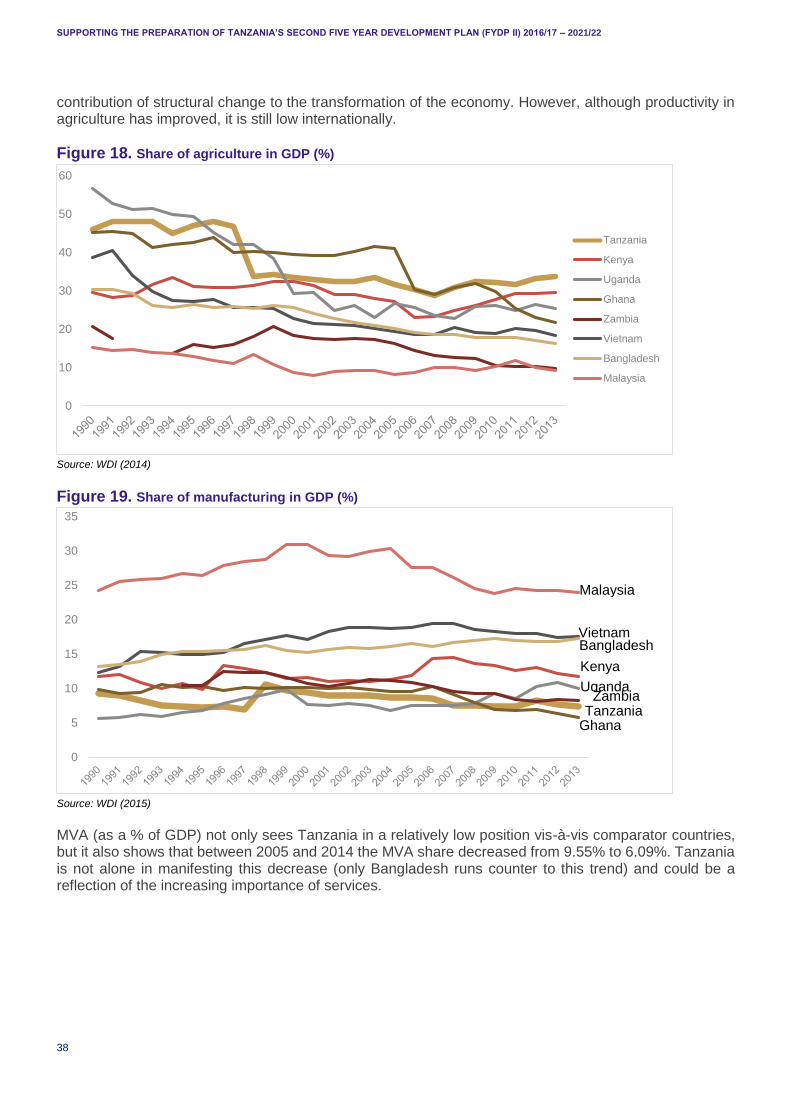
SUPPORTING THE PREPARATION OF TANZANIA’S SECOND FIVE YEAR DEVELOPMENT PLAN (FYDP II) 2016/17 – 2021/22
38
contribution of structural change to the transformation of the economy. However, although productivity in agriculture has improved, it is still low internationally.
Figure 18. Share of agriculture in GDP (%)
Source: WDI (2014)
Figure 19. Share of manufacturing in GDP (%)
Source: WDI (2015)
MVA (as a % of GDP) not only sees Tanzania in a relatively low position vis-à-vis comparator countries, but it also shows that between 2005 and 2014 the MVA share decreased from 9.55% to 6.09%. Tanzania is not alone in manifesting this decrease (only Bangladesh runs counter to this trend) and could be a reflection of the increasing importance of services.
0
10
20
30
40
50
60
Tanzania
Kenya
Uganda
Ghana
Zambia
Vietnam
Bangladesh
Malaysia
0
5
10
15
20
25
30
35
Malaysia
VietnamBangladesh
Kenya
UgandaZambia
TanzaniaGhana
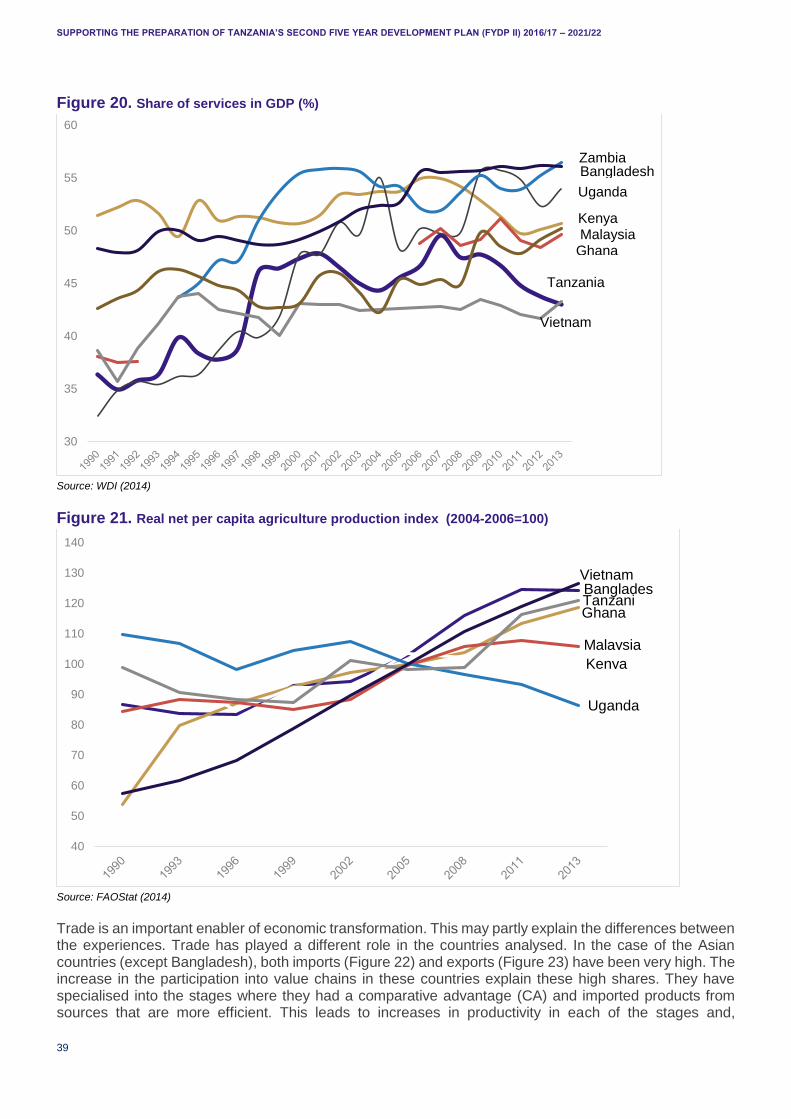
SUPPORTING THE PREPARATION OF TANZANIA’S SECOND FIVE YEAR DEVELOPMENT PLAN (FYDP II) 2016/17 – 2021/22
39
Figure 20. Share of services in GDP (%)
Source: WDI (2014)
Figure 21. Real net per capita agriculture production index (2004-2006=100)
Source: FAOStat (2014)
Trade is an important enabler of economic transformation. This may partly explain the differences between the experiences. Trade has played a different role in the countries analysed. In the case of the Asian countries (except Bangladesh), both imports (Figure 22) and exports (Figure 23) have been very high. The increase in the participation into value chains in these countries explain these high shares. They have specialised into the stages where they had a comparative advantage (CA) and imported products from sources that are more efficient. This leads to increases in productivity in each of the stages and,
30
35
40
45
50
55
60
ZambiaBangladesh
Uganda
KenyaMalaysia
Ghana
Tanzania
Vietnam
40
50
60
70
80
90
100
110
120
130
140
VietnamBangladesTanzaniGhana
Malaysia
Kenya
Uganda

SUPPORTING THE PREPARATION OF TANZANIA’S SECOND FIVE YEAR DEVELOPMENT PLAN (FYDP II) 2016/17 – 2021/22
40
consequently, on the whole chain. On the other hand, they have also become providers of inputs into other stages of the chains or, if they specialise in the final parts of the chain, providers of final products.
Trade, on the other hand, has played a more modest role in the African countries, particularly in Kenya. Exports remain a low share of GDP and imports are still too low to generate important transformation effects. However, it was easier for Asian countries to engage in value chains, particularly in the assembly stages, for multiple reasons. The same experience may not be replicable in Tanzania and other African countries.
Food and live animals and crude materials (inedible) represent more than 60% of total exports. This composition is similar to the observed in Kenya and Uganda, but differs markedly from the other comparators. In the case of Zambia and Ghana, manufactured goods classified chiefly by material, dominate the composition. It is important to highlight that some basic mineral processed products are included in this group.
The contrast with Asian countries is also revealing. There is heterogeneity between them. Most of Bangladeshi exports are concentrated in miscellaneous manufactured articles (textiles) whilst Vietnam and Malaysia present higher exports in machinery and transport equipment. Note that in the case of Malaysia, mineral fuels and lubricants represent a very high share of their exports.
Figure 22. Share of goods and services imports in GDP (%)
Source: WDI (2014)
0
10
20
30
40
50
60
70
80
90
100
1992 1995 1998 2001 2004 2007 2010 2013
Vietnam
Malaysia
Ghana
Zambia
KenyaTanzaniaUgandaBangladesh
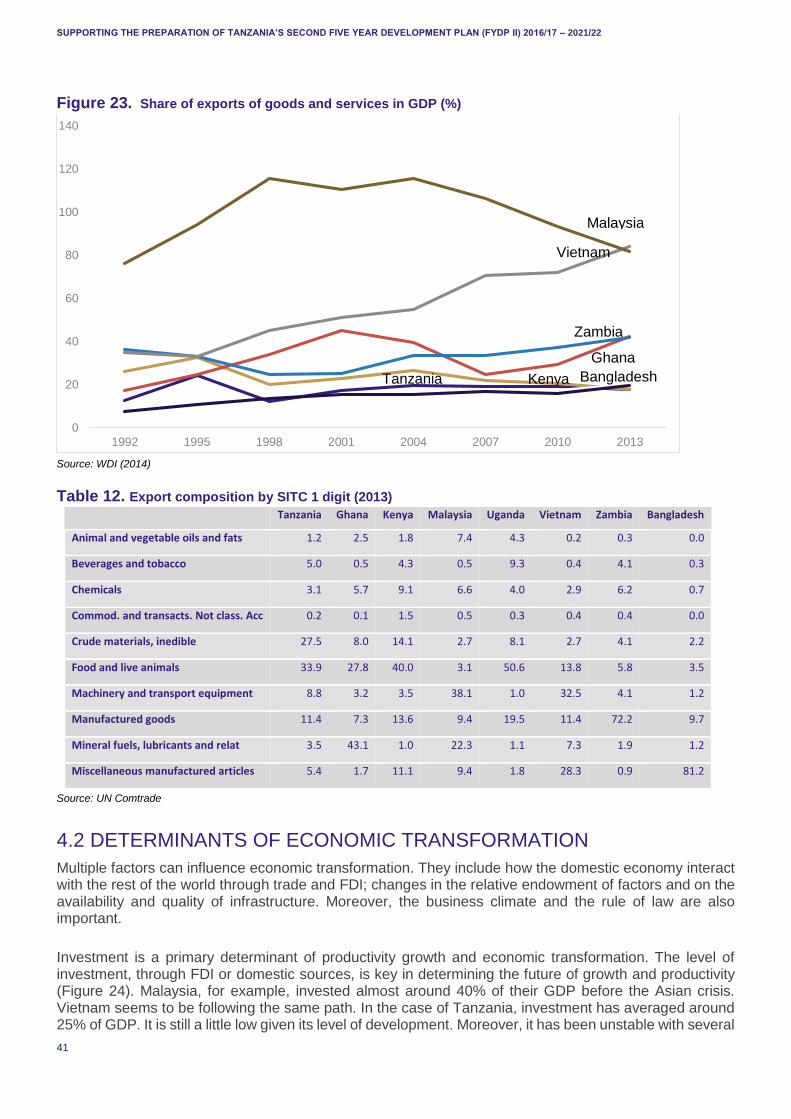
SUPPORTING THE PREPARATION OF TANZANIA’S SECOND FIVE YEAR DEVELOPMENT PLAN (FYDP II) 2016/17 – 2021/22
41
Figure 23. Share of exports of goods and services in GDP (%)
Source: WDI (2014)
Table 12. Export composition by SITC 1 digit (2013)
Tanzania Ghana Kenya Malaysia Uganda Vietnam Zambia Bangladesh
Animal and vegetable oils and fats 1.2 2.5 1.8 7.4 4.3 0.2 0.3 0.0
Beverages and tobacco 5.0 0.5 4.3 0.5 9.3 0.4 4.1 0.3
Chemicals 3.1 5.7 9.1 6.6 4.0 2.9 6.2 0.7
Commod. and transacts. Not class. Acc 0.2 0.1 1.5 0.5 0.3 0.4 0.4 0.0
Crude materials, inedible 27.5 8.0 14.1 2.7 8.1 2.7 4.1 2.2
Food and live animals 33.9 27.8 40.0 3.1 50.6 13.8 5.8 3.5
Machinery and transport equipment 8.8 3.2 3.5 38.1 1.0 32.5 4.1 1.2
Manufactured goods 11.4 7.3 13.6 9.4 19.5 11.4 72.2 9.7
Mineral fuels, lubricants and relat 3.5 43.1 1.0 22.3 1.1 7.3 1.9 1.2
Miscellaneous manufactured articles 5.4 1.7 11.1 9.4 1.8 28.3 0.9 81.2
Source: UN Comtrade
4.2 DETERMINANTS OF ECONOMIC TRANSFORMATION
Multiple factors can influence economic transformation. They include how the domestic economy interact with the rest of the world through trade and FDI; changes in the relative endowment of factors and on the availability and quality of infrastructure. Moreover, the business climate and the rule of law are also important.
Investment is a primary determinant of productivity growth and economic transformation. The level of investment, through FDI or domestic sources, is key in determining the future of growth and productivity (Figure 24). Malaysia, for example, invested almost around 40% of their GDP before the Asian crisis. Vietnam seems to be following the same path. In the case of Tanzania, investment has averaged around 25% of GDP. It is still a little low given its level of development. Moreover, it has been unstable with several
0
20
40
60
80
100
120
140
1992 1995 1998 2001 2004 2007 2010 2013
Vietnam
Malaysia
Zambia
Ghana
BangladeshTanzania Kenya
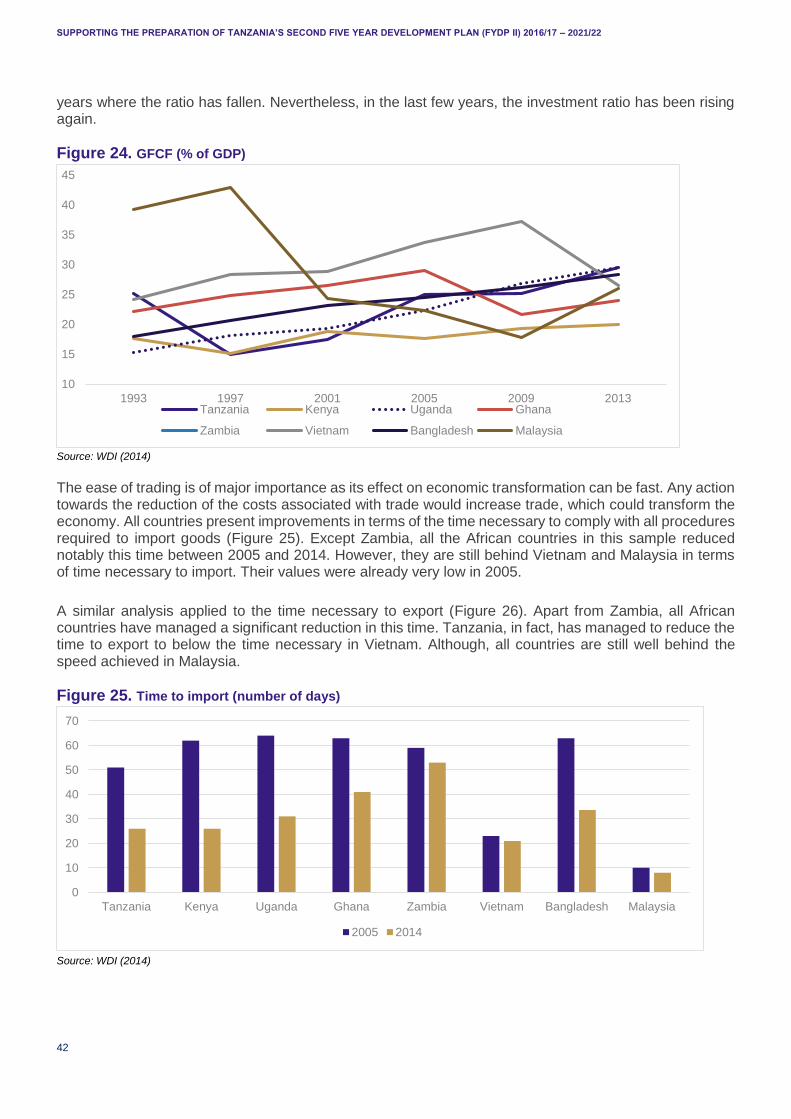
SUPPORTING THE PREPARATION OF TANZANIA’S SECOND FIVE YEAR DEVELOPMENT PLAN (FYDP II) 2016/17 – 2021/22
42
years where the ratio has fallen. Nevertheless, in the last few years, the investment ratio has been rising again.
Figure 24. GFCF (% of GDP)
Source: WDI (2014)
The ease of trading is of major importance as its effect on economic transformation can be fast. Any action towards the reduction of the costs associated with trade would increase trade, which could transform the economy. All countries present improvements in terms of the time necessary to comply with all procedures required to import goods (Figure 25). Except Zambia, all the African countries in this sample reduced notably this time between 2005 and 2014. However, they are still behind Vietnam and Malaysia in terms of time necessary to import. Their values were already very low in 2005.
A similar analysis applied to the time necessary to export (Figure 26). Apart from Zambia, all African countries have managed a significant reduction in this time. Tanzania, in fact, has managed to reduce the time to export to below the time necessary in Vietnam. Although, all countries are still well behind the speed achieved in Malaysia.
Figure 25. Time to import (number of days)
Source: WDI (2014)
10
15
20
25
30
35
40
45
1993 1997 2001 2005 2009 2013Tanzania Kenya Uganda Ghana
Zambia Vietnam Bangladesh Malaysia
0
10
20
30
40
50
60
70
Tanzania Kenya Uganda Ghana Zambia Vietnam Bangladesh Malaysia
2005 2014

SUPPORTING THE PREPARATION OF TANZANIA’S SECOND FIVE YEAR DEVELOPMENT PLAN (FYDP II) 2016/17 – 2021/22
43
Figure 26. Time to export (number of days)
Source: Own elaboration based on WDI
The complexity of the customs procedures is closely associated with the time necessary to either export or import. The more cumbersome and numerous the procedures the higher the time necessary to comply with them. Therefore, an inspection into the perception on the complexity of these procedures can shed some light on the policy efforts behind these reductions in the time to trade.
Figure 27 presents the perception of businesses managers on customs efficiency.7 Apart from Ghana, all countries have made progress in this front. In fact, Zambia was the country that seems to have made the most important improvements. Whilst Tanzania has made some progress, it still has the least efficient customs procedures. Notably, neither Bangladesh nor Vietnam would present more efficiency in customs. On the other hand, the increase in efficiency observed would not be enough to explain the important reduction in the time to trade. This implies that in addition to increasing efficiency, a reduction in the number of procedures and documents necessary to trade (Table 13) might have been behind these reductions.
Figure 27. Burden of customs procedures (1=inefficient, 7=most efficient)
Source: Own elaboration based on WDI
7 These rankings are sensitive to the perceptions that people in different countries may have. They could rank the same procedures differently. However, as these type of measures are hard to quantify, they constitute the only source of internationally comparable data to assess their effect.
0
10
20
30
40
50
60
Tanzania Kenya Uganda Ghana Zambia Vietnam Bangladesh Malaysia
2005 2014
0 1 2 3 4 5 6
Tanzania
Kenya
Uganda
Ghana
Zambia
Vietnam
Bangladesh
Malaysia
2014 2008

SUPPORTING THE PREPARATION OF TANZANIA’S SECOND FIVE YEAR DEVELOPMENT PLAN (FYDP II) 2016/17 – 2021/22
44
Table 13. Number of documents necessary to trade
Documents necessary to export Documents necessary to import
2005 2014 2005 2014
Tanzania 9 7 17 11
Kenya 7 8 14 9
Uganda 12 7 20 10
Ghana 6 6 7 7
Zambia 7 7 9 8
Vietnam 5 5 8 8
Bangladesh 6 6 9 9
Malaysia 4 4 4 4
Source: Own elaboration based on WDI
The time to trade, on the other hand, is independent of the transport time. In fact, customs procedures frequently can be dealt whilst goods are in transit. This implies that unless both procedures and transport costs and times are not reduced, countries will be unlikely to appreciate the transformation effect of trade. Therefore, the quality of the transport and logistics infrastructure needs to be examined.
Tanzania has a low quality in terms of its transport infrastructure (Table 14). Even when compared to its African peers, the quality is low. Kenya and Ghana, for example, present substantially higher quality transport infrastructure. The quality is also lower than the Asian comparators. Road infrastructure is similar quality to the observed in Bangladesh and Vietnam. However, part of the explanation of the low road quality in these countries is related to the high traffic levels given their population density. Road infrastructure, in these countries, suffers from the lack of space to develop.
All this suggests that, although some improvements have been made in terms of trade facilitation by reducing procedures and increase efficiency of customs, the poor transport infrastructure quality is preventing from profiting from them. Investments are needed to deal with this bottleneck.
Table 14. World rankings on transport infrastructure (2015)
Quality of infrastructure
Railway Road Port Average rank across infrastructure
Malaysia 12 19 19 17
Kenya 71 59 61 64
Ghana 66 79 92 79
Vietnam 52 104 88 81
Bangladesh 75 117 93 95
Zambia 87 86 124 99
Tanzania 88 112 106 102
Uganda 101 105 118 108
Source: World Economic Forum World Competitiveness Rankings
Transport infrastructure is not the only cost that prevents the operation of the transformation forces. High costs associated with the lack of reliable energy sources can also impede economic transformation (manufacturing needs energy). Figure 28 presents the number of power outages experienced by firms in a typical month. Although Bangladesh presents a very high number of events, Tanzania (and other African
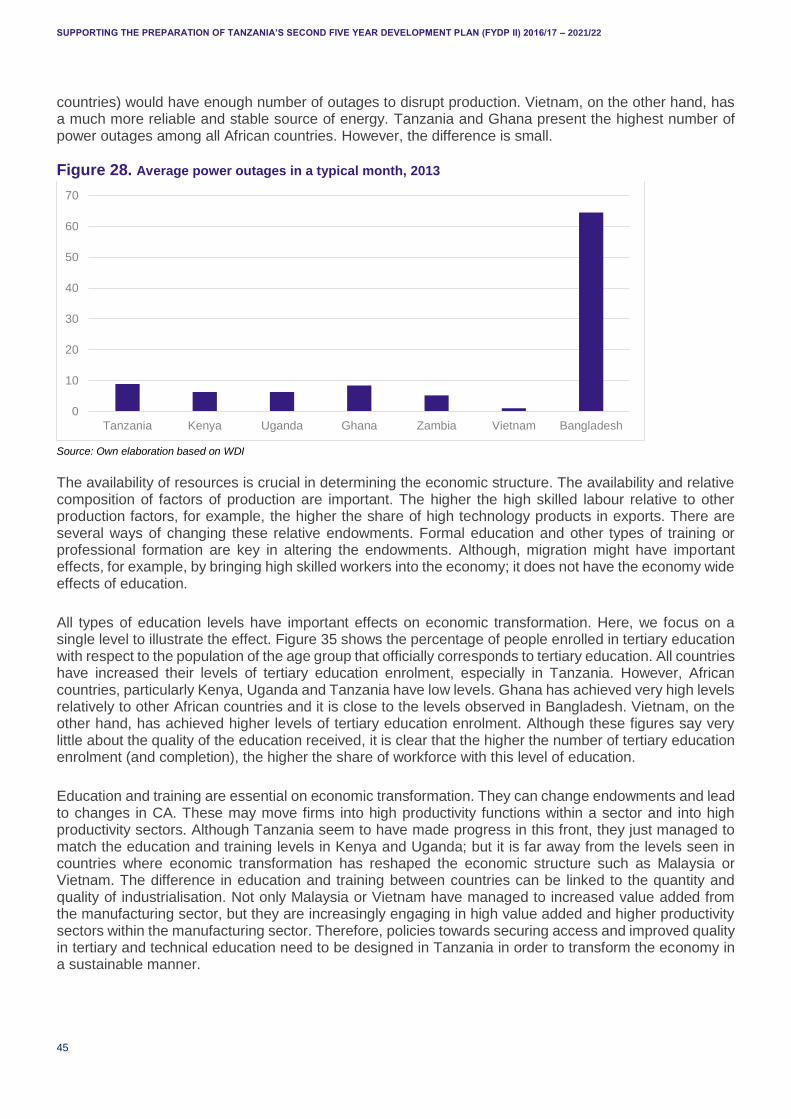
SUPPORTING THE PREPARATION OF TANZANIA’S SECOND FIVE YEAR DEVELOPMENT PLAN (FYDP II) 2016/17 – 2021/22
45
countries) would have enough number of outages to disrupt production. Vietnam, on the other hand, has a much more reliable and stable source of energy. Tanzania and Ghana present the highest number of power outages among all African countries. However, the difference is small.
Figure 28. Average power outages in a typical month, 2013
Source: Own elaboration based on WDI
The availability of resources is crucial in determining the economic structure. The availability and relative composition of factors of production are important. The higher the high skilled labour relative to other production factors, for example, the higher the share of high technology products in exports. There are several ways of changing these relative endowments. Formal education and other types of training or professional formation are key in altering the endowments. Although, migration might have important effects, for example, by bringing high skilled workers into the economy; it does not have the economy wide effects of education.
All types of education levels have important effects on economic transformation. Here, we focus on a single level to illustrate the effect. Figure 35 shows the percentage of people enrolled in tertiary education with respect to the population of the age group that officially corresponds to tertiary education. All countries have increased their levels of tertiary education enrolment, especially in Tanzania. However, African countries, particularly Kenya, Uganda and Tanzania have low levels. Ghana has achieved very high levels relatively to other African countries and it is close to the levels observed in Bangladesh. Vietnam, on the other hand, has achieved higher levels of tertiary education enrolment. Although these figures say very little about the quality of the education received, it is clear that the higher the number of tertiary education enrolment (and completion), the higher the share of workforce with this level of education.
Education and training are essential on economic transformation. They can change endowments and lead to changes in CA. These may move firms into high productivity functions within a sector and into high productivity sectors. Although Tanzania seem to have made progress in this front, they just managed to match the education and training levels in Kenya and Uganda; but it is far away from the levels seen in countries where economic transformation has reshaped the economic structure such as Malaysia or Vietnam. The difference in education and training between countries can be linked to the quantity and quality of industrialisation. Not only Malaysia or Vietnam have managed to increased value added from the manufacturing sector, but they are increasingly engaging in high value added and higher productivity sectors within the manufacturing sector. Therefore, policies towards securing access and improved quality in tertiary and technical education need to be designed in Tanzania in order to transform the economy in a sustainable manner.
0
10
20
30
40
50
60
70
Tanzania Kenya Uganda Ghana Zambia Vietnam Bangladesh
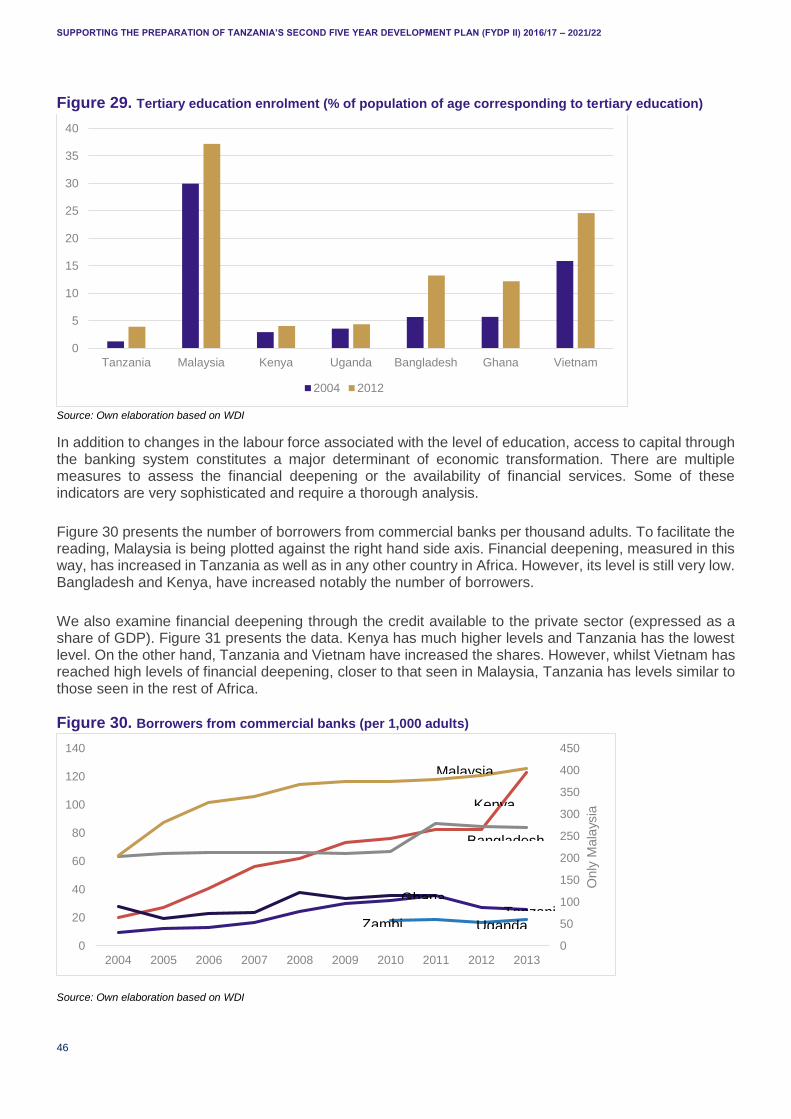
SUPPORTING THE PREPARATION OF TANZANIA’S SECOND FIVE YEAR DEVELOPMENT PLAN (FYDP II) 2016/17 – 2021/22
46
Figure 29. Tertiary education enrolment (% of population of age corresponding to tertiary education)
Source: Own elaboration based on WDI
In addition to changes in the labour force associated with the level of education, access to capital through the banking system constitutes a major determinant of economic transformation. There are multiple measures to assess the financial deepening or the availability of financial services. Some of these indicators are very sophisticated and require a thorough analysis.
Figure 30 presents the number of borrowers from commercial banks per thousand adults. To facilitate the reading, Malaysia is being plotted against the right hand side axis. Financial deepening, measured in this way, has increased in Tanzania as well as in any other country in Africa. However, its level is still very low. Bangladesh and Kenya, have increased notably the number of borrowers.
We also examine financial deepening through the credit available to the private sector (expressed as a share of GDP). Figure 31 presents the data. Kenya has much higher levels and Tanzania has the lowest level. On the other hand, Tanzania and Vietnam have increased the shares. However, whilst Vietnam has reached high levels of financial deepening, closer to that seen in Malaysia, Tanzania has levels similar to those seen in the rest of Africa.
Figure 30. Borrowers from commercial banks (per 1,000 adults)
Source: Own elaboration based on WDI
0
5
10
15
20
25
30
35
40
Tanzania Malaysia Kenya Uganda Bangladesh Ghana Vietnam
2004 2012
0
50
100
150
200
250
300
350
400
450
0
20
40
60
80
100
120
140
2004 2005 2006 2007 2008 2009 2010 2011 2012 2013
Only
Mala
ysia
Malaysia
Kenya
Bangladesh
GhanaTanzani
Zambi Uganda
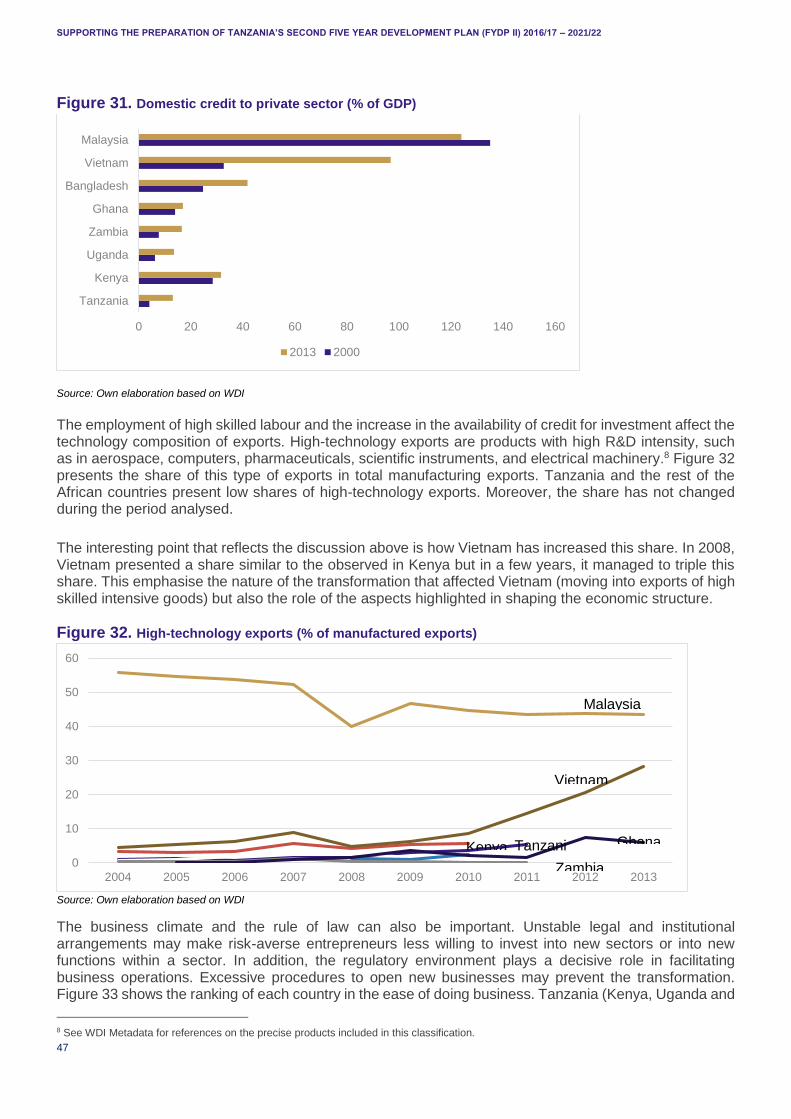
SUPPORTING THE PREPARATION OF TANZANIA’S SECOND FIVE YEAR DEVELOPMENT PLAN (FYDP II) 2016/17 – 2021/22
47
Figure 31. Domestic credit to private sector (% of GDP)
Source: Own elaboration based on WDI
The employment of high skilled labour and the increase in the availability of credit for investment affect the technology composition of exports. High-technology exports are products with high R&D intensity, such as in aerospace, computers, pharmaceuticals, scientific instruments, and electrical machinery.8 Figure 32 presents the share of this type of exports in total manufacturing exports. Tanzania and the rest of the African countries present low shares of high-technology exports. Moreover, the share has not changed during the period analysed.
The interesting point that reflects the discussion above is how Vietnam has increased this share. In 2008, Vietnam presented a share similar to the observed in Kenya but in a few years, it managed to triple this share. This emphasise the nature of the transformation that affected Vietnam (moving into exports of high skilled intensive goods) but also the role of the aspects highlighted in shaping the economic structure.
Figure 32. High-technology exports (% of manufactured exports)
Source: Own elaboration based on WDI
The business climate and the rule of law can also be important. Unstable legal and institutional arrangements may make risk-averse entrepreneurs less willing to invest into new sectors or into new functions within a sector. In addition, the regulatory environment plays a decisive role in facilitating business operations. Excessive procedures to open new businesses may prevent the transformation. Figure 33 shows the ranking of each country in the ease of doing business. Tanzania (Kenya, Uganda and
8 See WDI Metadata for references on the precise products included in this classification.
0 20 40 60 80 100 120 140 160
Tanzania
Kenya
Uganda
Zambia
Ghana
Bangladesh
Vietnam
Malaysia
2013 2000
0
10
20
30
40
50
60
2004 2005 2006 2007 2008 2009 2010 2011 2012 2013
Malaysia
Vietnam
Kenya Tanzani Ghana
Zambia
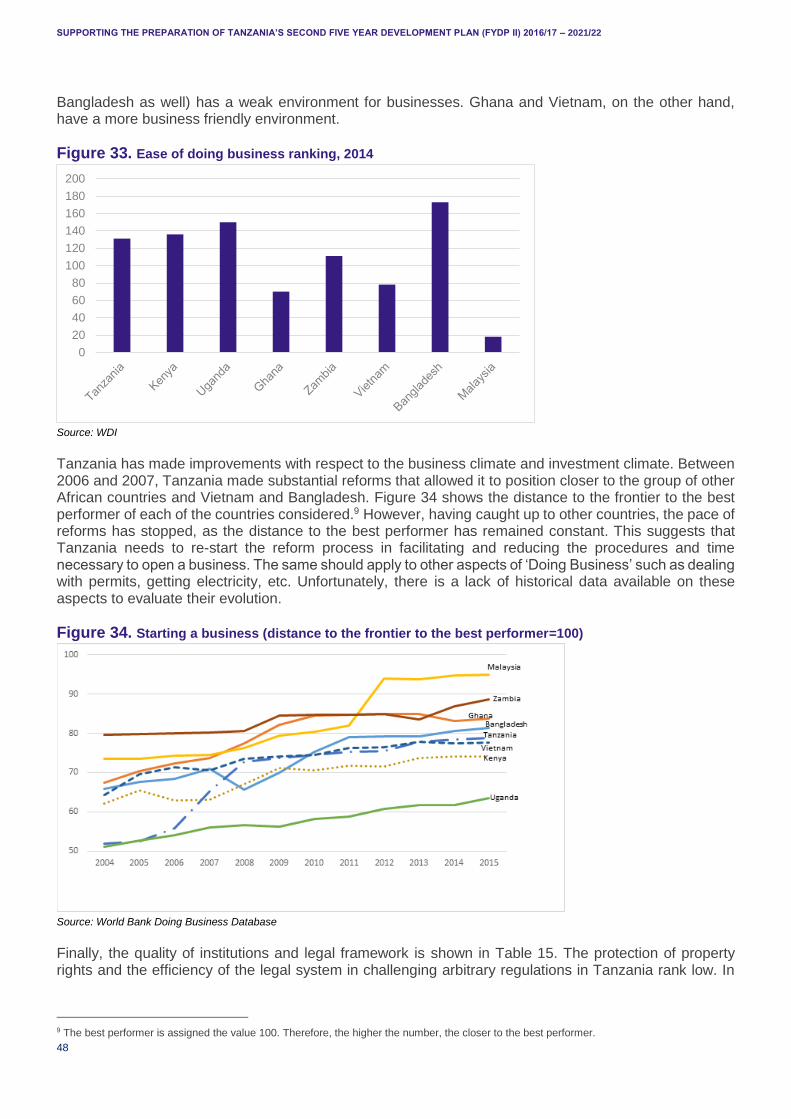
SUPPORTING THE PREPARATION OF TANZANIA’S SECOND FIVE YEAR DEVELOPMENT PLAN (FYDP II) 2016/17 – 2021/22
48
Bangladesh as well) has a weak environment for businesses. Ghana and Vietnam, on the other hand, have a more business friendly environment.
Figure 33. Ease of doing business ranking, 2014
Source: WDI
Tanzania has made improvements with respect to the business climate and investment climate. Between 2006 and 2007, Tanzania made substantial reforms that allowed it to position closer to the group of other African countries and Vietnam and Bangladesh. Figure 34 shows the distance to the frontier to the best performer of each of the countries considered.9 However, having caught up to other countries, the pace of reforms has stopped, as the distance to the best performer has remained constant. This suggests that Tanzania needs to re-start the reform process in facilitating and reducing the procedures and time necessary to open a business. The same should apply to other aspects of ‘Doing Business’ such as dealing with permits, getting electricity, etc. Unfortunately, there is a lack of historical data available on these aspects to evaluate their evolution.
Figure 34. Starting a business (distance to the frontier to the best performer=100)
Source: World Bank Doing Business Database
Finally, the quality of institutions and legal framework is shown in Table 15. The protection of property rights and the efficiency of the legal system in challenging arbitrary regulations in Tanzania rank low. In
9 The best performer is assigned the value 100. Therefore, the higher the number, the closer to the best performer.
0
20
40
60
80
100
120
140
160
180
200
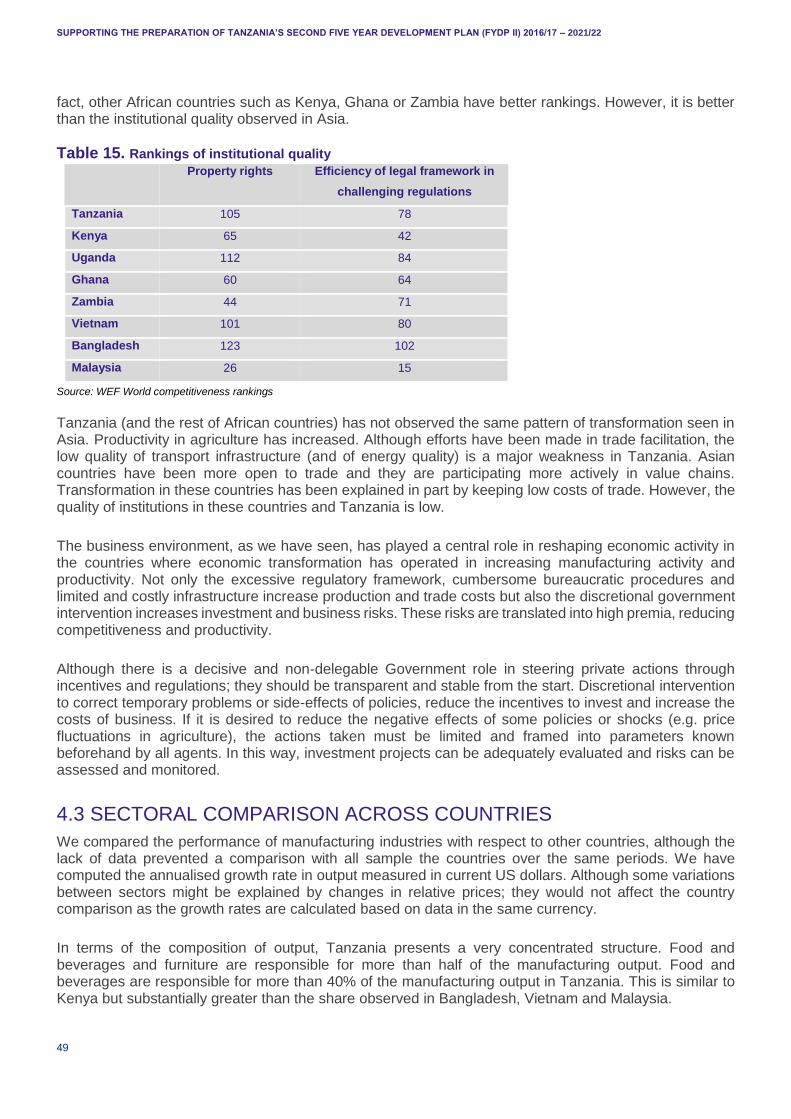
SUPPORTING THE PREPARATION OF TANZANIA’S SECOND FIVE YEAR DEVELOPMENT PLAN (FYDP II) 2016/17 – 2021/22
49
fact, other African countries such as Kenya, Ghana or Zambia have better rankings. However, it is better than the institutional quality observed in Asia.
Table 15. Rankings of institutional quality
Property rights Efficiency of legal framework in
challenging regulations
Tanzania 105 78
Kenya 65 42
Uganda 112 84
Ghana 60 64
Zambia 44 71
Vietnam 101 80
Bangladesh 123 102
Malaysia 26 15
Source: WEF World competitiveness rankings
Tanzania (and the rest of African countries) has not observed the same pattern of transformation seen in Asia. Productivity in agriculture has increased. Although efforts have been made in trade facilitation, the low quality of transport infrastructure (and of energy quality) is a major weakness in Tanzania. Asian countries have been more open to trade and they are participating more actively in value chains. Transformation in these countries has been explained in part by keeping low costs of trade. However, the quality of institutions in these countries and Tanzania is low.
The business environment, as we have seen, has played a central role in reshaping economic activity in the countries where economic transformation has operated in increasing manufacturing activity and productivity. Not only the excessive regulatory framework, cumbersome bureaucratic procedures and limited and costly infrastructure increase production and trade costs but also the discretional government intervention increases investment and business risks. These risks are translated into high premia, reducing competitiveness and productivity.
Although there is a decisive and non-delegable Government role in steering private actions through incentives and regulations; they should be transparent and stable from the start. Discretional intervention to correct temporary problems or side-effects of policies, reduce the incentives to invest and increase the costs of business. If it is desired to reduce the negative effects of some policies or shocks (e.g. price fluctuations in agriculture), the actions taken must be limited and framed into parameters known beforehand by all agents. In this way, investment projects can be adequately evaluated and risks can be assessed and monitored.
4.3 SECTORAL COMPARISON ACROSS COUNTRIES
We compared the performance of manufacturing industries with respect to other countries, although the lack of data prevented a comparison with all sample the countries over the same periods. We have computed the annualised growth rate in output measured in current US dollars. Although some variations between sectors might be explained by changes in relative prices; they would not affect the country comparison as the growth rates are calculated based on data in the same currency.
In terms of the composition of output, Tanzania presents a very concentrated structure. Food and beverages and furniture are responsible for more than half of the manufacturing output. Food and beverages are responsible for more than 40% of the manufacturing output in Tanzania. This is similar to Kenya but substantially greater than the share observed in Bangladesh, Vietnam and Malaysia.
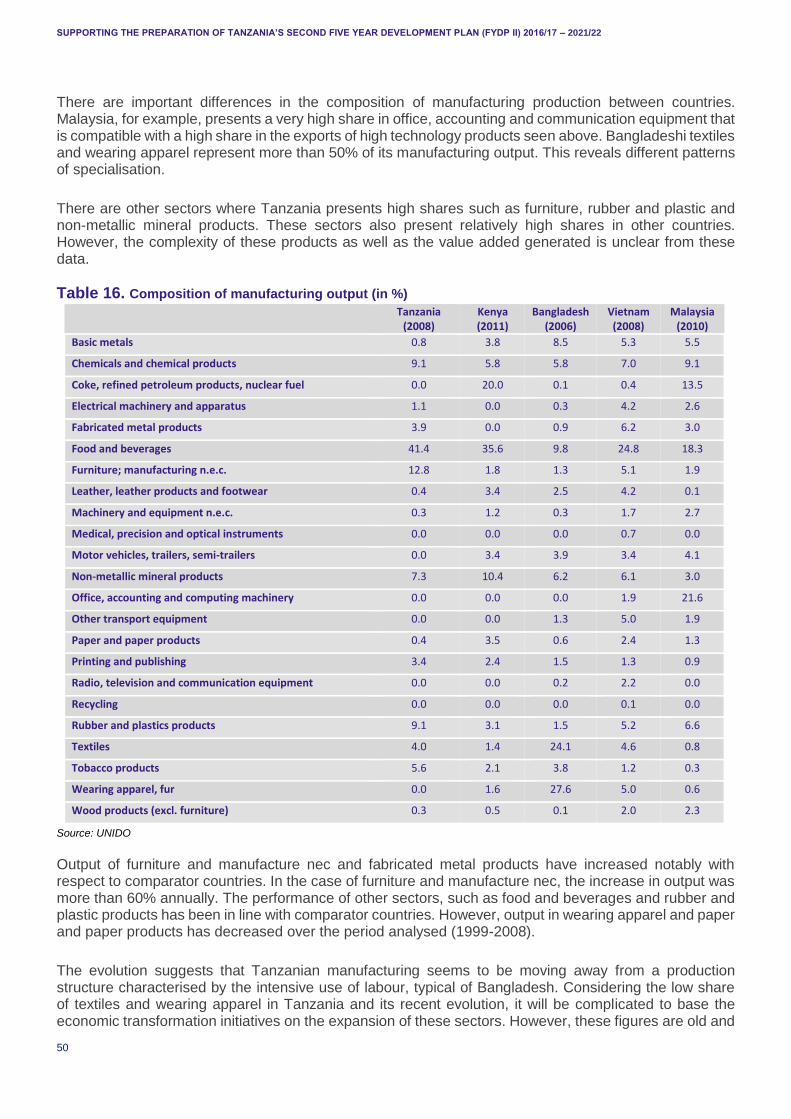
SUPPORTING THE PREPARATION OF TANZANIA’S SECOND FIVE YEAR DEVELOPMENT PLAN (FYDP II) 2016/17 – 2021/22
50
There are important differences in the composition of manufacturing production between countries. Malaysia, for example, presents a very high share in office, accounting and communication equipment that is compatible with a high share in the exports of high technology products seen above. Bangladeshi textiles and wearing apparel represent more than 50% of its manufacturing output. This reveals different patterns of specialisation.
There are other sectors where Tanzania presents high shares such as furniture, rubber and plastic and non-metallic mineral products. These sectors also present relatively high shares in other countries. However, the complexity of these products as well as the value added generated is unclear from these data.
Table 16. Composition of manufacturing output (in %)
Tanzania (2008)
Kenya (2011)
Bangladesh (2006)
Vietnam (2008)
Malaysia (2010)
Basic metals 0.8 3.8 8.5 5.3 5.5
Chemicals and chemical products 9.1 5.8 5.8 7.0 9.1
Coke, refined petroleum products, nuclear fuel 0.0 20.0 0.1 0.4 13.5
Electrical machinery and apparatus 1.1 0.0 0.3 4.2 2.6
Fabricated metal products 3.9 0.0 0.9 6.2 3.0
Food and beverages 41.4 35.6 9.8 24.8 18.3
Furniture; manufacturing n.e.c. 12.8 1.8 1.3 5.1 1.9
Leather, leather products and footwear 0.4 3.4 2.5 4.2 0.1
Machinery and equipment n.e.c. 0.3 1.2 0.3 1.7 2.7
Medical, precision and optical instruments 0.0 0.0 0.0 0.7 0.0
Motor vehicles, trailers, semi-trailers 0.0 3.4 3.9 3.4 4.1
Non-metallic mineral products 7.3 10.4 6.2 6.1 3.0
Office, accounting and computing machinery 0.0 0.0 0.0 1.9 21.6
Other transport equipment 0.0 0.0 1.3 5.0 1.9
Paper and paper products 0.4 3.5 0.6 2.4 1.3
Printing and publishing 3.4 2.4 1.5 1.3 0.9
Radio, television and communication equipment 0.0 0.0 0.2 2.2 0.0
Recycling 0.0 0.0 0.0 0.1 0.0
Rubber and plastics products 9.1 3.1 1.5 5.2 6.6
Textiles 4.0 1.4 24.1 4.6 0.8
Tobacco products 5.6 2.1 3.8 1.2 0.3
Wearing apparel, fur 0.0 1.6 27.6 5.0 0.6
Wood products (excl. furniture) 0.3 0.5 0.1 2.0 2.3
Source: UNIDO
Output of furniture and manufacture nec and fabricated metal products have increased notably with respect to comparator countries. In the case of furniture and manufacture nec, the increase in output was more than 60% annually. The performance of other sectors, such as food and beverages and rubber and plastic products has been in line with comparator countries. However, output in wearing apparel and paper and paper products has decreased over the period analysed (1999-2008).
The evolution suggests that Tanzanian manufacturing seems to be moving away from a production structure characterised by the intensive use of labour, typical of Bangladesh. Considering the low share of textiles and wearing apparel in Tanzania and its recent evolution, it will be complicated to base the economic transformation initiatives on the expansion of these sectors. However, these figures are old and

SUPPORTING THE PREPARATION OF TANZANIA’S SECOND FIVE YEAR DEVELOPMENT PLAN (FYDP II) 2016/17 – 2021/22
51
refer to a particular moment where important changes in the production structure occurred in Tanzania and worldwide.
Figure 35. Nominal annualised growth rate of the US dollar nominated value of output
-40 -20 0 20 40 60
Kenya
Malaysia
Tanzania
Vietnam
Bangladesh
Basic metals
-40 -20 0 20 40 60
Kenya
Malaysia
Tanzania
Vietnam
Bangladesh
Chemicals and chemical products
-40 -20 0 20 40 60
Kenya
Malaysia
Tanzania
Vietnam
Bangladesh
Electrical machinery and apparatus
-40 -20 0 20 40 60
Kenya
Malaysia
Tanzania
Vietnam
Bangladesh
Fabricated metal products
-40 -20 0 20 40 60
Kenya
Malaysia
Tanzania
Vietnam
Bangladesh
Food and beverages
-40 -20 0 20 40 60
Kenya
Malaysia
Tanzania
Vietnam
Bangladesh
Furniture; manufacturing n.e.c.
-40 -20 0 20 40 60
Kenya
Malaysia
Tanzania
Vietnam
Bangladesh
Machinery and equipment n.e.c.
-40 -20 0 20 40 60
Kenya
Malaysia
Tanzania
Vietnam
Bangladesh
Non-metallic mineral products
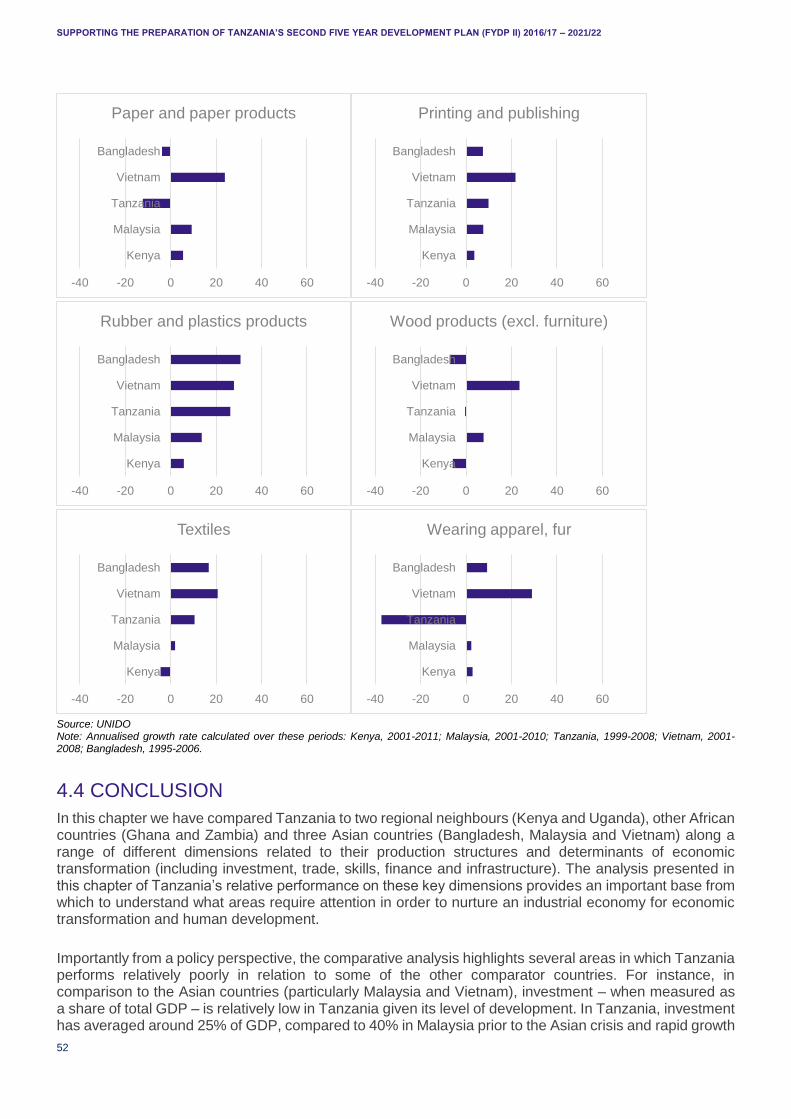
SUPPORTING THE PREPARATION OF TANZANIA’S SECOND FIVE YEAR DEVELOPMENT PLAN (FYDP II) 2016/17 – 2021/22
52
Source: UNIDO Note: Annualised growth rate calculated over these periods: Kenya, 2001-2011; Malaysia, 2001-2010; Tanzania, 1999-2008; Vietnam, 2001-2008; Bangladesh, 1995-2006.
4.4 CONCLUSION
In this chapter we have compared Tanzania to two regional neighbours (Kenya and Uganda), other African countries (Ghana and Zambia) and three Asian countries (Bangladesh, Malaysia and Vietnam) along a range of different dimensions related to their production structures and determinants of economic transformation (including investment, trade, skills, finance and infrastructure). The analysis presented in this chapter of Tanzania’s relative performance on these key dimensions provides an important base from which to understand what areas require attention in order to nurture an industrial economy for economic transformation and human development.
Importantly from a policy perspective, the comparative analysis highlights several areas in which Tanzania performs relatively poorly in relation to some of the other comparator countries. For instance, in comparison to the Asian countries (particularly Malaysia and Vietnam), investment – when measured as a share of total GDP – is relatively low in Tanzania given its level of development. In Tanzania, investment has averaged around 25% of GDP, compared to 40% in Malaysia prior to the Asian crisis and rapid growth
-40 -20 0 20 40 60
Kenya
Malaysia
Tanzania
Vietnam
Bangladesh
Paper and paper products
-40 -20 0 20 40 60
Kenya
Malaysia
Tanzania
Vietnam
Bangladesh
Printing and publishing
-40 -20 0 20 40 60
Kenya
Malaysia
Tanzania
Vietnam
Bangladesh
Rubber and plastics products
-40 -20 0 20 40 60
Kenya
Malaysia
Tanzania
Vietnam
Bangladesh
Wood products (excl. furniture)
-40 -20 0 20 40 60
Kenya
Malaysia
Tanzania
Vietnam
Bangladesh
Textiles
-40 -20 0 20 40 60
Kenya
Malaysia
Tanzania
Vietnam
Bangladesh
Wearing apparel, fur
SUPPORTING THE PREPARATION OF TANZANIA’S SECOND FIVE YEAR DEVELOPMENT PLAN (FYDP II) 2016/17 – 2021/22
53
in Vietnam. Tanzania has also been hampered by instability in investment flows, including declining investment relative to GDP in several years.
The quality of infrastructure in Tanzania is also relatively low, even when considered against the African comparators. Kenya and Ghana, for example, boast better rankings on the quality of transport infrastructure. While improvements to the general business environment have been made in Tanzania, and the country has moved closer to the other African countries (and Bangladesh and Vietnam) on several important dimensions of the quality of the business climate, the pace of reforms in the country has slowed. Along with Ghana, Tanzania experiences the highest number of power outages among the African comparators (and only Bangladesh registers more, on average, in a typical month). These outages can cause considerable disruption to production and can also act as a disincentive to investment. As with the other African countries (excluding Ghana), Tanzania also fares relatively poorly compared to the Asian comparators in terms of levels of tertiary education enrolment, although there is evidence that these levels are improving.
Similarly, although some improvements have been made in terms of facilitating trade, Tanzania still fares comparatively poorly around key dimensions of trade facilitation, such as the efficiency of customs procedures. This, coupled with the relatively poor transport infrastructure in the country, will need to be addressed if Tanzania is to boost exports and compete more effectively with these countries in attracting much-needed FDI into priority sectors.
More encouragingly, Tanzania has made progress in expanding credit available to the private sector (when expressed as a share of GDP) to levels similar to those in most of the other African countries. Even so, it remains below the level recorded in Kenya, and Tanzania has not managed to match the levels of financial deepening achieved by Vietnam, which are close to those recorded in Malaysia.
Looking at trade in manufactures, compared to the Asian countries, Tanzania (and the other African countries) have low shares of high-technology exports in total manufacturing exports. Moreover, the share has remained relatively stagnant since the early 2000s, in contrast to rapid growth in Vietnam.
These comparisons highlight important areas for improvement in Tanzania. Better quality infrastructure, skills development and improvements to education, higher levels of investment, more domestic credit to the private sector (as a share of GDP), and improvements to the business climate could all play an important role in driving economic transformation and human development in Tanzania. These issues are discussed in detail in the remaining chapters in this report, and they are central to the targets presented in Chapter 10 for policies that remove constraints towards further economic transformation.
SUPPORTING THE PREPARATION OF TANZANIA’S SECOND FIVE YEAR DEVELOPMENT PLAN (FYDP II) 2016/17 – 2021/22
54
PART II: SHAPING THE FYDP II – IDENTIFYING FUTURE SECTORS AND CONSTRAINTS

SUPPORTING THE PREPARATION OF TANZANIA’S SECOND FIVE YEAR DEVELOPMENT PLAN (FYDP II) 2016/17 – 2021/22
55
5. WHAT INDUSTRIES OR SUBSECTORS SHOULD TANZANIA PRIORITISE?
The chapter is split up into five sub-sections. The first section (5.1) examines the strengths and CA of Tanzania. Section 5.2 reviews a number of strategy papers, set out by the Government of Tanzania and international organisations. Both sub-sections are focused on highlighting what sectors Tanzania should prioritise and provide an overview of the analysis or justifications used to prioritise them.
The third sub-section (5.3) includes new quantitative analysis, including the results of a multiplier analysis, firm level productivity, a Hausmann-Hidalgo product space analysis, RCA analysis, and trade in value added. The final sub-section (5.4) discusses the results of key stakeholder interviews in regards to Tanzanian sectoral prioritisation. Section 5.5 summarises the findings of chapter 5.
5.1 TANZANIA’S STRENGTHS
To assess the strengths and CAs of Tanzania we have included an analysis of cross-sectoral competitive advantages (i.e. those that can benefit all sectors in the economy), as well as a summary of sector and sub-sector specific competitive advantages. The analysis draws on multiple existing studies including as the African Development Bank’s (AfDB’s) Country Strategy, the World Banks (2011) Country Assistance Strategy (CAS) and Tanzania’s 2014-2015 Investment guide
In terms of cross-sectoral (i.e. nationwide) CAs Tanzania can make use of, these include:
Geographically strategic location: Tanzania is the largest East African Community (EAC) country and is a major gateway for trade for Burundi and Rwanda as well the potential to provide transport links to landlocked neighbouring countries such as Eastern Congo, Malawi, Uganda and Zambia. Indian Ocean coastline and historical links with the Middle East and Asia provide strong trade links that could be further exploited.
Access to (regional) markets: In addition to its strategic location, Tanzania is also a member of multiple regional initiatives and trading blocs which increases its access to neighbour markets i.e. the EAC, the Southern Africa Development Community (SADC), as well as schemes such as the US African Growth and Opportunity Act (AGOA) and the EU’s Everything But Arms (EBA) and African, Caribbean and Pacific (ACP)-EU agreements.
Ample natural resources: The country has an abundance of rich natural resources (i.e. land, water, wildlife, fossil fuels and minerals), which can be transformed into sustainable productive activities and can result in an increase in higher value exportable products. As just one example, recently discovered deposits of soda ash at Lake Natron and the Engaruka Basis could be extracted and used as inputs for glass manufacturing, in the production of detergents and industrial chemicals, or in the textile industry (Mrindoko, 2014).
FDI: Already an attractive FDI destination with favourable investments laws, showing rapid increases in inward FDI (see Chapter 3 above for more details), mainly channelled towards the mining industry. As the country implements more comprehensive regulatory reforms, FDI is expected to further increase. The country also hosts a number of investment incentives for FDI such as double taxation agreements, SEZs and investment guarantees (through the Multilateral Investment Guarantee Agency (MIGA) and the Africa Trade Insurance Agency (ATIA)) and the Southern Agricultural Growth Corridor of Tanzania (SAGCOT) initiative.
A number of primary and secondary sectors i.e. agriculture, metals and mineral industries etc. have particular advantages, either due to the availability of particular natural resources or due to the geographic/climatic conditions which are conducive to cultivating certain high value crops. These sectors include:
SUPPORTING THE PREPARATION OF TANZANIA’S SECOND FIVE YEAR DEVELOPMENT PLAN (FYDP II) 2016/17 – 2021/22
56
Agriculture and agro-processing: A number of existing initiatives and developments in the agricultural sector (i.e. SAGCOT, the emergence of large sugar and sisal plantations etc.) suggest that agroprocessing could be a real growth focus for the country. Industrialisation can help improve productivity in the agricultural sector thanks to strong intra-sectoral linkages. Tanzania needs to use a value chain approach to make sure that the agricultural sector becomes more productive, profitable and creates more jobs. Tanzania should identify high-value niche products (i.e. ‘free range’ or ‘organic’ goods) which have higher export values and more resilient to global price fluctuations. Previously identified products that Tanzania could specialise in, include premium coffee and frozen fish fillets.
The country has significant advantages in promoting its agribusiness sector, especially for high-value vegetables and fruits, where latent CAs have been identified, a sub-sector that is also given focus in the World Banks’s 2014 CEM given its significant natural advantages. Porter et al. (2010) provide more information on the potential for high value vegetable production as a source of competitive exports. Although current production is currently small, in Tanzania, high global demand could be a potential source of growth. The sector is favoured by good soil, water, the potential for year round supply of vegetables and low cost labour whilst enabling conditions such as rising international and regional demand also favour production, even though it is constrained by weak input markets, limited labour skills, a lack of (international) market linkages and weak infrastructure. A number of individual agricultural sub-sectors have been identified by the Government of Tanzania as providing significant competitive advantages, these include:
Sugar Cane: Ideal soil and climate, good rainfall levels, membership to SAGCOT and high donor participation.
Rice: Ideal growth conditions (temperature, soil, rain and sunshine), low factor costs (labour and land) and a no. of earmarked large-scale rice cultivation areas which also receive donor support for investments.
Livestock: A large regional meat exporter, with 100,000 ha of land available and good climatic conditions with investor support through taxes, duty free imports and loans from the Tanzania Investment Bank. The sector can also form the basis of a leather industry with multiple export opportunities.
Horticulture: Land availability, good climatic conditions, regional and international links to export.
Fruit and Nut Processing: Untapped potential, with less than 10% of fruit and nuts (such as Cashew) produce currently processed, value added can be increased through processing and exports.
Tourism: The sector benefits from multiple historic and wildlife based tourist attractions in 16 national parks, 29 game reserve areas and 40 conservation zones as well as world renowned areas such as Mount Kilimanjara, the Ngorongoro Crater, Zanzibar and the Serengeti. It is a sector with strong direct and indirect employment opportunities and opportunities for growth outside of its northern Tanzanian focus. Earnings in the sector could be increased through regulatory strengthening and increased marketing.
Natural gas-based industries: Gas discoveries have been made in several areas of the Tanzanian coast with an estimated 47.7 trillion cubic feet of reserves. Apart from its uses as a source of energy and fuel, natural gas can also be used as a productive input in a number of industries i.e. petro-chemical and fertiliser production industries. Widespread investment within all potential industries may not be the most effective route whereas specialisation within ‘carefully selected’ industries and the export of gas may be an ‘attractive’ way forward rather than local direct use of gas. Tanzania needs to analyse the relation between gas price, foreign investment and use of revenues associated with gas. If these issues are not clearly dealt with, the country’s liquefied natural gas (LNG) endowment may not be a sustainable contributor to industrialisation and growth.
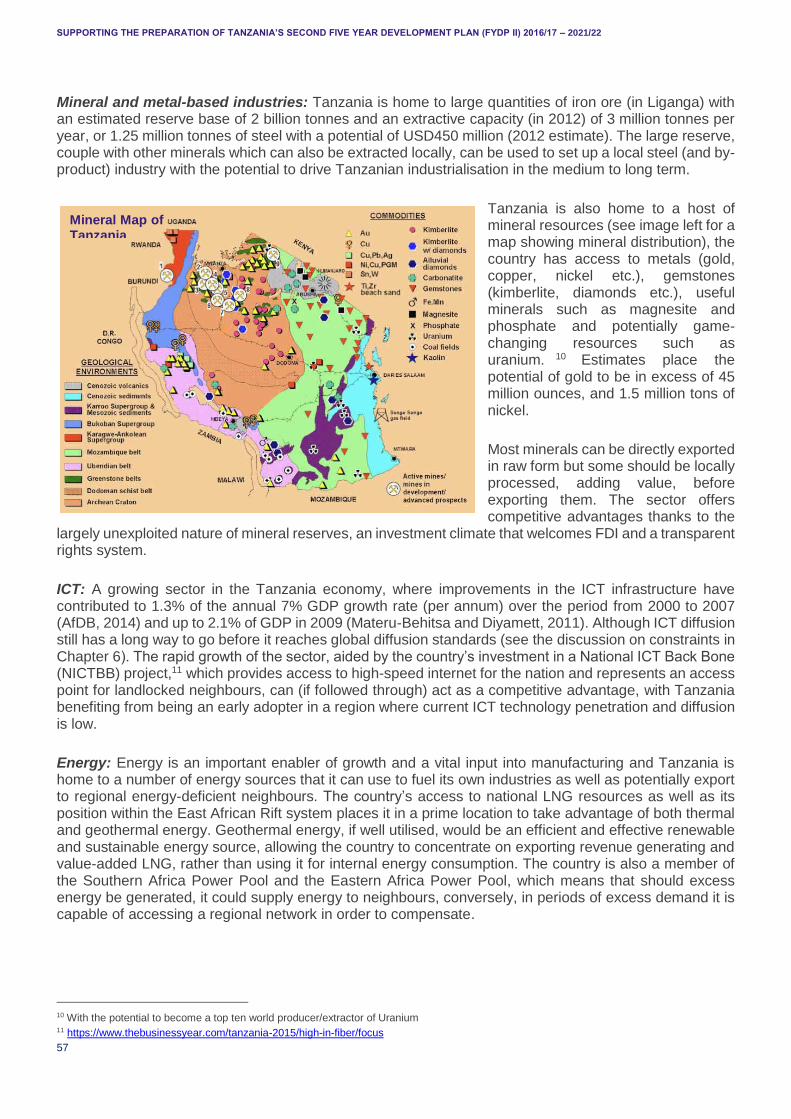
SUPPORTING THE PREPARATION OF TANZANIA’S SECOND FIVE YEAR DEVELOPMENT PLAN (FYDP II) 2016/17 – 2021/22
57
Mineral and metal-based industries: Tanzania is home to large quantities of iron ore (in Liganga) with an estimated reserve base of 2 billion tonnes and an extractive capacity (in 2012) of 3 million tonnes per year, or 1.25 million tonnes of steel with a potential of USD450 million (2012 estimate). The large reserve, couple with other minerals which can also be extracted locally, can be used to set up a local steel (and by-product) industry with the potential to drive Tanzanian industrialisation in the medium to long term.
Tanzania is also home to a host of mineral resources (see image left for a map showing mineral distribution), the country has access to metals (gold, copper, nickel etc.), gemstones (kimberlite, diamonds etc.), useful minerals such as magnesite and phosphate and potentially game-changing resources such as uranium. 10 Estimates place the potential of gold to be in excess of 45 million ounces, and 1.5 million tons of nickel.
Most minerals can be directly exported in raw form but some should be locally processed, adding value, before exporting them. The sector offers competitive advantages thanks to the
largely unexploited nature of mineral reserves, an investment climate that welcomes FDI and a transparent rights system.
ICT: A growing sector in the Tanzania economy, where improvements in the ICT infrastructure have contributed to 1.3% of the annual 7% GDP growth rate (per annum) over the period from 2000 to 2007 (AfDB, 2014) and up to 2.1% of GDP in 2009 (Materu-Behitsa and Diyamett, 2011). Although ICT diffusion still has a long way to go before it reaches global diffusion standards (see the discussion on constraints in Chapter 6). The rapid growth of the sector, aided by the country’s investment in a National ICT Back Bone (NICTBB) project,11 which provides access to high-speed internet for the nation and represents an access point for landlocked neighbours, can (if followed through) act as a competitive advantage, with Tanzania benefiting from being an early adopter in a region where current ICT technology penetration and diffusion is low.
Energy: Energy is an important enabler of growth and a vital input into manufacturing and Tanzania is home to a number of energy sources that it can use to fuel its own industries as well as potentially export to regional energy-deficient neighbours. The country’s access to national LNG resources as well as its position within the East African Rift system places it in a prime location to take advantage of both thermal and geothermal energy. Geothermal energy, if well utilised, would be an efficient and effective renewable and sustainable energy source, allowing the country to concentrate on exporting revenue generating and value-added LNG, rather than using it for internal energy consumption. The country is also a member of the Southern Africa Power Pool and the Eastern Africa Power Pool, which means that should excess energy be generated, it could supply energy to neighbours, conversely, in periods of excess demand it is capable of accessing a regional network in order to compensate.
10 With the potential to become a top ten world producer/extractor of Uranium 11 https://www.thebusinessyear.com/tanzania-2015/high-in-fiber/focus
Mineral Map of Tanzania

SUPPORTING THE PREPARATION OF TANZANIA’S SECOND FIVE YEAR DEVELOPMENT PLAN (FYDP II) 2016/17 – 2021/22
58
Transport: The country’s strategic geographic position places it as a potentially important regional and international trading hub. The image (left12) shows existing and planned national and international transport links – more of which in the section below. Current transport system quality levels vary between the four major modes of transport i.e. the air transport systems work well and whilst roads work there could be increased levels of rural connectivity, however rail and shipping infrastructure acts as a major constraint to growth.
Potential competitive advantages can be gained if the planned expansion of the Dar Es Salaam Port (and planned construction of new ports in other coastal areas) does
occur. The domestic air market is highly competitive (with seven airlines serving each domestic route) although its international routes connections are more limited and air safety remains an ongoing concern. Planned Chinese investments in the railway sector, coupled with planned tri-country connections (between Tanzania, Rwanda and Burundi), if they go ahead, could make Tanzania an important railway hub, connecting Eastern African countries to the Asian market.
In conclusion, Tanzania has a large range of advantages that provide a very favourable context for resource-based industrialisation. These advantages result from a combination of its strategic geographic placement facilitating trade both the east as well as to landlocked countries to the west and an abundance of natural resources that can be (sustainably) used to foster both resource-based industry and resource-based services.
5.2 REVIEWING PRIORITY SECTORS IN EXISTING STRATEGIES AND ANALYSES
Tanzania’s desire to undertake a structural socio-economic shift has been highlighted by the country’s President with a vision of moving away from agriculture and into high productivity industrial and services activities (Kikwete, 2014). A major part of this vision is Tanzania’s Ministry of Industry and Trade’s (MIT’s) IIDS 2025 (of 2011) which discusses the nation’s projected mid- to long-term industrialisation trajectory.
The IIDS 2025 sits within the country’s TDV 2025 framework, hence understanding its position within the overall strategic growth plan. The Vision 2025 does not, itself, provide concrete examples of what sectors the country should prioritise, however it provides an overview of the (broad) growth targets, as set out by the government. Whilst the Vision 2025 can be interpreted as an ‘aspirational’ strategy, the government of Tanzania has provided a more concrete strategy through the (2012) Tanzania LTPP covering the 2011 to 2026 period. The LTTP provides information on the first FYDP period (2011-2016) as well as setting out the strategy for the second and third five year periods, including the country’s industrialisation strategy.
The IIDS 2025 strategy provides useful historical information on the performance of Tanzania’s manufacturing sector and the horizontal and vertical actions that the government planned to enact in order to bolster growth. The strategy is particularly relevant to the focus of this paper since it clearly delineates what the government of Tanzania considers resource based sectors and highlights their growth strategies, citing the growing global demand for commodities as a major driving force for investment in these sectors.
12 From PWC’s 2013 ‘Africa Gearing Up’ Report
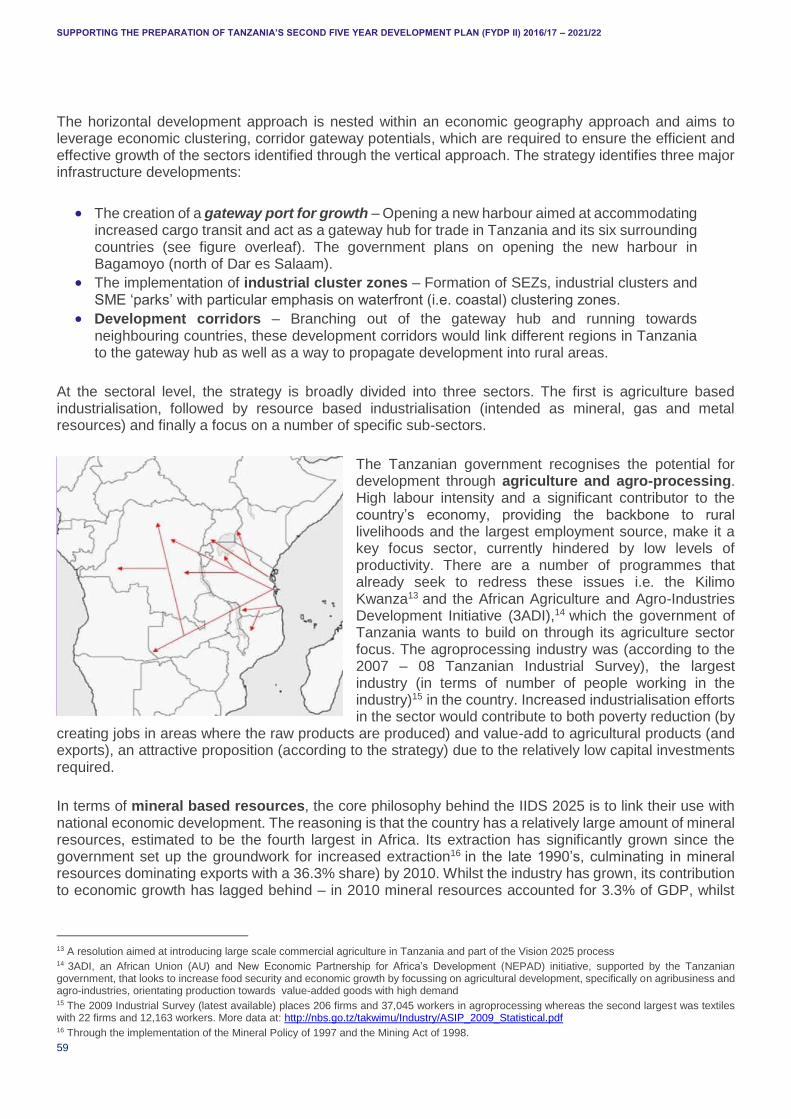
SUPPORTING THE PREPARATION OF TANZANIA’S SECOND FIVE YEAR DEVELOPMENT PLAN (FYDP II) 2016/17 – 2021/22
59
The horizontal development approach is nested within an economic geography approach and aims to leverage economic clustering, corridor gateway potentials, which are required to ensure the efficient and effective growth of the sectors identified through the vertical approach. The strategy identifies three major infrastructure developments:
The creation of a gateway port for growth – Opening a new harbour aimed at accommodating increased cargo transit and act as a gateway hub for trade in Tanzania and its six surrounding countries (see figure overleaf). The government plans on opening the new harbour in Bagamoyo (north of Dar es Salaam).
The implementation of industrial cluster zones – Formation of SEZs, industrial clusters and SME ‘parks’ with particular emphasis on waterfront (i.e. coastal) clustering zones.
Development corridors – Branching out of the gateway hub and running towards neighbouring countries, these development corridors would link different regions in Tanzania to the gateway hub as well as a way to propagate development into rural areas.
At the sectoral level, the strategy is broadly divided into three sectors. The first is agriculture based industrialisation, followed by resource based industrialisation (intended as mineral, gas and metal resources) and finally a focus on a number of specific sub-sectors.
The Tanzanian government recognises the potential for development through agriculture and agro-processing. High labour intensity and a significant contributor to the country’s economy, providing the backbone to rural livelihoods and the largest employment source, make it a key focus sector, currently hindered by low levels of productivity. There are a number of programmes that already seek to redress these issues i.e. the Kilimo Kwanza13 and the African Agriculture and Agro-Industries Development Initiative (3ADI),14 which the government of Tanzania wants to build on through its agriculture sector focus. The agroprocessing industry was (according to the 2007 – 08 Tanzanian Industrial Survey), the largest industry (in terms of number of people working in the industry)15 in the country. Increased industrialisation efforts in the sector would contribute to both poverty reduction (by
creating jobs in areas where the raw products are produced) and value-add to agricultural products (and exports), an attractive proposition (according to the strategy) due to the relatively low capital investments required.
In terms of mineral based resources, the core philosophy behind the IIDS 2025 is to link their use with national economic development. The reasoning is that the country has a relatively large amount of mineral resources, estimated to be the fourth largest in Africa. Its extraction has significantly grown since the government set up the groundwork for increased extraction16 in the late 1990’s, culminating in mineral resources dominating exports with a 36.3% share) by 2010. Whilst the industry has grown, its contribution to economic growth has lagged behind – in 2010 mineral resources accounted for 3.3% of GDP, whilst
13 A resolution aimed at introducing large scale commercial agriculture in Tanzania and part of the Vision 2025 process 14 3ADI, an African Union (AU) and New Economic Partnership for Africa’s Development (NEPAD) initiative, supported by the Tanzanian government, that looks to increase food security and economic growth by focussing on agricultural development, specifically on agribusiness and agro-industries, orientating production towards value-added goods with high demand 15 The 2009 Industrial Survey (latest available) places 206 firms and 37,045 workers in agroprocessing whereas the second largest was textiles with 22 firms and 12,163 workers. More data at: http://nbs.go.tz/takwimu/Industry/ASIP_2009_Statistical.pdf 16 Through the implementation of the Mineral Policy of 1997 and the Mining Act of 1998.
SUPPORTING THE PREPARATION OF TANZANIA’S SECOND FIVE YEAR DEVELOPMENT PLAN (FYDP II) 2016/17 – 2021/22
60
royalty values to the Tanzanian government were minimal compared to export revenues (USD 53.3 million and USD 1.2 billion respectively).
The main aim of the IIDS 2025 is to set up the framework to ensure that strong links are created between the country’s mineral resources and the local economy through increases local participation and value addition at all production levels, whilst minimising environmental degradation. The strategy defines resource-by-resource objectives but these can be broadly summarised into the need to refine products locally (both minerals and fossil fuels), setting up the base for mineral/metal based local industries, reducing energy imports and value adding to exports. Links with other economic sectors are clustered around connections at the vertical level, including the production of energy through the use of local fossil fuel reserves and the use of energy for value addition of mineral products (i.e. refineries).
Whilst the creation of a nitrogen based fertilizer plant is highlighted in the strategy – the processes and industries that revolve around its creation can also contribute to a structural shift within both the manufacturing and agricultural sectors. Chemical (nitrogen derivative based using ammonia/urea) fertilizer production in Tanzania is strategically important since it would be East Africa’s first chemical based fertilizer facility, reducing national and regional dependence on fertilizer imports and providing an additional value-added source of exports for the country 17 . The production plant opens the door for further investments within the chemical industry as envisaged by the IIDS 2025 i.e. the production of ammonium nitrate (industrial explosives), methanol (fuel) as well as more refined chemical compounds – all clustered within a planned specialised petro-chemical industrial zone, which is currently in its final stages of approval.18
The final focus component is on a number of specific subsectors that the country should focus its industrialisation efforts on. The document provides four criteria for choosing these industries, which are their market size, the length of their value chains, availability of resources in Tanzania and Tanzania’s CA. These sectors are:
Fertilisers: Fertilisers are a fundamental component needed to strengthen the agricultural sector by improving yield rates, given the low level of fertilizer use in the country. Tanzanian natural gas reserves and local mineral deposits can provide the material inputs for a local fertilizer industry.
Textiles: The textile sub-sector has, historically, been the cornerstone for industrialisation in high-income countries. The sector is labour intensive with high-value addition potential. Tanzania is one of the world’s largest cotton producers, hence already has access to a large source of raw materials for the sector and can further strengthen its input base by improving its relatively low yield rates.
Edible oils: Even though Tanzania has the potential to be self-sufficient in terms of edible oils, 70% of consumed oils are imported. Given the ease of entry into the sector, promotion of edible oils could be a potentially lucrative component of rural industrialisation.
Cashew nuts: 77% (in 2011) of cashew exports were unprocessed, even though production increased dramatically between 2000 and 2008 and the fact that processed cashew exports earn more than four times as much (per tonne) than unprocessed cashew exports.
Fruits: Quick wins in the sector can be made by reducing post-harvest losses (which can be as high as 60% of produce), through proper collection, processing and preservation systems.
Dairy: Strong potential to improve rural livelihoods as well as meet increasing local per-capita consumption of dairy products. Large volumes of livestock would make the sector competitive, at scale, dependant on much needed increases in quality and could benefit approximately 5 million agricultural households.
17 By 2015 the nitrogen fertilizer production facility had yet to be completed, but following a successful tender process initiated in 201317, a consortium (majority) led by the German Ferrostaal company in cooperation with the parastatal Tanzania Petroleum Development Corporation is expected to begin production by 2019/202017 - the consortia expects that close to 5000 new jobs will be created (both directly and indirectly) through the construction and operation of the plant. 18 http://corporate-digest.com/index.php/tanzania-creates-specialised-industrial-zone-for-petro-chemical-industries
SUPPORTING THE PREPARATION OF TANZANIA’S SECOND FIVE YEAR DEVELOPMENT PLAN (FYDP II) 2016/17 – 2021/22
61
Leather and leather products: Tanzania has a large livestock population providing a significant input base for the leather industry. Most leather exports are currently unprocessed and are of lower value and quality than leather exports from competing countries. There is, therefore, potential to both improve raw leather products but also set up value-adding processes to ensure that final exports are of higher value.
Light machinery: Strong incentive to replace imported light manufacturing products, creating a locally sourced foundation (and capital base) upon which other manufacturing industries (as well as the modernisation of the agricultural sector) can be based on.
Iron and steel production: Iron and coal mines are already operational in the country, there is also a strong growing demand for steel within the East Africa region, making the sector important both at the national and regional level. Given the country’s extensive iron ore reserves, steel production and processing is set to take-off in Tanzania. According to the NDC, Tanzania is set to produce 1.1 million metric tonnes of steel each year, and the commencement of commercial production will see the country rank among the top four producers of iron in Africa (East African Business Week, 2014).
Tourism: High value export market with potentially strong links to local manufacturing and easy rural participation and strong upstream and downstream links to the local and national economy.
A range of international organisations assess priority sectors for Tanzania have also discussed priority sector options provided as well as and the reasoning behind these choices.
One of the more detailed sectoral prioritisation strategies is contained in the World Bank’s (2014) Country Economic Memorandum (CEM). The CEM assesses transformative growth through the lens of productive employment as well as detailed information on the future drivers of industrial growth in the country.
The premise of the study is that jobs matter, as they are a means out of poverty, where sustainable growth coupled with increased employment (and higher labour income) lead to a ‘virtuous cycle’ of economic growth. This premise sets the tone for the identification of potential sectors through a combination of both their employment creation potential, their capacity to grow and Tanzania’s ability to move into (or expand) the sector.
Tanzania’s growth in employment has not matched the growth in the labour force i.e. the number of working age citizens has been growing faster than the number of available jobs (see Figure 36 below which illustrates how the country’s rapid increase in its labour force is paired with a slow decline in poverty levels) whilst the average wage is lower than in comparable countries (see Figure 36 below) and Tanzanian firms have become both less productive and more averse at hiring people due to the numerous constraints that they face.
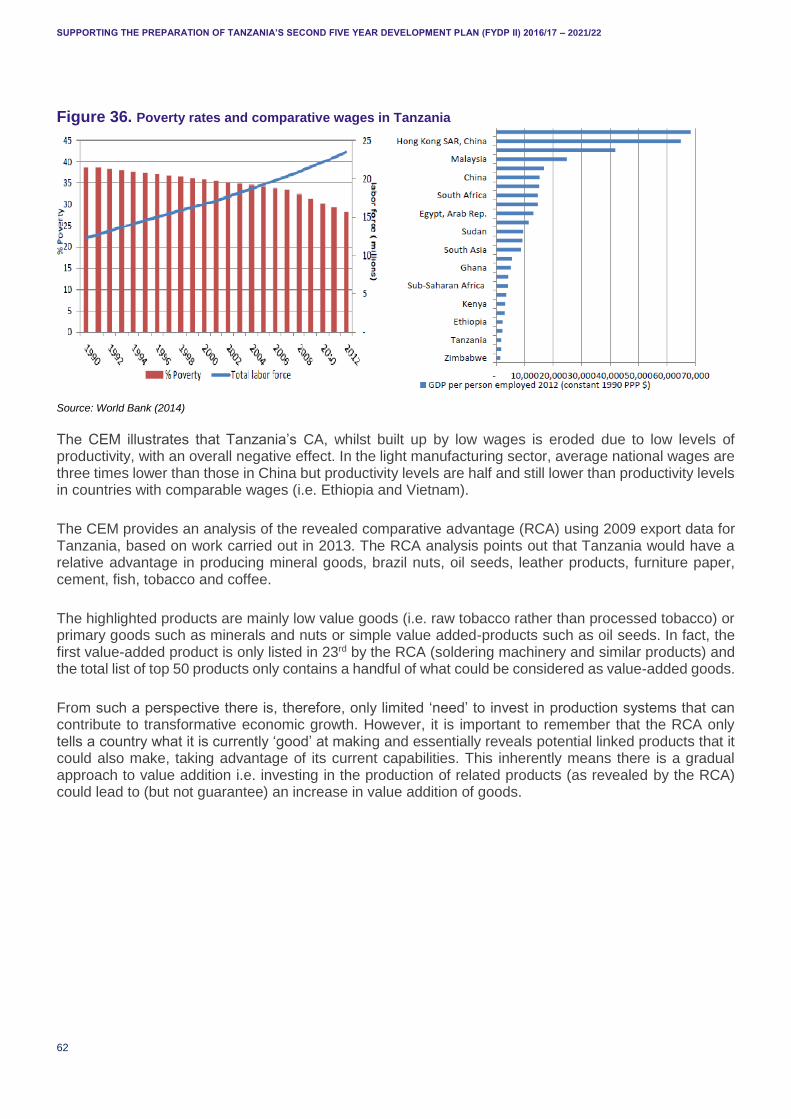
SUPPORTING THE PREPARATION OF TANZANIA’S SECOND FIVE YEAR DEVELOPMENT PLAN (FYDP II) 2016/17 – 2021/22
62
Figure 36. Poverty rates and comparative wages in Tanzania
Source: World Bank (2014)
The CEM illustrates that Tanzania’s CA, whilst built up by low wages is eroded due to low levels of productivity, with an overall negative effect. In the light manufacturing sector, average national wages are three times lower than those in China but productivity levels are half and still lower than productivity levels in countries with comparable wages (i.e. Ethiopia and Vietnam).
The CEM provides an analysis of the revealed comparative advantage (RCA) using 2009 export data for Tanzania, based on work carried out in 2013. The RCA analysis points out that Tanzania would have a relative advantage in producing mineral goods, brazil nuts, oil seeds, leather products, furniture paper, cement, fish, tobacco and coffee.
The highlighted products are mainly low value goods (i.e. raw tobacco rather than processed tobacco) or primary goods such as minerals and nuts or simple value added-products such as oil seeds. In fact, the first value-added product is only listed in 23rd by the RCA (soldering machinery and similar products) and the total list of top 50 products only contains a handful of what could be considered as value-added goods.
From such a perspective there is, therefore, only limited ‘need’ to invest in production systems that can contribute to transformative economic growth. However, it is important to remember that the RCA only tells a country what it is currently ‘good’ at making and essentially reveals potential linked products that it could also make, taking advantage of its current capabilities. This inherently means there is a gradual approach to value addition i.e. investing in the production of related products (as revealed by the RCA) could lead to (but not guarantee) an increase in value addition of goods.
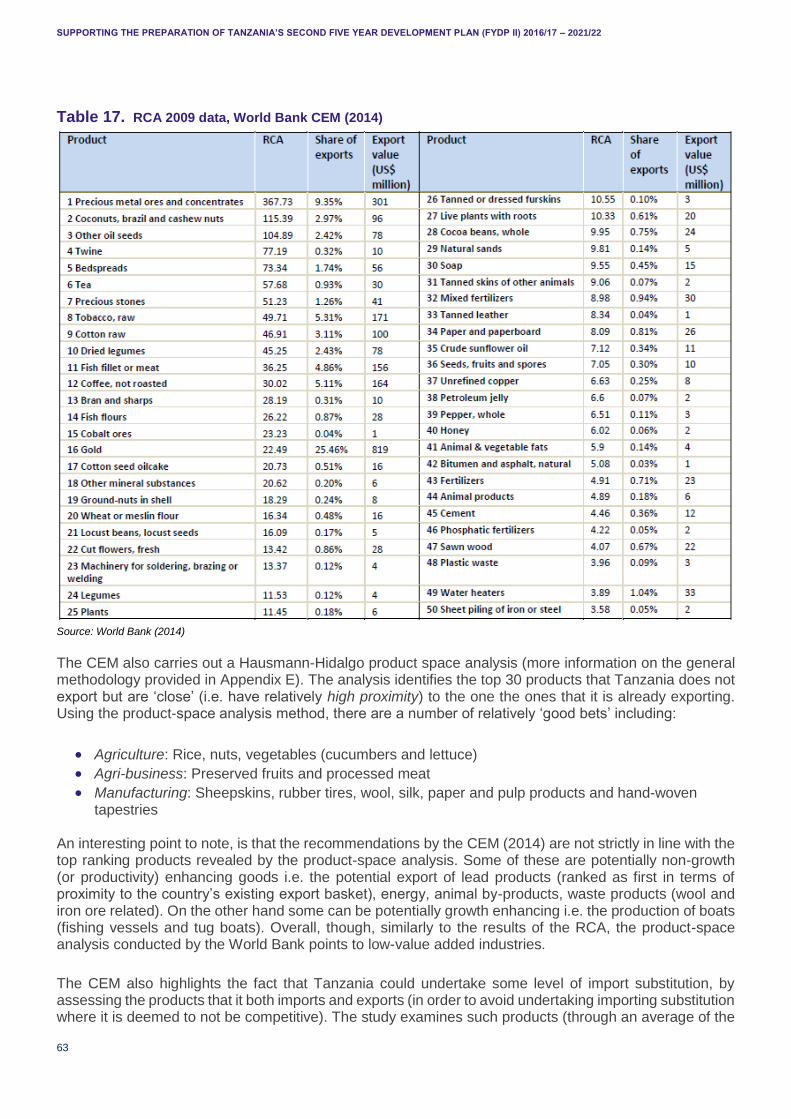
SUPPORTING THE PREPARATION OF TANZANIA’S SECOND FIVE YEAR DEVELOPMENT PLAN (FYDP II) 2016/17 – 2021/22
63
Table 17. RCA 2009 data, World Bank CEM (2014)
Source: World Bank (2014)
The CEM also carries out a Hausmann-Hidalgo product space analysis (more information on the general methodology provided in Appendix E). The analysis identifies the top 30 products that Tanzania does not export but are ‘close’ (i.e. have relatively high proximity) to the one the ones that it is already exporting. Using the product-space analysis method, there are a number of relatively ‘good bets’ including:
Agriculture: Rice, nuts, vegetables (cucumbers and lettuce)
Agri-business: Preserved fruits and processed meat
Manufacturing: Sheepskins, rubber tires, wool, silk, paper and pulp products and hand-woven tapestries
An interesting point to note, is that the recommendations by the CEM (2014) are not strictly in line with the top ranking products revealed by the product-space analysis. Some of these are potentially non-growth (or productivity) enhancing goods i.e. the potential export of lead products (ranked as first in terms of proximity to the country’s existing export basket), energy, animal by-products, waste products (wool and iron ore related). On the other hand some can be potentially growth enhancing i.e. the production of boats (fishing vessels and tug boats). Overall, though, similarly to the results of the RCA, the product-space analysis conducted by the World Bank points to low-value added industries.
The CEM also highlights the fact that Tanzania could undertake some level of import substitution, by assessing the products that it both imports and exports (in order to avoid undertaking importing substitution where it is deemed to not be competitive). The study examines such products (through an average of the
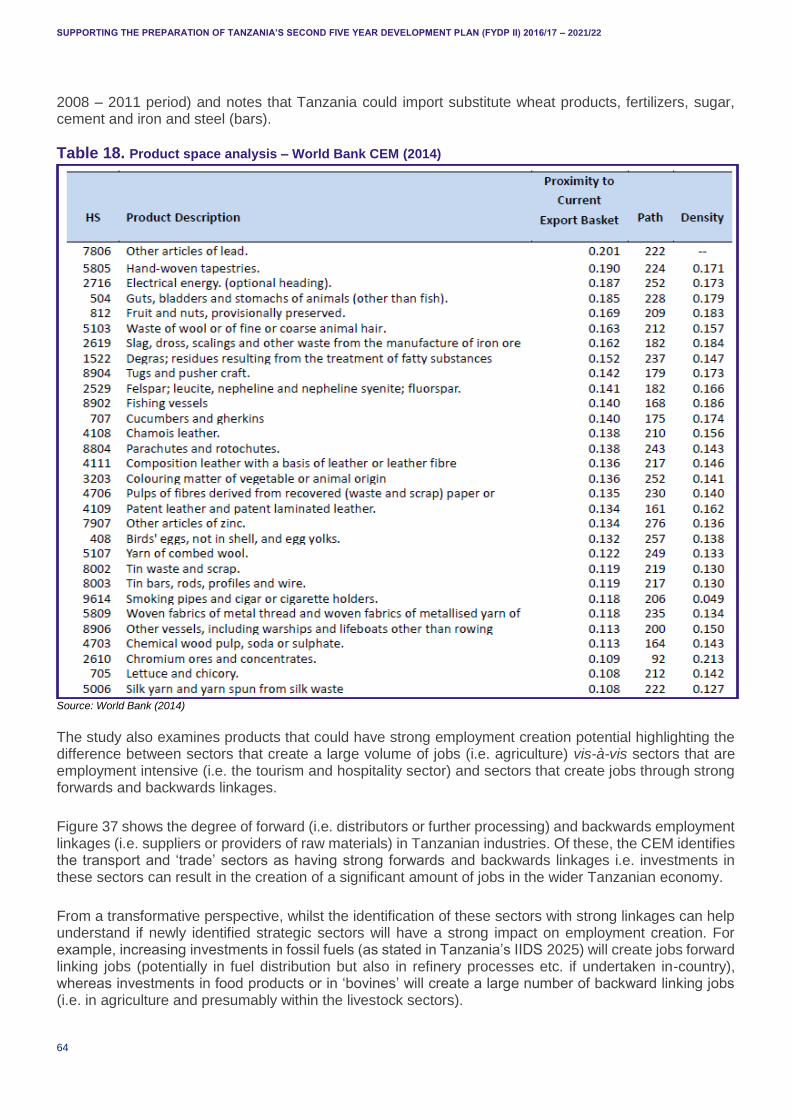
SUPPORTING THE PREPARATION OF TANZANIA’S SECOND FIVE YEAR DEVELOPMENT PLAN (FYDP II) 2016/17 – 2021/22
64
2008 – 2011 period) and notes that Tanzania could import substitute wheat products, fertilizers, sugar, cement and iron and steel (bars).
Table 18. Product space analysis – World Bank CEM (2014)
Source: World Bank (2014)
The study also examines products that could have strong employment creation potential highlighting the difference between sectors that create a large volume of jobs (i.e. agriculture) vis-à-vis sectors that are employment intensive (i.e. the tourism and hospitality sector) and sectors that create jobs through strong forwards and backwards linkages.
Figure 37 shows the degree of forward (i.e. distributors or further processing) and backwards employment linkages (i.e. suppliers or providers of raw materials) in Tanzanian industries. Of these, the CEM identifies the transport and ‘trade’ sectors as having strong forwards and backwards linkages i.e. investments in these sectors can result in the creation of a significant amount of jobs in the wider Tanzanian economy.
From a transformative perspective, whilst the identification of these sectors with strong linkages can help understand if newly identified strategic sectors will have a strong impact on employment creation. For example, increasing investments in fossil fuels (as stated in Tanzania’s IIDS 2025) will create jobs forward linking jobs (potentially in fuel distribution but also in refinery processes etc. if undertaken in-country), whereas investments in food products or in ‘bovines’ will create a large number of backward linking jobs (i.e. in agriculture and presumably within the livestock sectors).
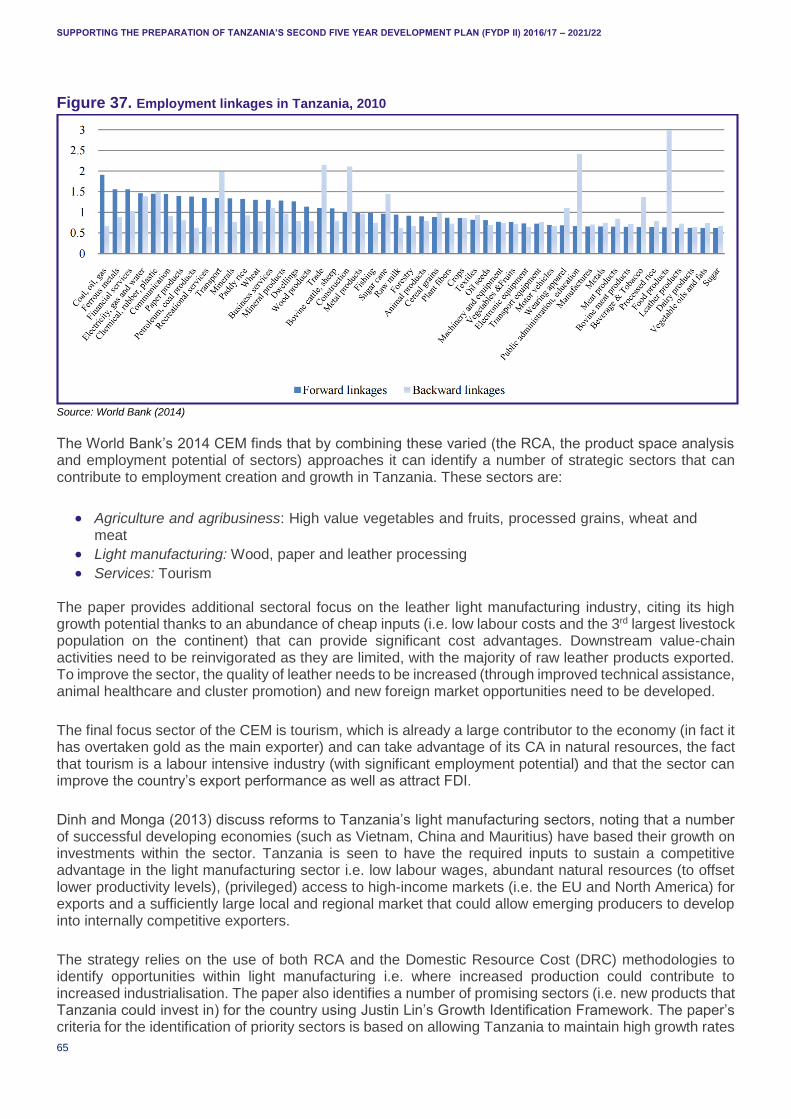
SUPPORTING THE PREPARATION OF TANZANIA’S SECOND FIVE YEAR DEVELOPMENT PLAN (FYDP II) 2016/17 – 2021/22
65
Figure 37. Employment linkages in Tanzania, 2010
Source: World Bank (2014)
The World Bank’s 2014 CEM finds that by combining these varied (the RCA, the product space analysis and employment potential of sectors) approaches it can identify a number of strategic sectors that can contribute to employment creation and growth in Tanzania. These sectors are:
Agriculture and agribusiness: High value vegetables and fruits, processed grains, wheat and meat
Light manufacturing: Wood, paper and leather processing
Services: Tourism The paper provides additional sectoral focus on the leather light manufacturing industry, citing its high growth potential thanks to an abundance of cheap inputs (i.e. low labour costs and the 3rd largest livestock population on the continent) that can provide significant cost advantages. Downstream value-chain activities need to be reinvigorated as they are limited, with the majority of raw leather products exported. To improve the sector, the quality of leather needs to be increased (through improved technical assistance, animal healthcare and cluster promotion) and new foreign market opportunities need to be developed.
The final focus sector of the CEM is tourism, which is already a large contributor to the economy (in fact it has overtaken gold as the main exporter) and can take advantage of its CA in natural resources, the fact that tourism is a labour intensive industry (with significant employment potential) and that the sector can improve the country’s export performance as well as attract FDI.
Dinh and Monga (2013) discuss reforms to Tanzania’s light manufacturing sectors, noting that a number of successful developing economies (such as Vietnam, China and Mauritius) have based their growth on investments within the sector. Tanzania is seen to have the required inputs to sustain a competitive advantage in the light manufacturing sector i.e. low labour wages, abundant natural resources (to offset lower productivity levels), (privileged) access to high-income markets (i.e. the EU and North America) for exports and a sufficiently large local and regional market that could allow emerging producers to develop into internally competitive exporters.
The strategy relies on the use of both RCA and the Domestic Resource Cost (DRC) methodologies to identify opportunities within light manufacturing i.e. where increased production could contribute to increased industrialisation. The paper also identifies a number of promising sectors (i.e. new products that Tanzania could invest in) for the country using Justin Lin’s Growth Identification Framework. The paper’s criteria for the identification of priority sectors is based on allowing Tanzania to maintain high growth rates
SUPPORTING THE PREPARATION OF TANZANIA’S SECOND FIVE YEAR DEVELOPMENT PLAN (FYDP II) 2016/17 – 2021/22
66
by moving from low to high productivity sectors framed within an employment creation agenda. The paper’s particular focus on light manufacturing is based on the fact that it is a labour intensive stepping stone that low income countries can use to enable export-orientated growth and compete through low labour costs, is an engine of growth, creates jobs and can help earn foreign exchange for the country and increased wages for those working in it.
Although the quantitative analysis undertaken is not provided, nor is a comparison with sectors outside of light manufacturing made, the paper highlights four light manufacturing sectors where competitiveness gains could be made in Tanzania: textiles and apparel, leather and leather products, wood and wood products and agroprocessing.
The US’s Millennium Challenge Corporation (MCC) is working on a compact with the Tanzanian government, and sees the energy sector as a potential foreign investment opportunity in the country. The MCC cites the country’s need for energy generation and increased transmission capacity and the numerous locally available energy sources (gas, coal, geothermal, hydro, wind, solar and biomass) either through Independent Power Producer (IPP) investments or through PPPs. The report also cites, subject to the availability of energy, investments in light industry and agro-processing as opportunities to take advantage of mining opportunities in the country or international agreements, such as SAGCOT, that open up regional markets.
UNIDO’s 2012 Tanzania Industrial Competitiveness Report (ICR) takes a more detailed look at the state of industry in the country. The report identifies four promising resource based industrial sub-sectors on which Tanzania could focus. These have been chosen for two reasons, the first is in-country resource availability and the second is that these sectors would boost the country’s industrialisation processes following the same pattern of labour-intensive, manufacturing led, growth seen in South and South East Asia. The identified sectors include:
Iron and steel
Natural gas: Energy and petro-chemical industries.
Agroprocessing and high value agriculture: Sugar-cane, sisal, coffee processing and premium coffee, organic production (various goods)
Minerals: Nickel and uranium, Iron processing
A caveat that the ICR makes is the fact that these are indicative industries and that there needs to be detailed identification and quantification that can help steer investment choices in these resources, followed by a cost and benefit analysis of these investments aimed at assessing which investments would have the best growth and employment impacts in Tanzania. Figure 38 provides a visual representation of the degree of processing of Tanzanian exports. It shows that the level of processing is restricted in the majority of sectors, goods in the metal and agricultural sectors are largely exported in raw form, whilst those in the mineral, wood, leather and sugar sectors are semi-processed.19 Only a small proportion of exported goods are fully processed – mainly clustered within the textiles sector with some representation within the wood and leather products sectors and only nominal representation in other activities.
These figures shed some light on why Tanzania’s government is looking to push resource based industrialisation. Taking note of the country’s main imports (petroleum based products) and exports (minerals and metals – accounting for 51% of exports) and the fact that the majority of exports (in 2012) were unprocessed, there is clearly significant scope to value-addition to exports and support higher value industries within (or based on) the mineral and metal sectors. Likewise, the amount of imported fossil fuels explains why the government is pushing for LNG extraction (and use) in order to reduce their dependence on imported energy (and fuel), improve their balance of trade and make the country less vulnerable to imported energy price shocks.
19 No clear definition is provided of what constitutes a processed and semi-processed product.
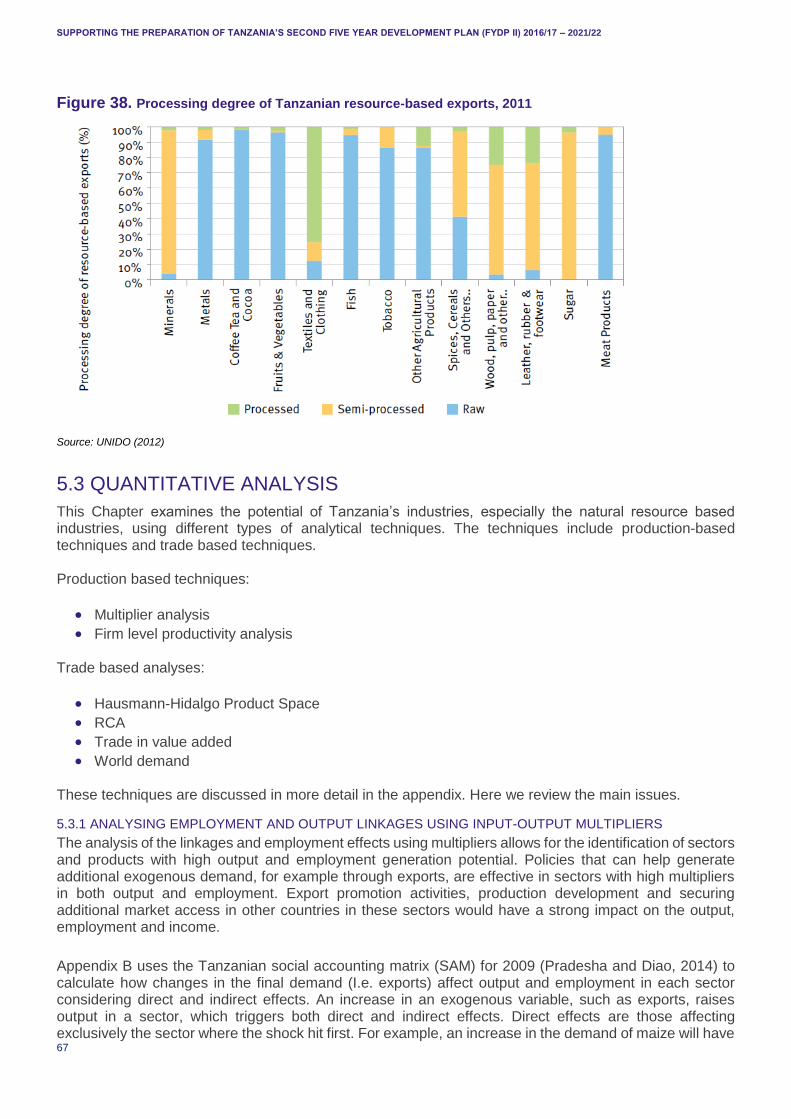
SUPPORTING THE PREPARATION OF TANZANIA’S SECOND FIVE YEAR DEVELOPMENT PLAN (FYDP II) 2016/17 – 2021/22
67
Figure 38. Processing degree of Tanzanian resource-based exports, 2011
Source: UNIDO (2012)
5.3 QUANTITATIVE ANALYSIS
This Chapter examines the potential of Tanzania’s industries, especially the natural resource based industries, using different types of analytical techniques. The techniques include production-based techniques and trade based techniques. Production based techniques:
Multiplier analysis
Firm level productivity analysis Trade based analyses:
Hausmann-Hidalgo Product Space
RCA
Trade in value added
World demand These techniques are discussed in more detail in the appendix. Here we review the main issues.
5.3.1 ANALYSING EMPLOYMENT AND OUTPUT LINKAGES USING INPUT-OUTPUT MULTIPLIERS
The analysis of the linkages and employment effects using multipliers allows for the identification of sectors and products with high output and employment generation potential. Policies that can help generate additional exogenous demand, for example through exports, are effective in sectors with high multipliers in both output and employment. Export promotion activities, production development and securing additional market access in other countries in these sectors would have a strong impact on the output, employment and income.
Appendix B uses the Tanzanian social accounting matrix (SAM) for 2009 (Pradesha and Diao, 2014) to calculate how changes in the final demand (I.e. exports) affect output and employment in each sector considering direct and indirect effects. An increase in an exogenous variable, such as exports, raises output in a sector, which triggers both direct and indirect effects. Direct effects are those affecting exclusively the sector where the shock hit first. For example, an increase in the demand of maize will have
SUPPORTING THE PREPARATION OF TANZANIA’S SECOND FIVE YEAR DEVELOPMENT PLAN (FYDP II) 2016/17 – 2021/22
68
a direct impact in the maize production. In addition, it will have indirect effects coming from the maize production linkages to other sectors. In turn, the production effect on these other sectors might also influence maize production through their linkages with this sector. When we add the direct and indirect effects, we get a measure of the multiplier effect of the shock.
This framework estimates the effects of a one-unit increase in the sectoral final demand on the output of all the sectors of the economy. In addition, it indicates the total effect on the payments to each of the production factors (a payroll effect). This will include both the payments made by the sector directly affected and those made through the indirect effects.
The results indicate that agricultural products (cashews, pulses, sorghum, sisal) and fish, among others, have strong output and employment effects, particularly in the lowest levels of skill. Particularly in the case of fish, both direct and indirect effects are important. Increases in the final demand of these products lead to stronger effects on employment. The combination of a direct effect and important backward linkages with the rest of the economy that generate additional demand of labour is behind this result. In addition, the output effects, though smaller than for some services sectors, are not negligible.
On the other hand, some services sectors, particularly those that can be associated to tourism such as hotels and catering, feature high employment effects although their capability in generating output in the rest of the economy are more limited. In general, a shock that increases demand for services tends to have the strongest effect on the output of the economy. However, the multiplier effect on employment generation of an increase in the final demand of services tends to be modest. The weaker backward linkages of services with the rest of the economy explains this result. For every Shilling exported of Sisal, Fish, Pulses, Cashews and tourism related services such as Hotels and Catering, for example, there are more than two Shillings worth of output in the Tanzanian economy.
5.3.2 FIRM-LEVEL PRODUCTIVITY
Economic transformation occurs when resources are moved to high-productivity activities. This might happen, for example, when resources are moved between low and high productivity firms within a sector; or when they are move between low and high productivity sectors. The firm level shifts are expected to be larger in developing countries since the competitive pressure is lower (e.g. there is more protection) and the costs of being low productive are smaller.
We analyse total factor productivity (TFP) at firm level using the World Bank Enterprise Survey (WBES). We have estimated the production function using a panel of two years (2006 and 2013) for Tanzania and 110 firms that were present in both years. The fitted residual of the estimation is our measure of TFP. A methodological discussion and results can be seen in the appendix. We then classified the TFP based on different firm attributes such as location, sector, ownership and the integration into the global economy.
The analysis suggests that productivity is higher in exporting firms and in firms that present a high international integration measured as the share of imported inputs in production. There is evidence on the link between trade and productivity. However, the direction of the causality is still unclear. Firms may be more productive because they trade (e.g. by meeting international quality standards) or they trade because they are more productive. Whatever the direction of the causality, the link between trade and productivity is strong.
In addition, firms located in Dar Es Salaam and Arusha have higher productivity. In the case of the largest city, there is a clear association between firm productivity and economics of agglomeration. Clustering firms in similar sectors observe lower costs because high competition from their suppliers. There are advantages because the cluster attracts more suppliers and customers than a single firm could achieve alone. Therefore, the larger the city, the higher the productivity. Productivity is high, on the other hand, as a result of being Dar es Salaam the main export and import port.
SUPPORTING THE PREPARATION OF TANZANIA’S SECOND FIVE YEAR DEVELOPMENT PLAN (FYDP II) 2016/17 – 2021/22
69
High productivity in Arusha, on the other hand, might be explained by the fact of being located closer to the Kenyan border, one of Tanzanian main trading partners. In particular, Arusha is closer to Nairobi, a main regional economic and communication hub. On the other hand, the diplomatic enclave and the tourist demand require the presence of higher quality services that benefit firms located in this city by increasing their productivity.
Firms operating in sectors such as plastics, chemicals and food would present, on average, higher productivity. However, the dispersion existing in these sectors, particularly in food, indicates a high degree of heterogeneity. This suggests that there is substantial room for improvement in catching up with the most productive firms in each sector. Rather than moving resources into other sectors, large productivity gains can be achieved by reducing heterogeneity in the most productive sectors.
In addition, we have compared sector productivity in Tanzania with Kenya, Ethiopia and Uganda in a single year. We compare the productivity in each sector in each country in comparison to the average productivity of all the sectors in all four countries. Interestingly, Tanzanian firms are the most productive firms. Chemicals, auto and auto-parts and food are the sectors with the highest differential productivity with respect to the average of the group. In contrast, textiles, garments and wood and furniture are the least productive sectors.
The productivity differential is largest with Ethiopia and smallest with Uganda and Kenya. The differences with these two are consistent with the less bureaucratic customs procedures to export and import as we have seen.
5.3.3 REVEALED COMPARATIVE ADVANTAGE
We examine in which products Tanzania has an RCA. According to Balassa’s definition, a country has an RCA in a particular product if the country exports more than its ‘fair’ share, which is the share of total world trade that the product represents. For instance, if Product A exports constitute 2% of the world trade and 6% of the exports of Country X, this means Country X exports 3 times its ‘fair share’ of Product A exports. Therefore, Country X has RCA in Product A. Data from the UN’s Comtrade database can be used to calculate RCA (the Balassa index) by Standard Industrial Trade Classification (SITC) 4-digit section (one of 1028 products). ‘World’ is defined as Comtrade’s ‘All countries’ aggregate (which represents the sum of the data reported by all countries in any given year).
Table 19 below shows the RCA for Tanzania (for the 2005 to 2013 period). The analysis shows that, over time, Tanzania’s RCA has been (and continues to be) strong for vegetable products as well as the corollary sub-industry of prepared foodstuffs (i.e. agro-processing). However, the strongest RCA revealed by the analysis is within the precious stone sector, where the RCA is around double that of the RCA in the vegetable sector. Overall the top 5 RCA’s coming out of the analysis are:
1. Precious stones (etc.) – RCA of 13.31 2. Vegetable products – RCA of 6.80 3. Prepared foodstuffs – RCA of 2.25 4. Live Animals – RCA of 1.46 5. Textiles – RCA of 1.28
The analysis therefore shows that the agricultural and agroprocessing industry is one where Tanzania could flourish given its CA. This is not surprising given the amount of minerals and ores that the country exports, that it would have a latent advantage in the production of precious stones (and corollary products).
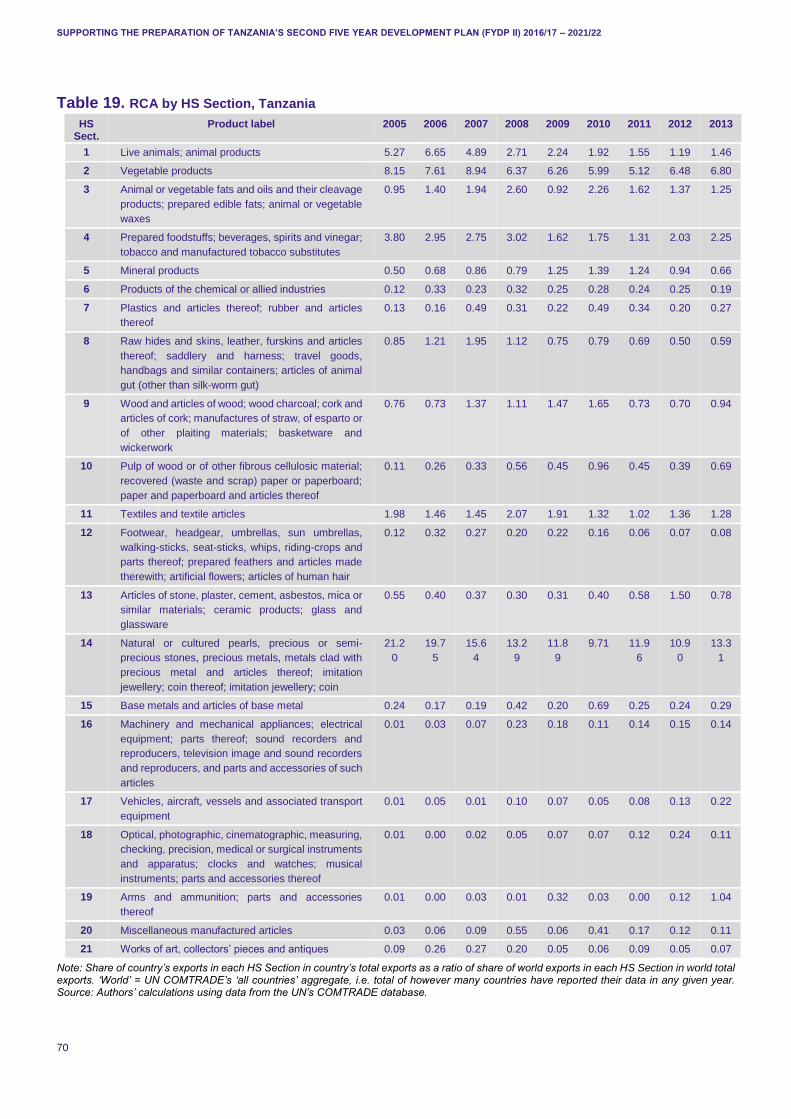
SUPPORTING THE PREPARATION OF TANZANIA’S SECOND FIVE YEAR DEVELOPMENT PLAN (FYDP II) 2016/17 – 2021/22
70
Table 19. RCA by HS Section, Tanzania
HS Sect.
Product label 2005 2006 2007 2008 2009 2010 2011 2012 2013
1 Live animals; animal products 5.27 6.65 4.89 2.71 2.24 1.92 1.55 1.19 1.46
2 Vegetable products 8.15 7.61 8.94 6.37 6.26 5.99 5.12 6.48 6.80
3 Animal or vegetable fats and oils and their cleavage
products; prepared edible fats; animal or vegetable
waxes
0.95 1.40 1.94 2.60 0.92 2.26 1.62 1.37 1.25
4 Prepared foodstuffs; beverages, spirits and vinegar;
tobacco and manufactured tobacco substitutes
3.80 2.95 2.75 3.02 1.62 1.75 1.31 2.03 2.25
5 Mineral products 0.50 0.68 0.86 0.79 1.25 1.39 1.24 0.94 0.66
6 Products of the chemical or allied industries 0.12 0.33 0.23 0.32 0.25 0.28 0.24 0.25 0.19
7 Plastics and articles thereof; rubber and articles
thereof
0.13 0.16 0.49 0.31 0.22 0.49 0.34 0.20 0.27
8 Raw hides and skins, leather, furskins and articles
thereof; saddlery and harness; travel goods,
handbags and similar containers; articles of animal
gut (other than silk-worm gut)
0.85 1.21 1.95 1.12 0.75 0.79 0.69 0.50 0.59
9 Wood and articles of wood; wood charcoal; cork and
articles of cork; manufactures of straw, of esparto or
of other plaiting materials; basketware and
wickerwork
0.76 0.73 1.37 1.11 1.47 1.65 0.73 0.70 0.94
10 Pulp of wood or of other fibrous cellulosic material;
recovered (waste and scrap) paper or paperboard;
paper and paperboard and articles thereof
0.11 0.26 0.33 0.56 0.45 0.96 0.45 0.39 0.69
11 Textiles and textile articles 1.98 1.46 1.45 2.07 1.91 1.32 1.02 1.36 1.28
12 Footwear, headgear, umbrellas, sun umbrellas,
walking-sticks, seat-sticks, whips, riding-crops and
parts thereof; prepared feathers and articles made
therewith; artificial flowers; articles of human hair
0.12 0.32 0.27 0.20 0.22 0.16 0.06 0.07 0.08
13 Articles of stone, plaster, cement, asbestos, mica or
similar materials; ceramic products; glass and
glassware
0.55 0.40 0.37 0.30 0.31 0.40 0.58 1.50 0.78
14 Natural or cultured pearls, precious or semi-
precious stones, precious metals, metals clad with
precious metal and articles thereof; imitation
jewellery; coin thereof; imitation jewellery; coin
21.2
0
19.7
5
15.6
4
13.2
9
11.8
9
9.71 11.9
6
10.9
0
13.3
1
15 Base metals and articles of base metal 0.24 0.17 0.19 0.42 0.20 0.69 0.25 0.24 0.29
16 Machinery and mechanical appliances; electrical
equipment; parts thereof; sound recorders and
reproducers, television image and sound recorders
and reproducers, and parts and accessories of such
articles
0.01 0.03 0.07 0.23 0.18 0.11 0.14 0.15 0.14
17 Vehicles, aircraft, vessels and associated transport
equipment
0.01 0.05 0.01 0.10 0.07 0.05 0.08 0.13 0.22
18 Optical, photographic, cinematographic, measuring,
checking, precision, medical or surgical instruments
and apparatus; clocks and watches; musical
instruments; parts and accessories thereof
0.01 0.00 0.02 0.05 0.07 0.07 0.12 0.24 0.11
19 Arms and ammunition; parts and accessories
thereof
0.01 0.00 0.03 0.01 0.32 0.03 0.00 0.12 1.04
20 Miscellaneous manufactured articles 0.03 0.06 0.09 0.55 0.06 0.41 0.17 0.12 0.11
21 Works of art, collectors’ pieces and antiques 0.09 0.26 0.27 0.20 0.05 0.06 0.09 0.05 0.07
Note: Share of country’s exports in each HS Section in country’s total exports as a ratio of share of world exports in each HS Section in world total exports. ‘World’ = UN COMTRADE’s ‘all countries’ aggregate, i.e. total of however many countries have reported their data in any given year. Source: Authors’ calculations using data from the UN’s COMTRADE database.

SUPPORTING THE PREPARATION OF TANZANIA’S SECOND FIVE YEAR DEVELOPMENT PLAN (FYDP II) 2016/17 – 2021/22
71
5.3.4 HAUSMANN-HIDALGO PRODUCT SPACE
We also examine the Hausmann-Hidalgo product space for Tanzania, which helps identify promising products for diversification as well as products that are ‘close’ to Tanzania’s existing production structure (based on trade data) and compare Tanzania’s economic complexity with benchmark countries. Appendix E provides details.
We first show that Tanzania is less diversified than e.g. Kenya or Malaysia but more diversified than Uganda, and the products that Tanzania exports are a bit less common and are produced by fewer countries than Kenya or Uganda. We find that East African countries tend to be relatively diversified countries producing standard products. Kenya has a higher value of the ECI, suggesting that Kenya has more productive knowledge (capabilities to produce diverse products) than Tanzania. Countries with relatively lower productive knowledge (lower ECI) – such as Tanzania– make products that either are in the peripheral parts of the product space or are relatively simpler, and moving to a particular new product does not provide much benefit (has low opportunity value) as compared to countries such as Malaysia, which have relatively higher ECI and opportunity value. But it is important to note that Tanzania has a higher ECI (especially in recent years) compared to natural resource exporters.
We compare product space maps of Tanzania and Kenya. This reveals two main issues. First, over time Tanzania has moved from specialising in peripheral products which have very few products close by towards specialising into products that are have more links to other products (i.e. are more in the middle dense area of the products space related to machinery/electronics/garments) which suggests a better way of specialisation (into products with more linkages / opportunity gain). And secondly, compared to Kenya, it lacks a profile that is sufficiently located into those products that have many links.
Our analysis in the appendix suggests Tanzania will benefit especially from diversifying into the following types of products (note that this product space is different from the product space analysis by the World Bank, 2014, mainly through using different assessment rules, but also through using other data):
Machinery and transport equipment (e.g. specialist industrial machinery)
Chemicals and related products (e.g. organo sulphur compounds)
Manufactured goods classified chiefly by material (e.g. glass sheets)
Miscellaneous manufactured articles (e.g. microscopes).
5.3.5 EXAMINING THE ROLE OF DIFFERENT SECTORS IN CONTRIBUTING TO VALUE ADDITION OF EXPORTS
Increasing the ability to export is important. However, increasing the value of exports is particularly relevant if it coincides with an increase in the domestic value added (DVA) part (in an absolute sense). Appendix C shows that the annual growth in domestic value addition in exports (calculated using Eora) was 5.4% over 2006-2011, whereas that in foreign value addition increased by 8% over the same period. The share of DVA has declined from nearly 90% in 2000 to around 70% in 2011. The local content of exports is lower than in many other countries. The annual growth rate in the domestic value addition (in gross exports, using Eora data) was 5.4% in Tanzania over 1996-2011, but this was much less than other SSA countries (e.g. 8.8% in Kenya, 10.9% in Uganda and 15.9% in Zambia). Moreover, the level share of domestic value addition in exports was 69.9% in 2011, and 90.1% in Nigeria, 75.1% in Zambia and 71.5% in Uganda.
The contribution to DVA has risen strongly over the last five years in a number of sectors including:
Post and telecommunications,
Chemical and mineral products,
Electrical machinery,
Wood and paper,
Metal products and
SUPPORTING THE PREPARATION OF TANZANIA’S SECOND FIVE YEAR DEVELOPMENT PLAN (FYDP II) 2016/17 – 2021/22
72
Hotels and restaurants.
The services share in value added in exports increased in several African countries apart from Ghana and Nigeria where increased commodity prices increased the share of the primary sector. After South Africa, Kenya holds joint second position with Rwanda, but increases have been much faster in Rwanda. In Tanzania, the share of services increased by 4 percentage points despite strong increases in commodity prices.
5.3.6 EXAMINING TANZANIA’S EXPORTS IN THE CONTEXT OF WORLD DEMAND
It is important to examine which sectors and products face increased demand in world markets. We track the evolution of world demand, vis-à-vis the evolution of Tanzanian export specialisation, or CA, in those products. Using these two criteria describes four possible scenarios:
1. Products where both Tanzanian CA and world demand is growing
2. Products where Tanzanian CA is growing but world demand is falling
3. Products where Tanzanian CA is falling but world demand is rising
4. Products where both Tanzanian CA and world demand are falling
The ideal situation, of course, is to specialise in the production and trade of those products where both dimensions are rising. In this case, Tanzanian would be gaining efficiency in products demanded by the world. Many of these products are familiar, as they tend to constitute the main exported products. However, others may escape the radar and may constitute interesting opportunities for further specialisation.
Those products where the CA is growing but demand is falling may present certain risks as they suggest that specialisation is moving towards products where demand is weak. Although Tanzania, in this way, will be capturing market share, it will be in products where world demand is losing interest. The transformation process is also present in those products where CA is falling but world demand is rising. These are products where Tanzania’s competitors might be presenting better production and trade conditions. Therefore, Tanzania is losing efficiency in production relatively to other products being exported by Tanzania. Although in some of these products, Tanzanian exports are growing, they are growing slower than world demand.
In order to identify products under each of these groups, we have used the annual growth rate of world exports between 2008 and 2013 as a measure of world demand (as many countries have not yet processed their trade statistics for 2014).
We have computed the normalised RCA for presentational purposes. The normalised RCA ranges from -1 to 1, with 0 the threshold. Whenever the RCA is positive, it indicates that Tanzania has an RCA in that product. The choice of the normalised RCA is based exclusively on presentational purposes (it limits the range of the indicator between -1 and 1). For the same reasons explained above, we have limited the calculation of the RCA to the period 2008-2013.
In addition, we have included the annual rate of growth of Tanzanian exports in these products. However, as export data for Tanzania in 2014 are already available, we have used it in the computation of the rate of growth. This implies that it represents a slightly longer period than the rate of growth of world demand.
Given that the number of products that meet these criteria in each case is very large (we have worked at HS 6 digits), we present in Table 20 a summary of the main products identified. In order to limit the number of products, we have selected those 10 in each group where world demand has grown or decreased the fastest or where Tanzanian exports are largest and demand is very weak. In the products where both RCA and world demand have gone up, we have divided the analysis in two parts: those products where Tanzania has shown a constant positive RCA in every year analysed, and those products where Tanzania did not have a CA in the period 2008-2010 but it did have in the period 2011-13. Table 20 presents a
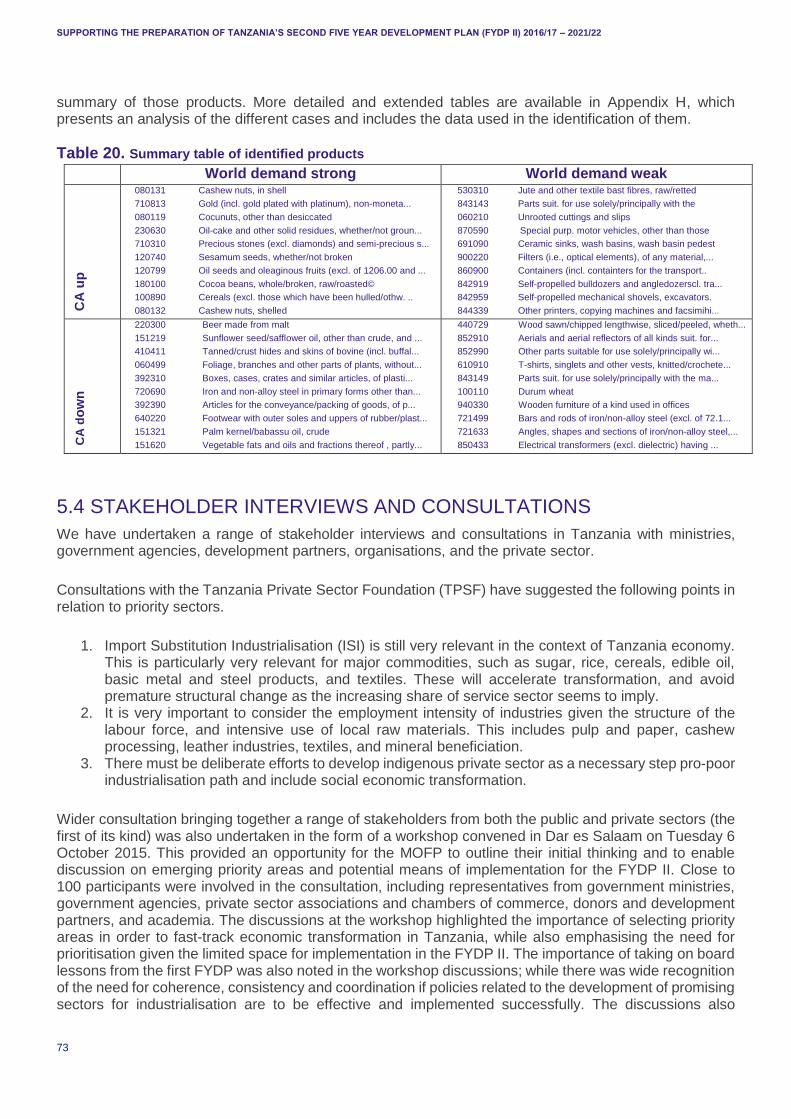
SUPPORTING THE PREPARATION OF TANZANIA’S SECOND FIVE YEAR DEVELOPMENT PLAN (FYDP II) 2016/17 – 2021/22
73
summary of those products. More detailed and extended tables are available in Appendix H, which presents an analysis of the different cases and includes the data used in the identification of them.
Table 20. Summary table of identified products
World demand strong World demand weak
CA
up
080131 Cashew nuts, in shell
710813 Gold (incl. gold plated with platinum), non-moneta...
080119 Cocunuts, other than desiccated
230630 Oil-cake and other solid residues, whether/not groun...
710310 Precious stones (excl. diamonds) and semi-precious s...
120740 Sesamum seeds, whether/not broken
120799 Oil seeds and oleaginous fruits (excl. of 1206.00 and ...
180100 Cocoa beans, whole/broken, raw/roasted©
100890 Cereals (excl. those which have been hulled/othw. ..
080132 Cashew nuts, shelled
530310 Jute and other textile bast fibres, raw/retted
843143 Parts suit. for use solely/principally with the
060210 Unrooted cuttings and slips
870590 Special purp. motor vehicles, other than those
691090 Ceramic sinks, wash basins, wash basin pedest
900220 Filters (i.e., optical elements), of any material,...
860900 Containers (incl. containters for the transport..
842919 Self-propelled bulldozers and angledozerscl. tra...
842959 Self-propelled mechanical shovels, excavators.
844339 Other printers, copying machines and facsimihi...
CA
do
wn
220300 Beer made from malt
151219 Sunflower seed/safflower oil, other than crude, and ...
410411 Tanned/crust hides and skins of bovine (incl. buffal...
060499 Foliage, branches and other parts of plants, without...
392310 Boxes, cases, crates and similar articles, of plasti...
720690 Iron and non-alloy steel in primary forms other than...
392390 Articles for the conveyance/packing of goods, of p...
640220 Footwear with outer soles and uppers of rubber/plast...
151321 Palm kernel/babassu oil, crude
151620 Vegetable fats and oils and fractions thereof , partly...
440729 Wood sawn/chipped lengthwise, sliced/peeled, wheth...
852910 Aerials and aerial reflectors of all kinds suit. for...
852990 Other parts suitable for use solely/principally wi...
610910 T-shirts, singlets and other vests, knitted/crochete...
843149 Parts suit. for use solely/principally with the ma...
100110 Durum wheat
940330 Wooden furniture of a kind used in offices
721499 Bars and rods of iron/non-alloy steel (excl. of 72.1...
721633 Angles, shapes and sections of iron/non-alloy steel,...
850433 Electrical transformers (excl. dielectric) having ...
5.4 STAKEHOLDER INTERVIEWS AND CONSULTATIONS
We have undertaken a range of stakeholder interviews and consultations in Tanzania with ministries, government agencies, development partners, organisations, and the private sector.
Consultations with the Tanzania Private Sector Foundation (TPSF) have suggested the following points in relation to priority sectors.
1. Import Substitution Industrialisation (ISI) is still very relevant in the context of Tanzania economy. This is particularly very relevant for major commodities, such as sugar, rice, cereals, edible oil, basic metal and steel products, and textiles. These will accelerate transformation, and avoid premature structural change as the increasing share of service sector seems to imply.
2. It is very important to consider the employment intensity of industries given the structure of the labour force, and intensive use of local raw materials. This includes pulp and paper, cashew processing, leather industries, textiles, and mineral beneficiation.
3. There must be deliberate efforts to develop indigenous private sector as a necessary step pro-poor industrialisation path and include social economic transformation.
Wider consultation bringing together a range of stakeholders from both the public and private sectors (the first of its kind) was also undertaken in the form of a workshop convened in Dar es Salaam on Tuesday 6 October 2015. This provided an opportunity for the MOFP to outline their initial thinking and to enable discussion on emerging priority areas and potential means of implementation for the FYDP II. Close to 100 participants were involved in the consultation, including representatives from government ministries, government agencies, private sector associations and chambers of commerce, donors and development partners, and academia. The discussions at the workshop highlighted the importance of selecting priority areas in order to fast-track economic transformation in Tanzania, while also emphasising the need for prioritisation given the limited space for implementation in the FYDP II. The importance of taking on board lessons from the first FYDP was also noted in the workshop discussions; while there was wide recognition of the need for coherence, consistency and coordination if policies related to the development of promising sectors for industrialisation are to be effective and implemented successfully. The discussions also
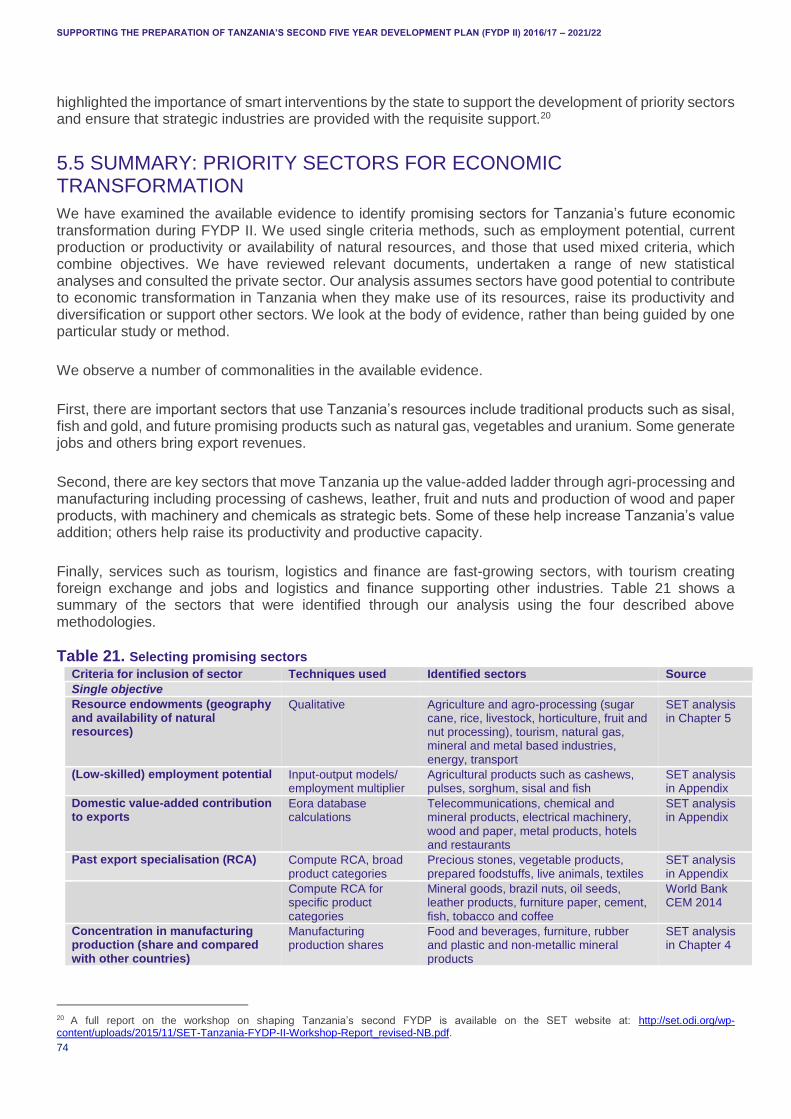
SUPPORTING THE PREPARATION OF TANZANIA’S SECOND FIVE YEAR DEVELOPMENT PLAN (FYDP II) 2016/17 – 2021/22
74
highlighted the importance of smart interventions by the state to support the development of priority sectors and ensure that strategic industries are provided with the requisite support.20
5.5 SUMMARY: PRIORITY SECTORS FOR ECONOMIC TRANSFORMATION
We have examined the available evidence to identify promising sectors for Tanzania’s future economic transformation during FYDP II. We used single criteria methods, such as employment potential, current production or productivity or availability of natural resources, and those that used mixed criteria, which combine objectives. We have reviewed relevant documents, undertaken a range of new statistical analyses and consulted the private sector. Our analysis assumes sectors have good potential to contribute to economic transformation in Tanzania when they make use of its resources, raise its productivity and diversification or support other sectors. We look at the body of evidence, rather than being guided by one particular study or method.
We observe a number of commonalities in the available evidence.
First, there are important sectors that use Tanzania’s resources include traditional products such as sisal, fish and gold, and future promising products such as natural gas, vegetables and uranium. Some generate jobs and others bring export revenues.
Second, there are key sectors that move Tanzania up the value-added ladder through agri-processing and manufacturing including processing of cashews, leather, fruit and nuts and production of wood and paper products, with machinery and chemicals as strategic bets. Some of these help increase Tanzania’s value addition; others help raise its productivity and productive capacity.
Finally, services such as tourism, logistics and finance are fast-growing sectors, with tourism creating foreign exchange and jobs and logistics and finance supporting other industries. Table 21 shows a summary of the sectors that were identified through our analysis using the four described above methodologies.
Table 21. Selecting promising sectors
Criteria for inclusion of sector Techniques used Identified sectors Source
Single objective
Resource endowments (geography and availability of natural resources)
Qualitative Agriculture and agro-processing (sugar cane, rice, livestock, horticulture, fruit and nut processing), tourism, natural gas, mineral and metal based industries, energy, transport
SET analysis in Chapter 5
(Low-skilled) employment potential Input-output models/ employment multiplier
Agricultural products such as cashews, pulses, sorghum, sisal and fish
SET analysis in Appendix
Domestic value-added contribution to exports
Eora database calculations
Telecommunications, chemical and mineral products, electrical machinery, wood and paper, metal products, hotels and restaurants
SET analysis in Appendix
Past export specialisation (RCA) Compute RCA, broad product categories
Precious stones, vegetable products, prepared foodstuffs, live animals, textiles
SET analysis in Appendix
Compute RCA for specific product categories
Mineral goods, brazil nuts, oil seeds, leather products, furniture paper, cement, fish, tobacco and coffee
World Bank CEM 2014
Concentration in manufacturing production (share and compared with other countries)
Manufacturing production shares
Food and beverages, furniture, rubber and plastic and non-metallic mineral products
SET analysis in Chapter 4
20 A full report on the workshop on shaping Tanzania’s second FYDP is available on the SET website at: http://set.odi.org/wp-content/uploads/2015/11/SET-Tanzania-FYDP-II-Workshop-Report_revised-NB.pdf.
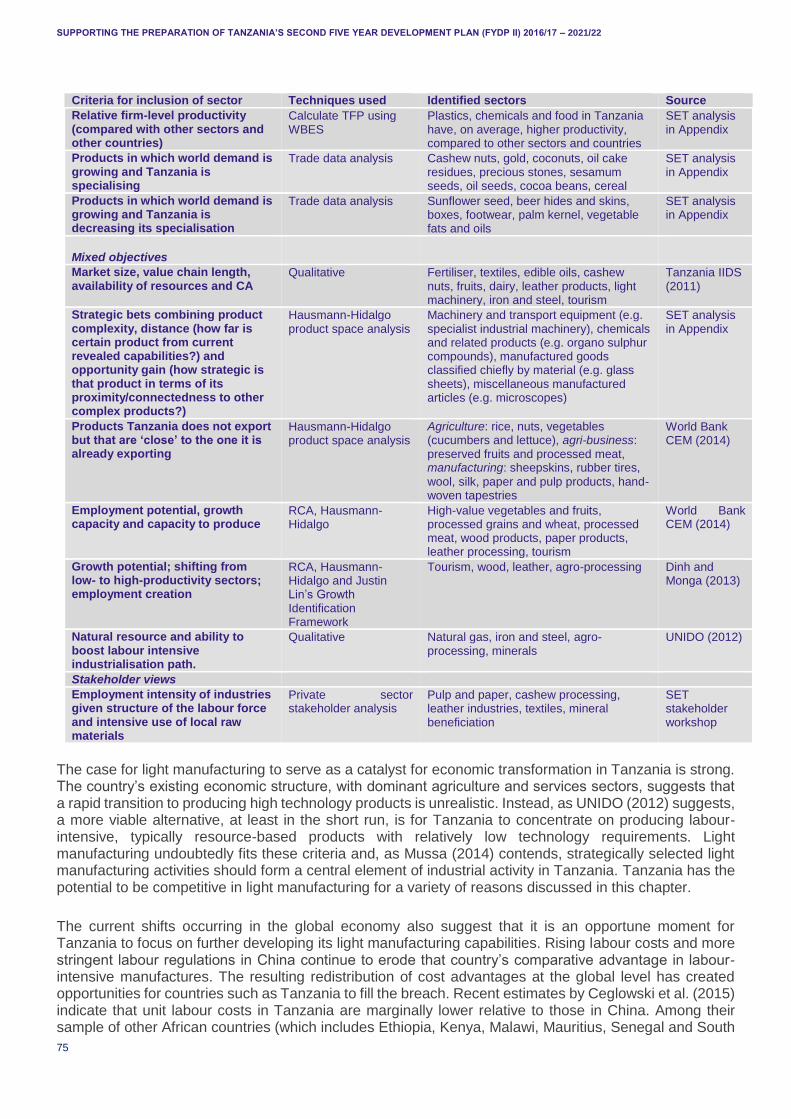
SUPPORTING THE PREPARATION OF TANZANIA’S SECOND FIVE YEAR DEVELOPMENT PLAN (FYDP II) 2016/17 – 2021/22
75
Criteria for inclusion of sector Techniques used Identified sectors Source
Relative firm-level productivity (compared with other sectors and other countries)
Calculate TFP using WBES
Plastics, chemicals and food in Tanzania have, on average, higher productivity, compared to other sectors and countries
SET analysis in Appendix
Products in which world demand is growing and Tanzania is specialising
Trade data analysis Cashew nuts, gold, coconuts, oil cake residues, precious stones, sesamum seeds, oil seeds, cocoa beans, cereal
SET analysis in Appendix
Products in which world demand is growing and Tanzania is decreasing its specialisation
Trade data analysis Sunflower seed, beer hides and skins, boxes, footwear, palm kernel, vegetable fats and oils
SET analysis in Appendix
Mixed objectives
Market size, value chain length, availability of resources and CA
Qualitative Fertiliser, textiles, edible oils, cashew nuts, fruits, dairy, leather products, light machinery, iron and steel, tourism
Tanzania IIDS (2011)
Strategic bets combining product complexity, distance (how far is certain product from current revealed capabilities?) and opportunity gain (how strategic is that product in terms of its proximity/connectedness to other complex products?)
Hausmann-Hidalgo product space analysis
Machinery and transport equipment (e.g. specialist industrial machinery), chemicals and related products (e.g. organo sulphur compounds), manufactured goods classified chiefly by material (e.g. glass sheets), miscellaneous manufactured articles (e.g. microscopes)
SET analysis in Appendix
Products Tanzania does not export but that are ‘close’ to the one it is already exporting
Hausmann-Hidalgo product space analysis
Agriculture: rice, nuts, vegetables (cucumbers and lettuce), agri-business: preserved fruits and processed meat, manufacturing: sheepskins, rubber tires,
wool, silk, paper and pulp products, hand-woven tapestries
World Bank CEM (2014)
Employment potential, growth capacity and capacity to produce
RCA, Hausmann-Hidalgo
High-value vegetables and fruits, processed grains and wheat, processed meat, wood products, paper products, leather processing, tourism
World Bank CEM (2014)
Growth potential; shifting from low- to high-productivity sectors; employment creation
RCA, Hausmann-Hidalgo and Justin Lin’s Growth Identification Framework
Tourism, wood, leather, agro-processing Dinh and Monga (2013)
Natural resource and ability to boost labour intensive industrialisation path.
Qualitative Natural gas, iron and steel, agro-processing, minerals
UNIDO (2012)
Stakeholder views
Employment intensity of industries given structure of the labour force and intensive use of local raw materials
Private sector stakeholder analysis
Pulp and paper, cashew processing, leather industries, textiles, mineral beneficiation
SET stakeholder workshop
The case for light manufacturing to serve as a catalyst for economic transformation in Tanzania is strong. The country’s existing economic structure, with dominant agriculture and services sectors, suggests that a rapid transition to producing high technology products is unrealistic. Instead, as UNIDO (2012) suggests, a more viable alternative, at least in the short run, is for Tanzania to concentrate on producing labour-intensive, typically resource-based products with relatively low technology requirements. Light manufacturing undoubtedly fits these criteria and, as Mussa (2014) contends, strategically selected light manufacturing activities should form a central element of industrial activity in Tanzania. Tanzania has the potential to be competitive in light manufacturing for a variety of reasons discussed in this chapter.
The current shifts occurring in the global economy also suggest that it is an opportune moment for Tanzania to focus on further developing its light manufacturing capabilities. Rising labour costs and more stringent labour regulations in China continue to erode that country’s comparative advantage in labour-intensive manufactures. The resulting redistribution of cost advantages at the global level has created opportunities for countries such as Tanzania to fill the breach. Recent estimates by Ceglowski et al. (2015) indicate that unit labour costs in Tanzania are marginally lower relative to those in China. Among their sample of other African countries (which includes Ethiopia, Kenya, Malawi, Mauritius, Senegal and South
SUPPORTING THE PREPARATION OF TANZANIA’S SECOND FIVE YEAR DEVELOPMENT PLAN (FYDP II) 2016/17 – 2021/22
76
Africa), only Ethiopia’s labour costs are at a similar level to those in China, although Tanzania is marginally more competitive on their relative unit labour cost measure. 21 That said, Ethiopia is more competitive than Tanzania along simple comparisons of manufacturing wage levels. Ceglowski et al. (2015) report that in 2010 annual manufacturing wages in Tanzania (at USD 1,581) were nearly double those in Ethiopia (USD 807). Similarly, estimates reported in Dinh et al. (2012) show that Ethiopia is more competitive than Tanzania in certain light manufacturing industries (producing polo shirts, dairy milk, wooden chairs, leather loafers or milled wheat) when only the US dollar values of monthly wages for skilled and unskilled workers are considered. For example, they report data for 2011 showing that monthly wages for skilled workers producing polo shirts in Ethiopia were in the range of USD 37-185, compared with equivalent wages ranging from USD 107-213 in Tanzania.22 Nevertheless, the general sense is that, at least in terms of labour costs in light manufacturing industries, Tanzania has become very competitive at the global level.
Light manufacturing is already a significant contributor to industry’s share of total GDP in Tanzania and the share of light manufacturing exports in Tanzania’s total merchandise exports has increased sharply in the past decade, rising for instance from 7% in 2003 to 20% in 2012 (ibid.). Even so, as in the case of many of the sectors in the Tanzanian economy, the light manufacturing sector remains poorly integrated into existing manufacturing global value chains (GVCs).
21 In most other SSA countries, relative unit labour costs exceed those in China by some margin. This is primarily because, until recently at least, both real wages and productivity levels in manufacturing have been higher in SSA countries than in China, but the real wage differential has exceeded the productivity differential (Ceglowski et al., 2015). 22 See Table 1.1 in Dinh et al. (2012) for a more detailed comparison.
SUPPORTING THE PREPARATION OF TANZANIA’S SECOND FIVE YEAR DEVELOPMENT PLAN (FYDP II) 2016/17 – 2021/22
77
6. ECONOMIC AND POLICY CONSTRAINTS TO SECTORAL GROWTH
This chapter examines the key constraints behind the emergence of previously identified successful (or potentially successful) industries that could help economic transformation in Tanzania, and in particular constraints to industrialisation. The chapter is based on document and data review and analysis, augmented by qualitative interviews. The Chapter also seeks to understand whether there are commonalities and differences in constraints across industries. There will be quick policy solutions in some cases, but in other cases the solutions will be long-term in nature.
We emphasise not one single view or policy, but we bring together a large body of evidence on the range of constraints to transformation. Our main conclusion is that a number of constraints are common across a large range of sectors. We divided constraints into two categories: economic fundamentals (skills, infrastructure such as energy and transport, finance and technology) and policies and institutions (including trade policy, corruption and effective coordination).
Dinh and Monga (2013) is the first study that we review. It covers general industrial growth constraints in Tanzania and highlights common microeconomic constraints that hinder both industrialisation and economic growth, including:
Anti-export bias: A number of tariff and non-tariff barriers restrict imports resulting in a shift away from export-oriented industries and more towards import-substituting industries. The indirect result is that export production becomes more expensive, by increasing export production costs as resources are channelled towards import substitution.
Trade logistics: Efforts need to be made to lower trade costs and improve trade facilitation. One of the key improvement points is the Dar Es Salaam Port, which is currently highly congested. Improvements here and the creation of the Bagamoyo Gateway Port would allow Tanzania to provide more effective trade links within the country and for landlocked neighbours.
Energy supply: The country is hindered by severe power outages due to a supply/usage gap. Inefficiencies in energy production and distribution are attributable to insufficient production by the Tanzania Electric Supply Company (TANESCO) (state-owned enterprise (SOE) holding the monopoly on power generation), slow infrastructure maintenance and development, limited private sector competition with TANESCO23 and dependence on hydroelectricity which causes fluctuations in energy supply dependent on season and climatic conditions.
Transport infrastructure: Rural roads require an overhaul as their current condition increases rural transport costs and raises agricultural production costs. Transport costs are highest between farms and the primary market they serve but lower between primary markets and secondary markets or wholesalers. Estimates show that 45% of average transport costs occur within the first 28% of transport distance.
Lack of entrepreneurial skills and business development opportunities: Perceived weaknesses in entrepreneurial skills in Tanzanian businesses translate to limited growth opportunities for firms (beyond the small scale) and missed opportunities to link to international business conglomerates (and associated value/supply chains).
Access to finance: A major binding constraint amongst most sectors, especially for small companies looking to expand. 80% of SMEs in Tanzania used their own savings in order to purchase new capital only 3% of companies in Tanzania borrow from financial institutions
23 The Government of Tanzania has set out an energy sector reform map, the ‘Energy Supply Industry Reform Strategy and Roadmap’ which also proposes the complete unbundling of TANESCO by 2020 (MCC, 2015)
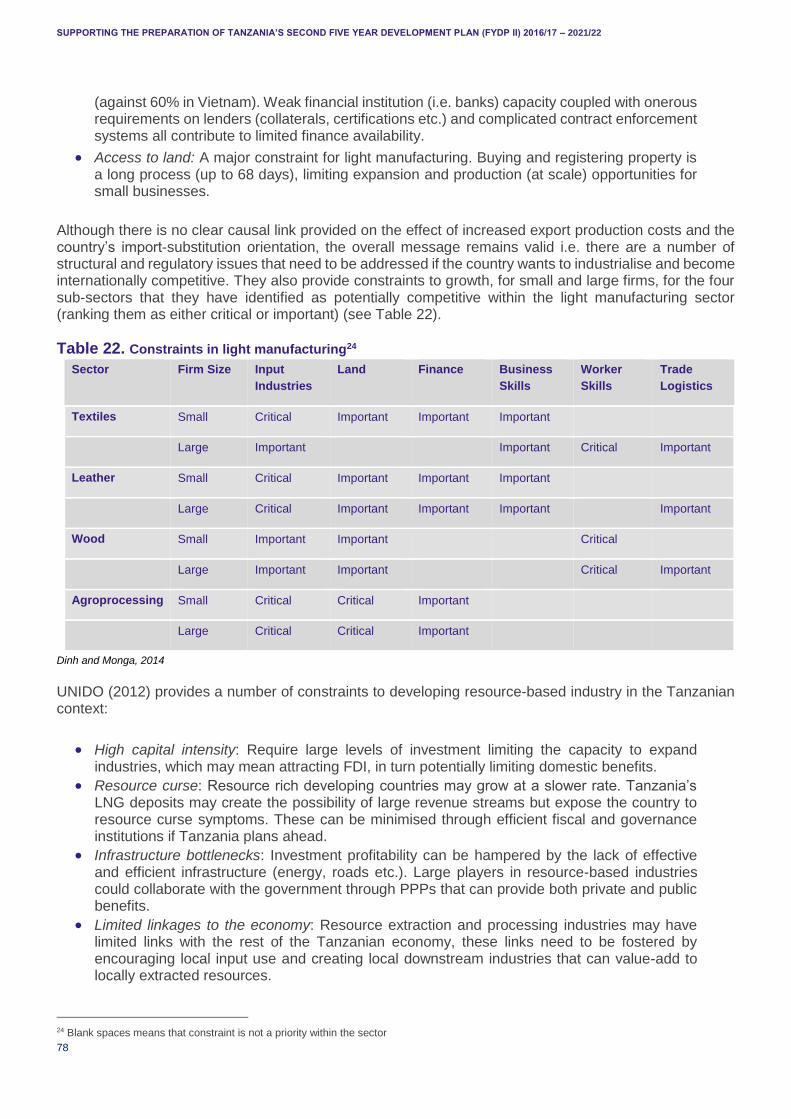
SUPPORTING THE PREPARATION OF TANZANIA’S SECOND FIVE YEAR DEVELOPMENT PLAN (FYDP II) 2016/17 – 2021/22
78
(against 60% in Vietnam). Weak financial institution (i.e. banks) capacity coupled with onerous requirements on lenders (collaterals, certifications etc.) and complicated contract enforcement systems all contribute to limited finance availability.
Access to land: A major constraint for light manufacturing. Buying and registering property is a long process (up to 68 days), limiting expansion and production (at scale) opportunities for small businesses.
Although there is no clear causal link provided on the effect of increased export production costs and the country’s import-substitution orientation, the overall message remains valid i.e. there are a number of structural and regulatory issues that need to be addressed if the country wants to industrialise and become internationally competitive. They also provide constraints to growth, for small and large firms, for the four sub-sectors that they have identified as potentially competitive within the light manufacturing sector (ranking them as either critical or important) (see Table 22).
Table 22. Constraints in light manufacturing24
Sector Firm Size Input
Industries
Land Finance Business
Skills
Worker
Skills
Trade
Logistics
Textiles Small Critical Important Important Important
Large Important Important Critical Important
Leather Small Critical Important Important Important
Large Critical Important Important Important Important
Wood Small Important Important Critical
Large Important Important Critical Important
Agroprocessing Small Critical Critical Important
Large Critical Critical Important
Dinh and Monga, 2014
UNIDO (2012) provides a number of constraints to developing resource-based industry in the Tanzanian context:
High capital intensity: Require large levels of investment limiting the capacity to expand industries, which may mean attracting FDI, in turn potentially limiting domestic benefits.
Resource curse: Resource rich developing countries may grow at a slower rate. Tanzania’s LNG deposits may create the possibility of large revenue streams but expose the country to resource curse symptoms. These can be minimised through efficient fiscal and governance institutions if Tanzania plans ahead.
Infrastructure bottlenecks: Investment profitability can be hampered by the lack of effective and efficient infrastructure (energy, roads etc.). Large players in resource-based industries could collaborate with the government through PPPs that can provide both private and public benefits.
Limited linkages to the economy: Resource extraction and processing industries may have limited links with the rest of the Tanzanian economy, these links need to be fostered by encouraging local input use and creating local downstream industries that can value-add to locally extracted resources.
24 Blank spaces means that constraint is not a priority within the sector

SUPPORTING THE PREPARATION OF TANZANIA’S SECOND FIVE YEAR DEVELOPMENT PLAN (FYDP II) 2016/17 – 2021/22
79
Technological and human skills gap: Technological adoption and limited human capital are a constraint in Tanzania. Industry specific training systems need to be implemented in order to raise worker skills (and productivity).
Stimulating links between sectoral development and nationwide economic growth also remains an important challenge. The UK Department for International Development (DFID), in its latest Tanzania Inclusive Growth Diagnostic states that links between the mining industry and the wider economy have been minimal, whilst the AfDB (2014) shows that the tourism sector has limited links to the local economy. Part of the issue lies in the fact that skills are limited in the labour force whilst the other component is the issue that products are not sufficiently value added – hence value chains with wider nationwide economic impacts are limited.
In terms of the ‘resource curse’, the International Monetary Fund (IMF) (2014) states that the potential revenues from large scale investments in the gas sector can be substantial for the Tanzanian economy and can have a positive transformational impact, however it cites the need for transparency and the implementation of appropriate policy and regulatory frameworks to manage fiscal revenue streams. Revenues are not projected to increase substantially until the third FYDP.
Figure 39. Biggest constraints in the manufacturing sector, Tanzania, 2013
Source: Enterprise Survey Data, 2013
Surveys also show up important information. Data from the 2013 Tanzanian Enterprise Survey for the manufacturing sector found that the biggest constraint to growth, for all manufacturing firms, was access to finance (an average of 42% of all firms), followed by access to electricity. Access to finance was also the biggest obstacle for furniture producing firms and ‘other manufacturing’ firms. Access to electricity was the largest constraint for food producing firms (i.e. agro-processing) and textiles and garment producing firms. Enterprise survey data further show that smaller firms find access to finance to be the biggest constraint, whereas larger firms are more constrained by access to electricity.
44.037.1
63.839.0
42.0
0.0 10.0 20.0 30.0 40.0 50.0 60.0 70.0
Access to finance
Access to land
Business licensing and permits
Corruption
Courts
Crime, theft and disorder
Customs and trade regulations
Electricity
Inadequately educated workforce
Labor regulations
Political instability
Practices of the informal sector
Tax administration
Tax rates
Transportation
All Firms Average Other Manufacturing Furniture Textiles & Garments Food

SUPPORTING THE PREPARATION OF TANZANIA’S SECOND FIVE YEAR DEVELOPMENT PLAN (FYDP II) 2016/17 – 2021/22
80
Infrastructure development remains one of the greatest challenges that Tanzania faces, acting as a constraint to both the regional and local economy (AfDB, 2014). The 2014-14 World Economic Forum (WEF) Global Competitiveness Report ranks the country’s infrastructure as 130th (out of 144) and the lack of infrastructure is ranked as the 5th most ‘problematic factor’ for doing business.
Table 23. Infrastructure constraints
Infrastructure Constraint Rank (out of 144)
Infrastructure Pillar Score 130th
Quality of Overall Infrastructure 117th
Quality of Roads 112th
Quality of Railroad Infrastructure 88th
Quality of Port Infrastructure 106th
Quality of Air Transport Infrastructure 131st
Quality of Electricity Supply 125th
Mobile Phone Subscriptions/100 Pop. 135th
Fixed Telephone Lines/100 pop. 136th
The Global Competitiveness Index (GCI) rankings show that the most pressing concerns for infrastructure are its transport and energy systems but also highlights the fact that communication technologies have yet to achieve the same ‘reach’ as in other countries. Both these issues aggravate transaction costs –transport bottlenecks, energy paucity and limited communication systems all decrease operational efficiency and increase operating costs, reducing international competitiveness for exports but also limiting the capacity of locally produced goods to compete with imported goods.
In terms of the structure of the country’s private sector, work carried out by Sutton and Olomi (2012) to map Tanzanian enterprises reveals some interesting constraints for a selection of sub sectors within the country (Table 24). The paper does not specify how the sectors were chosen, but contain a number of sectors relevant to the discussion carried out within this paper.
The highlighted constraints show a high degree of commonality i.e. infrastructure (transport and energy), access to finance, onerous import duties for semi-processed goods and cumbersome export standards, low quality and availability of capital and inputs etc.
We have also undertaken consultations with the private sector specifically for this study. This suggested the following constraints. Many constraints were viewed as critical, requiring urgent and robust solutions as pre-requisites for rapid industrialisation, for example:
The current levels of availability, reliability and cost of energy and transport infrastructure cannot support rapid industrialisation
The current private sector is perceived to be largely foreign controlled
Lack of innovation and access to information
Lack of skills
Lack of policy coherence and predictability which is a serious impediments to capital formation and industrialisation
Many uncoordinated policies, legislations, and taxes hinder competitiveness
Land for industrial projects is limited and extremely expensive
Low levels of productivity and fragmentation in agriculture
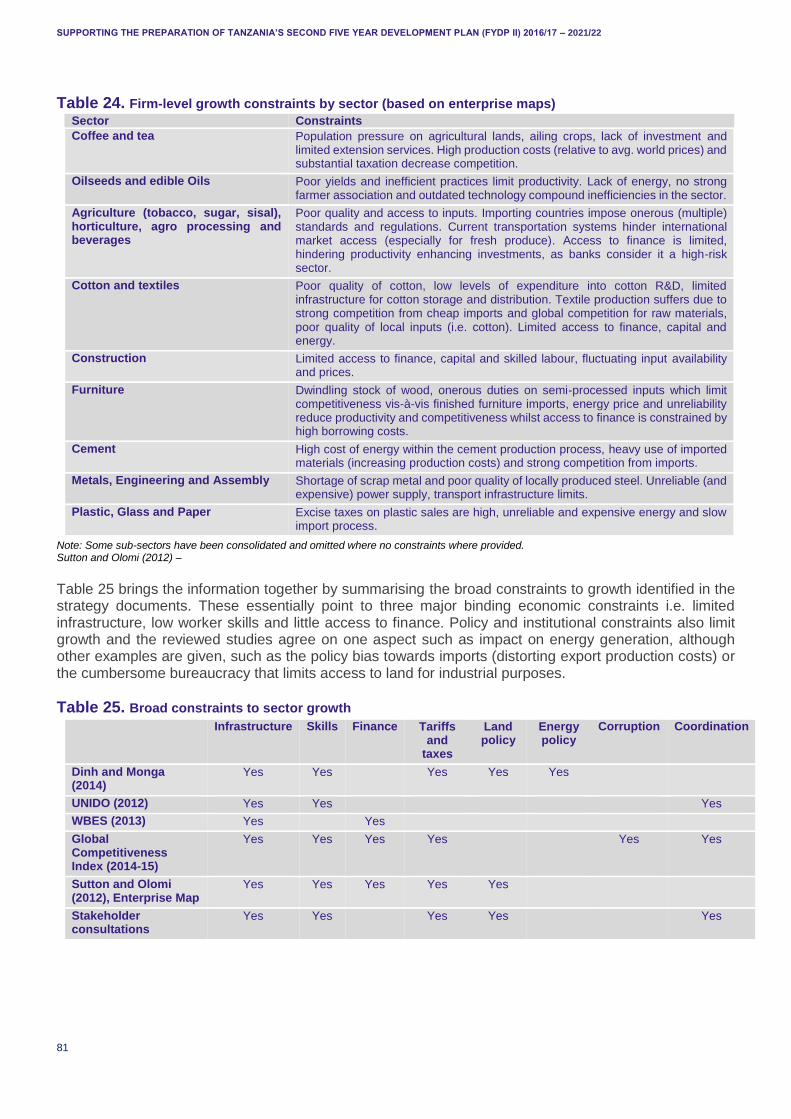
SUPPORTING THE PREPARATION OF TANZANIA’S SECOND FIVE YEAR DEVELOPMENT PLAN (FYDP II) 2016/17 – 2021/22
81
Table 24. Firm-level growth constraints by sector (based on enterprise maps)
Sector Constraints
Coffee and tea Population pressure on agricultural lands, ailing crops, lack of investment and limited extension services. High production costs (relative to avg. world prices) and substantial taxation decrease competition.
Oilseeds and edible Oils Poor yields and inefficient practices limit productivity. Lack of energy, no strong farmer association and outdated technology compound inefficiencies in the sector.
Agriculture (tobacco, sugar, sisal), horticulture, agro processing and beverages
Poor quality and access to inputs. Importing countries impose onerous (multiple) standards and regulations. Current transportation systems hinder international market access (especially for fresh produce). Access to finance is limited, hindering productivity enhancing investments, as banks consider it a high-risk sector.
Cotton and textiles Poor quality of cotton, low levels of expenditure into cotton R&D, limited infrastructure for cotton storage and distribution. Textile production suffers due to strong competition from cheap imports and global competition for raw materials, poor quality of local inputs (i.e. cotton). Limited access to finance, capital and energy.
Construction Limited access to finance, capital and skilled labour, fluctuating input availability and prices.
Furniture Dwindling stock of wood, onerous duties on semi-processed inputs which limit competitiveness vis-à-vis finished furniture imports, energy price and unreliability reduce productivity and competitiveness whilst access to finance is constrained by high borrowing costs.
Cement High cost of energy within the cement production process, heavy use of imported materials (increasing production costs) and strong competition from imports.
Metals, Engineering and Assembly Shortage of scrap metal and poor quality of locally produced steel. Unreliable (and expensive) power supply, transport infrastructure limits.
Plastic, Glass and Paper Excise taxes on plastic sales are high, unreliable and expensive energy and slow import process.
Note: Some sub-sectors have been consolidated and omitted where no constraints where provided. Sutton and Olomi (2012) –
Table 25 brings the information together by summarising the broad constraints to growth identified in the strategy documents. These essentially point to three major binding economic constraints i.e. limited infrastructure, low worker skills and little access to finance. Policy and institutional constraints also limit growth and the reviewed studies agree on one aspect such as impact on energy generation, although other examples are given, such as the policy bias towards imports (distorting export production costs) or the cumbersome bureaucracy that limits access to land for industrial purposes.
Table 25. Broad constraints to sector growth
Infrastructure Skills Finance Tariffs and
taxes
Land policy
Energy policy
Corruption Coordination
Dinh and Monga (2014)
Yes Yes Yes Yes Yes
UNIDO (2012) Yes Yes Yes
WBES (2013) Yes Yes
Global Competitiveness Index (2014-15)
Yes Yes Yes Yes Yes Yes
Sutton and Olomi (2012), Enterprise Map
Yes Yes Yes Yes Yes
Stakeholder consultations
Yes Yes Yes Yes Yes

SUPPORTING THE PREPARATION OF TANZANIA’S SECOND FIVE YEAR DEVELOPMENT PLAN (FYDP II) 2016/17 – 2021/22
82
PART III: IMPLEMENTING THE FYDP II – POLICY SUGGESTIONS, FINANCING OPTIONS, PREPAREDNESS AND WAYS OF WORKING
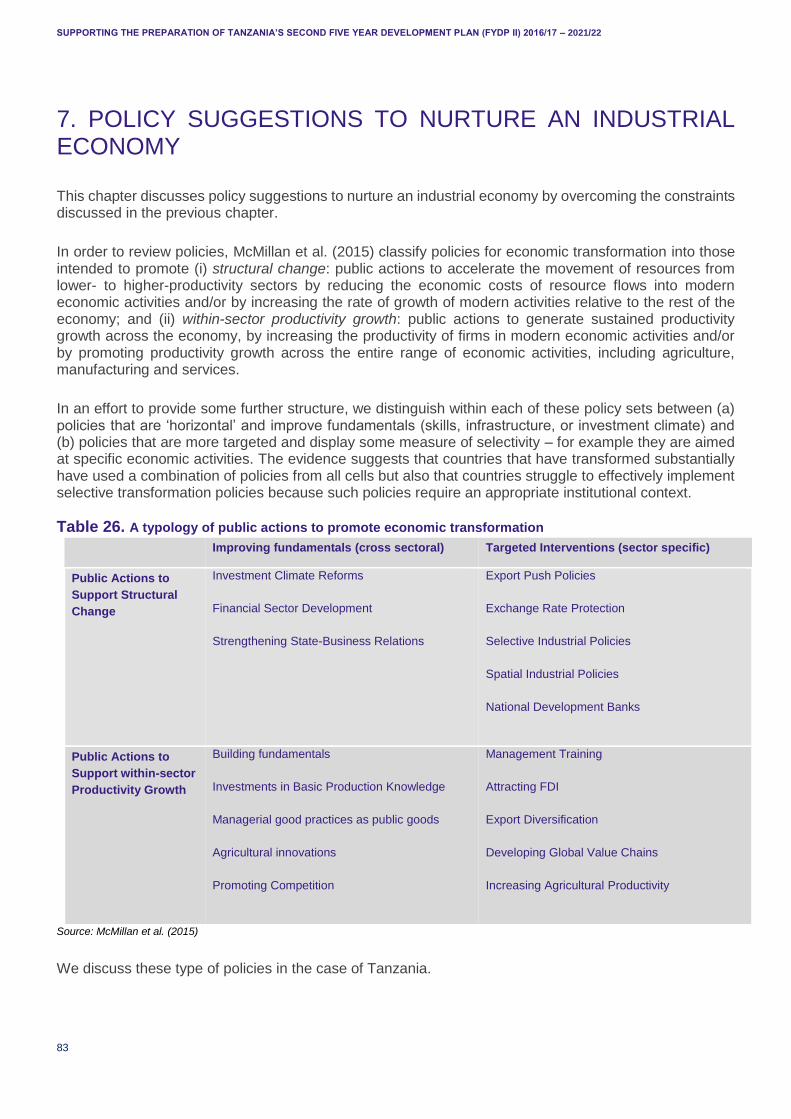
SUPPORTING THE PREPARATION OF TANZANIA’S SECOND FIVE YEAR DEVELOPMENT PLAN (FYDP II) 2016/17 – 2021/22
83
7. POLICY SUGGESTIONS TO NURTURE AN INDUSTRIAL ECONOMY
This chapter discusses policy suggestions to nurture an industrial economy by overcoming the constraints discussed in the previous chapter.
In order to review policies, McMillan et al. (2015) classify policies for economic transformation into those intended to promote (i) structural change: public actions to accelerate the movement of resources from lower- to higher-productivity sectors by reducing the economic costs of resource flows into modern economic activities and/or by increasing the rate of growth of modern activities relative to the rest of the economy; and (ii) within-sector productivity growth: public actions to generate sustained productivity growth across the economy, by increasing the productivity of firms in modern economic activities and/or by promoting productivity growth across the entire range of economic activities, including agriculture, manufacturing and services.
In an effort to provide some further structure, we distinguish within each of these policy sets between (a) policies that are ‘horizontal’ and improve fundamentals (skills, infrastructure, or investment climate) and (b) policies that are more targeted and display some measure of selectivity – for example they are aimed at specific economic activities. The evidence suggests that countries that have transformed substantially have used a combination of policies from all cells but also that countries struggle to effectively implement selective transformation policies because such policies require an appropriate institutional context.
Table 26. A typology of public actions to promote economic transformation
Improving fundamentals (cross sectoral) Targeted Interventions (sector specific)
Public Actions to
Support Structural
Change
Investment Climate Reforms
Financial Sector Development
Strengthening State-Business Relations
Export Push Policies
Exchange Rate Protection
Selective Industrial Policies
Spatial Industrial Policies
National Development Banks
Public Actions to
Support within-sector
Productivity Growth
Building fundamentals
Investments in Basic Production Knowledge
Managerial good practices as public goods
Agricultural innovations
Promoting Competition
Management Training
Attracting FDI
Export Diversification
Developing Global Value Chains
Increasing Agricultural Productivity
Source: McMillan et al. (2015)
We discuss these type of policies in the case of Tanzania.
SUPPORTING THE PREPARATION OF TANZANIA’S SECOND FIVE YEAR DEVELOPMENT PLAN (FYDP II) 2016/17 – 2021/22
84
7.1 CROSS SECTORAL POLICY SUGGESTIONS
The evidence available in Tanzania on cross-sector policy suggestions for ET and industrialisation points to the importance of a co-ordinated policy approach, infrastructure, business climate, science and technology policy, human resource development and finance.
Both the World Bank’s 2011 CAS and the World Bank’ 2014 CEM suggest the importance of infrastructure and the business climate:
Infrastructure unlocks potential: The CAS (World Bank, 2011) pushes for investments in transport, energy and irrigation. Unlocking the country’s potential requires well-designed and implemented PPPs investing in energy, transportations and water.
Take advantage of Tanzania’s strategic location: A key component, in tandem with infrastructure investments, required to enhance Tanzania’s international competitiveness. The strategy hinges on the creation of stronger economic ties to the East Africa and South Eastern Africa regions. Tanzania can act as a trade hub for neighbouring land-locked countries and a port of exit for trade with the Middle East as well as with Southern and Eastern Asia (World Bank, 2014).
Improve the business climate: Slow reforms in Tanzania’s business environment have hindered competitiveness gains. Both small and large enterprises face a number of regulatory and policy induced challenges that need to be addressed in order to help the country catch up with other, more competitive, economies.
The government of Tanzania is strongly pushing for greater international access through its vision of Tanzania as an international ‘gateway’, but in order to fully realise the benefits for the country as a whole it needs to also push for a supportive transportation and trade system within Tanzania. Rural producers need to be able to reach regional hubs in a quick and effective manner – a vital necessity if the agro-processing and leather manufacturing industries are to be developed. Likewise, regional hubs need to have efficient links to international hubs – where speed and effectiveness is paramount if perishable goods are to be exported to international markets.
In terms of the manufacturing sector, the UNIDO (2012) Tanzania ICR has a number of policy recommendations. Apart from the importance of a coherent and co-ordinated policy (such as trade, infrastructure etc.) towards the industrialisation process, with a clear mandate for MIT to coordinate industrial policies across government, it argues for enhanced integration of central government planning at the local or district level. This requires greater awareness at the local government level of what needs to be done to improve industrialisation as well as the creation of incentives to promote industrialisation at the local level.
They further argue that an effective science, innovation and technology policy that sets out technology and skills transfer is an absolute priority. The policy needs to ensure that technology transfer from international to national firms is facilitated and should be supported by the creation of technology centres and science/technology incubators. The industrial skill base also needs to be lifted through increased attention on secondary education, channelling educational resources to vocational and training schools and focusing tertiary education towards the formation of analytically skilled graduates. Such an improvement in capabilities should also extend to increased data collection and reporting for industry as whole, since it is an important monitoring and evaluation (M&E) tool that the government (and other stakeholders) can use to make informed (policy or investment) decisions.
Human resource development is a further key towards industrialisation. The historical experiences of industrialisation indicate that engaging in more complex production activities and technologies require skills development if businesses are to have access to appropriately skilled workforce. It is therefore
SUPPORTING THE PREPARATION OF TANZANIA’S SECOND FIVE YEAR DEVELOPMENT PLAN (FYDP II) 2016/17 – 2021/22
85
important to prepare for a large increase in the quantity, quality and range of nationally available skills in order to manage the process of economic transformation through industrialisation. The new demand for higher-skilled workers will require new resources for investing in improving the education and vocational training systems. Skills requirements for industrialisation in Tanzania have not been quantified. The extent to which the current skill supply in manufacturing matches skill demand from industry is a critical policy question. According to the industrial skills survey which was carried out in 2011 by the Government of Tanzania and UNIDO the perception of company owners/managers is that skills availability and formation was lagging behind requirements. Skill supply and demand are not well coordinated and the need to match future skills needs was not well articulated. The findings suggest rethinking of current education and training policies as a fundamental lever in the broader industrial policy agenda.
Although the Tanzanian industrial sector is dominated by low-tech production some manufacturing firms aspire to move up the innovation capability ladder. These will demand higher level industrial skills which are currently in short supply in Tanzania. In fact companies operating in more complex sectors have expressed demand for more highly qualified human resources which are not available in the labour market. More than half of the workers of an average company are low skilled, nearly one-third is medium-skilled and only 16 percent are high skilled (UNIDO, 2012). These findings indicate a need for the government to address the skills gap to trigger transformation through industrialisation.
The supply of skills currently exhibits two main gaps. First is the gap in industrial skills combining formal and experience-based education. This gap can be addressed by allocating higher level of public resources to vocational schools and training centres and to promoting experience-based skills development in the education system in general. The second gap is in analytically skilled graduates with a problem-solving and proactive attitude. The findings indicate that the complexity and technology content of industrial production matters in influencing skill requirements and skill gaps. For instance, innovation-oriented businesses employ twice as many university graduates, in particular science, technology, engineering and mathematics (STEM) graduates, than businesses that are not innovation-oriented, while medium- and high-tech companies generally employ a larger share of university graduates. The skills gap is generally higher in skills based on STEM subjects and business graduates.
The study National Skill Development to Facilitate Tanzania to Become Strong and Competitive Economy By 2025 aimed to identify the skills gaps and mechanisms for enhancement of skills development in Tanzania to make the transition innovative, participative, and knowledge-based and a strong competitive economy by 2025. The study used desk review and labour market survey to determine expected skills gap the country need to fill in order to have a competitive economy. The study shows in order for the economy to determine and attain the kind of skill and competence it require, skill development initiative must match with anticipated socioeconomic development. The study shows expected demand of labour force needed to attain MIC status is much higher. The comparison of actual enrolment against targeted number of professional in 2012/13 is far apart to each other with a big skill gap among science professional. The situation for medium term (2012 – 2015) and long term (2012 – 2025) will likely be much higher than the base year (2012/13). This implies the transformation path to attain MIC status, on as far as skills development initiatives are concerned needs a total change ranging from a change in policy formulation and its implementation, institutional arrangement to facilitate skill development, funding mechanisms and modalities for skill development and involvement of private sector participation in education and skills development. The sectors of focus specified for the Second Five Year Plan needs special training and interventions to such occupations be given a priority. In the long run, complete reforms and changes are needed to attain skills needed to facilitate the country to become a strong and competition economy.
A skills gap analysis for Tanzania based on requirements for attaining a middle income status indicates that Tanzania needs almost triple the number of technicians and six-fold the number of professionals as a percentage of the working population. This translates to nearly 300,000 engineers, architects and related technicians and up to 90,000 physical scientists and related technicians, 70,000 life scientists and related technicians and nearly 430,000 administrative and managerial professionals (UNIDO, 2012).
SUPPORTING THE PREPARATION OF TANZANIA’S SECOND FIVE YEAR DEVELOPMENT PLAN (FYDP II) 2016/17 – 2021/22
86
Skills development will need to be matched not only with short requirements but also with medium- and long-term industrial skill requirements considering technology foresight. The governments will strive to make it easier for entrepreneurs to harness the regional and global value chains capitalizing on the potentials of beneficiation and value addition. Investing in human skills broadly and specifically in specialized skills for the priority sectors in the regional value chain deserves high priority. Action will be taken to identify and quantify then skill gap and other specialized skills that will be required for structural transformation through industrialisation in priority sectors.
Concerned with the productivity challenge, the MIT has introduced in a Japan International Cooperation Agency (JICA)-supported project the kaizen management system to realise continuous improvement in quality and productivity involving the entire workforce from the top management to middle managers and workers. The challenge is to institutionalize the approach and facilitate its spread nationwide.
7.2 SECTOR SPECIFIC POLICY SUGGESTIONS
At the sectoral level, Dinh and Monga (2013) discuss a number of potential policies that can be used to increase growth and the competitiveness of Tanzanian sub-sectors identified in their analysis:
Textiles and apparel: A sector which is labour intensive and has a long value chain, with exports to the EU and the US elegible for duty free and quota free access (through the EU EBAI25 and the USA AGOA26). The sector is currently small as Tanzania only processes 20% of its cotton production (exporting the rest).
Policy suggestions: The elimination of tariffs on apparel inputs could help exporters resell material waste (a 1% reduction in production costs), encourage investments in technology to reduce dependence on imports and the development of industrial parks (following the Chinese model) to reduce operational constraints.
Leather and leather products: Tanzania has a ‘latent’ CA in the sector, where production prices are marginally competitive with those in China, further competitive gains can be made by removing supply-side constraints. Preferential access to high income countries could provide an impetus to growth.
Policy suggestions: Reduce (and then remove) export taxes to leather products, provision of technical assistance to the sector (through sectoral associations), encourage new investments through FDI (cooperating with local enterprises), forming leather industrial clusters, commercialise the livestock sector (breaking up large government owned ranches) and improve the legal and institutional framework.
Wood and wood products: Labour intensive sector, through which 800,000 people earned a living (2013), with the potential to improve performance across all levels of the value chain leading to reductions in poverty for those working within the sector.
Policy suggestions: Worker skills need to be improved through formal and informal training (i.e. the Kaizen programme), encourage investment (including FDI) and technology upgrades in the sector and the formation of privately owned plantations as well as prepare an integrated development strategy for the sector.
Agroprocessing: The sector presents strong backwards and forwards linkages with the rest of the Tanzanian economy, and agriculture is the main source of income for the majority (80%) of the rural population as well as providing the majority of inputs for agroprocessing activities. There is potential for a large variety in the types of crops that could be grown in the country
25 UNCTAD Definition of the agreement here 26 African Growth and Opportunity Act
SUPPORTING THE PREPARATION OF TANZANIA’S SECOND FIVE YEAR DEVELOPMENT PLAN (FYDP II) 2016/17 – 2021/22
87
(due to climate and strong arable land endowment). There is also high potential to increase productivity given that the majority of farmers are smallholders with limited use of technology and agricultural inputs. The agroprocessing sector contributes 55% (in 2013) of MVA and 65% of manufacturing employment.
Policy suggestions: Facilitating commercial farming (within the SAGCOT initiative) requires significant PPPs in order to build the necessary infrastructure, encourage contract farming (including encouraging better connections between smallholders and agroprocessing firms), speed up agroprocessing cluster formation and encourage the set-up of a packaging industry.
7.3 CONSULTATIONS: SUGGESTED POLICIES
Consultation with the private sector suggested the following policy actions for industrialisation:
Heavy investment in energy and transport infrastructure
Technology transfer and innovation (including access to information)
Integrated skills development and human resource strategy
Policy coherence and predictability
Fiscal and regulatory burden must be addressed
Modernisation of agriculture ISI is still very relevant in the context of Tanzania economy, especially related to major commodities, such as sugar, rice, cereals, edible oil, basic metal and steel products, and textiles.
The provision of state capital may still be necessary, as the real industrial projects financing is still very thin, relying mainly on commercial banks.
There must be deliberate efforts to develop indigenous private sector as a necessary step pro-poor industrialisation path and include social economic transformation.
The role of the state, in addition to financing key industries must include active planning, coordination and public investments for industrial development (active industrial policy)
7.4 CONCLUSIONS
Reports and consultations have highlighted a number of priority areas for policy, including the following:
Focus on industrialisation to foster economic transformation.
Implement seriously a number of PPPs for investment in energy, transportations and water. Promote large transport corridors (starting with the port) whilst also supporting SMEs along the corridor. There needs to be a sufficient scale (e.g. energy) to industrialise the economy. The road infrastructure is of poor quality.
A renewed emphasis on kick-starting reforms in Tanzania’s business environment, e.g. in tax, but also other areas.
Continue targeting industrial parks and clusters – existing SEZ sectors include textiles, leather, building materials, plastic cards, equipment, electronics assembly, cashew, confectionary, coffee.
Improve trade policy, e.g. reducing tariffs and export taxes and also streamlining customs procedures (a weak point in Tanzania compared to other countries). It is better to support promising sectors through positive action (appropriate skills, infrastructure, and business climate) rather than erecting protective walls. Substituting imports in this way will be more sustainable
Education and skills. Training e.g. for wood products, but also a more elaborate skills strategy to bring Tanzania up to a level needed to support industrialisation.
Promote an open technology policy.
Build linkages between sectors (e.g. tourism, gas) and the rest of the economy
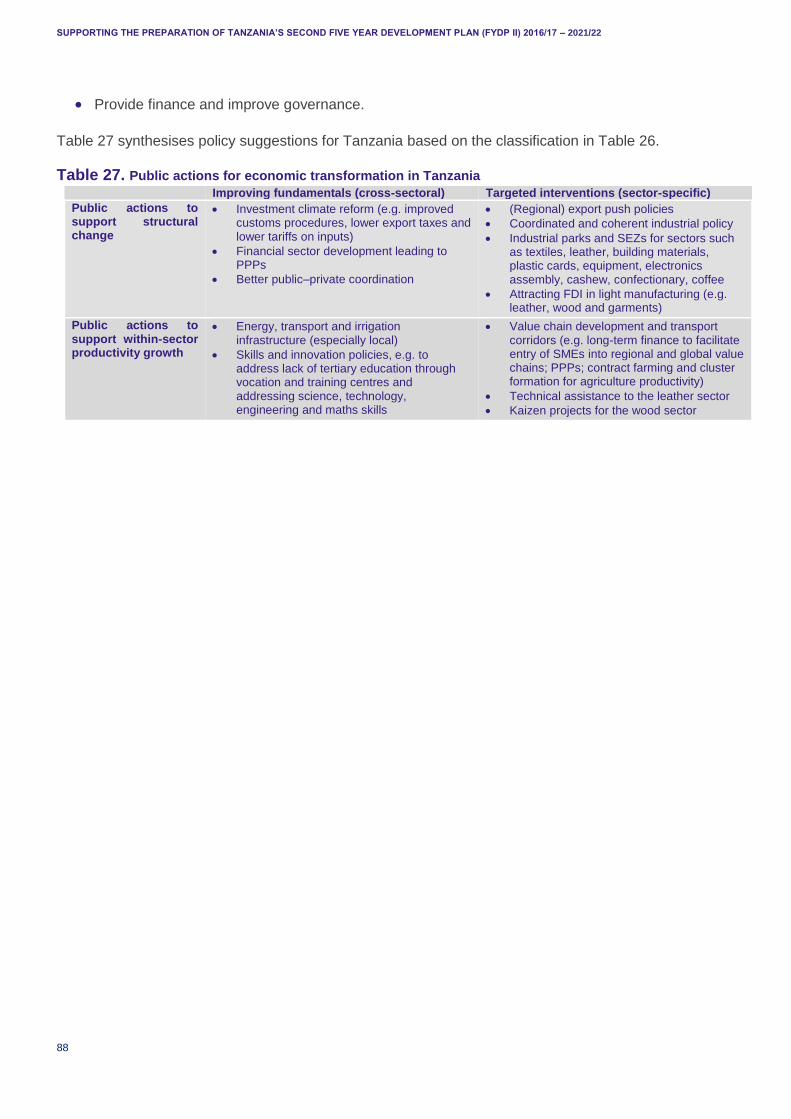
SUPPORTING THE PREPARATION OF TANZANIA’S SECOND FIVE YEAR DEVELOPMENT PLAN (FYDP II) 2016/17 – 2021/22
88
Provide finance and improve governance.
Table 27 synthesises policy suggestions for Tanzania based on the classification in Table 26.
Table 27. Public actions for economic transformation in Tanzania
Improving fundamentals (cross-sectoral) Targeted interventions (sector-specific)
Public actions to support structural change
Investment climate reform (e.g. improved customs procedures, lower export taxes and lower tariffs on inputs)
Financial sector development leading to PPPs
Better public–private coordination
(Regional) export push policies
Coordinated and coherent industrial policy
Industrial parks and SEZs for sectors such as textiles, leather, building materials, plastic cards, equipment, electronics assembly, cashew, confectionary, coffee
Attracting FDI in light manufacturing (e.g. leather, wood and garments)
Public actions to support within-sector productivity growth
Energy, transport and irrigation infrastructure (especially local)
Skills and innovation policies, e.g. to address lack of tertiary education through vocation and training centres and addressing science, technology, engineering and maths skills
Value chain development and transport corridors (e.g. long-term finance to facilitate entry of SMEs into regional and global value chains; PPPs; contract farming and cluster formation for agriculture productivity)
Technical assistance to the leather sector
Kaizen projects for the wood sector
SUPPORTING THE PREPARATION OF TANZANIA’S SECOND FIVE YEAR DEVELOPMENT PLAN (FYDP II) 2016/17 – 2021/22
89
8. MOBILISING AND USING FINANCE EFFECTIVELY FOR FYDP II
The implementation of the policy suggestions delineated in the previous chapter will require the mobilisation of substantial financial resources from both domestic and international sources. It will also require policies that ensure that these financial resources are used effectively to achieve the goals set out in FYDP II. In the first part of this chapter, we contextualise the discussion on mobilising finance by summarising recent trends in the flows of different sources of finance in Tanzania (see Appendix I for a detailed analysis of recent trends in financial flows). We then present the central tenets of a general finance and policy framework to mobilise finance and use it effectively in Tanzania in the context of FYDP II (a more detailed discussion of the framework is presented in Appendix I). In the final part of the chapter, we adopt a more focused approach that places the discussion on resource mobilisation within the context of the theme of nurturing industrialisation for economic transformation and human development.
This aim of this chapter is to provide a general framing of the key financing issues to consider in Tanzania in the context of the FYDP II. A number of potential political economy issues are relevant to the issue of financial resource mobilisation, especially with respect to the design and implementation of policies to boost revenue mobilisation from domestic and foreign sources, and these issues are dealt with in Chapter 9. Chapter 10 then discusses issues around prioritisation and sequencing of recommendations for the FYDP II (including those related to financial resource mobilisation).
8.1 RECENT TRENDS IN FINANCE FLOWS IN TANZANIA
Appendix I considers trends in four different categories of financial flows (domestic public finance, international public finance, domestic private finance and international private finance) over the period from 1980 to 2013. We focus primarily on national trends, rather than sub-national or sectoral trends, when looking at these various types of flows. The sources of finance in each of these four categories, together with notable trends in the various types of financial flows for the period in question, are summarised in Table 28.
Table 28. Categories of financial flows and notable trends and issues related to specific sources
Category Sources Notable trends and issues in Tanzania
Domestic public finance
Tax and other public revenues, Domestic debt
Tanzania’s tax-revenue-to GDP ratio is around 12%. This is relatively low compared to most other countries in the EAC grouping.
The level of domestic public debt has remained stable since 2004/05, amounting to 12% of GDP in 2012/13. But the level of public debt is notably higher (as a % of GDP) compared to the EAC average and the median levels across SSA and LICs.
International public finance
ODA, Other Official Flows (OOF) and SSC
Total net ODA has risen sharply in absolute terms since 1980.
However, as a share of GNI, net ODA has followed a downward trend since the early 1990s.
There has been a general upward trend in gross OOF since 2010.
Domestic private finance
Gross fixed capital formation (excluding FDI) by private sector, private credit provided by domestic banks, market capitalisation
There has been a substantial increase in the value of GFCF by the private sector since 2000. This has also increased when measured as a share of GDP.
GFCF undertaken by the private sector was equivalent to 18.1% of total GDP in 2013.
Domestic bank credit provided to the private sector has grown steadily relative to GDP, reaching 13.8% in 2014. However, this is still well below the average for SSA countries.
Stock market capitalisation by listed companies in Tanzania is substantially lower than the SSA average when measured as a percentage of GDP.
SUPPORTING THE PREPARATION OF TANZANIA’S SECOND FIVE YEAR DEVELOPMENT PLAN (FYDP II) 2016/17 – 2021/22
90
International private finance
International, private transfers (private development assistance (PDA), remittances), FDI and other international private capital flows (bank lending and equity and bond portfolio flows)
The value of personal remittances received has increased considerably since the mid-1990s, and particularly after 2007. Even so, the ratio of remittances to GDP has remained relatively stable.
Net inflows of FDI have increased as a share of GDP by more than 4 percentage points since 1998, reaching 4.2% of GDP in 2013.
Portfolio and private lending flows into Tanzania remain comparatively limited, particularly when measured against similar comparator countries.
Source: Categorisation of flows and sources of finance from ODI et al. (2015)
Figure 40 provides a broad overview of trends in Tanzania in different types of financial flows within each of the four categories by comparing flows of tax revenue (domestic public finance), net ODA (international public finance), GFCF (domestic private finance) and FDI (international private finance) for the period from 2000 to 2013. This clearly illustrates the declining influence of international sources of finance relative to domestic sources in Tanzania. While aid flows (net ODA) have declined as a proportion of GNI (aid flows have not kept pace with steady economic growth, especially since the onset of the global economic crisis and the ensuing fiscal constraints in donor countries, but also as a result of a fall in general budget support from donors),27 and FDI flows have been relatively stagnant (when measured as a percentage of GDP), GFCF by the private sector has increased sharply as a share of GDP, and there has been some growth in tax revenues (as a percentage of GDP) over the period.
It is important to note that alternative sources report lower tax revenue-to-GDP figures for the period since 2009. For example, WDI data, which is only available for the period from 2009-2012 reports Tanzania’s tax revenue as a percentage of GDP as 11.7% in 2009, 12.1% in 2010, 12.3% in 2011 and 11.7% in 2012. In its Third Review of the Policy Support Instrument (PSI) (published in January 2016), the IMF reports that tax revenue as a share of GDP was 12.4% in the 2013/14 fiscal year. Also, more recent data indicate that Tanzania’s tax revenue-to-GDP ratio is currently considerably lower than the 2013 figures reported in the IMF World Revenue Longitudinal Data, at around 12% of GDP (Government of Tanzania, 2015; World Bank, 2015a). The discrepancies between the tax-revenue-to-GDP data presented in Figure 38 (from the IMF World Revenue Longitudinal Data) and the lower ratios in the WDI, Government of Tanzania and World Bank data are primarily due to the rebasing of GDP data for Tanzania.28 Even so, the differences in the figures do not affect the overall conclusions regarding the broad trends in domestic and international sources of finance in Tanzania since 2000.
The broad trends in Figure 40, together with our detailed analysis of the flows of various sources of finance within the four overarching categories (see Appendix I) over the past two decades, provides a number of telling insights, particularly with respect to structural changes in the relative influence of different sources of domestic public, international public, domestic private and international private finance. For instance, despite gradual growth in domestic revenue collections through taxation, Tanzania’s tax-revenue-to-GDP ratio remains relatively low – at around 12% - compared to most of its regional counterparts in the EAC (especially Kenya and Rwanda). Tanzania has historically relied on aid from donors to make up for deficiencies in domestic revenue collection and finance shortfalls in the budget. In recent years, however, there has been a steady decline in general budget support from donors (discussed further below).
Moreover, while ODA flows to Tanzania have increased in absolute terms, they are declining as a share of GNI. This points to the declining influence of donor aid as an instrument for revenue mobilisation in Tanzania. Indeed, aid figures from the OECD development assistance committee show that aid flows to Tanzania fell by 19% in 2014 (Lovett, 2016). While overall aid flows are increasing in absolute terms, LDCs are receiving a smaller share, with aid to these countries falling by close to USD 2 billion in 2014 (ibid.). The impact of these general cuts at the global level have been compounded by a lack of trust between the international donor community and the Government of Tanzania, which has been a key cause of the
27 To some extent, the trend of declining aid flows relative to GNI also reflects measurement problems, since increasing aid from non OECD DAC countries is not comprehensively recorded in these statistics, especially in relation to aid flows from China. 28 We use the IMF World Revenue Longitudinal Data in Figure 38 as it available for the full 2000-2013 period. The WDI, Government of Tanzania and World Bank is only reported for a small subset of these years.
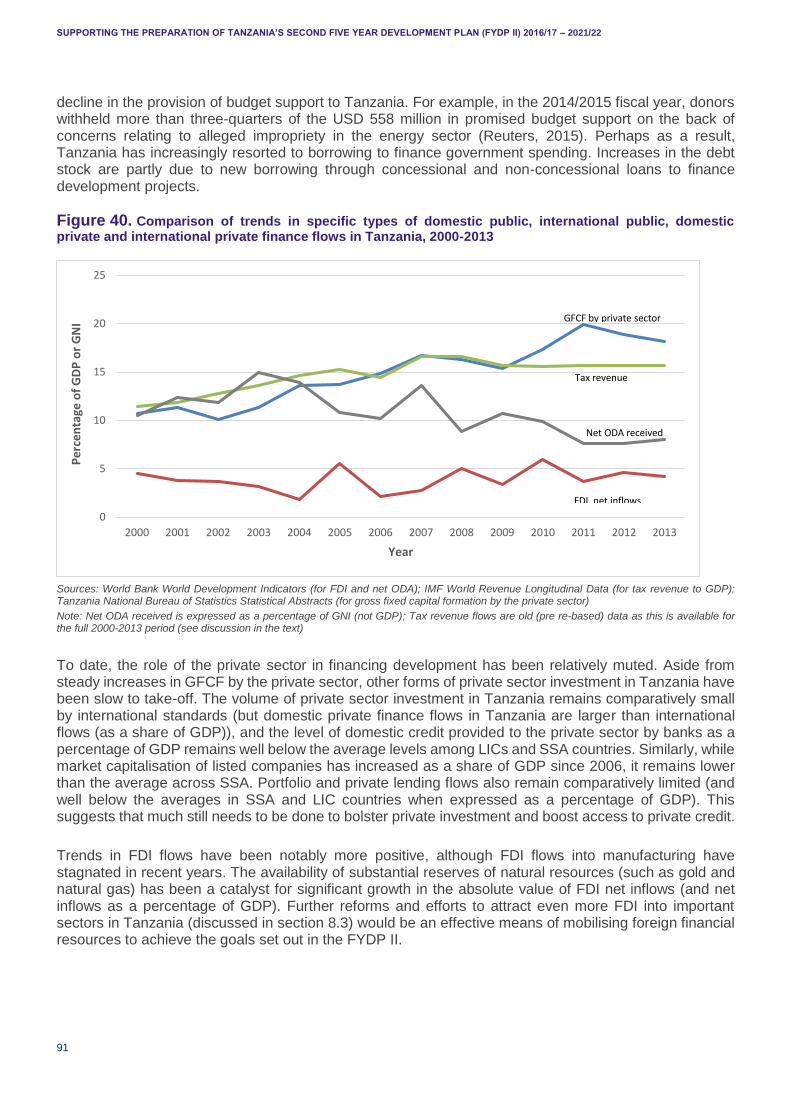
SUPPORTING THE PREPARATION OF TANZANIA’S SECOND FIVE YEAR DEVELOPMENT PLAN (FYDP II) 2016/17 – 2021/22
91
decline in the provision of budget support to Tanzania. For example, in the 2014/2015 fiscal year, donors withheld more than three-quarters of the USD 558 million in promised budget support on the back of concerns relating to alleged impropriety in the energy sector (Reuters, 2015). Perhaps as a result, Tanzania has increasingly resorted to borrowing to finance government spending. Increases in the debt stock are partly due to new borrowing through concessional and non-concessional loans to finance development projects.
Figure 40. Comparison of trends in specific types of domestic public, international public, domestic private and international private finance flows in Tanzania, 2000-2013
Sources: World Bank World Development Indicators (for FDI and net ODA); IMF World Revenue Longitudinal Data (for tax revenue to GDP); Tanzania National Bureau of Statistics Statistical Abstracts (for gross fixed capital formation by the private sector)
Note: Net ODA received is expressed as a percentage of GNI (not GDP); Tax revenue flows are old (pre re-based) data as this is available for the full 2000-2013 period (see discussion in the text)
To date, the role of the private sector in financing development has been relatively muted. Aside from steady increases in GFCF by the private sector, other forms of private sector investment in Tanzania have been slow to take-off. The volume of private sector investment in Tanzania remains comparatively small by international standards (but domestic private finance flows in Tanzania are larger than international flows (as a share of GDP)), and the level of domestic credit provided to the private sector by banks as a percentage of GDP remains well below the average levels among LICs and SSA countries. Similarly, while market capitalisation of listed companies has increased as a share of GDP since 2006, it remains lower than the average across SSA. Portfolio and private lending flows also remain comparatively limited (and well below the averages in SSA and LIC countries when expressed as a percentage of GDP). This suggests that much still needs to be done to bolster private investment and boost access to private credit.
Trends in FDI flows have been notably more positive, although FDI flows into manufacturing have stagnated in recent years. The availability of substantial reserves of natural resources (such as gold and natural gas) has been a catalyst for significant growth in the absolute value of FDI net inflows (and net inflows as a percentage of GDP). Further reforms and efforts to attract even more FDI into important sectors in Tanzania (discussed in section 8.3) would be an effective means of mobilising foreign financial resources to achieve the goals set out in the FYDP II.
0
5
10
15
20
25
2000 2001 2002 2003 2004 2005 2006 2007 2008 2009 2010 2011 2012 2013
Pe
rce
nta
ge o
f G
DP
or
GN
I
Year
GFCF by private sector
Tax revenue
Net ODA received
FDI, net inflows
SUPPORTING THE PREPARATION OF TANZANIA’S SECOND FIVE YEAR DEVELOPMENT PLAN (FYDP II) 2016/17 – 2021/22
92
8.2 A GENERAL FINANCE AND POLICY FRAMEWORK TO MOBILISE FINANCE AND USE IT EFFECTIVELY IN TANZANIA
The analysis above highlights the increasing importance of domestic sources of finance (both public and private) in Tanzania. The government has already launched, or has announced plans to launch, a number of reforms aimed at boosting domestic resource mobilisation (further details on recent plans are provided in Appendix I), and the new government has been energetic in its efforts to boost domestic revenue collections and eliminate non-essential expenditure since taking office following the elections in October 2015.
Despite the recent success of these efforts, which illustrates the potential of focused efforts to mobilise domestic revenues, several factors continue to affect the mobilisation of financial resources in Tanzania. Key challenges include a range of weaknesses in the tax system; an expanding financing gap, reflected in the persistence of both fiscal and balance-of-payment deficits; an over-reliance on foreign aid in an environment of declining aid flows globally; limited access to finance and investment in key sectors; and uncertainty over future revenues. These challenges are outlined in detail in Appendix I.
Given these challenges, and Tanzania’s financing needs to achieve the Sustainable Development Goals and the targets set out in the FYDP II, there are a range of potential policies that could be employed in Tanzania to boost the mobilisation of financial resources. We focus here on policies relevant to the four categories of sources of finance introduced above (domestic public finance, international public finance, domestic private finance and international private finance), and also consider how to ensure that these resources are used effectively in Tanzania in the context of FYDP II. The policies are outlined in detail in Appendix I, and summarised below in Table 29.
Table 29. General policies to mobilise finance and use it effectively, by category of financial flows
Category Policies to mobilise finance Policies to use finance effectively
Domestic public finance
Reforms to the tax system
Build on new initiatives introduced since elections in October 2015 – including efforts to improve TRA relations with taxpayers, close loopholes leading to revenue leakages, legally enforce requirements for businesses to pay unpaid tax charges (e.g. taxes due for unpaid container charges) and improved monitoring – to boost tax compliance
Minimise the application of tax exemptions, building on existing reforms under the VAT Act of 2014, and following through on government plans to reduce the value of tax exemptions to 1% of GDP from the current level of around 1.5%
Broaden the geographic distribution of the tax base and diversify sectoral contributions through, for example, strengthening the taxation of property
More effective taxation of informal sector by effectively identifying taxpayers (complete integration of national ID system with the TRA’s Tax Identification Numbers; enlist the help of ward, Mtaa and village executives to identify and register businesses)
Develop mobile money payment options to effectively facilitate electronic payment of taxes
Sovereign bonds
Carefully consider the fiscal risks (implementation, debt sustainability, roll-over,
Enhance public financial management systems to achieve more realistic revenue projections and budgets
Implement guidelines to prevent accumulation of arrears
Develop a plan to gradually reduce the existing debt stock
Reduce the use of expenditure floats at fiscal year end
More timely compilation of fiscal outturn data
Improve the distribution and allocation of revenues between the central government and LGAs
Ensure greater transparency and equity in the allocation of domestic revenues from the central government to LGAs based on objective measures of relative need
Address systemic weaknesses in public financial management at the local government level to reduce the fiduciary risks associated with allocations of public funds to LGAs
Potential role for Tanzania’s DFIs together with regional and international development banks to mobilise investment and plug financing gaps
DFIs such as TIB Development Bank, the NDC and regional and international development banks could play a role in designing and structuring development
SUPPORTING THE PREPARATION OF TANZANIA’S SECOND FIVE YEAR DEVELOPMENT PLAN (FYDP II) 2016/17 – 2021/22
93
Category Policies to mobilise finance Policies to use finance effectively
exchange rate and macroeconomic risks) associated with a sovereign bond issue
projects associated with FYDP II, and linking these projects to funding opportunities (e.g. arranging and leveraging funds for investment; developing bankable projects; managing project funding and implementation)
International public finance
Broaden the donor base
Focus on South-South cooperation to expand relations with large southern donors (e.g. China, India, Brazil, Saudi Arabia, Turkey, South Africa); maximise grants from existing donors
Tie development objectives to climate change targets
Tap into new sources of climate-related funding
Improve donor consultation and coordination
Ensure more inclusive consultation with donors to explain FYDP II objectives and plans and suggest ways in which donors can support these plans
Facilitate greater coordination between donors
More strategic use of aid allocations
Channel aid allocations to support public financial management through structural and personnel reforms
Allocate a large share of ODA to assist the TRA to fund recruitment to address skills and capacity shortfalls
More efficient distribution of aid resources
Raise the speed of disbursement of donor funds
Ensure a smooth flow of donor resources through the various levels of government (especially to reach decentralised units)
Domestic private finance
Expanded role for the private sector through PPPs
Greater private sector involvement in development-focused investments (e.g. transport and energy infrastructure investments) to transfer some government spending responsibilities to the private sector
Articulate more specific PPP policies and market them effectively to potential investors
Improve the quality of the business climate (combat corruption, clear government policy stance on macroeconomic management, consistency in policy messages) to attract more private investment
Improve financial intermediation to bolster access to private credit
Support the development of Tanzania’s capital market
Step up the removal of obstacles to lending
Support greater competition in the banking system
Targeted sectoral approach to loosening constraints in accessing credit (e.g. in agriculture)
Technical assistance to government and the private sector in the preparation of bankable PPP projects
Develop local financial markets
Further develop the market for government securities
Develop a liquid and well-functioning local currency bond market to boost the supply of alternative sources of financing and improve the allocation of capital
Encourage local governments and government agencies to utilise the stock market to mobilise finance, particularly for infrastructure development projects
Work with regulators and other key stakeholders to improve the product offerings of commercial banks
Stimulate effective competition in the commercial banking sector in order to incentivise banks to innovate
International private finance
Improve the quality of the business climate
Explore options for additional non-concessional borrowing and borrowing on commercial terms (obtain a credit rating)
Review policies for foreign participation in domestic bond markets
In addition to the general policies to mobilise finance outlined above, consideration could also be given to various innovative sources of financing development in Tanzania. Innovative finance can provide an alternative route for raising significant additional resources for development in a manner that is both stable
SUPPORTING THE PREPARATION OF TANZANIA’S SECOND FIVE YEAR DEVELOPMENT PLAN (FYDP II) 2016/17 – 2021/22
94
and predictable. In general, this may include innovative domestic public finance mechanisms such as diaspora bonds or GDP-linked bonds; innovative international public finance mechanisms such as solidarity levies on airline taxes or tobacco, carbon tax, or financial and currency transactions taxes; other resources involving international financial institutions (for example, leveraging the idle special drawing rights holdings of resource rich countries); bonds and debt-based instruments, including sustainable impact investing bonds, social impact investing, or debt conversions; innovative international private mechanisms such as crowd funding or solidarity contributions; and innovative public-private mechanisms (e.g. advance market commitments, front loaded securitised aid, loan guarantees and other risk mitigation tools).29 Importantly, however, it remains unclear how effective innovative financing can be in addressing financing gaps for sustainable development in developing countries (ODI et al., 2015). In addition, in some settings the implementation of innovative financing proposals can be met with strong resistance, both politically and in the form of other obstacles. Careful consideration of these issues would be necessary before specific innovative financing instruments could be considered as viable options for financing development in Tanzania.
8.3 FINANCE FOR DEVELOPING LIGHT MANUFACTURING
We discuss in this section ways to mobilise finance and use it effectively in the context of the specific case of economic transformation and value chain development in light manufacturing in Tanzania (this is one of the priority sectors and consistent with the focus on nurturing an industrial economy for economic transformation and human development). This is focused on financial resource mobilisation policies in three specific areas: through the tax system (section 8.3.1), through FDI and private capital flows (section 8.3.2), and via revenues from the natural gas sector (section 8.3.3).
Financing is a critical element of value chain development in light manufacturing in Tanzania. Indeed, as USAID (2008) stress in a more general context, finance represents the ‘lifeblood’ of the value chain. In Tanzania, limited access to finance remains an important constraint across light manufacturing sectors,30 and is particularly acute for SMEs and firms operating in the textiles and apparel, leather and leather products, wood and wood products and agri-processing sectors (Dinh and Monga, 2013). Financial resources are also required to address the range of binding constraints that hinder the development of light manufacturing in Tanzania (ibid.). These include low skill levels (particularly related to managerial and organisational skills), limited technology and industrial capabilities, and infrastructure shortages.
8.3.1 DESIGNING A TAX SYSTEM THAT IS CONDUCIVE TO INDUSTRIALISATION
In the context of light manufacturing in Tanzania, and indeed more generally, the issue of balance is important when considering reforms to the tax system. On the one hand, the tax system needs to be sufficiently robust so as to generate the revenues required to sustain the level of public expenditure required to provide the public services and infrastructure necessary to support the development of light manufacturing capabilities. At the same time, the country’s tax regime needs to be conducive to attracting the level of domestic and foreign investment required to grow and sustain the light manufacturing sector (IMF et al., 2011). As Mjema (2014) explains, the challenge is to find the ‘optimal’ tax position along this spectrum.
In this sub-section we consider both aspects, highlighting possible reforms to the tax system that are designed to boost the mobilisation of domestic resources with a view to financing the provision of public goods such as skills and infrastructure that are necessary ingredients in the industrialisation process. Thereafter, we discuss the importance of ensuring that the tax system in Tanzania is conducive to industrialisation (rather than constraining it) and provides the necessary incentives to attract local and foreign investment into productive industrial activity.
29 See Table 3.5 in ODI et al. (2015) for a description of these various innovative financing for development mechanisms. 30 These firms face a range of constraints in accessing finance, including information asymmetries, issues around collateral and the use of land as collateral, and concerns related to corruption in the court system
SUPPORTING THE PREPARATION OF TANZANIA’S SECOND FIVE YEAR DEVELOPMENT PLAN (FYDP II) 2016/17 – 2021/22
95
Tax reforms to boost domestic resource mobilisation and provide public goods necessary for industrialisation
The mobilisation of domestic financial resources is critically important to generate the funds necessary to finance the provision of public goods that support the development of light manufacturing capabilities in Tanzania and industrialisation more generally. Tax collections invariably represent a core component of the domestic resource mobilisation effort. Although good progress has already been made in improving the tax system in Tanzania, evident in substantial increases in revenue collections, particularly since the TRA’s inception (Fjeldstad and Heggstad, 2011),31 and more recently with the approach to taxation adopted by the new President since late 2015, tax collections in Tanzania are still relatively low. This is evident in the low tax revenue-to-GDP ratio in Tanzania compared to regional neighbours in the EAC (see Appendix I).
Several factors continue to affect efforts to boost tax revenues in Tanzania. These include a very narrow tax base, which is also highly concentrated both sectorally and geographically; the loss of substantial revenues through the provision of tax exemptions (equivalent to around 1.5% of GDP; although this issue has been addressed, to some extent, through the passing of a new VAT Act in 2014 which contains notable reductions in VAT exemptions) and incentives as well as a result of tax evasion, low levels of tax compliance and capital flight; a lack of systems and mechanisms to identify and reach taxpayers, made worse by the large number of potential taxpayers operating in the informal economy; 32 a range of challenges affecting the collection of taxes at the subnational level; capacity constraints within the TRA; and an overreliance on international trade taxes and indirect taxes relative to direct domestic taxes. These, and other, challenges to domestic resource mobilisation are discussed in detail in Appendix I.
The previous section summarised a range of general reforms that should be considered to address these challenges and mobilise additional domestic tax revenue (see Appendix I for further details). These reforms are designed to improve the efficiency and effectiveness of the tax system in Tanzania. This is critically important if the Government of Tanzania is to mobilise a sufficient level of domestic funds from which to finance the provision of the public goods necessary to support industrialisation. Even so, this represents just one component of what is required. The second element is to ensure that the additional resources mobilised through these reforms are used effectively to support economic transformation and the development of value chains in light manufacturing. In this regard, an effective general approach is to direct financial resources towards eliminating binding constraints that currently hamper the growth and development of light manufacturing in Tanzania. This is likely to require public investments to improve the functioning of markets, enhance infrastructure (particularly through improvements to the energy supply that eliminate the current problem of chronic electricity shortages) and address skills deficiencies within the workforce. The latter could include investment in quality training opportunities – particularly in areas such as management skills – that more effectively train Tanzanian workers so that they are equipped with the skills demanded by firms in light manufacturing industries. Upgrading the level of skills within the Tanzanian workforce is central to boosting the competitiveness of the Tanzanian manufacturing sector.
Another approach would be to use a portion of the additional domestic resources mobilised through the tax reforms to support activities in light manufacturing more directly. For instance, funds could be used to lower import barriers and improve infrastructure that enables firms to import intermediate inputs more efficiently and at lower cost. The analysis in Chapter 6 revealed that the competitiveness of several manufacturing industries in Tanzania is undermined by a lack of access to inputs, high duties on imported inputs and reliance on poor quality local inputs. In the leather industry, for example, high input costs (with the cost of importing leather especially high) represent a major constraint; as are high input prices in the wood and wood products sectors (Dinh and Monga, 2013). In a world of increasingly fragmented and complex trade and production patterns, the capacity to efficiently source cheaper, more differentiated and better quality intermediate inputs is a crucial driver of export competitiveness (OECD, 2013). Indeed, as
31 According to Fjeldstad and Heggstad (2011), in the first 12 years following the introduction of the TRA, revenue collection increased by 555.6% when measured in nominal US dollars. 32 Data from the 2014 ILFS indicates that the informal sector accounts for the second largest employment share (21.7% of total employment in Tanzania after the agriculture sector (66.3%)). Estimates from 2012, suggest that simply formalising small informal retail enterprises and informal tourism operations in Tanzania could bring in an additional TSh 86 billion in tax revenue (TradeMark Southern Africa, 2012).
SUPPORTING THE PREPARATION OF TANZANIA’S SECOND FIVE YEAR DEVELOPMENT PLAN (FYDP II) 2016/17 – 2021/22
96
the OECD (2013: 25) argues: “In GVCs, success in international markets depends as much on the capacity to import inputs efficiently as on the capacity to export.” In this context, lower import barriers and support that enable Tanzanian manufacturing firms to source inputs from more efficient or specialised producers either domestically or internationally can generate important cost advantages within the value chain. Support for importing intermediate inputs through efficient infrastructure could also generate important productivity gains in Tanzanian manufacturing firms since these inputs typically embody more productive technology and may facilitate better access to foreign knowledge (ibid.).
Designing a tax system that incentivises industrialisation
Tanzania should not focus exclusively on maximising revenues, but also be cognisant of the importance of designing a tax system that does not discourage investors and producers from financing and engaging in productive industrial activity within the country. The danger of adopting an exclusively pro-revenue approach to taxation is that reforms to the tax system may adversely affect production patterns in the economy, thereby acting as a constraint to industrialisation (DiJohn, 2010).
The nature and characteristics of the tax system play an important role in influencing the decision-making of both local and foreign investors. For example, in many different settings, including Tanzania, tax incentives are used as a tool to attract investment (either local or FDI) into specific industries or sectors. Several arguments have been advanced in favour of tax incentives in Tanzania. For instance, it has been argued that a lower tax burden can offset the adverse effects of the country’s otherwise relatively poor investment climate, thereby attracting FDI (and concomitant income and technology transfers) by providing investors with a higher net rate of return (TEC et al., 2012). More generally, Mjema and Shemoi (2013) contend that tax incentives are justified when they are put in place to address specific market failures, especially in the case of market failures that involve externalities.
At the same time, however, there is a large literature arguing that tax incentives may not be necessary to attract investment. Some argue that lower tax rates or tax incentives are likely to be ineffective in attracting investment in settings where the investment climate is otherwise poor (Van Parys and James, 2010; IMF, 2011). There are also a range of potential disadvantages associated with tax incentives. They reduce current and future government tax revenue, a particularly pertinent concern given the challenges that Tanzania currently faces with respect to domestic resource mobilisation; they require large administrative resources; they create differences in effective tax rates and, thus, distort the allocation of investment between subsidised and unsubsidised activities; they may encourage rent-seeking and corruption; they may increase the available loopholes for tax evasion; they may attract footloose firms rather than long-term investment; and they can be provided in a non-transparent way (Zee et al., 2002; IMF, 2006; Tax Justice Network-Africa and ActionAid International., 2012; TEC et al., 2012).
These competing views highlight the importance of putting in place a programme of tax incentives that works as intended, and which is aimed at achieving development objectives that are followed up in the future. A fresh review of tax incentives (and other exemptions) should be undertaken in Tanzania with a view to designing a programme of incentives that is geared towards the objective of nurturing an industrial economy for economic transformation and human development, and which supports investment and productive activity in light manufacturing activities in particular. Much can be learned from the experiences in Ireland and Singapore, where favourable tax environments have played a central role in attracting FDI and encouraging companies to establish regional headquarters in these countries (te Velde, 2003). Both countries have benefited from efficient corporate tax systems, marked by low corporate tax rates and attractive transfer pricing arrangements for multinationals. In Ireland, the corporate tax rate is just 12.5%. For its part, Singapore has offered tax incentives to companies operating in specific targeted sectors that are regarded as important for national economic development objectives. As a general rule, companies eligible to benefit from tax incentives in Singapore are expected to carry out high value activities and commit to specified levels of spending on local businesses and skilled employment (PWC, 2015b). For example, Singapore’s pioneer tax incentive entitles corporations that manufacture approved products with high technology content to a tax exemption for between five and 15 years (ibid.). In both Ireland and Singapore, the effectiveness of the corporate tax regime is enhanced by operating in tandem with favourable conditions for productive activity and investment (such as a political and economic stability,
SUPPORTING THE PREPARATION OF TANZANIA’S SECOND FIVE YEAR DEVELOPMENT PLAN (FYDP II) 2016/17 – 2021/22
97
well-educated and skilled workforces and good infrastructure). Furthermore, the incentives for investors in these two countries were provided as one component of an overall industrialisation strategy. However, it remains to be seen whether Tanzania is ready to implement a challenging incentive programme.
Further efforts to simplify the tax system and streamline tax processes in Tanzania are also necessary to ensure that the tax system does not discourage private enterprise or interfere with market signals in key industrial sectors. A present, Tanzanian enterprises are confronted with a plethora of different taxes. Businesses in Tanzania are required to make 49 different tax payments, on average, each year – well above the SSA average of 38 payments and higher than the EAC average as well (PWC, 2015a; World Bank, 2015a). The high number of taxes is due, at least in part, to the presence of numerous nuisance taxes. The multiplicity of taxes and cumulative levies in Tanzania act as a disincentive to tax payers (Ngaruko and Aikaeli, 2014; Wangwe et al., 2014), thereby compromising tax revenue collections, and raise the cost of doing business, thereby affecting the competitiveness of Tanzania’s manufacturing firms (Wangwe et al., 2014). As Fjeldstad and Heggstad (2011: 56) note: “multiple taxes (including fees and charges) make it difficult to enter new businesses and markets. Levies are perceived as exorbitant, often charged up-front irrespective of the size and type of business. Sometimes local and central taxes duplicate. We have also been informed by business people and senior civil servants that new taxes, fees and charges are introduced replacing nuisance taxes abolished by the government in recent years. This contributes to undermining the legitimacy of the tax system, encourages tax evasion and delays the formalization of micro- and small scale enterprises.” The tax system in Tanzania could be greatly simplified were these nuisance taxes to be eliminated wherever possible. Among other initiatives, this will require clearer guidelines on what should and should not be taxed by LGAs in Tanzania.
Unsurprisingly given the numerous different types of tax payments and the prevalence of nuisance taxes, Tanzania performs comparatively poorly on indicators of the ease of paying taxes. In the 2015 iteration of the World Bank’s Doing Business indicators, Tanzania ranked a lowly 148th out of 189 economies on the ease of paying taxes measure (down from 147th position in 2014). This low ranking reflects the high transaction costs associated with the payment of taxes in Tanzania and the complexity of the tax system in the country.
Given the current situation, there is a clear opportunity to reduce the number of payments that taxpayers in Tanzania are required to make and, more generally, to streamline tax compliance processes, particularly for start-up businesses and SMEs. Tax rules tend to disproportionately affect SMEs, especially start-up SMEs or those that face credit constraints, and tax compliance costs are usually relatively higher for SMEs than larger firms, which tend to be better able to navigate compliance hurdles (OECD, 2015). In Tanzania, the complexity of the tax system, exacerbated by knowledge gaps (such as low levels of awareness of tax laws) and limited assistance to comply with tax legislation, regulations and procedures has, in the past, affected levels of tax compliance among SMEs (ATAF & GIZ, 2014; Lubua, 2014). Higher levels of knowledge and awareness of tax laws and processes, together with the presence of adequate support to comply with these procedures tend to be correlated with better voluntary compliance.
Recognising these issues, a number of efforts have already being made to streamline tax processes and assist businesses in Tanzania to pay their taxes. In October 2012 an electronic system for filing VAT returns was introduced in order to reduce the time taken for VAT registered taxpayers to prepare and file VAT returns (PWC, 2015a). A Revenue Gateway System was launched in July 2013 to provide an interface between the TRA, Bank of Tanzania, commercial banks and other stakeholders (ibid.). This has made it possible to make multiple tax payments simultaneously (ibid.). More generally, the TRA has initiated a number of taxpayer education drives, and offers call centres that deal with taxpayer queries. Furthermore, the TRA has introduced one stop shops in Dar es Salaam for new business registration, which register and issue Taxpayer Identification Numbers and certificates for newly established businesses.
But some aspects of these initiatives require attention if tax processes in Tanzania are to be streamlined further. For example, it will be important to move ahead with plans to extend the ability to file returns
SUPPORTING THE PREPARATION OF TANZANIA’S SECOND FIVE YEAR DEVELOPMENT PLAN (FYDP II) 2016/17 – 2021/22
98
electronically to other types of tax – electronic filing is currently limited to VAT returns, with no equivalent electronic system for filing and paying social security contributions, the skills and development levy or corporate income tax (PWC, 2015a). Furthermore, while the e-filing system for VAT registered taxpayers is in place, there is currently no online payment system for VAT payments (ibid.). Finally, the impact and reach of the TRA’s taxpayer education initiatives could be improved (Lubua, 2014), for example by using ICT to disseminate taxpayer education information through mobile phones.
An additional problem is that labour taxes in Tanzania are comparatively high, particularly compared to the country’s regional neighbours (Business Times, 2013). The payroll costs faced by employers in Tanzania are inflated by the requirement to make employer social security contributions and pay a skills and development levy (PWC, 2015a). In principle, some sort of skills and development levy – such as the 1% levy applied in Singapore and Malaysia – can produce important benefits if the proceeds from the levy are effectively directed towards capacity building and other development priorities. However, at present the current levy of 5% collected on employees’ income in Tanzania is excessively high when measured against the global average (World Bank, 2015a). It was anticipated that this levy would be reduced to 2% in the 2014 budget, but no such reduction has been forthcoming (PWC, 2015a). Ongoing work by the IMF suggests that while personal income taxes are lower in Tanzania than in regional neighbours such as Kenya and Rwanda, these countries do not impose a comparable levy, meaning that with the addition of the social security contributions and skills and development levy Tanzania’s effective tax rate is actually higher. Indeed, estimates provided in consultation with the IMF suggest that the average effective tax rate in Tanzania is 34%, compared to 26% in Kenya and approximately 30% in Uganda and Rwanda. The heavy taxation of labour in Tanzania is seemingly incompatible with the goal of developing labour-intensive light manufacturing capabilities as a potential stepping stone into higher productive value-added activities. This also has a detrimental impact on the mobilisation of tax revenues by discouraging formal employment in the country. Importantly, while reducing the level of labour taxation in Tanzania is desirable, any efforts to do so will need to ensure that a reduction in the effective tax rate does not undermine the financial viability of pension funds.
These measures should form part of a broader shift in the tax system to systematically support local producers and productive activities in light manufacturing industries in Tanzania. In general, targeted tax breaks, offered together with a mix of other incentives and complementary policies (such as improvements to the business climate) that are directed specifically to supporting labour-intensive light manufacturing industries are likely to be most effective when used together. Certain industry-specific changes to the tax regime may also be necessary. For example, export taxes on hides and skins produced in Tanzania currently discourage local value-added processing of raw hides and the production of high-quality hides and skins in the leather and leather products industry (Dinh et al., 2013). In this way, these taxes are at odds with the country’s industrialisation objectives, and should be gradually reduced with a view to ultimately removing them altogether (ibid.). Similarly, consideration should be given to reducing import taxes on trucks and spare parts, which would help to lower the free on board production cost of manufactured goods (ibid.).
8.3.2 FDI AND PRIVATE CAPITAL FLOWS FOR INDUSTRIALISATION
Attracting FDI
Investment, whether through FDI or domestic sources, is a key determinant of productivity growth and economic transformation. For its part, FDI can act as an engine for economic transformation: facilitating the entry of new firms into existing or new sectors, leveraging backward and forward linkages with local suppliers and producers, contributing to industrial upgrading among domestic firms, generating multiplier effects, and producing positive productivity spillovers through demonstration effects and the diffusion of knowledge, skills and technology into the domestic economy (IMF, 2006; Du et al., 2011; Dinh et al., 2012; Dinh, 2013).
Tanzania is already one of the leading destinations for FDI in Africa, and the country has benefited from substantial growth in FDI inflows over the past two decades. FDI into the country doubled in value between 2005 and 2013 and there has been significant growth in the absolute level of net FDI inflows into Tanzania
SUPPORTING THE PREPARATION OF TANZANIA’S SECOND FIVE YEAR DEVELOPMENT PLAN (FYDP II) 2016/17 – 2021/22
99
over the past two decades (see Appendix I). The availability of substantial gold and natural gas deposits in Tanzania has been key to the expansion of FDI into the economy.
To date, much of the FDI flows into the country have taken the form of greenfield investment into the extractive and tourism sectors (African Development Bank, OECD and UNDP, 2014). The manufacturing sector is also a relatively significant recipient of FDI. Indeed, in 2011, 16% of total FDI in Tanzania was directed towards manufacturing, making this sector the second largest recipient of FDI in the country (Diyamett and Mutambla, 2014). However, FDI flows into the sector have stagnated in recent years (UNIDO, 2012). In addition, manufacturing FDI is distributed unevenly across Tanzania’s major industrial regions, with the bulk of the flows concentrated in Dar es Salaam (ibid.). Another issue, evident in many sectors (including manufacturing), is that relatively little FDI is targeted towards value-adding activities in Tanzania. Given these issues, it is critically important for Tanzania to attract and grow FDI into the right areas if the government’s ambitious industrialisation targets and goal of becoming a middle-income country by 2025 are to be achieved. This includes attracting greater levels of investment into the early stages of production in labour-intensive light manufacturing industries such as the garment industry (Dinh et al., 2013), as well as into new areas such as automotive assembly, or the manufacture of glass and production of detergents and industrial chemicals using the country’s considerable soda ash reserves.
A more coherent spatial approach to industrialisation, through the development of SEZs and industrial parks and clusters in major industrial regions and strategic locations across the country, would not only help to attract more FDI into Tanzania but also facilitate the diversification of the regional distribution of industrial activity.33 Tanzania’s EPZA sees the establishment of SEZs as means to attract FDI ‘migrating birds’, (Kelsall, 2013) while also serving as mechanisms for attracting local investment. According to the EPZA, Tanzanians currently own 45 percent of the 140 registered projects under EPZ and SEZ schemes in the country. Indian and Chinese investment is also prominent in these projects, accounting for 21% and 9% of registered projects, respectively; while a further 25% are owned by foreign investors from other countries (IPP Media, 2015). By influencing the location choice of firms in the country, such spatial industrial policies can be effective both in accelerating industrialisation in Tanzania and ensuring that the gains from industrialisation are distributed more evenly (Newman, 2015). The focus in developing these facilities should be on continuing efforts to attract export-led manufacturing investments into Tanzania, particularly those that are oriented towards the formation of value chains in light manufacturing industries such as leather, wood and textiles and garments. There is also scope to attract investment in manufacturing basic consumer goods (such as matches, soap, cooking oils and toothpaste) for the domestic and regional markets.
To be most effective, greater consistency is required in the government’s approach to locating and developing SEZs.34 There are already a number of SEZs in Tanzania, as well as a large number of
33 There is considerable potential to establish ‘plug-and-play’ industrial parks in Tanzania as a way to develop competitiveness in
light manufacturing industries and to attract FDI into these industries. According to Dinh et al. (2013: 62), these parks “can solve several constrains simultaneously by providing firms with affordable access to industrial land, standardized factory shell buildings, worker housing, training facilities, and one-stop shops for business regulations.” The experience in establishing these parks in China suggests that they can also be effective in promoting both competition and cooperation between firms, and facilitating industrial clustering by making it easier for smaller and larger firms to locate together. The latter can generate important economies of both scale and scope in specific industries. In turn, once established the industrial parks can be used as a tool to promote Tanzania as a leading destination for global investors (Dinh et al., 2013). 34 In the past few months, the development of the Bagamoyo SEZ has been marred by uncertainty and unnecessary confusion. The plans for the development of Bagamoyo SEZ, 75 kilometres north of Dar es Salaam, provide a model that could be replicated in other parts of the country. Construction of the SEZ, which will extend over 9,000 hectares, began in October 2015 and is expected to take 10 years to complete. It will include an 800 hectare Bagamoyo port, an airport, a 1,700 hectare industrial zone, a 5,000 hectare EPZ, a commercial zone, a 300 hectare technological (ICT) park, a logistics park, a tourist park and an adjacent residential area. According to the EPZA, the development of the SEZ is set to occur in two phases, beginning with the establishment of a trade centre focused on high quality goods for export to markets in East and Central Africa. The second phase will focus on light industries undertaking value added processing of agro-based raw materials for export from Tanzania (IPP Media, 2015). However, in early January 2016, the Government of Tanzania announced that the construction of the Bagamoyo Port had been suspended, stating that it was instead to focus on improving the capacity, performance and efficiency of the existing Mtwara and Dar es Salaam ports; before clarifying a day later that the construction of the Port would continue (Mirondo, 2016a, 2016b).
SUPPORTING THE PREPARATION OF TANZANIA’S SECOND FIVE YEAR DEVELOPMENT PLAN (FYDP II) 2016/17 – 2021/22
100
businesses that have EPZ status. Future plans to develop more SEZs would benefit from a detailed assessment of what has and has not worked with the existing SEZs in the country. This should include a review of the fiscal regime offered through SEZs and the designation of EPZ status to individual companies, and careful consideration of the implications of the country’s land policies. Taking on board the lessons learnws from such an assessment, it would then be important to focus on getting one SEZ working effectively first, rather than looking to develop multiple SEZs simultaneously. The successful development and implementation of one SEZ could go a long way to showing that the government and the private sector can work together effectively. It would also provide a platform from which to scale up and develop additional SEZs.
In line with this, while the concept of EPZs and SEZs is not new to Tanzania, there is scope to improve the manner in which future SEZs are conceptualised and developed in the country. Tuomi (2012) argues that the development of SEZs should be underpinned by clear strategic planning with input from investors (both domestic and foreign). A legal framework for SEZs, which clearly sets out institutional roles and responsibilities, is also important. In the past, overlapping mandates have existed for the regulation, development and operation of SEZs (for instance, the EPZA performed all three roles in the case of the Benjamin William Mkapa SEZ located at Mabibo), potentially creating a conflict of interest (Farole and Kweka, 2011). A targeted positioning strategy is also important for attracting FDI – the location of future SEZs in Tanzania should be determined solely by commercial considerations and on the basis of Tanzania’s comparative advantages (described in section 5.1). Moreover, strategic selection of the type of companies to be attracted to new SEZs, as well as concerted efforts to ensure that similar types of companies are located together, will be important to enhance the profile of the zones and maximise their potential to generate agglomeration and cluster effects (Tuomi, 2012). This requires a more nuanced understanding of how Tanzania’s comparative advantages can be exploited to attract (or up-scale) specific types of productive activity in Tanzania, and the way that well-designed and located SEZs can contribute to this process.
Moreover, the development of additional SEZs and industrial clusters and parks would need to be backed by greater emphasis on fostering backward and forward linkages to the rest of the economy and promoting other types of spillover effects (Kelsall, 2013). This could be achieved, for example, through a concerted effort – backed by range of incentives for eligible investors – to encourage FDI in cooperation with local companies or through joint ventures. In this respect, the FYDP II should focus on enhancing linkages both between local large enterprises and foreign firms, and between local large enterprises, foreign firms and domestic micro, small and medium sized enterprises (JICA, 2015). Localised linkages have been shown to be effective in generating knowledge diffusion through FDI from multinational enterprises to domestic firms (Rand, 2015). This is likely to require targeted interventions to boost the technological capabilities of local firms to make them more capable of serving as local content suppliers and, thus, more attractive as partners for foreign firms (Diyamett and Mutambla, 2014). Assistance will also be needed to enable local manufacturing firms and suppliers to expand production volumes. One possible way to encourage this type of assistance would be to follow the approach in Singapore, where a Local Industrial Upgrading Programme implemented by Singapore’s Economic Development Board encouraged multinationals to enter into long-term supply contracts with domestic firms and provided financial incentives (including subsidisation of training programmes) to encourage these multinationals to provide assistance to local suppliers to improve their efficiency (Rajan, 2004; Tuomi, 2012).
At the same time, further improvements to the business climate in Tanzania would also be effective in attracting FDI into light manufacturing. Indeed, the incentives and mechanisms described above should act as a complement to a welcoming and favourable business climate. In Appendix I we discuss a range of general areas in which the business climate can be improved in Tanzania, and highlight the mechanisms through which the business climate affects competitiveness and, hence, the attractiveness of the country as a destination for FDI. In the context of light manufacturing, improvements to the business climate in Tanzania should be framed within a strategy to develop a more competitive production environment that is conducive to attracting high-quality FDI into light manufacturing industries. This requires the development of adaptable skills within the labour market, sophisticated supplier networks, efficient
SUPPORTING THE PREPARATION OF TANZANIA’S SECOND FIVE YEAR DEVELOPMENT PLAN (FYDP II) 2016/17 – 2021/22
101
business services and flexible institutions, as well as consistency in government policy messages (Diyamett and Mutambla, 2014)
Recent issues related to corruption and inefficiencies at the Port of Dar es Salaam highlight the importance of the interaction of infrastructure with a favourable business climate for attracting and maintaining investment. For example, in early January 2016, reports emerged that Rwandan mineral exporters had resorted to using the Port of Mombasa in Kenya rather than the Port of Dar es Salaam for shipping their minerals to overseas customers, following a spate of thefts of minerals while in transit and persistent corruption in the management of the Tanzanian port in recent years, even though transport through Mombasa involves a longer and more expensive route (Agutamba, 2016).35 At the same time, the Kenyan authorities have invested heavily in improving facilities at the Port of Mombasa as it looks to attract greater volumes of cargo from the countries along the Northern Corridor (ibid.).
Nevertheless, the initial efforts of the new leadership within the Government of Tanzania to clamp down on corruption are encouraging. It will be important for the government to build on this, and capitalise on a relatively stable political economy, to continue to create an environment that is conducive to attracting greater levels of both domestic and foreign investment.
Facilitating private sector financing
There has been encouraging growth in Tanzania’s financial sector in recent years. This has seen increases in the number of banking institutions and insurance companies, along with an expanding presence of established financial non-governmental organisations and savings and credit cooperative societies (African Development Bank, OECD and UNDP, 2014). This has been accompanied by increased competition in the financial sector and an expanding range of financial products. At the same time, the Government of Tanzania has actively sought to liberalise capital markets through reforms to the existing capital framework for both foreign and domestic investors.
Despite this progress, the financial sector still provides relatively little credit to Tanzania’s private sector.
Manufacturing firms continue to face difficulty accessing credit. This is primarily due to comparatively high lending rates in Tanzania and other EAC countries (at least relative to the comparator countries introduced in Chapter 4),36 which inflate the costs associated with accessing working capital (Wangwe et al., 2014). This problem is exacerbated by the reality that the working capital structures in these firms are heavily skewed towards debt (ibid.). Furthermore, information asymmetries undermine efforts to establish trust between borrowers and lenders within the financial system (ibid.). As a result of these (and other) challenges, which are discussed in greater detail in Appendix I, manufacturing firms in Tanzania (especially small firms) find it difficult to obtain the necessary finance to expand, purchase land and buildings, or upgrade equipment and machinery.
Against this backdrop, there are a range of potential interventions that can help to facilitate access to private sector financing for light manufacturing firms in Tanzania. We argue in Appendix I that loosening constraints to accessing private credit and improving the performance of Tanzania’s financial sector as an intermediary is necessary to boost access to domestic private financing. In the context of light manufacturing, this could be achieved in several ways. First, greater flexibility in the way in which commercial banks and other financial institutions apply collateral requirements would make it easier for these firms to access bank loans. When considering loan applications from manufacturing SMEs, for example, assistance could be provided to commercial banks in Tanzania to more effectively understand and evaluate the working capital requirements and investment projects of individual light manufacturing firms (Wignaraja, 2015). Financial literacy is also important. Individual light manufacturing firms in
35 The additional cost of transporting through Mombasa Port is estimated at USD 500 per vessel. 36 Lending interest rates tend to be comparatively high in Tanzania and even higher elsewhere in East Africa. According to WDI data, the lending interest rate was 16.3% in Tanzania in 2014, and 16.5% and 21.5% in Kenya and Uganda, respectively. These rates are high compared to the comparator countries introduced in Chapter 4. For example, the corresponding lending interest rates were lower in Zambia (11.6%), Bangladesh (13%), Malaysia (4.6%) and Vietnam (8.7%).
SUPPORTING THE PREPARATION OF TANZANIA’S SECOND FIVE YEAR DEVELOPMENT PLAN (FYDP II) 2016/17 – 2021/22
102
Tanzania would benefit from assistance to prepare effective business plans and financial statements. This would boost their chances of obtaining loans from commercial banks.
Second, action could be considered to make interventions on industrial financing with special attention to long-term private finance to facilitate the entry of small SMEs into regional and global manufacturing value chains. These interventions could include the following:
Provide government incentives to induce commercial banks and other financial institutions to offer finance to well-managed light manufacturing firms to purchase or upgrade machinery and equipment (Dinh et al., 2012).
Establish a fund to facilitate increased lending to SMEs from sources other than banks. This could take a similar form to the Business Finance Partnership in operation in the United Kingdom, where funds are matched with money from private sector investors and are invested on fully commercial terms (HM Treasury Department for Business Innovation and Skills, 2015). Such an approach represents a way to bring together government investment and funds from private investors, with money mobilised in this way lent directly to Tanzanian SMEs by fund managers or DFIs such as the CDC, the International Finance Corporation (IFC) or others.
Mobilise resources to raise the level of capital available to a well-functioning development bank to fund projects designed to support value chain development in light manufacturing. This is particularly important for cases in which there are important projects that are initially unable to attract funding from commercial banks. In these instances, such development finance institutions can perform a transformational role. Similar approaches have been successful in other countries in the past, with development banks in Japan, China and Malaysia, for example, successfully acting as intermediaries to match finance from pension funds and community savings to specific development projects (TIB Development Bank, 2015).
Step-up land reforms that enable private firms to access long-term leases for industrial land (Dinh et al., 2012).
Third, the clustering of firms and industries can be effective in reducing the financial costs and risks typically faced by start-ups and small manufacturing firms in Tanzania. The risks associated with these types of firms mean that they often face considerable difficulty accessing loans from banks and other financial institutions. Locating these firms together, for example in plug-and-play industrial parks (discussed earlier in the context of attracting FDI), can be effective in assisting them to access finance. The location of firms in clusters may, for example, enable SMEs to apply for finance jointly to establish specific facilities or fund training and skills development interventions. As Dinh et al. (2013: 40) argue: “Plug-and-play industrial parks have greatly reduced start-up costs and risks among small and medium industries that are not sufficiently developed to qualify for bank loans, but that have the scale, capital, and growth prospects to take advantage of larger facilities.” Dinh et al. (2012) show that this approach has been particularly effective in China, where industrial parks have paved the way for the development of industrial clusters, with resulting spillover benefits in terms of economies of scale and scope. It has also proved to be effective in Japan, where peer pressure among SMEs within individual clusters has been instrumental in ensuring that SMEs repay their loans (Wignaraja, 2015).
Options for PPP financing
PPPs can be effective mechanisms for leveraging finance to fund investment gaps for national development activities, especially infrastructure projects. This is especially relevant in the Tanzanian context, where infrastructure shortages act as a binding constraint to further industrialisation. This, coupled with the fact that the Government of Tanzania has prioritised infrastructure development, suggests that there is considerable scope for PPP arrangements to leverage finance from the public sector to address investment shortfalls for specific infrastructure development projects that support industrialisation.
This is particularly true in the case of power and energy infrastructure. Industrial activities rely heavily on a stable and reliable supply of power. At present, however, poor service quality, an unreliable and
SUPPORTING THE PREPARATION OF TANZANIA’S SECOND FIVE YEAR DEVELOPMENT PLAN (FYDP II) 2016/17 – 2021/22
103
intermittent power supply, frequent rationing, unplanned power outages and interruptions, voltage fluctuation and phase failures have a crippling effect on the industrial sector in Tanzania. Addressing these issues will require well-balanced investment in power generation, transmission, distribution and the construction and operation of energy sub-stations, as well as proper operation and frequent maintenance (JICA, 2015). There is scope for private sector involvement, for example through independent power producers (IPPs) to improve energy provision or through PPPs that facilitate private investment in alternative power sources such as hydro power and thermal power plants.
PPPs could also be used to leverage funding for much-needed investments to address gaps in transportation infrastructure. The private sector has already expressed interest in investing in the development of new transport corridors (Balchin, 2015). Some investors have publicly declared their interest in investing in transport projects related to the Central Corridor, which will link Dar es Salaam to Isaka, Keza, Kigali, Gitega and Musongati in Rwanda. For instance, Retired General Hamisi Semfuko, now executive chairman of Arinma Africa, expressed interest in 2015 in investing in the construction of a toll road between Dar es Salaam and Chalinze as well as in the construction of bridges along the corridor, and has claimed that he can raise up to USD 1 billion in investment in the corridor (Masare, 2015).
More generally, however, misunderstandings between the government and the private sector – particularly related to the sharing of risks and benefits – and limited knowledge of the practicalities of the PPP concept from both sides have hampered progress in establishing a fully functional PPP framework in Tanzania. Several existing PPP financing projects in the country (including those involving Songas and Independent Power Tanzania Limited) have faced problems in their implementation – such as governance issues, concerns related to contingent liabilities and other contracting issues – and the process of moving to completion of the projects has proved to be difficult.
There is a need for greater transparency in agreements and compacts between the government and the private sector if these issues are to be addressed. Similarly, a programme to address issues arising in negotiating and executing PPPs needs to be designed and implemented in Tanzania. Both of these require the development of a more robust methodology to evaluate the viability and feasibility of specific PPP projects and a clear framework to guide risk and benefit sharing between the public and private sectors. From the public sector perspective, this framework should adequately recognise the potential risks from PPPs associated with debt sustainability (Cagliari, 2014). It should also provide guidance on how the Tanzanian public sector should deal with obligations to purchase services from a private operator and honour calls on guarantees, and ensure that the costs associated with leveraging finance through PPPs are recorded in a transparent and accountable manner (JDC, 2012; Prizzon and Mustapha, 2014). This should form part of a broader initiative to enhance government capacity for evaluating, negotiating and executing PPP projects.
At the sectoral level, the Tanzania Private Sector Foundation (TPSF) is already attempting to identify ‘quick win’ areas for PPP projects. Their focus is on products, industries and sectors that have the potential to generate transformative impacts in the economy and which do not have especially onerous technical requirements. The Government of Tanzania could work more closely with the TPSF, the Tanzania National Business Council and the Tanzania Investors Round Table using the identification of promising products and sectors outlined in Chapter 5 as a basis, to further develop this process.
In general, introducing the correct framework and mechanisms around the governance of PPPs is very difficult, and very few countries in the world have managed to do so effectively. Ultimately, private sector involvement in financing infrastructure development and sectoral development in Tanzania through PPPs will require a very efficient private sector as well as government facilitation and institutional development. In particular, the Government of Tanzania will need to create an environment that is conducive to private sector involvement in order to generate the necessary appetite from within the private sector to invest. As a part of this process, the FYDP II should clearly identify priority projects in EPZs and SEZs so that the private sector can identify opportunities. The appetite from the private sector will come from an awareness of the sectors that are prioritised by the government.
SUPPORTING THE PREPARATION OF TANZANIA’S SECOND FIVE YEAR DEVELOPMENT PLAN (FYDP II) 2016/17 – 2021/22
104
8.4 THE OIL AND NATURAL GAS SECTOR AS A CATALYST FOR INDUSTRIALISATION
The oil and gas sector is likely to play a major role in injecting financial resources into Tanzania in the future. Should the extraction of newly discovered offshore natural gas deposits prove to be commercially viable, estimates suggest the resulting boost to government coffers could amount to the equivalent of 3% of non-gas GDP (World Bank, 2015). Exports of LNG from Tanzania could provide up to USD 2 billion in government revenue (Bukurura and Mmari, 2014).
The realisation of these revenues is still some way off, however, with the anticipated revenues from new discoveries of off-shore natural gas deposits only likely to be realised between seven and 10 years from now and, thus, after the conclusion of the FDYP II period. Furthermore, it is necessary to temper expectations about future revenue flows given that a final investment decision related to the extraction of off-shore gas reserves is still some way off, and may be compromised by the current fall in gas prices internationally. Nevertheless, the relatively long lead time provides an opportunity to put in place an effective institutional and policy environment that optimises the benefits for the Tanzanian people from any future oil and gas proceeds (Adam, 2015). If managed correctly, the envisaged revenue yields can play a significant role in reducing the country’s current reliance on foreign aid and grants, and diversifying the revenue base at the disposal of the Government of Tanzania.
8.4.1 OVERVIEW OF THE EMERGING NATURAL GAS SECTOR AND RELATED INDUSTRIES
While some literature suggests that resource abundance has adverse effects on countries’ economic growth, there is also evidence of countries that have progressed rapidly using their natural resource endowments. Poor outcomes are associated with many factors. These include failures to capture revenue, adverse volatility in resource dependent countries, low savings and investments, wasteful spending, disruptions in economic fundamentals that prevent competitiveness and diversification, and conflicts. Despite some country failures and associated factors, there are also some success stories where countries have achieved high growth and diversified economies, supported in part or significantly by the abundance of natural resources. Examples of successful countries often cited include Malaysia, Norway, Chile and Botswana. What makes the difference is the robustness of the policy choices that states choose to follow and the strategies for pursuing them. Bukurura and Mmari (2014) discuss how certain policy choices influenced positive outcomes in Norway, the Netherlands, Malaysia and China. Tanzania has recently discovered vast deposits of natural gas, adding to its other natural resources, which include minerals, forestry, wildlife and agricultural land. Natural gas resources provide significant potential to drive economic growth and transformation, by stimulating industrialisation, increasing FDI flows and export revenues, and creating jobs. What is needed are effective strategies and policy choices to utilise these resources effectively, accompanied by appropriate legal and regulatory instruments. The first discoveries of natural gas in Tanzania were made in 1974 and 1982 at Songo Songo Island (Lindi region) and Mnazi bay (Mtwara region), respectively. These two onshore discoveries make up 7.5 TCF Gas Initially in Place (GIIP). Further discoveries were made between 2007 and June 2015, with onshore wells located in Kiliwani, Ntorya and Mkuranga estimated at 0.5 TCF and offshore wells in 4 blocks estimated at 47.13 TCF, making a total GIIP estimated at 55.08 TCF as of June 2015. Commercialisation of natural gas in Tanzania started many years after the first discoveries in 1974. Production commenced in 2004 with the completion of an infrastructure project for transporting 102 million standard cubic feet per day (mmscfd) of natural gas to Dar es Salaam via a 12 inch (marine) and 16 inch on-land pipeline spanning 225 kilometres. Nearly 90% of this natural gas is used in the generation of power while the remaining 10% is used in some industries, households and institutions as fuel. There are 37 industries located in Dar es Salaam that are currently connected to the pipeline and are using natural gas. Subsequently, in 2006, another gas to power project was commissioned in Mnazi Bay, with a current production of 130 mmscfd of natural gas per day that is transported via a 27 kilometre 8 inch pipeline to the power generation plant. The installed capacity of the Mnazi Bay gas processing plant is 10 mmscfd,
SUPPORTING THE PREPARATION OF TANZANIA’S SECOND FIVE YEAR DEVELOPMENT PLAN (FYDP II) 2016/17 – 2021/22
105
but its current supply to the power plant is 2 mmscfd, producing 12MW that is consumed in Mtwara and Lindi. This is, however, below the 18MW installed capacity of the power plant. The installed capacities for both the processing plant at Songo Songo and the pipeline to Dar es Salaam reached their maximum designed capacities in 2008. This resulted in a failure to generate additional electricity from natural gas to meet the increasing demand. It has also limited the connection of new industrial, household and institutional customers. The Government of Tanzania decided to raise natural gas processing and transportation capacity by constructing two natural gas processing plants (at Madimba – Mtwara and Songo Songo – Lindi) and a 532 kilometre pipeline comprising a 36 inch gas transportation pipeline from Mtwara and a 24 inch pipeline from Songo Songo Somangafungu where it joins the 36 inch pipeline to Dar es Salaam. The new gas infrastructure was completed and started operations in October 2015, and is currently supplying natural gas power generating plants in Dar es Salaam. This new infrastructure has greatly boosted natural gas supply for power generation and the potential to use available gas for industrial purposes. New investments in cement production have come on-stream and others are under construction, whose main production inputs will include natural gas. The Dangote Cement plant in Mtwara – with installed capacity of 7,500 tons of cement per day – was launched in October 2015. There are other natural gas related industrial ventures that are still in their planning stage, including those for manufacturing of fertilizer and ammonia products.
8.4.2 KEY MILESTONS IN PREPARATION FOR THE REALISATION OF NATURAL GAS REVENUES
The government of the United Republic of Tanzania has undertaken several steps towards ensuring that the economy benefits at large from recent discoveries of natural gas. For the country to benefit, the management of funds generated would be guided by not only an appropriate policy and legal framework, but also the alignment of stakeholders across the entire value chain.
In 2015, three important acts were passed by parliament, namely, the Oil and Gas Revenue Management Act, The Tanzania Extractive Industries (Transparency and Accountability) Act and the Petroleum Act. The first Act is meant to ensure all actors responsible for managing the funds from oil and gas are set in place legally. This applies to revenue sources, their collection mechanisms, their management, their utilisation and the saving /investment balance.
The Act on transparency and accountability is intended to ensure honest and open reporting of costs and profits, taxes received and paid, as well as publishing of contracts between the Government of Tanzania and various contractors, including operators of exploration and production wells. The Petroleum Act, on the other hand, provides regulation of all activities (downstream, midstream and upstream). The recent establishment of the Petroleum Upstream Regulatory Authority (PURA) – an independent regulatory authority in charge of monitoring petroleum upstream activities in Mainland Tanzania – as stipulated in the Petroleum Act, is intended to ensure that petroleum resources are optimised, and that activities within the industry are carried out in line with best practice and for the benefit of the state and its people.
PURA will advise the minister and the government on matters related to oil and gas. In particular, it will advise the Minister on negotiations of production sharing agreements and the processing, granting, renewing, suspending and cancelling of exploration, development and production licences. PURA will facilitate the resolution of complaints and disputes and will ensure the implementation of local content rules in the petroleum sector. The coordinating, monitoring, forecasting and other functions of PURA are found in Part II Sub- Part II, Sections 11-28 of the Petroleum Act, 2015.
The Electricity and Water Utilities Regulatory Authority (EWURA) is expected to continue to regulate midstream and downstream activities. EWURA will continue to approve applications for tariffs and prices and issue renewal, suspension and cancellation of construction approvals and operational licences, while also undertaking the collection of fees and levies for the petroleum sector. In addition EWURA will be working closely with PURA as stipulated in the Petroleum Act in Sections 29 to 31.
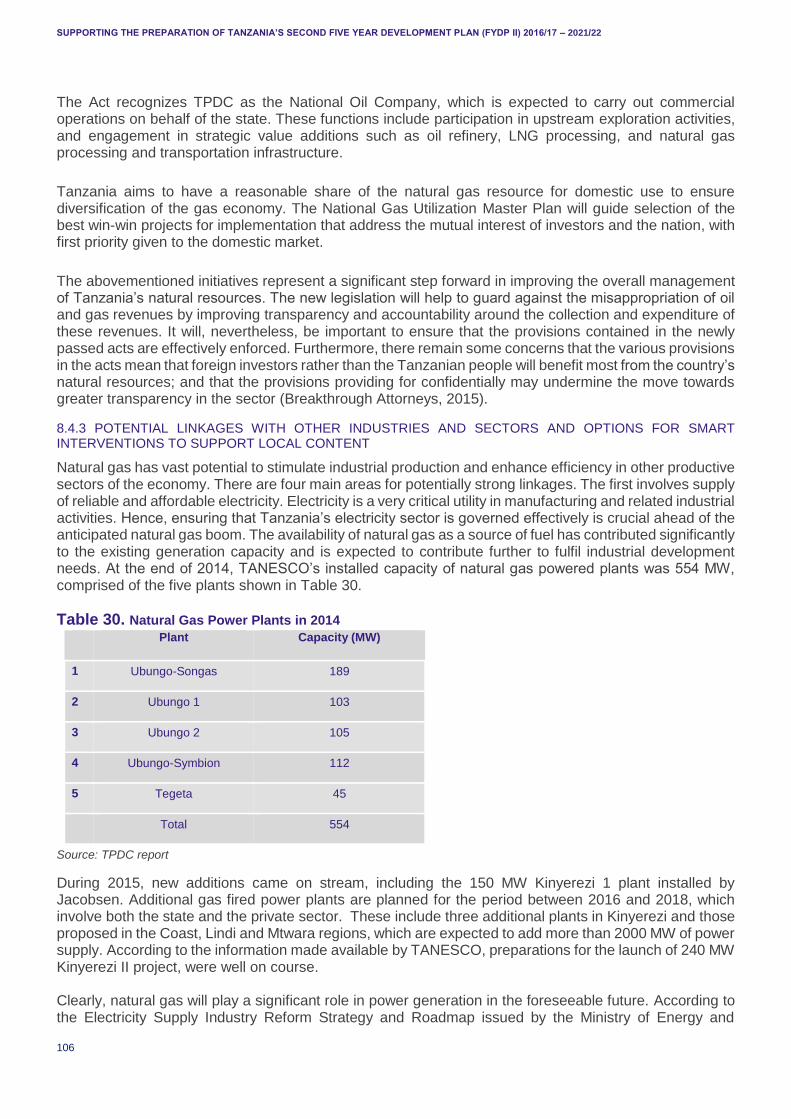
SUPPORTING THE PREPARATION OF TANZANIA’S SECOND FIVE YEAR DEVELOPMENT PLAN (FYDP II) 2016/17 – 2021/22
106
The Act recognizes TPDC as the National Oil Company, which is expected to carry out commercial operations on behalf of the state. These functions include participation in upstream exploration activities, and engagement in strategic value additions such as oil refinery, LNG processing, and natural gas processing and transportation infrastructure.
Tanzania aims to have a reasonable share of the natural gas resource for domestic use to ensure diversification of the gas economy. The National Gas Utilization Master Plan will guide selection of the best win-win projects for implementation that address the mutual interest of investors and the nation, with first priority given to the domestic market.
The abovementioned initiatives represent a significant step forward in improving the overall management of Tanzania’s natural resources. The new legislation will help to guard against the misappropriation of oil and gas revenues by improving transparency and accountability around the collection and expenditure of these revenues. It will, nevertheless, be important to ensure that the provisions contained in the newly passed acts are effectively enforced. Furthermore, there remain some concerns that the various provisions in the acts mean that foreign investors rather than the Tanzanian people will benefit most from the country’s natural resources; and that the provisions providing for confidentially may undermine the move towards greater transparency in the sector (Breakthrough Attorneys, 2015).
8.4.3 POTENTIAL LINKAGES WITH OTHER INDUSTRIES AND SECTORS AND OPTIONS FOR SMART INTERVENTIONS TO SUPPORT LOCAL CONTENT
Natural gas has vast potential to stimulate industrial production and enhance efficiency in other productive sectors of the economy. There are four main areas for potentially strong linkages. The first involves supply of reliable and affordable electricity. Electricity is a very critical utility in manufacturing and related industrial activities. Hence, ensuring that Tanzania’s electricity sector is governed effectively is crucial ahead of the anticipated natural gas boom. The availability of natural gas as a source of fuel has contributed significantly to the existing generation capacity and is expected to contribute further to fulfil industrial development needs. At the end of 2014, TANESCO’s installed capacity of natural gas powered plants was 554 MW, comprised of the five plants shown in Table 30.
Table 30. Natural Gas Power Plants in 2014
Plant Capacity (MW)
1 Ubungo-Songas 189
2 Ubungo 1 103
3 Ubungo 2 105
4 Ubungo-Symbion 112
5 Tegeta 45
Total 554
Source: TPDC report
During 2015, new additions came on stream, including the 150 MW Kinyerezi 1 plant installed by Jacobsen. Additional gas fired power plants are planned for the period between 2016 and 2018, which involve both the state and the private sector. These include three additional plants in Kinyerezi and those proposed in the Coast, Lindi and Mtwara regions, which are expected to add more than 2000 MW of power supply. According to the information made available by TANESCO, preparations for the launch of 240 MW Kinyerezi II project, were well on course. Clearly, natural gas will play a significant role in power generation in the foreseeable future. According to the Electricity Supply Industry Reform Strategy and Roadmap issued by the Ministry of Energy and
SUPPORTING THE PREPARATION OF TANZANIA’S SECOND FIVE YEAR DEVELOPMENT PLAN (FYDP II) 2016/17 – 2021/22
107
Minerals in 2014, natural gas was already contributing 527 MW out of a total 1,583 MW, equivalent to 33%. With the projected additional capacity by 2025, natural gas is forecast to contribute 4,469 MWs of the projected total of 10,798 MW, equivalent to 41%. These projections assume additional generation of hydro power from the current level of 561 MW to 2,090 MW by 2025, together with 2,900 MW from coal, and 1,338 MW from other sources (HFO/GO/Diesel, wind, solar, geothermal, and interconnector). Second, natural gas provides a cheaper source of energy for heating, cooking, and fuel. Currently, natural gas is used in operations in 37 industries, two institutions, and 70 households for cooking, and as fuel for few vehicles, under a pilot project. In industries where production processes requires massive heat energy, such as cement and steel plants, the availability of natural gas will provide much impetus. Current users include Wazo Hill Cement Plant, Tanzania Breweries Limited, and a number of Steel Mills. Additional demand for natural gas for industrial uses will grow from the current efforts of government to improve the business environment and to support domestic industrial production. New investments in low pressure natural gas distribution infrastructure will have to be made in major industrial cities and industrial clusters such as the EPZs. As the government has made decisions to invest further in the commercial production of coal, a significant synergy provided by natural gas should be exploited to pursue the development of large scale iron and steel industries, where natural gas is used both as a fuel and a reducing agent. The reduction process, which purifies or removes oxygen from iron ore, is important in steel production. While this process has historically been performed using coal in the major steel producing countries like the United States of America, relative costs of production and considerations of carbon emissions dictate an optimum energy mix. The iron and steel industry has the potential to provide significant multiplier effects in other sectors and intensify local content. Steel is still a material of choice in the construction, transportation and manufacturing sectors. As the Tanzania national accounts data indicate, the construction and transport sectors have grown fast and the potential is still very large. The focus of FYDP II on industrialisation is likely to provide further impetus for the growth of these sectors, along with manufacturing. The oil and gas industry is in itself a large consumer of steel products, especially in the construction of exploration and production platforms, processing plants and equipment fabrication facilities. Local production of these high value input goods can provide significant avenues for local content, including job creation, utilisation of domestic raw materials, and backward and forward linkages across productive sectors. Third, the use of natural gas as feedstock provides significant opportunity for diversifying the economy by promoting the development of petrochemical industries. Natural gas can be used as a feedstock in the manufacturing of fertilizer, especially urea and ammonia. Local production of fertilizer will not only provide impetus to the agriculture sector, but also help to reduce the demand for foreign exchange needed for the importation of fertilizer, while at the same time increasing the share of manufacturing employment. It is understood that efforts by the government to establish fertilizer under joint venture arrangements are already underway. Local demand for fertilizer in Tanzania is estimated to reach 885,000 tons per year by 2025, while the projects under consideration are estimated to produce 1.3 million tons per year. Natural gas can also produce methanol, which is an important raw material for many other hydrocarbon derivative products such as Di-Methyl Ether which, in turn, is used as feedstock in most petrochemical industries to manufacture plastics, paints, pharmaceuticals and adhesives. Many successful countries have used natural gas to establish petrochemical industrial bases, including Malaysia, China, and Trinidad and Tobago. For instance, with estimated natural gas reserves of 13 TCF as of 2013, Trinidad and Tobago has a developed a diversified industrial base consisting of ten ammonia plants, seven methanol plants, a urea plant, four iron and steel mills, and several light industrial plants related to the natural gas value chain. Fourth, natural gas revenues can be used to complement other sources of revenue to finance the necessary infrastructure development and industrial ventures in Tanzania. The revenue boost will emanate from savings generated by substituting costly imported liquid fuels for generating power, and from the sale of gas to the domestic as well as foreign markets.
SUPPORTING THE PREPARATION OF TANZANIA’S SECOND FIVE YEAR DEVELOPMENT PLAN (FYDP II) 2016/17 – 2021/22
108
Computations from the Tanzania Petroleum Development Corporation (TPDC) indicate that, in the period from the commencement of commercial consumption of gas in 2004 up to June 2015, total consumption of natural gas amounted to 286 million cubic feet worth USD 703 million. These were equivalent to 8.5 trillion litres that would have cost USD 7.3 billion, thus representing significant savings. A significant portion of foreign exchange would have to be spent to import liquid fuels.
Natural gas revenues are expected to be large, which has also fuelled high expectations among Tanzanians. However, such revenue flows depend on many factors, including global demand and supply conditions, investment and production costs, and the domestic-export balance. At present, only onshore wells are producing on a commercial basis. Revenue data available at TPDC indicates that between 2004 and March 2015 total revenue from sales of natural gas amounted to USD 325 million. Larger flows of revenue are expected from the estimated 47 TCF reserves located in the deep offshore. International oil companies operating the three offshore discovery blocks intend to develop a LNG facility for the export market, and preparations had reached an advanced stage prior to the recent declines in oil and gas prices, which have slowed down exploration activities and delayed the decision on LNG development plans.
In terms of projections, the Production Sharing Agreements based on the 2008 model production sharing agreement suggest that 90-95% of existing reserves will be earmarked for export to international markets, with the remaining for the domestic market. It is understood that the government is negotiating these terms as part of host government agreements and, thus, the final domestic-export ratios may differ from the current ones. The cycle of the project is also an important parameter to consider in projecting expected revenues from LNG. According to the Tanzanian LNG industry demand and local supply analysis undertaken under the auspices of the World Bank, EU and UK aid in 2014, the project completion period will be seven years from the date of the final investment decision, including the preliminary preparations of land acquisition and studies, and Front End Engineering and Design. Thereafter, production will commence, with peak revenue estimated in year eight of production.
A model projection made by BG in 2013 indicated that government revenues could reach nearly USD 2 billion per year in peak years seven and eight at the prices prevailing in 2013 (USD 15-16/Btu). A significant portion of LNG markets are in Asian countries, especially Japan, South Korea, China, Taiwan and India. Following the dramatic declines in oil prices, gas prices have also fallen below USD 10/Btu in Asian markets and by even more in the US markets. This situation will definitely lower revenue estimates and is likely to delay many LNG projects, including the Tanzanian project. Volatility in oil and gas prices is inherently a characteristic of this industry, explaining why a robust oil and gas revenue management framework is necessary to avoid negative consequences for macroeconomic fundamentals, the non-resource fiscal balance, and the country’s broader competitiveness.
8.4.4 LINKS BETWEEN MORE RELIABLE AND LOWER COST ENERGY FOR INDUSTRIALISATION
Supplying energy for industrialisation calls for reorganisation of the electricity supply to ensure there is enhanced competition in the generation, transmission, distribution and retailing of power. Energy shortages currently represent a binding constraint to industrial development in Tanzania and it will be critically important to address them if the development plans for the FYDP II are to be viable in the long term.
TANESCO, which is a vertically integrated state-owned company, owns and carries out generation, transmission, distribution and retailing to final consumers in Tanzania. In addition, TANESCO sells bulk electricity to Zanzibar Electric Company (ZECO) through submarine cables to Zanzibar and Pemba Islands. Given the importance of its role, concerted efforts will need to be made in the five year FYDP II period to ensure that TANESCO operates as a viable entity.
TANESCO, which has operated as a monopoly over the years, has prepared an Electricity Supply Industry (ESI) Reform Strategy and Roadmap covering the period from 2014 to 2025. This takes into consideration the country’s energy needs for Vision 2025. The ESI reform strategy will be undertaken in four gradual

SUPPORTING THE PREPARATION OF TANZANIA’S SECOND FIVE YEAR DEVELOPMENT PLAN (FYDP II) 2016/17 – 2021/22
109
phases that will result in a fully competitive electricity market structure by 2025 (see Table 31) – which is expected to feature independent generation, transmission and distribution companies with much emphasis on private sector participation in the entire supply chain with the exception of the transmission section. The strategy aims to increase electricity connection from 24% (as of 2014) to 50% in 2025. The strategy notes the importance of diversifying sources of energy, with power currently coming from hydro, natural gas and diesel sources that generate about 1,583 MW (through a mix of hydropower (33%), natural gas (47%) and diesel (20%)). In the future less dependence on diesel and increased dependency on hydro and natural gas are expected. Over the years there have been reduction in electricity produced by hydro, driven in part by changing climatic conditions with prolonged dry seasons. In addition, coal, wind, solar, geothermal and interconnector sources are projected to generate about 10,800 MW by 2025.
The strategy shows clearly that TANESCO would move towards more reliable and lower cost energy. To increase efficiency, among other things, the strategy aims to reduce system losses from 19% (as of 2014) to 12% in 2025. For this to happen, the strategy aims to institute capacity building programmes in key institutions to support the new market structure, and to introduce a trading system for both bulk and retail market operations.
In addition, challenges around non-cost reflective tariffs would need to be tackled. In the past income has not been reflective of production and operational costs due to high capacity and service charges from Independent Power Producers and Emergency Power Producers.
Table 31. ESI Reform Strategy Phases and Timeline
Immediate Term
(Jul 2014-Jun 2015)
Short Term
(Jul 2015 – Jun 2018)
Medium Term
(Jul 2018 – Jun 2021)
Long Term
(Jul 2021- Jun 2025)
Internal Turnaround Partial Vertical Unbundling Complete Vertical Unbundling
Full Vertical and Horizontal Unbundling
a) Establish a Task Force with a mandate to monitor the implementation of the Roadmap
b) Establish a Transformation and Change Management Team (TCMT) at TANESCO to manage the reform process
c) Initiate business processes review
d) Carry out Management Information System Audit
e) Increase electricity connection level from 24% to 30% f) Reducing system losses from 19% to 18% g) Establish separate accounting system for ring fenced units h) Carry out human capital needs assessment
i) Improve TANESCO’s financial performance
j) Review Electricity Act, 2008 including Section 41(6)
k) Institute capacity building programme to key institutions to support the new market structure
a) Unbundling of generation segment from transmission and distribution segments
b) Approving generators to sell electricity directly to bulk off-takers
c) Continue improving TANESCO’s financial performance
d) Designate Independent Market Operator (IMO)
e) Increase electricity connection level from 30% to 33%
f) Reducing system losses from 18% to 16%
g) Setting up a mechanism and rules for the operation of a retail market for electricity by the regulator
h) Establish market
information desk for
mobilization and
dissemination of information
a) Unbundling of distribution from transmission
b) Determine optimal number of zones to be incorporated
c) Strengthen the designated IMO to manage wholesale and retail electricity trading
d) Increase electricity connection level from 33% to 39%
e) Set up a mechanism and rules for the operation of a retail market
f) Reducing system losses from 16% to 14%
g) Provide oversight role for
the retail market while prices
are determined by the market
forces
a) Unbundling distribution segment into several Zonal distribution companies
b) Prepare for listing of generation and distribution companies at the Dar es Salaam Stock Exchange (DSE).
c) Establish ESI standards d) Reducing system losses from 14% to 12%
e) Increase electricity connection levels from 39% to 50%
f) Invest in human capital and
trading systems in
preparation for retail market
operations
SUPPORTING THE PREPARATION OF TANZANIA’S SECOND FIVE YEAR DEVELOPMENT PLAN (FYDP II) 2016/17 – 2021/22
110
l) Develop technology based Standard Power Purchase Agreement (PPA) model
m) Develop Grid Codes to guide transmission and distribution system
n) Designate Grid Control Centre as Independent System Operator (ISO)
Source: ESI Reform Strategy and the Roadmap (2014: Table 5 page 39)
8.4.5 CONCLUSION
It has been well-known for several decades that Tanzania possesses established reserves of natural gas both onshore and in shallow-water fields. Recent exploratory activities have yielded significant finds in the form of new offshore reserves, in the process fundamentally transforming the oil and natural gas landscape in Tanzania. Should the extraction of the offshore natural gas deposits prove to be commercially viable, it could provide a major injection of revenue into Tanzania in the next seven to 10 years. Even so, the anticipated revenues will need to be carefully managed and spent effectively. Emphasis in this regard should be placed on leveraging natural gas revenues to grow the non-resource sectors of the economy, focusing in particular on utilising these revenues for investment in key infrastructure and complementary inputs – such as physical and human capital – that support the development of higher productive sectors and which enhance productivity within existing sectors. The recently enacted Oil and Gas Revenues Management Act provides a sound legal platform from which to ensure that this is achieved, and it will be important that its various safeguard measures are applied effectively and consistently in practice in order to ensure that revenues from the natural gas sector are utilised well to spur growth in other sectors of the economy.
Appropriate macroeconomic management strategies that shield public expenditures from the potentially damaging effects of volatility in the flow of natural gas revenues will also be important. At a general level, this will require a fiscal framework that facilitates the smoothening of natural resource revenue flows and promotes intergenerational equity. Important progress has already been made in this regard with the passing of the Oil and Gas Revenue Management Act, The Tanzania Extractive Industries (Transparency and Accountability) Act and the Petroleum Act. The Government of Tanzania will also need to carefully manage the possible exchange rate effects of large influxes of revenue (or even the expectation of future revenue flows) associated with the sector. This will be critically important if Tanzania is to avoid the trappings of ‘Dutch disease’, where large inflows of foreign currency revenues (or expectations of future inflows) from natural resources cause the domestic currency to appreciate, thereby adversely affecting the price competitiveness of products in other sectors on the export market.
The prospect of a real exchange rate appreciation is not the only potential risk. Earnings from the oil and gas sector can be highly unpredictable due to the volatility of oil and gas prices in global commodity markets. This can generate instability in revenue flows from the sector, with a potentially destabilising impact on public savings and expenditure (Moshi, 2013). In this context, borrowing against expectations of future revenues should be avoided. The Tanzanian authorities will also need to be mindful of the possibility of capital flight in the sector. Finally, the expectation of massive future influxes of revenues from the new discoveries of offshore natural gas deposits may generate a degree of complacency, with attendant negative impacts on governance and fiscal discipline in Tanzania (World Bank, 2011).
The risks associated with these issues are exacerbated by uncertainties around future investment in the natural gas sector and the precise level of revenues that will ultimately flow from the sector into government coffers. These uncertainties arise from the long lead times involved in the exploration and eventual production of natural gas (Adam, 2015). Ultimately, the viability of exploratory and productive activities, and the ensuring value of revenues, will depend on the state of the global gas market and on the evolution of international oil and gas prices (Adam, 2015; World Bank, 2015a).
SUPPORTING THE PREPARATION OF TANZANIA’S SECOND FIVE YEAR DEVELOPMENT PLAN (FYDP II) 2016/17 – 2021/22
111
The Government of Tanzania will also need to make some difficult decisions regarding local gas prices in the face of potentially competing objectives. On the one hand, the sale of gas in the domestic market at a price comparable to the export parity price would provide fiscal room for the government to scale up social spending. At the same time, however, a low price for gas sold domestically is also important for local producers to access inputs. The government will need to carefully consider the trade-offs related to lower versus higher domestic gas prices.
That said, if managed correctly the envisaged revenue yields from Tanzania’s off-shore natural gas deposits can play a significant role in reducing the country’s current reliance on foreign aid and grants. In this sense, the mobilisation of revenues from the sector can contribute to efforts to diversify the sources of development finance at the disposal of the Government of Tanzania, while also providing a potential means to eliminate existing stocks of domestic and external debt (Lunogelo, 2014).
8.5 SUMMARY: A FINANCE AND POLICY FRAMEWORK MATRIX FOR ECONOMIC TRANSFORMATION AND VALUE CHAIN DEVELOPMENT IN LIGHT MANUFACTURING
Table 32 provides a summary matrix of our core proposals on mechanisms and policies to mobilise finance for economic transformation and value chain development in light manufacturing. These are divided into proposals for the tax system, attracting FDI and private capital flows, and the management and utilisation of revenues from the natural gas sector.
Table 32. Summary of proposals to mobilise resources through taxes, FDI and private capital flows for economic transformation and value chain development in light manufacturing
Core area Objective Specific Proposals
The tax system Boost DRM and provide the public goods necessary for industrialisation
Minimise the application of tax exemptions
Combat tax avoidance and tax evasion
Broaden the geographical and sectoral distribution of
the tax base
More effective taxation of the informal sector
Ensure that additional resources
mobilised through the tax system are
used effectively to support economic
transformation and the development
of value chains in light manufacturing
Direct financial resources to eliminate binding
constraints (e.g. infrastructure, chronic electricity
shortages and skills shortages) to development of light
manufacturing
Support access to intermediate inputs for light
manufacturing firms through efficient infrastructure
and lower import barriers
Design a tax system that incentivises
industrialisation
Undertake a fresh review of tax incentives to design a
programme of incentives that is geared towards
nurturing an industrial economy for economic
transformation and human development
Simplify the tax system by reducing the number of
payments that taxpayers are required to make; and
streamline tax compliance processes to make it easier
to pay taxes (for example, by moving ahead with plans
to extend electronic filing to other tax returns (and not
just VAT returns))
Eliminate nuisance taxes and prepare clearer
guidelines on what should and should not be taxed by
LGAs
Tax labour less heavily
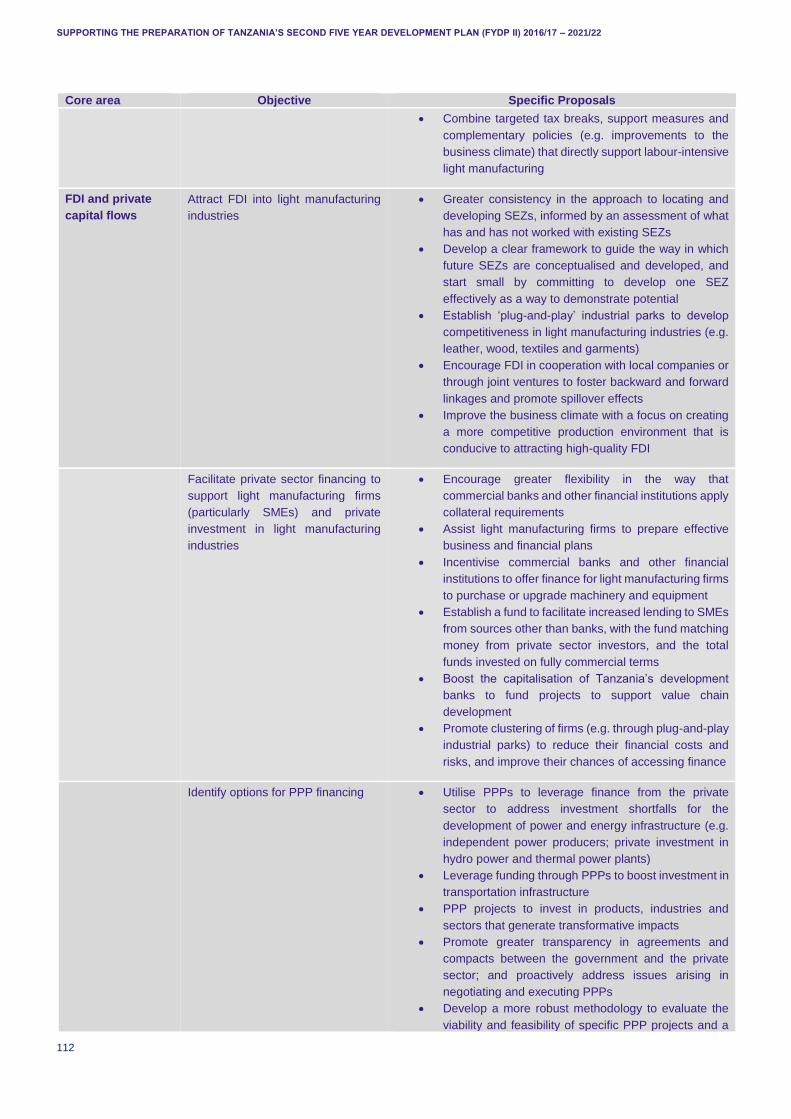
SUPPORTING THE PREPARATION OF TANZANIA’S SECOND FIVE YEAR DEVELOPMENT PLAN (FYDP II) 2016/17 – 2021/22
112
Core area Objective Specific Proposals
Combine targeted tax breaks, support measures and
complementary policies (e.g. improvements to the
business climate) that directly support labour-intensive
light manufacturing
FDI and private
capital flows
Attract FDI into light manufacturing
industries
Greater consistency in the approach to locating and
developing SEZs, informed by an assessment of what
has and has not worked with existing SEZs
Develop a clear framework to guide the way in which
future SEZs are conceptualised and developed, and
start small by committing to develop one SEZ
effectively as a way to demonstrate potential
Establish ‘plug-and-play’ industrial parks to develop
competitiveness in light manufacturing industries (e.g.
leather, wood, textiles and garments)
Encourage FDI in cooperation with local companies or
through joint ventures to foster backward and forward
linkages and promote spillover effects
Improve the business climate with a focus on creating
a more competitive production environment that is
conducive to attracting high-quality FDI
Facilitate private sector financing to
support light manufacturing firms
(particularly SMEs) and private
investment in light manufacturing
industries
Encourage greater flexibility in the way that
commercial banks and other financial institutions apply
collateral requirements
Assist light manufacturing firms to prepare effective
business and financial plans
Incentivise commercial banks and other financial
institutions to offer finance for light manufacturing firms
to purchase or upgrade machinery and equipment
Establish a fund to facilitate increased lending to SMEs
from sources other than banks, with the fund matching
money from private sector investors, and the total
funds invested on fully commercial terms
Boost the capitalisation of Tanzania’s development
banks to fund projects to support value chain
development
Promote clustering of firms (e.g. through plug-and-play
industrial parks) to reduce their financial costs and
risks, and improve their chances of accessing finance
Identify options for PPP financing Utilise PPPs to leverage finance from the private
sector to address investment shortfalls for the
development of power and energy infrastructure (e.g.
independent power producers; private investment in
hydro power and thermal power plants)
Leverage funding through PPPs to boost investment in
transportation infrastructure
PPP projects to invest in products, industries and
sectors that generate transformative impacts
Promote greater transparency in agreements and
compacts between the government and the private
sector; and proactively address issues arising in
negotiating and executing PPPs
Develop a more robust methodology to evaluate the
viability and feasibility of specific PPP projects and a
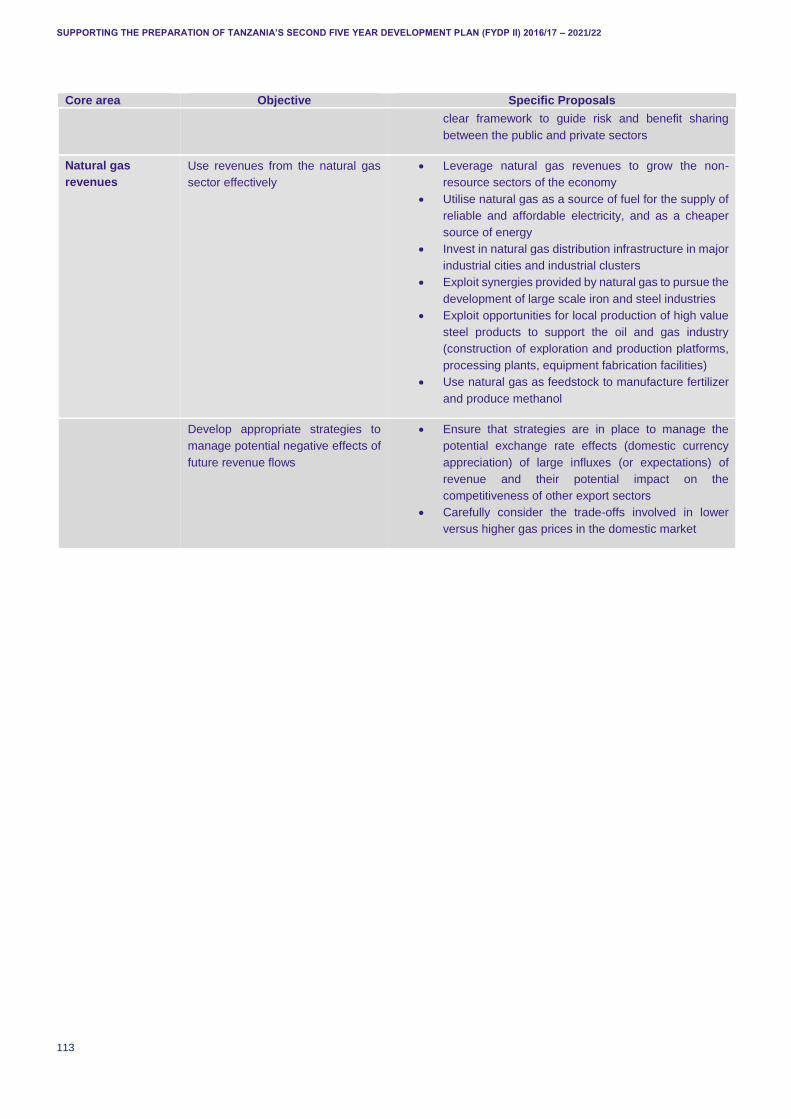
SUPPORTING THE PREPARATION OF TANZANIA’S SECOND FIVE YEAR DEVELOPMENT PLAN (FYDP II) 2016/17 – 2021/22
113
Core area Objective Specific Proposals
clear framework to guide risk and benefit sharing
between the public and private sectors
Natural gas
revenues Use revenues from the natural gas
sector effectively
Leverage natural gas revenues to grow the non-
resource sectors of the economy
Utilise natural gas as a source of fuel for the supply of
reliable and affordable electricity, and as a cheaper
source of energy
Invest in natural gas distribution infrastructure in major
industrial cities and industrial clusters
Exploit synergies provided by natural gas to pursue the
development of large scale iron and steel industries
Exploit opportunities for local production of high value
steel products to support the oil and gas industry
(construction of exploration and production platforms,
processing plants, equipment fabrication facilities)
Use natural gas as feedstock to manufacture fertilizer
and produce methanol
Develop appropriate strategies to
manage potential negative effects of
future revenue flows
Ensure that strategies are in place to manage the
potential exchange rate effects (domestic currency
appreciation) of large influxes (or expectations) of
revenue and their potential impact on the
competitiveness of other export sectors
Carefully consider the trade-offs involved in lower
versus higher gas prices in the domestic market
SUPPORTING THE PREPARATION OF TANZANIA’S SECOND FIVE YEAR DEVELOPMENT PLAN (FYDP II) 2016/17 – 2021/22
114
9. POLICY PREPAREDNESS AND WAYS OF WORKING
9.1 PRIORITY POLICY AND FINANCE AREAS
Both the analysis of the broader policy suggestions in Chapter 7 and the policy suggestions around mobilising and using finance for nurturing an industrial economy for economic transformation and human development in Chapter 8 clearly suggest a number of common priority themes. In order to nurture an industrial economy, the reviewed studies and consultations suggest Tanzania will need to prioritise the following five areas:
Infrastructure development. Developing all the infrastructure elements of transport corridors for agriculture and agri-processing; getting the energy infrastructure (both soft and hard) right seems an absolute priority for industrialisation in the coming five years when the offshore gas sector is also going to be developed.
Human capital development. Promoting appropriate skill (incl. management skill) levels and technology development in target sectors;
Finance. Improving domestic resource mobilisation for industrialisation, including raising tax revenues whilst encouraging industrialisation and developing capital markets by raising capital for productive activities;
Investment climate. Stepping-up efforts to reform the regulatory framework around targeted areas such as energy markets; non-income taxes on labour; port efficiency, and
Industrial and FDI policy. Developing a limited set of SEZs and cluster formation for attracting FDI that can build human and technological capabilities and produce higher quality manufacturing products (e.g. through developing SEZs and promoting clusters of firms).
However, discussing a consensus around priority sectors and priority policy and finance areas does not guarantee that the required actions are taken. This chapter further unpacks this and first highlights the challenges of implementing industrial policy (9.2) and then considers different ways of moving forward (9.3-9.4). Section 9.5 summarises the main issues and considers how the areas above can be tackled.
9.2 THE CHALLENGES OF IMPLEMENTING INDUSTRIAL POLICY IN TANZANIA
Since the late 1990s, Tanzania has been experiencing a significant growth acceleration. The main sources of which have been in minerals, tourism, services and foreign aid. More recently, there has been some growth in manufacturing, and even manufacturing exports. Nevertheless, the size of the manufacturing sector remains comparatively small, and it is not clear that these gains are sustainable. Although more research is needed, anecdotal evidence suggests that some of the growth has come from shielding domestic firms behind tariff barriers, and/or granting particularistic favours and exemptions. This would not be a sustainable solution.
If we look at the history of industrial policy in Tanzania (see also Chapter 2), in fact, we find a series of disappointments. In the 1970s the country used a protected parastatal sector to try and build up an industrial base, but by the end of that decade, many of its firms were producing way under capacity, mired in debt, and acting as a serious drain on state resources. Although the external environment was doubtless a contributing factor, there were also problems of mismanagement and corruption, signalling a failure of the bureaucracy to effectively discipline the use of industrial policy rents (which is needed for growth as Appendix J shows). This remained true in some cases well into the 1980s, with firms or firm managers using their influence with the bureaucracy to continue receiving rents, even when the prospects of them using them efficiently appeared slim (Coulson, 1979, 1982; Gray, 2013; Kelsall, 2013).
SUPPORTING THE PREPARATION OF TANZANIA’S SECOND FIVE YEAR DEVELOPMENT PLAN (FYDP II) 2016/17 – 2021/22
115
In the 1990s, attention shifted to supporting a new large scale mining sector. A handful of large players were attracted to Tanzania with the help of generous land grants and tax write-offs. However, the government has not always been consistent in its support of the sector. Not only has it faced difficulties in ensuring that the exemptions to which firms are legally entitled are efficiently dealt with by the tax administration and customs, it has also changed policy by renegotiating deals with big companies (Cooksey and Kelsall, 2011). The issue we highlight is inconsistency in policy implementation.
Horticulture and floriculture have also seen significant growth in recent years, yet there is a sense that they have underperformed. Although the government has made land available for private investors, in practice it has often failed to protect their use rights to that land. In addition, there have been deficiencies in supporting infrastructure and logistics services (Cooksey and Kelsall, 2011).
Tourism has been something of a success story in Tanzania, with room for future expansion. However, the industry faces considerable human resource constraints, and in recent years the destruction of the country’s wildlife resources through poaching has reached very high levels. As in the case of many countries, the government has found it very difficult to control poaching, in part due to its inability to discipline powerful economic agents and lower level officials.
In the 2000s, attempts were made to massively expand rice production with the help of irrigation infrastructure and tariff barriers. However, results have been disappointing. Many of the local councils entrusted with building that infrastructure have failed to maintain it well, while high prices for rice have been undermined by smuggling through the ‘Zanzibar route’. This further demonstrates an inability to use industrial policy rents in a disciplined way (Therkilsden 2011). Efforts have also been made to establish SEZs in Tanzania, but these have faced challenges. Some of the zones have not benefited from the high quality infrastructure and administration integral to their successful functioning. Meanwhile, some of the firms located outside the zones granted special economic privileges under the policy, have failed to fulfil their obligations to export (Gray 2013). That said, there are now some promising Chinese and Singaporean firms locating in SEZs around garments.
Another challenge has been the misuse of rents in the energy sector, with corruption scandals surrounding the commissioning of emergency power plants, leading to ongoing electricity shortages and the loss of billions of shillings of public money (Cooksey, 2002, 2008; Cooksey and Kelsall, 2011; Cooksey, 2011; Gray, 2015).
The challenges faced in the implementation of industrial policy reflect a number of features of Tanzania’s political settlement.37 There are three very salient points to note here. First, until relatively recently, private industrialists have not been a significant part of the ‘dominant coalition’. The industrial sector at Independence was tiny, dominated by foreign capital and Tanzanian Asians, and it did not play a significant role in the nationalist movement. As such, it lacked political legitimacy, and became the target of nationalisations in the Arusha Declaration of 1967. Consequently, the kinds of mutual interest between political power and private capital that characterised other, more developmental states, did not emerge in Tanzania (Therkilsden and Bourgouin 2012).
Even after the privatisations of the 1980s and 1990s, industrialists have lacked legitimacy and have tended to keep a low profile. Despite the existence of several donor funded business associations, business has not had a strong collective voice, and industrialists pursue their interests by means of particularistic, ‘closed deals’ with government, as opposed to transparent, ordered deals. Recently, a few high profile indigenous African businessmen have risen to prominence and some of them have headed business associations. They have excellent networks, and it is unclear how far they represent the collective interests of business in general. A new class of emerging African businesspeople, often the foreign educated scions of the
37 A ‘political settlement’ can be defined as, ‘the formal and informal processes, agreements, and practices that help consolidate politics, rather than violence, as a means for dealing with disagreements about interests, ideas and the distribution and use of power’ Edward Laws and Adrian Leftwich, 'Political Settlements. Dlp Concept Brief 01', (University of Birmingham: Developmental Leadership Project, 2014)
SUPPORTING THE PREPARATION OF TANZANIA’S SECOND FIVE YEAR DEVELOPMENT PLAN (FYDP II) 2016/17 – 2021/22
116
politico-bureaucratic class is also on the rise, but it is too early to assess its political potential (Therkilsden and Bourgouin 2012).
The second point to note is that Tanzania’s political settlement comprises a number of different centres of power and influence (as is the case in other countries, perhaps more so). Although at a macro level it appears to represent a balance of power between politicians, bureaucrats and the military, reaching out to their supporters in the cities and the countryside, at a more granular level it appears to be comprised of several cross-cutting networks all in competition for power, money and influence. This has undermined the strength of the political centre in Tanzania. In particular, leaders have, in the past, failed to prevent powerful colleagues from engaging in corruption in strategic sectors of the economy, and they have also failed to ensure that bureaucrats follow regulations with consistency. This explains the mixed record on nurturing an industrial economy described above. Tanzanian governments have been unable to use industrial policy rents in the best possible growth enhancing way (Gray, 2013, 2015; Kelsall, 2013; Therkilsden and Bourgouin, 2012).
The third point to note is that the introduction of multi-party democracy has exacerbated these trends. Multi-partyism has raised the cost of elections, both in terms of the resources that are required to motivate local party cadres and bureaucrats to get out the vote, and the resources that must be channelled to constituencies. A key source of these additional revenues appears to be party donations by well-connected businessmen, and suggestions of corruption. In this context, industrial rents are too much diverted towards short-term election financing rather than long term development. Although there are also pressures pushing in the opposite direction, for example mass media exposure of corruption scandals and calls for the ruling party to get its house in order, and although recent months have seen some progress, the ability of Tanzania to implement a forward-thinking industrial policy remains to be seen (Gray, 2013, 2015; Kelsall, 2013; Therkilsden and Bourgouin, 2012).
Tanzania’s emerging status as a future petro-state provides opportunities but also challenges. The coming on stream of large scale petro rents in a few years’ time will provide a potential investment fund to stimulate industrial development, both around petro-chemicals and in less directly related industries. However, in most African countries this has not happened, and petrodollars have instead unbalanced macroeconomies and encouraged ruling elites to neglect the development of agriculture and manufacturing (Lewis, 2007). Unless innovative institutional arrangements are developed around the use of oil rents, we can expect the growth of this industry to generate negative feedback loops with the rest of the economy, damaging the prospects for more dynamic and inclusive growth.
Taken together, these trends have created a situation in which industrial policy in Tanzania does not always reach its intended aims. The government lacks both the vertical and horizontal coordination capacity to make large-scale changes in the fundamentals that affect investment. It has found it difficult to secure consensus about the importance of such fundamentals, and to ensure the compliance of government officials in implementing them. In some cases, the business community has been left to negotiate deals with government on a one to one basis. These problems must be added to, and indeed are bound up with the fact, that the ideological attitude toward private business, especially owned by foreigners or non-indigenous Tanzanians, remains ambivalent: the legacy of Julius Nyerere’s economic nationalism remains strong. Consequently, even a more targeted form of industrial policy, for example encouraging FDI in a particular light manufacturing sector, or the creation of a world-class SEZ, is likely to be challenging (Therkilsden and Bourgouin, 2012). Another way of putting this is to say Tanzania’s policy preparedness is low, in the sense that the objective institutional conditions for the successful implementation of an ambitious five year plan that aims to nurture an industrial economy may not exist.
It is not all doom and gloom, however, and the following sections provide some suggestions for how Tanzania can find a way out of the current implementation impasse.
SUPPORTING THE PREPARATION OF TANZANIA’S SECOND FIVE YEAR DEVELOPMENT PLAN (FYDP II) 2016/17 – 2021/22
117
9.3 MOVING FORWARD
In October, Tanzania elected a new President with a reputation for getting things done. Prior to the election, some politicians associated with corruption scandals were sidelined. Since the election, President Magufuli has moved quickly to reduce non-essential public expenditure by, for example, banning non-essential travel by government officials, reducing the number of officials deployed on essential foreign trips, banning government events in privately owned hotels, and cutting down on state events, dinners and luncheons. The new government has also placed greater emphasis on boosting domestic revenue collections with a view to moving away from donor dependency. On the back of moves to boost tax compliance, including a commitment to closing loopholes, legally enforcing the payment of unpaid taxes by businesses, and improved monitoring, tax collections in Tanzania hit a record high – at TSh 1.4 trillion – in December 2015, representing the largest monthly amount collected by the TRA since it was established. This has been accompanied by renewed vigour in efforts to eradicate barriers to the mobilisation of domestic financial resources, including by cracking down on corruption. For example, several senior TRA officials were suspended in November 2015 following the revelation that TSh 80 billion in tax revenue had been lost due to unpaid taxes on 349 cargo containers at Dar es Salaam Port (Mwangonde and Mwalimu, 2015). This is part of the new government’s broader efforts to address the problem of pervasive tax evasion, which is said to have cost the government billions of shillings in revenue.
It is clear that in the short period since the election much has been achieved, but it is too early to say whether this conclusively represents the triumph or a ‘clean government’ faction, or whether the factional conflicts of the past are now behind it. However, it at least presents a window of opportunity for a new, stronger, more implementation focused central leadership. One thing is certain; a successful industrial policy in Tanzania will require absolutely determined and tireless leadership.
As described in Appendix J, cutting edge political economy analysis suggests that moving from growth acceleration, which Tanzania is already experiencing, to growth maintenance, of which Tanzania is on the cusp, involves moving beyond support for particular firms towards creating pockets of bureaucratic effectiveness and strong state-business relations at the sectoral level. Political economy analysis also suggests that sectors that target competitive export markets, or that involve smallholders or SMEs, are most likely to create positive feedback loops with the wider institutional environment for business. The foregoing economic analysis has shown that there are a number of sectors which both fulfil these criteria and have good developmental potential in Tanzania. However, creating these pockets of effectiveness will often involve strengthening vertical chains of intra-ministerial accountability and inter-ministerial coordination. The state needs to become strong enough to both help business, and discipline it. This implies a new way of working.
9.4 DOING PLANNING AND DEVELOPMENT DIFFERENTLY
Although section 9.1 suggests there is quite a consensus on what needs to happen in Tanzania for it to be able to sustain growth, it is much less clear about how to make it happen. History has shown that doing industrial policy effectively in Tanzania is very difficult, and it has also provided some reasons for why it is difficult. We know that in order to implement industrial policy effectively, the political will to do so needs to be strengthened (see Appendix J for a discussion on effective industrial policy). Moreover, the mechanisms that will translate that political will into action also need to be strengthened. This will doubtless involve fighting ongoing battles against vested political and economic interests, unhelpful ideologies and bureaucratic inertia. An effective industrial policy in Tanzania will create winners and losers. Any solution, therefore, must be politically smart. Moreover, old-style planning for success will not do. Old-style planning works where the context is stable, the problem is simple and the intervention is simple; and where leaders have sufficient control over resource allocation decisions. In other words, when we understand the political and operational context, know how to influence it, and, moreover, understand the problem and how to solve it.
SUPPORTING THE PREPARATION OF TANZANIA’S SECOND FIVE YEAR DEVELOPMENT PLAN (FYDP II) 2016/17 – 2021/22
118
In Tanzania, as in many countries, it is hard to know exactly how to increase the legitimacy of private sector led economic growth, especially when some of the most obvious beneficiaries of that growth will be foreign firms and investors. There will be a range of vested interests surrounding particular economic sectors, and even when these are known, it is not easy to imagine a way forward. Further, there is no blue print for getting ministries to work together better, or getting lower level civil servants to do their jobs more effectively. Moreover, there is no perfect foresight on all the problems and obstacles of a technical or logistical nature that will affect the attempts to promote a particular sector. Consequently it is important to transition from a more conventional notion of development planning according to blueprints, to one of searching for solutions.
Another way of saying this is that industrial policy in Tanzania needs to become more problem-driven, iterative, and adaptive (Andrews, 2013). If the problem is that Tanzania needs to be able to build a world-class SEZ, it is not sufficient to have a plan to solve that problem and then expect everything to fall into place. One may start with a loose plan, but the plan should change as the implementers come to understand more about the problem, as new problems arise, and new solutions present themselves. Implementers need to be empowered to be creative, at the same time as being accountable.
Much has been written recently about what a problem-driven, iterative development approach (PDIA) looks like (Andrews et al., 2015; Barder, n.d.; Wild et al., 2015). Thinking has also taken place on what a monitoring and evaluation strategy for PDIA programmes would look like (Pritchett et al., 2013). In essence, an M&E strategy that is fit for the 21st century complements a set of targets and monitoring for compliance with experimenting. For example, it would experiment within the parameters of the programme design, evaluate feedback at frequent intervals, and scale up or scale down approaches accordingly. In other words, policy-makers make a number of small bets on what will work, and then follow signs of success with bigger bets, in much the same way as economic entrepreneurs do. This is not to say that all bets should be in safe areas. Sometimes, if the potential rewards are high enough, it will be worth placing a bet in a risky area, that is an area where the challenges appear large, and the probability of success small. However, a prudent approach is to adopt a mixed portfolio, with some safer and some more risky bets.
In addition, since many of the problems implementers encounter will have a political as well as a technical dimension, they must be politically savvy (Booth and Unsworth, 2014). Problem driven political economy analysis should be embedded as part of the programme methodology – not as something to be done at the outset of a programme and then left on the shelf, as often happens – but something that is done and updated on an ongoing basis. Implementers need to know who stands to gain or lose from a particular policy or programme, what their political strengths are, how potential spoilers can be brought on board or circumvented, how alliances between potential winners can be forged, and so on. And they need to be aware that the factions in favour or opposition to a policy may be constantly shifting, so that strategy needs to be revised and updated in real time. They also need to know that first-best technical solutions may simply be unfeasible in the current political context, and that second or third best solutions may have to be found.
There is already a programme in the Tanzanian government that is working in a self-consciously problem-driven, adaptive way. It is called Big Results Now (BRN). BRN will be discussed further in Appendix K of this report, but suffice to say that with some adaptation, the PDB/BRN would appear to be a potential vehicle for implementing some key areas of FYDP II.
SUPPORTING THE PREPARATION OF TANZANIA’S SECOND FIVE YEAR DEVELOPMENT PLAN (FYDP II) 2016/17 – 2021/22
119
9.5 SUMMARISING PRIORITIES AND WAYS OF WORKING
The analysis in this chapter, the discussion in Appendix J and in the writing of the MOFP itself,38 indicate that there are a range of characteristics of effective industrial policy as well as characteristics of institutions (e.g. SBRs) behind good policy for transformation.
Leadership is crucial. Whilst economic transformation was embedded in the language of speeches of the incumbent president, the implementation has involved multiple initiatives (BRN, as well as other initiatives) and different private sector associations at different times (the TPSF, the National Business Council, others). It is crucial that the new President leads from the start, maps a clear path forward and works with various stakeholders.
Inter-agency / ministerial co-ordination within government. The next FYDP will need to be implemented with coherence. Dinh and Monga (2013) suggest that the MOFP needs to be in charge of the co-ordination of planning. But other ministries (e.g. trade and industry, or the revenue authority) also have a stake. It is therefore important that the President and the MOFP have the power to discipline other agencies. Coherence is not always adhered to. For example, VAT and import duty exemptions granted by the Ministry of Finance through the Tanzania Investment Centre (TIC) were not always honoured by the TRA or Customs (Kelsall et al., 2013), suggesting there is a lack of coherence in implementation, which often results in failure to deliver intended benefits and creates uncertainty for potential investors.
Trust amongst stakeholders is essential, but it is sometimes lacking. The consultations as well as historical considerations presented in this report suggest there is still distrust and a lack of reciprocity between public and private sectors in Tanzania. This has been tempered to some extent through recent efforts to build trust between the government and the private sector, especially through the Tanzania National Business Council and the Tanzania Investors Round Table forum. Even so, it will be important to continue to build this trust and to institutionalise effective state-business relations. Page (2013) discusses the challenges with the President’s Advisory Council in Tanzania, working through the Tanzania National Business Council. The Council in Tanzania was least effective, as between 2002-2009 35 reforms were undertaken through the council in Uganda, 18 Ghana, 10 in Senegal and only 5 in Tanzania. Many of the proposed investment and policy changes at the sector level have not been undertaken or delayed.
Similarly, demonstrable efforts to build trust between the international donor community and the Government of Tanzania are also required. With the election of a new President in October 2015, the government is well placed to re-energise relations with the international donor community and encourage greater coordination among donors.
Tanzania lacks enough good collaborative projects between relevant stakeholders, perhaps because SBRs are not sufficiently institutionalised. A task force to deal with the financial crisis in 2008-2010, and the TRA process to raise tax to GDP ratios have been suggested as good examples, but there are many examples of failed collaborations. For example, one stakeholder suggested that the previous five year plan would involve specific PPPs in energy distribution but they never materialised. Further, Kelsall et al. (2013) discuss the lack of collaborative action on the part of government to support horticulture in seeking adequate transport arrangements (unlike e.g. Kenya), land and water rights, taxation and credit. The absence of such collaborations are missed opportunities and need to be rectified in the approach of the next five year plan.
Policy inconsistency is an issue in Tanzania. In broad terms, this impacts negatively on the delivery of public services which, in turn, can influence the potential for transformation via the labour supply and, more generally, undermine human development. Policy inconsistency may also have more specific
38 Mpango, P. (2013) Socio-Economic Transformation for Poverty Reduction: Eight Key Messages for Unlocking Tanzania’s Potential, REPOA Brief. Dar es Salaam: REPOA.

SUPPORTING THE PREPARATION OF TANZANIA’S SECOND FIVE YEAR DEVELOPMENT PLAN (FYDP II) 2016/17 – 2021/22
120
sectoral impacts. Kelsall et al. (2013) discuss the example of the gold sector. At first the sector featured regulations that were seen as international best practice, but a new act and problems around mining rights dampened interest in the mining sector. Further, the TRA does not always adhere by conditions in agreements according to stakeholders. As a further example, DFID (2015) argue that there is some reform fatigue in recent years, having improved the business environment earlier on. It is important that the new President restarts the emphasis on business environment reforms.
As argued in this Chapter, learning, experimenting and adaptive development is a more promising way forward for implementation compared to old style planning that set targets on objectives alone.
We can apply these important principles in the case of the priority policy areas. For each policy area, Table 33 presents potential projects, possible technical and political economy issues that might arise in their implementation, and suggestions on potential responses and ways of working to deal with these issues. The table also suggests a range of new National Key Results Area (NKRAs).
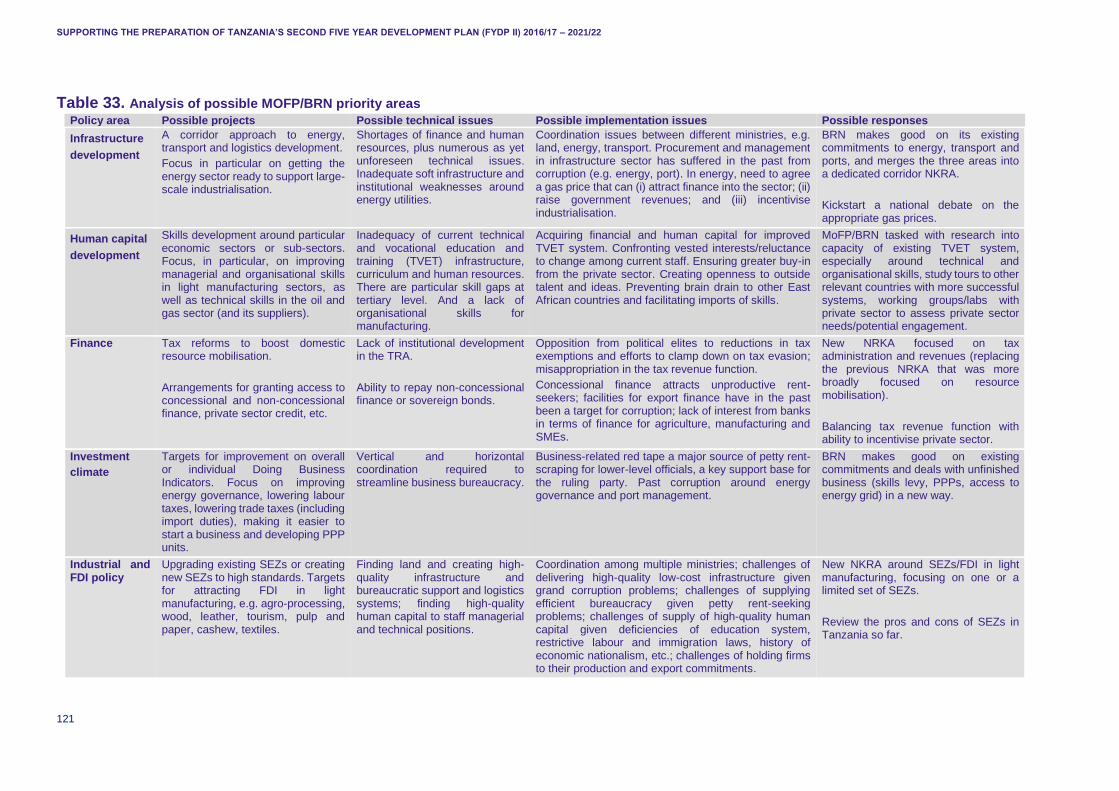
SUPPORTING THE PREPARATION OF TANZANIA’S SECOND FIVE YEAR DEVELOPMENT PLAN (FYDP II) 2016/17 – 2021/22
121
Table 33. Analysis of possible MOFP/BRN priority areas
Policy area Possible projects Possible technical issues Possible implementation issues Possible responses
Infrastructure
development
A corridor approach to energy, transport and logistics development.
Focus in particular on getting the energy sector ready to support large-scale industrialisation.
Shortages of finance and human resources, plus numerous as yet unforeseen technical issues. Inadequate soft infrastructure and institutional weaknesses around energy utilities.
Coordination issues between different ministries, e.g. land, energy, transport. Procurement and management in infrastructure sector has suffered in the past from corruption (e.g. energy, port). In energy, need to agree a gas price that can (i) attract finance into the sector; (ii) raise government revenues; and (iii) incentivise industrialisation.
BRN makes good on its existing commitments to energy, transport and ports, and merges the three areas into a dedicated corridor NKRA.
Kickstart a national debate on the appropriate gas prices.
Human capital
development
Skills development around particular economic sectors or sub-sectors. Focus, in particular, on improving managerial and organisational skills in light manufacturing sectors, as well as technical skills in the oil and gas sector (and its suppliers).
Inadequacy of current technical and vocational education and training (TVET) infrastructure, curriculum and human resources. There are particular skill gaps at tertiary level. And a lack of organisational skills for manufacturing.
Acquiring financial and human capital for improved TVET system. Confronting vested interests/reluctance to change among current staff. Ensuring greater buy-in from the private sector. Creating openness to outside talent and ideas. Preventing brain drain to other East African countries and facilitating imports of skills.
MoFP/BRN tasked with research into capacity of existing TVET system, especially around technical and organisational skills, study tours to other relevant countries with more successful systems, working groups/labs with private sector to assess private sector needs/potential engagement.
Finance Tax reforms to boost domestic resource mobilisation.
Arrangements for granting access to concessional and non-concessional finance, private sector credit, etc.
Lack of institutional development in the TRA.
Ability to repay non-concessional finance or sovereign bonds.
Opposition from political elites to reductions in tax exemptions and efforts to clamp down on tax evasion; misappropriation in the tax revenue function.
Concessional finance attracts unproductive rent-seekers; facilities for export finance have in the past been a target for corruption; lack of interest from banks in terms of finance for agriculture, manufacturing and SMEs.
New NRKA focused on tax administration and revenues (replacing the previous NRKA that was more broadly focused on resource mobilisation).
Balancing tax revenue function with ability to incentivise private sector.
Investment
climate
Targets for improvement on overall or individual Doing Business Indicators. Focus on improving energy governance, lowering labour taxes, lowering trade taxes (including import duties), making it easier to start a business and developing PPP units.
Vertical and horizontal coordination required to streamline business bureaucracy.
Business-related red tape a major source of petty rent-scraping for lower-level officials, a key support base for the ruling party. Past corruption around energy governance and port management.
BRN makes good on existing commitments and deals with unfinished business (skills levy, PPPs, access to energy grid) in a new way.
Industrial and FDI policy
Upgrading existing SEZs or creating new SEZs to high standards. Targets for attracting FDI in light manufacturing, e.g. agro-processing, wood, leather, tourism, pulp and paper, cashew, textiles.
Finding land and creating high-quality infrastructure and bureaucratic support and logistics systems; finding high-quality human capital to staff managerial and technical positions.
Coordination among multiple ministries; challenges of delivering high-quality low-cost infrastructure given grand corruption problems; challenges of supplying efficient bureaucracy given petty rent-seeking problems; challenges of supply of high-quality human capital given deficiencies of education system, restrictive labour and immigration laws, history of economic nationalism, etc.; challenges of holding firms to their production and export commitments.
New NKRA around SEZs/FDI in light manufacturing, focusing on one or a limited set of SEZs.
Review the pros and cons of SEZs in Tanzania so far.
SUPPORTING THE PREPARATION OF TANZANIA’S SECOND FIVE YEAR DEVELOPMENT PLAN (FYDP II) 2016/17 – 2021/22
122
10. TARGETS, MONITORING AND LEARNING IN FYDP II
The design of a plan to nurture an industrial economy is strengthened by having measurable targets which can be followed up for action and which can form the basis for learning and adaptive development. This report provides an initial discussion of possible targets which could be discussed wider.
Tanzania has long had a broad vision of becoming a diversified semi-industrialised economy with a substantial industrial sector. It has developed three five-year plans to guide this, with the first plan coming to an end, and the second, aiming at nurturing an industrial economy for economic transformation and human development, is being formulated with a view to starting later this year. A number of strategies have supported the implementation of these plans. These policy documents have highlighted desirable aspects, targets and factors behind industrialisation and economic transformation.
The analysis in this paper shows it is essential to define three types of targets for:
What is the overall objective: Aspects of economic transformation
What needs to be tackled: Policies that remove constraints towards further economic transformation
Making it happen: Ways of working and institutional contexts The FYDP II should not only consider ultimate targets on economic transformation but also short to medium targets for action to achieve them, including actions to make it happen (improve the policy preparedness and clarity around the institutional contexts). Objectives Aspects of economic transformation include targets for:
Shares of manufacturing and high productivity services in the economy
Labour productivity (by sector), value addition per employee
Employment in high productivity activities
Percentage of goods within a particular sector that are exported in a raw, semi-processed and wholly processed state (this could be explored using UNIDO data)
Value addition percentage
High technology exports (as a % of total exports)
Export diversification Table 34 provides an initial discussion of these targets. It focuses mostly on economic transformation at the aggregate level (apart from the target on manufacturing). Chapter 5 suggested a three-pronged approach towards prioritising sectors:
1. Activities that use Tanzania’s resources: traditional activities such as sisal, fish and gold; and promising activities such as natural gas, vegetables, uranium and soda ash. Some sectors generate significant jobs, others export revenues;
2. Activities that increase value added through agro-processing and manufacturing, such as processing of cashew, leather, fruit and nuts and the production of wood and paper products, and garments, with machinery, detergents and chemicals, and automotive assembly as strategic bets. Some of these help increase Tanzania’s value-addition; others help raise its productivity and productive capacity;
3. Fast-growing services sector activities such as tourism and trade, with tourism creating foreign exchange and jobs and trade supporting other industries.
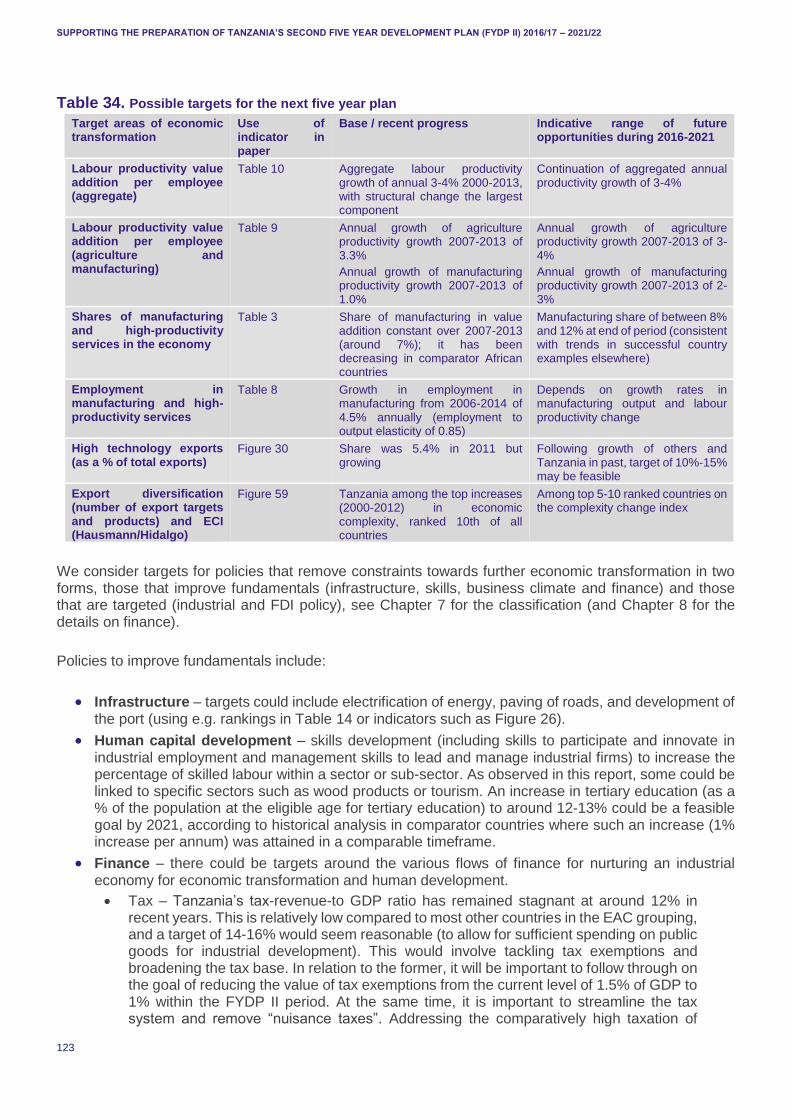
SUPPORTING THE PREPARATION OF TANZANIA’S SECOND FIVE YEAR DEVELOPMENT PLAN (FYDP II) 2016/17 – 2021/22
123
Table 34. Possible targets for the next five year plan
Target areas of economic transformation
Use of indicator in paper
Base / recent progress Indicative range of future opportunities during 2016-2021
Labour productivity value addition per employee (aggregate)
Table 10 Aggregate labour productivity growth of annual 3-4% 2000-2013, with structural change the largest component
Continuation of aggregated annual productivity growth of 3-4%
Labour productivity value addition per employee (agriculture and manufacturing)
Table 9 Annual growth of agriculture productivity growth 2007-2013 of 3.3%
Annual growth of manufacturing productivity growth 2007-2013 of 1.0%
Annual growth of agriculture productivity growth 2007-2013 of 3-4%
Annual growth of manufacturing productivity growth 2007-2013 of 2-3%
Shares of manufacturing and high-productivity services in the economy
Table 3 Share of manufacturing in value addition constant over 2007-2013 (around 7%); it has been decreasing in comparator African countries
Manufacturing share of between 8% and 12% at end of period (consistent with trends in successful country examples elsewhere)
Employment in manufacturing and high-productivity services
Table 8 Growth in employment in manufacturing from 2006-2014 of 4.5% annually (employment to output elasticity of 0.85)
Depends on growth rates in manufacturing output and labour productivity change
High technology exports (as a % of total exports)
Figure 30 Share was 5.4% in 2011 but growing
Following growth of others and Tanzania in past, target of 10%-15% may be feasible
Export diversification (number of export targets and products) and ECI (Hausmann/Hidalgo)
Figure 59 Tanzania among the top increases (2000-2012) in economic complexity, ranked 10th of all countries
Among top 5-10 ranked countries on the complexity change index
We consider targets for policies that remove constraints towards further economic transformation in two forms, those that improve fundamentals (infrastructure, skills, business climate and finance) and those that are targeted (industrial and FDI policy), see Chapter 7 for the classification (and Chapter 8 for the details on finance).
Policies to improve fundamentals include:
Infrastructure – targets could include electrification of energy, paving of roads, and development of the port (using e.g. rankings in Table 14 or indicators such as Figure 26).
Human capital development – skills development (including skills to participate and innovate in industrial employment and management skills to lead and manage industrial firms) to increase the percentage of skilled labour within a sector or sub-sector. As observed in this report, some could be linked to specific sectors such as wood products or tourism. An increase in tertiary education (as a % of the population at the eligible age for tertiary education) to around 12-13% could be a feasible goal by 2021, according to historical analysis in comparator countries where such an increase (1% increase per annum) was attained in a comparable timeframe.
Finance – there could be targets around the various flows of finance for nurturing an industrial economy for economic transformation and human development.
Tax – Tanzania’s tax-revenue-to GDP ratio has remained stagnant at around 12% in recent years. This is relatively low compared to most other countries in the EAC grouping, and a target of 14-16% would seem reasonable (to allow for sufficient spending on public goods for industrial development). This would involve tackling tax exemptions and broadening the tax base. In relation to the former, it will be important to follow through on the goal of reducing the value of tax exemptions from the current level of 1.5% of GDP to 1% within the FYDP II period. At the same time, it is important to streamline the tax system and remove “nuisance taxes”. Addressing the comparatively high taxation of
SUPPORTING THE PREPARATION OF TANZANIA’S SECOND FIVE YEAR DEVELOPMENT PLAN (FYDP II) 2016/17 – 2021/22
124
labour will also be important, and this could be achieved by reducing the skills and development levy from the current level of 5% to between 1% and 2%.
Domestic credit – judging by experience in other countries, a target could include to increase domestic credit to the private sector (currently around 14% of GDP) to approximately 20% by 2021 (Figure 29). There could be more general targets for the development of capital markets.
Gross fixed capital formation – It increased from 25% in 2009 to 29% of GDP in 2013, and maintaining a 25% ratio in the coming five years would be good. But a larger share should go to manufacturing.
International private capital – FDI flows have been at 4% of GDP recently, which should be continued, but too little is going to the manufacturing sector. Greater flows of FDI are needed into labour intensive manufacturing industries such as garments, and to spur activity in new areas such as automotive assembly, the manufacture of glass, production of detergents and industrial chemicals.
Development finance and ODA – development banks could be strengthened and aid could be used to support human capital, infrastructure, boost tax revenue collection and develop local capital markets.
Natural gas revenues – much work will need to be done to identify an appropriate range for domestic gas prices that is high enough to to provide fiscal room for increased social spending and encourage investors in the industry, but that is low enough that local producers can access energy inputs.
Investment climate – a desired target rank (or change in ranking) for Doing Business indicators or rankings in relation to other countries, although it might be better to have a target for individual indicators. For example, given Tanzania’s identified binding constraints on transportation the following indicators could be best targeted:
Time to export: Potential feasible target between 12 and 15 days (Figure 26)
Cost to export: Reduce cost from USD1,009 to USD600 – USD800 in line with more competitive comparator countries.
Documents to export: Reduce required documents from 11 to 8 in line with more competitive comparator countries.
More targeted policies include:
Industrial policy. This could include developing a limited set of SEZs (around certain products and regions). There are already planned or existing SEZs in Bagamoyo (with a port), Mtwara (around gas, e.g. fertilizer, petrochemical and cement companies), Kigoma (focused on processed manufacturing, regional trade), with others planned (Mwanza, Kagera ,Mara, Manyara, Shinyango, Arusha, Kilimanjaro, Tanga, Lindi, Ruvuma, Mbeya, Iringa, Tabora, Rugwa). By 2013, SEZs promoted 26,000 direct jobs, and 200, 000 indirect jobs, with an investment of USD 1.2 bn, and exports of USD 0.5 bn. It is already focusing on agroprocessing (32%), engineering (37%), mineral processing (18%) and textile (13%). There could be a target on the % of planned SEZs in operation by 2021 i.e. 80%. At the same time there should be a discussion on pros and cons of existing SEZ activity.
FDI policy. This could include targets on attracting FDI in light manufacturing (see above under finance).
Targets for appropriate ways of working and institutional settings need to a range of general principles:
Leadership: it is important to keep an emphasis on the overall development vision for the next FYDP so that agencies can be disciplined and cohered around a set of common objectives.
Effective SBRs: there should be targets on type of consultations with private sector representation and the use of public–private dialogue to build trust. This includes involving SME and informal business in discussion as well as a more transparent interaction with large business.
SUPPORTING THE PREPARATION OF TANZANIA’S SECOND FIVE YEAR DEVELOPMENT PLAN (FYDP II) 2016/17 – 2021/22
125
Administrative and coordinating capacity in relevant ministries: it is necessary to ensure there is a strong unit in the presidency, with a sufficient level of staffing, to cohere policies and discipline other ministries.
There could be a target on collaborative projects, for example on PPPs in infrastructure or SEZs, which could demonstrate that Tanzania is serious about and open to modern ways of implementing the five-year plan. Collaborative projects could initially focus on the previously identified policy priorities and sectors that are aiming to have a real transformative impact.
Monitoring, learning and searching for solutions should be embedded in the next FYDP. There is unfinished business of the FYDP given the lack of implementation. This should be recognised and an element of learning and adaptive development could be included when using collaborative projects to achieve the five policy areas discussed in Chapter 9.
11. CONCLUSIONS
Tanzania has long had a broad vision of becoming a diversified semi-industrialised economy with a substantial industrial sector. It has developed three five-year plans to guide this, with the first coming to an end this year and the second, aiming at nurturing an industrial economy for economic transformation and human development, being formulated with a view to starting later in the year. This report has aimed to inform the target setting process for the next five year plan 2016/17 – 2020/2021 with a theme of nurturing an industrial economy for economic transformation and human development.
Tanzania has grown rapidly, at a rate of around 7% over the past decade, but it needs to overcome a range of economic and political constraints and engage in different ways of working if it is to industrialise more fully, transform the economy, create more good-quality jobs, reduce poverty faster, foster human development and improve resilience against shocks. Industrialisation has been one of the priorities in implementing Tanzania’s Vision 2025, but the share of manufacturing in GDP is falling and currently below 7%. Although there is quite a consensus on what needs to happen in Tanzania for it to be able to sustain growth and ignite meaningful economic transformation, it is much less clear how to make it happen.
The issues facing FYDP II are at some level similar, but at another level very different, from those facing its predecessor. Looking backwards, this plan can learn lessons from the implementation of the first FYDP, and we need to ask why some targets have been met but not others. The new plan needs to continue with unfinished business and tackle the economic, political and institutional constraints that have emerged. However, looking forward, this plan faces a different international environment, with rapidly growing African markets and rising Asian wages, which offer opportunities for Africa’s industrialisation. The discovery of offshore gas deposits, which, if commercially viable, could boost government revenue by the equivalent of 3% of non-gas GDP and bring in up to USD2 billion in export revenue (while also providing a source of fuel for the supply of electricity and cheaper energy), as well as other natural resources, provides further opportunities for industrialisation, although this also presents risks. Further, this plan relies more on the private sector to undertake much of the activity, with the government facilitating industrialisation rather than getting in the way. Domestic (public and private) financial resources are increasing in relative terms compared with international sources. A new government came to power at the end of 2015. It immediately began with a range of reforms. It should also respond to the challenges above and implement a new vision for economic transformation. It cannot afford to stand aloof and risk further deindustrialisation.
There are some early signs of structural transformation in Tanzania. The country needs to build on these by addressing generally agreed policy options, but in a different way compared to the past. Given the challenges in Tanzania, and in many other countries, around private-sector led economic growth, it is important to transition from a more conventional notion of development planning according to blueprints to one of searching for solutions. This requires an approach to industrial policy that is more problem-driven, iterative and adaptive. It can best do this in practical terms by considering a number of collaborative projects that would illustrate how it can nudge the economy further onto a more transformational path in the following areas: infrastructure development, human capital development, tax policy reform, investment

SUPPORTING THE PREPARATION OF TANZANIA’S SECOND FIVE YEAR DEVELOPMENT PLAN (FYDP II) 2016/17 – 2021/22
126
climate reform and practical industrial policy. But this requires learning and adaptive development throughout the duration of the plan – a new approach that is appropriate given the new challenges.
This needs to be matched by a commitment from the leadership to ensure that there is one ministry or agency responsible for overall implementation, that other agencies are co-ordinated and assigned responsibilities effectively, and that these agencies stay focused and see projects through. This is an exciting time for Tanzania (e.g. rebalancing in China, regional growth, offshore gas discovery, governance changes), but effective leadership is required to seize the opportunities for transformation. Now is the time to act.
SUPPORTING THE PREPARATION OF TANZANIA’S SECOND FIVE YEAR DEVELOPMENT PLAN (FYDP II) 2016/17 – 2021/22
127
REFERENCES
Adam, C. (2015) ‘Tanzania: Turning Natural Gas into Sustained Growth’ in A. Zedillo, O. Cattaneo and H. Wheeler (eds.) Africa at a Fork in the Road: Taking Off or Disappointment Once Again? New Haven, CT: Yale Centre for the Study of Globalization. African Development Bank (2010) ‘Domestic Resource Mobilization for Poverty Reduction in East Africa: Tanzania Case Study’, Regional Department East Africa (OREA), November 2010. African Development Bank (2011) ‘Tanzania Country Strategy Paper’, African Development Bank Regional Department East 1, June 2011. African Development Bank, OECD and UNDP (2014) ‘Tanzania Economic Outlook 2014’, Available from: http://www.africaneconomicoutlook.org/en/country-notes/east-africa/tanzania/ Agutamba, K. (2016) ‘Rwandan miners turn to Mombasa over mysterious theft of goods in Dar’, The New Times, 5 January 2016. Andrews, M. (2013) ‘The Limits of Institutional Reform in Development: Changing Rules for Realistic Solutions’. Cambridge: Cambridge University Press. Andrews, M., Pritchett, L., and Woolcock, M. (2015), 'Doing problem driven work’. CID Working Paper No. 307. Cambridge MA: Center for International Development at Harvard University. Angga, P. and Diao, X. (2014) ‘A 2009 Social Accounting Matrix (SAM) for Tanzania’. Washington, DC: International Food Policy Research Institute (IFPRI). ATAF (African Tax Administration Forum) and GIZ (2014) ‘Taxation of SMEs in Africa: Good Practices and Lessons Learned’, September 2014. Balchin, N. (2015) ‘Shaping Tanzania’s Second Five Year Development Plan (2016-2012): Workshop Report of a meeting on 6 October 2015’, Supporting Economic Transformation, October 2015. Bank of Tanzania (2011) Financial Stability Report September 2011. Dar es Salaam: Bank of Tanzania. Bank of Tanzania (2015a) Financial Stability Report September 2015. Dar es Salaam: Bank of Tanzania. Bank of Tanzania. (2014) ‘Financing Agriculture and Agribusiness in Tanzania: Opportunities and Challenges’, Proceedings of the 17th Annual Conference of Financial Institutions, Arusha International Conference Centre, 24-25 November 2014. Bank of Tanzania (2015b) Monthly Economic Review December 2015. Dar es Salaam: Bank of Tanzania. Bank of Tanzania (2015c) Monthly Economic Review July 2015. Dar es Salaam: Bank of Tanzania. Barder, O. (n.d.), 'If development is complex, is the results agenda bunk?', in O. Bardner (ed.), Owen abroad (2015; http://www.owen.org/blog/5872). Berensmann, K., Dafe, F., Lindenberg, N. and Volz, U. (2015) ‘Financing Global Development: The role of Local Currency Bond Markets in Sub-Saharan Africa’, German Development Institute Briefing Paper 11/2015. Bloom, N. and Van Reenen, J. (2010) ‘Why Do Management Practices Differ Across Firms and Countries?’ Journal of Economic Perspectives, 24(1): 203–224.
SUPPORTING THE PREPARATION OF TANZANIA’S SECOND FIVE YEAR DEVELOPMENT PLAN (FYDP II) 2016/17 – 2021/22
128
Booth, D. and Unsworth, S. (2014) 'Politically smart, locally led development. Discussion paper', London: Overseas Development Institute. Breakthrough Attorneys (2015) ‘Tanzania’s New Regime on Oil and Gas Laws: Unveiling Knights or Villains?’, Available from: http://breakthroughattorneys.com/tanzanias-new-regime-oil-gas-laws/ Bukurura, S.H. and Mmari, D.E. (2014) ‘Hydrocarbon Resources in Tanzania: Achieving Benefits with Robust Protection’, REPOA Special Paper 14/3. Business Times (2013) ‘Tanzanian Employees ‘The Most Highly Taxed in EAC’, 22 November 2013. Buur, L. and Whitfield, L. (2013) ‘Industrial policy and state-business relations: towards a heuristic approach’ in Te Velde, D.W. (ed.) State-business relations and industrial policy: Current policy and research debates August 2013 at: https://static.squarespace.com/static/5167f6a2e4b0f1cbdee8d1c0/t/520bbceee4b0835de583c34f/1376500974972/DEGRP+Policy+Essays+State-business+relations+and+industrial+policy.pdf. Cagliari, A. (2014) ‘Post-2015 Infrastructure Finance: The New Debt Threat?’, Development Progress Blog, http://www.developmentprogress.org/blog/2014/02/10/post-2015-infrastructure-finance-new-debt-threat Ceglowski, J., Golub, S., Mbaye, A. and Prasad, V. (2015) ‘Can Africa Compete with China in Manufacturing? The Role of Relative Unit Labor Costs’. Unpublished mimeo. Clemens, B., Thomas, M. and Thurlow, J. (2009). ‘Social accounting matrices and multiplier analysis: An introduction with exercises’. Volume. 5. International Food Policy Research Institute. Cochran, T., Bond, D.L., Sheppard, B. and Samuels, B. (2009) ‘Financing Local Infrastructure: Part One Report – The Tanzania Environmental Scan’, Report for UNCDF, November 2009. Cooksey, B. (2002) 'The power and the vainglory: anatomy of a Malaysian IPP in Tanzania', in K.S. Jomo (ed.), Ugly Malaysians? South-South investment abused? Durban: Centre for Black Research: 47-67. Cooksey, B. (2008) 'Who benefits? Tanzanian case studies of investment, trade and procurement’, Tanzania Development Research Group, World Bank-Norway cooperation workshop: examining illicit financial flows from developing countries. Oslo: Norwegian Ministry of Foreign Affairs. Cooksey, B. (2011), 'Public goods, rents and business in Tanzania', Background Paper 01. London: Africa Power and Politics Programme. Cooksey, B. and Kelsall, T. (2011) 'The political economy of the investment climate in Tanzania', Research Report 01. London: Africa Power and Politics Programme. Coulson, A. (1982) Tanzania: A political economy. Oxford: Clarendon Press. Coulson, A. (ed.) (1979) African Socialism in Practice. Nottingham: Russell Press Ltd. DFID (2015) ‘Inclusive Growth Diagnostic Tanzania’, Unpublished draft. Diao, X. J. Kweka, M. McMillan and Qureshi, Z. (2015) ‘Understanding Africa’s Recent Growth: Evidence from Tanzania’, Unpublished draft. DiJohn, J. (2010) ‘Taxation, Resource Mobilisation and State Performance’, Crisis States Research Centre Working Paper No. 84, November 2010. Dinh Hinh T. (2013) ‘Light Manufacturing in Africa: Findings and Policy Lessons’, UNU WIDER Presentation, The World Bank, 25 June 2013.
SUPPORTING THE PREPARATION OF TANZANIA’S SECOND FIVE YEAR DEVELOPMENT PLAN (FYDP II) 2016/17 – 2021/22
129
Dinh Hinh T. and Monga, C. (2013). ‘Light Manufacturing in Tanzania: A Reform Agenda for Job Creation and Prosperity’. World Bank Publications. Dinh Hinh, T., Palmade, V., Chandra, V. and Cossar, F. (2012) ‘Light Manufacturing in Africa: Targeted Policies to Enhance Private Investment and Create Jobs’. Washington, DC: The World Bank. Diyamett, B. and Mutambla, M. (2014) ‘Foreign direct investment and local technological capabilities in least developed countries: some evidence from the Tanzanian manufacturing sector’, African Journal of Science, Technology, Innovation and Development, 6(5): 401-414. Doner, R. and Schneider, B. (2000) ‘Business associations and economic development: why some associations contribute more than others’, Business and Politics, 2(3): 261-288. Du, L., Harrison, A. and Jefferson, G. (2011) ‘FDI Spillovers and Industrial Policy: The Role of Tariffs and Tax Holidays’, World Development, 64: 366-383. East African Business Week (2014) ‘Tanzania set for ore sales’, 26 October 2014, Available from: http://www.busiweek.com/index1.php?Ctp=2&pI=2068&pLv=3&srI=49&spI=27 ESRF (Economic and Social Research Foundation) (2013) ‘Review of the Agricultural Sector Development Strategy 2001-2012’, Prepared for the Ministry of Agriculture, Food Security and Cooperatives. Evans, P. (1995) Embedded Autonomy: States and Industrial Transformation. Princeton, NJ: Princeton University Press. Farole, T. and Kweka, J. (2011) ‘Institutional Best Practices for Special Economic Zones: An Application to Tanzania’, World Bank Africa Trade Policy Note No. 25. Fjeldstad, O-H. and Heggstad, K.K. (2011) ‘The tax systems in Mozambique, Tanzania and Zambia: Capacity and constraints’, Chr. Michelsen Institute Report R 2011:3. Gaddis, I., Wane, W. and Morisset, J. (2013) ‘Is Tanzania Raising Enough Tax Revenue?’ World Bank Blog, 2 April 2013, Available from: http://blogs.worldbank.org/africacan/is-tanzania-raising-enough-tax-revenue. Government of Tanzania (2015) ‘Speech by the Minister of Finance Hon. Saada Mkuya Salum (MP) Introducing to the National Assembly the Estimates of Government Revenue and Expenditure for Fiscal Year 2015/2016’, Available from: http://www.tra.go.tz/documents/BUDGET%20SPEECH%20MINISTER%20OF%20FINANCE%20FINAL%20FINAL.pdf Graham, P. and Round, J. (1985) ‘Social accounting matrices: A basis for planning’, World Bank, September 1985. Gray, H. (2013) 'Industrial policy and the political settlement in Tanzania: aspects of continuity and change since independence', Review of African Political Economy, 40 (136): 185-201. Gray, H. (2015) 'The political economy of grand corruption in Tanzania', African Affairs, 114 (456): 382-403. Hausmann, R., Rodrik, D. and Velasco, A. (2008) ‘Growth Diagnostics’ in N. Serra and J. E. Stiglitz (eds), The Washington Consensus Reconsidered: Towards a New Global Governance, New York: Oxford University Press. HM Treasury Department for Business Innovation and Skills (2015) ‘2010 to 2015 government policy: business enterprise’, Policy paper, 8 May 2015. Available from:
SUPPORTING THE PREPARATION OF TANZANIA’S SECOND FIVE YEAR DEVELOPMENT PLAN (FYDP II) 2016/17 – 2021/22
130
https://www.gov.uk/government/publications/2010-to-2015-government-policy-business-enterprise/2010-to-2015-government-policy-business-enterprise IMF (International Monetary Fund) (2014) ‘2014 Article IV Consultation, Third Review under the Standby Credit Facility Arrangement, Request for a Waiver for Nonobservance of a Performance Criterion, and Financing Assurances Review – Staff Report; Press Releases; and Statement of the Executive Director for the United Republic of Tanzania’, IMF Country Report No. 14/120. Geneva: International Monetary Fund. IMF (2006) ‘Kenya, Uganda, and United Republic of Tanzania: Selected Issues’, IMF Country Report No. 08/353, October 2008. IMF (2011) 'Revenue Mobilization in Developing Countries’, Fiscal Affairs Department, March 2011. IMF (2009) ‘Tanzania: The Story of an African Transition’, Washington, D.C.: International Monetary Fund. IMF (2015) ‘United Republic of Tanzania Second Review Under the Policy Support Instrument – Debt Sustainability Analysis’, 19 June 2015. IMF (2014) ‘United Republic of Tanzania – Selected Issues’ IMF Country Report No. 14/121, May 2014. IMF, OECD, UN and World Bank (2011) ‘Supporting the Development of More Effective Tax Systems’, Report to the G-20 Development Working Group. IPP Media (2015) ‘Bagamoyo port to handle fourth generation ships’, 14 October 2015, Available from: http://www.ippmedia.com/?l=85280 JDC (Jubilee Debt Campaign) (2012) ‘State of Debt: Putting an End to 30 years of Crisis’. London: JDC. JICA (Japan International Cooperation Agency) (2015) 'EOJ-JICA Tanzania’s Comments on Drafting the Next Five-Year Development Plan – From Our Experiences in Japan, Asia and On-going Activities in Tanzania’, Discussion document, 18 August 2015. Kahyarara, G. (2013) ‘Tanzania Manufacturing Export and Growth: A cointegration approach’, International Journal of Economics and Management Sciences, 12 (2): 41-51. Katera, L. (2014) 'Local Government Taxation in Tanzania: Experiences, Challenges and Lessons', in H.M. Kitillya (ed.) Managing Tax Regimes in Tanzania: Experiences, Challenges and Lessons. Dar es Salaam: TEMA. Kato, T. (2013) ‘Research Outline and Preliminary Findings: Impact of Agricultural Input Subsidies on Poverty in Tanzania’, Draft report presented at REPOA’s 18th Annual Research Workshop, Kunduchi Beach Hotel, Dar es Salaam, Tanzania, 3-4 April 2013. Kelsall, T. (2013) Business, Politics, and the State in Africa: Challenging the Orthodoxies on Growth and Transformation. London: Zed Books. Khan, M. (2000a) 'Rent-seeking as process', in M. Khan and K.S. Jomo (eds.), Rents, Rent-Seeking and Economic Development: Theory and evidence in Asia. Cambridge: Cambridge University Press, 70-144. Khan, M. (2000b), 'Rents, efficiency and growth', in M. Khan and K. S. Jomo (eds.), Rents, Rent-Seeking and Economic Development: Theory and Evidence in Asia. Cambridge: Cambridge University Press: 21-69. Khan, M. (2010) 'Political settlements and the governance of growth-enhancing institutions’, Research Paper Series on 'Growth-Enhancing Governance'. London: SOAS, University of London.
SUPPORTING THE PREPARATION OF TANZANIA’S SECOND FIVE YEAR DEVELOPMENT PLAN (FYDP II) 2016/17 – 2021/22
131
Kikwete, J.M. (2014) ‘Tanzania’s Transformation and Vision 2025: Governing Economic Growth for Social Gain’, Transcript. Kingombe, C. and te Velde, D.W. (2014) ‘The role of Special Economic Zones in Manufacturing Development in sub Saharan Africa: Structural Transformation and Employment Creation’, forthcoming in J. Weiss and M. Tribe (eds. 2014) Handbook on Industry and Development. Routledge, London. Kitillya, H.M. (2014a) ‘Managing Tax Regimes in Tanzania: Experiences, Challenges and Lessons’, in H.M. Kitillya (ed.) Managing Tax Regimes in Tanzania: Experiences, Challenges and Lessons. Dar es Salaam: TEMA. Dar es Salaam: TEMA. Kitillya, H.M. (2014b) ‘Real Property Taxation and Inequality’, in H.M. Kitillya (ed.) Managing Tax Regimes in Tanzania: Experiences, Challenges and Lessons. Dar es Salaam: TEMA. Dar es Salaam: TEMA. Kragelund, P. (2010) ‘The Potential Role of Non-Traditional Donors’ Aid in Africa’, International Centre for Trade and Sustainable Development, 4 March 2010. Krueger, A.O. (1974) 'The political economy of the rent-seeking society', American Economic Review, 64 (3): 291-303. Lall, S. (2001) Competitiveness, Technology and Skills. Cheltenham: Edward Elgar Publishing Ltd. Laws, E. and Leftwich, A. (2014) 'Political Settlements’, DLP Concept Brief 01. University of Birmingham: Developmental Leadership Project. Lewis, P.M. (2007) Growing Apart: Oil, politics, and economic change in Indonesia and Nigeria. Ann Arbor, MI: University of Michigan Press. Lin, J., Monga, C., te Velde, D. W., Tendulkar, S., Amsden, A., Amoako, K. Y., Pack, H. and Lim, W. (2011) ‘Growth Identification and Facilitation: The Role of the State in Dynamics of Structural Change’, Development Policy Review, May 2011. Lovett, A. (2016) ‘The aid pie is growing, but the poorest countries get a smaller slice’, The Guardian, 7 January 2016. Lubua, E.W. (2014) ‘Influencing Tax Compliance in SMEs through the Use of ICTs’, International Journal of Learning, Teaching and Educational Research, 2 (1): 80-90. Lunogelo, H.B. (2014) ‘European Report on Development: Financing and other means of implementation in the post-2015 context – Tanzania Country Illustration’. Luvanda, E. and Yona, F.M. (2014) ‘Membership in Regional Economic Integrations: Implication on the Tax System in Tanzania’, in H.M. Kitillya (ed.) Managing Tax Regimes in Tanzania: Experiences, Challenges and Lessons. Dar es Salaam: TEMA. Dar es Salaam: TEMA. Manson, K. (2015). ‘Tanzania debut bond sale still on track’, Financial Times, 19 February 2015. Materu-Behitsa, M and Diyamett, B (2011) ‘Tanzania ICT Sector Performance Review 2009/2010’ Research ICT Africa, 2011. Maxfield, S. and B.R. Schneider (eds.) (1997) Business and the State in Developing Countries. Cornell University Press, Ithaca. Malhotra, K. (2013) ‘National Agricultural Input Voucher Scheme (NAIVS 2009-2012), Tanzania: Opportunities for Improvement’, REPOA Brief No. 40, September 2013.

SUPPORTING THE PREPARATION OF TANZANIA’S SECOND FIVE YEAR DEVELOPMENT PLAN (FYDP II) 2016/17 – 2021/22
132
Masare, A. (2015) ‘Ex-soldier to invest $1bn in road project’, The Citizen, 2 April 2015. Mbilinyi, A. and V. Kazi. (2011) ‘Aid Effectiveness in Tanzania’, Economic and Social Research Foundation Policy Brief No. 2/2011. MCC (2015) ‘Business Opportunities in Tanzania’s Power Sector’, MCC Investment Outlook, 2015. McMillan, M., J. Page and D.W. te Velde (2015) ‘Supporting Economic Transformation’, Unpublished draft. McMillan, M. and Rodrik, D. (2013) ‘State-business relations: structural change and industrialisation in Africa’ in Te Velde, D.W. (ed.) State-business relations and industrial policy: Current policy and research debates, August 2013, Available from: https://static.squarespace.com/static/5167f6a2e4b0f1cbdee8d1c0/t/520bbceee4b0835de583c34f/1376500974972/DEGRP+Policy+Essays+State-business+relations+and+industrial+policy.pdf. Ministry of Energy and Minerals (2015) Tanzania Minerals Audit Agency: Annual Report 2014. Tanzania: Ministry of Energy and Minerals. Moore, M. and Schmitz, H. (2008) 'Idealism, realism and the investment climate in developing countries', Working Paper 307. Brighton: Centre for the Future State, Institute of Development Studies, University of Sussex. Mirondo, R. (2016a) 'Govt halts building of Bagamoyo Port', The Citizen, 8 January 2016. Available from: http://www.thecitizen.co.tz/News/Govt-halts-building-of-Bagamoyo-Port/-/1840340/3025392/-/bslg0c/-/index.html Mirondo, R. (2016b) ‘Tanzania: Fate of Bagamoyo Port Clarified’, The Citizen, 9 January 2016. Available from: http://allafrica.com/stories/201601090047.html MIT (Massachusetts Institute of Technology (2011) ‘Integrated Industrial Development Strategy 2025’ Ministry of Industry and Trade Tanzania, 2011. Mjema, G.D. (2014) 'Looking beyond the current tax regimes in Tanzania’, in H.M. Kitillya (ed.) Managing Tax Regimes in Tanzania: Experiences, Challenges and Lessons. Dar es Salaam: TEMA. Dar es Salaam: TEMA. Mjema, G.D. and Shemoi, L. (2014) ‘Tax Administration in Tanzania’, in H.M. Kitillya (ed.) Managing Tax Regimes in Tanzania: Experiences, Challenges and Lessons. Dar es Salaam: TEMA. Dar es Salaam: TEMA. Moshi, H.P.B. (2013) ‘Opportunities and Challenges for the Extraction of Natural Gas in Tanzania: The Imperative of Adequate Preparedness’, ESRF Discussion Paper No. 48. Mpango, P. (2013) ‘Socio-Economic Transformation for Poverty Reduction: Eight Key Messages for Unlocking Tanzania’s Potential’, REPOA Brief. Dar es Salaam: REPOA. Mrindoko, S. (2014) ‘Tanzania: Lake Natron Soda Ash Project Still On’, Tanzania Daily News, 20 May 2014, Available from: http://allafrica.com/stories/201405201231.html. Mushi, D.P. (2014) ‘Potentials and Challenges of Taxing the Informal Sector in Tanzania’, in H.M. Kitillya (ed.) Managing Tax Regimes in Tanzania: Experiences, Challenges and Lessons. Dar es Salaam: TEMA. Dar es Salaam: TEMA. Newman, C. (2015) ‘Industrial clusters: Who benefits?’, Brookings Institution Learning to Compete Working Paper No. 5.
SUPPORTING THE PREPARATION OF TANZANIA’S SECOND FIVE YEAR DEVELOPMENT PLAN (FYDP II) 2016/17 – 2021/22
133
Ngaruko, D.D. and Aikaeli, J. (2014) ‘Tax Enforcement and Compliance in Tanzania’, in H.M. Kitillya (ed.) Managing Tax Regimes in Tanzania: Experiences, Challenges and Lessons. Dar es Salaam: TEMA. Dar es Salaam: TEMA. NBS (National Bureau of Statistics) (2014) ‘National Accounts of Tanzania Mainland 2001 – 2013’ Tanzania National Bureau of Statistics, 2014. NBS (2014a) ‘Revised National Accounts Estimates for Tanzania Mainland, Base Year 2007’ Tanzania National Bureau of Statistics, 2014. NBS (2014b) ‘Formal Sector Employment and Earnings Analytical Report 2014’ Tanzania National Bureau of Statistics, 2014. NBS (2015a) ‘Labour Force Survey’ Tanzania National Bureau of Statistics, 2015. NBS (2015b) ‘Quarterly Gross Domestic Product of Tanzania Mainland, First Quarter 2015’, National Bureau of Statistics and Ministry of Finance, NBS (2016) ‘The Third Quarter Gross Domestic Product (July-September) 2015’. National Bureau of Statistics and Ministry of Finance and Planning, January 2016. Nelson, D. (1993) National Innovation Systems: A Comparative Analysis. New York: Oxford University Press. Noman, A., Botchwey, K., Stein, H. and Stiglitz, J.E. (eds.) (2011) Good Growth and Governance in Africa: Rethinking development strategies. Oxford: Oxford University Press. North, D. C. (1993) 'Institutions and credible commitment', Journal of Institutional and Theoretical Economics, 149 (1): 11-23. ODI, European Centre for Development Policy Management, German Development Institute, University of Athens and Southern Voice Network (2015) ‘European Report on Development 2015: Combining finance and policies to implement a transformative post-2015 development agenda’. OECD (2013) ‘Interconnected Economies: Benefiting from Global Value Chains’, Synthesis Report. OECD (2015) ‘Taxation of SMEs in OECD and G20 Countries’, OECD Tax Policy Studies No. 23. OECD (2007) ‘Tax Incentives for Investment – A Global Perspective: experiences in MENA and non-MENA countries’, Available from: http://www.oecd.org/mena/investment/38758855.pdf. OECD Development Co-operation Directorate (2015) ‘Development Co-operation by Countries Beyond the DAC: Towards a more complete picture of international development finance’, May 2015. Olingo, A. (2015) ‘Rwanda, Tanzania amend VAT laws as tax exemptions prove costly’, The East African, 31 January 2015, Available from: http://www.theeastafrican.co.ke/business/Rwanda--Tanzania-amend-VAT-
laws-as-tax-exemptions-prove-costly-/-/2560/2608524/-/lc2jgwz/-/index.html. Osoro, N.E. (2010) ‘Domestic Resource Mobilization in Sub-Saharan Africa: The Case of Tanzania’. Ottawa: The North-South Institute. Osoro, N.E. (2014) 'Tax Structure and Incentives', in H.M. Kitillya (ed.) Managing Tax Regimes in Tanzania: Experiences, Challenges and Lessons. Dar es Salaam: TEMA. Dar es Salaam: TEMA.
SUPPORTING THE PREPARATION OF TANZANIA’S SECOND FIVE YEAR DEVELOPMENT PLAN (FYDP II) 2016/17 – 2021/22
134
Pack, H. and Westphal, L. (1986) ‘Industrial Strategy and Technological Change’, Journal of Development Economics, 22: 87–128. Page, J. (2013) ‘Industrial Policy in Practice: Africa’s Presidential investor’s advisory councils’, Paper presented at the UNU-WIDER Conference “Learning to Compete: Industrial Development and Policy in Africa” Helsinki, Finland 24-25 June 2013, Available from: http://www1.wider.unu.edu/L2Cconf/sites/default/files/L2CPapers/Page.pdf. Page, J. (2012) ‘Aid, Structural Change and the Private Sector in Africa’, UNU-Wider working paper 2012/21. Helsinki: WIDER. Policy Forum (2009) ‘An Analysis of Tanzania’s Budget Revenue Projections: How much revenue are we losing?’ Tanzania Budget 2009/2010: Policy Brief 3.09. Porter, M. Bernstein, M. Bimesdoerfer, B. Marwa, F. Mbabazi, L and Zollmann, J. (2010) ‘High Value Vegetables in Tanzania – The Seeds of a Competitive Cluster’, HBS Microeconomics of Competitiveness. Pritchett, L. and Werker, E. (2012) 'Developing the guts of a GUT (Grand Unified Theory): elite commitment and inclusive growth'. Manchester: ESID. Pritchett, L., Samji, S., and Hammer, J. (2013) 'It's All About MeE: Using Structured Experiential Learning ("e") to Crawl the Design Space’, Center for Global Development. Working Paper 322'. Washington, DC: Center for Global Development. Pritchett, L., Sen, K., Kar, S. and Raihan, S. (2014) 'Trillions gained and lost: estimating the magnitude of growth episodes', CID Working Paper No. 279. Harvard University: Center for International Development. Prizzon, A. and Mustapha, S. (2014) ‘Debt sustainability in HIPCs in a new age of choice’, ODI Working Paper 397, June 2014. PWC (PriceWaterhouseCoopers) (2013) ‘Africa Gearing Up 2013’, PriceWaterhouseCoopers, 2013. PWC (2015a) ‘Paying Taxes 2015: The global picture’, Available from: https://www.pwc.com/gx/en/paying-taxes/pdf/pwc-paying-taxes-2015-low-resolution.pdf. PWC (2015b) ‘Singapore: Corporate – Tax credits and incentives’, Available from: http://taxsummaries.pwc.com/uk/taxsummaries/wwts.nsf/ID/Singapore-Corporate-Tax-credits-and-incentives Quadir, F. (2013) 'Rising Donors and the New Narrative of ‘South-South’ Cooperation: what prospects for changing the landscape of development assistance programmes?’, Third World Quarterly, 34 (2): 321-338. Rajan, R.S. (2004) ‘Measures to Attract FDI: Investment Promotion, Incentives and Policy Intervention’, Economic and Political Weekly, 39 (1): 12-16. Rand, J. (2015) ‘Understanding FDI spillover mechanisms’, Brookings Institution Learning to Compete Working Papers No. 6. Relnert, K. A., and Roland-Holst, D. W. (1997) Social accounting matrices. Applied methods for trade policy analysis: A handbook. Cambridge: Cambridge University Press. Reuters (2015) ‘Tanzania budget spending seen flat in 2015/16’, Available from: https://uk.finance.yahoo.com/news/tanzania-budget-spending-seen-flat-2015-16-072011466--sector.html
SUPPORTING THE PREPARATION OF TANZANIA’S SECOND FIVE YEAR DEVELOPMENT PLAN (FYDP II) 2016/17 – 2021/22
135
Rodenstein-Rodan, P. N. (1943) ‘Problems of industrialization of Eastern and Southeastern Europe’, Economic Journal, 53: 202-11. Rodrik, D. (1996) ‘Coordination Failures and Government Policy: A Model with Applications to East Asia and Eastern Europe’, Journal of International Economics, 40: 1-22. Rodrik, D. (2004) ‘Getting Institutions Right’, Cambridge, MA: Harvard University. Rodrik, D. (2008) ‘Second Best Institutions’ NBER Working Paper Series 14050, June 2008, Available from: http://www.nber.org/papers/w14050.pdf. Rwanda Revenue Authority (2015) ‘Tax Policy and Tax Administration Reforms in Rwanda: Developing Country Perspective’, Available from: http://effectivecooperation.org/wordpress/wp-content/uploads/2015/07/Richard-Tusabe-RRA-Commissioner-General.pdf Saliola, F., and Seker, M. (2011) ‘Total factor productivity across the developing world’, Research Note. The World Bank. Sen, K. (2012) 'The Political Dynamics of Economic Growth’, ESID Working Paper 05', Manchester: ESID. Smith, K., Fordelone, T.Y. and Zimmermann, F. (2010) ‘Beyond the DAC: The Welcome Role of Other Providers of Development Co-operation’, DCD Issues Brief, May 2010. Stiglitz, J.E. (1996) Whither Socialism. Cambridge, M.A.: The MIT Press. Sutton, J. and Olomi, D. (2012) ‘An Enterprise Map of Tanzania’, International Growth Centre, Available from: http://personal.lse.ac.uk/sutton/tanzania_final.pdf. Tanzania Development Vision 2025 (2015), 'Big Results Now! 2013/2014 Annual Report', Dar es Salaam. Tanzania Development Vision 2025 (n.d.), 'Big Results Now! Roadmap', Dar es Salaam. Tanzania Revenue Authority (2014) Annual Report 2013/2014. Dar es Salaam: TRA. Tax Justice Network-Africa and ActionAid International (2012) ‘Tax competition in East Africa: A race to the bottom? Tax incentives and revenue losses in Kenya’, May 2012. TEC (Tanzania Episcopal Conference), National Muslim Council of Tanzania and Christian Council of Tanzania (2012) ‘The One Billion Dollar Question: How Can Tanzania Stop Losing So Much Revenue’, June 2012. te Velde, D.W. (2003) ‘Government Policies towards Foreign Direct Investment’, in G. Wignaraja (ed.) Competitiveness Strategy in Developing Countries. London: Routledge Studies in Development Economics, pp. 166-197. te Velde, D.W. (2006) “Measuring State-Business Relations in sub-Saharan Africa” IPPG discussion paper 4, Available from: http://www.ippg.org.uk/PDF/State-business%204.pdf.
te Velde, D.W. (2010) ‘Effective state-business relations, industrial policy and economic growth’, London: ODI. te Velde, D.W. (2014) ‘Sovereign bonds in sub-Saharan Africa: Good for growth or ahead of time?’ ODI Briefing No. 87.
SUPPORTING THE PREPARATION OF TANZANIA’S SECOND FIVE YEAR DEVELOPMENT PLAN (FYDP II) 2016/17 – 2021/22
136
te Velde, D. W. and Morrissey, O. (2005) ‘Supporting Industrial Development: Overcoming Market Failures and Providing Public Goods’, Combating Marginalization and Poverty through Industrial Development. Project 3, United Nations Industrial Development Organization, Vienna. te Velde, D.W., Booth, D., Leipziger, D. and Uneze, E. (2015) ‘Supporting Economic Transformation in Nigeria’, Supporting Economic Transformation Programme, London: ODI. Therkilsden, O. (2011) 'Policy making and implementation in agriculture: Tanzania's push for irrigated rice', Working Paper 2011:26. Copenhagen: Danish Institute for International Studies. Therkilsden, O. and Bourgouin, F. (2012) 'Continuity and change in Tanzania's ruling coalition: legacies, crises and weak productive capacity’, DIIS Working Paper 2012:06. Copenhagen: Danish Institute for International Studies. TIB Development Bank (2015) ‘How to Efficiently Implement and Finance Development Projects’, Submission to Presidents Office Planning Commission, October 2015. TIC (Tanzania Investment Centre) (2014) ‘Tanzania Investment Guide 2014 – 15’, Tanzania Investment Centre, 2014. Tidemand, P., Sola, N., Maziku, A., Williamson, T., Tobias, J., Long, C. and Tilley, H. (2014) ‘Local Government Authority (LGA) fiscal inequities and the challenges of ‘disadvantaged’ LGAs in Tanzania’, ODI Report, August 2014. Tilley, H. (2014) The Political Economy of Aid and Accountability: The Rise and Fall of Budget Support in Tanzania. Surrey, UK: Ashgate Publishing Limited. TradeMark Southern Africa (2012) ‘Tanzania: Informal sector evades Sh86bn yearly’, Available from: http://www.trademarksa.org/news/tanzania-informal-sector-evades-sh86bn-yearly Tuomi, K. (2012) ‘Review of Investment Incentives: Best Practice in Attracting Investment’, International Growth Centre Working Paper, June 2012. TPC (Tanzania Planning Commission) (n.d) The Tanzania Development Vision 2025. United Republic of Tanzania. Uganda Revenue Authority (2015) ‘Performance Brief July to February 2015’, Available from: UNCITED (2015) ‘Key Indicators of the Labour Market from the ILFS 2006 and 2014’. UNCTAD (United Nations Conference on Trade and Development) (2013) ‘World Investment Report 2013’. Geneva: UNCTAD. UNESCA (United Nations Economic and Social Council) (2012) ‘Preparing for the 2012 Development Cooperation: Aid as a Catalyst to Increase Domestic Revenue Mobilisation in Sub Saharan Africa’. Geneva: UNESCA. UNIDO (United Nations Industrial Development Organisation) (2012) ‘Tanzania Industrial Competitiveness Report 2012’. Ministry of Trade and Industry of the United Republic of Tanzania, POPC and UNIDO. UNIDO (2015) ‘Tanzania Industrial Competitiveness Report 2015’, Unpublished draft, October 2015. USAID (2008) ‘Finance in Value Chain Analysis – A Synthesis Paper’, Micro Report No. 132.

SUPPORTING THE PREPARATION OF TANZANIA’S SECOND FIVE YEAR DEVELOPMENT PLAN (FYDP II) 2016/17 – 2021/22
137
Van Parys, S. and James, S. (2010) ‘Why tax incentives may be an ineffective tool to encouraging investment? – The role of investment climate’, Available from: http://taxblog.com/svanparys/why-tax-incentivesmay-ineffective-tool-encouraging-investment-the-role-investment-climate/. Vries, G. de., Timmer, M., and De Vries, K. (2013) ‘Structural transformation in Africa: Static gains, dynamic losses’. Groningen Growth and Development Centre. Wade, R. (1990) Governing the Market: Economic theory and the role of government in East Asian industrialization. Princeton and Oxford: Princeton University Press. Wangwe, S., Mmari, D., Aikaeli, J. Rutatina, N., Mboghoina, T. and Kinyondo, A. (2014) ‘The Performance of the Manufacturing Sector in Tanzania: Challenges and the Way Forward’, Learning to Compete Working Paper No. 22. Whitfield, L. (2011) 'How countries become rich and reduce poverty: A review of heterodox explanations of economic development', Working Paper 2011: 13. Copenhagen: Danish Institute for International Studies. Whitfield, L. and Therkilsden, O. (2011) 'What Drives States to Support the Development of Productive Sectors? Strategies ruling elites pursue for political survival and their policy implications', Working Paper 2011:15. Copenhagen: Danish Institute for International Studies. Whitfield, L., Therkilsden, O., Buur, L. and Kjaer, A.M. (2015) The Politics of African Industrial Policy: A Comparative Perspective. Cambridge: Cambridge University Press. Wignaraja, G. (2015) ‘4 ways to boost SME access to finance from commercial banks in ASEAN’, Asian Development Bank, 2 October 2015. Wild, L., Booth, D., Cummings, C., Foresti, M. and Wales, J. (2015) 'Adapting Development: Improving Services for the Poor’. London: Overseas Development Institute. Woodruff, C. (2014) ‘Managing for efficiency in the garment sector’, in D.W. te Velde (ed)., Enhancing productivity in Bangladesh’s garment sector. DFID ESRC Growth Research Programme Policy Essays. World Bank. (2011) ‘Country Assistance Strategy for the United Republic of Tanzania for the Period FY 2012-2015’, May 2011. World Bank (2014) ‘Tanzania Country Economic Memorandum’, September 2014. World Bank (2015a) ‘Why Should Tanzanians Pay Taxes? The unavoidable need to finance economic development’, Tanzania Economic Update, Issue 7, July 2015 World Bank (2015b) ‘World Bank to Help Strengthen Public Institutions to Deliver Key Services in Burundi’, Available from: http://www.worldbank.org/en/news/press-release/2015/04/22/world-bank-strengthen-public-institutions-key-services-burundi Zee, H.J., Stotsky, J. and Ley, E. (2002) ‘Tax incentives for business investment: A primer for policy makers in developing countries’, World Development, 30(9): 1497-1516.
SUPPORTING THE PREPARATION OF TANZANIA’S SECOND FIVE YEAR DEVELOPMENT PLAN (FYDP II) 2016/17 – 2021/22
138
APPENDIX A – DATA SOURCES We have used amongst others the following national data sources:
- Rebased national accounts data from the NBS
- Population census data for 2002 and 2012
- Formal Employment and Earning Survey (FEES)
- Annual Survey of Industry Production (ASIP)
- “Employment and Earning Survey, Analytic Reports”, NBS, various years
- A survey on Micro, Small, Medium Enterprise (MSME) in 2010
- LFS 2006 and 2014
- Bank of Tanzania
We have also used a number of international data sources, including:
o Comtrade (Commodity Trade Statistics) Database (United Nations)
O TRADE MAP – INTERNATIONAL TRADE CENTRE (ITC)
o Atlas of Economic Complexity – Center for International Development at Harvard University o Diversification measures from IMF toolkit o Eora Multi-Region Input–Output Database
o Groningen Growth and Development Centre (GGDC), the 10-Sector Database, version 2014;
o WDI;
o Global Employment Trends (GET) 2014 supporting datasets – ILO;
o Demographic and Health Surveys (DHSs) (as an example of household-level data) o World Economic Forum Global Competitiveness Rankings o World Bank Doing Business Database o Africa Sector Database o UNSTATS
These international data have been widely discussed in Tanzania (e.g. at a DFID/ESRC DFID- Economic and Social Research Council (ESRC) Growth Research Programme (DEGRP)/ Research on Poverty Alleviation (REPOA) conference on 23 February 2015), e.g. see conference note and other downloads available from: http://degrp.squarespace.com/events/2015/1/29/economic-transformation-tanzania.
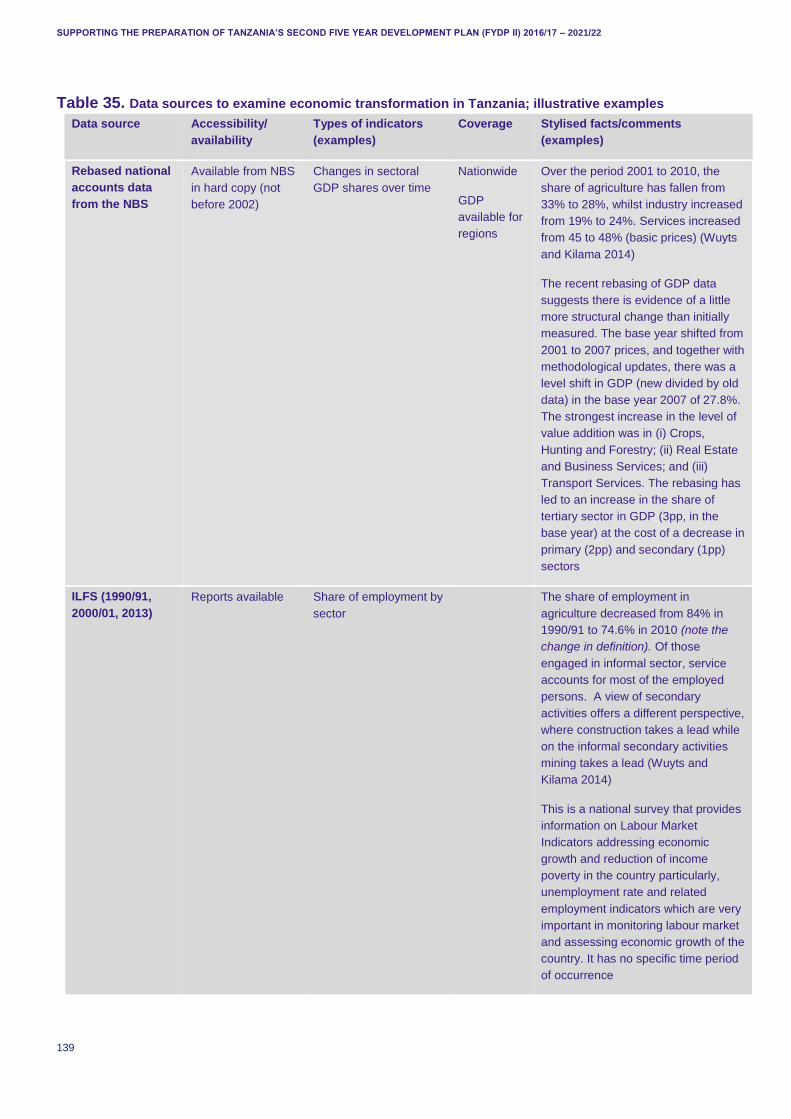
SUPPORTING THE PREPARATION OF TANZANIA’S SECOND FIVE YEAR DEVELOPMENT PLAN (FYDP II) 2016/17 – 2021/22
139
Table 35. Data sources to examine economic transformation in Tanzania; illustrative examples
Data source Accessibility/
availability Types of indicators
(examples) Coverage Stylised facts/comments
(examples)
Rebased national
accounts data
from the NBS
Available from NBS
in hard copy (not
before 2002)
Changes in sectoral
GDP shares over time
Nationwide
GDP
available for
regions
Over the period 2001 to 2010, the
share of agriculture has fallen from
33% to 28%, whilst industry increased
from 19% to 24%. Services increased
from 45 to 48% (basic prices) (Wuyts
and Kilama 2014)
The recent rebasing of GDP data
suggests there is evidence of a little
more structural change than initially
measured. The base year shifted from
2001 to 2007 prices, and together with
methodological updates, there was a
level shift in GDP (new divided by old
data) in the base year 2007 of 27.8%.
The strongest increase in the level of
value addition was in (i) Crops,
Hunting and Forestry; (ii) Real Estate
and Business Services; and (iii)
Transport Services. The rebasing has
led to an increase in the share of
tertiary sector in GDP (3pp, in the
base year) at the cost of a decrease in
primary (2pp) and secondary (1pp)
sectors
ILFS (1990/91,
2000/01, 2013) Reports available Share of employment by
sector
The share of employment in
agriculture decreased from 84% in
1990/91 to 74.6% in 2010 (note the
change in definition). Of those
engaged in informal sector, service
accounts for most of the employed
persons. A view of secondary
activities offers a different perspective,
where construction takes a lead while
on the informal secondary activities
mining takes a lead (Wuyts and
Kilama 2014)
This is a national survey that provides
information on Labour Market
Indicators addressing economic
growth and reduction of income
poverty in the country particularly,
unemployment rate and related
employment indicators which are very
important in monitoring labour market
and assessing economic growth of the
country. It has no specific time period
of occurrence
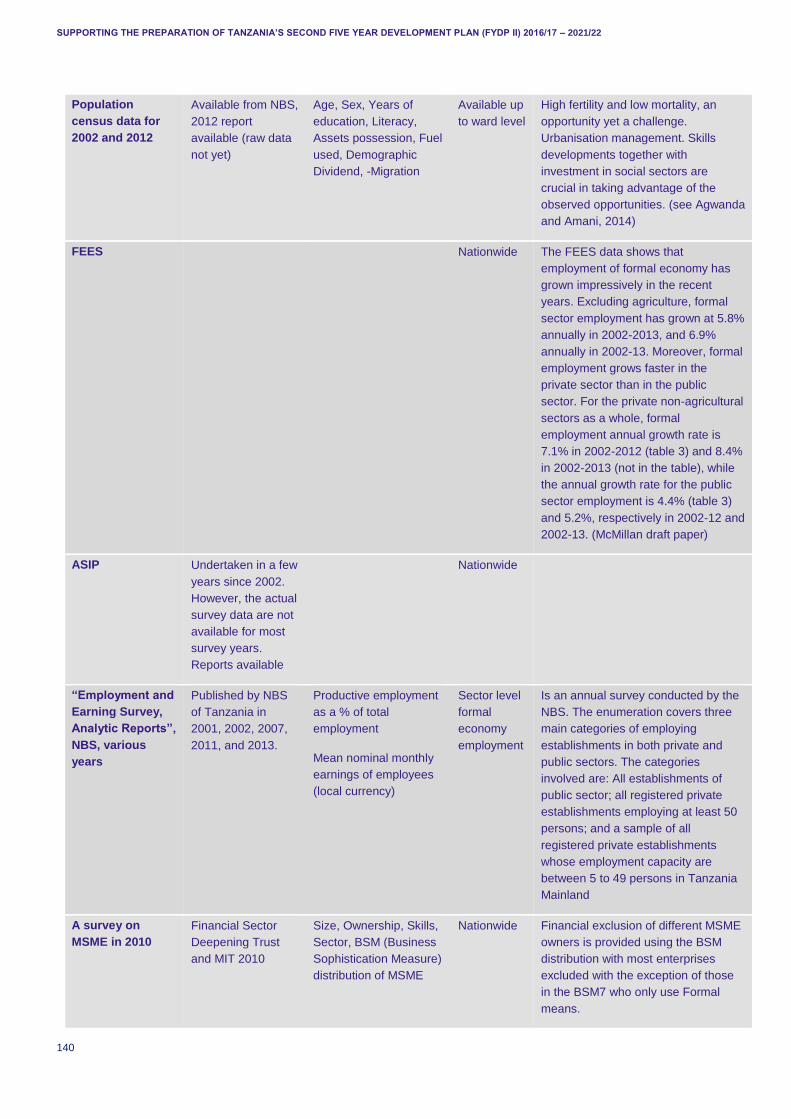
SUPPORTING THE PREPARATION OF TANZANIA’S SECOND FIVE YEAR DEVELOPMENT PLAN (FYDP II) 2016/17 – 2021/22
140
Population
census data for
2002 and 2012
Available from NBS,
2012 report
available (raw data
not yet)
Age, Sex, Years of
education, Literacy,
Assets possession, Fuel
used, Demographic
Dividend, -Migration
Available up
to ward level High fertility and low mortality, an
opportunity yet a challenge.
Urbanisation management. Skills
developments together with
investment in social sectors are
crucial in taking advantage of the
observed opportunities. (see Agwanda
and Amani, 2014)
FEES Nationwide The FEES data shows that
employment of formal economy has
grown impressively in the recent
years. Excluding agriculture, formal
sector employment has grown at 5.8%
annually in 2002-2013, and 6.9%
annually in 2002-13. Moreover, formal
employment grows faster in the
private sector than in the public
sector. For the private non-agricultural
sectors as a whole, formal
employment annual growth rate is
7.1% in 2002-2012 (table 3) and 8.4%
in 2002-2013 (not in the table), while
the annual growth rate for the public
sector employment is 4.4% (table 3)
and 5.2%, respectively in 2002-12 and
2002-13. (McMillan draft paper)
ASIP Undertaken in a few
years since 2002.
However, the actual
survey data are not
available for most
survey years.
Reports available
Nationwide
“Employment and
Earning Survey,
Analytic Reports”,
NBS, various
years
Published by NBS
of Tanzania in
2001, 2002, 2007,
2011, and 2013.
Productive employment
as a % of total
employment
Mean nominal monthly
earnings of employees
(local currency)
Sector level
formal
economy
employment
Is an annual survey conducted by the
NBS. The enumeration covers three
main categories of employing
establishments in both private and
public sectors. The categories
involved are: All establishments of
public sector; all registered private
establishments employing at least 50
persons; and a sample of all
registered private establishments
whose employment capacity are
between 5 to 49 persons in Tanzania
Mainland
A survey on
MSME in 2010 Financial Sector
Deepening Trust
and MIT 2010
Size, Ownership, Skills,
Sector, BSM (Business
Sophistication Measure)
distribution of MSME
Nationwide Financial exclusion of different MSME
owners is provided using the BSM
distribution with most enterprises
excluded with the exception of those
in the BSM7 who only use Formal
means.
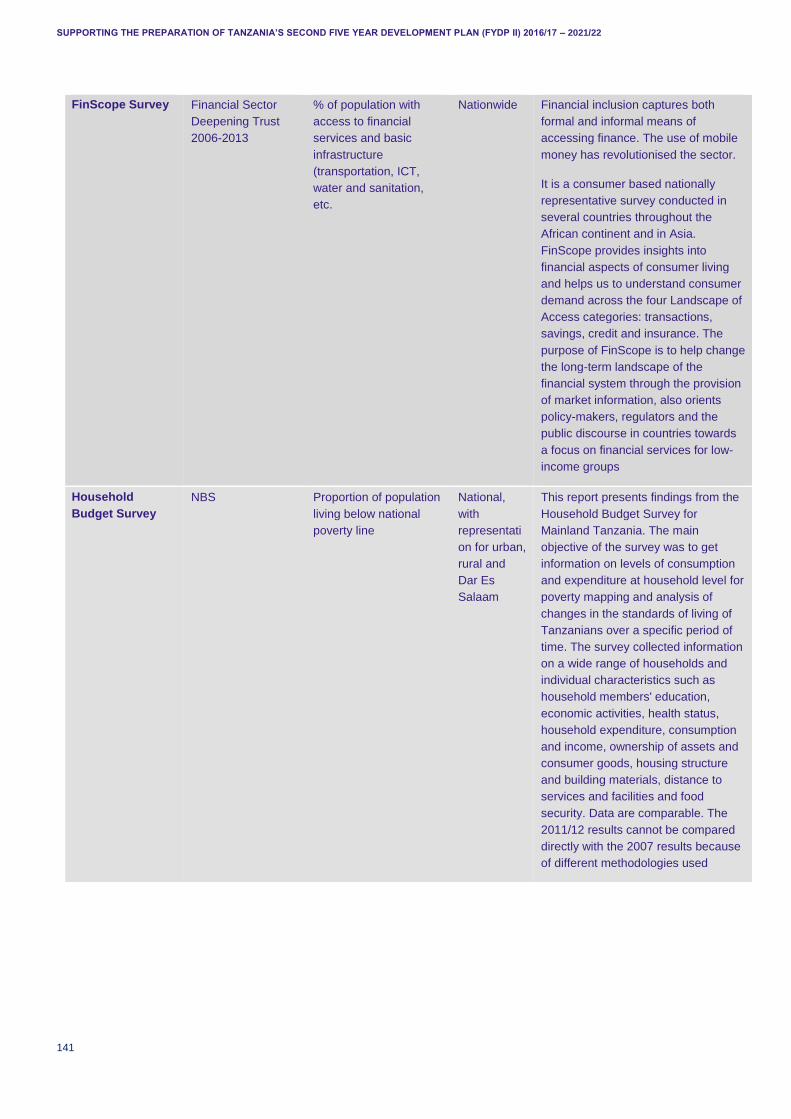
SUPPORTING THE PREPARATION OF TANZANIA’S SECOND FIVE YEAR DEVELOPMENT PLAN (FYDP II) 2016/17 – 2021/22
141
FinScope Survey Financial Sector
Deepening Trust
2006-2013
% of population with
access to financial
services and basic
infrastructure
(transportation, ICT,
water and sanitation,
etc.
Nationwide Financial inclusion captures both
formal and informal means of
accessing finance. The use of mobile
money has revolutionised the sector.
It is a consumer based nationally
representative survey conducted in
several countries throughout the
African continent and in Asia.
FinScope provides insights into
financial aspects of consumer living
and helps us to understand consumer
demand across the four Landscape of
Access categories: transactions,
savings, credit and insurance. The
purpose of FinScope is to help change
the long-term landscape of the
financial system through the provision
of market information, also orients
policy-makers, regulators and the
public discourse in countries towards
a focus on financial services for low-
income groups
Household
Budget Survey NBS Proportion of population
living below national
poverty line
National,
with
representati
on for urban,
rural and
Dar Es
Salaam
This report presents findings from the
Household Budget Survey for
Mainland Tanzania. The main
objective of the survey was to get
information on levels of consumption
and expenditure at household level for
poverty mapping and analysis of
changes in the standards of living of
Tanzanians over a specific period of
time. The survey collected information
on a wide range of households and
individual characteristics such as
household members' education,
economic activities, health status,
household expenditure, consumption
and income, ownership of assets and
consumer goods, housing structure
and building materials, distance to
services and facilities and food
security. Data are comparable. The
2011/12 results cannot be compared
directly with the 2007 results because
of different methodologies used
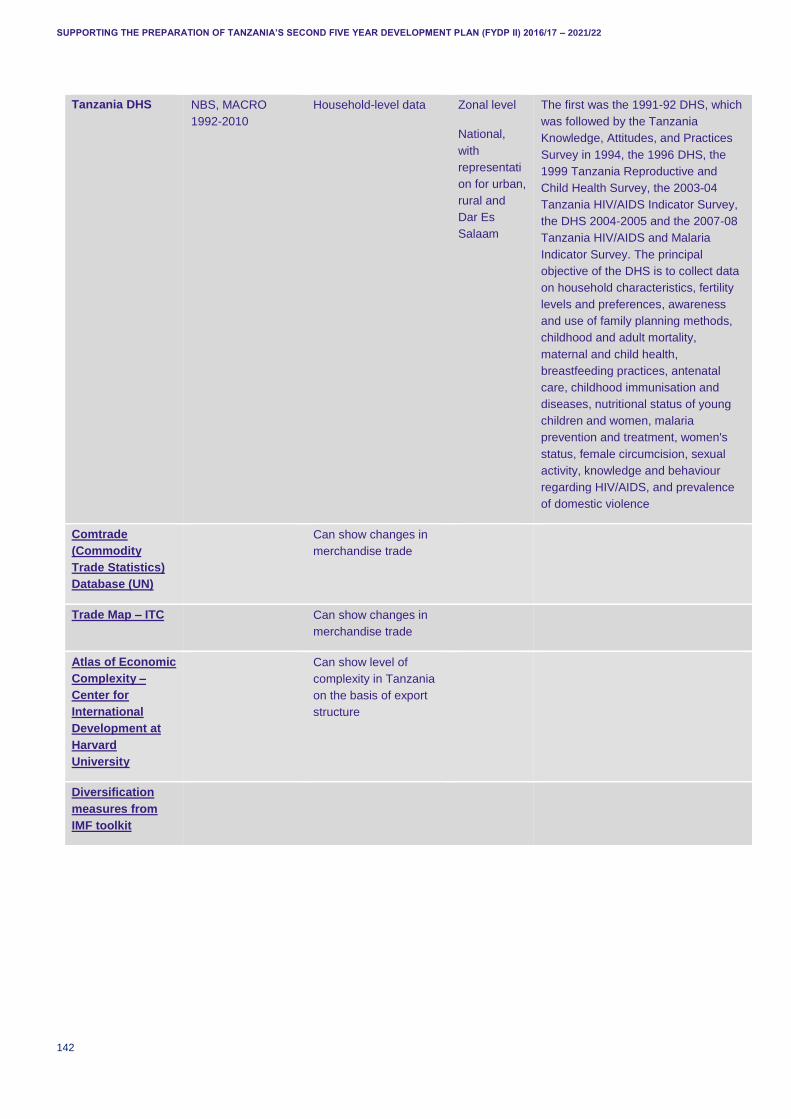
SUPPORTING THE PREPARATION OF TANZANIA’S SECOND FIVE YEAR DEVELOPMENT PLAN (FYDP II) 2016/17 – 2021/22
142
Tanzania DHS
NBS, MACRO
1992-2010 Household-level data Zonal level
National,
with
representati
on for urban,
rural and
Dar Es
Salaam
The first was the 1991-92 DHS, which
was followed by the Tanzania
Knowledge, Attitudes, and Practices
Survey in 1994, the 1996 DHS, the
1999 Tanzania Reproductive and
Child Health Survey, the 2003-04
Tanzania HIV/AIDS Indicator Survey,
the DHS 2004-2005 and the 2007-08
Tanzania HIV/AIDS and Malaria
Indicator Survey. The principal
objective of the DHS is to collect data
on household characteristics, fertility
levels and preferences, awareness
and use of family planning methods,
childhood and adult mortality,
maternal and child health,
breastfeeding practices, antenatal
care, childhood immunisation and
diseases, nutritional status of young
children and women, malaria
prevention and treatment, women's
status, female circumcision, sexual
activity, knowledge and behaviour
regarding HIV/AIDS, and prevalence
of domestic violence
Comtrade
(Commodity
Trade Statistics)
Database (UN)
Can show changes in
merchandise trade
Trade Map – ITC Can show changes in
merchandise trade
Atlas of Economic
Complexity –
Center for
International
Development at
Harvard
University
Can show level of
complexity in Tanzania
on the basis of export
structure
Diversification
measures from
IMF toolkit
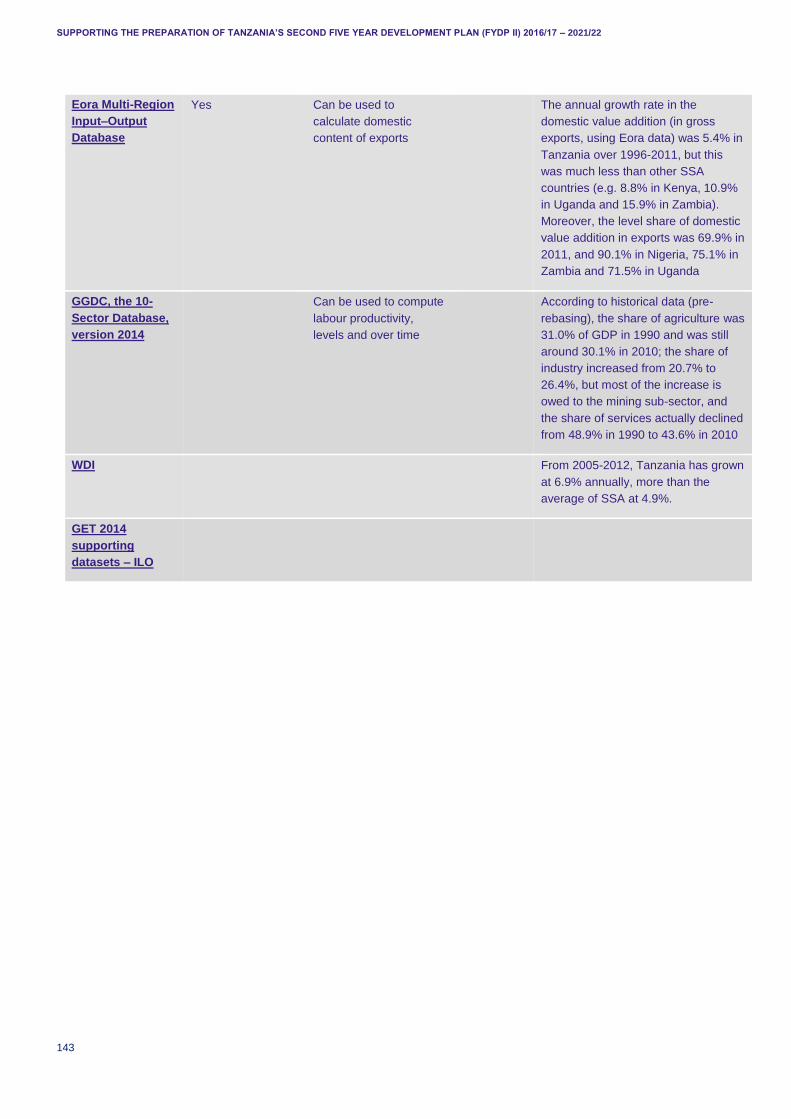
SUPPORTING THE PREPARATION OF TANZANIA’S SECOND FIVE YEAR DEVELOPMENT PLAN (FYDP II) 2016/17 – 2021/22
143
Eora Multi-Region
Input–Output
Database
Yes Can be used to
calculate domestic
content of exports
The annual growth rate in the
domestic value addition (in gross
exports, using Eora data) was 5.4% in
Tanzania over 1996-2011, but this
was much less than other SSA
countries (e.g. 8.8% in Kenya, 10.9%
in Uganda and 15.9% in Zambia).
Moreover, the level share of domestic
value addition in exports was 69.9% in
2011, and 90.1% in Nigeria, 75.1% in
Zambia and 71.5% in Uganda
GGDC, the 10-
Sector Database,
version 2014
Can be used to compute
labour productivity,
levels and over time
According to historical data (pre-
rebasing), the share of agriculture was
31.0% of GDP in 1990 and was still
around 30.1% in 2010; the share of
industry increased from 20.7% to
26.4%, but most of the increase is
owed to the mining sub-sector, and
the share of services actually declined
from 48.9% in 1990 to 43.6% in 2010
WDI From 2005-2012, Tanzania has grown
at 6.9% annually, more than the
average of SSA at 4.9%.
GET 2014
supporting
datasets – ILO
SUPPORTING THE PREPARATION OF TANZANIA’S SECOND FIVE YEAR DEVELOPMENT PLAN (FYDP II) 2016/17 – 2021/22
144
APPENDIX B – USING A SOCIAL ACCOUNTING MATRIX TO CALCULATE OUTPUT AND EMPLOYMENT EFFECTS IN TANZANIA A policy maker interested in promoting economic transformation needs information about the type of sectors and activities that have the greatest knock on effects on output and employment of different types of labour. The most appropriate sectors have the ability of raising the output of other sectors through backward linkages and generate jobs.
Output and employment multipliers calculate the value of production in all sectors and payments to factors of production (mainly labour) that will be necessary in order to meet a level of final demand. They will take into account the direct and indirect effects through all sectors of the economy. The analysis can also be turned around. In this example, we calculate output and employment multipliers using SAMs for Tanzania.
There are a number of data options for calculating multiplier, but at the minimum, they need to include information about how sectors are linked to each other through purchasing and delivering inputs. Input-output tables usually contain these data. For this example, we use the Tanzanian SAM for 2009 (Angga and Diao, 2014). It represents 58 activities and commodities and distinguishes between different types of labour (unfinished primary education, primary education completed, secondary education completed and tertiary education completed), capital and land. The matrix represents the transfers and transactions between sectors and institutions. Activities purchase factors and use these to produce goods and services. They sell them via commodity markets (plus imports) to households, the government, investors and the rest of the world. This circular framework implies that each institution’s expenditure becomes the income of another institution. For additional discussion, please see Pyatt and Round (1985) and Relnert and Roland-Host (1997).
An increase in an exogenous variable, such as exports, raises output in a sector, which triggers both direct and indirect effects. Direct effects are those affecting exclusively the sector where the shock hit first. For example, an increase in the demand of maize will have a direct impact in the maize production. In addition, it will have indirect effects coming from the maize production linkages to other sectors. In turn, the production effect on these other sectors might also influence maize production through their linkages with this sector. When we add the direct and indirect effects, we get a measure of the multiplier effect of the shock.
The recursion present between direct and indirect effects, where the effects on the backward linkages may affect the sector where the shock originated, is worked out using the Leontieff input-output model. This framework estimates the effects of a one-unit increase in the sectoral final demand on the output of all the sectors of the economy. In addition, it indicates the total effect on the payments to each of the production factors (a payroll effect). This will include both the payments made by the sector directly affected and those made through the indirect effects. Assuming infinitely elastic labour supply in such a way that changes in the payments to factors are attributed exclusively to changes in quantities, it is possible to find the effects of the shock on the use of each of the factors of production. More discussion and detailed formulae on the multipliers can be found in Round (2003) and Breisinger et al (2009).
It is important to highlight the unconstrained nature of this exercise. It is assumed that the economy can meet any final demand shock and that no frictions exist. In reality, there will be competition for resources. For example, maize, sorghum, oilseeds tend to compete for land. This means that an increase in the demand for one of these crops may require the reduction of output in the others. Moreover, some sectors have their output capacity limited. For example, the output of mining depends on the availability of the mineral resource extracted. Although, it is possible to introduce output limitations to the input-output model, the competition for resources as well as other interactions between all the markets in the economy need to be explored with other methodologies such as computable general equilibrium models.
SUPPORTING THE PREPARATION OF TANZANIA’S SECOND FIVE YEAR DEVELOPMENT PLAN (FYDP II) 2016/17 – 2021/22
145
An additional limitation of the input-output model is associated with its high level of sectoral aggregation. As we mentioned, the Tanzanian SAM includes 58 sectors. Although it presents a detailed disaggregation for agriculture and food products, it presents very high levels of aggregation in the rest of the sectors. This presents problems at the time of evaluating the effects, as it is necessary to extend average results to multiple products and subsectors. For example, machinery and vehicles represents a very heterogeneous group of sectors that will receive the same impact. Other methodologies, such as partial equilibrium models, allow a further disaggregation of the economy; however, the indirect effects, by definition, are lost.
Finally, the data requirements of input-output tables and SAMs are very high. This implies that they are frequently outdated (the current version for Tanzania from the International Food Policy Research Institute (IFPRI) refers to 2009, and we know that the economy has changed since then; national sources have an I-O matrix dating from 1980 and a new version is only now being estimated). Moreover, they represent single points in time without further observations in the past. As long as the economy has not been subjected to shocks that have changed substantially the structure of the economy, it is possible to use a “recent” SAM. However, any economy would experience long-term transformations, which require updates of input-output tables or SAMs.
OUTPUT AND EMPLOYMENT EFFECTS
Table 36 presents the multiplier effects in output and in labour and the value of the exports in each sector. Each number indicates the increase in the output or payment to labour (in billions of Tanzanian Shillings, or any other unit) of an increase of one billion in the final demand of each product. A one unit shock (e.g. one billion Tanzanian shilling) applied to maize, for example, will have a total output effect of 2.07 units (in billions of Tanzanian Shillings). This includes the direct effect on maize and the indirect effects on the rest of the sectors. In addition, the shock will increase the total payments to workers with secondary education completed by 0.16 billion of Tanzanian Shillings (third column) and by 0.23 billion to workers with primary education completed. Therefore, it is possible to identify the sectors that will have a stronger multiplier effect on output and on (different types of) labour.
The direct and the indirect effects on employment can be approximated by looking into the share of the remuneration to labour in total inputs. As one unit of increase in demand would initially increase supply by one unit, the share of labour in total inputs indicate how much would be spend directly in the labour hired by that sector. This can help to give an idea of the main drivers of the effect. The higher this share, the higher would be the direct effect on employment.
The sectors placed in the top of the table have the highest output multiplier (although many sectors are not currently exporting). These are sectors with important final demand components. However, the limited size of the domestic market makes may hamper final demand which makes them unlikely stimulate large increases in output and employment. They could only do so if they manage to find additional demand in the rest of the world. Moreover, the direct effects primarily explain the size of the total multipliers because the backward linkages in these sectors tend to be small.
If we go further down the table, there are some sectors with positive and large exports and important multiplier effect. These are typical industrial products (sisal, livestock, fisheries, pulses, cashews) but also services such as hotels and catering. The latter is associated with, among other activities, tourism.
SUPPORTING THE PREPARATION OF TANZANIA’S SECOND FIVE YEAR DEVELOPMENT PLAN (FYDP II) 2016/17 – 2021/22
146
Table 36. Multiplier effect of increase of TZ 1 billion in final demand by product
Value of
exports Output
Share of
employment
in inputs
Tertiary
education
Second.
education
Primary
education
Less than
primary
education
Business
services 2.89 0.5 0.38 0.62 0.1 0.02
Government adm 2.75 0.5 0.53 0.47 0.09 0.02
Maize milling 3,139 2.63 0.1 0.04 0.21 0.2 0.04
Education 2.58 0.5 0.48 0.38 0.09 0.02
Sugarcane 2.49 0.3 0.05 0.17 0.41 0.06
Health 2.44 0.5 0.47 0.37 0.08 0.02
Sisal 21,157 2.38 0.2 0.05 0.19 0.26 0.13
Hotels / catering 380,049 2.36 0.2 0.08 0.33 0.16 0.03
Ot private
services 2.32 0.5 0.17 0.56 0.14 0.02
Construction 2.21 0.4 0.09 0.51 0.13 0.03
Retail /wholesale 2.21 0.6 0.15 0.58 0.15 0.04
Rice 214 2.2 0.2 0.04 0.16 0.3 0.04
Cattle 3,253 2.2 0.3 0.04 0.17 0.33 0.06
Rice milling 3,467 2.2 0.1 0.04 0.18 0.18 0.02
Electricity 2.18 0.2 0.11 0.33 0.08 0.03
Poultry 93 2.17 0.3 0.04 0.17 0.33 0.06
Comm’s and post 2.16 0.2 0.13 0.31 0.08 0.02
Sorghum 777 2.15 0.2 0.05 0.19 0.21 0.08
Other livestock 28,169 2.13 0.3 0.04 0.16 0.31 0.06
Pulses 100,618 2.12 0.3 0.04 0.15 0.38 0.07
Cashews 185,982 2.12 0.4 0.04 0.16 0.46 0.1
Meat, fish / dairy 789 2.12 0.5 0.08 0.44 0.22 0.04
Water 2.12 0.1 0.1 0.28 0.08 0.02
Maize 7,146 2.07 0.2 0.04 0.16 0.23 0.04
Plantains 2.07 0.3 0.04 0.16 0.35 0.08
Fisheries 355,996 2.07 0.5 0.04 0.16 0.48 0.11
Other root crops 338 2.05 0.2 0.04 0.15 0.31 0.04
Tobacco
cure/proc 6,485 2.02 0.3 0.11 0.32 0.12 0.03
Forestry 60,532 2 0.8 0.05 0.82 0.1 0.06
Millet 593 1.99 0.1 0.04 0.17 0.18 0.06
Coffee 126,789 1.98 0.3 0.04 0.16 0.36 0.05
Leaf tea 69,248 1.98 0.3 0.05 0.19 0.29 0.05
Cassava 1.92 0.1 0.04 0.14 0.17 0.03
Cotton 198,848 1.92 0.3 0.05 0.2 0.28 0.04
Oilseeds 53,890 1.9 0.3 0.03 0.14 0.35 0.07
Other crops 39,425 1.9 0.2 0.04 0.14 0.28 0.06
SUPPORTING THE PREPARATION OF TANZANIA’S SECOND FIVE YEAR DEVELOPMENT PLAN (FYDP II) 2016/17 – 2021/22
147
Value of
exports Output
Share of
employment
in inputs
Tertiary
education
Second.
education
Primary
education
Less than
primary
education
Vegetables 30,011 1.86 0.3 0.03 0.14 0.33 0.04
Fruits 2,537 1.82 0.3 0.03 0.14 0.31 0.04
Coconuts 39,600 1.74 0.3 0.03 0.13 0.32 0.06
Transport/storage 2,434,240 1.51 0.3 0.11 0.29 0.07 0.01
Tobacco 177,354 1.37 0.3 0.03 0.12 0.22 0.03
Beverages 18,059 1.33 0.1 0.05 0.14 0.08 0.02
Non-metals 37,444 1.32 0.1 0.04 0.16 0.04 0.01
Mining 836,010 1.25 0.0 0.03 0.1 0.04 0.01
Other milling 114,716 1.07 0.1 0.02 0.11 0.06 0.02
Rubber products 7,783 1.01 0.1 0.03 0.12 0.03 0.01
Sugar refining 19,097 0.97 0.2 0.04 0.12 0.07 0.02
Ot food
processing 204,364 0.95 0.1 0.03 0.09 0.08 0.02
Financial services 593,750 0.9 0.3 0.08 0.15 0.03 0.01
Textiles /clothing 120,714 0.69 0.3 0.03 0.13 0.05 0.01
Wood products 24,627 0.6 0.1 0.02 0.11 0.02 0.01
Metals 61,890 0.51 0.1 0.02 0.05 0.02 0
Ot manufacturing 28,095 0.46 0.1 0.02 0.07 0.02 0.01
Other cereals 30,892 0.22 0.2 0 0.02 0.03 0
Machinery/ vehic 65,325 0.16 0.0 0 0.01 0.01 0
Petroleum 0.13 0.1 0 0.02 0 0
Fertilizer 8,744 0.1 0.2 0 0.01 0 0
Chemicals 51,063 0.09 0.2 0 0.02 0 0
Source: Own calculations and Tanzanian SAM
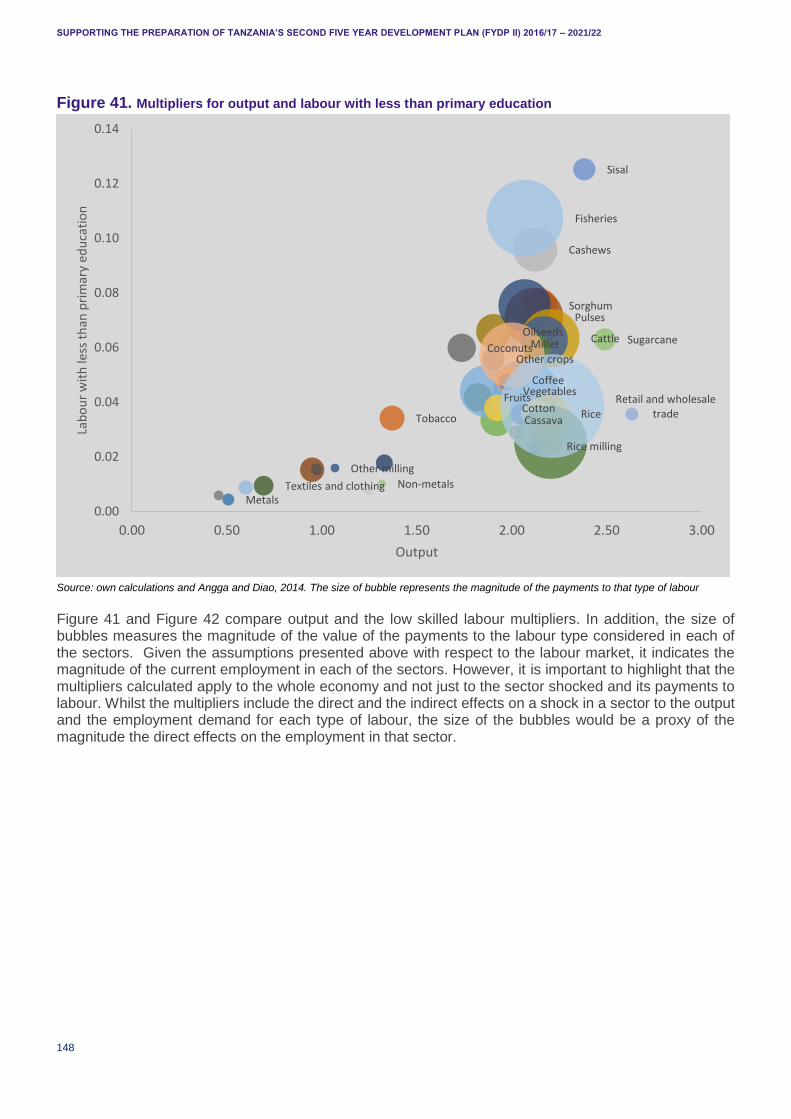
SUPPORTING THE PREPARATION OF TANZANIA’S SECOND FIVE YEAR DEVELOPMENT PLAN (FYDP II) 2016/17 – 2021/22
148
Figure 41. Multipliers for output and labour with less than primary education
Source: own calculations and Angga and Diao, 2014. The size of bubble represents the magnitude of the payments to that type of labour
Figure 41 and Figure 42 compare output and the low skilled labour multipliers. In addition, the size of bubbles measures the magnitude of the value of the payments to the labour type considered in each of the sectors. Given the assumptions presented above with respect to the labour market, it indicates the magnitude of the current employment in each of the sectors. However, it is important to highlight that the multipliers calculated apply to the whole economy and not just to the sector shocked and its payments to labour. Whilst the multipliers include the direct and the indirect effects on a shock in a sector to the output and the employment demand for each type of labour, the size of the bubbles would be a proxy of the magnitude the direct effects on the employment in that sector.
Sorghum
Millet
RiceCassava
Pulses
Coconuts
Oilseeds
FruitsVegetables
Coffee
Cashews
Cotton
Sisal
Sugarcane
Tobacco
Other crops
Cattle
Fisheries
Rice milling
Other milling
Textiles and clothing Non-metals
Metals
Retail and wholesale trade
0.00
0.02
0.04
0.06
0.08
0.10
0.12
0.14
0.00 0.50 1.00 1.50 2.00 2.50 3.00
Lab
ou
r w
ith
less
th
an p
rim
ary
edu
cati
on
Output
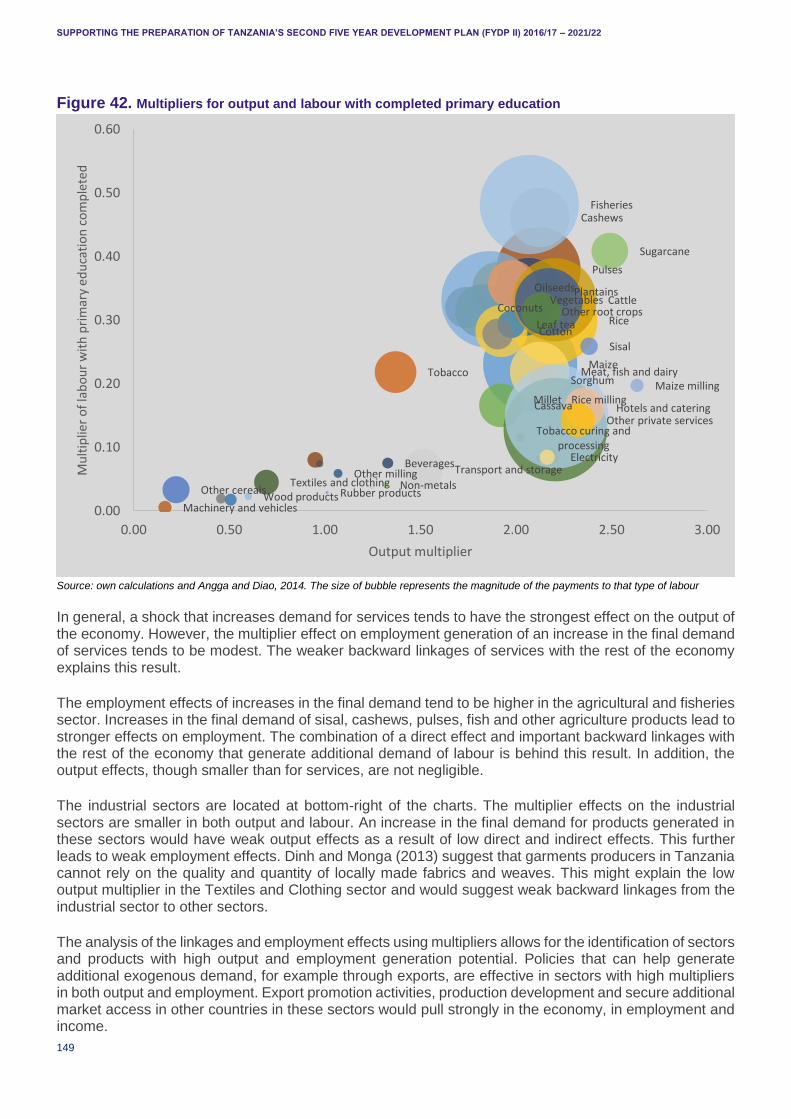
SUPPORTING THE PREPARATION OF TANZANIA’S SECOND FIVE YEAR DEVELOPMENT PLAN (FYDP II) 2016/17 – 2021/22
149
Figure 42. Multipliers for output and labour with completed primary education
Source: own calculations and Angga and Diao, 2014. The size of bubble represents the magnitude of the payments to that type of labour
In general, a shock that increases demand for services tends to have the strongest effect on the output of the economy. However, the multiplier effect on employment generation of an increase in the final demand of services tends to be modest. The weaker backward linkages of services with the rest of the economy explains this result.
The employment effects of increases in the final demand tend to be higher in the agricultural and fisheries sector. Increases in the final demand of sisal, cashews, pulses, fish and other agriculture products lead to stronger effects on employment. The combination of a direct effect and important backward linkages with the rest of the economy that generate additional demand of labour is behind this result. In addition, the output effects, though smaller than for services, are not negligible.
The industrial sectors are located at bottom-right of the charts. The multiplier effects on the industrial sectors are smaller in both output and labour. An increase in the final demand for products generated in these sectors would have weak output effects as a result of low direct and indirect effects. This further leads to weak employment effects. Dinh and Monga (2013) suggest that garments producers in Tanzania cannot rely on the quality and quantity of locally made fabrics and weaves. This might explain the low output multiplier in the Textiles and Clothing sector and would suggest weak backward linkages from the industrial sector to other sectors.
The analysis of the linkages and employment effects using multipliers allows for the identification of sectors and products with high output and employment generation potential. Policies that can help generate additional exogenous demand, for example through exports, are effective in sectors with high multipliers in both output and employment. Export promotion activities, production development and secure additional market access in other countries in these sectors would pull strongly in the economy, in employment and income.
Maize
Sorghum
Millet
Rice
Other cereals
Cassava
Other root crops
Pulses
Coconuts
OilseedsPlantainsVegetables
Cashews
Cotton
Sisal
Sugarcane
Leaf tea
Tobacco
Cattle
Fisheries
Meat, fish and dairyMaize milling
Rice milling
Other milling
Tobacco curing and processing
Beverages
Textiles and clothingWood products Rubber products
Non-metals
Machinery and vehicles
Electricity
Hotels and catering
Transport and storage
Other private services
0.00
0.10
0.20
0.30
0.40
0.50
0.60
0.00 0.50 1.00 1.50 2.00 2.50 3.00
Mu
ltip
lier
of
lab
ou
r w
ith
pri
mar
y ed
uca
tio
n c
om
ple
ted
Output multiplier
SUPPORTING THE PREPARATION OF TANZANIA’S SECOND FIVE YEAR DEVELOPMENT PLAN (FYDP II) 2016/17 – 2021/22
150
Agricultural products (cashews, pulses, sorghum, sisal) and fish, among others, present strong output and employment effects, particularly in the lowest levels of skill. However, some services sectors, particularly those that can be associated to tourism such as hotels and catering, are feature high employment effects although their capability in generating output in the rest of the economy are more limited.
HOW TO CALCULATE MULTIPLIERS USING A SOCIAL ACCOUNTING MATRIX
The calculations of the output and employment multipliers are based on the Leontieff model. They use an input-output table or an SAM. An SAM contains payments and transfers between activities, households, markets and other economic agents representing a given economy in a particular point in time. The SAM is a square matrix formed by the following sub-matrices:
Table 37. Social accounting matrix
Activities Commodities Factors Households Exogenous
Demand
Total
Activities Xji X
Commodities Zij Hi Ei Z
Factors Vj V
Households V Y
Exogenous
Demand
Gj S E
Total X Z V Y E
Activities pay for the commodities (represented by Zij) used in production. These products are then domestically commercialised (Xji). Activities also pay for factors of production (labour, land and capital) for their use and they are represented by matrix Vj. X represents the value of their output.
The total demand (Z) consists of intermediate use (Zij), household demand (Hi), and exogenous demand (Ej). By exogenous we mean that the model does not determine that type of demand. The exogenous demand builds up primarily from government consumption, investment and exports. Total supply consists of domestic supply and imports (Gj). Households derive their income from factors (V) which they spent on goods; they also pay direct taxes and/or receive subsidies (S)
To apply the Leontieff model we need to divide each element in each column by its column total to derive the technical coefficients matrix M:
Table 38. Matrix of technical coefficients
Activities Commodities Factors Households Exogenous
Demand
Total
Activities bji =Xji/Zi X
Commodities aij= Zij/Xj ci =Hi/Y Ei Z
Factors vj =Vj/Xj V
Households 1 Y
Exogenous
Demand
Ij =Gj/Zi s =S/Y E
Total X Z V Y E
Total demand Z can be expressed as
𝑍𝑖 = 𝑎𝑖𝑗𝑋𝑗 + 𝑐𝑖𝑌 + 𝐸𝑖 (1)
SUPPORTING THE PREPARATION OF TANZANIA’S SECOND FIVE YEAR DEVELOPMENT PLAN (FYDP II) 2016/17 – 2021/22
151
Gross output X is only a part of total demand Z
𝑋𝑗 = 𝑏𝑗𝑖𝑍𝑖 (2)
At the same time, total household income is formed by the factors’ earnings:
𝑌 = 𝑣𝑗𝑋𝑗 (3)
Substituting 2 into 3 gives
𝑌 = 𝑣𝑗𝑏𝑗𝑖𝑍𝑖 (4)
Replacing equations 2 and 4 into 1
𝑍𝑖 = 𝑎𝑖𝑗𝑏𝑗𝑖𝑍𝑖 + 𝑐𝑖𝑣𝑗𝑏𝑗𝑖𝑍𝑖 + 𝐸𝑖 (5)
Moving all endogenous components to the right-hand side and grouping Z terms together yields
(1 − 𝑎𝑖𝑗𝑏𝑗𝑖 − 𝑐𝑖𝑣𝑗𝑏𝑗𝑖)𝑍𝑖 = 𝐸𝑖 (6)
Assuming any number of activities and commodities, 6 can be written as
(𝐼 − 𝑀)𝑍 = 𝐸 (7)
Rearranging terms
𝑍 = (𝐼 − 𝑀)−1𝐸 (8)
Equation 7 indicates the value of vector Z, supply, necessary to meet final demand E. Domestic production is a share of total supply, therefore
𝑋 = 𝑏(𝐼 − 𝑀)−1𝐸 (9)
An increase in the final demand (I.e. exports) would require an output large enough to meet its increased demand plus the intermediate demands of other activities. The employment multiplier is defined in the same way. This means
𝑉 = 𝑣𝑏(𝐼 − 𝑀)−1𝐸 (10)
DOMESTIC RESOURCE COST METHODOLOGY
The DRC methodology is used to measure a country’s CA within an industry based on factor prices. The formula – as cited and explained by Dinh and Monga (2013) - for DRC is as follows:
𝑑𝑗 =− ∑ 𝑓𝑠𝑗
𝑣𝑠𝑚𝑠=2
𝑢𝑗 − ��𝑗
Where dj is the DRC of product j; m is the number of primary factors of production; n is the number of products; vs is the accounting price for the sth primary factor (where s = 1 is the foreign exchange); fsj is the difference between the marginal (dollar) revenue of commodity j (uj) and the marginal (dollar) import requirements for the unit production of the commodity j (mj). Bar’s represent the total (both direct and indirect) primary factors of production.

SUPPORTING THE PREPARATION OF TANZANIA’S SECOND FIVE YEAR DEVELOPMENT PLAN (FYDP II) 2016/17 – 2021/22
152
Where the DRC is less than 1, the cost of domestic resources required to produce one unit of the good is less than any potential foreign exchange earnings from exporting the product, which means there is a CA in production, where governments should promote the manufacture and export of the good. Where the DRC is more than one, the opposite is true and import-substitution should not be promoted (Dinh and Monga, 2013).

SUPPORTING THE PREPARATION OF TANZANIA’S SECOND FIVE YEAR DEVELOPMENT PLAN (FYDP II) 2016/17 – 2021/22
153
APPENDIX C – VALUE ADDITION IN EXPORTS We have used Eora data to calculate the following variables:
DVA embodied in exports: The potential benefits from global value chain participation are most clearly demonstrated by the evolution of its DVA embodied in gross exports over time. Put simply, increasing DVA embodied in gross exports over time signifies greater value addition within the country itself. At the industry level, DVA consists of value added created in a specific industry itself, value added created in other domestic sectors supplying this industry, as well as previously exported intermediates re-imported from abroad for use in a given industry.
DVA embodied in exports as a share of exports: This indicator can be a relatively good proxy of value chain participation, with a decline in DVA as a share of gross exports indicative of participation in longer and more sophisticated value chains where more imported value added is in turn being re-exported. However, it could also suggest the declining significance of the services economy, which tends to have short value chains and high values of exported DVA as a share of exports.
Foreign value added (FVA): This is an indicator of backward integration. Increases in FVA in exports are indicative of a greater share of foreign inputs being exported by the respective country. Increasing backward integration tends to be particularly important for developing countries as it links to a number of measures of structural transformation.
We can also analyse the importance of each sector (including natural resources) in value addition in exports (including exports of manufactured goods).
The annual growth in domestic value addition in exports (calculated using Eora) was 5.4% over 2006-2011, whereas that in foreign value addition increased by 8% over the same period. The share of DVA has declined from nearly 90% in 2000 to around 70% in 2011. The local content of exports is lower than in many other countries. The annual growth rate in the domestic value addition (in gross exports, using Eora data) was 5.4% in Tanzania over 1996-2011, but this was much less than other SSA countries (e.g. 8.8% in Kenya, 10.9% in Uganda and 15.9% in Zambia). Moreover, the level share of domestic value addition in exports was 69.9% in 2011, and 90.1% in Nigeria, 75.1% in Zambia and 71.5% in Uganda.
The contribution to DVA has risen strongly over the last five years in a number of sectors including post and telecommunications, chemical and mineral products, electrical machinery, wood and paper, metal products and hotels and restaurants.
Figure 43. Compound annual growth rate of DVA, FVA and exports, 1996-2011 and 2006-11
Source: Own computations using Eora26 database
0%
5%
10%
15%
20%
25%
DVA FVA Exports
1996-2011
2006-2011
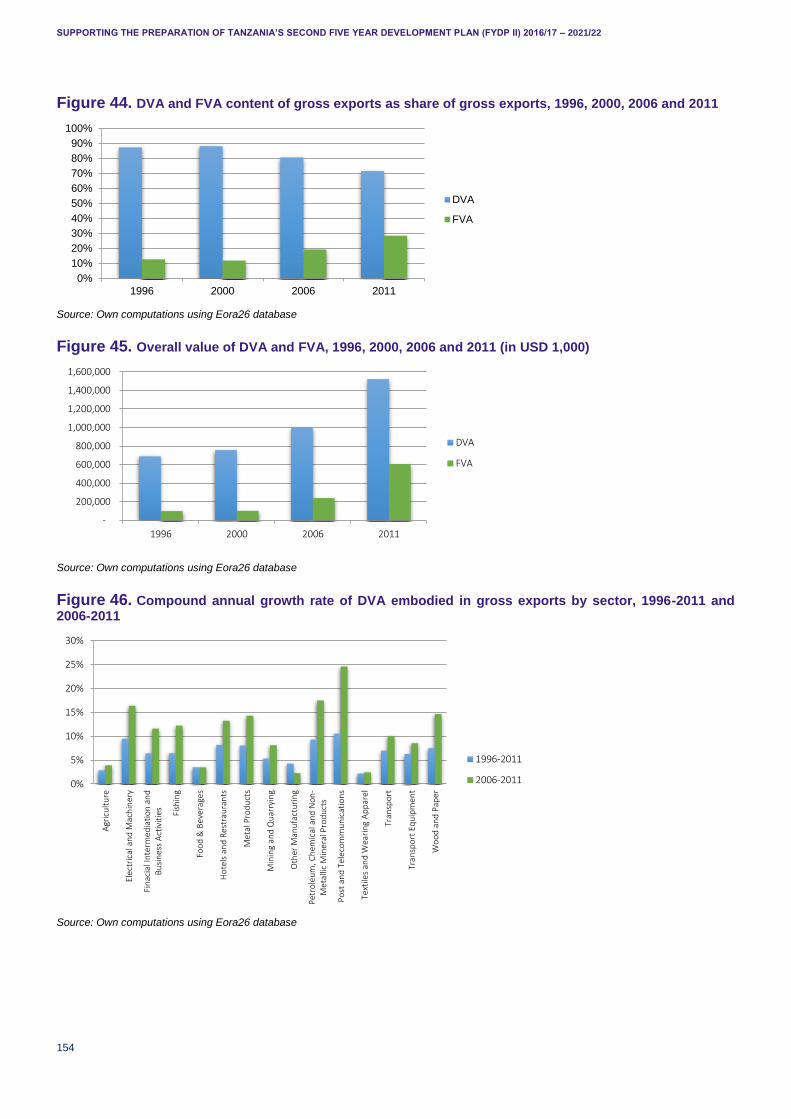
SUPPORTING THE PREPARATION OF TANZANIA’S SECOND FIVE YEAR DEVELOPMENT PLAN (FYDP II) 2016/17 – 2021/22
154
Figure 44. DVA and FVA content of gross exports as share of gross exports, 1996, 2000, 2006 and 2011
Source: Own computations using Eora26 database
Figure 45. Overall value of DVA and FVA, 1996, 2000, 2006 and 2011 (in USD 1,000)
Source: Own computations using Eora26 database
Figure 46. Compound annual growth rate of DVA embodied in gross exports by sector, 1996-2011 and 2006-2011
Source: Own computations using Eora26 database
0%
10%
20%
30%
40%
50%
60%
70%
80%
90%
100%
1996 2000 2006 2011
DVA
FVA
-
200,000
400,000
600,000
800,000
1,000,000
1,200,000
1,400,000
1,600,000
1996 2000 2006 2011
DVA
FVA
0%
5%
10%
15%
20%
25%
30%
Agr
icu
ltu
re
Elec
tric
al a
nd
Mac
hin
ery
Fin
acia
l In
term
ed
iati
on
an
dB
usi
nes
s A
ctiv
itie
s
Fish
ing
Foo
d &
Bev
erag
es
Ho
tels
an
d R
estr
aura
nts
Met
al P
rod
uct
s
Min
ing
and
Qu
arry
ing
Oth
er M
anu
fact
uri
ng
Pet
role
um
, Ch
emic
al a
nd
No
n-
Met
allic
Min
eral
Pro
du
cts
Po
st a
nd
Tel
eco
mm
un
icat
ion
s
Text
iles
and
Wea
rin
g A
pp
arel
Tran
spo
rt
Tran
spo
rt E
qu
ipm
ent
Wo
od
an
d P
aper
1996-2011
2006-2011
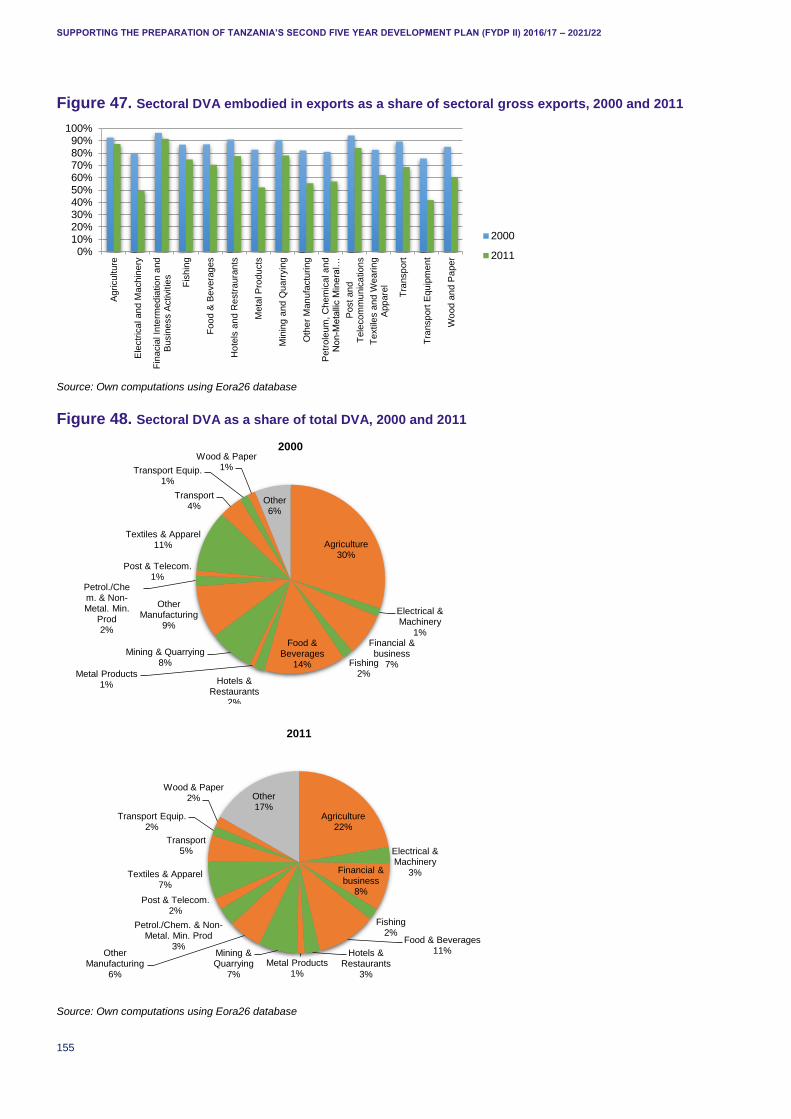
SUPPORTING THE PREPARATION OF TANZANIA’S SECOND FIVE YEAR DEVELOPMENT PLAN (FYDP II) 2016/17 – 2021/22
155
Figure 47. Sectoral DVA embodied in exports as a share of sectoral gross exports, 2000 and 2011
Source: Own computations using Eora26 database
Figure 48. Sectoral DVA as a share of total DVA, 2000 and 2011
Source: Own computations using Eora26 database
0%10%20%30%40%50%60%70%80%90%
100%
Agri
culture
Ele
ctr
ica
l an
d M
achin
ery
Fin
acia
l In
term
ed
iatio
n a
nd
Busin
ess A
ctivitie
s
Fis
hin
g
Foo
d &
Be
vera
ges
Ho
tels
an
d R
estr
aura
nts
Meta
l P
rodu
cts
Min
ing
and Q
uarr
yin
g
Oth
er
Man
ufa
ctu
ring
Petr
ole
um
, C
hem
ica
l an
dN
on-M
eta
llic M
ine
ral…
Post an
dT
ele
com
mu
nic
ation
s
Textile
s a
nd
Wea
rin
gA
pp
are
l
Tra
nsp
ort
Tra
nsp
ort
Equ
ipm
en
t
Wo
od a
nd P
ape
r
2000
2011
Agriculture30%
Electrical & Machinery
1%Financial & business
7%Fishing2%
Food & Beverages
14%
Hotels & Restaurants
2%
Metal Products1%
Mining & Quarrying8%
Other Manufacturing
9%
Petrol./Chem. & Non-Metal. Min.
Prod2%
Post & Telecom.1%
Textiles & Apparel11%
Transport4%
Transport Equip.1%
Wood & Paper1%
Other6%
2000
Agriculture22%
Electrical & Machinery
3%Financial & business
8%
Fishing2%
Food & Beverages11%Hotels &
Restaurants3%
Metal Products1%
Mining & Quarrying
7%
Other Manufacturing
6%
Petrol./Chem. & Non-Metal. Min. Prod
3%
Post & Telecom.2%
Textiles & Apparel7%
Transport5%
Transport Equip.2%
Wood & Paper2% Other
17%
2011
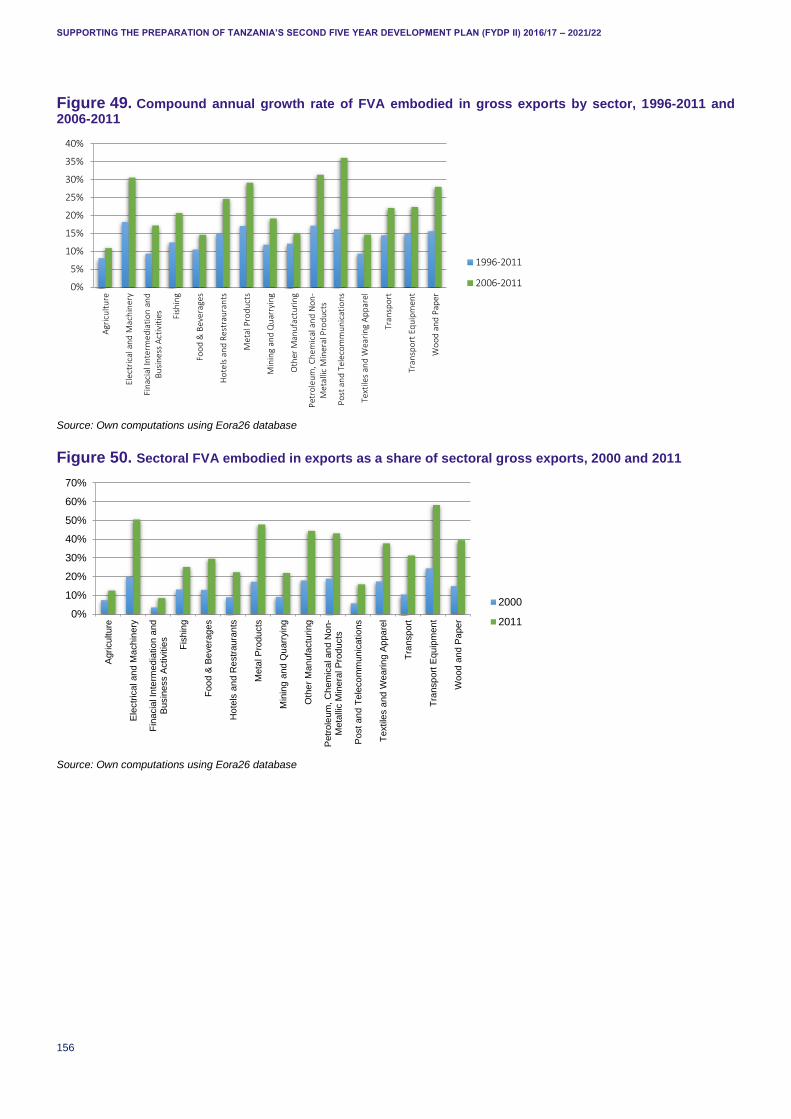
SUPPORTING THE PREPARATION OF TANZANIA’S SECOND FIVE YEAR DEVELOPMENT PLAN (FYDP II) 2016/17 – 2021/22
156
Figure 49. Compound annual growth rate of FVA embodied in gross exports by sector, 1996-2011 and 2006-2011
Source: Own computations using Eora26 database
Figure 50. Sectoral FVA embodied in exports as a share of sectoral gross exports, 2000 and 2011
Source: Own computations using Eora26 database
0%
5%
10%
15%
20%
25%
30%
35%
40%
Agr
icu
ltu
re
Elec
tric
al a
nd
Mac
hin
ery
Fin
acia
l In
term
ed
iati
on
an
dB
usi
nes
s A
ctiv
itie
s
Fish
ing
Foo
d &
Bev
erag
es
Ho
tels
an
d R
estr
aura
nts
Met
al P
rod
uct
s
Min
ing
and
Qu
arry
ing
Oth
er M
anu
fact
uri
ng
Pet
role
um
, Ch
emic
al a
nd
No
n-
Met
allic
Min
eral
Pro
du
cts
Po
st a
nd
Tel
eco
mm
un
icat
ion
s
Text
iles
and
Wea
rin
g A
pp
arel
Tran
spo
rt
Tran
spo
rt E
qu
ipm
ent
Wo
od
an
d P
aper
1996-2011
2006-2011
0%
10%
20%
30%
40%
50%
60%
70%
Agri
culture
Ele
ctr
ica
l an
d M
achin
ery
Fin
acia
l In
term
ed
iatio
n a
nd
Busin
ess A
ctivitie
s
Fis
hin
g
Foo
d &
Be
vera
ges
Ho
tels
an
d R
estr
aura
nts
Meta
l P
rodu
cts
Min
ing
and Q
uarr
yin
g
Oth
er
Man
ufa
ctu
ring
Petr
ole
um
, C
hem
ica
l an
d N
on-
Meta
llic M
inera
l P
rod
ucts
Post an
d T
ele
co
mm
un
ications
Textile
s a
nd
Wea
rin
g A
ppa
rel
Tra
nsp
ort
Tra
nsp
ort
Equ
ipm
en
t
Wo
od a
nd P
ape
r
2000
2011
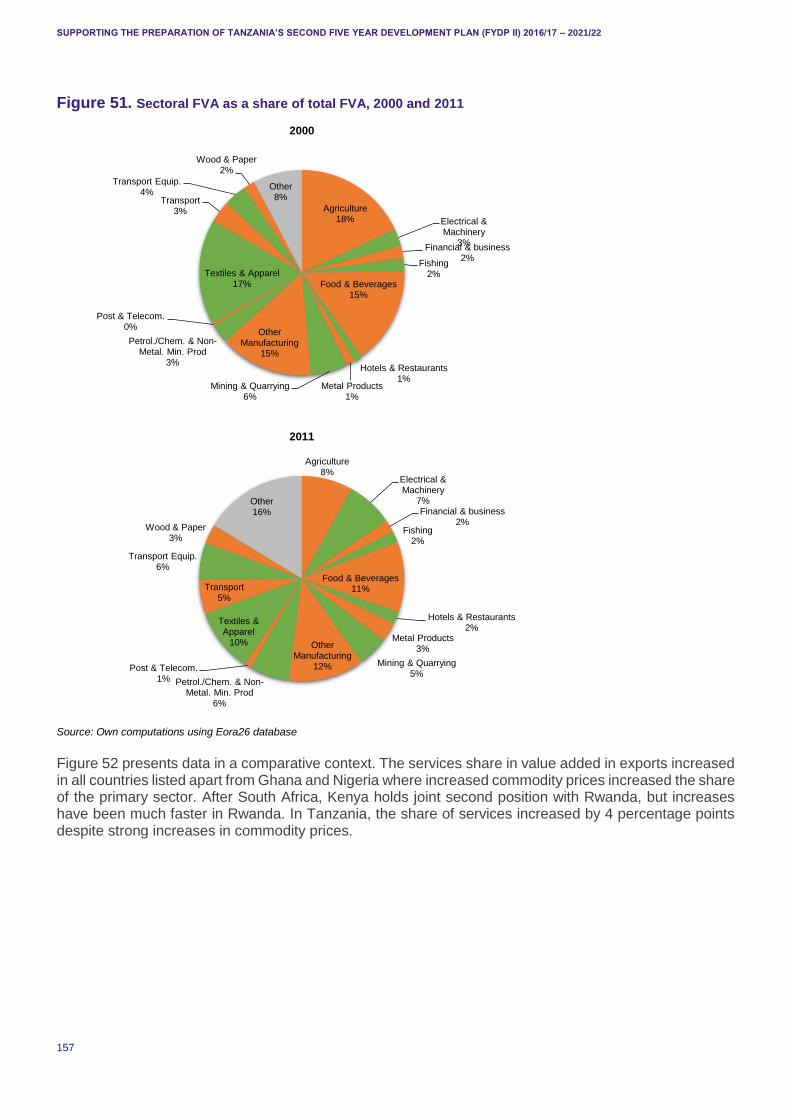
SUPPORTING THE PREPARATION OF TANZANIA’S SECOND FIVE YEAR DEVELOPMENT PLAN (FYDP II) 2016/17 – 2021/22
157
Figure 51. Sectoral FVA as a share of total FVA, 2000 and 2011
Source: Own computations using Eora26 database
Figure 52 presents data in a comparative context. The services share in value added in exports increased in all countries listed apart from Ghana and Nigeria where increased commodity prices increased the share of the primary sector. After South Africa, Kenya holds joint second position with Rwanda, but increases have been much faster in Rwanda. In Tanzania, the share of services increased by 4 percentage points despite strong increases in commodity prices.
Agriculture18% Electrical &
Machinery3%
Financial & business2%
Fishing2%
Food & Beverages15%
Hotels & Restaurants1%
Metal Products1%
Mining & Quarrying6%
Other Manufacturing
15%
Petrol./Chem. & Non-Metal. Min. Prod
3%
Post & Telecom.0%
Textiles & Apparel17%
Transport3%
Transport Equip.4%
Wood & Paper2%
Other8%
2000
Agriculture8%
Electrical & Machinery
7%Financial & business
2%Fishing
2%
Food & Beverages11%
Hotels & Restaurants2%
Metal Products3%
Mining & Quarrying5%
Other Manufacturing
12%
Petrol./Chem. & Non-Metal. Min. Prod
6%
Post & Telecom.1%
Textiles & Apparel
10%
Transport5%
Transport Equip.6%
Wood & Paper3%
Other16%
2011

SUPPORTING THE PREPARATION OF TANZANIA’S SECOND FIVE YEAR DEVELOPMENT PLAN (FYDP II) 2016/17 – 2021/22
158
Figure 52. Contribution of the service sectors to value addition in exports, 2000 and 2011, selected countries
Source: own calculations using EORA database. Services include financial and business, hotels and restaurants, post and telecommunications, and transport.
15%14%
12%
18%
11%
13%
16%
7%
19%18%
16%
21%
19%
12%
14%
9%
0%
5%
10%
15%
20%
25%
Kenya Tanzania Uganda SouthAfrica
Rwanda Ghana Nigeria India
2000
2011
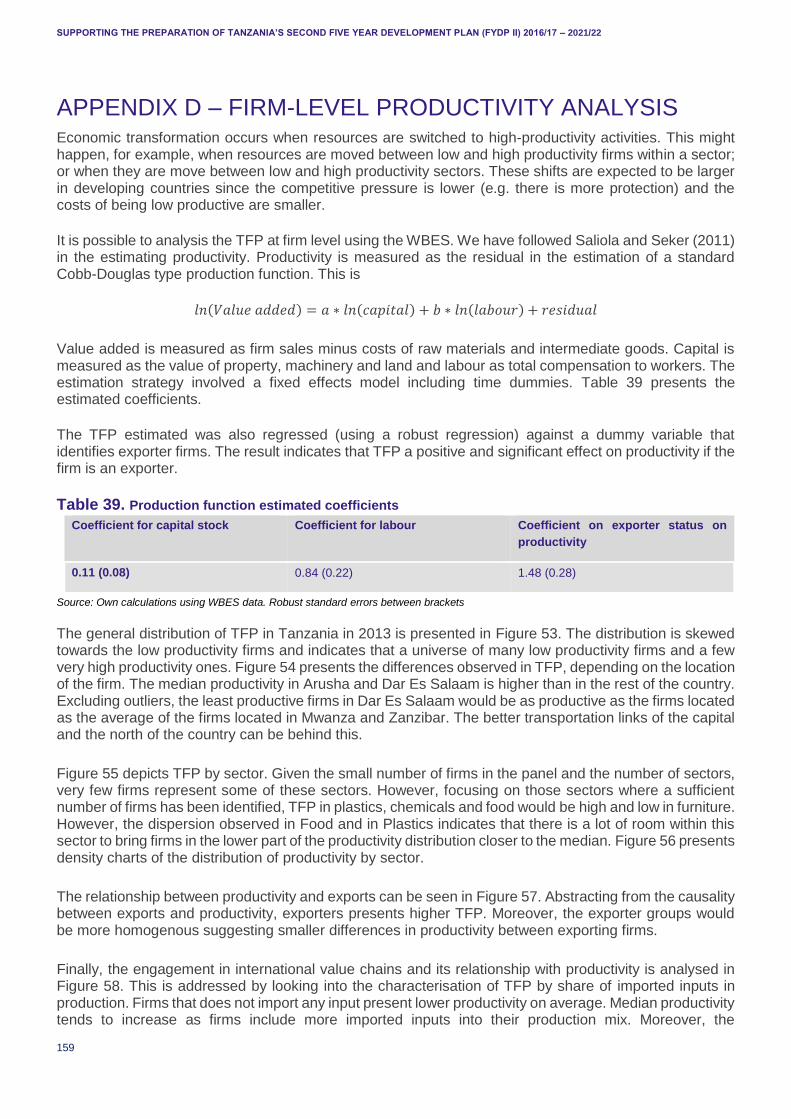
SUPPORTING THE PREPARATION OF TANZANIA’S SECOND FIVE YEAR DEVELOPMENT PLAN (FYDP II) 2016/17 – 2021/22
159
APPENDIX D – FIRM-LEVEL PRODUCTIVITY ANALYSIS Economic transformation occurs when resources are switched to high-productivity activities. This might happen, for example, when resources are moved between low and high productivity firms within a sector; or when they are move between low and high productivity sectors. These shifts are expected to be larger in developing countries since the competitive pressure is lower (e.g. there is more protection) and the costs of being low productive are smaller.
It is possible to analysis the TFP at firm level using the WBES. We have followed Saliola and Seker (2011) in the estimating productivity. Productivity is measured as the residual in the estimation of a standard Cobb-Douglas type production function. This is
𝑙𝑛(𝑉𝑎𝑙𝑢𝑒 𝑎𝑑𝑑𝑒𝑑) = 𝑎 ∗ 𝑙𝑛(𝑐𝑎𝑝𝑖𝑡𝑎𝑙) + 𝑏 ∗ 𝑙𝑛(𝑙𝑎𝑏𝑜𝑢𝑟) + 𝑟𝑒𝑠𝑖𝑑𝑢𝑎𝑙
Value added is measured as firm sales minus costs of raw materials and intermediate goods. Capital is measured as the value of property, machinery and land and labour as total compensation to workers. The estimation strategy involved a fixed effects model including time dummies. Table 39 presents the estimated coefficients.
The TFP estimated was also regressed (using a robust regression) against a dummy variable that identifies exporter firms. The result indicates that TFP a positive and significant effect on productivity if the firm is an exporter.
Table 39. Production function estimated coefficients
Coefficient for capital stock Coefficient for labour Coefficient on exporter status on
productivity
0.11 (0.08) 0.84 (0.22) 1.48 (0.28)
Source: Own calculations using WBES data. Robust standard errors between brackets
The general distribution of TFP in Tanzania in 2013 is presented in Figure 53. The distribution is skewed towards the low productivity firms and indicates that a universe of many low productivity firms and a few very high productivity ones. Figure 54 presents the differences observed in TFP, depending on the location of the firm. The median productivity in Arusha and Dar Es Salaam is higher than in the rest of the country. Excluding outliers, the least productive firms in Dar Es Salaam would be as productive as the firms located as the average of the firms located in Mwanza and Zanzibar. The better transportation links of the capital and the north of the country can be behind this.
Figure 55 depicts TFP by sector. Given the small number of firms in the panel and the number of sectors, very few firms represent some of these sectors. However, focusing on those sectors where a sufficient number of firms has been identified, TFP in plastics, chemicals and food would be high and low in furniture. However, the dispersion observed in Food and in Plastics indicates that there is a lot of room within this sector to bring firms in the lower part of the productivity distribution closer to the median. Figure 56 presents density charts of the distribution of productivity by sector.
The relationship between productivity and exports can be seen in Figure 57. Abstracting from the causality between exports and productivity, exporters presents higher TFP. Moreover, the exporter groups would be more homogenous suggesting smaller differences in productivity between exporting firms.
Finally, the engagement in international value chains and its relationship with productivity is analysed in Figure 58. This is addressed by looking into the characterisation of TFP by share of imported inputs in production. Firms that does not import any input present lower productivity on average. Median productivity tends to increase as firms include more imported inputs into their production mix. Moreover, the
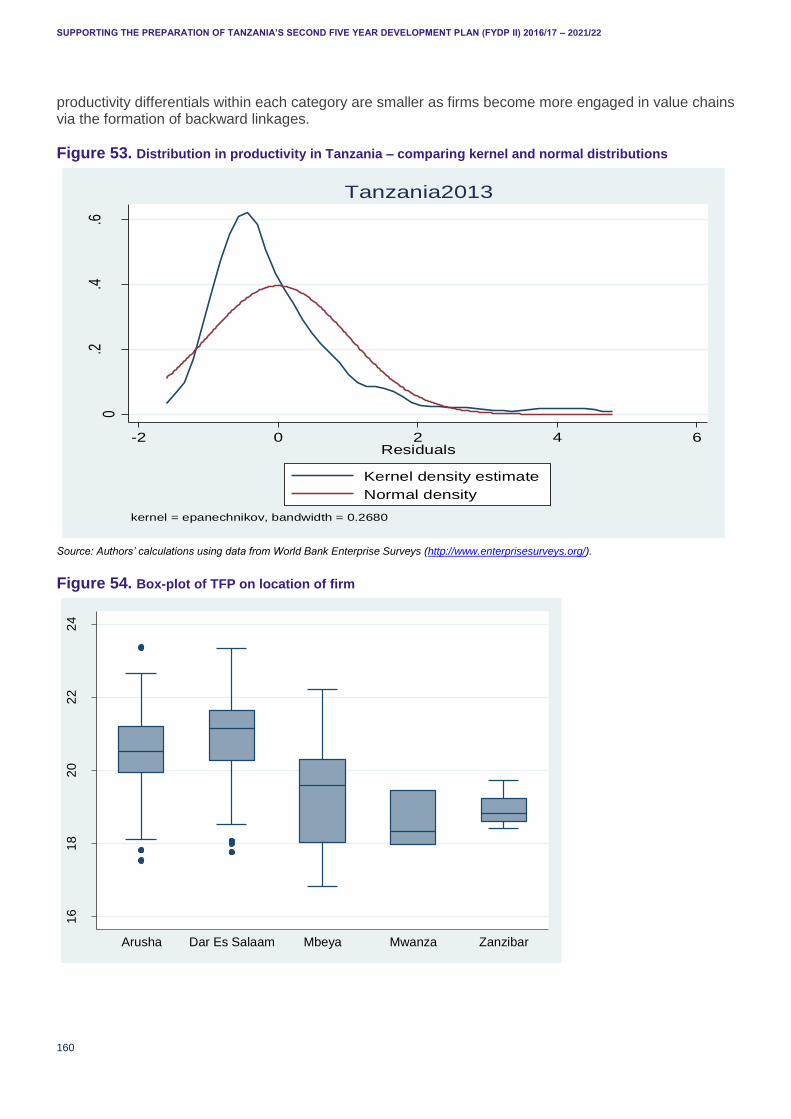
SUPPORTING THE PREPARATION OF TANZANIA’S SECOND FIVE YEAR DEVELOPMENT PLAN (FYDP II) 2016/17 – 2021/22
160
productivity differentials within each category are smaller as firms become more engaged in value chains via the formation of backward linkages.
Figure 53. Distribution in productivity in Tanzania – comparing kernel and normal distributions
Source: Authors’ calculations using data from World Bank Enterprise Surveys (http://www.enterprisesurveys.org/).
Figure 54. Box-plot of TFP on location of firm
0.2
.4.6
Den
sity
-2 0 2 4 6Residuals
Kernel density estimate
Normal density
kernel = epanechnikov, bandwidth = 0.2680
Tanzania2013
16
18
20
22
24
Arusha Dar Es Salaam Mbeya Mwanza Zanzibar
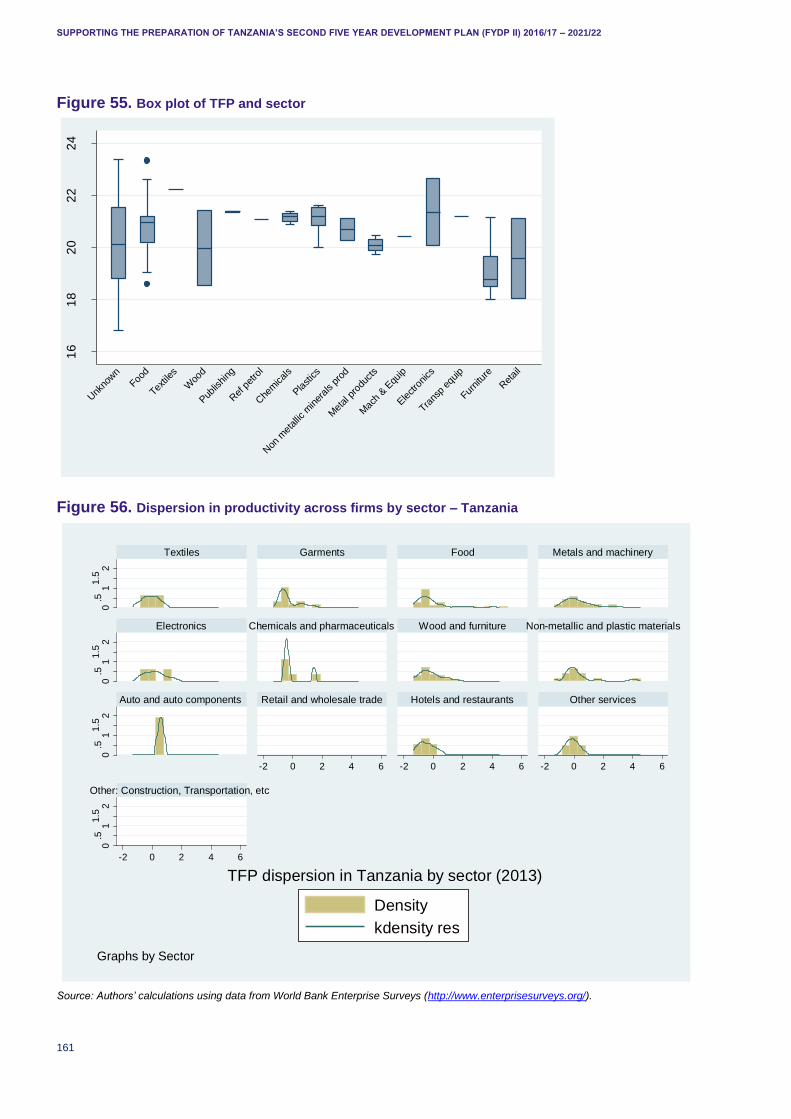
SUPPORTING THE PREPARATION OF TANZANIA’S SECOND FIVE YEAR DEVELOPMENT PLAN (FYDP II) 2016/17 – 2021/22
161
Figure 55. Box plot of TFP and sector
Figure 56. Dispersion in productivity across firms by sector – Tanzania
Source: Authors’ calculations using data from World Bank Enterprise Surveys (http://www.enterprisesurveys.org/).
16
18
20
22
24
Unk
nown
Food
Textiles
Woo
d
Pub
lishing
Ref
pet
rol
Che
micals
Pla
stics
Non
met
allic
miner
als
prod
Met
al p
rodu
cts
Mac
h & E
quip
Ele
ctro
nics
Trans
p eq
uip
Furnitu
re
Ret
ail
0.5
11
.52
0.5
11
.52
0.5
11
.52
0.5
11
.52
-2 0 2 4 6 -2 0 2 4 6 -2 0 2 4 6
-2 0 2 4 6
Textiles Garments Food Metals and machinery
Electronics Chemicals and pharmaceuticals Wood and furniture Non-metallic and plastic materials
Auto and auto components Retail and wholesale trade Hotels and restaurants Other services
Other: Construction, Transportation, etc
Density
kdensity res
Den
sity
TFP dispersion in Tanzania by sector (2013)
Graphs by Sector
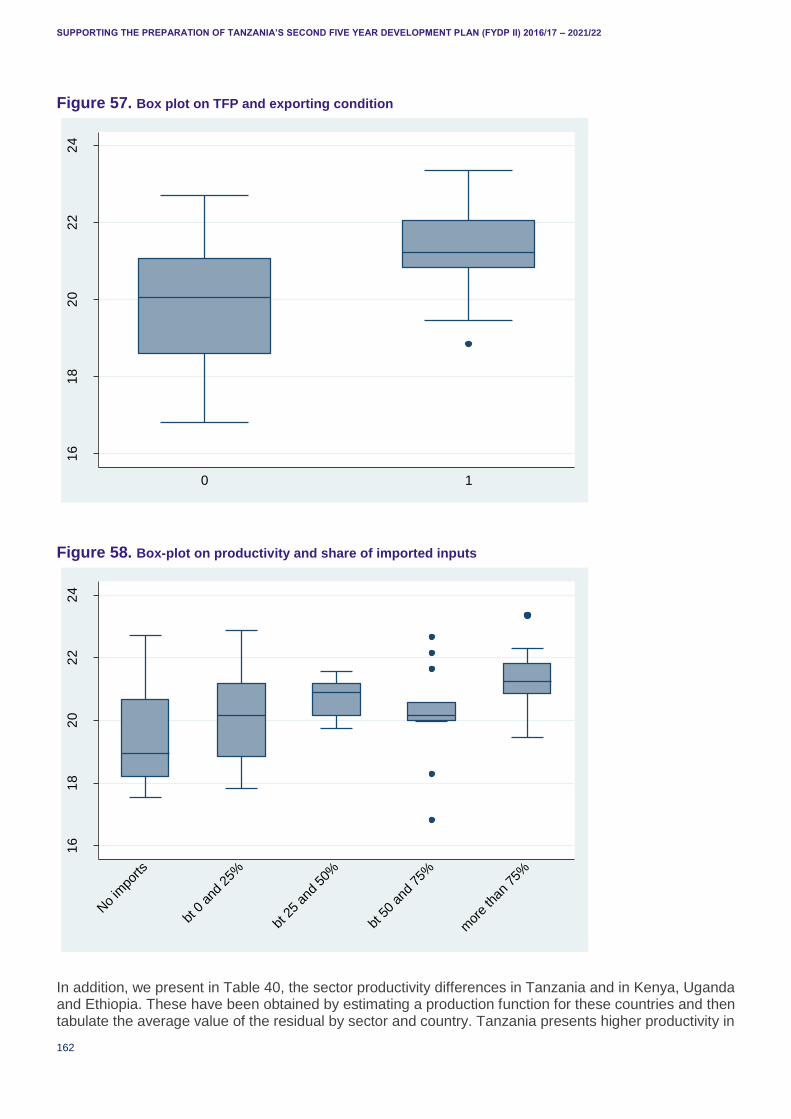
SUPPORTING THE PREPARATION OF TANZANIA’S SECOND FIVE YEAR DEVELOPMENT PLAN (FYDP II) 2016/17 – 2021/22
162
Figure 57. Box plot on TFP and exporting condition
Figure 58. Box-plot on productivity and share of imported inputs
In addition, we present in Table 40, the sector productivity differences in Tanzania and in Kenya, Uganda and Ethiopia. These have been obtained by estimating a production function for these countries and then tabulate the average value of the residual by sector and country. Tanzania presents higher productivity in
16
18
20
22
24
0 1
16
18
20
22
24
No
impo
rts
bt 0
and
25%
bt 2
5 an
d 50
%
bt 5
0 an
d 75
%
mor
e th
an 7
5%
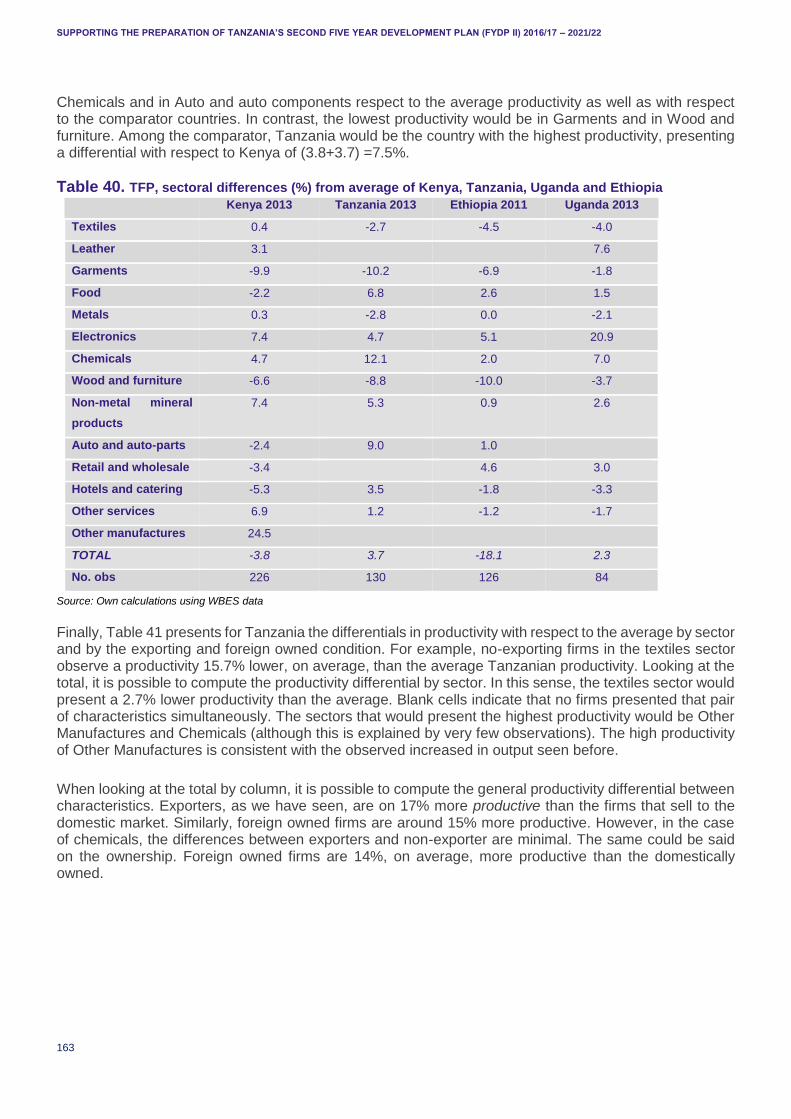
SUPPORTING THE PREPARATION OF TANZANIA’S SECOND FIVE YEAR DEVELOPMENT PLAN (FYDP II) 2016/17 – 2021/22
163
Chemicals and in Auto and auto components respect to the average productivity as well as with respect to the comparator countries. In contrast, the lowest productivity would be in Garments and in Wood and furniture. Among the comparator, Tanzania would be the country with the highest productivity, presenting a differential with respect to Kenya of (3.8+3.7) =7.5%.
Table 40. TFP, sectoral differences (%) from average of Kenya, Tanzania, Uganda and Ethiopia
Kenya 2013 Tanzania 2013 Ethiopia 2011 Uganda 2013
Textiles 0.4 -2.7 -4.5 -4.0
Leather 3.1 7.6
Garments -9.9 -10.2 -6.9 -1.8
Food -2.2 6.8 2.6 1.5
Metals 0.3 -2.8 0.0 -2.1
Electronics 7.4 4.7 5.1 20.9
Chemicals 4.7 12.1 2.0 7.0
Wood and furniture -6.6 -8.8 -10.0 -3.7
Non-metal mineral
products
7.4 5.3 0.9 2.6
Auto and auto-parts -2.4 9.0 1.0
Retail and wholesale -3.4 4.6 3.0
Hotels and catering -5.3 3.5 -1.8 -3.3
Other services 6.9 1.2 -1.2 -1.7
Other manufactures 24.5
TOTAL -3.8 3.7 -18.1 2.3
No. obs 226 130 126 84
Source: Own calculations using WBES data
Finally, Table 41 presents for Tanzania the differentials in productivity with respect to the average by sector and by the exporting and foreign owned condition. For example, no-exporting firms in the textiles sector observe a productivity 15.7% lower, on average, than the average Tanzanian productivity. Looking at the total, it is possible to compute the productivity differential by sector. In this sense, the textiles sector would present a 2.7% lower productivity than the average. Blank cells indicate that no firms presented that pair of characteristics simultaneously. The sectors that would present the highest productivity would be Other Manufactures and Chemicals (although this is explained by very few observations). The high productivity of Other Manufactures is consistent with the observed increased in output seen before.
When looking at the total by column, it is possible to compute the general productivity differential between characteristics. Exporters, as we have seen, are on 17% more productive than the firms that sell to the domestic market. Similarly, foreign owned firms are around 15% more productive. However, in the case of chemicals, the differences between exporters and non-exporter are minimal. The same could be said on the ownership. Foreign owned firms are 14%, on average, more productive than the domestically owned.
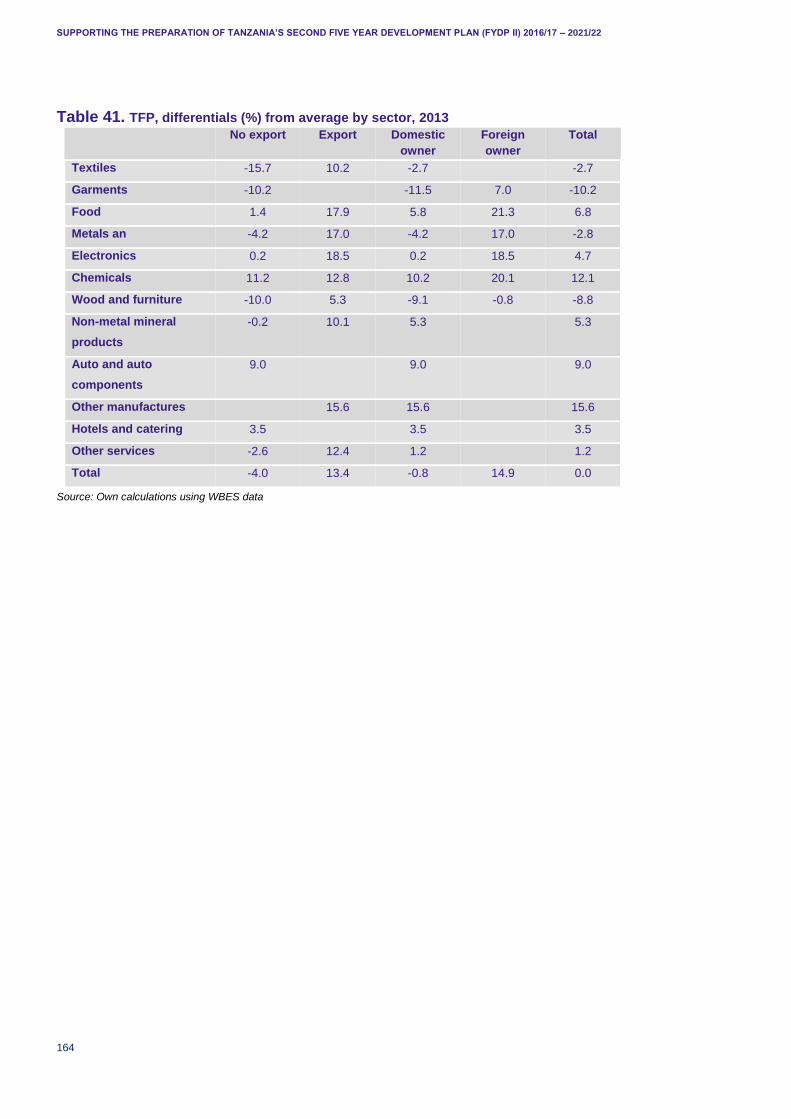
SUPPORTING THE PREPARATION OF TANZANIA’S SECOND FIVE YEAR DEVELOPMENT PLAN (FYDP II) 2016/17 – 2021/22
164
Table 41. TFP, differentials (%) from average by sector, 2013
No export Export Domestic
owner
Foreign
owner
Total
Textiles -15.7 10.2 -2.7 -2.7
Garments -10.2 -11.5 7.0 -10.2
Food 1.4 17.9 5.8 21.3 6.8
Metals an -4.2 17.0 -4.2 17.0 -2.8
Electronics 0.2 18.5 0.2 18.5 4.7
Chemicals 11.2 12.8 10.2 20.1 12.1
Wood and furniture -10.0 5.3 -9.1 -0.8 -8.8
Non-metal mineral
products
-0.2 10.1 5.3 5.3
Auto and auto
components
9.0 9.0 9.0
Other manufactures 15.6 15.6 15.6
Hotels and catering 3.5 3.5 3.5
Other services -2.6 12.4 1.2 1.2
Total -4.0 13.4 -0.8 14.9 0.0
Source: Own calculations using WBES data

SUPPORTING THE PREPARATION OF TANZANIA’S SECOND FIVE YEAR DEVELOPMENT PLAN (FYDP II) 2016/17 – 2021/22
165
APPENDIX E – HAUSMANN PRODUCT SPACE ANALYSIS FOR TANZANIA The Hausmann, Hidalgo analysis uses the RCA values to calculate which countries are diversified into many products and which products are not exported by many other countries (more complex products). The figure below shows the negative relationship between the diversity of a country and the average ubiquity of its products (Hausmann et al., 2014b). More diverse countries (countries which export a relatively large number of products) export products with relatively lower ubiquity (products that are produced by relatively few other countries). In this figure, Tanzania is less diversified than e.g. Kenya or Malaysia but more diversified than Uganda, and the products that Tanzania exports are a bit less common and are produced by fewer countries than Kenya or Uganda.
The figure further shows the negative relationship between diversity and average ubiquity, as discussed in Hausmann and Hidalgo (2009). Area (1) in the figure consists of countries with little diversification producing standard products that many countries export (high ubiquity). Area (2) includes diversified countries producing standard products, area (3) consists of non-diversified countries producing products that are less ubiquitious (exclusive products) and area (4) includes diversified countries that produces exclusive products. Area 1 countries in the figure above are mostly developing countries while area 4 countries are mainly developed countries. African countries are mostly spread over area 1 and 3. Asia also has many countries in area 4. The East African countries just make it to area 2.
Figure 59. The relationship between ubiquity and diversification
Source: Authors’ calculations for the year 2012.
0
10
20
30
40
50
60
0 50 100 150 200 250 300 350 400 450 500
Ave
rage
ub
iqu
ity
Diversity
Diversity vs avg ubiquity
Diversity vs avg ubiquity-SSA
Diversity vs avg ubiquity-Asia
Tanzania
1 2
3 4
Kenya
Uganda
Malaysia
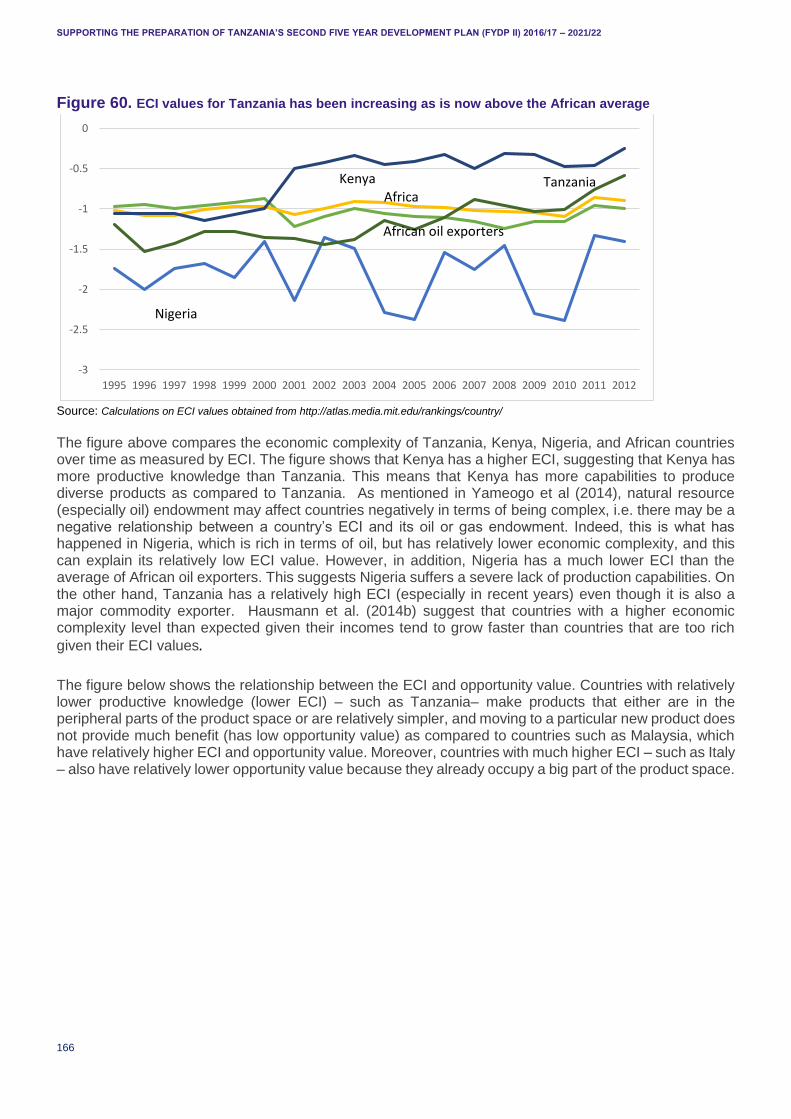
SUPPORTING THE PREPARATION OF TANZANIA’S SECOND FIVE YEAR DEVELOPMENT PLAN (FYDP II) 2016/17 – 2021/22
166
Figure 60. ECI values for Tanzania has been increasing as is now above the African average
Source: Calculations on ECI values obtained from http://atlas.media.mit.edu/rankings/country/
The figure above compares the economic complexity of Tanzania, Kenya, Nigeria, and African countries over time as measured by ECI. The figure shows that Kenya has a higher ECI, suggesting that Kenya has more productive knowledge than Tanzania. This means that Kenya has more capabilities to produce diverse products as compared to Tanzania. As mentioned in Yameogo et al (2014), natural resource (especially oil) endowment may affect countries negatively in terms of being complex, i.e. there may be a negative relationship between a country’s ECI and its oil or gas endowment. Indeed, this is what has happened in Nigeria, which is rich in terms of oil, but has relatively lower economic complexity, and this can explain its relatively low ECI value. However, in addition, Nigeria has a much lower ECI than the average of African oil exporters. This suggests Nigeria suffers a severe lack of production capabilities. On the other hand, Tanzania has a relatively high ECI (especially in recent years) even though it is also a major commodity exporter. Hausmann et al. (2014b) suggest that countries with a higher economic complexity level than expected given their incomes tend to grow faster than countries that are too rich
given their ECI values.
The figure below shows the relationship between the ECI and opportunity value. Countries with relatively lower productive knowledge (lower ECI) – such as Tanzania– make products that either are in the peripheral parts of the product space or are relatively simpler, and moving to a particular new product does not provide much benefit (has low opportunity value) as compared to countries such as Malaysia, which have relatively higher ECI and opportunity value. Moreover, countries with much higher ECI – such as Italy – also have relatively lower opportunity value because they already occupy a big part of the product space.
-3
-2.5
-2
-1.5
-1
-0.5
0
1995 1996 1997 1998 1999 2000 2001 2002 2003 2004 2005 2006 2007 2008 2009 2010 2011 2012
Nigeria
Africa
African oil exporters
Kenya Tanzania

SUPPORTING THE PREPARATION OF TANZANIA’S SECOND FIVE YEAR DEVELOPMENT PLAN (FYDP II) 2016/17 – 2021/22
167
Figure 61. Tanzania’s position in the product space in 2012: ECI versus opportunity value
Source: Authors’ calculations based on UN Comtrade data.
Figure 62. ECI and GDP per capita (USD 1,000) in 2012
Source: Authors’ calculations based on UN Comtrade data.
Figure 62 shows that economic complexity of a country is positively correlated with its income. A country with a relatively higher GDP has a higher productive knowledge (higher complexity) as compared to a country with lower GDP such as Tanzania.
The clearest way to show the importance of product complexity is to point to the product space maps for Tanzania and comparator countries such as Kenya or Malaysia for the period 1962 to 2012. We show a number of maps at the end (each dot is a product, and the colour of the product shows which communities
-50
-40
-30
-20
-10
0
10
20
-3 -2 -1 0 1 2 3 4
Opp. value
ECI
TanzaniaKenya Malaysia
0
20
40
60
80
100
120
-3 -2 -1 0 1 2 3 4
GD
P p
er
cap
ita
ECI
Tanzania
SUPPORTING THE PREPARATION OF TANZANIA’S SECOND FIVE YEAR DEVELOPMENT PLAN (FYDP II) 2016/17 – 2021/22
168
(sector) it belongs to. The size of dots is proportional to world trade: the bigger the dot, the greater proportion of world trade belongs to this product).
The product space maps shows two main things. First, over time Tanzania has moved from specialising in peripheral products which have very few products close by to specialising into products that are have more links to other products (i.e. are more in the middle related to machinery/electronics/garments) which suggests a better specialisation. But secondly, compared to Kenya, it lack a profile that is sufficiently located into those products that have many links.
The same data can also be used to calculate other measures (see note at the end for full explanations and the formulas behind them):
The ECI and the corresponding measure for products, the PCI. In 2012 Tanzania ranked 122 of 180 on the complexity map.
A complexity index can be analysed for countries and products. Distance: How far is a certain product from the current revealed capabilities? Opportunity gain: How strategic is that product in terms of its proximity/connectedness to other complex products?
Figure 63 and Figure 64 show products that are feasible for Tanzania in 2012, and plots the 1,028 products included in our analysis. Feasible products are those with relatively more complexity or opportunity gain and smaller distance to Tanzania’s current productive knowledge. Among the products shown in Figure 5, the feasible ones correspond to products with ECI value greater than Tanzania’s current ECI value (-0.56) and to the left of the line drawn between the two points: (1) the intersection of the 25th percentile of PCI and 25th percentile of distance; and (2) the intersection of the 75th percentile of PCI and 75th percentile of distance.
According to Figure 64, the feasible products lie above the line with greater than zero opportunity gain (Hausmann et al. (2014b)) and to the left of the line drawn between the two points: (1) the intersection of the 25th percentile of opportunity gain and 25th percentile of distance; and (2) the intersection of the 75th percentile of opportunity gain and 75th percentile of distance. The reason the diagonal lines are taken into account is that there is a trade-off between the complexity or opportunity gain of a product and its distance, because products with higher complexity and opportunity gain are generally also more distant, which makes it more difficult to move to these products.
According to Figure 63 and Figure 64, feasible products are in the major sectors such as machinery and transport equipment and miscellaneous manufactured products. Products in these sectors are relatively complex and provide large opportunity value.

SUPPORTING THE PREPARATION OF TANZANIA’S SECOND FIVE YEAR DEVELOPMENT PLAN (FYDP II) 2016/17 – 2021/22
169
Figure 63. Tanzania’s efficiency frontier: complexity (PCI) versus distance, 2012
Figure 64. Tanzania’s efficiency frontier: opportunity gain versus distance, 2012
We can combine the above three measures into a single index by using a weight. For example, the parsimonious transformation index gives importance to products that are closer to the country’s current set of capabilities, but with higher sophistication so that the development of new products is faster and less risky. The strategic bets index emphasises products that are more sophisticated even if they lie at a greater distance. Therefore, the parsimonious transformation index prioritises distance while the strategic bets index prioritises complexity and opportunity gain.
-4.5
-3.5
-2.5
-1.5
-0.5
0.5
1.5
2.5
3.5
0.7 0.75 0.8 0.85 0.9 0.95 1 1.05
PC
I
Distance
below current ECI
Petroleum gases, gaseous
Hand/portable tools nes
Drawn/blown glass sheets
Cocoa wastes
Optical appliances nes
-0.5
-0.3
-0.1
0.1
0.3
0.5
0.7
0.7 0.75 0.8 0.85 0.9 0.95 1 1.05Op
po
rtu
nit
y ga
in
Distance
above opp.gain>0
below opp.gain<0
Cocoa wastes Scientific instrumnt nes
Oil seed/etc flour/meal
Non-mag recorded media
Copy mach parts/access.
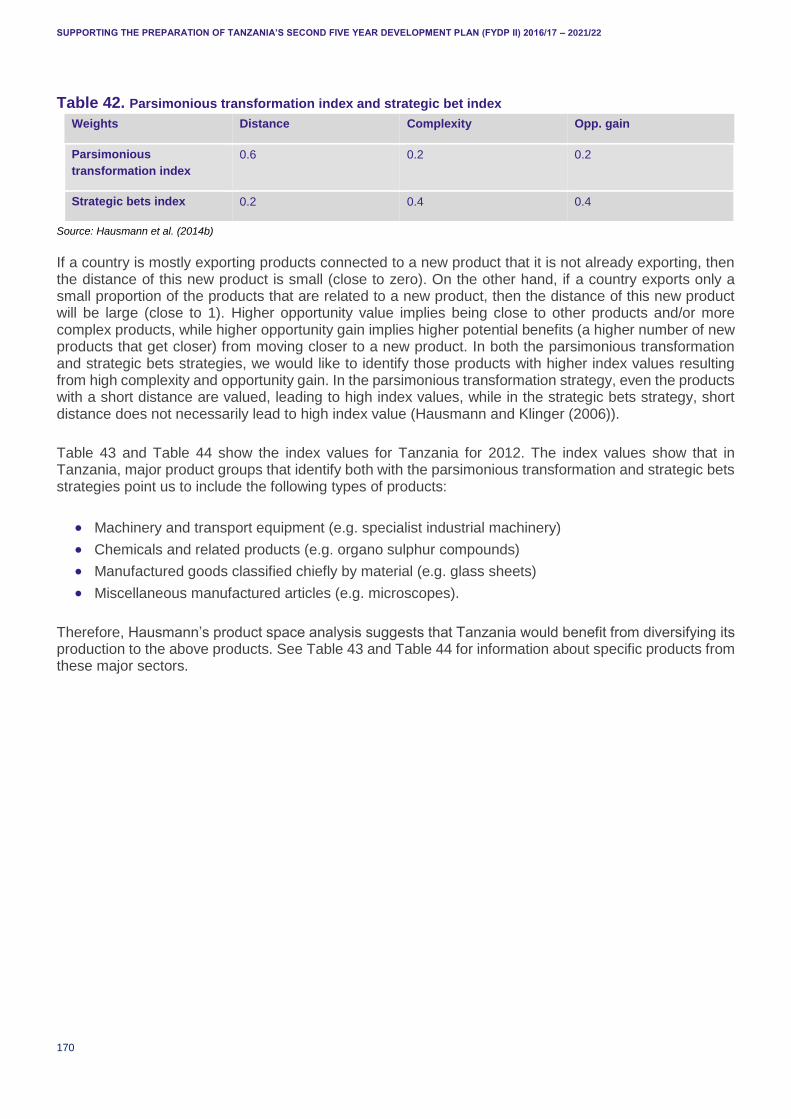
SUPPORTING THE PREPARATION OF TANZANIA’S SECOND FIVE YEAR DEVELOPMENT PLAN (FYDP II) 2016/17 – 2021/22
170
Table 42. Parsimonious transformation index and strategic bet index
Weights Distance Complexity Opp. gain
Parsimonious
transformation index
0.6 0.2 0.2
Strategic bets index 0.2 0.4 0.4
Source: Hausmann et al. (2014b)
If a country is mostly exporting products connected to a new product that it is not already exporting, then the distance of this new product is small (close to zero). On the other hand, if a country exports only a small proportion of the products that are related to a new product, then the distance of this new product will be large (close to 1). Higher opportunity value implies being close to other products and/or more complex products, while higher opportunity gain implies higher potential benefits (a higher number of new products that get closer) from moving closer to a new product. In both the parsimonious transformation and strategic bets strategies, we would like to identify those products with higher index values resulting from high complexity and opportunity gain. In the parsimonious transformation strategy, even the products with a short distance are valued, leading to high index values, while in the strategic bets strategy, short distance does not necessarily lead to high index value (Hausmann and Klinger (2006)).
Table 43 and Table 44 show the index values for Tanzania for 2012. The index values show that in Tanzania, major product groups that identify both with the parsimonious transformation and strategic bets strategies point us to include the following types of products:
Machinery and transport equipment (e.g. specialist industrial machinery)
Chemicals and related products (e.g. organo sulphur compounds)
Manufactured goods classified chiefly by material (e.g. glass sheets)
Miscellaneous manufactured articles (e.g. microscopes).
Therefore, Hausmann’s product space analysis suggests that Tanzania would benefit from diversifying its production to the above products. See Table 43 and Table 44 for information about specific products from these major sectors.
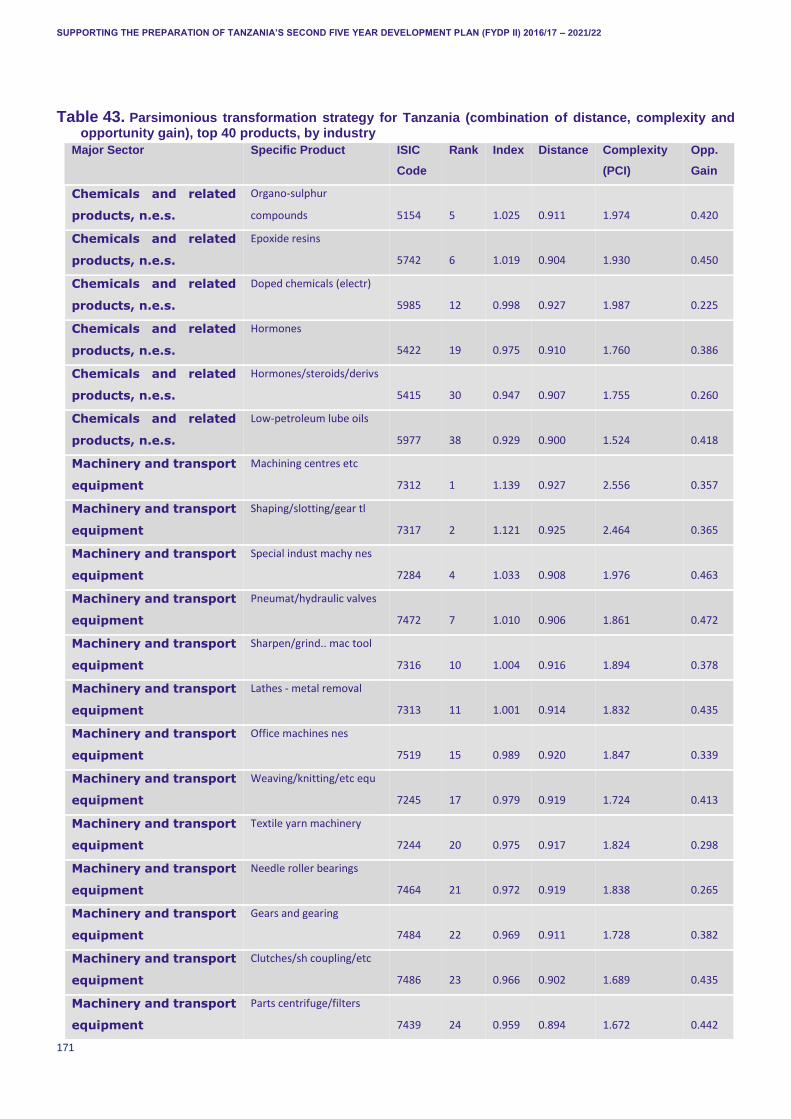
SUPPORTING THE PREPARATION OF TANZANIA’S SECOND FIVE YEAR DEVELOPMENT PLAN (FYDP II) 2016/17 – 2021/22
171
Table 43. Parsimonious transformation strategy for Tanzania (combination of distance, complexity and opportunity gain), top 40 products, by industry
Major Sector Specific Product ISIC
Code
Rank Index Distance Complexity
(PCI)
Opp.
Gain
Chemicals and related
products, n.e.s.
Organo-sulphur
compounds 5154 5 1.025 0.911 1.974 0.420
Chemicals and related
products, n.e.s.
Epoxide resins
5742 6 1.019 0.904 1.930 0.450
Chemicals and related
products, n.e.s.
Doped chemicals (electr)
5985 12 0.998 0.927 1.987 0.225
Chemicals and related
products, n.e.s.
Hormones
5422 19 0.975 0.910 1.760 0.386
Chemicals and related
products, n.e.s.
Hormones/steroids/derivs
5415 30 0.947 0.907 1.755 0.260
Chemicals and related
products, n.e.s.
Low-petroleum lube oils
5977 38 0.929 0.900 1.524 0.418
Machinery and transport
equipment
Machining centres etc
7312 1 1.139 0.927 2.556 0.357
Machinery and transport
equipment
Shaping/slotting/gear tl
7317 2 1.121 0.925 2.464 0.365
Machinery and transport
equipment
Special indust machy nes
7284 4 1.033 0.908 1.976 0.463
Machinery and transport
equipment
Pneumat/hydraulic valves
7472 7 1.010 0.906 1.861 0.472
Machinery and transport
equipment
Sharpen/grind.. mac tool
7316 10 1.004 0.916 1.894 0.378
Machinery and transport
equipment
Lathes - metal removal
7313 11 1.001 0.914 1.832 0.435
Machinery and transport
equipment
Office machines nes
7519 15 0.989 0.920 1.847 0.339
Machinery and transport
equipment
Weaving/knitting/etc equ
7245 17 0.979 0.919 1.724 0.413
Machinery and transport
equipment
Textile yarn machinery
7244 20 0.975 0.917 1.824 0.298
Machinery and transport
equipment
Needle roller bearings
7464 21 0.972 0.919 1.838 0.265
Machinery and transport
equipment
Gears and gearing
7484 22 0.969 0.911 1.728 0.382
Machinery and transport
equipment
Clutches/sh coupling/etc
7486 23 0.966 0.902 1.689 0.435
Machinery and transport
equipment
Parts centrifuge/filters
7439 24 0.959 0.894 1.672 0.442
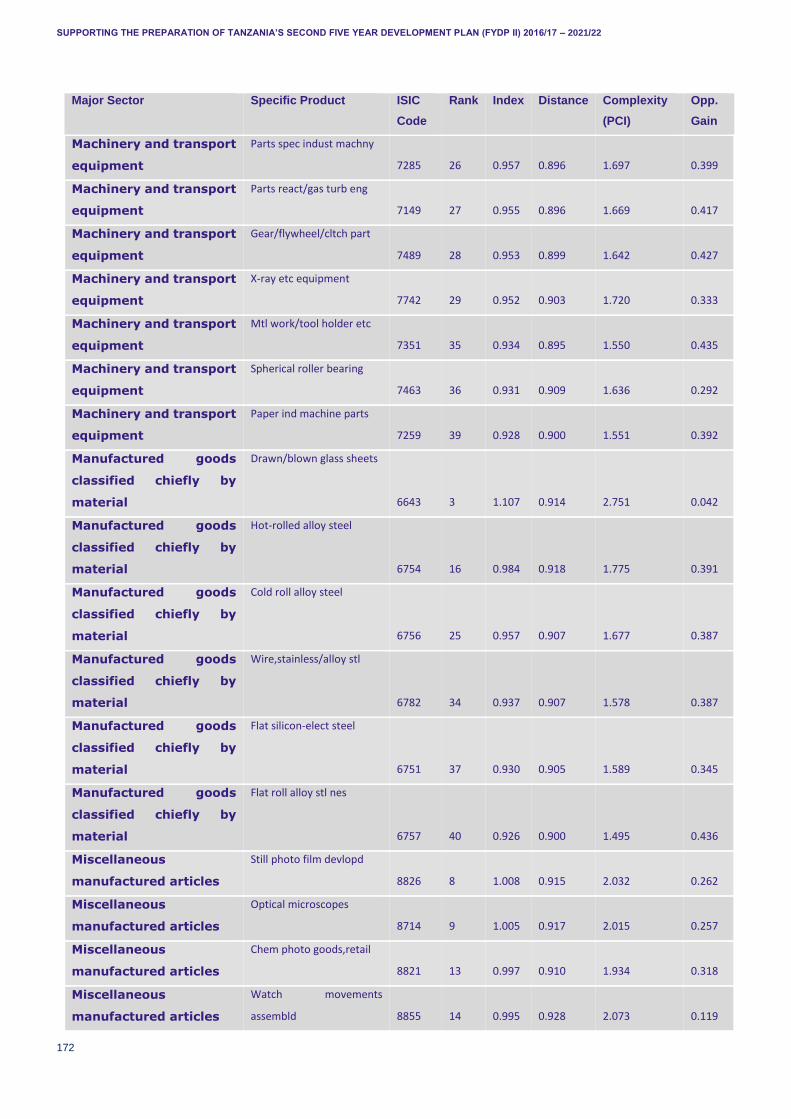
SUPPORTING THE PREPARATION OF TANZANIA’S SECOND FIVE YEAR DEVELOPMENT PLAN (FYDP II) 2016/17 – 2021/22
172
Major Sector Specific Product ISIC
Code
Rank Index Distance Complexity
(PCI)
Opp.
Gain
Machinery and transport
equipment
Parts spec indust machny
7285 26 0.957 0.896 1.697 0.399
Machinery and transport
equipment
Parts react/gas turb eng
7149 27 0.955 0.896 1.669 0.417
Machinery and transport
equipment
Gear/flywheel/cltch part
7489 28 0.953 0.899 1.642 0.427
Machinery and transport
equipment
X-ray etc equipment
7742 29 0.952 0.903 1.720 0.333
Machinery and transport
equipment
Mtl work/tool holder etc
7351 35 0.934 0.895 1.550 0.435
Machinery and transport
equipment
Spherical roller bearing
7463 36 0.931 0.909 1.636 0.292
Machinery and transport
equipment
Paper ind machine parts
7259 39 0.928 0.900 1.551 0.392
Manufactured goods
classified chiefly by
material
Drawn/blown glass sheets
6643 3 1.107 0.914 2.751 0.042
Manufactured goods
classified chiefly by
material
Hot-rolled alloy steel
6754 16 0.984 0.918 1.775 0.391
Manufactured goods
classified chiefly by
material
Cold roll alloy steel
6756 25 0.957 0.907 1.677 0.387
Manufactured goods
classified chiefly by
material
Wire,stainless/alloy stl
6782 34 0.937 0.907 1.578 0.387
Manufactured goods
classified chiefly by
material
Flat silicon-elect steel
6751 37 0.930 0.905 1.589 0.345
Manufactured goods
classified chiefly by
material
Flat roll alloy stl nes
6757 40 0.926 0.900 1.495 0.436
Miscellaneous
manufactured articles
Still photo film devlopd
8826 8 1.008 0.915 2.032 0.262
Miscellaneous
manufactured articles
Optical microscopes
8714 9 1.005 0.917 2.015 0.257
Miscellaneous
manufactured articles
Chem photo goods,retail
8821 13 0.997 0.910 1.934 0.318
Miscellaneous
manufactured articles
Watch movements
assembld 8855 14 0.995 0.928 2.073 0.119

SUPPORTING THE PREPARATION OF TANZANIA’S SECOND FIVE YEAR DEVELOPMENT PLAN (FYDP II) 2016/17 – 2021/22
173
Major Sector Specific Product ISIC
Code
Rank Index Distance Complexity
(PCI)
Opp.
Gain
Miscellaneous
manufactured articles
Physic/chem analysis equ
8744 18 0.977 0.905 1.745 0.427
Miscellaneous
manufactured articles
Original prints etc
8962 31 0.944 0.899 1.873 0.148
Miscellaneous
manufactured articles
Binoculars/telescopes
8711 32 0.942 0.902 1.591 0.413
Miscellaneous
manufactured articles
Optical appliances nes
8719 33 0.937 0.939 1.671 0.198
Source: Own calculations
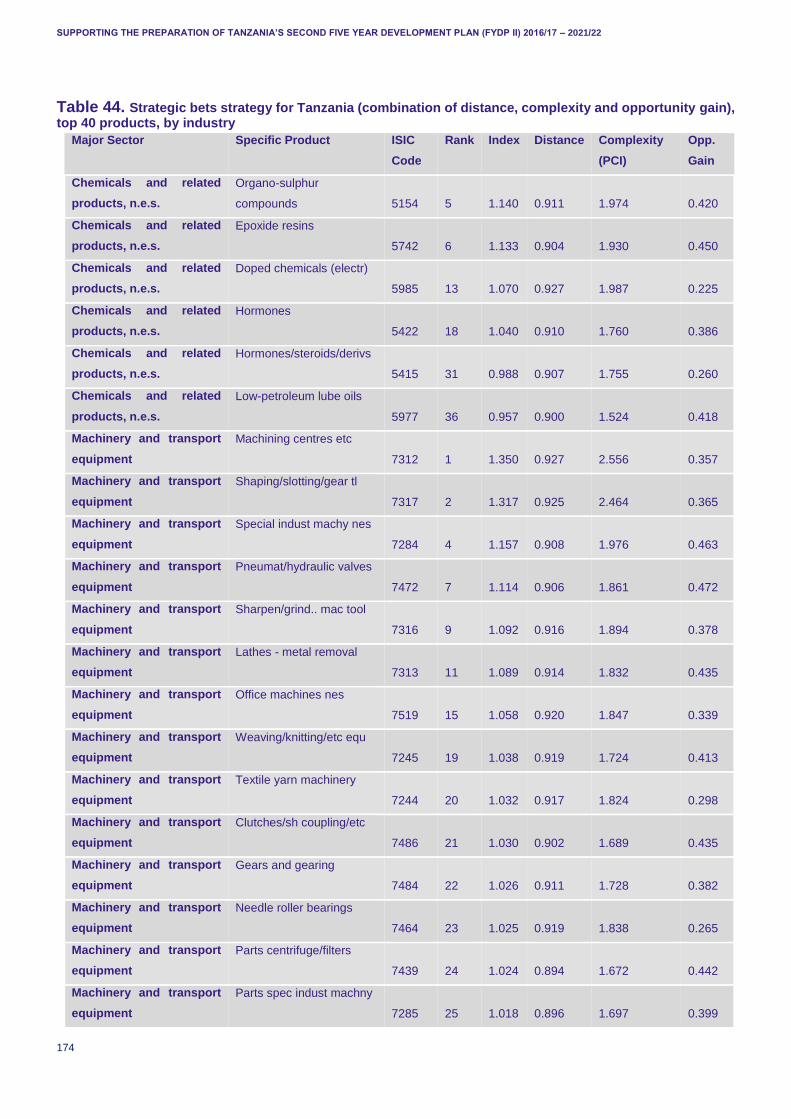
SUPPORTING THE PREPARATION OF TANZANIA’S SECOND FIVE YEAR DEVELOPMENT PLAN (FYDP II) 2016/17 – 2021/22
174
Table 44. Strategic bets strategy for Tanzania (combination of distance, complexity and opportunity gain), top 40 products, by industry
Major Sector Specific Product ISIC
Code
Rank Index Distance Complexity
(PCI)
Opp.
Gain
Chemicals and related
products, n.e.s.
Organo-sulphur
compounds 5154 5 1.140 0.911 1.974 0.420
Chemicals and related
products, n.e.s.
Epoxide resins
5742 6 1.133 0.904 1.930 0.450
Chemicals and related
products, n.e.s.
Doped chemicals (electr)
5985 13 1.070 0.927 1.987 0.225
Chemicals and related
products, n.e.s.
Hormones
5422 18 1.040 0.910 1.760 0.386
Chemicals and related
products, n.e.s.
Hormones/steroids/derivs
5415 31 0.988 0.907 1.755 0.260
Chemicals and related
products, n.e.s.
Low-petroleum lube oils
5977 36 0.957 0.900 1.524 0.418
Machinery and transport
equipment
Machining centres etc
7312 1 1.350 0.927 2.556 0.357
Machinery and transport
equipment
Shaping/slotting/gear tl
7317 2 1.317 0.925 2.464 0.365
Machinery and transport
equipment
Special indust machy nes
7284 4 1.157 0.908 1.976 0.463
Machinery and transport
equipment
Pneumat/hydraulic valves
7472 7 1.114 0.906 1.861 0.472
Machinery and transport
equipment
Sharpen/grind.. mac tool
7316 9 1.092 0.916 1.894 0.378
Machinery and transport
equipment
Lathes - metal removal
7313 11 1.089 0.914 1.832 0.435
Machinery and transport
equipment
Office machines nes
7519 15 1.058 0.920 1.847 0.339
Machinery and transport
equipment
Weaving/knitting/etc equ
7245 19 1.038 0.919 1.724 0.413
Machinery and transport
equipment
Textile yarn machinery
7244 20 1.032 0.917 1.824 0.298
Machinery and transport
equipment
Clutches/sh coupling/etc
7486 21 1.030 0.902 1.689 0.435
Machinery and transport
equipment
Gears and gearing
7484 22 1.026 0.911 1.728 0.382
Machinery and transport
equipment
Needle roller bearings
7464 23 1.025 0.919 1.838 0.265
Machinery and transport
equipment
Parts centrifuge/filters
7439 24 1.024 0.894 1.672 0.442
Machinery and transport
equipment
Parts spec indust machny
7285 25 1.018 0.896 1.697 0.399
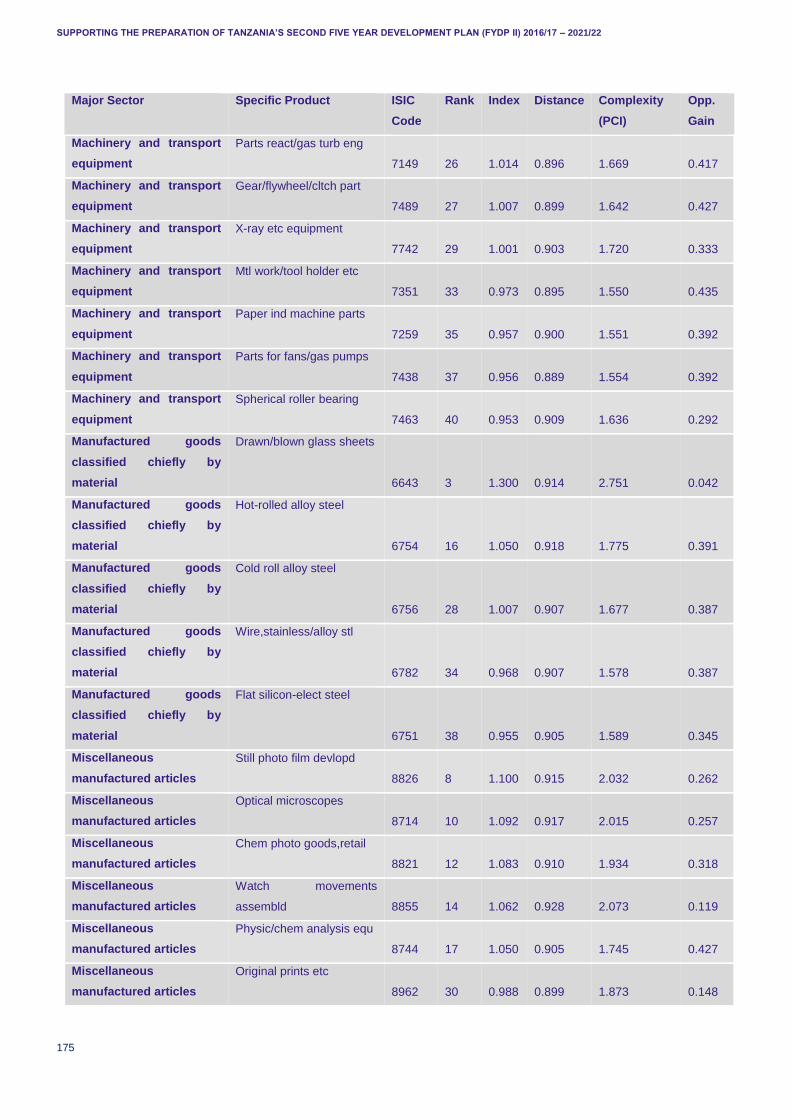
SUPPORTING THE PREPARATION OF TANZANIA’S SECOND FIVE YEAR DEVELOPMENT PLAN (FYDP II) 2016/17 – 2021/22
175
Major Sector Specific Product ISIC
Code
Rank Index Distance Complexity
(PCI)
Opp.
Gain
Machinery and transport
equipment
Parts react/gas turb eng
7149 26 1.014 0.896 1.669 0.417
Machinery and transport
equipment
Gear/flywheel/cltch part
7489 27 1.007 0.899 1.642 0.427
Machinery and transport
equipment
X-ray etc equipment
7742 29 1.001 0.903 1.720 0.333
Machinery and transport
equipment
Mtl work/tool holder etc
7351 33 0.973 0.895 1.550 0.435
Machinery and transport
equipment
Paper ind machine parts
7259 35 0.957 0.900 1.551 0.392
Machinery and transport
equipment
Parts for fans/gas pumps
7438 37 0.956 0.889 1.554 0.392
Machinery and transport
equipment
Spherical roller bearing
7463 40 0.953 0.909 1.636 0.292
Manufactured goods
classified chiefly by
material
Drawn/blown glass sheets
6643 3 1.300 0.914 2.751 0.042
Manufactured goods
classified chiefly by
material
Hot-rolled alloy steel
6754 16 1.050 0.918 1.775 0.391
Manufactured goods
classified chiefly by
material
Cold roll alloy steel
6756 28 1.007 0.907 1.677 0.387
Manufactured goods
classified chiefly by
material
Wire,stainless/alloy stl
6782 34 0.968 0.907 1.578 0.387
Manufactured goods
classified chiefly by
material
Flat silicon-elect steel
6751 38 0.955 0.905 1.589 0.345
Miscellaneous
manufactured articles
Still photo film devlopd
8826 8 1.100 0.915 2.032 0.262
Miscellaneous
manufactured articles
Optical microscopes
8714 10 1.092 0.917 2.015 0.257
Miscellaneous
manufactured articles
Chem photo goods,retail
8821 12 1.083 0.910 1.934 0.318
Miscellaneous
manufactured articles
Watch movements
assembld 8855 14 1.062 0.928 2.073 0.119
Miscellaneous
manufactured articles
Physic/chem analysis equ
8744 17 1.050 0.905 1.745 0.427
Miscellaneous
manufactured articles
Original prints etc
8962 30 0.988 0.899 1.873 0.148
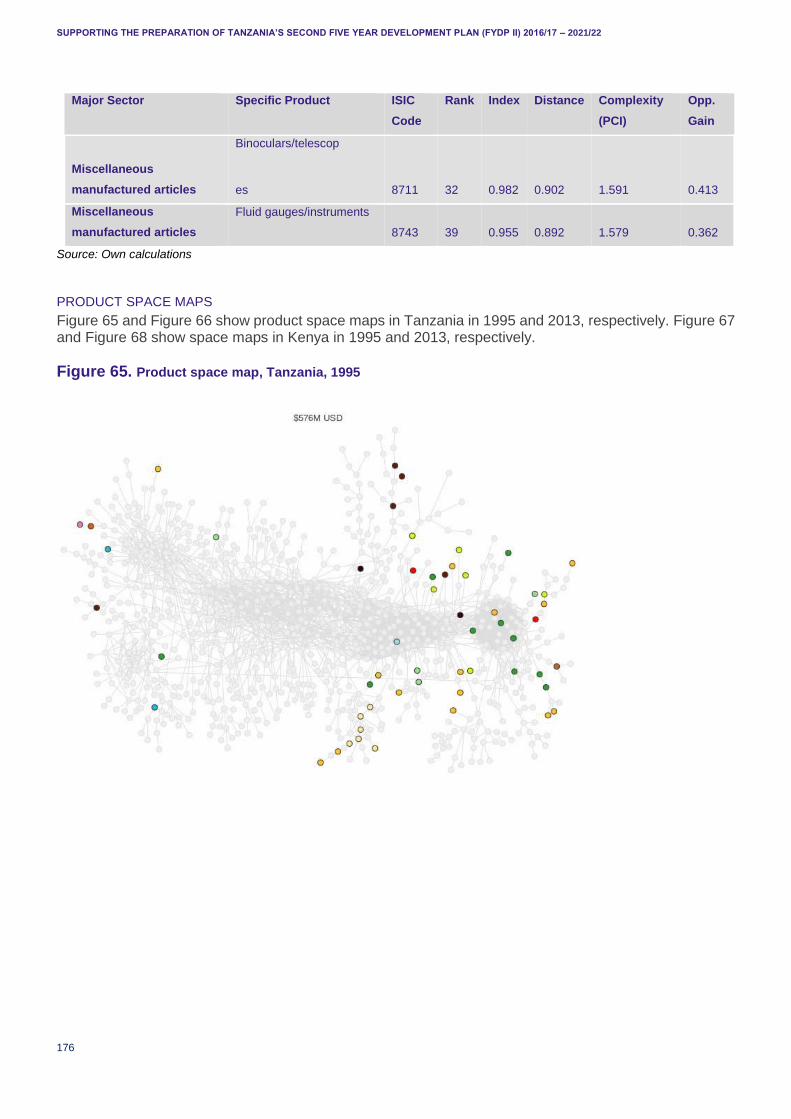
SUPPORTING THE PREPARATION OF TANZANIA’S SECOND FIVE YEAR DEVELOPMENT PLAN (FYDP II) 2016/17 – 2021/22
176
Major Sector Specific Product ISIC
Code
Rank Index Distance Complexity
(PCI)
Opp.
Gain
Miscellaneous
manufactured articles
Binoculars/telescop
es 8711 32 0.982 0.902 1.591 0.413
Miscellaneous
manufactured articles
Fluid gauges/instruments
8743 39 0.955 0.892 1.579 0.362
Source: Own calculations
PRODUCT SPACE MAPS
Figure 65 and Figure 66 show product space maps in Tanzania in 1995 and 2013, respectively. Figure 67 and Figure 68 show space maps in Kenya in 1995 and 2013, respectively.
Figure 65. Product space map, Tanzania, 1995
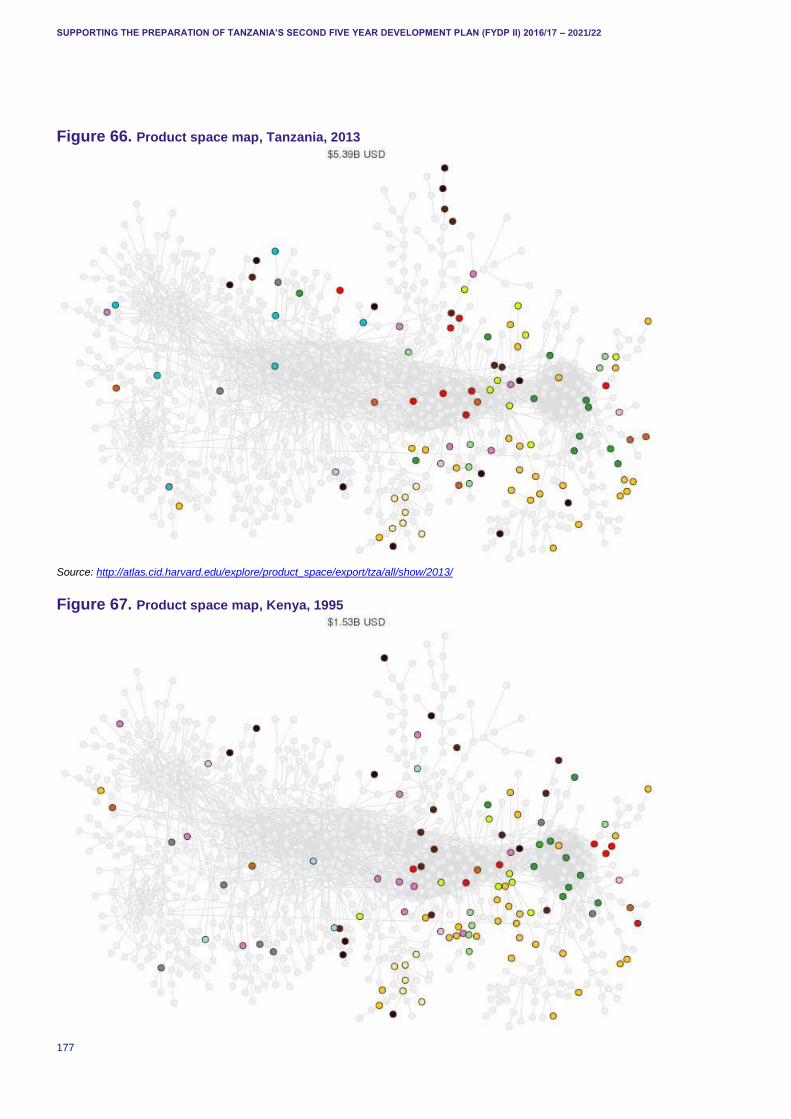
SUPPORTING THE PREPARATION OF TANZANIA’S SECOND FIVE YEAR DEVELOPMENT PLAN (FYDP II) 2016/17 – 2021/22
177
Figure 66. Product space map, Tanzania, 2013
Source: http://atlas.cid.harvard.edu/explore/product_space/export/tza/all/show/2013/
Figure 67. Product space map, Kenya, 1995
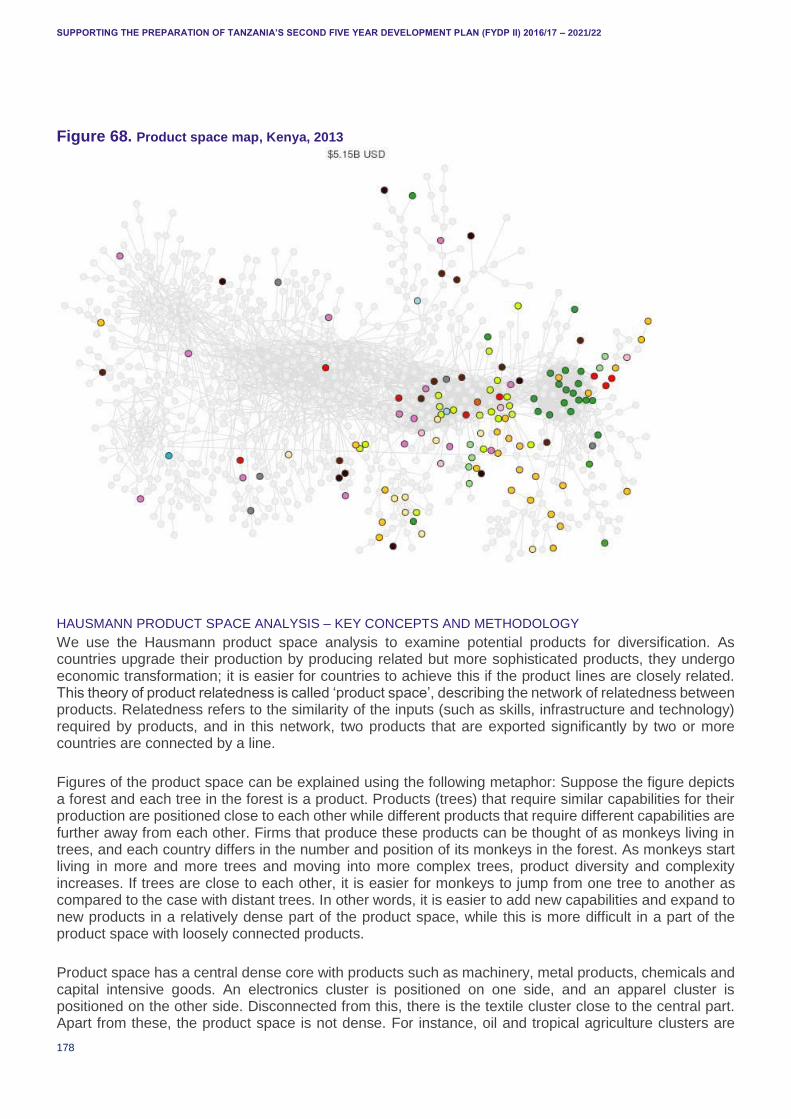
SUPPORTING THE PREPARATION OF TANZANIA’S SECOND FIVE YEAR DEVELOPMENT PLAN (FYDP II) 2016/17 – 2021/22
178
Figure 68. Product space map, Kenya, 2013
HAUSMANN PRODUCT SPACE ANALYSIS – KEY CONCEPTS AND METHODOLOGY
We use the Hausmann product space analysis to examine potential products for diversification. As countries upgrade their production by producing related but more sophisticated products, they undergo economic transformation; it is easier for countries to achieve this if the product lines are closely related. This theory of product relatedness is called ‘product space’, describing the network of relatedness between products. Relatedness refers to the similarity of the inputs (such as skills, infrastructure and technology) required by products, and in this network, two products that are exported significantly by two or more countries are connected by a line.
Figures of the product space can be explained using the following metaphor: Suppose the figure depicts a forest and each tree in the forest is a product. Products (trees) that require similar capabilities for their production are positioned close to each other while different products that require different capabilities are further away from each other. Firms that produce these products can be thought of as monkeys living in trees, and each country differs in the number and position of its monkeys in the forest. As monkeys start living in more and more trees and moving into more complex trees, product diversity and complexity increases. If trees are close to each other, it is easier for monkeys to jump from one tree to another as compared to the case with distant trees. In other words, it is easier to add new capabilities and expand to new products in a relatively dense part of the product space, while this is more difficult in a part of the product space with loosely connected products.
Product space has a central dense core with products such as machinery, metal products, chemicals and capital intensive goods. An electronics cluster is positioned on one side, and an apparel cluster is positioned on the other side. Disconnected from this, there is the textile cluster close to the central part. Apart from these, the product space is not dense. For instance, oil and tropical agriculture clusters are
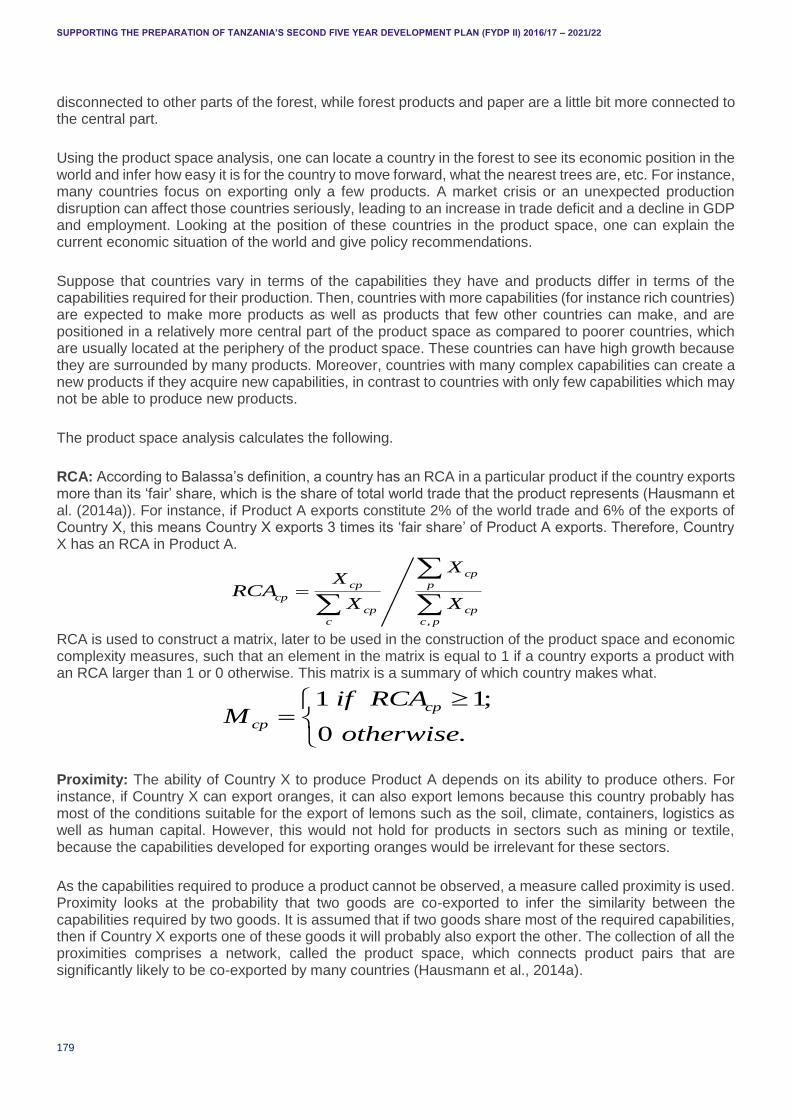
SUPPORTING THE PREPARATION OF TANZANIA’S SECOND FIVE YEAR DEVELOPMENT PLAN (FYDP II) 2016/17 – 2021/22
179
disconnected to other parts of the forest, while forest products and paper are a little bit more connected to the central part.
Using the product space analysis, one can locate a country in the forest to see its economic position in the world and infer how easy it is for the country to move forward, what the nearest trees are, etc. For instance, many countries focus on exporting only a few products. A market crisis or an unexpected production disruption can affect those countries seriously, leading to an increase in trade deficit and a decline in GDP and employment. Looking at the position of these countries in the product space, one can explain the current economic situation of the world and give policy recommendations.
Suppose that countries vary in terms of the capabilities they have and products differ in terms of the capabilities required for their production. Then, countries with more capabilities (for instance rich countries) are expected to make more products as well as products that few other countries can make, and are positioned in a relatively more central part of the product space as compared to poorer countries, which are usually located at the periphery of the product space. These countries can have high growth because they are surrounded by many products. Moreover, countries with many complex capabilities can create a new products if they acquire new capabilities, in contrast to countries with only few capabilities which may not be able to produce new products.
The product space analysis calculates the following.
RCA: According to Balassa’s definition, a country has an RCA in a particular product if the country exports more than its ‘fair’ share, which is the share of total world trade that the product represents (Hausmann et al. (2014a)). For instance, if Product A exports constitute 2% of the world trade and 6% of the exports of Country X, this means Country X exports 3 times its ‘fair share’ of Product A exports. Therefore, Country X has an RCA in Product A.
,
cp
cp p
cp
cp cp
c c p
XX
RCAX X
RCA is used to construct a matrix, later to be used in the construction of the product space and economic complexity measures, such that an element in the matrix is equal to 1 if a country exports a product with an RCA larger than 1 or 0 otherwise. This matrix is a summary of which country makes what.
1 1;
0 .
cp
cp
if RCAM
otherwise
Proximity: The ability of Country X to produce Product A depends on its ability to produce others. For instance, if Country X can export oranges, it can also export lemons because this country probably has most of the conditions suitable for the export of lemons such as the soil, climate, containers, logistics as well as human capital. However, this would not hold for products in sectors such as mining or textile, because the capabilities developed for exporting oranges would be irrelevant for these sectors.
As the capabilities required to produce a product cannot be observed, a measure called proximity is used. Proximity looks at the probability that two goods are co-exported to infer the similarity between the capabilities required by two goods. It is assumed that if two goods share most of the required capabilities, then if Country X exports one of these goods it will probably also export the other. The collection of all the proximities comprises a network, called the product space, which connects product pairs that are significantly likely to be co-exported by many countries (Hausmann et al., 2014a).
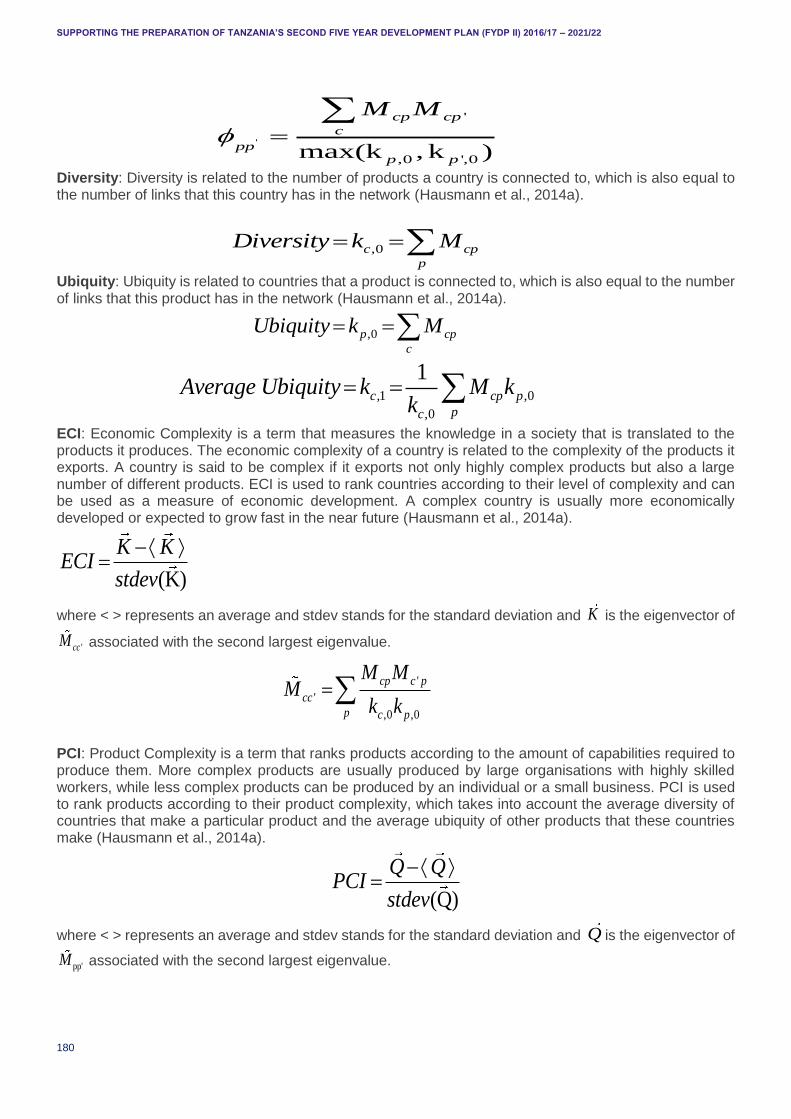
SUPPORTING THE PREPARATION OF TANZANIA’S SECOND FIVE YEAR DEVELOPMENT PLAN (FYDP II) 2016/17 – 2021/22
180
'
'
,0 ',0max(k ,k )
cp cp
c
ppp p
M M
Diversity: Diversity is related to the number of products a country is connected to, which is also equal to the number of links that this country has in the network (Hausmann et al., 2014a).
,0c cp
p
Diversity k M
Ubiquity: Ubiquity is related to countries that a product is connected to, which is also equal to the number of links that this product has in the network (Hausmann et al., 2014a).
,0p cp
c
Ubiquity k M
,1 ,0
,0
1c cp p
pc
Average Ubiquity k M kk
ECI: Economic Complexity is a term that measures the knowledge in a society that is translated to the products it produces. The economic complexity of a country is related to the complexity of the products it exports. A country is said to be complex if it exports not only highly complex products but also a large number of different products. ECI is used to rank countries according to their level of complexity and can be used as a measure of economic development. A complex country is usually more economically developed or expected to grow fast in the near future (Hausmann et al., 2014a).
(K)
K KECI
stdev
where < > represents an average and stdev stands for the standard deviation and K is the eigenvector of
'ccM associated with the second largest eigenvalue.
'
'
,0 ,0
cp c p
cc
p c p
M MM
k k
PCI: Product Complexity is a term that ranks products according to the amount of capabilities required to produce them. More complex products are usually produced by large organisations with highly skilled workers, while less complex products can be produced by an individual or a small business. PCI is used to rank products according to their product complexity, which takes into account the average diversity of countries that make a particular product and the average ubiquity of other products that these countries make (Hausmann et al., 2014a).
(Q)
Q QPCI
stdev
where < > represents an average and stdev stands for the standard deviation and Q is the eigenvector of
pp'M associated with the second largest eigenvalue.
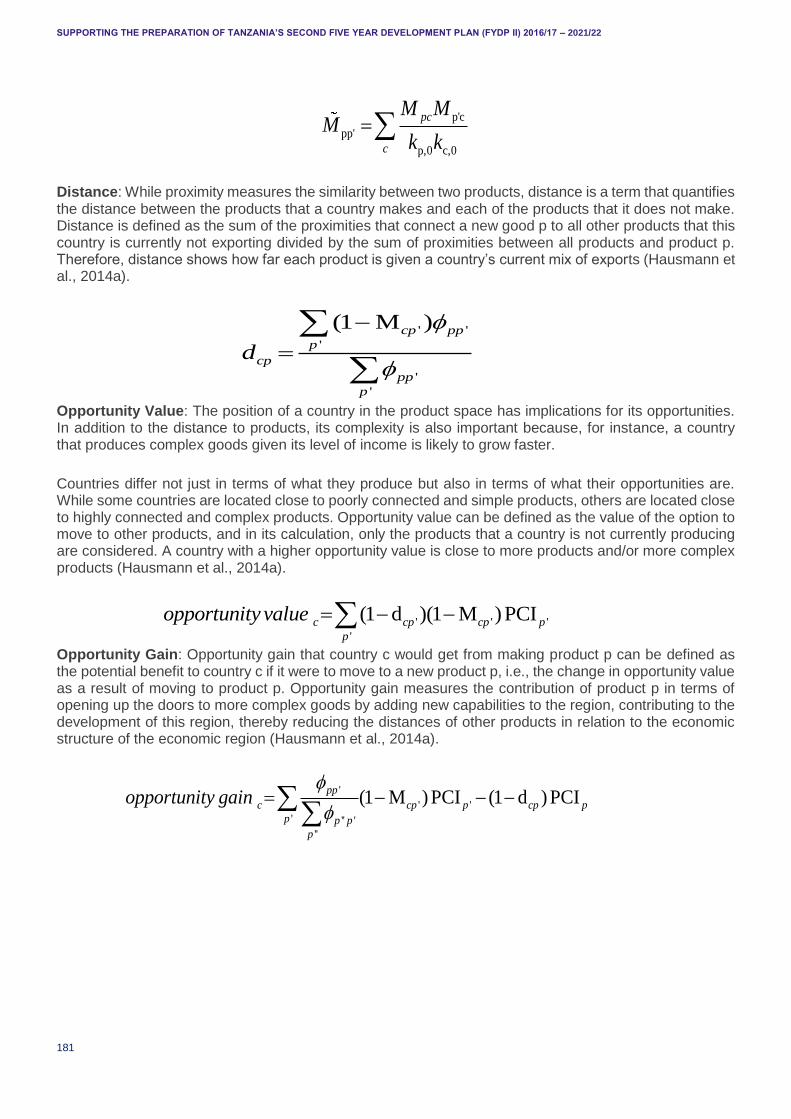
SUPPORTING THE PREPARATION OF TANZANIA’S SECOND FIVE YEAR DEVELOPMENT PLAN (FYDP II) 2016/17 – 2021/22
181
p'c
pp'
p,0 c,0
pc
c
M MM
k k
Distance: While proximity measures the similarity between two products, distance is a term that quantifies the distance between the products that a country makes and each of the products that it does not make. Distance is defined as the sum of the proximities that connect a new good p to all other products that this country is currently not exporting divided by the sum of proximities between all products and product p. Therefore, distance shows how far each product is given a country’s current mix of exports (Hausmann et al., 2014a).
' '
'
'
'
(1 M )cp pp
p
cp
pp
p
d
Opportunity Value: The position of a country in the product space has implications for its opportunities. In addition to the distance to products, its complexity is also important because, for instance, a country that produces complex goods given its level of income is likely to grow faster.
Countries differ not just in terms of what they produce but also in terms of what their opportunities are. While some countries are located close to poorly connected and simple products, others are located close to highly connected and complex products. Opportunity value can be defined as the value of the option to move to other products, and in its calculation, only the products that a country is not currently producing are considered. A country with a higher opportunity value is close to more products and/or more complex products (Hausmann et al., 2014a).
' ' '
'
(1 d )(1 M )PCIc cp cp p
p
opportunity value
Opportunity Gain: Opportunity gain that country c would get from making product p can be defined as the potential benefit to country c if it were to move to a new product p, i.e., the change in opportunity value as a result of moving to product p. Opportunity gain measures the contribution of product p in terms of opening up the doors to more complex goods by adding new capabilities to the region, contributing to the development of this region, thereby reducing the distances of other products in relation to the economic structure of the economic region (Hausmann et al., 2014a).
'
' '
' '' '
''
(1 M ) PCI (1 d ) PCIpp
c cp p cp p
p p p
p
opportunity gain
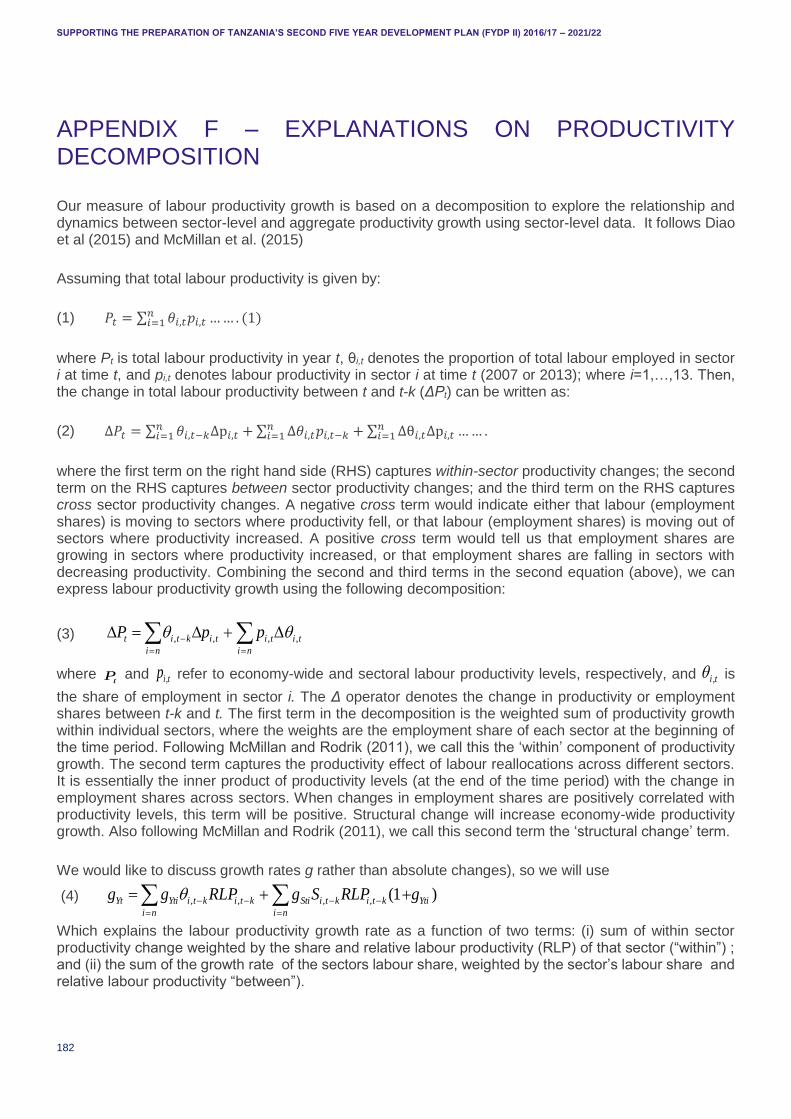
SUPPORTING THE PREPARATION OF TANZANIA’S SECOND FIVE YEAR DEVELOPMENT PLAN (FYDP II) 2016/17 – 2021/22
182
APPENDIX F – EXPLANATIONS ON PRODUCTIVITY DECOMPOSITION
Our measure of labour productivity growth is based on a decomposition to explore the relationship and dynamics between sector-level and aggregate productivity growth using sector-level data. It follows Diao et al (2015) and McMillan et al. (2015)
Assuming that total labour productivity is given by:
(1) 𝑃𝑡 = ∑ 𝜃𝑖,𝑡𝑝𝑖,𝑡 … … . (1)𝑛𝑖=1
where Pt is total labour productivity in year t, θi,t denotes the proportion of total labour employed in sector i at time t, and pi,t denotes labour productivity in sector i at time t (2007 or 2013); where i=1,…,13. Then, the change in total labour productivity between t and t-k (ΔPt) can be written as:
(2) Δ𝑃𝑡 = ∑ 𝜃𝑖,𝑡−𝑘Δp𝑖,𝑡 + ∑ Δ𝜃𝑖,𝑡𝑝𝑖,𝑡−𝑘 + ∑ Δθ𝑖,𝑡Δp𝑖,𝑡 … … .𝑛𝑖=1
𝑛𝑖=1
𝑛𝑖=1
where the first term on the right hand side (RHS) captures within-sector productivity changes; the second term on the RHS captures between sector productivity changes; and the third term on the RHS captures cross sector productivity changes. A negative cross term would indicate either that labour (employment shares) is moving to sectors where productivity fell, or that labour (employment shares) is moving out of sectors where productivity increased. A positive cross term would tell us that employment shares are growing in sectors where productivity increased, or that employment shares are falling in sectors with decreasing productivity. Combining the second and third terms in the second equation (above), we can express labour productivity growth using the following decomposition:
(3)
ni
tititi
ni
ktit ppP ,,,,
where tP and tip , refer to economy-wide and sectoral labour productivity levels, respectively, and ti , is
the share of employment in sector i. The Δ operator denotes the change in productivity or employment shares between t-k and t. The first term in the decomposition is the weighted sum of productivity growth within individual sectors, where the weights are the employment share of each sector at the beginning of the time period. Following McMillan and Rodrik (2011), we call this the ‘within’ component of productivity growth. The second term captures the productivity effect of labour reallocations across different sectors. It is essentially the inner product of productivity levels (at the end of the time period) with the change in employment shares across sectors. When changes in employment shares are positively correlated with productivity levels, this term will be positive. Structural change will increase economy-wide productivity growth. Also following McMillan and Rodrik (2011), we call this second term the ‘structural change’ term.
We would like to discuss growth rates g rather than absolute changes), so we will use
(4) )1(,,,, Yti
ni
ktiktiStikti
ni
ktiYtiYt gRLPSgRLPgg
Which explains the labour productivity growth rate as a function of two terms: (i) sum of within sector productivity change weighted by the share and relative labour productivity (RLP) of that sector (“within”) ; and (ii) the sum of the growth rate of the sectors labour share, weighted by the sector’s labour share and relative labour productivity “between”).
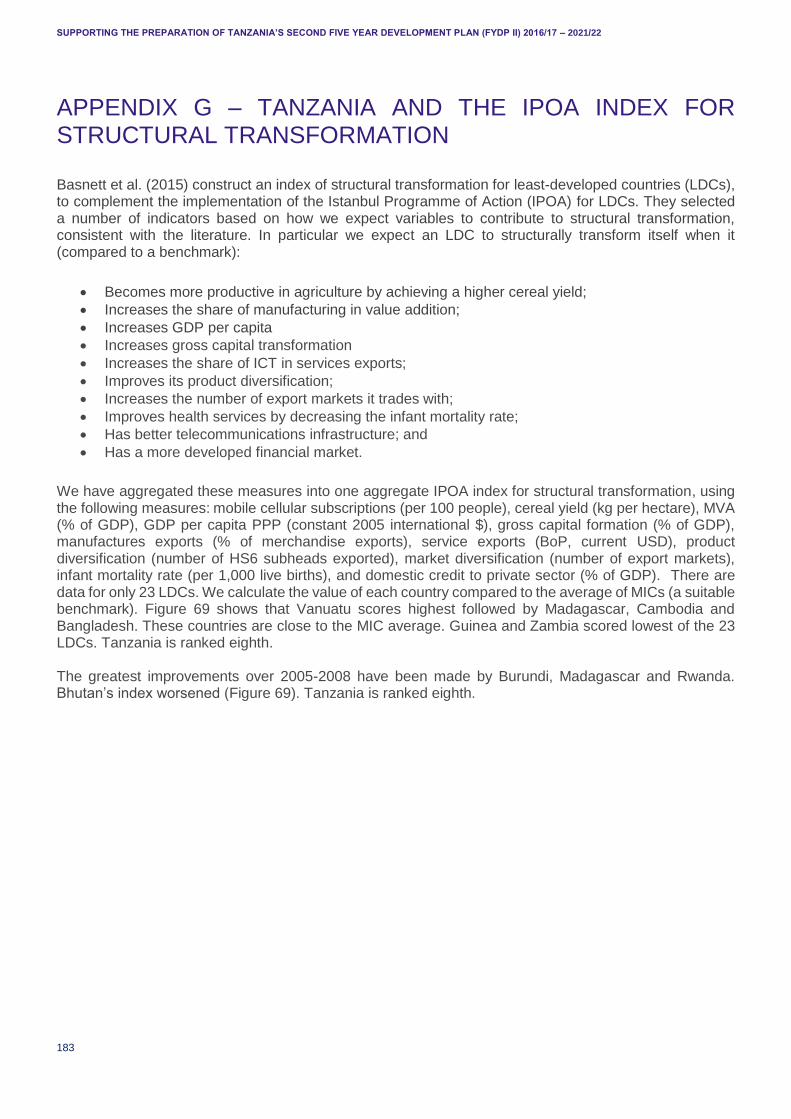
SUPPORTING THE PREPARATION OF TANZANIA’S SECOND FIVE YEAR DEVELOPMENT PLAN (FYDP II) 2016/17 – 2021/22
183
APPENDIX G – TANZANIA AND THE IPOA INDEX FOR STRUCTURAL TRANSFORMATION
Basnett et al. (2015) construct an index of structural transformation for least-developed countries (LDCs), to complement the implementation of the Istanbul Programme of Action (IPOA) for LDCs. They selected a number of indicators based on how we expect variables to contribute to structural transformation, consistent with the literature. In particular we expect an LDC to structurally transform itself when it (compared to a benchmark):
Becomes more productive in agriculture by achieving a higher cereal yield;
Increases the share of manufacturing in value addition;
Increases GDP per capita
Increases gross capital transformation
Increases the share of ICT in services exports;
Improves its product diversification;
Increases the number of export markets it trades with;
Improves health services by decreasing the infant mortality rate;
Has better telecommunications infrastructure; and
Has a more developed financial market.
We have aggregated these measures into one aggregate IPOA index for structural transformation, using the following measures: mobile cellular subscriptions (per 100 people), cereal yield (kg per hectare), MVA (% of GDP), GDP per capita PPP (constant 2005 international $), gross capital formation (% of GDP), manufactures exports (% of merchandise exports), service exports (BoP, current USD), product diversification (number of HS6 subheads exported), market diversification (number of export markets), infant mortality rate (per 1,000 live births), and domestic credit to private sector (% of GDP). There are data for only 23 LDCs. We calculate the value of each country compared to the average of MICs (a suitable benchmark). Figure 69 shows that Vanuatu scores highest followed by Madagascar, Cambodia and Bangladesh. These countries are close to the MIC average. Guinea and Zambia scored lowest of the 23 LDCs. Tanzania is ranked eighth. The greatest improvements over 2005-2008 have been made by Burundi, Madagascar and Rwanda. Bhutan’s index worsened (Figure 69). Tanzania is ranked eighth.
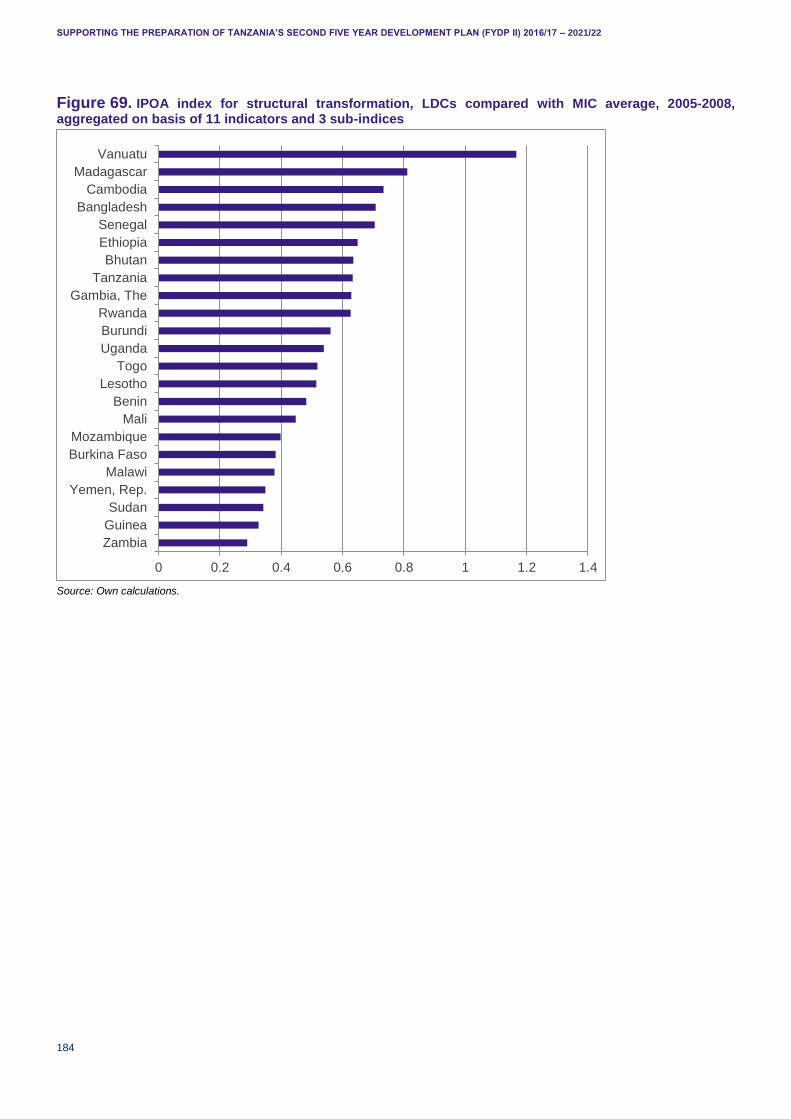
SUPPORTING THE PREPARATION OF TANZANIA’S SECOND FIVE YEAR DEVELOPMENT PLAN (FYDP II) 2016/17 – 2021/22
184
Figure 69. IPOA index for structural transformation, LDCs compared with MIC average, 2005-2008, aggregated on basis of 11 indicators and 3 sub-indices
Source: Own calculations.
0 0.2 0.4 0.6 0.8 1 1.2 1.4
Zambia
Guinea
Sudan
Yemen, Rep.
Malawi
Burkina Faso
Mozambique
Mali
Benin
Lesotho
Togo
Uganda
Burundi
Rwanda
Gambia, The
Tanzania
Bhutan
Ethiopia
Senegal
Bangladesh
Cambodia
Madagascar
Vanuatu
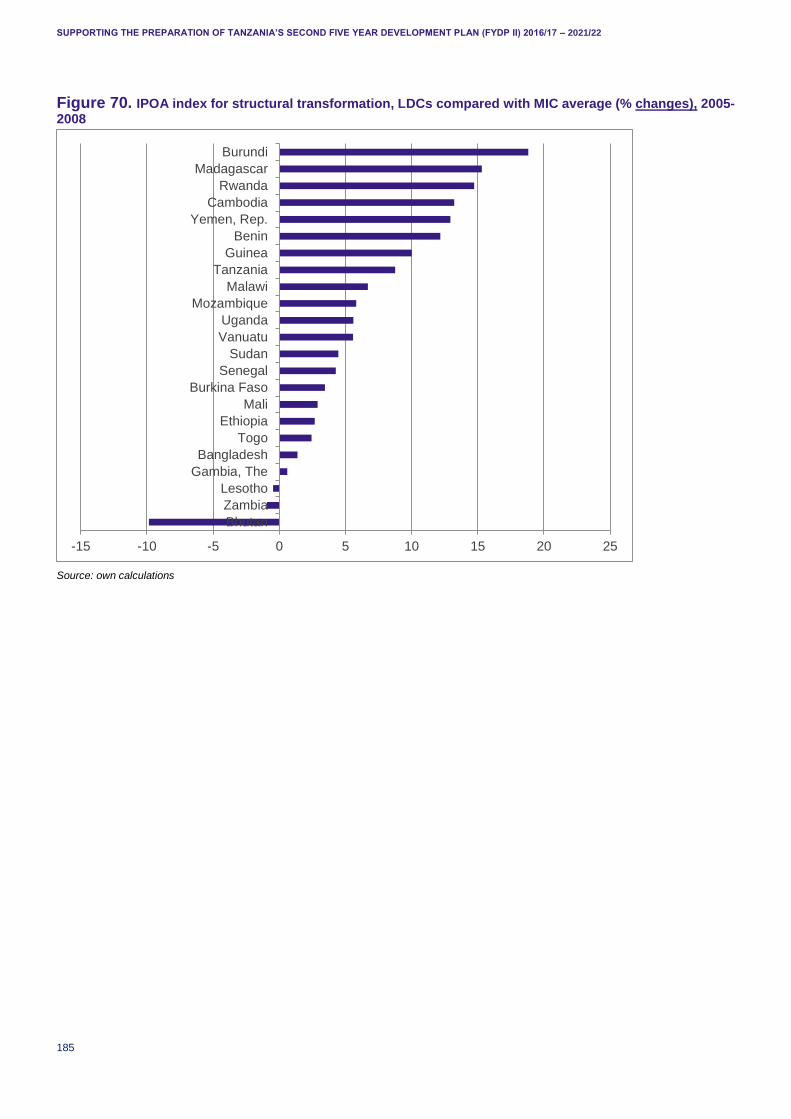
SUPPORTING THE PREPARATION OF TANZANIA’S SECOND FIVE YEAR DEVELOPMENT PLAN (FYDP II) 2016/17 – 2021/22
185
Figure 70. IPOA index for structural transformation, LDCs compared with MIC average (% changes), 2005-2008
Source: own calculations
-15 -10 -5 0 5 10 15 20 25
Bhutan
Zambia
Lesotho
Gambia, The
Bangladesh
Togo
Ethiopia
Mali
Burkina Faso
Senegal
Sudan
Vanuatu
Uganda
Mozambique
Malawi
Tanzania
Guinea
Benin
Yemen, Rep.
Cambodia
Rwanda
Madagascar
Burundi
SUPPORTING THE PREPARATION OF TANZANIA’S SECOND FIVE YEAR DEVELOPMENT PLAN (FYDP II) 2016/17 – 2021/22
186
APPENDIX H – EVOLUTION OF TANZANIA’S EXPORTS AND WORLD DEMAND Table 45 presents a list of products that have experienced growth in world demand and where Tanzania has shown a CA (close to 1 is the maximum for normalised CA as shown) in every year between 2008 and 2013. We consider these as consolidated products in the export structure. Some of these products are clearly familiar, of course. However, the analysis can help to identify other products that can be leading the economic transformation through trade. In addition, we present the share of Tanzania in the world demand of these products. This indicates on one hand, the room that Tanzania has to expand their supply (the lower the share the higher the possibilities of expansion); and on the other side, it indicates the degree of leadership in world supply. At the same time, the comparison between the Tanzania export and world demand growth rate, indicates whether Tanzania is increasing its leadership in the supply.
Table 45. Sustained positive RCA (normalised) and growing world demand RCA TZA
exports
2014 (in thousands of USD)
TZA Average
growth 2008-
14
World
growth 2008-
13
Share
Tanzania 2013 HS Product Name 2008 2009 2010 2011 2012 2013
030419 Fish filletsandother fish meat (excl. of 0304.11-030... 0.976 0.967 0.958 0.965 0.903 0.921 30,931 -9.3% 4.6% 0.6%
030429 Fish filletsandother fish meat (excl. of 0304.21-030... 0.922 0.908 0.912 0.879 0.854 0.844 69,356 3.4% 4.6% 0.3%
030559 Dried fish other than cod (Gadus morhua/ogac/macro... 0.963 0.970 0.952 0.916 0.914 0.902 17,226 12.1% 3.8% 0.5%
030759 Octopus (Octopus spp.), other than live/fresh/chil... 0.969 0.936 0.925 0.878 0.860 0.842 3,097 -14.5% 9.5% 0.3%
050610 Ossein and bones treated with acid 0.966 0.939 0.986 0.973 0.980 0.979 2,043 26.4% 14.6% 2.5%
050710 Ivory; ivory powder and waste 0.999 0.998 0.999 0.997 0.998 0.993 273 -21.7% 8.1% 7.2%
050790 Tortoise-shell, whalebone and whalebone hair, horns,... 0.370 0.883 0.754 0.908 0.863 0.840 21 -4.0% 6.1% 0.3%
050800 Coral and similar materials, unworked/simply prepare... 0.772 0.726 0.468 0.534 0.627 0.840 351 9.9% 8.1% 0.3%
060311 Fresh roses 0.869 0.874 0.930 0.922 0.945 0.846 9,906 3.2% 6.6% 0.3%
060390 Cut flowers and flower buds of a kind suit. for bouq... 0.929 0.888 0.794 0.352 0.617 0.853 1,444 -11.5% 4.9% 0.3%
070810 Peas (Pisum sativum), shelled/unshelled, fresh/chi... 0.971 0.843 0.919 0.234 0.972 0.844 585 -22.6% 7.5% 0.3%
070820 Beans (Vigna spp., Phaseolus spp.), shelled/unshel... 0.921 0.848 0.851 0.889 0.944 0.959 7,565 17.7% 6.8% 1.2%
070890 Leguminous vegetables (excl. of 0708.10 and 0708.20)... 0.650 0.798 0.793 0.950 0.943 0.946 16 -19.8% 7.6% 0.9%
071220 Onions, dried, whole/cut/sliced/broken/in powder b... 0.735 0.725 0.438 0.804 0.373 0.641 342 -2.8% 4.9% 0.1%
071310 Peas (Pisum sativum), dried, shelled, whether/not ... 0.982 0.980 0.983 0.968 0.980 0.981 32,390 -1.5% 7.1% 2.7%
071320 Chickpeas (garbanzos), dried, shelled, whether/not... 0.966 0.935 0.967 0.953 0.950 0.953 19,421 17.3% 14.9% 1.1%
071339 Beans (Vigna spp., Phaseolus spp. (excl. of 0713.3... 0.739 0.958 0.962 0.903 0.944 0.825 6,263 36.0% 1.6% 0.3%
071390 Dried leguminous vegetables, n.e.s., shelled, whet... 0.997 0.995 0.994 0.996 0.994 0.994 103,351 28.2% 9.0% 8.2%
080119 Cocunuts, other than desiccated 0.981 0.939 0.925 0.934 0.909 0.914 2,143 7.8% 28.7% 0.6%
080131 Cashew nuts, in shell 0.998 0.998 0.996 0.994 0.994 0.996 376,228 36.4% 31.4% 14.4%
080132 Cashew nuts, shelled 0.978 0.955 0.952 0.907 0.900 0.928 15,653 -7.2% 16.7% 0.7%
090111 Coffee, not roasted, not decaffeinated 0.940 0.941 0.910 0.902 0.917 0.947 121,053 2.8% 3.8% 1.0%
090240 Tea, black (fermented) and partly fermented tea, whe... 0.974 0.978 0.960 0.970 0.972 0.964 43,503 1.7% 9.4% 1.4%
090700 Cloves (whole fruit, cloves and stems) 0.995 0.994 0.989 0.987 0.993 0.996 30,781 12.5% 16.3% 13.0%
100820 Millet 0.882 0.974 0.766 0.720 0.172 0.097 172 -6.1% 7.0% 0.0%
100890 Cereals (excl. those which have been hulled/othw. ... 0.931 0.804 0.957 0.965 0.945 0.919 2,750 7.8% 17.2% 0.6%
110100 Wheat/meslin flour 0.951 0.883 0.952 0.926 0.922 0.932 16,129 -11.1% 4.5% 0.7%
110220 Maize (corn) flour 0.729 0.600 0.941 0.898 0.393 0.485 6,200 49.7% 4.7% 0.1%
120740 Sesamum seeds, whether/not broken 0.988 0.988 0.976 0.985 0.982 0.988 324,415 39.7% 22.7% 4.5%
120799 Oil seeds and oleaginous fruits (excl. of 1206.00 and ... 0.949 0.954 0.956 0.916 0.970 0.970 13,406 26.4% 21.0% 1.7%
120930 Seeds of herbaceous plants cultivated principally ... 0.877 0.878 0.887 0.844 0.800 0.752 528 -6.2% 4.8% 0.2%
120991 Vegetable seeds, of a kind used for sowing 0.773 0.493 0.463 0.656 0.631 0.758 5,617 4.8% 6.7% 0.2%
120999 Seeds, n.e.s., of a kind used for sowing 0.932 0.702 0.766 0.389 0.738 0.729 127 -33.0% 2.2% 0.2%
121190 Plants and parts of plants, incl. seeds and fruits, of... 0.856 0.873 0.840 0.865 0.881 0.863 5,777 6.4% 12.5% 0.4%
130120 Gum Arabic 0.870 0.666 0.634 0.700 0.582 0.804 447 -7.0% 1.4% 0.2%
151211 Sunflower seed/safflower oil, crude 0.728 0.555 0.922 0.764 0.665 0.577 7,086 5.6% 11.3% 0.1%
151229 Cotton seed oil, other than crude, and fractions the... 0.944 0.820 0.759 0.841 0.936 0.931 214 -18.2% 0.3% 0.7%
152190 Beeswax, other insect waxes and spermaceti, whether/... 0.988 0.984 0.981 0.979 0.952 0.977 2,397 -3.6% 12.2% 2.2%
170191 Cane/beet sugar and chemically pure sucrose, in soli... 0.559 0.956 0.966 0.938 0.978 0.994 11 -33.4% 3.1% 9.1%
170310 Cane molasses 0.930 0.834 0.737 0.822 0.642 0.770 303 -25.5% 8.8% 0.2%
180100 Cocoa beans, whole/broken, raw/roasted 0.952 0.870 0.801 0.798 0.726 0.789 22,139 -2.0% 17.8% 0.2%
210130 Roasted chicory and other roasted coffee substitutes... 0.949 0.974 0.947 0.916 0.911 0.920 58 -32.3% 5.6% 0.6%
230210 Bran, sharps and other residues, whether/not in the ... 0.769 0.783 0.310 0.953 0.008 0.569 8,513 62.1% 13.0% 0.1%
230230 Bran, sharps and other residues, whether/not in the ... 0.959 0.955 0.933 0.946 0.919 0.964 14,371 13.8% 10.0% 1.4%
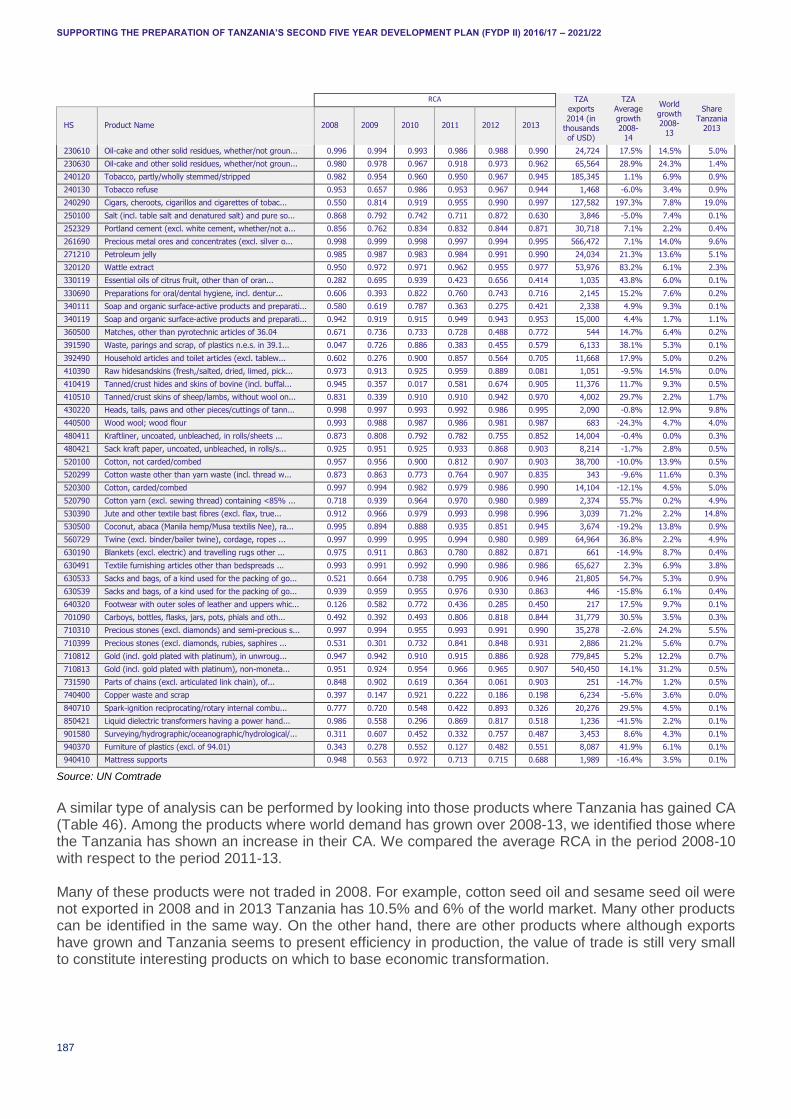
SUPPORTING THE PREPARATION OF TANZANIA’S SECOND FIVE YEAR DEVELOPMENT PLAN (FYDP II) 2016/17 – 2021/22
187
RCA TZA exports
2014 (in thousands of USD)
TZA Average
growth 2008-
14
World
growth 2008-
13
Share
Tanzania 2013 HS Product Name 2008 2009 2010 2011 2012 2013
230610 Oil-cake and other solid residues, whether/not groun... 0.996 0.994 0.993 0.986 0.988 0.990 24,724 17.5% 14.5% 5.0%
230630 Oil-cake and other solid residues, whether/not groun... 0.980 0.978 0.967 0.918 0.973 0.962 65,564 28.9% 24.3% 1.4%
240120 Tobacco, partly/wholly stemmed/stripped 0.982 0.954 0.960 0.950 0.967 0.945 185,345 1.1% 6.9% 0.9%
240130 Tobacco refuse 0.953 0.657 0.986 0.953 0.967 0.944 1,468 -6.0% 3.4% 0.9%
240290 Cigars, cheroots, cigarillos and cigarettes of tobac... 0.550 0.814 0.919 0.955 0.990 0.997 127,582 197.3% 7.8% 19.0%
250100 Salt (incl. table salt and denatured salt) and pure so... 0.868 0.792 0.742 0.711 0.872 0.630 3,846 -5.0% 7.4% 0.1%
252329 Portland cement (excl. white cement, whether/not a... 0.856 0.762 0.834 0.832 0.844 0.871 30,718 7.1% 2.2% 0.4%
261690 Precious metal ores and concentrates (excl. silver o... 0.998 0.999 0.998 0.997 0.994 0.995 566,472 7.1% 14.0% 9.6%
271210 Petroleum jelly 0.985 0.987 0.983 0.984 0.991 0.990 24,034 21.3% 13.6% 5.1%
320120 Wattle extract 0.950 0.972 0.971 0.962 0.955 0.977 53,976 83.2% 6.1% 2.3%
330119 Essential oils of citrus fruit, other than of oran... 0.282 0.695 0.939 0.423 0.656 0.414 1,035 43.8% 6.0% 0.1%
330690 Preparations for oral/dental hygiene, incl. dentur... 0.606 0.393 0.822 0.760 0.743 0.716 2,145 15.2% 7.6% 0.2%
340111 Soap and organic surface-active products and preparati... 0.580 0.619 0.787 0.363 0.275 0.421 2,338 4.9% 9.3% 0.1%
340119 Soap and organic surface-active products and preparati... 0.942 0.919 0.915 0.949 0.943 0.953 15,000 4.4% 1.7% 1.1%
360500 Matches, other than pyrotechnic articles of 36.04 0.671 0.736 0.733 0.728 0.488 0.772 544 14.7% 6.4% 0.2%
391590 Waste, parings and scrap, of plastics n.e.s. in 39.1... 0.047 0.726 0.886 0.383 0.455 0.579 6,133 38.1% 5.3% 0.1%
392490 Household articles and toilet articles (excl. tablew... 0.602 0.276 0.900 0.857 0.564 0.705 11,668 17.9% 5.0% 0.2%
410390 Raw hidesandskins (fresh,/salted, dried, limed, pick... 0.973 0.913 0.925 0.959 0.889 0.081 1,051 -9.5% 14.5% 0.0%
410419 Tanned/crust hides and skins of bovine (incl. buffal... 0.945 0.357 0.017 0.581 0.674 0.905 11,376 11.7% 9.3% 0.5%
410510 Tanned/crust skins of sheep/lambs, without wool on... 0.831 0.339 0.910 0.910 0.942 0.970 4,002 29.7% 2.2% 1.7%
430220 Heads, tails, paws and other pieces/cuttings of tann... 0.998 0.997 0.993 0.992 0.986 0.995 2,090 -0.8% 12.9% 9.8%
440500 Wood wool; wood flour 0.993 0.988 0.987 0.986 0.981 0.987 683 -24.3% 4.7% 4.0%
480411 Kraftliner, uncoated, unbleached, in rolls/sheets ... 0.873 0.808 0.792 0.782 0.755 0.852 14,004 -0.4% 0.0% 0.3%
480421 Sack kraft paper, uncoated, unbleached, in rolls/s... 0.925 0.951 0.925 0.933 0.868 0.903 8,214 -1.7% 2.8% 0.5%
520100 Cotton, not carded/combed 0.957 0.956 0.900 0.812 0.907 0.903 38,700 -10.0% 13.9% 0.5%
520299 Cotton waste other than yarn waste (incl. thread w... 0.873 0.863 0.773 0.764 0.907 0.835 343 -9.6% 11.6% 0.3%
520300 Cotton, carded/combed 0.997 0.994 0.982 0.979 0.986 0.990 14,104 -12.1% 4.5% 5.0%
520790 Cotton yarn (excl. sewing thread) containing <85% ... 0.718 0.939 0.964 0.970 0.980 0.989 2,374 55.7% 0.2% 4.9%
530390 Jute and other textile bast fibres (excl. flax, true... 0.912 0.966 0.979 0.993 0.998 0.996 3,039 71.2% 2.2% 14.8%
530500 Coconut, abaca (Manila hemp/Musa textilis Nee), ra... 0.995 0.894 0.888 0.935 0.851 0.945 3,674 -19.2% 13.8% 0.9%
560729 Twine (excl. binder/bailer twine), cordage, ropes ... 0.997 0.999 0.995 0.994 0.980 0.989 64,964 36.8% 2.2% 4.9%
630190 Blankets (excl. electric) and travelling rugs other ... 0.975 0.911 0.863 0.780 0.882 0.871 661 -14.9% 8.7% 0.4%
630491 Textile furnishing articles other than bedspreads ... 0.993 0.991 0.992 0.990 0.986 0.986 65,627 2.3% 6.9% 3.8%
630533 Sacks and bags, of a kind used for the packing of go... 0.521 0.664 0.738 0.795 0.906 0.946 21,805 54.7% 5.3% 0.9%
630539 Sacks and bags, of a kind used for the packing of go... 0.939 0.959 0.955 0.976 0.930 0.863 446 -15.8% 6.1% 0.4%
640320 Footwear with outer soles of leather and uppers whic... 0.126 0.582 0.772 0.436 0.285 0.450 217 17.5% 9.7% 0.1%
701090 Carboys, bottles, flasks, jars, pots, phials and oth... 0.492 0.392 0.493 0.806 0.818 0.844 31,779 30.5% 3.5% 0.3%
710310 Precious stones (excl. diamonds) and semi-precious s... 0.997 0.994 0.955 0.993 0.991 0.990 35,278 -2.6% 24.2% 5.5%
710399 Precious stones (excl. diamonds, rubies, saphires ... 0.531 0.301 0.732 0.841 0.848 0.931 2,886 21.2% 5.6% 0.7%
710812 Gold (incl. gold plated with platinum), in unwroug... 0.947 0.942 0.910 0.915 0.886 0.928 779,845 5.2% 12.2% 0.7%
710813 Gold (incl. gold plated with platinum), non-moneta... 0.951 0.924 0.954 0.966 0.965 0.907 540,450 14.1% 31.2% 0.5%
731590 Parts of chains (excl. articulated link chain), of... 0.848 0.902 0.619 0.364 0.061 0.903 251 -14.7% 1.2% 0.5%
740400 Copper waste and scrap 0.397 0.147 0.921 0.222 0.186 0.198 6,234 -5.6% 3.6% 0.0%
840710 Spark-ignition reciprocating/rotary internal combu... 0.777 0.720 0.548 0.422 0.893 0.326 20,276 29.5% 4.5% 0.1%
850421 Liquid dielectric transformers having a power hand... 0.986 0.558 0.296 0.869 0.817 0.518 1,236 -41.5% 2.2% 0.1%
901580 Surveying/hydrographic/oceanographic/hydrological/... 0.311 0.607 0.452 0.332 0.757 0.487 3,453 8.6% 4.3% 0.1%
940370 Furniture of plastics (excl. of 94.01) 0.343 0.278 0.552 0.127 0.482 0.551 8,087 41.9% 6.1% 0.1%
940410 Mattress supports 0.948 0.563 0.972 0.713 0.715 0.688 1,989 -16.4% 3.5% 0.1%
Source: UN Comtrade
A similar type of analysis can be performed by looking into those products where Tanzania has gained CA (Table 46). Among the products where world demand has grown over 2008-13, we identified those where the Tanzania has shown an increase in their CA. We compared the average RCA in the period 2008-10 with respect to the period 2011-13. Many of these products were not traded in 2008. For example, cotton seed oil and sesame seed oil were not exported in 2008 and in 2013 Tanzania has 10.5% and 6% of the world market. Many other products can be identified in the same way. On the other hand, there are other products where although exports have grown and Tanzania seems to present efficiency in production, the value of trade is still very small to constitute interesting products on which to base economic transformation.
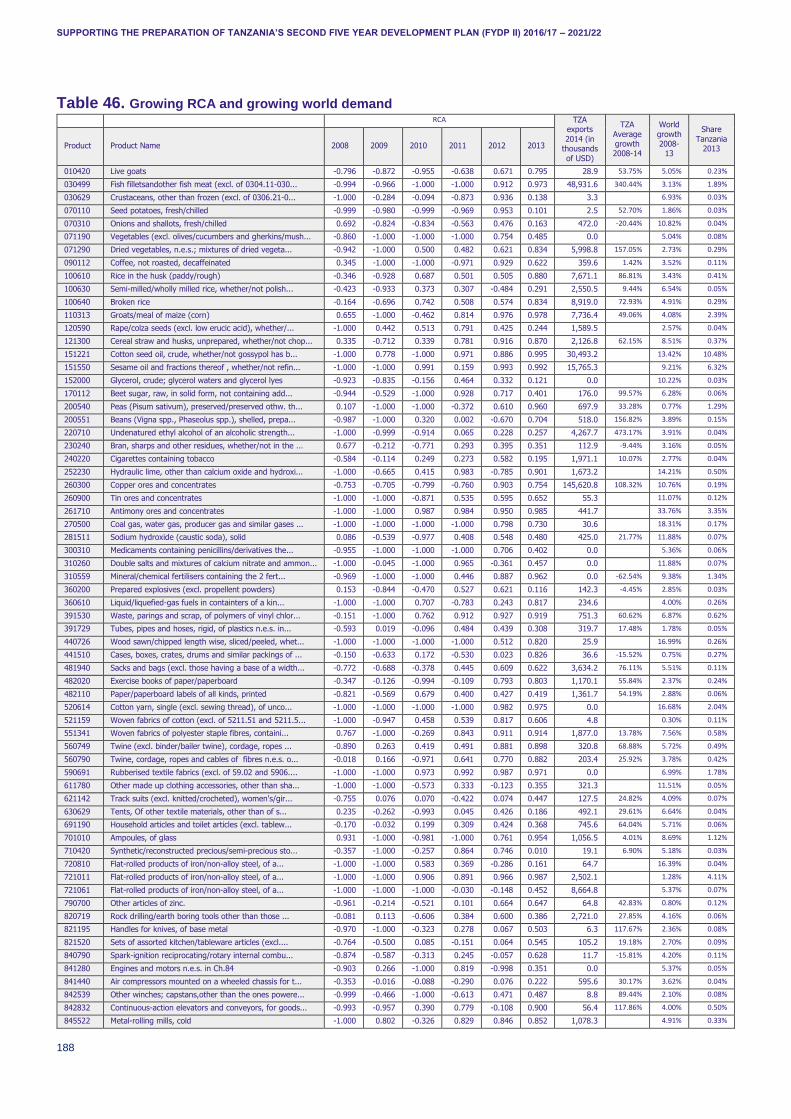
SUPPORTING THE PREPARATION OF TANZANIA’S SECOND FIVE YEAR DEVELOPMENT PLAN (FYDP II) 2016/17 – 2021/22
188
Table 46. Growing RCA and growing world demand RCA TZA
exports
2014 (in thousands
of USD)
TZA
Average growth 2008-14
World
growth 2008-
13
Share
Tanzania 2013 Product Product Name 2008 2009 2010 2011 2012 2013
010420 Live goats -0.796 -0.872 -0.955 -0.638 0.671 0.795 28.9 53.75% 5.05% 0.23%
030499 Fish filletsandother fish meat (excl. of 0304.11-030... -0.994 -0.966 -1.000 -1.000 0.912 0.973 48,931.6 340.44% 3.13% 1.89%
030629 Crustaceans, other than frozen (excl. of 0306.21-0... -1.000 -0.284 -0.094 -0.873 0.936 0.138 3.3 6.93% 0.03%
070110 Seed potatoes, fresh/chilled -0.999 -0.980 -0.999 -0.969 0.953 0.101 2.5 52.70% 1.86% 0.03%
070310 Onions and shallots, fresh/chilled 0.692 -0.824 -0.834 -0.563 0.476 0.163 472.0 -20.44% 10.82% 0.04%
071190 Vegetables (excl. olives/cucumbers and gherkins/mush... -0.860 -1.000 -1.000 -1.000 0.754 0.485 0.0 5.04% 0.08%
071290 Dried vegetables, n.e.s.; mixtures of dried vegeta... -0.942 -1.000 0.500 0.482 0.621 0.834 5,998.8 157.05% 2.73% 0.29%
090112 Coffee, not roasted, decaffeinated 0.345 -1.000 -1.000 -0.971 0.929 0.622 359.6 1.42% 3.52% 0.11%
100610 Rice in the husk (paddy/rough) -0.346 -0.928 0.687 0.501 0.505 0.880 7,671.1 86.81% 3.43% 0.41%
100630 Semi-milled/wholly milled rice, whether/not polish... -0.423 -0.933 0.373 0.307 -0.484 0.291 2,550.5 9.44% 6.54% 0.05%
100640 Broken rice -0.164 -0.696 0.742 0.508 0.574 0.834 8,919.0 72.93% 4.91% 0.29%
110313 Groats/meal of maize (corn) 0.655 -1.000 -0.462 0.814 0.976 0.978 7,736.4 49.06% 4.08% 2.39%
120590 Rape/colza seeds (excl. low erucic acid), whether/... -1.000 0.442 0.513 0.791 0.425 0.244 1,589.5 2.57% 0.04%
121300 Cereal straw and husks, unprepared, whether/not chop... 0.335 -0.712 0.339 0.781 0.916 0.870 2,126.8 62.15% 8.51% 0.37%
151221 Cotton seed oil, crude, whether/not gossypol has b... -1.000 0.778 -1.000 0.971 0.886 0.995 30,493.2 13.42% 10.48%
151550 Sesame oil and fractions thereof , whether/not refin... -1.000 -1.000 0.991 0.159 0.993 0.992 15,765.3 9.21% 6.32%
152000 Glycerol, crude; glycerol waters and glycerol lyes -0.923 -0.835 -0.156 0.464 0.332 0.121 0.0 10.22% 0.03%
170112 Beet sugar, raw, in solid form, not containing add... -0.944 -0.529 -1.000 0.928 0.717 0.401 176.0 99.57% 6.28% 0.06%
200540 Peas (Pisum sativum), preserved/preserved othw. th... 0.107 -1.000 -1.000 -0.372 0.610 0.960 697.9 33.28% 0.77% 1.29%
200551 Beans (Vigna spp., Phaseolus spp.), shelled, prepa... -0.987 -1.000 0.320 0.002 -0.670 0.704 518.0 156.82% 3.89% 0.15%
220710 Undenatured ethyl alcohol of an alcoholic strength... -1.000 -0.999 -0.914 0.065 0.228 0.257 4,267.7 473.17% 3.91% 0.04%
230240 Bran, sharps and other residues, whether/not in the ... 0.677 -0.212 -0.771 0.293 0.395 0.351 112.9 -9.44% 3.16% 0.05%
240220 Cigarettes containing tobacco -0.584 -0.114 0.249 0.273 0.582 0.195 1,971.1 10.07% 2.77% 0.04%
252230 Hydraulic lime, other than calcium oxide and hydroxi... -1.000 -0.665 0.415 0.983 -0.785 0.901 1,673.2 14.21% 0.50%
260300 Copper ores and concentrates -0.753 -0.705 -0.799 -0.760 0.903 0.754 145,620.8 108.32% 10.76% 0.19%
260900 Tin ores and concentrates -1.000 -1.000 -0.871 0.535 0.595 0.652 55.3 11.07% 0.12%
261710 Antimony ores and concentrates -1.000 -1.000 0.987 0.984 0.950 0.985 441.7 33.76% 3.35%
270500 Coal gas, water gas, producer gas and similar gases ... -1.000 -1.000 -1.000 -1.000 0.798 0.730 30.6 18.31% 0.17%
281511 Sodium hydroxide (caustic soda), solid 0.086 -0.539 -0.977 0.408 0.548 0.480 425.0 21.77% 11.88% 0.07%
300310 Medicaments containing penicillins/derivatives the... -0.955 -1.000 -1.000 -1.000 0.706 0.402 0.0 5.36% 0.06%
310260 Double salts and mixtures of calcium nitrate and ammon... -1.000 -0.045 -1.000 0.965 -0.361 0.457 0.0 11.88% 0.07%
310559 Mineral/chemical fertilisers containing the 2 fert... -0.969 -1.000 -1.000 0.446 0.887 0.962 0.0 -62.54% 9.38% 1.34%
360200 Prepared explosives (excl. propellent powders) 0.153 -0.844 -0.470 0.527 0.621 0.116 142.3 -4.45% 2.85% 0.03%
360610 Liquid/liquefied-gas fuels in containters of a kin... -1.000 -1.000 0.707 -0.783 0.243 0.817 234.6 4.00% 0.26%
391530 Waste, parings and scrap, of polymers of vinyl chlor... -0.151 -1.000 0.762 0.912 0.927 0.919 751.3 60.62% 6.87% 0.62%
391729 Tubes, pipes and hoses, rigid, of plastics n.e.s. in... -0.593 0.019 -0.096 0.484 0.439 0.308 319.7 17.48% 1.78% 0.05%
440726 Wood sawn/chipped length wise, sliced/peeled, whet... -1.000 -1.000 -1.000 -1.000 0.512 0.820 25.9 16.99% 0.26%
441510 Cases, boxes, crates, drums and similar packings of ... -0.150 -0.633 0.172 -0.530 0.023 0.826 36.6 -15.52% 0.75% 0.27%
481940 Sacks and bags (excl. those having a base of a width... -0.772 -0.688 -0.378 0.445 0.609 0.622 3,634.2 76.11% 5.51% 0.11%
482020 Exercise books of paper/paperboard -0.347 -0.126 -0.994 -0.109 0.793 0.803 1,170.1 55.84% 2.37% 0.24%
482110 Paper/paperboard labels of all kinds, printed -0.821 -0.569 0.679 0.400 0.427 0.419 1,361.7 54.19% 2.88% 0.06%
520614 Cotton yarn, single (excl. sewing thread), of unco... -1.000 -1.000 -1.000 -1.000 0.982 0.975 0.0 16.68% 2.04%
521159 Woven fabrics of cotton (excl. of 5211.51 and 5211.5... -1.000 -0.947 0.458 0.539 0.817 0.606 4.8 0.30% 0.11%
551341 Woven fabrics of polyester staple fibres, containi... 0.767 -1.000 -0.269 0.843 0.911 0.914 1,877.0 13.78% 7.56% 0.58%
560749 Twine (excl. binder/bailer twine), cordage, ropes ... -0.890 0.263 0.419 0.491 0.881 0.898 320.8 68.88% 5.72% 0.49%
560790 Twine, cordage, ropes and cables of fibres n.e.s. o... -0.018 0.166 -0.971 0.641 0.770 0.882 203.4 25.92% 3.78% 0.42%
590691 Rubberised textile fabrics (excl. of 59.02 and 5906.... -1.000 -1.000 0.973 0.992 0.987 0.971 0.0 6.99% 1.78%
611780 Other made up clothing accessories, other than sha... -1.000 -1.000 -0.573 0.333 -0.123 0.355 321.3 11.51% 0.05%
621142 Track suits (excl. knitted/crocheted), women's/gir... -0.755 0.076 0.070 -0.422 0.074 0.447 127.5 24.82% 4.09% 0.07%
630629 Tents, Of other textile materials, other than of s... 0.235 -0.262 -0.993 0.045 0.426 0.186 492.1 29.61% 6.64% 0.04%
691190 Household articles and toilet articles (excl. tablew... -0.170 -0.032 0.199 0.309 0.424 0.368 745.6 64.04% 5.71% 0.06%
701010 Ampoules, of glass 0.931 -1.000 -0.981 -1.000 0.761 0.954 1,056.5 4.01% 8.69% 1.12%
710420 Synthetic/reconstructed precious/semi-precious sto... -0.357 -1.000 -0.257 0.864 0.746 0.010 19.1 6.90% 5.18% 0.03%
720810 Flat-rolled products of iron/non-alloy steel, of a... -1.000 -1.000 0.583 0.369 -0.286 0.161 64.7 16.39% 0.04%
721011 Flat-rolled products of iron/non-alloy steel, of a... -1.000 -1.000 0.906 0.891 0.966 0.987 2,502.1 1.28% 4.11%
721061 Flat-rolled products of iron/non-alloy steel, of a... -1.000 -1.000 -1.000 -0.030 -0.148 0.452 8,664.8 5.37% 0.07%
790700 Other articles of zinc. -0.961 -0.214 -0.521 0.101 0.664 0.647 64.8 42.83% 0.80% 0.12%
820719 Rock drilling/earth boring tools other than those ... -0.081 0.113 -0.606 0.384 0.600 0.386 2,721.0 27.85% 4.16% 0.06%
821195 Handles for knives, of base metal -0.970 -1.000 -0.323 0.278 0.067 0.503 6.3 117.67% 2.36% 0.08%
821520 Sets of assorted kitchen/tableware articles (excl.... -0.764 -0.500 0.085 -0.151 0.064 0.545 105.2 19.18% 2.70% 0.09%
840790 Spark-ignition reciprocating/rotary internal combu... -0.874 -0.587 -0.313 0.245 -0.057 0.628 11.7 -15.81% 4.20% 0.11%
841280 Engines and motors n.e.s. in Ch.84 -0.903 0.266 -1.000 0.819 -0.998 0.351 0.0 5.37% 0.05%
841440 Air compressors mounted on a wheeled chassis for t... -0.353 -0.016 -0.088 -0.290 0.076 0.222 595.6 30.17% 3.62% 0.04%
842539 Other winches; capstans,other than the ones powere... -0.999 -0.466 -1.000 -0.613 0.471 0.487 8.8 89.44% 2.10% 0.08%
842832 Continuous-action elevators and conveyors, for goods... -0.993 -0.957 0.390 0.779 -0.108 0.900 56.4 117.86% 4.00% 0.50%
845522 Metal-rolling mills, cold -1.000 0.802 -0.326 0.829 0.846 0.852 1,078.3 4.91% 0.33%
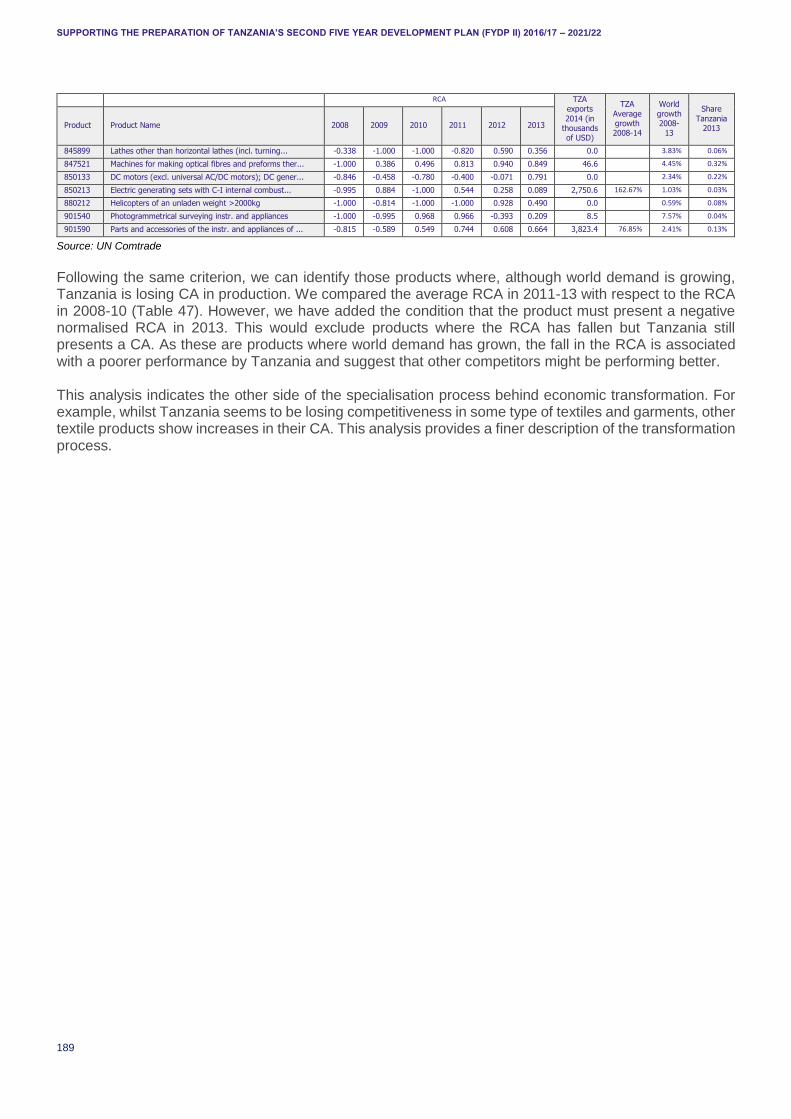
SUPPORTING THE PREPARATION OF TANZANIA’S SECOND FIVE YEAR DEVELOPMENT PLAN (FYDP II) 2016/17 – 2021/22
189
RCA TZA exports
2014 (in thousands of USD)
TZA
Average growth 2008-14
World
growth 2008-
13
Share
Tanzania 2013 Product Product Name 2008 2009 2010 2011 2012 2013
845899 Lathes other than horizontal lathes (incl. turning... -0.338 -1.000 -1.000 -0.820 0.590 0.356 0.0 3.83% 0.06%
847521 Machines for making optical fibres and preforms ther... -1.000 0.386 0.496 0.813 0.940 0.849 46.6 4.45% 0.32%
850133 DC motors (excl. universal AC/DC motors); DC gener... -0.846 -0.458 -0.780 -0.400 -0.071 0.791 0.0 2.34% 0.22%
850213 Electric generating sets with C-I internal combust... -0.995 0.884 -1.000 0.544 0.258 0.089 2,750.6 162.67% 1.03% 0.03%
880212 Helicopters of an unladen weight >2000kg -1.000 -0.814 -1.000 -1.000 0.928 0.490 0.0 0.59% 0.08%
901540 Photogrammetrical surveying instr. and appliances -1.000 -0.995 0.968 0.966 -0.393 0.209 8.5 7.57% 0.04%
901590 Parts and accessories of the instr. and appliances of ... -0.815 -0.589 0.549 0.744 0.608 0.664 3,823.4 76.85% 2.41% 0.13%
Source: UN Comtrade
Following the same criterion, we can identify those products where, although world demand is growing, Tanzania is losing CA in production. We compared the average RCA in 2011-13 with respect to the RCA in 2008-10 (Table 47). However, we have added the condition that the product must present a negative normalised RCA in 2013. This would exclude products where the RCA has fallen but Tanzania still presents a CA. As these are products where world demand has grown, the fall in the RCA is associated with a poorer performance by Tanzania and suggest that other competitors might be performing better. This analysis indicates the other side of the specialisation process behind economic transformation. For example, whilst Tanzania seems to be losing competitiveness in some type of textiles and garments, other textile products show increases in their CA. This analysis provides a finer description of the transformation process.
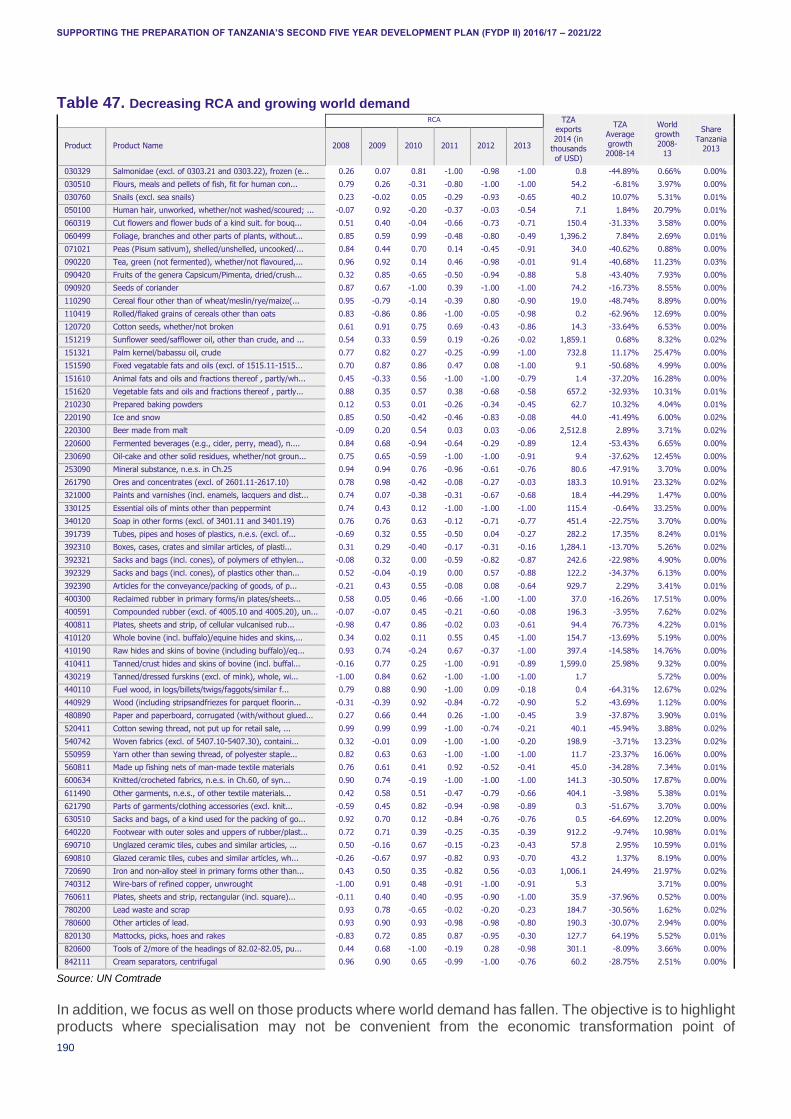
SUPPORTING THE PREPARATION OF TANZANIA’S SECOND FIVE YEAR DEVELOPMENT PLAN (FYDP II) 2016/17 – 2021/22
190
Table 47. Decreasing RCA and growing world demand RCA TZA
exports
2014 (in thousands
of USD)
TZA
Average growth 2008-14
World
growth 2008-
13
Share
Tanzania 2013 Product Product Name 2008 2009 2010 2011 2012 2013
030329 Salmonidae (excl. of 0303.21 and 0303.22), frozen (e... 0.26 0.07 0.81 -1.00 -0.98 -1.00 0.8 -44.89% 0.66% 0.00%
030510 Flours, meals and pellets of fish, fit for human con... 0.79 0.26 -0.31 -0.80 -1.00 -1.00 54.2 -6.81% 3.97% 0.00%
030760 Snails (excl. sea snails) 0.23 -0.02 0.05 -0.29 -0.93 -0.65 40.2 10.07% 5.31% 0.01%
050100 Human hair, unworked, whether/not washed/scoured; ... -0.07 0.92 -0.20 -0.37 -0.03 -0.54 7.1 1.84% 20.79% 0.01%
060319 Cut flowers and flower buds of a kind suit. for bouq... 0.51 0.40 -0.04 -0.66 -0.73 -0.71 150.4 -31.33% 3.58% 0.00%
060499 Foliage, branches and other parts of plants, without... 0.85 0.59 0.99 -0.48 -0.80 -0.49 1,396.2 7.84% 2.69% 0.01%
071021 Peas (Pisum sativum), shelled/unshelled, uncooked/... 0.84 0.44 0.70 0.14 -0.45 -0.91 34.0 -40.62% 0.88% 0.00%
090220 Tea, green (not fermented), whether/not flavoured,... 0.96 0.92 0.14 0.46 -0.98 -0.01 91.4 -40.68% 11.23% 0.03%
090420 Fruits of the genera Capsicum/Pimenta, dried/crush... 0.32 0.85 -0.65 -0.50 -0.94 -0.88 5.8 -43.40% 7.93% 0.00%
090920 Seeds of coriander 0.87 0.67 -1.00 0.39 -1.00 -1.00 74.2 -16.73% 8.55% 0.00%
110290 Cereal flour other than of wheat/meslin/rye/maize(... 0.95 -0.79 -0.14 -0.39 0.80 -0.90 19.0 -48.74% 8.89% 0.00%
110419 Rolled/flaked grains of cereals other than oats 0.83 -0.86 0.86 -1.00 -0.05 -0.98 0.2 -62.96% 12.69% 0.00%
120720 Cotton seeds, whether/not broken 0.61 0.91 0.75 0.69 -0.43 -0.86 14.3 -33.64% 6.53% 0.00%
151219 Sunflower seed/safflower oil, other than crude, and ... 0.54 0.33 0.59 0.19 -0.26 -0.02 1,859.1 0.68% 8.32% 0.02%
151321 Palm kernel/babassu oil, crude 0.77 0.82 0.27 -0.25 -0.99 -1.00 732.8 11.17% 25.47% 0.00%
151590 Fixed vegatable fats and oils (excl. of 1515.11-1515... 0.70 0.87 0.86 0.47 0.08 -1.00 9.1 -50.68% 4.99% 0.00%
151610 Animal fats and oils and fractions thereof , partly/wh... 0.45 -0.33 0.56 -1.00 -1.00 -0.79 1.4 -37.20% 16.28% 0.00%
151620 Vegetable fats and oils and fractions thereof , partly... 0.88 0.35 0.57 0.38 -0.68 -0.58 657.2 -32.93% 10.31% 0.01%
210230 Prepared baking powders 0.12 0.53 0.01 -0.26 -0.34 -0.45 62.7 10.32% 4.04% 0.01%
220190 Ice and snow 0.85 0.50 -0.42 -0.46 -0.83 -0.08 44.0 -41.49% 6.00% 0.02%
220300 Beer made from malt -0.09 0.20 0.54 0.03 0.03 -0.06 2,512.8 2.89% 3.71% 0.02%
220600 Fermented beverages (e.g., cider, perry, mead), n.... 0.84 0.68 -0.94 -0.64 -0.29 -0.89 12.4 -53.43% 6.65% 0.00%
230690 Oil-cake and other solid residues, whether/not groun... 0.75 0.65 -0.59 -1.00 -1.00 -0.91 9.4 -37.62% 12.45% 0.00%
253090 Mineral substance, n.e.s. in Ch.25 0.94 0.94 0.76 -0.96 -0.61 -0.76 80.6 -47.91% 3.70% 0.00%
261790 Ores and concentrates (excl. of 2601.11-2617.10) 0.78 0.98 -0.42 -0.08 -0.27 -0.03 183.3 10.91% 23.32% 0.02%
321000 Paints and varnishes (incl. enamels, lacquers and dist... 0.74 0.07 -0.38 -0.31 -0.67 -0.68 18.4 -44.29% 1.47% 0.00%
330125 Essential oils of mints other than peppermint 0.74 0.43 0.12 -1.00 -1.00 -1.00 115.4 -0.64% 33.25% 0.00%
340120 Soap in other forms (excl. of 3401.11 and 3401.19) 0.76 0.76 0.63 -0.12 -0.71 -0.77 451.4 -22.75% 3.70% 0.00%
391739 Tubes, pipes and hoses of plastics, n.e.s. (excl. of... -0.69 0.32 0.55 -0.50 0.04 -0.27 282.2 17.35% 8.24% 0.01%
392310 Boxes, cases, crates and similar articles, of plasti... 0.31 0.29 -0.40 -0.17 -0.31 -0.16 1,284.1 -13.70% 5.26% 0.02%
392321 Sacks and bags (incl. cones), of polymers of ethylen... -0.08 0.32 0.00 -0.59 -0.82 -0.87 242.6 -22.98% 4.90% 0.00%
392329 Sacks and bags (incl. cones), of plastics other than... 0.52 -0.04 -0.19 0.00 0.57 -0.88 122.2 -34.37% 6.13% 0.00%
392390 Articles for the conveyance/packing of goods, of p... -0.21 0.43 0.55 -0.08 0.08 -0.64 929.7 2.29% 3.41% 0.01%
400300 Reclaimed rubber in primary forms/in plates/sheets... 0.58 0.05 0.46 -0.66 -1.00 -1.00 37.0 -16.26% 17.51% 0.00%
400591 Compounded rubber (excl. of 4005.10 and 4005.20), un... -0.07 -0.07 0.45 -0.21 -0.60 -0.08 196.3 -3.95% 7.62% 0.02%
400811 Plates, sheets and strip, of cellular vulcanised rub... -0.98 0.47 0.86 -0.02 0.03 -0.61 94.4 76.73% 4.22% 0.01%
410120 Whole bovine (incl. buffalo)/equine hides and skins,... 0.34 0.02 0.11 0.55 0.45 -1.00 154.7 -13.69% 5.19% 0.00%
410190 Raw hides and skins of bovine (including buffalo)/eq... 0.93 0.74 -0.24 0.67 -0.37 -1.00 397.4 -14.58% 14.76% 0.00%
410411 Tanned/crust hides and skins of bovine (incl. buffal... -0.16 0.77 0.25 -1.00 -0.91 -0.89 1,599.0 25.98% 9.32% 0.00%
430219 Tanned/dressed furskins (excl. of mink), whole, wi... -1.00 0.84 0.62 -1.00 -1.00 -1.00 1.7 5.72% 0.00%
440110 Fuel wood, in logs/billets/twigs/faggots/similar f... 0.79 0.88 0.90 -1.00 0.09 -0.18 0.4 -64.31% 12.67% 0.02%
440929 Wood (including stripsandfriezes for parquet floorin... -0.31 -0.39 0.92 -0.84 -0.72 -0.90 5.2 -43.69% 1.12% 0.00%
480890 Paper and paperboard, corrugated (with/without glued... 0.27 0.66 0.44 0.26 -1.00 -0.45 3.9 -37.87% 3.90% 0.01%
520411 Cotton sewing thread, not put up for retail sale, ... 0.99 0.99 0.99 -1.00 -0.74 -0.21 40.1 -45.94% 3.88% 0.02%
540742 Woven fabrics (excl. of 5407.10-5407.30), containi... 0.32 -0.01 0.09 -1.00 -1.00 -0.20 198.9 -3.71% 13.23% 0.02%
550959 Yarn other than sewing thread, of polyester staple... 0.82 0.63 0.63 -1.00 -1.00 -1.00 11.7 -23.37% 16.06% 0.00%
560811 Made up fishing nets of man-made textile materials 0.76 0.61 0.41 0.92 -0.52 -0.41 45.0 -34.28% 7.34% 0.01%
600634 Knitted/crocheted fabrics, n.e.s. in Ch.60, of syn... 0.90 0.74 -0.19 -1.00 -1.00 -1.00 141.3 -30.50% 17.87% 0.00%
611490 Other garments, n.e.s., of other textile materials... 0.42 0.58 0.51 -0.47 -0.79 -0.66 404.1 -3.98% 5.38% 0.01%
621790 Parts of garments/clothing accessories (excl. knit... -0.59 0.45 0.82 -0.94 -0.98 -0.89 0.3 -51.67% 3.70% 0.00%
630510 Sacks and bags, of a kind used for the packing of go... 0.92 0.70 0.12 -0.84 -0.76 -0.76 0.5 -64.69% 12.20% 0.00%
640220 Footwear with outer soles and uppers of rubber/plast... 0.72 0.71 0.39 -0.25 -0.35 -0.39 912.2 -9.74% 10.98% 0.01%
690710 Unglazed ceramic tiles, cubes and similar articles, ... 0.50 -0.16 0.67 -0.15 -0.23 -0.43 57.8 2.95% 10.59% 0.01%
690810 Glazed ceramic tiles, cubes and similar articles, wh... -0.26 -0.67 0.97 -0.82 0.93 -0.70 43.2 1.37% 8.19% 0.00%
720690 Iron and non-alloy steel in primary forms other than... 0.43 0.50 0.35 -0.82 0.56 -0.03 1,006.1 24.49% 21.97% 0.02%
740312 Wire-bars of refined copper, unwrought -1.00 0.91 0.48 -0.91 -1.00 -0.91 5.3 3.71% 0.00%
760611 Plates, sheets and strip, rectangular (incl. square)... -0.11 0.40 0.40 -0.95 -0.90 -1.00 35.9 -37.96% 0.52% 0.00%
780200 Lead waste and scrap 0.93 0.78 -0.65 -0.02 -0.20 -0.23 184.7 -30.56% 1.62% 0.02%
780600 Other articles of lead. 0.93 0.90 0.93 -0.98 -0.98 -0.80 190.3 -30.07% 2.94% 0.00%
820130 Mattocks, picks, hoes and rakes -0.83 0.72 0.85 0.87 -0.95 -0.30 127.7 64.19% 5.52% 0.01%
820600 Tools of 2/more of the headings of 82.02-82.05, pu... 0.44 0.68 -1.00 -0.19 0.28 -0.98 301.1 -8.09% 3.66% 0.00%
842111 Cream separators, centrifugal 0.96 0.90 0.65 -0.99 -1.00 -0.76 60.2 -28.75% 2.51% 0.00%
Source: UN Comtrade
In addition, we focus as well on those products where world demand has fallen. The objective is to highlight products where specialisation may not be convenient from the economic transformation point of
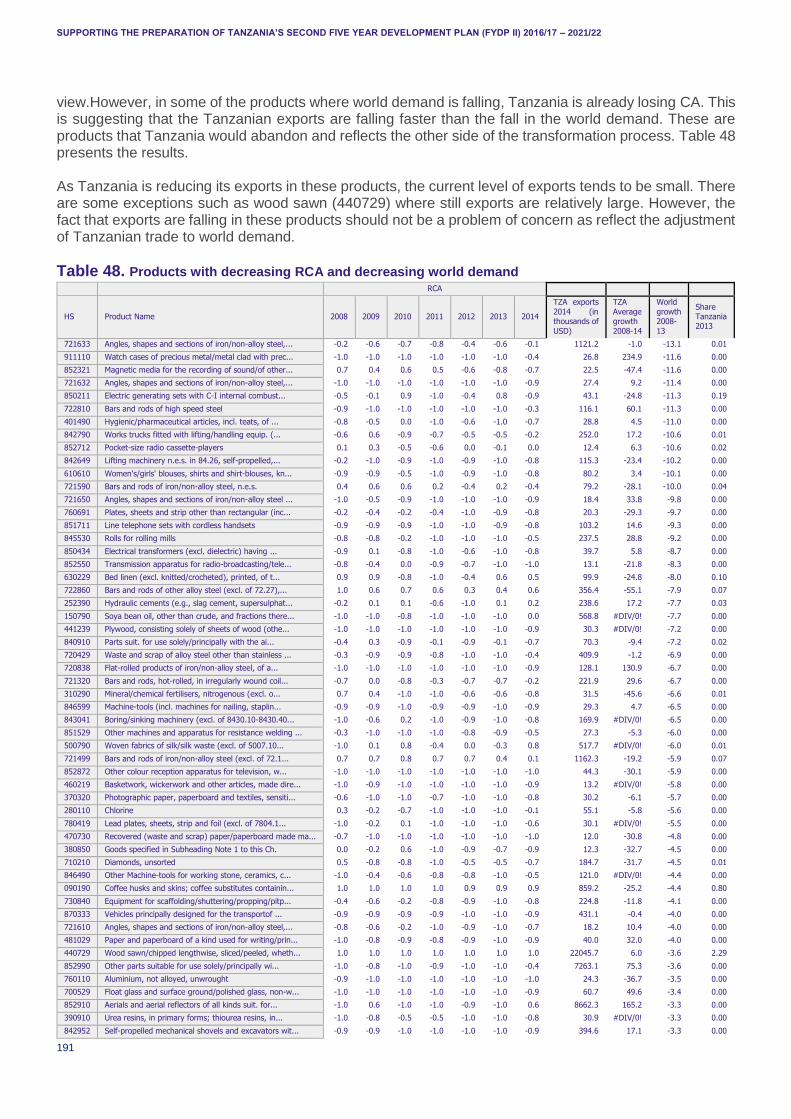
SUPPORTING THE PREPARATION OF TANZANIA’S SECOND FIVE YEAR DEVELOPMENT PLAN (FYDP II) 2016/17 – 2021/22
191
view.However, in some of the products where world demand is falling, Tanzania is already losing CA. This is suggesting that the Tanzanian exports are falling faster than the fall in the world demand. These are products that Tanzania would abandon and reflects the other side of the transformation process. Table 48 presents the results. As Tanzania is reducing its exports in these products, the current level of exports tends to be small. There are some exceptions such as wood sawn (440729) where still exports are relatively large. However, the fact that exports are falling in these products should not be a problem of concern as reflect the adjustment of Tanzanian trade to world demand.
Table 48. Products with decreasing RCA and decreasing world demand RCA
HS Product Name 2008 2009 2010 2011 2012 2013 2014
TZA exports
2014 (in thousands of
USD)
TZA
Average growth
2008-14
World
growth 2008-
13
Share Tanzania 2013
721633 Angles, shapes and sections of iron/non-alloy steel,... -0.2 -0.6 -0.7 -0.8 -0.4 -0.6 -0.1 1121.2 -1.0 -13.1 0.01
911110 Watch cases of precious metal/metal clad with prec... -1.0 -1.0 -1.0 -1.0 -1.0 -1.0 -0.4 26.8 234.9 -11.6 0.00
852321 Magnetic media for the recording of sound/of other... 0.7 0.4 0.6 0.5 -0.6 -0.8 -0.7 22.5 -47.4 -11.6 0.00
721632 Angles, shapes and sections of iron/non-alloy steel,... -1.0 -1.0 -1.0 -1.0 -1.0 -1.0 -0.9 27.4 9.2 -11.4 0.00
850211 Electric generating sets with C-I internal combust... -0.5 -0.1 0.9 -1.0 -0.4 0.8 -0.9 43.1 -24.8 -11.3 0.19
722810 Bars and rods of high speed steel -0.9 -1.0 -1.0 -1.0 -1.0 -1.0 -0.3 116.1 60.1 -11.3 0.00
401490 Hygienic/pharmaceutical articles, incl. teats, of ... -0.8 -0.5 0.0 -1.0 -0.6 -1.0 -0.7 28.8 4.5 -11.0 0.00
842790 Works trucks fitted with lifting/handling equip. (... -0.6 0.6 -0.9 -0.7 -0.5 -0.5 -0.2 252.0 17.2 -10.6 0.01
852712 Pocket-size radio cassette-players 0.1 0.3 -0.5 -0.6 0.0 -0.1 0.0 12.4 6.3 -10.6 0.02
842649 Lifting machinery n.e.s. in 84.26, self-propelled,... -0.2 -1.0 -0.9 -1.0 -0.9 -1.0 -0.8 115.3 -23.4 -10.2 0.00
610610 Women's/girls' blouses, shirts and shirt-blouses, kn... -0.9 -0.9 -0.5 -1.0 -0.9 -1.0 -0.8 80.2 3.4 -10.1 0.00
721590 Bars and rods of iron/non-alloy steel, n.e.s. 0.4 0.6 0.6 0.2 -0.4 0.2 -0.4 79.2 -28.1 -10.0 0.04
721650 Angles, shapes and sections of iron/non-alloy steel ... -1.0 -0.5 -0.9 -1.0 -1.0 -1.0 -0.9 18.4 33.8 -9.8 0.00
760691 Plates, sheets and strip other than rectangular (inc... -0.2 -0.4 -0.2 -0.4 -1.0 -0.9 -0.8 20.3 -29.3 -9.7 0.00
851711 Line telephone sets with cordless handsets -0.9 -0.9 -0.9 -1.0 -1.0 -0.9 -0.8 103.2 14.6 -9.3 0.00
845530 Rolls for rolling mills -0.8 -0.8 -0.2 -1.0 -1.0 -1.0 -0.5 237.5 28.8 -9.2 0.00
850434 Electrical transformers (excl. dielectric) having ... -0.9 0.1 -0.8 -1.0 -0.6 -1.0 -0.8 39.7 5.8 -8.7 0.00
852550 Transmission apparatus for radio-broadcasting/tele... -0.8 -0.4 0.0 -0.9 -0.7 -1.0 -1.0 13.1 -21.8 -8.3 0.00
630229 Bed linen (excl. knitted/crocheted), printed, of t... 0.9 0.9 -0.8 -1.0 -0.4 0.6 0.5 99.9 -24.8 -8.0 0.10
722860 Bars and rods of other alloy steel (excl. of 72.27),... 1.0 0.6 0.7 0.6 0.3 0.4 0.6 356.4 -55.1 -7.9 0.07
252390 Hydraulic cements (e.g., slag cement, supersulphat... -0.2 0.1 0.1 -0.6 -1.0 0.1 0.2 238.6 17.2 -7.7 0.03
150790 Soya bean oil, other than crude, and fractions there... -1.0 -1.0 -0.8 -1.0 -1.0 -1.0 0.0 568.8 #DIV/0! -7.7 0.00
441239 Plywood, consisting solely of sheets of wood (othe... -1.0 -1.0 -1.0 -1.0 -1.0 -1.0 -0.9 30.3 #DIV/0! -7.2 0.00
840910 Parts suit. for use solely/principally with the ai... -0.4 0.3 -0.9 -0.1 -0.9 -0.1 -0.7 70.3 -9.4 -7.2 0.02
720429 Waste and scrap of alloy steel other than stainless ... -0.3 -0.9 -0.9 -0.8 -1.0 -1.0 -0.4 409.9 -1.2 -6.9 0.00
720838 Flat-rolled products of iron/non-alloy steel, of a... -1.0 -1.0 -1.0 -1.0 -1.0 -1.0 -0.9 128.1 130.9 -6.7 0.00
721320 Bars and rods, hot-rolled, in irregularly wound coil... -0.7 0.0 -0.8 -0.3 -0.7 -0.7 -0.2 221.9 29.6 -6.7 0.00
310290 Mineral/chemical fertilisers, nitrogenous (excl. o... 0.7 0.4 -1.0 -1.0 -0.6 -0.6 -0.8 31.5 -45.6 -6.6 0.01
846599 Machine-tools (incl. machines for nailing, staplin... -0.9 -0.9 -1.0 -0.9 -0.9 -1.0 -0.9 29.3 4.7 -6.5 0.00
843041 Boring/sinking machinery (excl. of 8430.10-8430.40... -1.0 -0.6 0.2 -1.0 -0.9 -1.0 -0.8 169.9 #DIV/0! -6.5 0.00
851529 Other machines and apparatus for resistance welding ... -0.3 -1.0 -1.0 -1.0 -0.8 -0.9 -0.5 27.3 -5.3 -6.0 0.00
500790 Woven fabrics of silk/silk waste (excl. of 5007.10... -1.0 0.1 0.8 -0.4 0.0 -0.3 0.8 517.7 #DIV/0! -6.0 0.01
721499 Bars and rods of iron/non-alloy steel (excl. of 72.1... 0.7 0.7 0.8 0.7 0.7 0.4 0.1 1162.3 -19.2 -5.9 0.07
852872 Other colour reception apparatus for television, w... -1.0 -1.0 -1.0 -1.0 -1.0 -1.0 -1.0 44.3 -30.1 -5.9 0.00
460219 Basketwork, wickerwork and other articles, made dire... -1.0 -0.9 -1.0 -1.0 -1.0 -1.0 -0.9 13.2 #DIV/0! -5.8 0.00
370320 Photographic paper, paperboard and textiles, sensiti... -0.6 -1.0 -1.0 -0.7 -1.0 -1.0 -0.8 30.2 -6.1 -5.7 0.00
280110 Chlorine 0.3 -0.2 -0.7 -1.0 -1.0 -1.0 -0.1 55.1 -5.8 -5.6 0.00
780419 Lead plates, sheets, strip and foil (excl. of 7804.1... -1.0 -0.2 0.1 -1.0 -1.0 -1.0 -0.6 30.1 #DIV/0! -5.5 0.00
470730 Recovered (waste and scrap) paper/paperboard made ma... -0.7 -1.0 -1.0 -1.0 -1.0 -1.0 -1.0 12.0 -30.8 -4.8 0.00
380850 Goods specified in Subheading Note 1 to this Ch. 0.0 -0.2 0.6 -1.0 -0.9 -0.7 -0.9 12.3 -32.7 -4.5 0.00
710210 Diamonds, unsorted 0.5 -0.8 -0.8 -1.0 -0.5 -0.5 -0.7 184.7 -31.7 -4.5 0.01
846490 Other Machine-tools for working stone, ceramics, c... -1.0 -0.4 -0.6 -0.8 -0.8 -1.0 -0.5 121.0 #DIV/0! -4.4 0.00
090190 Coffee husks and skins; coffee substitutes containin... 1.0 1.0 1.0 1.0 0.9 0.9 0.9 859.2 -25.2 -4.4 0.80
730840 Equipment for scaffolding/shuttering/propping/pitp... -0.4 -0.6 -0.2 -0.8 -0.9 -1.0 -0.8 224.8 -11.8 -4.1 0.00
870333 Vehicles principally designed for the transportof ... -0.9 -0.9 -0.9 -0.9 -1.0 -1.0 -0.9 431.1 -0.4 -4.0 0.00
721610 Angles, shapes and sections of iron/non-alloy steel,... -0.8 -0.6 -0.2 -1.0 -0.9 -1.0 -0.7 18.2 10.4 -4.0 0.00
481029 Paper and paperboard of a kind used for writing/prin... -1.0 -0.8 -0.9 -0.8 -0.9 -1.0 -0.9 40.0 32.0 -4.0 0.00
440729 Wood sawn/chipped lengthwise, sliced/peeled, wheth... 1.0 1.0 1.0 1.0 1.0 1.0 1.0 22045.7 6.0 -3.6 2.29
852990 Other parts suitable for use solely/principally wi... -1.0 -0.8 -1.0 -0.9 -1.0 -1.0 -0.4 7263.1 75.3 -3.6 0.00
760110 Aluminium, not alloyed, unwrought -0.9 -1.0 -1.0 -1.0 -1.0 -1.0 -1.0 24.3 -36.7 -3.5 0.00
700529 Float glass and surface ground/polished glass, non-w... -1.0 -1.0 -1.0 -1.0 -1.0 -1.0 -0.9 60.7 49.6 -3.4 0.00
852910 Aerials and aerial reflectors of all kinds suit. for... -1.0 0.6 -1.0 -1.0 -0.9 -1.0 0.6 8662.3 165.2 -3.3 0.00
390910 Urea resins, in primary forms; thiourea resins, in... -1.0 -0.8 -0.5 -0.5 -1.0 -1.0 -0.8 30.9 #DIV/0! -3.3 0.00
842952 Self-propelled mechanical shovels and excavators wit... -0.9 -0.9 -1.0 -1.0 -1.0 -1.0 -0.9 394.6 17.1 -3.3 0.00
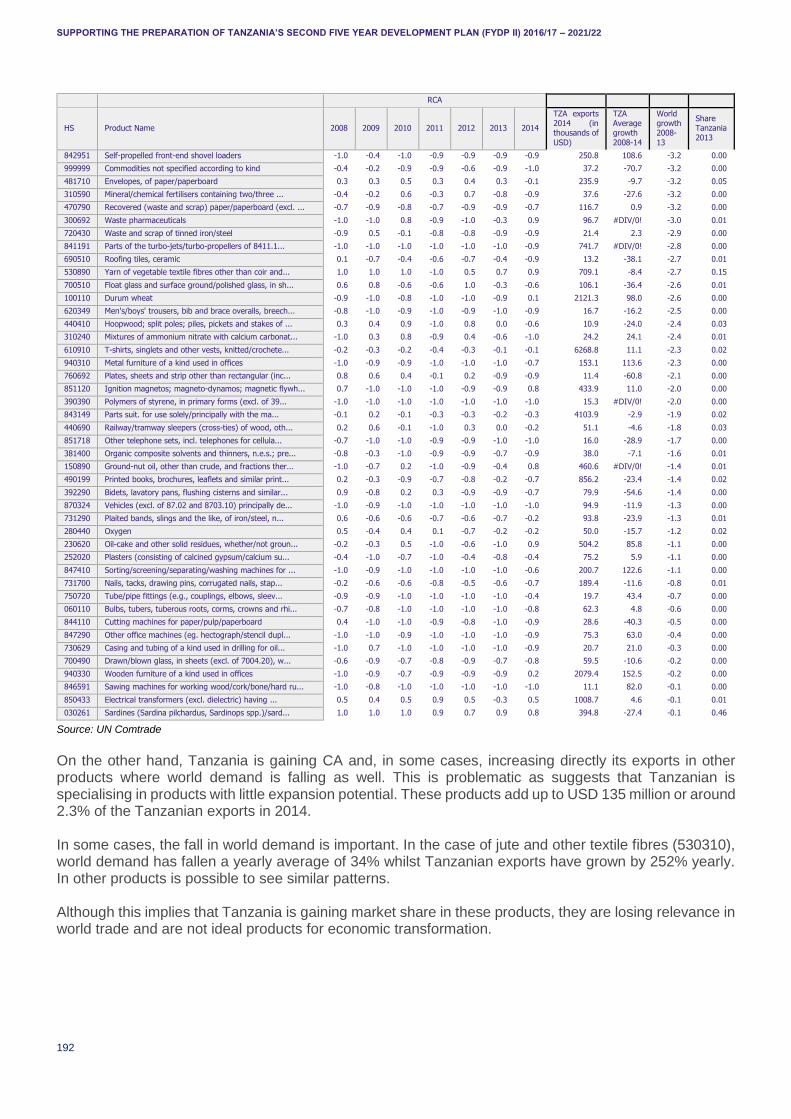
SUPPORTING THE PREPARATION OF TANZANIA’S SECOND FIVE YEAR DEVELOPMENT PLAN (FYDP II) 2016/17 – 2021/22
192
RCA
HS Product Name 2008 2009 2010 2011 2012 2013 2014
TZA exports 2014 (in thousands of
USD)
TZA Average growth
2008-14
World growth 2008-
13
Share Tanzania 2013
842951 Self-propelled front-end shovel loaders -1.0 -0.4 -1.0 -0.9 -0.9 -0.9 -0.9 250.8 108.6 -3.2 0.00
999999 Commodities not specified according to kind -0.4 -0.2 -0.9 -0.9 -0.6 -0.9 -1.0 37.2 -70.7 -3.2 0.00
481710 Envelopes, of paper/paperboard 0.3 0.3 0.5 0.3 0.4 0.3 -0.1 235.9 -9.7 -3.2 0.05
310590 Mineral/chemical fertilisers containing two/three ... -0.4 -0.2 0.6 -0.3 0.7 -0.8 -0.9 37.6 -27.6 -3.2 0.00
470790 Recovered (waste and scrap) paper/paperboard (excl. ... -0.7 -0.9 -0.8 -0.7 -0.9 -0.9 -0.7 116.7 0.9 -3.2 0.00
300692 Waste pharmaceuticals -1.0 -1.0 0.8 -0.9 -1.0 -0.3 0.9 96.7 #DIV/0! -3.0 0.01
720430 Waste and scrap of tinned iron/steel -0.9 0.5 -0.1 -0.8 -0.8 -0.9 -0.9 21.4 2.3 -2.9 0.00
841191 Parts of the turbo-jets/turbo-propellers of 8411.1... -1.0 -1.0 -1.0 -1.0 -1.0 -1.0 -0.9 741.7 #DIV/0! -2.8 0.00
690510 Roofing tiles, ceramic 0.1 -0.7 -0.4 -0.6 -0.7 -0.4 -0.9 13.2 -38.1 -2.7 0.01
530890 Yarn of vegetable textile fibres other than coir and... 1.0 1.0 1.0 -1.0 0.5 0.7 0.9 709.1 -8.4 -2.7 0.15
700510 Float glass and surface ground/polished glass, in sh... 0.6 0.8 -0.6 -0.6 1.0 -0.3 -0.6 106.1 -36.4 -2.6 0.01
100110 Durum wheat -0.9 -1.0 -0.8 -1.0 -1.0 -0.9 0.1 2121.3 98.0 -2.6 0.00
620349 Men's/boys' trousers, bib and brace overalls, breech... -0.8 -1.0 -0.9 -1.0 -0.9 -1.0 -0.9 16.7 -16.2 -2.5 0.00
440410 Hoopwood; split poles; piles, pickets and stakes of ... 0.3 0.4 0.9 -1.0 0.8 0.0 -0.6 10.9 -24.0 -2.4 0.03
310240 Mixtures of ammonium nitrate with calcium carbonat... -1.0 0.3 0.8 -0.9 0.4 -0.6 -1.0 24.2 24.1 -2.4 0.01
610910 T-shirts, singlets and other vests, knitted/crochete... -0.2 -0.3 -0.2 -0.4 -0.3 -0.1 -0.1 6268.8 11.1 -2.3 0.02
940310 Metal furniture of a kind used in offices -1.0 -0.9 -0.9 -1.0 -1.0 -1.0 -0.7 153.1 113.6 -2.3 0.00
760692 Plates, sheets and strip other than rectangular (inc... 0.8 0.6 0.4 -0.1 0.2 -0.9 -0.9 11.4 -60.8 -2.1 0.00
851120 Ignition magnetos; magneto-dynamos; magnetic flywh... 0.7 -1.0 -1.0 -1.0 -0.9 -0.9 0.8 433.9 11.0 -2.0 0.00
390390 Polymers of styrene, in primary forms (excl. of 39... -1.0 -1.0 -1.0 -1.0 -1.0 -1.0 -1.0 15.3 #DIV/0! -2.0 0.00
843149 Parts suit. for use solely/principally with the ma... -0.1 0.2 -0.1 -0.3 -0.3 -0.2 -0.3 4103.9 -2.9 -1.9 0.02
440690 Railway/tramway sleepers (cross-ties) of wood, oth... 0.2 0.6 -0.1 -1.0 0.3 0.0 -0.2 51.1 -4.6 -1.8 0.03
851718 Other telephone sets, incl. telephones for cellula... -0.7 -1.0 -1.0 -0.9 -0.9 -1.0 -1.0 16.0 -28.9 -1.7 0.00
381400 Organic composite solvents and thinners, n.e.s.; pre... -0.8 -0.3 -1.0 -0.9 -0.9 -0.7 -0.9 38.0 -7.1 -1.6 0.01
150890 Ground-nut oil, other than crude, and fractions ther... -1.0 -0.7 0.2 -1.0 -0.9 -0.4 0.8 460.6 #DIV/0! -1.4 0.01
490199 Printed books, brochures, leaflets and similar print... 0.2 -0.3 -0.9 -0.7 -0.8 -0.2 -0.7 856.2 -23.4 -1.4 0.02
392290 Bidets, lavatory pans, flushing cisterns and similar... 0.9 -0.8 0.2 0.3 -0.9 -0.9 -0.7 79.9 -54.6 -1.4 0.00
870324 Vehicles (excl. of 87.02 and 8703.10) principally de... -1.0 -0.9 -1.0 -1.0 -1.0 -1.0 -1.0 94.9 -11.9 -1.3 0.00
731290 Plaited bands, slings and the like, of iron/steel, n... 0.6 -0.6 -0.6 -0.7 -0.6 -0.7 -0.2 93.8 -23.9 -1.3 0.01
280440 Oxygen 0.5 -0.4 0.4 0.1 -0.7 -0.2 -0.2 50.0 -15.7 -1.2 0.02
230620 Oil-cake and other solid residues, whether/not groun... -0.2 -0.3 0.5 -1.0 -0.6 -1.0 0.9 504.2 85.8 -1.1 0.00
252020 Plasters (consisting of calcined gypsum/calcium su... -0.4 -1.0 -0.7 -1.0 -0.4 -0.8 -0.4 75.2 5.9 -1.1 0.00
847410 Sorting/screening/separating/washing machines for ... -1.0 -0.9 -1.0 -1.0 -1.0 -1.0 -0.6 200.7 122.6 -1.1 0.00
731700 Nails, tacks, drawing pins, corrugated nails, stap... -0.2 -0.6 -0.6 -0.8 -0.5 -0.6 -0.7 189.4 -11.6 -0.8 0.01
750720 Tube/pipe fittings (e.g., couplings, elbows, sleev... -0.9 -0.9 -1.0 -1.0 -1.0 -1.0 -0.4 19.7 43.4 -0.7 0.00
060110 Bulbs, tubers, tuberous roots, corms, crowns and rhi... -0.7 -0.8 -1.0 -1.0 -1.0 -1.0 -0.8 62.3 4.8 -0.6 0.00
844110 Cutting machines for paper/pulp/paperboard 0.4 -1.0 -1.0 -0.9 -0.8 -1.0 -0.9 28.6 -40.3 -0.5 0.00
847290 Other office machines (eg. hectograph/stencil dupl... -1.0 -1.0 -0.9 -1.0 -1.0 -1.0 -0.9 75.3 63.0 -0.4 0.00
730629 Casing and tubing of a kind used in drilling for oil... -1.0 0.7 -1.0 -1.0 -1.0 -1.0 -0.9 20.7 21.0 -0.3 0.00
700490 Drawn/blown glass, in sheets (excl. of 7004.20), w... -0.6 -0.9 -0.7 -0.8 -0.9 -0.7 -0.8 59.5 -10.6 -0.2 0.00
940330 Wooden furniture of a kind used in offices -1.0 -0.9 -0.7 -0.9 -0.9 -0.9 0.2 2079.4 152.5 -0.2 0.00
846591 Sawing machines for working wood/cork/bone/hard ru... -1.0 -0.8 -1.0 -1.0 -1.0 -1.0 -1.0 11.1 82.0 -0.1 0.00
850433 Electrical transformers (excl. dielectric) having ... 0.5 0.4 0.5 0.9 0.5 -0.3 0.5 1008.7 4.6 -0.1 0.01
030261 Sardines (Sardina pilchardus, Sardinops spp.)/sard... 1.0 1.0 1.0 0.9 0.7 0.9 0.8 394.8 -27.4 -0.1 0.46
Source: UN Comtrade
On the other hand, Tanzania is gaining CA and, in some cases, increasing directly its exports in other products where world demand is falling as well. This is problematic as suggests that Tanzanian is specialising in products with little expansion potential. These products add up to USD 135 million or around 2.3% of the Tanzanian exports in 2014. In some cases, the fall in world demand is important. In the case of jute and other textile fibres (530310), world demand has fallen a yearly average of 34% whilst Tanzanian exports have grown by 252% yearly. In other products is possible to see similar patterns. Although this implies that Tanzania is gaining market share in these products, they are losing relevance in world trade and are not ideal products for economic transformation.
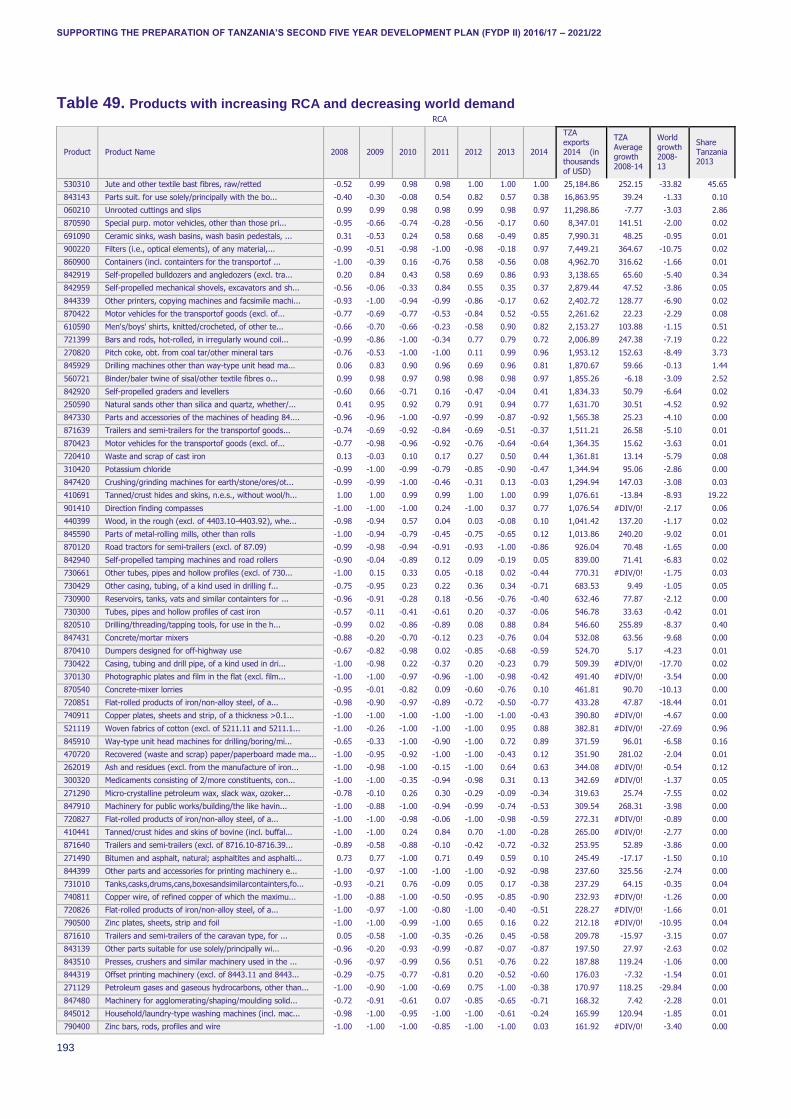
SUPPORTING THE PREPARATION OF TANZANIA’S SECOND FIVE YEAR DEVELOPMENT PLAN (FYDP II) 2016/17 – 2021/22
193
Table 49. Products with increasing RCA and decreasing world demand RCA
Product Product Name 2008 2009 2010 2011 2012 2013 2014
TZA
exports 2014 (in thousands
of USD)
TZA
Average growth
2008-14
World
growth 2008-
13
Share Tanzania 2013
530310 Jute and other textile bast fibres, raw/retted -0.52 0.99 0.98 0.98 1.00 1.00 1.00 25,184.86 252.15 -33.82 45.65
843143 Parts suit. for use solely/principally with the bo... -0.40 -0.30 -0.08 0.54 0.82 0.57 0.38 16,863.95 39.24 -1.33 0.10
060210 Unrooted cuttings and slips 0.99 0.99 0.98 0.98 0.99 0.98 0.97 11,298.86 -7.77 -3.03 2.86
870590 Special purp. motor vehicles, other than those pri... -0.95 -0.66 -0.74 -0.28 -0.56 -0.17 0.60 8,347.01 141.51 -2.00 0.02
691090 Ceramic sinks, wash basins, wash basin pedestals, ... 0.31 -0.53 0.24 0.58 0.68 -0.49 0.85 7,990.31 48.25 -0.95 0.01
900220 Filters (i.e., optical elements), of any material,... -0.99 -0.51 -0.98 -1.00 -0.98 -0.18 0.97 7,449.21 364.67 -10.75 0.02
860900 Containers (incl. containters for the transportof ... -1.00 -0.39 0.16 -0.76 0.58 -0.56 0.08 4,962.70 316.62 -1.66 0.01
842919 Self-propelled bulldozers and angledozers (excl. tra... 0.20 0.84 0.43 0.58 0.69 0.86 0.93 3,138.65 65.60 -5.40 0.34
842959 Self-propelled mechanical shovels, excavators and sh... -0.56 -0.06 -0.33 0.84 0.55 0.35 0.37 2,879.44 47.52 -3.86 0.05
844339 Other printers, copying machines and facsimile machi... -0.93 -1.00 -0.94 -0.99 -0.86 -0.17 0.62 2,402.72 128.77 -6.90 0.02
870422 Motor vehicles for the transportof goods (excl. of... -0.77 -0.69 -0.77 -0.53 -0.84 0.52 -0.55 2,261.62 22.23 -2.29 0.08
610590 Men's/boys' shirts, knitted/crocheted, of other te... -0.66 -0.70 -0.66 -0.23 -0.58 0.90 0.82 2,153.27 103.88 -1.15 0.51
721399 Bars and rods, hot-rolled, in irregularly wound coil... -0.99 -0.86 -1.00 -0.34 0.77 0.79 0.72 2,006.89 247.38 -7.19 0.22
270820 Pitch coke, obt. from coal tar/other mineral tars -0.76 -0.53 -1.00 -1.00 0.11 0.99 0.96 1,953.12 152.63 -8.49 3.73
845929 Drilling machines other than way-type unit head ma... 0.06 0.83 0.90 0.96 0.69 0.96 0.81 1,870.67 59.66 -0.13 1.44
560721 Binder/baler twine of sisal/other textile fibres o... 0.99 0.98 0.97 0.98 0.98 0.98 0.97 1,855.26 -6.18 -3.09 2.52
842920 Self-propelled graders and levellers -0.60 0.66 -0.71 0.16 -0.47 -0.04 0.41 1,834.33 50.79 -6.64 0.02
250590 Natural sands other than silica and quartz, whether/... 0.41 0.95 0.92 0.79 0.91 0.94 0.77 1,631.70 30.51 -4.52 0.92
847330 Parts and accessories of the machines of heading 84.... -0.96 -0.96 -1.00 -0.97 -0.99 -0.87 -0.92 1,565.38 25.23 -4.10 0.00
871639 Trailers and semi-trailers for the transportof goods... -0.74 -0.69 -0.92 -0.84 -0.69 -0.51 -0.37 1,511.21 26.58 -5.10 0.01
870423 Motor vehicles for the transportof goods (excl. of... -0.77 -0.98 -0.96 -0.92 -0.76 -0.64 -0.64 1,364.35 15.62 -3.63 0.01
720410 Waste and scrap of cast iron 0.13 -0.03 0.10 0.17 0.27 0.50 0.44 1,361.81 13.14 -5.79 0.08
310420 Potassium chloride -0.99 -1.00 -0.99 -0.79 -0.85 -0.90 -0.47 1,344.94 95.06 -2.86 0.00
847420 Crushing/grinding machines for earth/stone/ores/ot... -0.99 -0.99 -1.00 -0.46 -0.31 0.13 -0.03 1,294.94 147.03 -3.08 0.03
410691 Tanned/crust hides and skins, n.e.s., without wool/h... 1.00 1.00 0.99 0.99 1.00 1.00 0.99 1,076.61 -13.84 -8.93 19.22
901410 Direction finding compasses -1.00 -1.00 -1.00 0.24 -1.00 0.37 0.77 1,076.54 #DIV/0! -2.17 0.06
440399 Wood, in the rough (excl. of 4403.10-4403.92), whe... -0.98 -0.94 0.57 0.04 0.03 -0.08 0.10 1,041.42 137.20 -1.17 0.02
845590 Parts of metal-rolling mills, other than rolls -1.00 -0.94 -0.79 -0.45 -0.75 -0.65 0.12 1,013.86 240.20 -9.02 0.01
870120 Road tractors for semi-trailers (excl. of 87.09) -0.99 -0.98 -0.94 -0.91 -0.93 -1.00 -0.86 926.04 70.48 -1.65 0.00
842940 Self-propelled tamping machines and road rollers -0.90 -0.04 -0.89 0.12 0.09 -0.19 0.05 839.00 71.41 -6.83 0.02
730661 Other tubes, pipes and hollow profiles (excl. of 730... -1.00 0.15 0.33 0.05 -0.18 0.02 -0.44 770.31 #DIV/0! -1.75 0.03
730429 Other casing, tubing, of a kind used in drilling f... -0.75 -0.95 0.23 0.22 0.36 0.34 -0.71 683.53 9.49 -1.05 0.05
730900 Reservoirs, tanks, vats and similar containters for ... -0.96 -0.91 -0.28 0.18 -0.56 -0.76 -0.40 632.46 77.87 -2.12 0.00
730300 Tubes, pipes and hollow profiles of cast iron -0.57 -0.11 -0.41 -0.61 0.20 -0.37 -0.06 546.78 33.63 -0.42 0.01
820510 Drilling/threading/tapping tools, for use in the h... -0.99 0.02 -0.86 -0.89 0.08 0.88 0.84 546.60 255.89 -8.37 0.40
847431 Concrete/mortar mixers -0.88 -0.20 -0.70 -0.12 0.23 -0.76 0.04 532.08 63.56 -9.68 0.00
870410 Dumpers designed for off-highway use -0.67 -0.82 -0.98 0.02 -0.85 -0.68 -0.59 524.70 5.17 -4.23 0.01
730422 Casing, tubing and drill pipe, of a kind used in dri... -1.00 -0.98 0.22 -0.37 0.20 -0.23 0.79 509.39 #DIV/0! -17.70 0.02
370130 Photographic plates and film in the flat (excl. film... -1.00 -1.00 -0.97 -0.96 -1.00 -0.98 -0.42 491.40 #DIV/0! -3.54 0.00
870540 Concrete-mixer lorries -0.95 -0.01 -0.82 0.09 -0.60 -0.76 0.10 461.81 90.70 -10.13 0.00
720851 Flat-rolled products of iron/non-alloy steel, of a... -0.98 -0.90 -0.97 -0.89 -0.72 -0.50 -0.77 433.28 47.87 -18.44 0.01
740911 Copper plates, sheets and strip, of a thickness >0.1... -1.00 -1.00 -1.00 -1.00 -1.00 -1.00 -0.43 390.80 #DIV/0! -4.67 0.00
521119 Woven fabrics of cotton (excl. of 5211.11 and 5211.1... -1.00 -0.26 -1.00 -1.00 -1.00 0.95 0.88 382.81 #DIV/0! -27.69 0.96
845910 Way-type unit head machines for drilling/boring/mi... -0.65 -0.33 -1.00 -0.90 -1.00 0.72 0.89 371.59 96.01 -6.58 0.16
470720 Recovered (waste and scrap) paper/paperboard made ma... -1.00 -0.95 -0.92 -1.00 -1.00 -0.43 0.12 351.90 281.02 -2.04 0.01
262019 Ash and residues (excl. from the manufacture of iron... -1.00 -0.98 -1.00 -0.15 -1.00 0.64 0.63 344.08 #DIV/0! -0.54 0.12
300320 Medicaments consisting of 2/more constituents, con... -1.00 -1.00 -0.35 -0.94 -0.98 0.31 0.13 342.69 #DIV/0! -1.37 0.05
271290 Micro-crystalline petroleum wax, slack wax, ozoker... -0.78 -0.10 0.26 0.30 -0.29 -0.09 -0.34 319.63 25.74 -7.55 0.02
847910 Machinery for public works/building/the like havin... -1.00 -0.88 -1.00 -0.94 -0.99 -0.74 -0.53 309.54 268.31 -3.98 0.00
720827 Flat-rolled products of iron/non-alloy steel, of a... -1.00 -1.00 -0.98 -0.06 -1.00 -0.98 -0.59 272.31 #DIV/0! -0.89 0.00
410441 Tanned/crust hides and skins of bovine (incl. buffal... -1.00 -1.00 0.24 0.84 0.70 -1.00 -0.28 265.00 #DIV/0! -2.77 0.00
871640 Trailers and semi-trailers (excl. of 8716.10-8716.39... -0.89 -0.58 -0.88 -0.10 -0.42 -0.72 -0.32 253.95 52.89 -3.86 0.00
271490 Bitumen and asphalt, natural; asphaltites and asphalti... 0.73 0.77 -1.00 0.71 0.49 0.59 0.10 245.49 -17.17 -1.50 0.10
844399 Other parts and accessories for printing machinery e... -1.00 -0.97 -1.00 -1.00 -1.00 -0.92 -0.98 237.60 325.56 -2.74 0.00
731010 Tanks,casks,drums,cans,boxesandsimilarcontainters,fo... -0.93 -0.21 0.76 -0.09 0.05 0.17 -0.38 237.29 64.15 -0.35 0.04
740811 Copper wire, of refined copper of which the maximu... -1.00 -0.88 -1.00 -0.50 -0.95 -0.85 -0.90 232.93 #DIV/0! -1.26 0.00
720826 Flat-rolled products of iron/non-alloy steel, of a... -1.00 -0.97 -1.00 -0.80 -1.00 -0.40 -0.51 228.27 #DIV/0! -1.66 0.01
790500 Zinc plates, sheets, strip and foil -1.00 -1.00 -0.99 -1.00 0.65 0.16 0.22 212.18 #DIV/0! -10.95 0.04
871610 Trailers and semi-trailers of the caravan type, for ... 0.05 -0.58 -1.00 -0.35 -0.26 0.45 -0.58 209.78 -15.97 -3.15 0.07
843139 Other parts suitable for use solely/principally wi... -0.96 -0.20 -0.93 -0.99 -0.87 -0.07 -0.87 197.50 27.97 -2.63 0.02
843510 Presses, crushers and similar machinery used in the ... -0.96 -0.97 -0.99 0.56 0.51 -0.76 0.22 187.88 119.24 -1.06 0.00
844319 Offset printing machinery (excl. of 8443.11 and 8443... -0.29 -0.75 -0.77 -0.81 0.20 -0.52 -0.60 176.03 -7.32 -1.54 0.01
271129 Petroleum gases and gaseous hydrocarbons, other than... -1.00 -0.90 -1.00 -0.69 0.75 -1.00 -0.38 170.97 118.25 -29.84 0.00
847480 Machinery for agglomerating/shaping/moulding solid... -0.72 -0.91 -0.61 0.07 -0.85 -0.65 -0.71 168.32 7.42 -2.28 0.01
845012 Household/laundry-type washing machines (incl. mac... -0.98 -1.00 -0.95 -1.00 -1.00 -0.61 -0.24 165.99 120.94 -1.85 0.01
790400 Zinc bars, rods, profiles and wire -1.00 -1.00 -1.00 -0.85 -1.00 -1.00 0.03 161.92 #DIV/0! -3.40 0.00
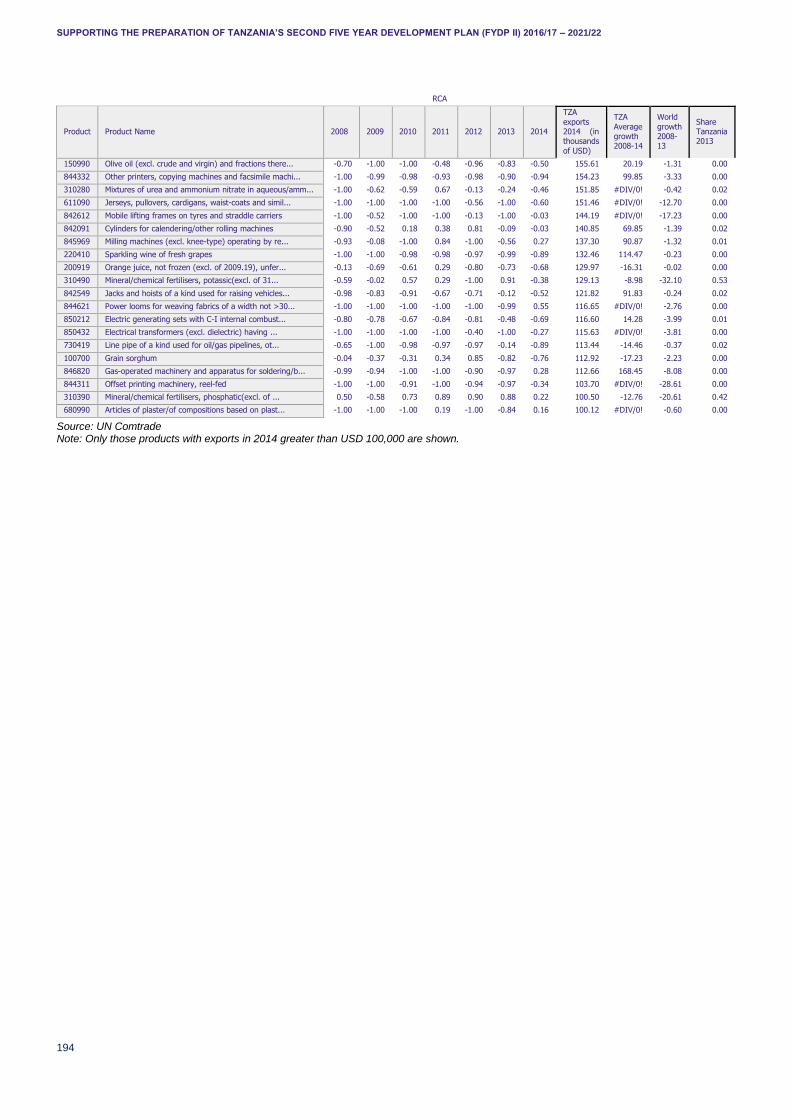
SUPPORTING THE PREPARATION OF TANZANIA’S SECOND FIVE YEAR DEVELOPMENT PLAN (FYDP II) 2016/17 – 2021/22
194
RCA
Product Product Name 2008 2009 2010 2011 2012 2013 2014
TZA
exports 2014 (in thousands
of USD)
TZA
Average growth 2008-14
World
growth 2008-13
Share Tanzania 2013
150990 Olive oil (excl. crude and virgin) and fractions there... -0.70 -1.00 -1.00 -0.48 -0.96 -0.83 -0.50 155.61 20.19 -1.31 0.00
844332 Other printers, copying machines and facsimile machi... -1.00 -0.99 -0.98 -0.93 -0.98 -0.90 -0.94 154.23 99.85 -3.33 0.00
310280 Mixtures of urea and ammonium nitrate in aqueous/amm... -1.00 -0.62 -0.59 0.67 -0.13 -0.24 -0.46 151.85 #DIV/0! -0.42 0.02
611090 Jerseys, pullovers, cardigans, waist-coats and simil... -1.00 -1.00 -1.00 -1.00 -0.56 -1.00 -0.60 151.46 #DIV/0! -12.70 0.00
842612 Mobile lifting frames on tyres and straddle carriers -1.00 -0.52 -1.00 -1.00 -0.13 -1.00 -0.03 144.19 #DIV/0! -17.23 0.00
842091 Cylinders for calendering/other rolling machines -0.90 -0.52 0.18 0.38 0.81 -0.09 -0.03 140.85 69.85 -1.39 0.02
845969 Milling machines (excl. knee-type) operating by re... -0.93 -0.08 -1.00 0.84 -1.00 -0.56 0.27 137.30 90.87 -1.32 0.01
220410 Sparkling wine of fresh grapes -1.00 -1.00 -0.98 -0.98 -0.97 -0.99 -0.89 132.46 114.47 -0.23 0.00
200919 Orange juice, not frozen (excl. of 2009.19), unfer... -0.13 -0.69 -0.61 0.29 -0.80 -0.73 -0.68 129.97 -16.31 -0.02 0.00
310490 Mineral/chemical fertilisers, potassic(excl. of 31... -0.59 -0.02 0.57 0.29 -1.00 0.91 -0.38 129.13 -8.98 -32.10 0.53
842549 Jacks and hoists of a kind used for raising vehicles... -0.98 -0.83 -0.91 -0.67 -0.71 -0.12 -0.52 121.82 91.83 -0.24 0.02
844621 Power looms for weaving fabrics of a width not >30... -1.00 -1.00 -1.00 -1.00 -1.00 -0.99 0.55 116.65 #DIV/0! -2.76 0.00
850212 Electric generating sets with C-I internal combust... -0.80 -0.78 -0.67 -0.84 -0.81 -0.48 -0.69 116.60 14.28 -3.99 0.01
850432 Electrical transformers (excl. dielectric) having ... -1.00 -1.00 -1.00 -1.00 -0.40 -1.00 -0.27 115.63 #DIV/0! -3.81 0.00
730419 Line pipe of a kind used for oil/gas pipelines, ot... -0.65 -1.00 -0.98 -0.97 -0.97 -0.14 -0.89 113.44 -14.46 -0.37 0.02
100700 Grain sorghum -0.04 -0.37 -0.31 0.34 0.85 -0.82 -0.76 112.92 -17.23 -2.23 0.00
846820 Gas-operated machinery and apparatus for soldering/b... -0.99 -0.94 -1.00 -1.00 -0.90 -0.97 0.28 112.66 168.45 -8.08 0.00
844311 Offset printing machinery, reel-fed -1.00 -1.00 -0.91 -1.00 -0.94 -0.97 -0.34 103.70 #DIV/0! -28.61 0.00
310390 Mineral/chemical fertilisers, phosphatic(excl. of ... 0.50 -0.58 0.73 0.89 0.90 0.88 0.22 100.50 -12.76 -20.61 0.42
680990 Articles of plaster/of compositions based on plast... -1.00 -1.00 -1.00 0.19 -1.00 -0.84 0.16 100.12 #DIV/0! -0.60 0.00
Source: UN Comtrade Note: Only those products with exports in 2014 greater than USD 100,000 are shown.
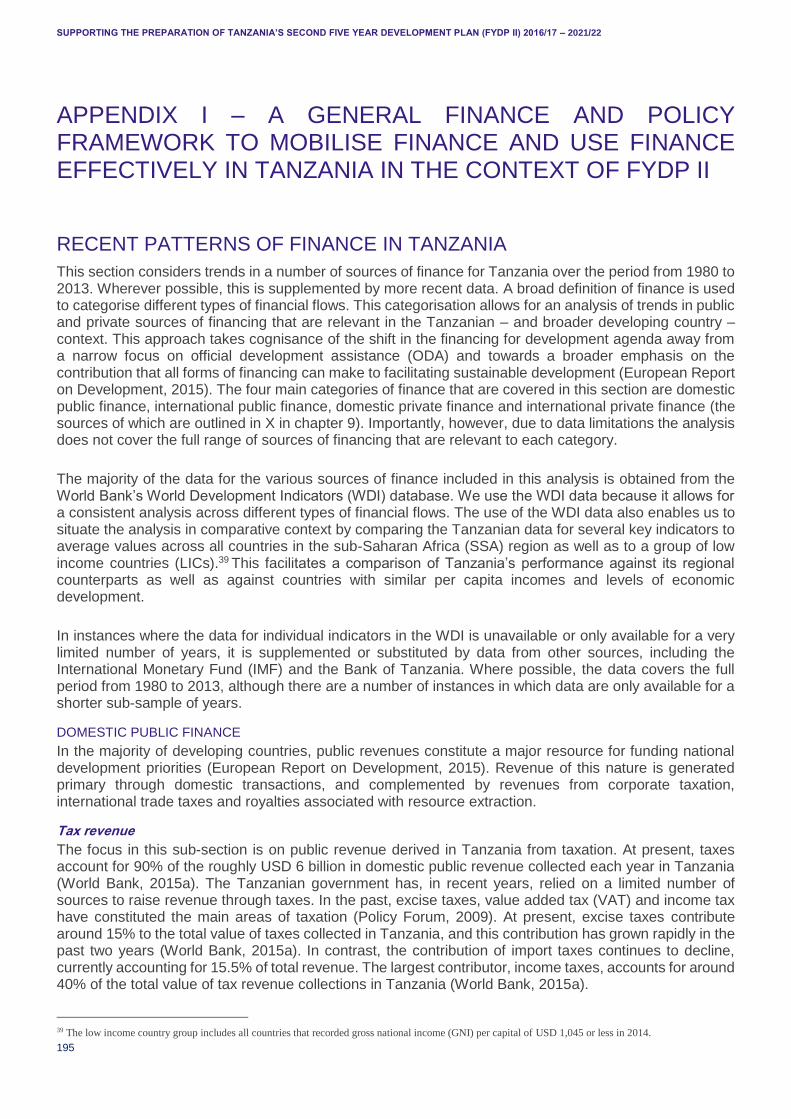
SUPPORTING THE PREPARATION OF TANZANIA’S SECOND FIVE YEAR DEVELOPMENT PLAN (FYDP II) 2016/17 – 2021/22
195
APPENDIX I – A GENERAL FINANCE AND POLICY FRAMEWORK TO MOBILISE FINANCE AND USE FINANCE EFFECTIVELY IN TANZANIA IN THE CONTEXT OF FYDP II
RECENT PATTERNS OF FINANCE IN TANZANIA
This section considers trends in a number of sources of finance for Tanzania over the period from 1980 to 2013. Wherever possible, this is supplemented by more recent data. A broad definition of finance is used to categorise different types of financial flows. This categorisation allows for an analysis of trends in public and private sources of financing that are relevant in the Tanzanian – and broader developing country – context. This approach takes cognisance of the shift in the financing for development agenda away from a narrow focus on official development assistance (ODA) and towards a broader emphasis on the contribution that all forms of financing can make to facilitating sustainable development (European Report on Development, 2015). The four main categories of finance that are covered in this section are domestic public finance, international public finance, domestic private finance and international private finance (the sources of which are outlined in X in chapter 9). Importantly, however, due to data limitations the analysis does not cover the full range of sources of financing that are relevant to each category.
The majority of the data for the various sources of finance included in this analysis is obtained from the World Bank’s World Development Indicators (WDI) database. We use the WDI data because it allows for a consistent analysis across different types of financial flows. The use of the WDI data also enables us to situate the analysis in comparative context by comparing the Tanzanian data for several key indicators to average values across all countries in the sub-Saharan Africa (SSA) region as well as to a group of low income countries (LICs).39 This facilitates a comparison of Tanzania’s performance against its regional counterparts as well as against countries with similar per capita incomes and levels of economic development.
In instances where the data for individual indicators in the WDI is unavailable or only available for a very limited number of years, it is supplemented or substituted by data from other sources, including the International Monetary Fund (IMF) and the Bank of Tanzania. Where possible, the data covers the full period from 1980 to 2013, although there are a number of instances in which data are only available for a shorter sub-sample of years.
DOMESTIC PUBLIC FINANCE
In the majority of developing countries, public revenues constitute a major resource for funding national development priorities (European Report on Development, 2015). Revenue of this nature is generated primary through domestic transactions, and complemented by revenues from corporate taxation, international trade taxes and royalties associated with resource extraction.
Tax revenue
The focus in this sub-section is on public revenue derived in Tanzania from taxation. At present, taxes account for 90% of the roughly USD 6 billion in domestic public revenue collected each year in Tanzania (World Bank, 2015a). The Tanzanian government has, in recent years, relied on a limited number of sources to raise revenue through taxes. In the past, excise taxes, value added tax (VAT) and income tax have constituted the main areas of taxation (Policy Forum, 2009). At present, excise taxes contribute around 15% to the total value of taxes collected in Tanzania, and this contribution has grown rapidly in the past two years (World Bank, 2015a). In contrast, the contribution of import taxes continues to decline, currently accounting for 15.5% of total revenue. The largest contributor, income taxes, accounts for around 40% of the total value of tax revenue collections in Tanzania (World Bank, 2015a).
39 The low income country group includes all countries that recorded gross national income (GNI) per capital of USD 1,045 or less in 2014.
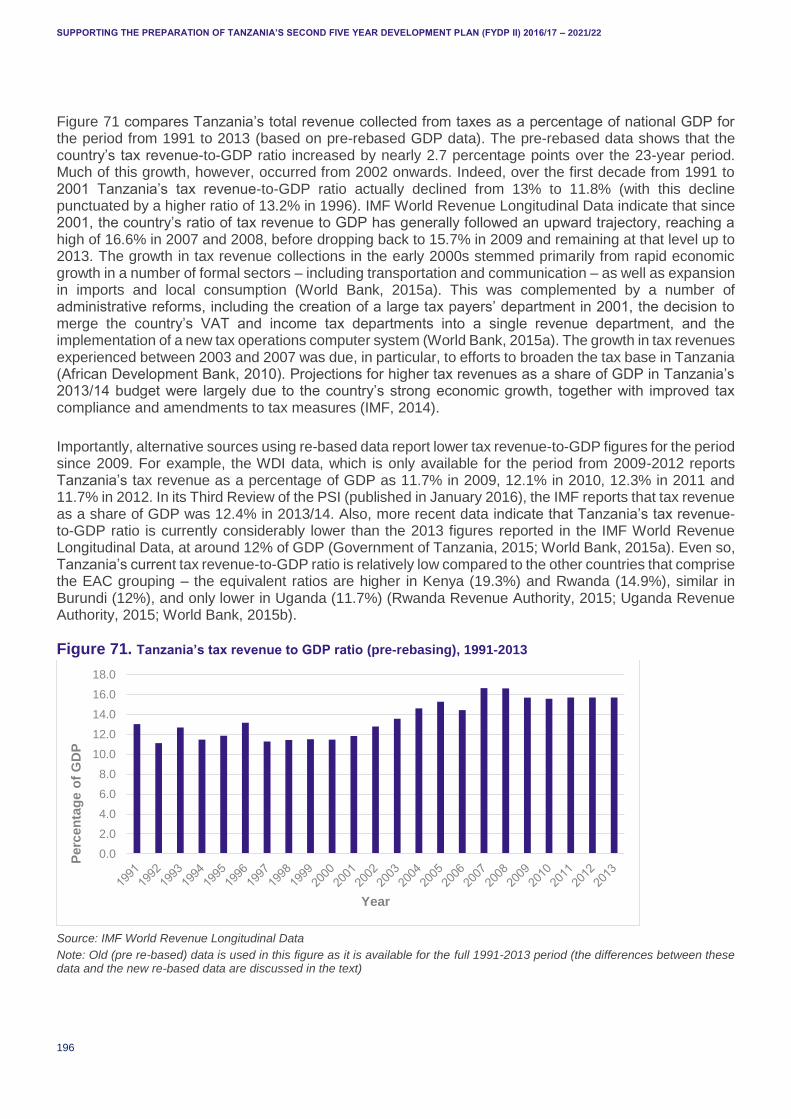
SUPPORTING THE PREPARATION OF TANZANIA’S SECOND FIVE YEAR DEVELOPMENT PLAN (FYDP II) 2016/17 – 2021/22
196
Figure 71 compares Tanzania’s total revenue collected from taxes as a percentage of national GDP for the period from 1991 to 2013 (based on pre-rebased GDP data). The pre-rebased data shows that the country’s tax revenue-to-GDP ratio increased by nearly 2.7 percentage points over the 23-year period. Much of this growth, however, occurred from 2002 onwards. Indeed, over the first decade from 1991 to 2001 Tanzania’s tax revenue-to-GDP ratio actually declined from 13% to 11.8% (with this decline punctuated by a higher ratio of 13.2% in 1996). IMF World Revenue Longitudinal Data indicate that since 2001, the country’s ratio of tax revenue to GDP has generally followed an upward trajectory, reaching a high of 16.6% in 2007 and 2008, before dropping back to 15.7% in 2009 and remaining at that level up to 2013. The growth in tax revenue collections in the early 2000s stemmed primarily from rapid economic growth in a number of formal sectors – including transportation and communication – as well as expansion in imports and local consumption (World Bank, 2015a). This was complemented by a number of administrative reforms, including the creation of a large tax payers’ department in 2001, the decision to merge the country’s VAT and income tax departments into a single revenue department, and the implementation of a new tax operations computer system (World Bank, 2015a). The growth in tax revenues experienced between 2003 and 2007 was due, in particular, to efforts to broaden the tax base in Tanzania (African Development Bank, 2010). Projections for higher tax revenues as a share of GDP in Tanzania’s 2013/14 budget were largely due to the country’s strong economic growth, together with improved tax compliance and amendments to tax measures (IMF, 2014).
Importantly, alternative sources using re-based data report lower tax revenue-to-GDP figures for the period since 2009. For example, the WDI data, which is only available for the period from 2009-2012 reports Tanzania’s tax revenue as a percentage of GDP as 11.7% in 2009, 12.1% in 2010, 12.3% in 2011 and 11.7% in 2012. In its Third Review of the PSI (published in January 2016), the IMF reports that tax revenue as a share of GDP was 12.4% in 2013/14. Also, more recent data indicate that Tanzania’s tax revenue-to-GDP ratio is currently considerably lower than the 2013 figures reported in the IMF World Revenue Longitudinal Data, at around 12% of GDP (Government of Tanzania, 2015; World Bank, 2015a). Even so, Tanzania’s current tax revenue-to-GDP ratio is relatively low compared to the other countries that comprise the EAC grouping – the equivalent ratios are higher in Kenya (19.3%) and Rwanda (14.9%), similar in Burundi (12%), and only lower in Uganda (11.7%) (Rwanda Revenue Authority, 2015; Uganda Revenue Authority, 2015; World Bank, 2015b).
Figure 71. Tanzania’s tax revenue to GDP ratio (pre-rebasing), 1991-2013
Source: IMF World Revenue Longitudinal Data
Note: Old (pre re-based) data is used in this figure as it is available for the full 1991-2013 period (the differences between these data and the new re-based data are discussed in the text)
0.0
2.0
4.0
6.0
8.0
10.0
12.0
14.0
16.0
18.0
Perc
en
tag
e o
f G
DP
Year
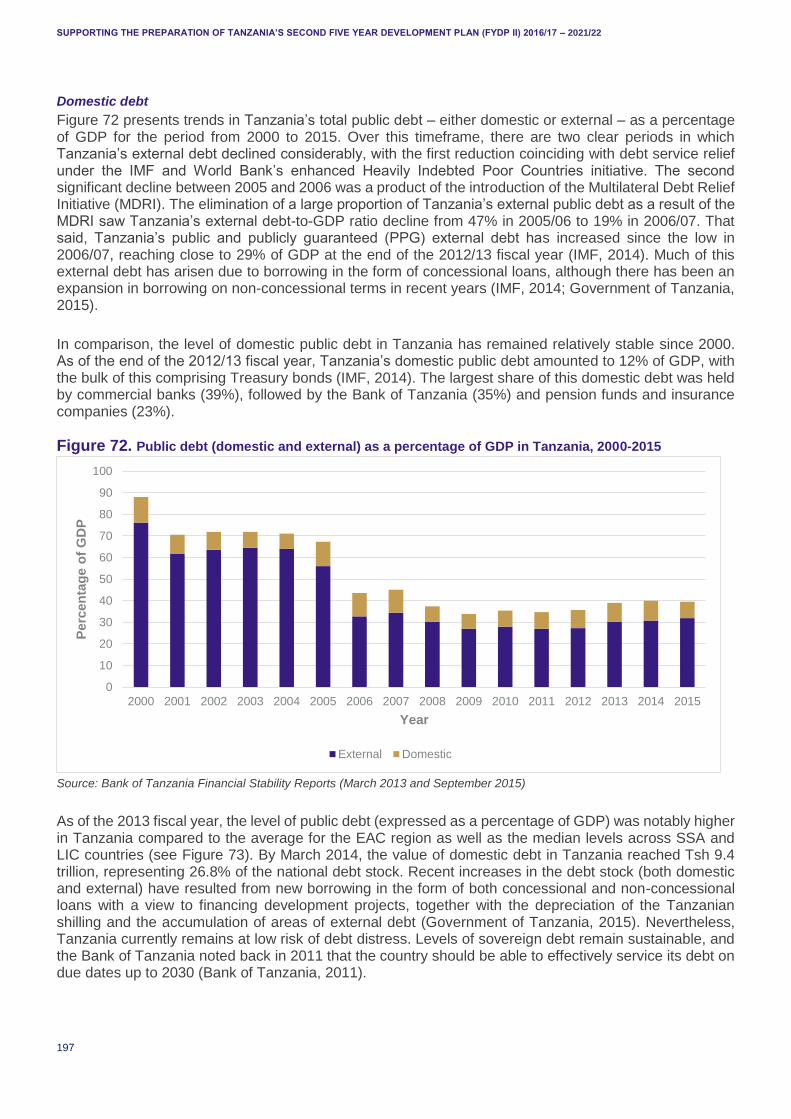
SUPPORTING THE PREPARATION OF TANZANIA’S SECOND FIVE YEAR DEVELOPMENT PLAN (FYDP II) 2016/17 – 2021/22
197
Domestic debt
Figure 72 presents trends in Tanzania’s total public debt – either domestic or external – as a percentage of GDP for the period from 2000 to 2015. Over this timeframe, there are two clear periods in which Tanzania’s external debt declined considerably, with the first reduction coinciding with debt service relief under the IMF and World Bank’s enhanced Heavily Indebted Poor Countries initiative. The second significant decline between 2005 and 2006 was a product of the introduction of the Multilateral Debt Relief Initiative (MDRI). The elimination of a large proportion of Tanzania’s external public debt as a result of the MDRI saw Tanzania’s external debt-to-GDP ratio decline from 47% in 2005/06 to 19% in 2006/07. That said, Tanzania’s public and publicly guaranteed (PPG) external debt has increased since the low in 2006/07, reaching close to 29% of GDP at the end of the 2012/13 fiscal year (IMF, 2014). Much of this external debt has arisen due to borrowing in the form of concessional loans, although there has been an expansion in borrowing on non-concessional terms in recent years (IMF, 2014; Government of Tanzania, 2015).
In comparison, the level of domestic public debt in Tanzania has remained relatively stable since 2000. As of the end of the 2012/13 fiscal year, Tanzania’s domestic public debt amounted to 12% of GDP, with the bulk of this comprising Treasury bonds (IMF, 2014). The largest share of this domestic debt was held by commercial banks (39%), followed by the Bank of Tanzania (35%) and pension funds and insurance companies (23%).
Figure 72. Public debt (domestic and external) as a percentage of GDP in Tanzania, 2000-2015
Source: Bank of Tanzania Financial Stability Reports (March 2013 and September 2015)
As of the 2013 fiscal year, the level of public debt (expressed as a percentage of GDP) was notably higher in Tanzania compared to the average for the EAC region as well as the median levels across SSA and LIC countries (see Figure 73). By March 2014, the value of domestic debt in Tanzania reached Tsh 9.4 trillion, representing 26.8% of the national debt stock. Recent increases in the debt stock (both domestic and external) have resulted from new borrowing in the form of both concessional and non-concessional loans with a view to financing development projects, together with the depreciation of the Tanzanian shilling and the accumulation of areas of external debt (Government of Tanzania, 2015). Nevertheless, Tanzania currently remains at low risk of debt distress. Levels of sovereign debt remain sustainable, and the Bank of Tanzania noted back in 2011 that the country should be able to effectively service its debt on due dates up to 2030 (Bank of Tanzania, 2011).
0
10
20
30
40
50
60
70
80
90
100
2000 2001 2002 2003 2004 2005 2006 2007 2008 2009 2010 2011 2012 2013 2014 2015
Perc
en
tag
e o
f G
DP
Year
External Domestic
SUPPORTING THE PREPARATION OF TANZANIA’S SECOND FIVE YEAR DEVELOPMENT PLAN (FYDP II) 2016/17 – 2021/22
198
Figure 73. Public debt in Tanzania as a percentage of GDP versus EAC average and median values in SSA and LIC groupings
Source: IMF (2014)
INTERNATIONAL PUBLIC FINANCE
In the developing country context, the three main sources of international public finance are ODA, other official financial flows (OOF) and South-South Cooperation (SSC). ODA and SSC are provided primarily by governments and government-owned or directed institutions. In contrast, OOF is typically provided by a broader range of actors, including export credit agencies, government owned or directed development finance institutions, multilateral development banks and development finance institutions (European Report on Development, 2015). The management of these financial flows also tends to vary by type, with largely private sector management in the case of OOF and predominantly government management for SSC sources. ODA, in turn, is typically managed by a variety of different actors, with governments tending to play the most significant role.
Official development assistance
Tanzania has been a major recipient of donor aid for many years. Moreover, Tanzania’s share of total global donor aid flows has increased steadily alongside the economic reforms undertaken in the country. There has, however, been a gradual shift in the composition of donor assistance provided to Tanzania over the past 20 years. In particular, the focus of donors in the mid-1990s on project aid and technical assistance has gradually given way to greater emphasis on direct budgetary support for government expenditure (IMF, 2009). This shift in focus has not dampened the importance of aid inflows in financing government operations in Tanzania.
Indeed, despite the recent shift in the post-2015 financing for development agenda away from a narrow focus on ODA and towards a broader emphasis on all financing channels, net ODA and other official aid flows to Tanzania remain significant. International development assistance continues to represent an important source of finance in Tanzania; and the country has tended to be one of the largest recipients of development assistance in the EAC region (African Development Bank, 2010). Most of the ODA received by Tanzania has come in the form of loans, grants and contributions that do not require repayment (Lunogelo, 2014).
The total amount of net ODA received by Tanzania has risen sharply since 1980. When measured in current US dollars, Tanzania’s net ODA received increased by nearly 408% between 1980 and 2013, climbing from USD 675.6 million in 1980 to more than USD 3.4 billion in 2013. Figure 74 plots Tanzania’s net ODA received over the period from 1988 to 2013 in current US dollars, and also expresses this as a percentage of GNI. Between 1988 and 2000, the level of net ODA received by Tanzania remained relatively stagnant, rising by just 5.6% (and falling below the 1988 level in most of the intervening years). Thereafter, however, net ODA to Tanzania has generally increased markedly. To be sure, between 2001 and 2013, the amount of net ODA that the country received rose by approximately 169%, with the highest levels for individual years recorded in 2013, followed by 2010, 2009 and 2007, respectively. This follows
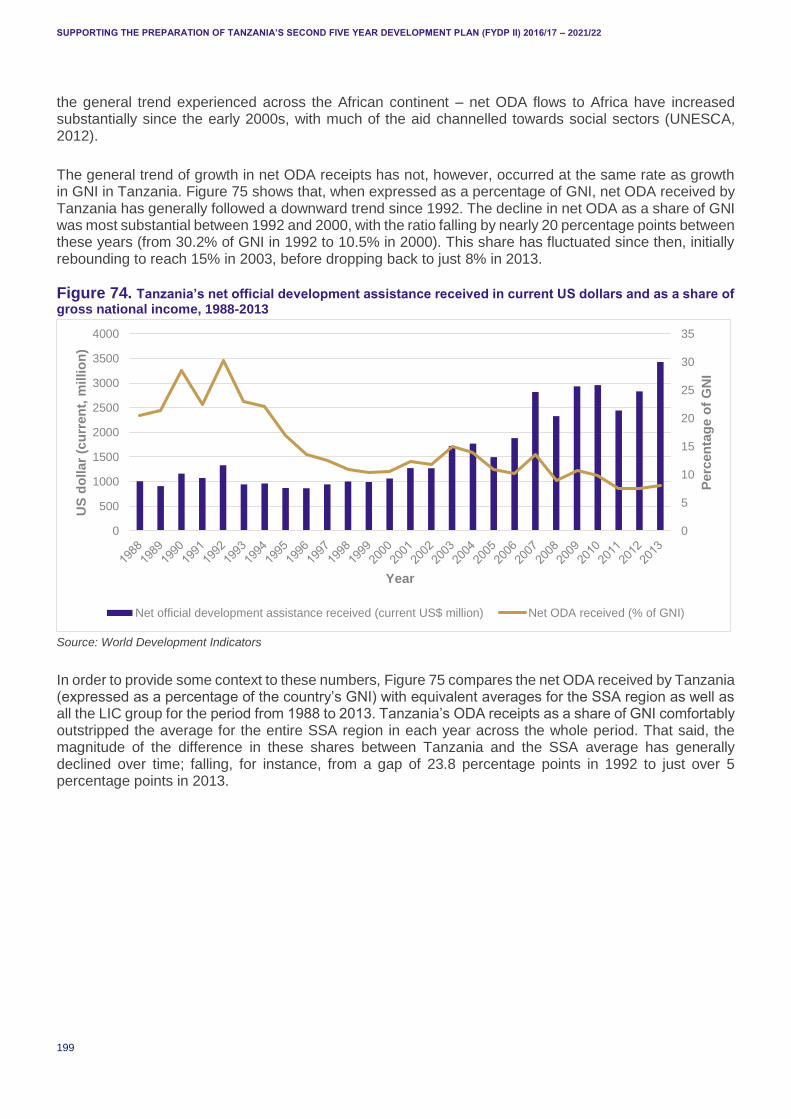
SUPPORTING THE PREPARATION OF TANZANIA’S SECOND FIVE YEAR DEVELOPMENT PLAN (FYDP II) 2016/17 – 2021/22
199
the general trend experienced across the African continent – net ODA flows to Africa have increased substantially since the early 2000s, with much of the aid channelled towards social sectors (UNESCA, 2012).
The general trend of growth in net ODA receipts has not, however, occurred at the same rate as growth in GNI in Tanzania. Figure 75 shows that, when expressed as a percentage of GNI, net ODA received by Tanzania has generally followed a downward trend since 1992. The decline in net ODA as a share of GNI was most substantial between 1992 and 2000, with the ratio falling by nearly 20 percentage points between these years (from 30.2% of GNI in 1992 to 10.5% in 2000). This share has fluctuated since then, initially rebounding to reach 15% in 2003, before dropping back to just 8% in 2013.
Figure 74. Tanzania’s net official development assistance received in current US dollars and as a share of gross national income, 1988-2013
Source: World Development Indicators
In order to provide some context to these numbers, Figure 75 compares the net ODA received by Tanzania (expressed as a percentage of the country’s GNI) with equivalent averages for the SSA region as well as all the LIC group for the period from 1988 to 2013. Tanzania’s ODA receipts as a share of GNI comfortably outstripped the average for the entire SSA region in each year across the whole period. That said, the magnitude of the difference in these shares between Tanzania and the SSA average has generally declined over time; falling, for instance, from a gap of 23.8 percentage points in 1992 to just over 5 percentage points in 2013.
0
5
10
15
20
25
30
35
0
500
1000
1500
2000
2500
3000
3500
4000
Perc
en
tag
e o
f G
NI
US
do
llar
(cu
rren
t, m
illio
n)
Year
Net official development assistance received (current US$ million) Net ODA received (% of GNI)
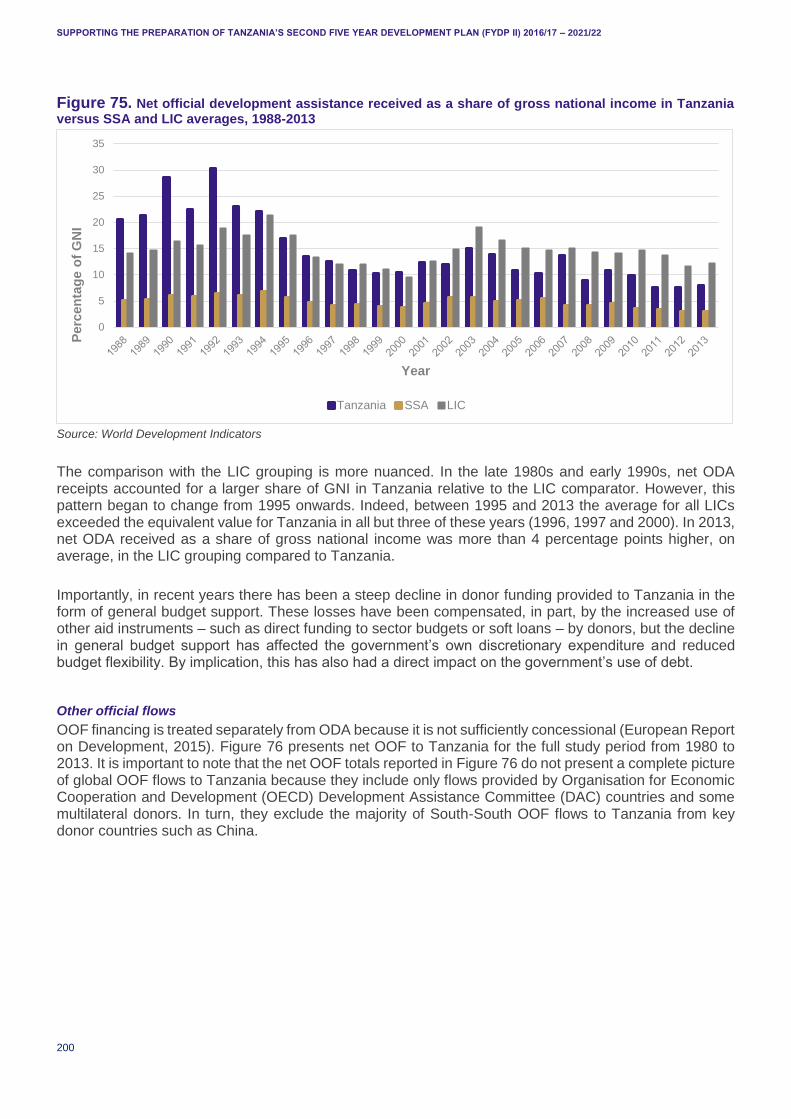
SUPPORTING THE PREPARATION OF TANZANIA’S SECOND FIVE YEAR DEVELOPMENT PLAN (FYDP II) 2016/17 – 2021/22
200
Figure 75. Net official development assistance received as a share of gross national income in Tanzania versus SSA and LIC averages, 1988-2013
Source: World Development Indicators
The comparison with the LIC grouping is more nuanced. In the late 1980s and early 1990s, net ODA receipts accounted for a larger share of GNI in Tanzania relative to the LIC comparator. However, this pattern began to change from 1995 onwards. Indeed, between 1995 and 2013 the average for all LICs exceeded the equivalent value for Tanzania in all but three of these years (1996, 1997 and 2000). In 2013, net ODA received as a share of gross national income was more than 4 percentage points higher, on average, in the LIC grouping compared to Tanzania.
Importantly, in recent years there has been a steep decline in donor funding provided to Tanzania in the form of general budget support. These losses have been compensated, in part, by the increased use of other aid instruments – such as direct funding to sector budgets or soft loans – by donors, but the decline in general budget support has affected the government’s own discretionary expenditure and reduced budget flexibility. By implication, this has also had a direct impact on the government’s use of debt.
Other official flows
OOF financing is treated separately from ODA because it is not sufficiently concessional (European Report on Development, 2015). Figure 76 presents net OOF to Tanzania for the full study period from 1980 to 2013. It is important to note that the net OOF totals reported in Figure 76 do not present a complete picture of global OOF flows to Tanzania because they include only flows provided by Organisation for Economic Cooperation and Development (OECD) Development Assistance Committee (DAC) countries and some multilateral donors. In turn, they exclude the majority of South-South OOF flows to Tanzania from key donor countries such as China.
0
5
10
15
20
25
30
35
Perc
en
tag
e o
f G
NI
Year
Tanzania SSA LIC

SUPPORTING THE PREPARATION OF TANZANIA’S SECOND FIVE YEAR DEVELOPMENT PLAN (FYDP II) 2016/17 – 2021/22
201
Figure 76. Gross and net other official flows to Tanzania, 1980-2013
Source: OECD Stat
There was considerable variation in the magnitude of both gross and net OOF to Tanzania over the 1980 to 2013 period. Looking at individual years, the three largest flows of gross OOF were all recorded prior to 2000, with the largest gross flow of USD 196.3 million registered in 1987. More recently, there has been a general upward trend in gross OOF to Tanzania since 2010 (following a sharp decline between 2008 and 2010 on the back of the debilitating effects of the global economic crisis on international financial flows). This saw gross OOF increase from USD 33.4 million in 2010 to USD 102.2 million in 2013.
Retaining the focus on individual years, the largest instance of positive net OOF was recorded in 1987 (USD 129.8 million), followed by 1983 (USD 88.3 million), 2013 (USD 65.1 million) and 2008 (USD 63.3 million). In the period between 1980 and 2013 there were several instances of negative net OOF (in just more than half of the 33 years) in which Tanzania’s repayments on OOF loans or returns to providers from OOF investments exceeded the new provision of finance from OOF sources. The largest instance of negative net OOF to Tanzania was recorded in 2002, during which the new provision of finance to Tanzania from OOF sources was exceeded by the country’s repayments on OOF loans or returns to providers of OOF investments by nearly USD 115 million. In recent years, net OOF to Tanzania has rebounded following a sharp decline between 2008 and 2011. This recovery saw net OOF reach USD 65.1 million in 2013.
DOMESTIC PRIVATE FINANCE
Flows of domestic private finance are intrinsically difficult to measure due to the reality that it is often difficult to disentangle these flows from those in other categories. This section focuses on three different measures in order to illustrate trends in different types of domestic private finance that are available to Tanzania. The three measures are GFCF by the private sector, the provision of private credit by domestic banks and stock market capitalisation.
Gross fixed capital formation by the private sector
Figure 77 presents the level of GFCF undertaken by the private sector in Tanzania between 2000 and 2013, and also expresses this as a share of total GDP. In absolute terms, there was a substantial increase in private sector investment in GFCF over this period, with the total rising from approximately TSh 871.9 billion in 1990 to nearly TSh 12.9 trillion in 2013. Much of the acceleration in GFCF by the private sector occurred from mid-2000s onwards, with a nearly five-fold increase between 2005 and 2013. When
-150
-100
-50
0
50
100
150
200
250
US
do
llars
(cu
rren
t, m
illio
n)
Year
Total OOF, Net Total OOF, Gross
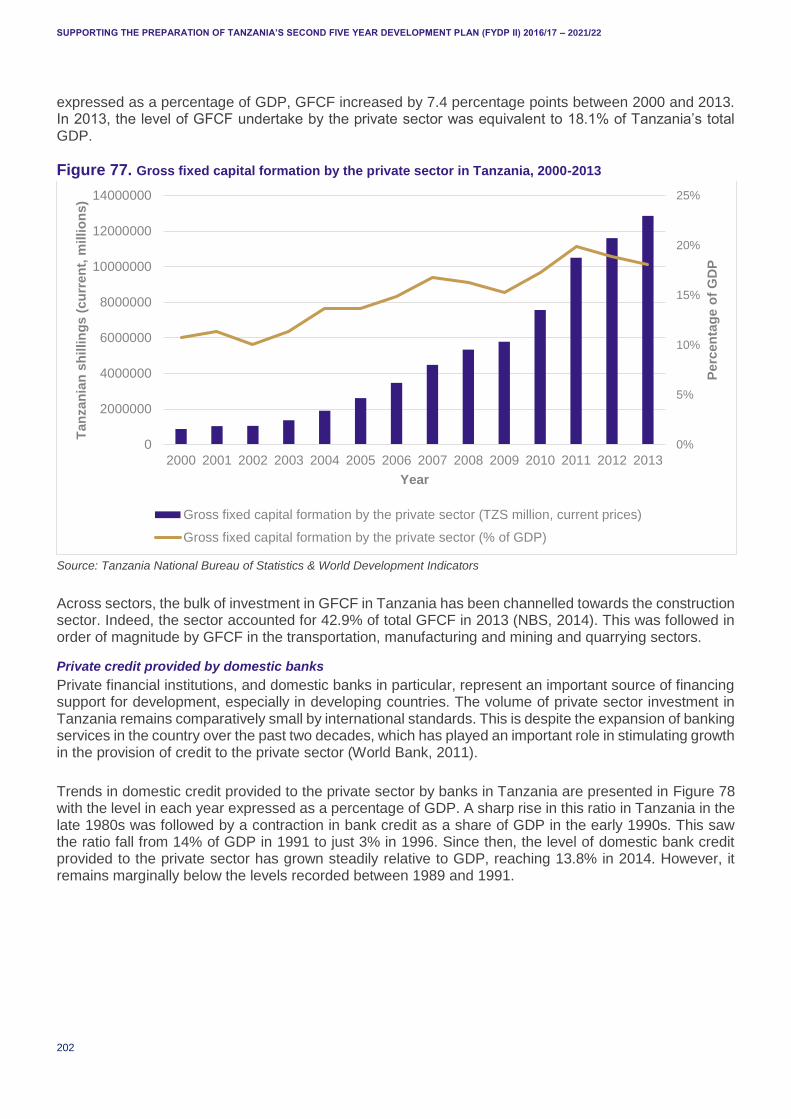
SUPPORTING THE PREPARATION OF TANZANIA’S SECOND FIVE YEAR DEVELOPMENT PLAN (FYDP II) 2016/17 – 2021/22
202
expressed as a percentage of GDP, GFCF increased by 7.4 percentage points between 2000 and 2013. In 2013, the level of GFCF undertake by the private sector was equivalent to 18.1% of Tanzania’s total GDP.
Figure 77. Gross fixed capital formation by the private sector in Tanzania, 2000-2013
Source: Tanzania National Bureau of Statistics & World Development Indicators
Across sectors, the bulk of investment in GFCF in Tanzania has been channelled towards the construction sector. Indeed, the sector accounted for 42.9% of total GFCF in 2013 (NBS, 2014). This was followed in order of magnitude by GFCF in the transportation, manufacturing and mining and quarrying sectors.
Private credit provided by domestic banks
Private financial institutions, and domestic banks in particular, represent an important source of financing support for development, especially in developing countries. The volume of private sector investment in Tanzania remains comparatively small by international standards. This is despite the expansion of banking services in the country over the past two decades, which has played an important role in stimulating growth in the provision of credit to the private sector (World Bank, 2011).
Trends in domestic credit provided to the private sector by banks in Tanzania are presented in Figure 78 with the level in each year expressed as a percentage of GDP. A sharp rise in this ratio in Tanzania in the late 1980s was followed by a contraction in bank credit as a share of GDP in the early 1990s. This saw the ratio fall from 14% of GDP in 1991 to just 3% in 1996. Since then, the level of domestic bank credit provided to the private sector has grown steadily relative to GDP, reaching 13.8% in 2014. However, it remains marginally below the levels recorded between 1989 and 1991.
0%
5%
10%
15%
20%
25%
0
2000000
4000000
6000000
8000000
10000000
12000000
14000000
2000 2001 2002 2003 2004 2005 2006 2007 2008 2009 2010 2011 2012 2013
Perc
en
tag
e o
f G
DP
Tan
zan
ian
sh
illin
gs (
cu
rren
t, m
illio
ns)
Year
Gross fixed capital formation by the private sector (TZS million, current prices)
Gross fixed capital formation by the private sector (% of GDP)
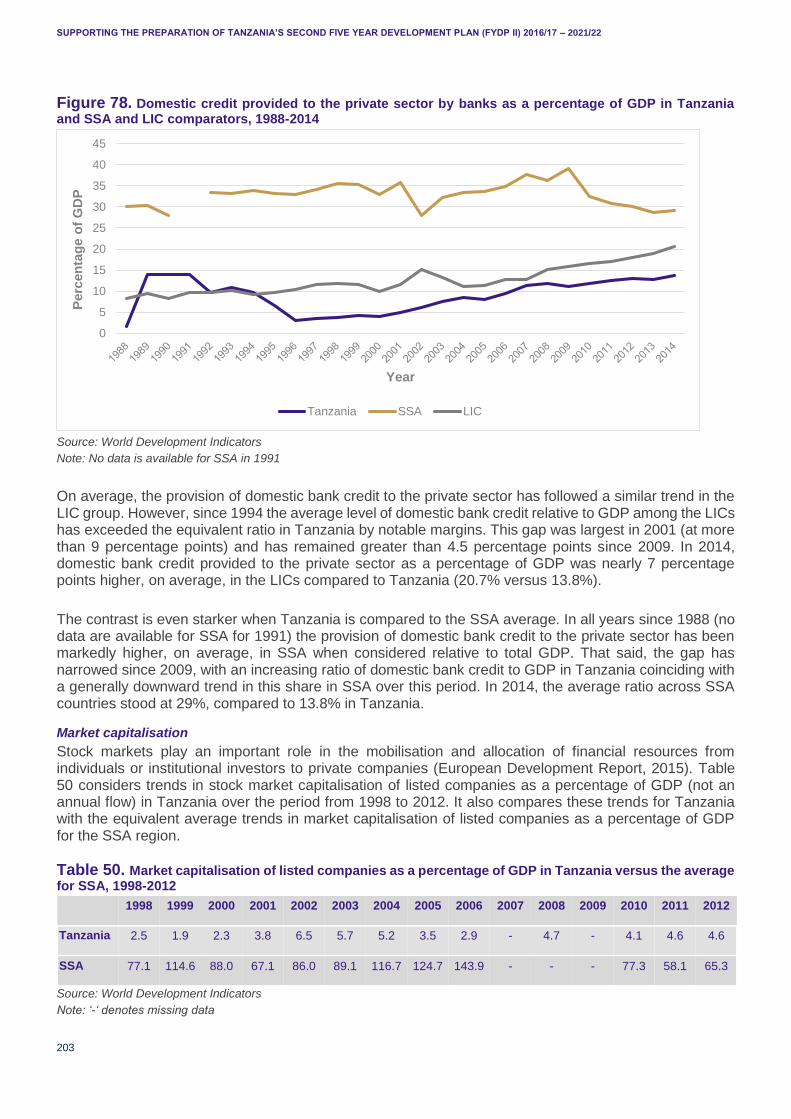
SUPPORTING THE PREPARATION OF TANZANIA’S SECOND FIVE YEAR DEVELOPMENT PLAN (FYDP II) 2016/17 – 2021/22
203
Figure 78. Domestic credit provided to the private sector by banks as a percentage of GDP in Tanzania and SSA and LIC comparators, 1988-2014
Source: World Development Indicators
Note: No data is available for SSA in 1991
On average, the provision of domestic bank credit to the private sector has followed a similar trend in the LIC group. However, since 1994 the average level of domestic bank credit relative to GDP among the LICs has exceeded the equivalent ratio in Tanzania by notable margins. This gap was largest in 2001 (at more than 9 percentage points) and has remained greater than 4.5 percentage points since 2009. In 2014, domestic bank credit provided to the private sector as a percentage of GDP was nearly 7 percentage points higher, on average, in the LICs compared to Tanzania (20.7% versus 13.8%).
The contrast is even starker when Tanzania is compared to the SSA average. In all years since 1988 (no data are available for SSA for 1991) the provision of domestic bank credit to the private sector has been markedly higher, on average, in SSA when considered relative to total GDP. That said, the gap has narrowed since 2009, with an increasing ratio of domestic bank credit to GDP in Tanzania coinciding with a generally downward trend in this share in SSA over this period. In 2014, the average ratio across SSA countries stood at 29%, compared to 13.8% in Tanzania.
Market capitalisation
Stock markets play an important role in the mobilisation and allocation of financial resources from individuals or institutional investors to private companies (European Development Report, 2015). Table 50 considers trends in stock market capitalisation of listed companies as a percentage of GDP (not an annual flow) in Tanzania over the period from 1998 to 2012. It also compares these trends for Tanzania with the equivalent average trends in market capitalisation of listed companies as a percentage of GDP for the SSA region.
Table 50. Market capitalisation of listed companies as a percentage of GDP in Tanzania versus the average for SSA, 1998-2012
1998 1999 2000 2001 2002 2003 2004 2005 2006 2007 2008 2009 2010 2011 2012
Tanzania 2.5 1.9 2.3 3.8 6.5 5.7 5.2 3.5 2.9 - 4.7 - 4.1 4.6 4.6
SSA 77.1 114.6 88.0 67.1 86.0 89.1 116.7 124.7 143.9 - - - 77.3 58.1 65.3
Source: World Development Indicators
Note: ‘-‘ denotes missing data
0
5
10
15
20
25
30
35
40
45
Perc
en
tag
e o
f G
DP
Year
Tanzania SSA LIC
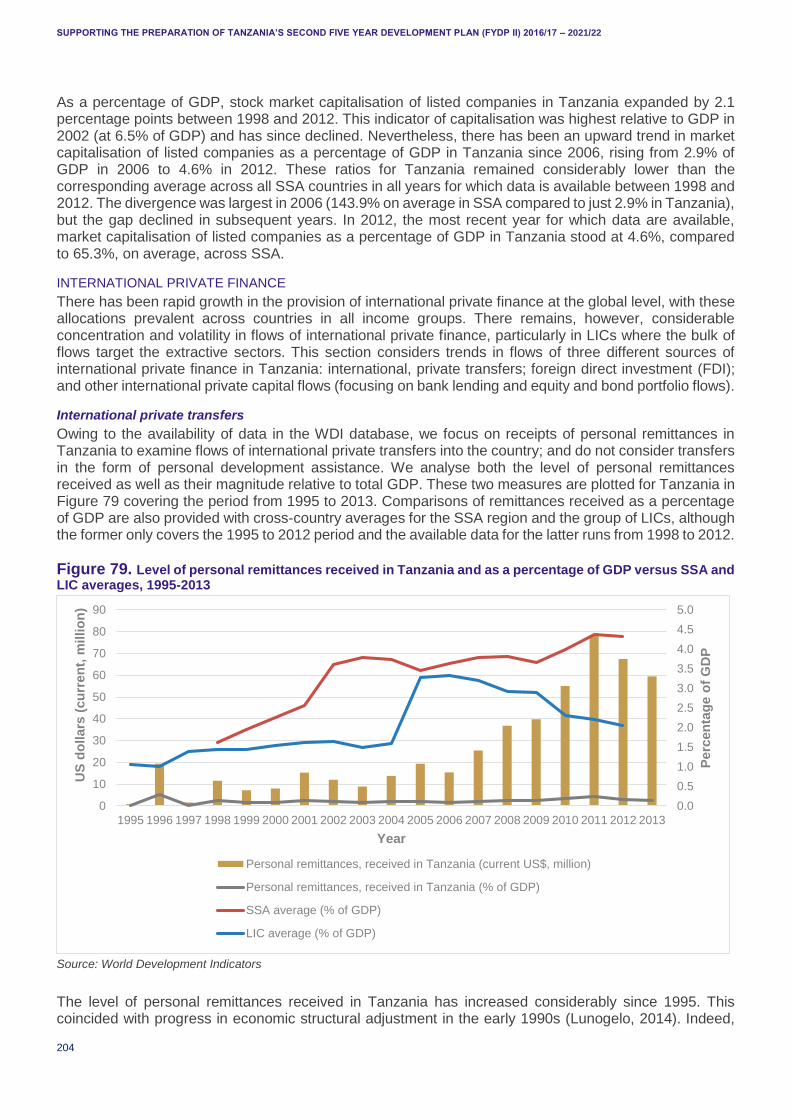
SUPPORTING THE PREPARATION OF TANZANIA’S SECOND FIVE YEAR DEVELOPMENT PLAN (FYDP II) 2016/17 – 2021/22
204
As a percentage of GDP, stock market capitalisation of listed companies in Tanzania expanded by 2.1 percentage points between 1998 and 2012. This indicator of capitalisation was highest relative to GDP in 2002 (at 6.5% of GDP) and has since declined. Nevertheless, there has been an upward trend in market capitalisation of listed companies as a percentage of GDP in Tanzania since 2006, rising from 2.9% of GDP in 2006 to 4.6% in 2012. These ratios for Tanzania remained considerably lower than the corresponding average across all SSA countries in all years for which data is available between 1998 and 2012. The divergence was largest in 2006 (143.9% on average in SSA compared to just 2.9% in Tanzania), but the gap declined in subsequent years. In 2012, the most recent year for which data are available, market capitalisation of listed companies as a percentage of GDP in Tanzania stood at 4.6%, compared to 65.3%, on average, across SSA.
INTERNATIONAL PRIVATE FINANCE
There has been rapid growth in the provision of international private finance at the global level, with these allocations prevalent across countries in all income groups. There remains, however, considerable concentration and volatility in flows of international private finance, particularly in LICs where the bulk of flows target the extractive sectors. This section considers trends in flows of three different sources of international private finance in Tanzania: international, private transfers; foreign direct investment (FDI); and other international private capital flows (focusing on bank lending and equity and bond portfolio flows).
International private transfers
Owing to the availability of data in the WDI database, we focus on receipts of personal remittances in Tanzania to examine flows of international private transfers into the country; and do not consider transfers in the form of personal development assistance. We analyse both the level of personal remittances received as well as their magnitude relative to total GDP. These two measures are plotted for Tanzania in Figure 79 covering the period from 1995 to 2013. Comparisons of remittances received as a percentage of GDP are also provided with cross-country averages for the SSA region and the group of LICs, although the former only covers the 1995 to 2012 period and the available data for the latter runs from 1998 to 2012.
Figure 79. Level of personal remittances received in Tanzania and as a percentage of GDP versus SSA and LIC averages, 1995-2013
Source: World Development Indicators
The level of personal remittances received in Tanzania has increased considerably since 1995. This coincided with progress in economic structural adjustment in the early 1990s (Lunogelo, 2014). Indeed,
0.0
0.5
1.0
1.5
2.0
2.5
3.0
3.5
4.0
4.5
5.0
0
10
20
30
40
50
60
70
80
90
1995 1996 1997 1998 1999 2000 2001 2002 2003 2004 2005 2006 2007 2008 2009 2010 2011 2012 2013
Perc
en
tag
e o
f G
DP
US
do
llars
(cu
rren
t, m
illio
n)
Year
Personal remittances, received in Tanzania (current US$, million)
Personal remittances, received in Tanzania (% of GDP)
SSA average (% of GDP)
LIC average (% of GDP)
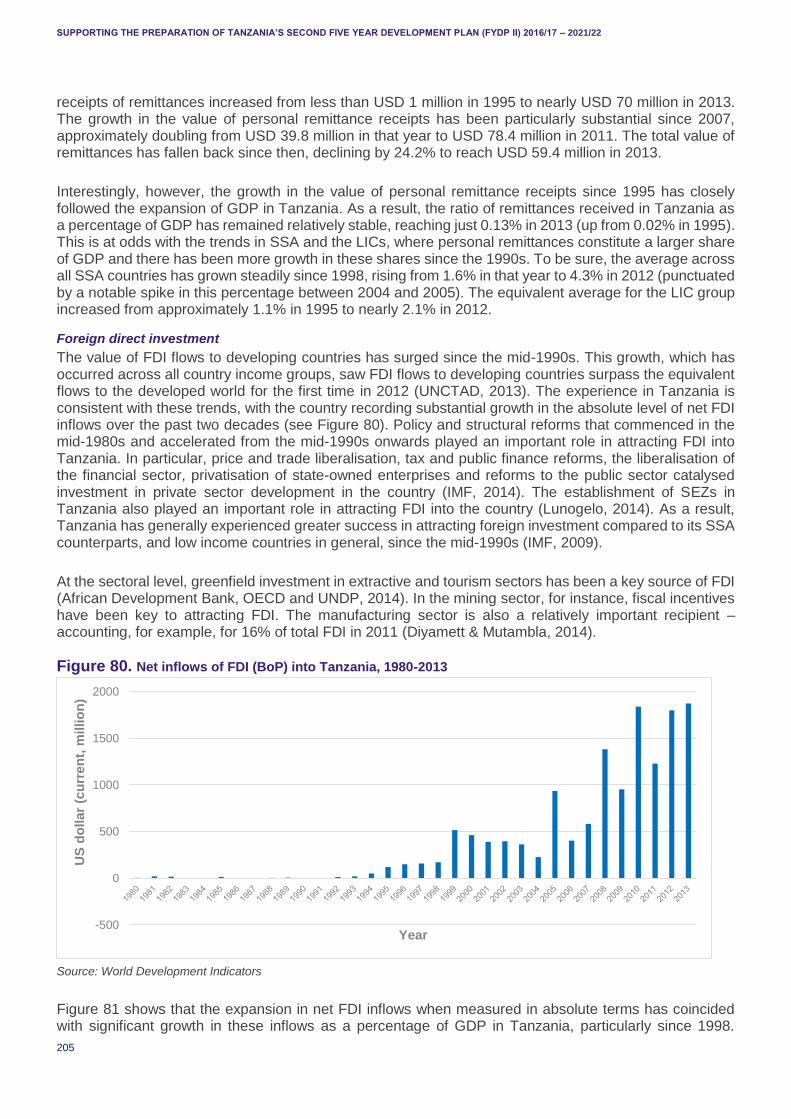
SUPPORTING THE PREPARATION OF TANZANIA’S SECOND FIVE YEAR DEVELOPMENT PLAN (FYDP II) 2016/17 – 2021/22
205
receipts of remittances increased from less than USD 1 million in 1995 to nearly USD 70 million in 2013. The growth in the value of personal remittance receipts has been particularly substantial since 2007, approximately doubling from USD 39.8 million in that year to USD 78.4 million in 2011. The total value of remittances has fallen back since then, declining by 24.2% to reach USD 59.4 million in 2013.
Interestingly, however, the growth in the value of personal remittance receipts since 1995 has closely followed the expansion of GDP in Tanzania. As a result, the ratio of remittances received in Tanzania as a percentage of GDP has remained relatively stable, reaching just 0.13% in 2013 (up from 0.02% in 1995). This is at odds with the trends in SSA and the LICs, where personal remittances constitute a larger share of GDP and there has been more growth in these shares since the 1990s. To be sure, the average across all SSA countries has grown steadily since 1998, rising from 1.6% in that year to 4.3% in 2012 (punctuated by a notable spike in this percentage between 2004 and 2005). The equivalent average for the LIC group increased from approximately 1.1% in 1995 to nearly 2.1% in 2012.
Foreign direct investment
The value of FDI flows to developing countries has surged since the mid-1990s. This growth, which has occurred across all country income groups, saw FDI flows to developing countries surpass the equivalent flows to the developed world for the first time in 2012 (UNCTAD, 2013). The experience in Tanzania is consistent with these trends, with the country recording substantial growth in the absolute level of net FDI inflows over the past two decades (see Figure 80). Policy and structural reforms that commenced in the mid-1980s and accelerated from the mid-1990s onwards played an important role in attracting FDI into Tanzania. In particular, price and trade liberalisation, tax and public finance reforms, the liberalisation of the financial sector, privatisation of state-owned enterprises and reforms to the public sector catalysed investment in private sector development in the country (IMF, 2014). The establishment of SEZs in Tanzania also played an important role in attracting FDI into the country (Lunogelo, 2014). As a result, Tanzania has generally experienced greater success in attracting foreign investment compared to its SSA counterparts, and low income countries in general, since the mid-1990s (IMF, 2009).
At the sectoral level, greenfield investment in extractive and tourism sectors has been a key source of FDI (African Development Bank, OECD and UNDP, 2014). In the mining sector, for instance, fiscal incentives have been key to attracting FDI. The manufacturing sector is also a relatively important recipient – accounting, for example, for 16% of total FDI in 2011 (Diyamett & Mutambla, 2014).
Figure 80. Net inflows of FDI (BoP) into Tanzania, 1980-2013
Source: World Development Indicators
Figure 81 shows that the expansion in net FDI inflows when measured in absolute terms has coincided with significant growth in these inflows as a percentage of GDP in Tanzania, particularly since 1998.
-500
0
500
1000
1500
2000
US
do
llar
(cu
rren
t, m
illio
n)
Year
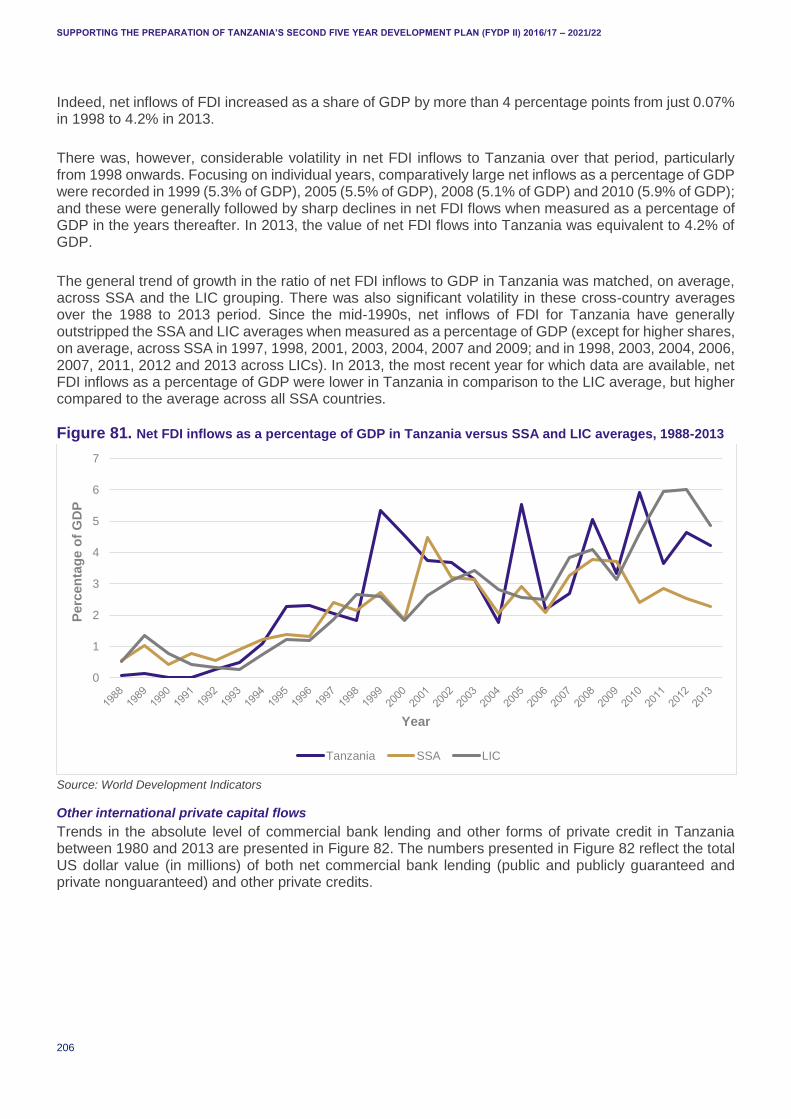
SUPPORTING THE PREPARATION OF TANZANIA’S SECOND FIVE YEAR DEVELOPMENT PLAN (FYDP II) 2016/17 – 2021/22
206
Indeed, net inflows of FDI increased as a share of GDP by more than 4 percentage points from just 0.07% in 1998 to 4.2% in 2013.
There was, however, considerable volatility in net FDI inflows to Tanzania over that period, particularly from 1998 onwards. Focusing on individual years, comparatively large net inflows as a percentage of GDP were recorded in 1999 (5.3% of GDP), 2005 (5.5% of GDP), 2008 (5.1% of GDP) and 2010 (5.9% of GDP); and these were generally followed by sharp declines in net FDI flows when measured as a percentage of GDP in the years thereafter. In 2013, the value of net FDI flows into Tanzania was equivalent to 4.2% of GDP.
The general trend of growth in the ratio of net FDI inflows to GDP in Tanzania was matched, on average, across SSA and the LIC grouping. There was also significant volatility in these cross-country averages over the 1988 to 2013 period. Since the mid-1990s, net inflows of FDI for Tanzania have generally outstripped the SSA and LIC averages when measured as a percentage of GDP (except for higher shares, on average, across SSA in 1997, 1998, 2001, 2003, 2004, 2007 and 2009; and in 1998, 2003, 2004, 2006, 2007, 2011, 2012 and 2013 across LICs). In 2013, the most recent year for which data are available, net FDI inflows as a percentage of GDP were lower in Tanzania in comparison to the LIC average, but higher compared to the average across all SSA countries.
Figure 81. Net FDI inflows as a percentage of GDP in Tanzania versus SSA and LIC averages, 1988-2013
Source: World Development Indicators
Other international private capital flows
Trends in the absolute level of commercial bank lending and other forms of private credit in Tanzania between 1980 and 2013 are presented in Figure 82. The numbers presented in Figure 82 reflect the total US dollar value (in millions) of both net commercial bank lending (public and publicly guaranteed and private nonguaranteed) and other private credits.
0
1
2
3
4
5
6
7
Perc
en
tag
e o
f G
DP
Year
Tanzania SSA LIC
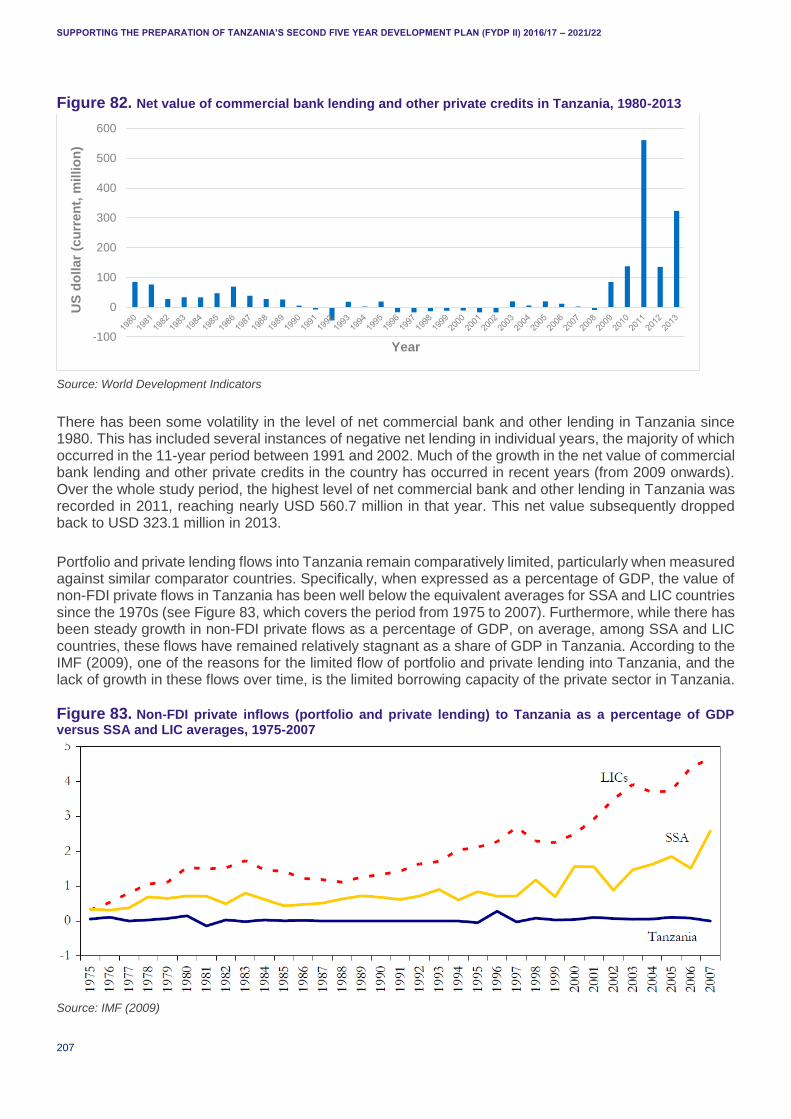
SUPPORTING THE PREPARATION OF TANZANIA’S SECOND FIVE YEAR DEVELOPMENT PLAN (FYDP II) 2016/17 – 2021/22
207
Figure 82. Net value of commercial bank lending and other private credits in Tanzania, 1980-2013
Source: World Development Indicators
There has been some volatility in the level of net commercial bank and other lending in Tanzania since 1980. This has included several instances of negative net lending in individual years, the majority of which occurred in the 11-year period between 1991 and 2002. Much of the growth in the net value of commercial bank lending and other private credits in the country has occurred in recent years (from 2009 onwards). Over the whole study period, the highest level of net commercial bank and other lending in Tanzania was recorded in 2011, reaching nearly USD 560.7 million in that year. This net value subsequently dropped back to USD 323.1 million in 2013.
Portfolio and private lending flows into Tanzania remain comparatively limited, particularly when measured against similar comparator countries. Specifically, when expressed as a percentage of GDP, the value of non-FDI private flows in Tanzania has been well below the equivalent averages for SSA and LIC countries since the 1970s (see Figure 83, which covers the period from 1975 to 2007). Furthermore, while there has been steady growth in non-FDI private flows as a percentage of GDP, on average, among SSA and LIC countries, these flows have remained relatively stagnant as a share of GDP in Tanzania. According to the IMF (2009), one of the reasons for the limited flow of portfolio and private lending into Tanzania, and the lack of growth in these flows over time, is the limited borrowing capacity of the private sector in Tanzania.
Figure 83. Non-FDI private inflows (portfolio and private lending) to Tanzania as a percentage of GDP versus SSA and LIC averages, 1975-2007
Source: IMF (2009)
-100
0
100
200
300
400
500
600
US
do
llar
(cu
rren
t, m
illio
n)
Year
SUPPORTING THE PREPARATION OF TANZANIA’S SECOND FIVE YEAR DEVELOPMENT PLAN (FYDP II) 2016/17 – 2021/22
208
CHALLENGES TO THE MOBILISATION OF FINANCIAL RESOURCES IN TANZANIA
In this section we identify a range of short and long term finance challenges that Tanzania will need to confront if it is to boost domestic resource mobilisation and enhance access to finance for development. Successfully addressing these challenges is particularly pertinent given the country’s desire to scale up public sector investment, with a strong emphasis on increased infrastructure spending. The latter has been a central thrust of the government’s strategy to reduce poverty in the FYPD I period.
At a fundamental level, the Government of Tanzania currently faces a range of general budgetary challenges. For example, in assessing issues affecting the implementation of the 2014/15 budget, the Ministry of Finance, highlighted the following broad challenges:
Lengthy periods of time involved in accessing external concessional loans.
The dependence of public corporations on government subvention.
Rising demand for financial resources to fund socio-economic infrastructure.
The ongoing effect of the global economic crisis on the availability of credit in financial markets.
These general issues are underscored by a number of specific short and long term challenges that affect Tanzania’s ability to generate sufficient financial resources to drive development. These issues – which include weaknesses in the tax system, the persistence of large fiscal deficits and rising national debt, an over-reliance on foreign aid, and structural barriers to bank lending in the private sector – are discussed in detail below.
Weaknesses in the tax system
As noted in earlier, the level of domestic revenue collection in Tanzania remains comparatively low. Indeed, the country’s tax revenue-to-GDP ratio is low in comparison to its regional neighbours. The persistence of low tax revenue collections in Tanzania can be attributed to a variety of factors. At a fundamental level, tax collections are constrained by a narrow tax base (Mjema, 2014). Fewer than three million salaried employees are registered to pay tax in the country out of a total of some 22 million economically active individuals (Lunogelo, 2014). Tanzania is also reliant on a relatively small number of firms for the majority of its domestic tax revenues – when trade-related taxes are excluded, around 400 large taxpayers contribute as much as 70% of the country’s total revenue collections (TEC et al., 2012).
The tax base is also highly concentrated geographically. The bulk of tax collections come from Dar es Salaam – the capital city contributes as much as 90% of Tanzania’s total tax revenue; and large enterprises, the majority of which are located in Dar es Salaam, account for close to half of total tax revenue collections (World Bank, 2015a). This is despite the greater Dar es Salaam region contributing just 17% of Tanzania’s total GDP (Lunogelo, 2014).
The tax base is also concentrated in a few sectors. This is particularly evident in the case of VAT collections. Currently, the bulk of VAT is collected from businesses trading in food, beverages, cigarettes and telecommunications (ibid.). In turn, important sectors such as agriculture, construction, mining and trade make disproportionately low contributions to total VAT collections (ibid.).
The narrow tax base in Tanzania is exacerbated by the presence of binding constraints to expanding the tax net. The African Development Bank (2010) has identified two clear constraints in this regard: a lack of systems and mechanisms to identify and reach taxpayers, and a shortage of knowledge on potential taxpayers operating in the Tanzania’s large informal economy. The TRA has introduced Taxpayer Identification Numbers (TIN) for both individuals and businesses and organisations, but the process of integrating these numbers with the broader national personal identification number database is not yet complete.
SUPPORTING THE PREPARATION OF TANZANIA’S SECOND FIVE YEAR DEVELOPMENT PLAN (FYDP II) 2016/17 – 2021/22
209
There is also concentration in the types of taxes that provide the bulk of Tanzania’s domestic tax revenue. Specifically, Tanzania relies relatively heavily on international trade taxes relative to domestic indirect taxes (Kitillya, 2014; Mjema and Shemoi, 2013). The dominance of international trade taxes in the tax revenue basket is potentially problematic given that these revenues are expected to fall in line with Tanzania’s involvement in the ongoing regional integration efforts occurring in the EAC as well as the Southern African Development Community and the proposed Tripartite Free Trade Area. In turn, the country is relatively more dependent on indirect taxes compared to direct taxes (Mjema and Shemoi, 2013). Even though the share of direct taxes relative to indirect taxes has been increasing over the past decade, there remains scope to boost the collection of direct taxes domestically in Tanzania (Osoro, 2014).
Tax collection efforts in Tanzania are also heavily affected by widespread tax evasion and low levels of tax compliance. Tanzania’s tax take has been hampered in the past by an endemic culture of tax avoidance in Tanzania (African Development Bank, 2010). Even in the case of indirect taxes such as VAT, which should, in principle, be easier to collect, tax evasion has been rife. In 2013, the VAT collection rate in Tanzania stood at just 40% – well below the equivalent levels in Uganda (45%), Zambia (54.6%) and Kenya (57.6%) (Gaddis et al., 2013). At the sectoral level, the large nonmonetary component of the agriculture sector impinges on the ability to collect taxes from the sector, even though it has in the past made a major contribution to total GDP (IMF, 2009). In tourism, the dominance of cash transactions in certain parts of the sector is more conducive to tax evasion (ibid.). Furthermore, the persistence of tax concessions designed to encourage investment in the mining sector continues to prevent increases in effective tax rates (ibid.).
The problem of tax avoidance and evasion is exacerbated by the presence of a plethora of tax exemptions. Tanzania is currently foregoing significant revenue through these exemptions, and their presence is regarded as a major contributor to the country’s relatively poor revenue collection performance (Mjema and Shemoi, 2013). Encouragingly, there has been some progress in eliminating unnecessary exemptions – for instance, the passing of a new VAT Act in 2014 has facilitated the removal of several exemptions,40 but these changes have only been made recently and it is too early to gauge the extent to which they will actually contribute to rising tax collections (they are, however, projected to bring in an additional TZS 260 billion in revenue). Furthermore, there seems to be considerable opposition to the removal of tax exemptions within certain interest groups and constituencies, and this is reflected in the fact that only one out of four areas of reform has been passed by Parliament to date.41
Capacity challenges within the Tanzania Revenue Authority (TRA) also compromise tax collection efforts. In the past, the TRA has faced challenges in recruiting and retaining skilled tax specialists, particularly in areas such as ICT, accounting and finance, audit and legal affairs (African Development Bank, 2010). More recently, the limited audit capacity within the TRA in specialised sectors has manifested in a shortage of specialised technical expertise (Luvanda and Yona, 2014). This has meant that the TRA has faced considerable difficulty in addressing more complex tax issues such as the taxation of multinationals and transfer pricing (Kitillya, 2014). Assistance in addressing the latter problem is already in place through support from several development partners, including the Norwegian and UK (DFID/Her Majesty’s Revenue and Customs) governments and USAID.
Finally, Tanzania faces a number of challenges related to the collection of taxes at the local government level. Many of these stem from capacity challenges, such as difficulties in estimating potential revenues and monitoring private revenue collectors, which manifest in inefficiencies in the collection of taxes by LGAs (Katera, 2013). As a result, own revenue sources constitute only a small share of the finance available to LGAs, with the bulk instead coming through intergovernmental transfers (Mjema and Shemoi, 2013).
40 In the new VAT Act, the previously unrestricted powers of the government to grant or amend restrictions has been altered so that approval must be attained from the National Assembly before the government is allowed to review, grant or abolish a particular tax exemption. The new Act also removes tax exemptions on imports that are used for mining or oil and gas exploration (Olingo, 2015). 41 Information provided during an interview with TRA on 8 October 2015.
SUPPORTING THE PREPARATION OF TANZANIA’S SECOND FIVE YEAR DEVELOPMENT PLAN (FYDP II) 2016/17 – 2021/22
210
A persistent fiscal deficit and rising national debt
Tanzania continues to grapple with the challenge of an expanding financing gap. Between 2010 and 2013, public spending exceeded the total value of tax revenue collected by the country by 12% (Gaddis et al., 2013). The Tanzanian authorities have increasingly resorted to commercial borrowing and foreign aid to finance the gap, with the concomitant challenge of having to manage rising national debt levels (Lunogelo, 2014).
As a result, Tanzania has been running both fiscal and balance-of-payment deficits for some time. In the past, the fiscal deficit has been financed, in a large part (up to 40%), by foreign sources (Osoro, 2010). A declining trend in grants, however, has made efforts to reduce Tanzania’s fiscal deficit increasingly challenging (IMF, 2014). The Government of Tanzania seeks to contain the size of the fiscal deficit within the range of the equivalent of around 3% of GDP, which will require significant control of public expenditure and the diversion of resources to cover debt service obligations (World Bank, 2015a).
Over-reliance on foreign aid
The contribution made by external aid to Tanzania’s total budget has declined steadily in recent years, with the aid contribution falling from 40% of the budget in the 2008/09 fiscal year to below 30% in 2013/14 (World Bank, 2015a). Even so, the expanding financing gap in Tanzania provides clear evidence that existing domestic financing capacity falls short of what is required to meet the country’s financing needs. As a result, Tanzania remains heavily reliant on foreign aid from donors to finance the provision of basic services and infrastructure.
This poses several challenges to financial resource mobilisation in Tanzania. First, the reliance on external assistance has in the past had the perverse effect of undermining ‘tax morale’ among Tanzania’s elite, compromising efforts to boost tax revenue collection (African Development Bank, 2010). Second, the effectiveness of aid flows into the country has also been adversely affected by a lack of planning and implementation capacity within Tanzania, especially within line ministries. At times, this has resulted in the late disbursement of basket funds, low absorption capacity, delays in tendering processes, variation in financial management procedures and delays in the processing and warranting of funds (Mbilinyi and Kazi, 2011). Finally, Tanzania’s heavy reliance on foreign aid poses risks given the current global environment of generally declining aid flows.
Structural barriers to bank lending to the private sector, resulting in limited access to finance for private investment
A small capital market, together with a shortage of institutions providing credit to the private sector, places considerable constraints on the availability of finance for private investment in Tanzania. Most firms in Tanzania depend on credit finance provided by commercial banks. These banks do not have a development focus and this, coupled with a shortage of development banks and other development finance institutions (DFIs), limits the available opportunities to access long-term funding for development at lower interest rates (Wangwe et al., 2014). Consequently, very little credit has been being provided in the past to finance productive investment in the country (Osoro, 2010). This has been aggravated by a shortage of financial institutions with the capability, or willingness, to mobilise and monetize domestic savings, particularly in the rural parts of the country (ibid.). In short, the result has been that Tanzania’s financial sector has in the past performed “poorly as an intermediary” (ibid., 31).
The shortage of available credit is exacerbated by the high cost of credit. The cost of credit to the private sector in Tanzania has increased since 2012 (World Bank, 2015a). This is due, at least in part, to the persistence of perceptions of high levels of risk associated with lending to the private sector, which have manifested in a wide spread between lending and deposit rates (Lunogelo, 2014). As a result, securing loans has been relatively expensive in Tanzania (Osoro, 2010).
The existing financing challenges are clearly evident in sectors such as agriculture. The finance that is currently available falls well short of the level required to transform the agricultural sector and raise agricultural productivity, both of which could play a critical role in the alleviation of extreme poverty in the

SUPPORTING THE PREPARATION OF TANZANIA’S SECOND FIVE YEAR DEVELOPMENT PLAN (FYDP II) 2016/17 – 2021/22
211
country’s rural areas (Bank of Tanzania, 2014). The level of access to bank financing in the agricultural sector is low compared to that in other key sectors such as manufacturing, trade and services (ibid.). Indeed, less than 5% of total bank loans in Tanzania are directed towards the agriculture sector (ESRF, 2013).
The difficulties associated with accessing finance in the agriculture sector in Tanzania are a product of several different challenges. At a fundamental level, there is a general reluctance on the part of financial institutions to provide credit to agribusinesses due to the shortage of institutional mechanisms and instruments capable of mitigating the inherent risks associated with agribusiness in Tanzania (Lunogelo, 2014). Other financing challenges that currently hinder the development of the agricultural sector include high interest rates, short loan repayment periods relative to the crop cycle, lack of collateral available to farmers and the prevalence of short-term rather than long-term finance (Bank of Tanzania, 2014).
These challenges aside, a range of institutional factors also affect access to finance among agricultural producers in Tanzania. According to the Bank of Tanzania (2014: 23): “These obstacles include unpredictable government policies, political intervention in agri-markets and inadequacy of supporting legislation. At the bank level, obstacles to lending to agriculture include lack of understanding of agricultural markets, large distance between bank branches and farmers, mismatch in financial products and sector needs, high perceived risk in financing agriculture and lack of long-term funding.”
LESSONS FROM FYDP I ON FINANCE TARGETS
At its inception, the FYDP I set out to achieve a number of ambitious targets – including, for example, goals relating to boosting GDP growth, sectoral contributions to GDP, manufacturing employment and Tanzania’s contribution to world trade – within the overall focus of removing binding constraints to growth in Tanzania. The attainment of these targets was seen as important in building a foundation for industrialisation and export-led growth. Nevertheless, as we show in section 3.5, several targets have turned out to be too ambitious, including those related to GDP growth, the share of manufacturing in GDP, the share of Tanzania in world trade and World Bank Doing Business indicators.
Other targets relate specifically to financing and government expenditure. Table 51 provides several illustrative examples of actual performance and progress against several of these targets. The experience to date suggests that the ambitions of the FYDP I have been affected to a certain extent by the availability of sufficient resources (particularly financial resources) for implementation. Encouragingly, the Government of Tanzania is well on track to achieve certain targets (such as those related to restricting the budget deficit and limiting government expenditure as a share of GDP), and should exceed initial expectations on these targets. That said, some of the targets that were achieved may have been too easy to attain or mask fiscal management problems (such as the target on overall government expenditure as a share of GDP). Moreover, several other targets have proven to be too optimistic, with goals to increase the revenue-to-GDP ratio to 19%, and reduce tax exemptions to 1% of domestic revenue unlikely to be achieved by the end of the 2015/16 financial year. This suggests that consideration will need to be given to ensuring that the targets set for FYDP II are realistic given the available resources and the timeframe for implementation of the plan. More generally, there is a sense that budgeting and revenue targets have not been realistic, highlighting the need for future budgets to be more realistically linked to actual revenues.
Table 51. Assessment of progress towards FYDP I (2011/12-2015/16) targets, illustrative examples
Target for 2015/16 Actual Performance Assessment of progress
Restrict the budget deficit (excluding grant) to 10% of GDP
Budget balance to GDP ratio (excluding grants) of -5.1% in 2014/15 (provisional data)
On track to exceed target
Increase revenue-to-GDP ratio to 19%
Tax revenue to GDP ratio of 12% in 2014/15. Current revenue to GDP ratio of 14% in 2014/15.
Got worse. Tanzania’s revenue to GDP ratio remains low compared with most EAC counterparts.
Overall government expenditure not to exceed 28% of GDP
Projected to be 20.6% at the end of 2015/16
Target met
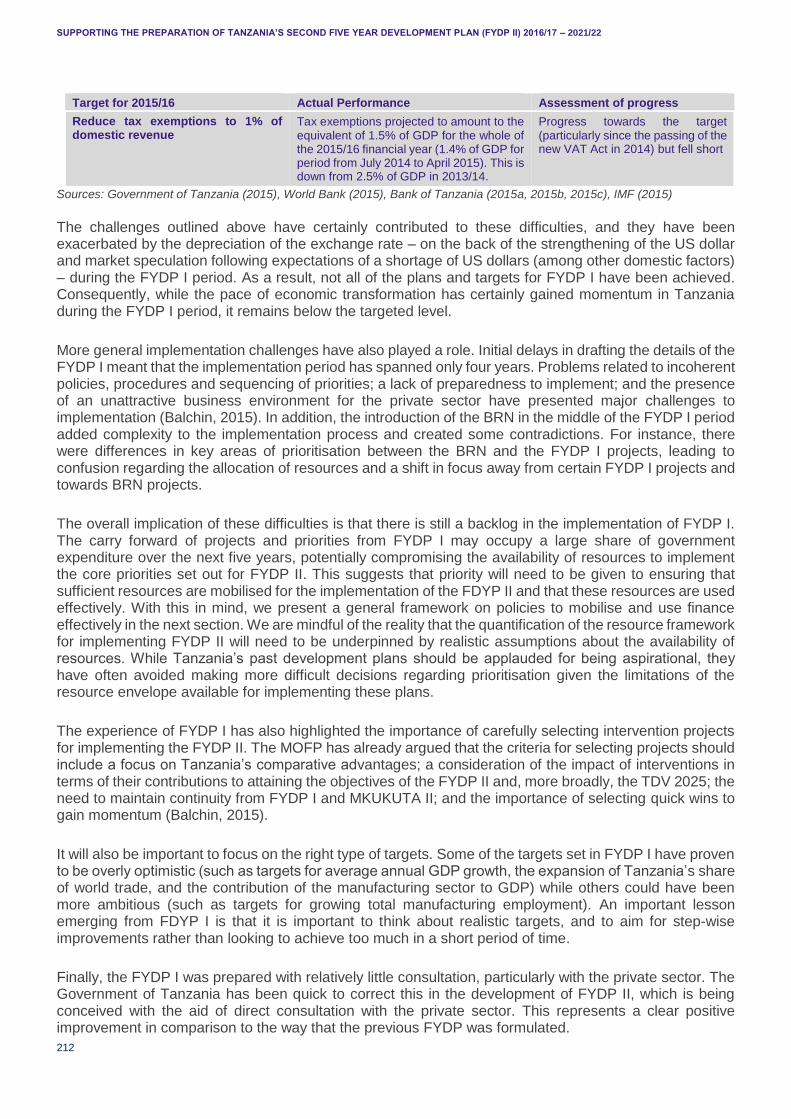
SUPPORTING THE PREPARATION OF TANZANIA’S SECOND FIVE YEAR DEVELOPMENT PLAN (FYDP II) 2016/17 – 2021/22
212
Target for 2015/16 Actual Performance Assessment of progress
Reduce tax exemptions to 1% of domestic revenue
Tax exemptions projected to amount to the equivalent of 1.5% of GDP for the whole of the 2015/16 financial year (1.4% of GDP for period from July 2014 to April 2015). This is down from 2.5% of GDP in 2013/14.
Progress towards the target (particularly since the passing of the new VAT Act in 2014) but fell short
Sources: Government of Tanzania (2015), World Bank (2015), Bank of Tanzania (2015a, 2015b, 2015c), IMF (2015)
The challenges outlined above have certainly contributed to these difficulties, and they have been exacerbated by the depreciation of the exchange rate – on the back of the strengthening of the US dollar and market speculation following expectations of a shortage of US dollars (among other domestic factors) – during the FYDP I period. As a result, not all of the plans and targets for FYDP I have been achieved. Consequently, while the pace of economic transformation has certainly gained momentum in Tanzania during the FYDP I period, it remains below the targeted level.
More general implementation challenges have also played a role. Initial delays in drafting the details of the FYDP I meant that the implementation period has spanned only four years. Problems related to incoherent policies, procedures and sequencing of priorities; a lack of preparedness to implement; and the presence of an unattractive business environment for the private sector have presented major challenges to implementation (Balchin, 2015). In addition, the introduction of the BRN in the middle of the FYDP I period added complexity to the implementation process and created some contradictions. For instance, there were differences in key areas of prioritisation between the BRN and the FYDP I projects, leading to confusion regarding the allocation of resources and a shift in focus away from certain FYDP I projects and towards BRN projects.
The overall implication of these difficulties is that there is still a backlog in the implementation of FYDP I. The carry forward of projects and priorities from FYDP I may occupy a large share of government expenditure over the next five years, potentially compromising the availability of resources to implement the core priorities set out for FYDP II. This suggests that priority will need to be given to ensuring that sufficient resources are mobilised for the implementation of the FDYP II and that these resources are used effectively. With this in mind, we present a general framework on policies to mobilise and use finance effectively in the next section. We are mindful of the reality that the quantification of the resource framework for implementing FYDP II will need to be underpinned by realistic assumptions about the availability of resources. While Tanzania’s past development plans should be applauded for being aspirational, they have often avoided making more difficult decisions regarding prioritisation given the limitations of the resource envelope available for implementing these plans.
The experience of FYDP I has also highlighted the importance of carefully selecting intervention projects for implementing the FYDP II. The MOFP has already argued that the criteria for selecting projects should include a focus on Tanzania’s comparative advantages; a consideration of the impact of interventions in terms of their contributions to attaining the objectives of the FYDP II and, more broadly, the TDV 2025; the need to maintain continuity from FYDP I and MKUKUTA II; and the importance of selecting quick wins to gain momentum (Balchin, 2015).
It will also be important to focus on the right type of targets. Some of the targets set in FYDP I have proven to be overly optimistic (such as targets for average annual GDP growth, the expansion of Tanzania’s share of world trade, and the contribution of the manufacturing sector to GDP) while others could have been more ambitious (such as targets for growing total manufacturing employment). An important lesson emerging from FDYP I is that it is important to think about realistic targets, and to aim for step-wise improvements rather than looking to achieve too much in a short period of time.
Finally, the FYDP I was prepared with relatively little consultation, particularly with the private sector. The Government of Tanzania has been quick to correct this in the development of FYDP II, which is being conceived with the aid of direct consultation with the private sector. This represents a clear positive improvement in comparison to the way that the previous FYDP was formulated.
SUPPORTING THE PREPARATION OF TANZANIA’S SECOND FIVE YEAR DEVELOPMENT PLAN (FYDP II) 2016/17 – 2021/22
213
POLICIES TO MOBILISE AND USE FINANCE EFFECTIVELY
A range of different policies should be considered both to mobilise financial resources for development and to ensure that these resources are utilised effectively in Tanzania. In this section we consider policies for the mobilisation and effective use of four broad categories of finance: domestic public finance; international public finance; domestic private finance; and international private finance. It is clear that much work still needs to be done to establish an environment in which the optimal conditions and incentives are in place to maximise domestic resource mobilisation and foreign investment on a sustainable basis in Tanzania. The proposals delineated in this section are designed to provide initial guidance in this regard.
DOMESTIC PUBLIC FINANCE
Reform the tax system
The Government of Tanzania, at times with the support of the donor community, has already launched, or has announced plans to launch, a number of reforms aimed at boosting the efficiency and efficacy of tax revenue collection. These have included, for example, the implementation of a new VAT Act, the introduction of higher levies on fuel, and a range of administrative reforms designed to reduce the prevalence of tax exemptions, broaden the tax base in the country and improve the efficiency of tax administration. The latter is emphasised in the TRA’s Fourth Corporate Plan (CP4) and has been a key thrust of donor support. For example, support from donors has been provided to the TRA through the World Bank-run Tax Administration Project and assistance from the IFC and the World Bank to reengineer VAT, income tax and PAYE processes in Tanzania under the auspices of the Tanzania Tax Administration Simplification project (UNESCA, 2012).
In its 2015/16 Budget Frame, the Tanzanian Ministry of Finance announced several new plans to boost tax revenue collection. These include the introduction of performance contracts for TRA staff in order to ensure the achievement of revenue collection targets (Government of Tanzania, 2015). Plans to enforce the use of electronic fiscal devices in all business transactions are expected to boost efforts to prevent tax evasion in the country (ibid.). The government has also expressed a firm commitment to no longer conduct business with suppliers, contractors and service providers that do not pay their taxes promptly (ibid.). Finally, the previous Minister of Finance has proposed a number of amendments to the Income Tax Act (see Government of Tanzania, 2015 page 40).
Furthermore, a raft of new measures aimed at improving tax compliance in Tanzania have been introduced since the elections in October 2015, and these have coincided with substantial increases in tax collections, which reached a record high of TSh 1.4 billion in December 2015. These have included a focus on closing loopholes, improving the enforcement of legal requirements for businesses to pay unpaid taxes (some success has already been achieved in getting businesses to pay taxes due for unpaid container charges at the Dar es Salaam Port), boosting licensing income by re-registering owners of motorcycles and tricycles under a new system, and improving systems for monitoring tax compliance.
Given the promise of these existing efforts, and the progress made in improving tax collections immediately after the elections in Tanzania in October 2015, it will be important to continue the momentum generated through these initial successes, especially given the immense pressure to mobilise additional resources to finance both the FYDP II priorities and the country’s broader social and economic development objectives. More needs to be done to improve the efficiency of tax administration and tax collection processes and procedures in Tanzania. Focused efforts could potential bring a significant boost to domestic revenue collections. In conducting a tax gap analysis comparing Tanzania’s economic structure to similar countries, the IMF has estimated a potential revenue gap of between 3-4% of GDP.42
Proposals to improve the administration and collection of taxes in Tanzania are outlined below. In some cases, these do not represent new reforms, but rather emphasise the need for greater attention and resources to be directed towards existing initiatives. The implementation of these proposals will require
42 Figure provided through consultation with Thomas Baunsgaard, IMF Resident Representative in Tanzania.
SUPPORTING THE PREPARATION OF TANZANIA’S SECOND FIVE YEAR DEVELOPMENT PLAN (FYDP II) 2016/17 – 2021/22
214
concerted effort to strengthen and institutionalise political support for tax administration reform (UNESCA, 2012). This should be done with the ultimate goal of improving Tanzania’s tax-revenue-to-GDP ratio to between 20% and 25% in the long term.
First, it will be important to follow through on the government’s commitment to reduce the value of tax exemptions to 1% of GDP (from the current high of 4% of GDP). The Government of Tanzania has already moved to reduce tax exemptions granted through the discretionary powers of the Minister of Finance, and further progress in this regard is crucial in order to improve the allocative efficiency of the tax system in the country. In previous years, tax exemptions have created distortions in the system and resulted in the loss of a considerable amount of tax revenue (African Development Bank, 2010). This was particularly true in the case of the mining sector, where exemptions from local government taxes, withholding taxes and fuel levies were frequently built into mining contracts (Policy Forum, 2009). The African Development Bank (2010) has estimated that the reduction of tax exemptions in Tanzania could raise tax collections by several percentage points.
Second, there remains a need to broaden the geographical distribution of the tax base. Attempts to do so could focus on reducing the current dependence on Dar es Salaam for the vast majority of Tanzania’s tax collections. Similarly, it will be important to diversify sectoral contributions to the tax base in Tanzania. The taxation of currently undertaxed sectors such as real estate and natural resources as well as those that make a comparatively low contribution to total tax collection – particularly the agriculture, construction, manufacturing, mining and trade sectors – should be prioritised. For example, there is considerable scope to strengthen the taxation of property in Tanzania. As Osoro (2010: 39) noted back in 2010: “Most property owners, especially in towns and cities and notably those who own commercial or residential building, are not contributing adequately to tax revenue. Although the law clearly states that property taxes must be collected and the TRA is mandated to collect them, collection effort has been too low.” The resulting low revenues from property taxes in Tanzania have compromised the ability of LGAs to finance expenditure on public goods in the past (DiJohn, 2010). Greater emphasis on the collection of property taxes could deliver a steady source of revenue for LGAs in Tanzania and provide an important link between the collection of these taxes and the public goods and services that they are used to fund (Kitillya, 2014b).
An earlier pilot study on property tax collection in Dar es Salaam suggests that measures designed to improve the collection of these taxes can provide a significant boost to revenue. The pilot study involved the TRA collecting property tax on behalf of municipalities in Dar es Salaam over a five-year period commencing in July 2008. While under the responsibility of the TRA, the collection rate for property taxes grew by 34% (TRA, 2014). Consideration should be given to reinstituting this arrangement in Dar es Salaam and extending the approach to other cities in Tanzania. This could be complimented by continued efforts to empower LGAs to undertake their own property valuations and streamline the valuation process, both of which have already been emphasised in the BRN’s NKRA on Resource Mobilisation for the 2013/14 to 2015/16 period. Other constraints to property tax administration also need to be addressed. This will require greater consistency in the valuation and assessment of properties; reductions in time lags in the valuation process; higher tax rates; improved registration of properties; the removal of exemptions from payment currently enjoyed by certain property owners; a harmonisation of methods used to determine the tax base; and efforts to raise the level of compliance through, for example, improved service delivery at the local level (at present, poor service delivery discourages voluntary compliance) (Kitillya, 2014b; Ngaruko and Aikaeli, 2014).
Third, more effective taxation of the informal sector would also make a significant contribution to boosting tax revenues. The imposition of presumptive taxes is a possible short-term measure, and the TRA has already expressed a commitment to improving the presumptive taxation scheme that was passed by Parliament in June 2014 (TRA, 2014). The long-term focus should be on attracting participants currently operating in Tanzania’s informal sector into the formal economy. Central to this is the effective identification of taxpayers. Several initiatives have already been introduced to aid this process, and a concerted effort is required to ensure that these initiatives are finalised. For instance, the integration of the national identification system with the TRA’s system of Tax Identification Numbers needs to be completed, along with the finalisation of the construction of a database documenting the physical locations of businesses
SUPPORTING THE PREPARATION OF TANZANIA’S SECOND FIVE YEAR DEVELOPMENT PLAN (FYDP II) 2016/17 – 2021/22
215
(Kitillya, 2014a). The process of registering businesses can also be aided by enlisting the help of ward, Mtaa and village executives to identify and register informal enterprises in their communities (Mushi, 2014). The World Bank (2015) also suggests that partnerships with the private sector, banks and large taxpayers could play a role in reducing informality by placing the burden of responsibility for the collection of VAT from all suppliers on large firms.
These specific policies are likely to be more effective if accompanied by a range of more general administrative reforms to the tax system. The World Bank (2015), for instance, proposes the development of mobile money payment options to more effectively facilitate the electronic payment of taxes. This should help to reduce transaction costs associated with the tax payments in Tanzania and, as a result, improve levels of compliance, leading to higher tax revenues.
Ultimately, the success of these reforms to the tax system in Tanzania will hinge on the extent to which the Tanzanian state is able to establish a viable fiscal contract with its citizens. In this regard, the importance of good governance cannot be underestimated. For instance, it is necessary to strengthen the link between tax payment and service delivery in Tanzania. As noted by the World Bank (2015: 33): “The Government should provide basic services to the country’s citizens, while citizens should be able to demand accountability from the Government regarding its expenditures. If this contract does not exist, citizens do not feel a moral obligation to pay tax.”
Enhance public financial management systems
At a general level, domestic resources can be used more effectively for development in the context of the FYDP II in the presence of better financial management. This requires commitment from the Government of Tanzania to undertake further public financial management reform. Such commitment is particularly important given the large increases in government expenditure that have been witnessed since the early 2000s – in the 10 years prior to 2013/14, spending by the Government of Tanzania increased at an average rate of 22% each year (BRN Resource Mobilisation NKRA, 2013). Indeed, the need to strengthen public finance management is recognised explicitly in MKUKUTA II and MKUZA II. Although Tanzania is considered to possess one of the best public financial management systems in SSA, there remains room for improvement (IMF, 2009). This is evident in declining Public Expenditure and Financial Accountability (PEFA) scores on a number of different indicators.43 In the case of budgeting processes, for instance, improvements are required across the board from budget formulation and execution through to cost management and monitoring and reporting (ibid.).
The IMF (2014) looking at where specific improvements are required, and highlight the following areas:
The implementation of guidelines to prevent arrears accumulation.
The development of a plan, with appropriate verification and safeguards, to gradually reduce the existing debt stock.
Diminish the use of expenditure floats at the end of each fiscal year.
More timely compilation of fiscal outturn data that is consistent with financing data.
These improvements can be accompanied by more general improvements to the monitoring and management of fiscal risks in Tanzania. The Bank of Tanzania (2011: 11) has previously highlighted the need to enhance the regulatory framework and risk management systems in order to “support a safer, efficient and resilient financial system.”
Improve the distribution and allocation of revenues between the central government and LGAs
Domestic revenues can be utilised more effectively for industrial and human development across Tanzania if there is greater equity in the manner in which they are distributed to, and utilised by, LGAs. For some time, fiscal transfers from the central government to LGAs in Tanzania have tended to be unevenly
43 See www.pefa.org.
SUPPORTING THE PREPARATION OF TANZANIA’S SECOND FIVE YEAR DEVELOPMENT PLAN (FYDP II) 2016/17 – 2021/22
216
distributed, particularly in the case of recurrent government transfers (Tidemand et al., 2014). This has created an inequitable system in which there is wide variation in the revenue allocations across districts (ibid.). These divergences in allocations do not appear to be related to any objective measures of relative need across LGAs (ibid.).
Addressing the issue will require greater fiscal transparency around LGA resource allocations from the central government (particularly in the case of allocations in the form of recurrent block grants), as well as improved transparency related to the utilisation of financial resources at both the central and local government levels, including in relation to the distribution of financial resources within LGAs. In terms of the latter, for example, some LGAs in Tanzania have developed schemes to provide fiscal (as well as non-fiscal) incentives to attract and retain staff, and in some cases deploy employees to understaffed areas (Tidemand et al., 2014). On a different note, a more transparent and equitable system of revenue allocations from the central government would also reduce the incentives for LGAs to introduce additional nuisance taxes.
At the same time, the systemic weaknesses in public financial management systems at the local level identified in the World Bank’s Country Assistance Strategy (CAS) for the 2012 to 2015 period, which raise the fiduciary risk facing public funds at the level of local government, need to be addressed. Policies to this effect should look to:
Address variations resulting from the presence of multiple planning processes and reporting requirements.
Improve the harmonisation of stand-along IT solutions.
Improve coordination between LGAs and central government ministries.
Introduce comprehensive monitoring of fund flows.
Close dormant bank accounts.
Enhance the management of carry forward balances.
Establish a well-functioning incentive structure.
Sovereign bonds
Tanzania has the option to issue sovereign bonds to mobilise additional financial resources for the implementation of the development projects contained within the FYDP II. The approach of issuing sovereign bonds has become increasingly popular among SSA countries. These bonds represent a relatively inexpensive means to attract new sources of external finance for growth and development projects or to direct towards debt management. They also offer the benefit of lower direct borrowing costs when compared to domestic debt (te Velde, 2014) although recently they have gone up. This is important in the Tanzanian context, where interest rates are relatively high. Sovereign bonds potentially create the opportunity to borrow at lower interest rates on international capital markets. Furthermore, given that Tanzania has traditionally relied heavily on aid flows to finance expenditure, sovereign bonds can generate a useful alternative source of finance particularly for projects that do not typically attract donor funding. Indeed, issuing sovereign bonds is seen as a way to raise finance for key infrastructure modernisation projects as well as to supplement domestic revenue (Lunogelo, 2014). It has been estimated that a bond issue has the potential to raise up to USD 1 billion in additional funds for these purposes (Manson, 2015).
Tanzania’s initial plans to issue sovereign bonds were shelved in 2008 due to the onset of the global financial crisis. These plans were reinstituted in 2013. However, legal issues associated with the procurement of credit rating agencies at the time meant that the contracts between the Government and the rating agencies had to be nullified, thereby putting a halt to proceedings. The process has since restarted and the government is still working on this
The next step will be to structure the sovereign bonds to the market. Tanzania’s Ministry of Finance has noted that this will depend on the state of the market at the time that the bonds are intended to be issued. The Ministry of Finance will need to carefully track interest rate developments in the global market in order
SUPPORTING THE PREPARATION OF TANZANIA’S SECOND FIVE YEAR DEVELOPMENT PLAN (FYDP II) 2016/17 – 2021/22
217
to determine an appropriate time to issue the bonds. Issuing the bonds when the prevailing interest rate is high would mean raising the budget deficit. This implies that careful consideration is required before undertaking further borrowing, particularly given that debt service is currently the second largest item in Tanzania’s budget. The Government of Tanzania will need to be certain that it is able to generate sufficient funds to pay back the money borrowed through the sovereign bond issue. In this context, the quality and viability of projects selected for implementation in FYDP II is critical if they are to be financed through sovereign bonds. It is very expensive to repay these types of finance, particularly if the project fails.
This highlights the importance of carefully considering and assessing the fiscal risks associated with a sovereign bond issue in Tanzania. Several broad categories of risks should be considered: implementation risks; debt sustainability risks; roll-over risks; exchange-rate risk and macroeconomic risk (te Velde, 2014). Delays in implementation of projects in Tanzania could result in the burden of additional carry costs. In turn, debt sustainability risks will arise should Tanzania find itself in a situation in which it is unable to manage the debt, if the funds are spent unwisely, or if insufficient funds are available to repay the bond when it matures. Sovereign bonds could also carry roll-over risks in Tanzania if they account for a significant share of external debt. This will be exacerbated if the bonds mature prior to the completion of the projects they are intended to fund.
The risks associated with a devaluation of the Tanzanian shilling also need to be assessed. Were the currency to devalue, foreign currency repayments on the sovereign bond may become relatively more expensive than equivalent repayments on domestic debt. In such a scenario, any benefits associated with lower direct borrowing costs for sovereign bonds relative to domestic bonds would be eliminated.
The final issue relates to potential macroeconomic risks. Substantial inflows of capital into Tanzania could bring with them the possibility of excessive volatility and the threat of inflation. The IMF (2009) has noted in the past that the mitigation of these risks in Tanzania would require careful management of public debt as well as disciplined public procurement.
Potential role for Tanzania’s DFIs in tandem with regional and international development banks to mobilise investment and plug financing gaps
There is scope for Tanzania’s existing DFIs to play a more influential role in designing and structuring development projects associated with FYDP II, and linking these projects to funding opportunities. The TIB Development Bank has advocated moving away from the government’s existing cash budgeting system. The TIB has argued that: “cash budgets cannot accommodate multi-year, fully funded programs because the budget cycle occurs on a strict, yearly basis. A real-life translation of this funding limitation can be seen in road construction that creates disjointed roads where the tarmac ends halfway down the street. Waiting for next years’ budget to complete the tarmac road is further stymied by availability of the budget the following year. Budget projections can only extend out to the coming year because projects are funded on the basis of fiscus ability to collect tax revenues. Therefore, perennially the Government runs out of money.” (TIB Development Bank, 2015: 2). For these reasons, in the TIB’s view, the cash budgeting approach adopted by the Government of Tanzania constrains its ability to shape a financing system for development projects that functions both smoothly and sustainably. Instead, they advocate funding multi-year capital expenditure projects such as infrastructure development programmes through a combination of equity and debt. The TIB could play a role in facilitating this by arranging commercial funding for commercially viable projects (for instance by acting as an intermediary to match – and leverage – surplus funds to areas in need of investment capital) or structuring projects as a transaction advisor.
Naturally, it would be important to be mindful of the risks associated with project management should such an approach be adopted. There would be exposure to exchange rate risk stemming from the reality that the bulk of the money would be raised from outside of Tanzania (TIB Development Bank, 2015). In addition, there would be risks associated with the efficiency of management in both the institutions involved in raising the money and those tasked with implementing the projects that are financed in this way (ibid.). Finally, the quality and efficiency of project implementation and the efficient selection of projects will be important determinants of the capacity to repay the funds leveraged for such projects (ibid.).
SUPPORTING THE PREPARATION OF TANZANIA’S SECOND FIVE YEAR DEVELOPMENT PLAN (FYDP II) 2016/17 – 2021/22
218
In addition to the role of arranging and leveraging funds for investment in development projects, Tanzania’s development banks, including the TIB Development Bank and the NDC, could play a greater role in assisting the Government of Tanzania to develop bankable projects. Moreover, they can be used more extensively to manage the funding and implementation of projects that are not bankable (such as rural electrification and small-scale mining initiatives) by taking on the initial risk associated with the investment.
A key constraint to DFIs in Tanzania playing a more influential role as proposed above is that they are currently undercapitalised. This can be addressed if institutions such as the TIB Development Bank and the NDC are encouraged to team up with other development banks in the region (such as the Development Bank of Southern Africa (DBSA) or the African Development Bank) and elsewhere (such as the newly established BRICS Development Bank – now known as the New Development Bank).
INTERNATIONAL PUBLIC FINANCE
Tanzania remains heavily dependent on donor aid flows and other forms of development assistance. While the Government of Tanzania has been vocal in its plans to reduce reliance on foreign aid in favour of greater mobilisation of domestic resources, international development assistance is likely to remain an important factor in the Tanzanian context for some time to come. However, the nature of donor assistance is evolving. Over the past decade, for instance, Tanzania has experienced reductions in general budget support linked to deterioration in the relationship between donors and the government (Tilley, 2014), and this has been accompanied by a shift towards programme funding. Looking ahead, there are likely to be further changes, particularly in the shape of a move away from grants to less concessional loans (given that Tanzania will be graduating to middle-income status at some point). In light of this, it is worth considering both policies that improve the mobilisation of international public finance and those that ensure that the financial resources that do flow from these resources are utilised more effectively. We consider a couple of options below.
Broadening the donor base, focusing on South-South cooperation
Shifting trends in the donor market suggest that a new approach to attracting and interacting with donors may yield dividends in Tanzania. While aid from traditional donors continues to account for most of the development assistance provided in Africa, the role of non-OECD DAC donors is expanding rapidly (Smith et al., 2010; Quadir, 2013; OECD Development Cooperation Directorate, 2015). Large southern donors such as China and India, together with other developing countries such as Brazil, Saudi Arabia, Turkey and South Africa have become increasingly influential providers of development assistance both on the continent and in other developing regions (Kragelund, 2010). Expanding relationships with these new emerging donors through increased South-South cooperation can go a long way to filling the gap in donor finance created by declining aid flows (at least in relative terms) from Tanzania’s OECD DAC donors. This will be important to maintain stable flows of donor finance into Tanzanian. Already, Tanzania has made commendable efforts to build relationships with non-OECD DAC donors. For example, the Ministry of Finance and Planning has boosted its desk officer resources in the external finance department to work with southern donors.
Tie development objectives to climate change targets
One option that Tanzania should consider in order to mobilise greater resources from the donor community is to tap into the considerable growth in global funds targeted towards climate change objectives. New sources of climate-related funding are increasingly being made available by development partners. If Tanzania is able to tie key national development objectives in the FYDP II to climate-related targets, it will open up possibilities for attract this funding. Indeed, as the World Bank (2011: 31) noted in its CAS for Tanzania for the 2012 to 2015 fiscal years: “A climate change strategy would incorporate climate change adaptation into national growth and development plans, clarifying institutional responsibilities for addressing climate change across government sectors. A corresponding financing mechanism would let Tanzania leverage multiple funding sources to address both national development priorities and climate-related objectives.”
SUPPORTING THE PREPARATION OF TANZANIA’S SECOND FIVE YEAR DEVELOPMENT PLAN (FYDP II) 2016/17 – 2021/22
219
More strategic use of aid allocations
Given the magnitude of flows of ODA and over forms of development assistance to Tanzania from foreign sources, policies that ensure that these resources are effectively utilised are crucial. In the context of the extensive reforms necessary to boost domestic resource mobilisation in the country, moves to channel aid allocations to support these reforms could be of considerable benefit. Aid allocations to support public financial management are markedly lower across Africa compared to developing countries as a whole – averaging 0.1% between 2002 and 2010 compared to the developing country average of 3.1% over the same period (UNESCA, 2012). This suggests that there is significant scope to redirect some donor support towards domestic resource mobilisation in Africa.
In the Tanzanian context, there may be considerable benefits to allocating a share of total ODA towards supporting tax administration reforms that promote domestic tax mobilisation and improve domestic tax structures. For example, the semi-autonomous nature of the TRA should provide the necessary flexibility to utilise donor funds to implement key structural and personnel reforms required to boost capacity and recruit personnel to address shortages in skills and technical expertise. More generally, the success of the East AFRITAC in the region provides a compelling example of how donor assistance can be channelled effectively towards revenue administration and public financial management. The East AFRITAC’s approach to technical assistance is demand-driven and output-oriented, and its assistance in the area of revenue administration has focused on building capacity in member countries to mobilise tax and trade revenues and broaden their tax bases. In the area of public financial management, it has focused on directing assistance towards strengthening budgeting, budget execution, financial reporting and oversight. Examples of recent support provided through East AFRITAC to Tanzania include assistance to the TRA to strengthen audit capacity and support to the Bank of Tanzania in enhancing its Financial Stability Risk Assessment and Reporting Framework.
More efficient distribution of aid resources
At the same time, it will be important to raise the speed of disbursement of donor funds and ensure a smooth flow of donor resources through the various levels of government. This will require efforts to reduce the amount of time taken for donor funds to reach decentralised units (districts, for instance) and ensure that resource flows are allocated more equitably within the country.
DOMESTIC PRIVATE FINANCE
Alongside the mobilisation of domestic public finance, financial flows from domestic private sources are likely to grow in significance as the Government of Tanzania looks to reduce its dependency on international aid. This suggests a greater role for private credit flows as well as private sector involvement in financing development in the country.
An expanded role for the private sector through PPPs
PPPs have become increasingly attractive to the Government of Tanzania as mechanisms to address financing gaps in key priority areas for development. Indeed, the Government of Tanzania has already announced its intention to explore opportunities for greater private sector involvement in development-focused investments. This presents a viable option to transfer some of the government’s spending responsibilities to the private sector. PPPs could take the form of lease contracts, concessions, Build–Operate–Transfer or Build–Own–Transfer (BOT) corporations; equity participation, among others.
The Government of Tanzania has already sought to get the policy and regulatory frameworks in place to boost the role of PPPs as financing mechanisms for national development activities. This is evident in the enactment of the National PPP Policy in 2009, the PPP Act of 2010, PPP Regulations in 2011 and the Public Procurement Act of the same year. Despite this, there are few practical details in the national PPP policy documents and legislation on specific options for PPP financing or how PPPs will actually be encouraged in practice. Attention should be given to articulating more specific PPP policies and strategies and marketing them effectively to potential investors.

SUPPORTING THE PREPARATION OF TANZANIA’S SECOND FIVE YEAR DEVELOPMENT PLAN (FYDP II) 2016/17 – 2021/22
220
The private sector could play a particularly influential role in financing Tanzania’s extensive infrastructure needs, either through direct investment or through PPPs to finance infrastructure spending. For example, in the energy sector the utilisation of PPPs provides a means to mobilise finance through IPPs. As Lungelo (2014) notes, however, the correct mix of financing sources for infrastructure development may differ by sector. He argues that the development of transport and energy infrastructure in Tanzania is best suited to a combination of ODA and private funding; while the focus in financing ICT infrastructure should be directed towards FDI and private sector finance. In the agriculture sector, the World Bank (2011) suggests that PPPs could be utilised to drive commercialisation, particularly for the provision of key inputs, services, storage facilities, long-term finance to investors in processing, support to export infrastructure, trade finance, warehouse finance and logistics. A case-by-case approach is required to determine, and facilitate, the best mix of public, private and donor finance for specific infrastructure development projects.
The success of PPPs, whether in investments in infrastructure development or other areas, is likely to require greater levels of technical assistance to support both the government and the private sector, particularly to assist in the preparation of bankable projects and business plans (Lunogelo, 2014). Capacity building is also required to expand PPP into new areas of the economy.
Finally, the quality of the business climate is an important determinant of private sector investment decisions. Attracting private sector involvement through PPPs to finance development in Tanzania will require further efforts to combat corruption in the country. It will also require clear messages from the Government of Tanzania on its policy stance towards macroeconomic management (JICA, 2015).
Improve financial intermediation to bolster access to private credit
The liberalisation of the banking and financial sector in Tanzania since the mid-1990s has broadened the array of opportunities available to actors within the economy to obtain credit and loans. Nevertheless, there remains scope to boost access to private credit, particularly for certain sectors, and further support the development of Tanzania’s capital market.
The generally poor performance of Tanzania’s financial sector as an intermediary points to an urgent need to improve financial intermediation in order to bolster private sector access to credit. This can be achieved by stepping up the removal of obstacles to lending and supporting greater competition in the banking system (IMF, 2006). The ongoing development of Tanzania’s credit reference system, originally established in 2012 and currently consisting of a databank housed at the Bank of Tanzania and two private credit reference bureaus, will also help to improve financial intermediation by further mitigating the lending risks faced by commercial banks in Tanzania.
Efforts to build trust within the private sector and between the financial sector and other sectors in the Tanzanian economy will also be important. In Tanzania, short term investment financing constraints arise mainly due to trust issues – both in terms of trust within the private sector and between the banking sector and other sectors in the country. The Tanzania National Business Council and the Tanzania Investors Round Table forum provide existing platforms from which to focus efforts to engage in further trust building.
A targeted, sectoral approach to loosening constraints in accessing credit could also be effective. Osoro (2010) has argued previously that credit should be provided on concessionary terms to sectors in the Tanzanian economy that boast above average employment multipliers. Three potential options are proposed in this regard: (i) expanding commercial banks’ lending activity; (ii) requiring banks to hold 20% of their assets in the form of loans to employment-intensive sectors; or (iii) enlarging Tanzania’s guarantee scheme (Osoro, 2010).
Finally, enhancing access to credit in the agriculture sector should be prioritised. Currently, only a small share of domestic private credit is channelled to agriculture – for instance, less than 5% of total bank loans in Tanzania are provided to the agriculture sector (ESRF, 2013). Boosting this share will require the introduction of risk mitigation mechanisms – such as guarantee and refinance facilities – that encourage
SUPPORTING THE PREPARATION OF TANZANIA’S SECOND FIVE YEAR DEVELOPMENT PLAN (FYDP II) 2016/17 – 2021/22
221
a greater number of financial institutions to engage with the sector (Bank of Tanzania, 2014). According to the Bank of Tanzania (2014: 17) an independent guarantee institution is required in order to “enhance the development impact of the Tanzania Agricultural Development Bank, by allowing it to focus on the financing [of] small holder farmers who cannot currently qualify for commercial loans.” It is argued that such a fund will benefit from being able to leverage finance available throughout the entire Tanzanian banking system (Bank of Tanzania, 2014).
Further develop domestic financial markets
In the wake of the international financial crises that have beset the global economy in recent years, the development of domestic securities markets has become increasingly topical. In the Tanzanian context, the further development of the government securities market can potentially provide a number of benefits. First, it would provide an additional avenue for funding budget deficits, thereby potentially assisting the government to avoid monetary financing of the deficit or building up foreign currency denominated debt (World Bank, 2015a). An additional benefit to developing the market for government securities is that it “can increase overall financial stability and improve financial intermediation through greater competition and development of related financial infrastructure, products, and services.” (World Bank, 2015a). In this sense, the development of a well-functioning government securities market in Tanzania has the potential to evolve the financial system from one that is dominated by commercial banks to one where capital markets complement financing available through the banking system.
A more developed capital market in Tanzania can provide an effective tool to finance industrial and human development in the country. For example, a more developed, liquid and well-functioning local currency bond market in Tanzania would boost the supply of alternative sources of financing and help to improve the allocation of capital, while also allowing for greater diversification of risks between domestic and foreign investors (Berensmann et al., 2015). The development of the local currency bond market in Tanzania can be supported by strengthening the institutional and regulatory environment in the financial sector, continuing to develop suitable financial infrastructure, broadening the investor base in the country, and creating a more liquid secondary market.
Local governments, government agencies and the private sector should also be encouraged to utilise the stock market to mobilise funding. For example, Tanzania could look to follow the example of the Kenyan Government and issue public infrastructure bonds to finance water, road, energy or other infrastructure development projects. In the Kenyan case, this approach laid a base for both private sector players and state-owned enterprises to issue corporate bonds with similar intentions (Berensmann et al., 2015).
At the same time, the Government of Tanzania should continue to work towards deepening the financial sector. This should include working with regulators and other key stakeholders – including the Bank of Tanzania, the Dar es Salaam Stock Exchange and the Capital Markets and Securities Authority – to improve product offerings provided by commercial banks in Tanzania.
INTERNATIONAL PRIVATE FINANCE
International private finance flows may stem from a variety of different sources, including FDI, bank lending, portfolio flows, remittances and philanthropy. Nevertheless, the core policy ingredients required to mobilise these types of finance are often common across the various sources.
Improve the quality of the business climate to make Tanzania more attractive as a destination for FDI
Complementary domestic policies play an important role in facilitating growth in international private sources of finance. For example, improvements to the business climate through structural and institutional reforms are likely to spur investment (IMF, 2014). Market-seeking investment decisions are influenced by institutional conditions, the macroeconomic situation, the availability of infrastructure and the regulatory framework in particular countries (IMF, 2006). These, and other factors, are fundamental elements of the quality of the business climate, and represent key determinants of the competitiveness of a country’s
SUPPORTING THE PREPARATION OF TANZANIA’S SECOND FIVE YEAR DEVELOPMENT PLAN (FYDP II) 2016/17 – 2021/22
222
production environment. For instance, the quality of physical infrastructure (particularly transport and energy infrastructure) and social infrastructure (such as education and health), together with macroeconomic stability and predictable leadership (especially in terms of how the government views the private sector’s role and contribution to industrialisation) serve as foundations for competiveness. In turn, access to finance, the quality of the legal and regulatory regime, and the skills of the workforce, are critical enablers of competitiveness.
Recognising this, the need to improve the business climate has assumed increasing priority in the Government of Tanzania’s policy agenda over the past five years. Aspects of the business climate that still require attention (in addition to the issues related to the tax system discussed above) include improvements to physical and social infrastructure, particularly in rural areas but also in key urban centres; better alignment across institutions; more streamlined regulations; the consolidation of overlapping functions that currently increase the cost of doing business; better access to finance and land; and labour laws that are more conducive to industrialisation. Improving these areas should form an integral part of the policy agenda in FYDP II. Elsewhere, we also discuss the importance of SEZ for attracting FDI.
Explore options for additional non-concessional borrowing and borrowing on commercial terms
Tanzania has historically relied heavily on grants to finance budget-related expenditure, but their influence in relative terms has been declining over time. This has been accompanied by a move towards concessional loans. Concessional borrowing and grants are expected to remain the primary sources of financing for development expenditure in Tanzania. Even so, the reality that it is becoming increasingly difficult to access concessionary loans in the current global environment, coupled with the scale of financing needs in the country, has prompted the authorities to explore additional sources of finance – including borrowing on non-concessional terms – in the past few years (World Bank, 2011).
As a result, although Tanzania’s previous Minister of Finance highlighted a preference for borrowing through concessional loans rather than commercial loans (due to the fact that the latter have to be repaid at market rates), the Tanzanian authorities have already drawn on non-concessional borrowing from domestic and international commercial banks to finance infrastructure development. For example, the Chinese government has provided finance to construct a gas pipeline from Mtwara to Dar es Salaam (Lunogelo, 2014). The Government of Tanzania may be forced to undertake a greater level of non-concessional borrowing in the future should it be unable to raise the level of finance required to fund development projects through other sources.
Commercial borrowing also represents a potential option for financing infrastructure investment at the local government level. Cochran et al. (2009) have previously noted the potential to pool loans for small LGA projects as a means of securitisation and to provide lower cost funding for new loans. They suggest that local revenue sources (user fees, for example) could be utilised to service the debt on some of these loans.
SUPPORTING THE PREPARATION OF TANZANIA’S SECOND FIVE YEAR DEVELOPMENT PLAN (FYDP II) 2016/17 – 2021/22
223
APPENDIX J – THE POLITICAL ECONOMY OF GROWTH AND INDUSTRIAL POLICY
THE POLITICAL ECONOMY OF GROWTH
Structural change and technological upgrading are at the heart of economic transformation. Inducing private producers to move into higher productivity sectors, however, will involve some combination of increasing the incentives they face and reducing their risks. As discussed in previous sections, governments can do this in a variety of ways. They can provide a stable political and macroeconomic environment, supply good infrastructure, and build strong human capital; they can promote the country and negotiate privileged access to markets abroad; they can supply access to finance, often on concessional terms, grant subsidies, or special tax exemptions; they can also shelter firms from competition by applying tariffs or quotas; and they can coordinate actors and inputs around specific economic sectors to help make investments in them a success. All of these are examples, broadly speaking, of industrial policies.
One of the effects of industrial policies is to allow firms to make higher profits than if those policies weren’t there; in other words, they allow firms to make an ‘economic rent’. Rents are often essential to stimulating the risky investments that are needed for structural transformation, technological upgrading, and growth (Khan 2000a, 2000b; Noman et al. 2011; Wade 1990; Whitfield 2011; Whitfield et al. 2015). But economic rents can also have a negative side. While access to rents can motivate producers to acquire new technologies, become more efficient, and grow, they can also encourage them to be complacent or lazy (Khan 2000a, 2000b; Krueger 1974). Consequently, industrial policy is only likely to be growth enhancing if it is accompanied by mechanisms for disciplining producers. Rents need to be withdrawn from firms who are not producing efficiently and converting their advantages into economic growth. Moreover, once firms have reached a certain level of maturity, they should be allowed to stand on their own feet. Industrial policy should play a very specific role in helping industries that have a latent comparative advantage to realise that potential; they should not be used to prop up forms or industries who have either lost that advantage, or show few signs of ever being able to achieve it.
Implementing a disciplined industrial policy of this type is not easy. The prospect of supernormal profits typically stimulates a process of ‘rent-seeking’ on the part of interested firms. They employ a variety of means, both legal—for example lobbying— and illegal—for example bribe-paying—to gain and maintain access to rents (Khan 2000a, 2000b; Krueger 1974). Consequently, an effective industrial policy requires a government that does not allow these kinds influences to divert it from the single-minded goal of efficiency and growth. Moreover, it is important to stress that having good industrial policies on paper is not normally sufficient to stimulate investment, or at least not large amounts of investment. In addition, firms must be reasonably confident that the government will deliver on its promises. Government must provide a ‘credible commitment’ to investors that its polices will be implemented and that the firms will be able to realise the advantages the policies provide for (North 1993).
INDUSTRIAL POLICY ‘DEALS’ AND ECONOMIC GROWTH
Some policies, for example political stability, cutting red tape, or sound macroeconomic policy lend themselves to an economy-wide implementation. Others, such as human capital development, or granting tax exemptions, can be applied more narrowly to specific sectors, or even specific firms. For a variety of reasons, some political, some bureaucratic, developing country governments often prefer the latter, and there is evidence to suggest that these ‘closed’ deals can be a good means of stimulating investment and growth in the short term (Pritchett and Werker 2012; Sen 2012). However, one of the unfortunate consequences is that these privileged firms often attempt to pull the ladder up behind them, preventing other firms from acquiring the same advantages. This shields them from competition, and actually reduces their incentive to innovate and invest. Another consequence is that the economy becomes overly dependent on a few firms or sectors, and thus vulnerable to economic shocks. Indeed, there is some evidence that countries which base their industrial policy on granting favours to a few well-connected firms
SUPPORTING THE PREPARATION OF TANZANIA’S SECOND FIVE YEAR DEVELOPMENT PLAN (FYDP II) 2016/17 – 2021/22
224
tend to experience an erratic, boom and bust pattern of growth. Most of the gains from periods of expansion are subsequently wiped out in periods of contraction, meaning that per capita incomes remain low (Pritchett and Werker 2012; Pritchett et al. 2014).
Although industrial policy may profitably begin by privileging just a few specific firms, maintaining growth requires that it expands over time to benefit all firms that wish to enter a sector, and, eventually, to all firms that might invest in the economy generally. For example, a fast track through bureaucratic red tape first applied to just a single investor, perhaps informally, should be expanded so that it benefits all the potential firms in a sector, and should lead, eventually, to a well-functioning investor-friendly bureaucracy across the board. Analysts have described this as a shift from closed to open deals, or from relationship-based to rules-based governance (Moore and Schmitz 2008; Pritchett and Werker 2012).
INDUSTRIAL POLICY AND THE POLITICAL SETTLEMENT
Evidence suggests that politicians typically move from actions that privilege just a few firms, to policies that nurture an entire sector, when they believe that their political survival depends on the growth of that sector. The success or failure of the resulting policies will then depend on whether they are able to create a ‘pocket’ of bureaucratic expertise around that sector, and where business is able to organize effectively and represent its interests to the bureaucracy. The state must be able to understand and respond to the needs of business, without being captured by it (Whitfield and Therkilsden 2011; Whitfield et al. 2015). Whether or not the state is willing and able to do this hinges on the nature of what experts have called, the ‘political settlement’. It is the balance of power among organized groups in society, between the ruling coalition and its own supporters on the one hand, and the ruling coalition and its opponents on the other, which will largely determine whether it has the strength to create a competent pocket of bureaucratic effectiveness and shield it, and business, from rent-seeking and other political pressures. In countries where the ruling coalition is strong vis a vis its own supporters and opponents, it is easier to create and sustain such pockets; where it is weak, this is more difficult (Khan 2010; Whitfield et al. 2015).
The ability to provide good, business-friendly institutions across the board, such as an efficient bureaucracy and rule of law, is typically a much longer term project, and requires significant resources, which are usually the outcome not the precursor of economic growth. As the economy becomes more developed, businesses typically become more politically powerful, and begin to lobby for more business-friendly policies across the board, creating a positive feedback loop between growth and institutional change. However, those loops are more likely to be positive in some types of economy than others. In areas like construction, energy, transport, or import-substituting industries, domestic investors often stand to gain from ‘closed deals’ and captive markets. Instead of trying to expand the benefits they receive to others, will benefit instead from pulling up the ladder behind them. Similarly, exporters who depend for the success of their business on grants of land or licenses to exploit mineral resources, may be happy enough with particularistic policies, negotiating individually with the bureaucracy to get the services they need, and working out of economic enclaves. Manufacturing firms, by contrast, are usually smaller, and rarely have enough individual clout to affect government policy in this way. They are more likely to band together in an association and press for changes, such as cheaper power or better infrastructure that benefit the entire sector, and may even spill over to other industries. This is even more the case for small-scale domestic producers, for example farmers or informal sector businesses, who, if they are able to organize, are more likely to press for changes that are general in nature, for example simpler business registration and taxation policies, and therefore beneficial to broad sectors of the economy (Pritchett and Werker 2012).
WHAT MAKES FOR GOOD INDUSTRIAL POLICY?
The literature clarifies that industrial policy can be important in theory. Industrial policy can help to address market and co-ordination failures (te Velde and Morrissey, 2005). The process of innovation involves learning, institutional development and systematic interactions between various actors (Nelson, 1993) and is beset by a range of market, co-ordination (Rodenstein-Road, 1943) and government failures. Market and coordination failures are prevalent in areas such as skills development, technological development and knowledge externalities (Pack and Westphal, 1986; Lall, 2001), infrastructure provision, and capital markets (Stiglitz, 1996). Co-ordination failures also operate between linked firms, in clusters of firms and
SUPPORTING THE PREPARATION OF TANZANIA’S SECOND FIVE YEAR DEVELOPMENT PLAN (FYDP II) 2016/17 – 2021/22
225
relating to the economy as a whole and might prevent an economy from reaching a higher development path (Rodrik, 1996). The debate has never been about whether such market failures existed but to what extent they do.
Many decades of experience in promoting industrialisation around the world clearly show that there are certain types of industrial policies to avoid, i.e. those that pick and choose particular firms rather create the broad conditions for winners in a sector or larger part of the economy, those that are not time bound and do not require improved performance, those that heavily distort private investment incentives, or involve Government getting directly involved with investors, and those that are not implemented consistently over time. Instead, the government can add most value by providing a predictable and conducive business environment for investment, for both national and foreign, small and large, in all regions. Targeting activities only works if this is governed by effective state-business relations that involve adequate capacity in both public and private sectors, transparent and reciprocal relationships and absence of collusive behaviour.
More specifically, Rodrik (2004) lists a number of design principles for effective industrial policy:
Incentives should be provided only to ‘new’ activities
There should be clear benchmarks/criteria for success and failure
There must be a built-in sunset clause
Public support must target activities, not sectors
Activities that are subsidised must have the clear potential of providing spill-overs and demonstration effects
The authority for carrying out industrial policies must be vested in agencies with demonstrated competence
Implementing agencies must be monitored closely by a principal with a clear stake in the outcomes and who has political authority at the highest level
The agencies carrying out promotion must maintain channels of communication with the private sector
Optimally, mistakes that result in ‘picking the losers’ will occur
Promotion activities need to have the capacity to renew themselves so that the cycle of discovery becomes an on-going one.
The debate on industrial policy has evolved considerably over the past decades. From the 1950s to the 1980s, the structuralists (following e.g. Hans Singer and Raul Prebisch) suggested a policy of import substitution to promote heavy manufacturing and reduce commodity dependence. By the 1990s, it had become clear that the suggestions from the structuralists led to practical problems and the Latin American debt crisis followed. The Washington Consensus emerged which suggested a range of key market policies which did not foresee a role for industrial policies. Indeed, the World Banks’s World Development Report 2005 on the Investment Climate did not mention the term industrial policy; instead it contained a long list of investment climate reforms that would need to be undertaken, although the theoretical underpinning often remained weak. This consensus also ran into problems because some countries that followed these policies (several Latin American countries) grew unsatisfactorily, whilst others that did not follow these policies (China, Vietnam) grew rapidly.
The 2008 Growth Commission report marked some change. Its review of successful experiences of growth, mentioned, for example, the key role played by leadership in promoting economic growth, along four other key ingredients of growth. Hausmann et al (2008) made a significant further step, by emphasising that the binding constraints to growth are country specific. Using a growth diagnostic tree, the method identifies whether growth is held back either by high costs of financing or by low returns to a project. An interesting feature of this model is that appropriate policies to overcome binding constraints are almost by definition targeted at specific issues, often requiring specific industrial policies (whether it is to enhance skills, or place infrastructure etc.) and political economy considerations.
SUPPORTING THE PREPARATION OF TANZANIA’S SECOND FIVE YEAR DEVELOPMENT PLAN (FYDP II) 2016/17 – 2021/22
226
Lin and Monga (2011) discuss ‘the role of the state in the dynamics of structural change ’ and they provide a practical procedure to identify and facilitate growth through a six-step procedure for growth identification and facilitation. The process is based on Lin’s work on structural economics i.e. select industries in comparable countries, identify constraints to technological upgrading of existing domestic firms, attract new firm, scale up of the successful private innovations in new industries, build SEZs or industrial parks, compensate pioneer firms. However, whilst the key ingredients of growth are known (as argued in the Growth Commission), and Lin and Monga (2011) suggest that a recipe is close as well, there are severe challenges in finding good cooks: which individuals and organisations can support and engineer the growth process?
Recently a range of new policy insights have emerged on promoting growth, some of which are general in nature and others are more specific. Common to both types is the fact that they all seem to argue for a more pragmatic (between the extremes of free market and centrally led concepts of growth) and gradual approach. Page (2012) discusses three ways for promoting economic growth: tilting production towards exports, supporting agglomerations, and attracting and building firm capabilities. Sutton’s enterprise maps and follow up work suggest a pragmatic role for Investment Promotion Agencies in “fixing broken wheels in the economy”. Bloom and Van Reenen (2010) argue that the quality of management is key for firm productivity suggesting management training is important. Woodruff (2014) argues that productivity differs across product lines and provides evidence that supervisor training increases performance.
What has also become clear from the experience of a range of countries (te Velde et al, 2015) that have achieved a turn-around in economic transformation, is the importance of emphasising global competitiveness, even in a large economy with a growing domestic market. A number of successful economic developers, many in East Asia, have striven to benchmark their performance to global standards, whether by exporting or by opening their national economies to bracing external competition to drive out unproductive firms in favour of productive ones. Notably in Korea, allocating credit selectively to these productive firms played a key role, along with the use of performance criteria to provide time bound incentives.
Much of the literature points to the importance of policies to actively support the growth process. All of the approaches above however require a high quality institutional setting for policies to work properly – one where the state and business can interact to agree on the best direction for the economy. The question is no longer whether industrial policy is important, but rather how to use such policies and to examine the institutional setting that determines the design and implementation of good policies.
What makes for effective state–business relations (SBRs)? Evans (1995) discussed “embedded autonomy” in which the public and private sectors form a strategic relationship. Following the contributions by Evans (1995) and Maxfield and Schneider (1997), good SBRs tend to be based on benign collaboration between business and the state, with positive mechanisms that enable transparency, ensure the likelihood of reciprocity, increase credibility of the state among the capitalists and establish high levels of trust between public and private agents.
Rodrik (2004) lists three key elements for an appropriate institutional architecture: (i) political leadership at the top; (ii) co-ordination and deliberation councils; and (iii) mechanisms of transparency and accountability. Rodrik has also argued that developing countries should be aiming for second best institutions (Rodrik, 2008) which means that developing countries should not be aiming for ‘best-practice’ institutions as used in developed countries but rather institutions that take into account both the local context as well as issues that cannot be quickly resolved.
More recently, Rodrik has developed (see McMillan and Rodrik, 2013) these key elements into three prerequisites required to promote policy reform i.e. embeddedness, discipline and accountability. Of these, the principle of embeddedness is the one most relevant to the SBR discussion as it refers to the idea that policy makers must be close enough to the ‘real’ economy in order to have the right information and seize

SUPPORTING THE PREPARATION OF TANZANIA’S SECOND FIVE YEAR DEVELOPMENT PLAN (FYDP II) 2016/17 – 2021/22
227
potential opportunities. Such close links require the right institutions that promote exchange between policy makers and the private sector i.e. institutions that set up the groundwork for strategic collaborations between businesses and the state. Page (2013) argues that effective SBRs depend on commitment, focus, experimentation and feedback.
SUPPORTING THE PREPARATION OF TANZANIA’S SECOND FIVE YEAR DEVELOPMENT PLAN (FYDP II) 2016/17 – 2021/22
228
APPENDIX K – LINK TO BRN
BACKGROUND
In 2010, the President’s Office Planning Commission (POPC) conducted a study into Tanzania’s progress toward the Tanzania Development Vision 2025, which is the government’s overarching development policy goal. It found that although ministries, departments and agencies (MDAs) all had action plans for TDV2025, these plans were not generally being implemented in an organised manner, targets often went unmet due to implementation bottlenecks, and there was a lack of accountability for delivering outcomes, particularly where tasks required budgetary and implementation coordination between more than one MDA.
The President challenged the Planning Commission to provide a solution. It responded with the Long-Term Perspective Plan, providing an implementation framework in the shape of three 5-year plans, designed successively to i) Unleash Tanzania’s growth potential, ii) Nurture an industrial economy; and iii) Attain export growth and competitiveness.
Concurrently, the POPC looked for a systematic delivery methodology that would increase discipline, focus, and accountability for this goals. After various consultations, the government decided to adopt Malaysia’s ‘Big Fast Results’ 8-Steps of Transformation Methodology, adapting it for the Tanzanian context as, ‘Big Results Now’ (BRN) (Tanzania Development Vision 2025 n.d.).
HOW BRN WORKS
The BRN delivery methodology is a highly adaptive, flexible way of delivering results. Its eight steps involve: 1) Setting a clear and distinct strategic direction, 2) Conducting comprehensive ‘labs’ sessions, 3) Organising an open day, 4) Publishing a clear and comprehensive roadmap, 5) Setting Key Performance Indicators and targets, 6) Implementing the initiatives, 7) Conducting third-party review and validation, and 8) Publishing an annual report. The methodology is facilitated by an institutional architecture comprised of a Transformation and Delivery Council chaired by the President, a President’s Delivery Bureau (PDB) within the Office of the President, Steering Committees comprising key stakeholders and chaired by a relevant Minister, and Ministerial Delivery Units (MDUs).
BRN sets its strategic direction by choosing a limited number of National Key Results Areas (NKRAs). NKRAs are chosen by the President and Cabinet, in consultation with the PDB and MOFP, and following a rigorous process of research and consultation to assess the expected impact of various potential social or economic projects, examining factors such as expected number of beneficiaries, change in quality of life, and ease of implementation. The Planning Commission, supported by external technical advisors, then further prioritises the critical issues to be resolved within each sector, before moving to the second, ‘lab’ phase.
Lab sessions are problem-solving platforms in which all relevant stakeholders are engaged in a common space to participate in an intense discussion session over six weeks. Among the purposes of the lab is to set targets, trajectories, and baseline benchmarks for each priority sector; to set action plans with key milestones, specific implementation steps and clear accountabilities; to establish funding requirements and sources; and to secure senior stakeholder buy-in through intense periodic ‘syndication’ sessions.
Lab sessions are followed by an open day, in which the government shares information about the findings and recommendations of the lab session with stakeholders, beneficiaries and the public. Final Lab Reports are then converted into a Roadmap which identifies the targets, delivery period, and implementers for each NKRA. This is followed by the setting of Key Performance Indicators against which an NKRA’s progress can be measured, with each NKRA Minister being assigned a Scorecard. The Scorecard is the topic for discussion between the President and the Minister during bi-annual ‘Presidential Performance Dialogues’.
SUPPORTING THE PREPARATION OF TANZANIA’S SECOND FIVE YEAR DEVELOPMENT PLAN (FYDP II) 2016/17 – 2021/22
229
The methodology then moves to its implementation phase. The key agencies here are the President’s Delivery Bureau and the Ministerial Delivery Units, which work together to ensure implementation and execution of NKRA initiatives at line item level, monitor and evaluate performance, and facilitate problem solving and solution generation. The Delivery System ‘sets a cadence and environment in which results ‘must’ be achieved. Monitoring, evaluation and reporting mechanisms include an Implementation Tracking Tool, KPI Dashboard, and Presidential Performance Dialogue. Problem solving platforms include MDU Weekly Problem Solving Meetings, NKRA Steering Committee Meetings; and monthly Inter-Ministerial Technical Committee Meetings. At the apex of the escalation system is the Transformation and Delivery Council, chaired by the President.
In the seventh step, an independent professional services firm is contracted to provide a quantitative assessment of BRN’s performance, while an international panel of experts convened by the President provides a qualitative assessment. The results are published in Step 8, the Annual Report (Tanzania Development Vision 2025 n.d.).
As we saw in Chapter 9 of this report, industrial policy initiatives typically involve complex vertical and horizontal coordination problems that span the public and private sector, the ability to think politically, and solve problems iteratively. On the face of things, BRN has the potential to deliver.
BRN ACTIVITIES
BRN chooses its priorities in waves. In Wave 1, Agriculture, Education, Energy, Resource Mobilization, Transport and Water were identified as NKRAs, and each was given a series of ‘topline targets’ to achieve.
Agriculture was to establish 25 commercial farming deals for paddy and sugarcane, develop 78 professionally managed collective rice irrigation and marketing schemes, and establish 275 collective warehouse-based marketing schemes to provide farmers with access to market.
Education was to improve pass rates in primary and secondary schools to 60% in 2013, 70% in 2014 and 80% in 2015.
Energy was to improve transmission lines, construct 14 new energy projects and make 590,000 new connections.
Resource Mobilisation aimed, among other things, to implement 6 trillion worth of projects via private project funding by 2015/16, cap non BRN expenditure to TZS 17.7 trillion, and reduce the budget deficit by TZS 4 trillion.
Transport aimed to increase cargo throughput through Dar es Salaam port to 18 million tones, increase railway freight from 0.2 million tons to 3 million tons, and reduce road travel time between Dar es Salaam, Mwanza, Rusumo and Kabanga from 3.5 to 2.5 days. Water aimed to increase the number of rural Tanzanians with access to clean water from 40% to 67%.
Even before the end of its first year, BRN had expanded to include a Second Wave of six projects centred on improving aspects of the business environment, namely: i) Access to land and security of tenure, ii) Contract enforcement, law and order, iii) Curbing corruption, iv) Labour laws and skillset, v) Aligning regulations and institutions, and vi) Taxation, multiplicity of levies, fees, and charges. The private sector participated actively in the setting of these NKRAs, and Regional Delivery Units were established to help improve implementation (Tanzania Development Vision 2025 2015, n.d.).
Later, a Third Wave of NKRAs was added in Health.
BRN PERFORMANCE
Over the first year of implementation, all the NKRAs were adjudged to have made demonstrable progress, with the average KPI achievement standing at 72% (Tanzania Development Vision 2025 2015).
SUPPORTING THE PREPARATION OF TANZANIA’S SECOND FIVE YEAR DEVELOPMENT PLAN (FYDP II) 2016/17 – 2021/22
230
Consultations with BRN staff suggest that it has performed best when implementing projects with a strong lead ministry and a minister that has fully internalised the methodology. Water is widely regarded as one of the most successful NKRAs precisely for those reasons. The Minister for Water was also able to obtain buy-in and sign performance contracts with another Ministry, PMO-RALG, which manages local water staff, something of a triumph for horizontal and vertical coordination. BRN has apparently had less impressive results in areas that require more extensive inter-ministerial coordination, with unclear accountability lines arguably a part of the problem. It has had even less success in areas that involve public-private partnerships. The reasons are various and depend in part on changing old habits and mentalities in both the public and private sectors. Financing has also been a consistent problem for several NKRAs. It is not clear whether this is a simple question of political commitment and coordination, or whether it reflects deeper seated problems in Tanzania’s public finances, in which arrears are growing.
Progress on the Second Wave NKRAs has been slow. Apparently labs were conducted in a compressed fashion, partly because of the inability of private sector stakeholders to devote an entire six weeks to them. Further, the labs fell in a period when relevant ministers were preoccupied with the constitutional review process, and some failed to attend. Consequently, a considerable amount of time was required to refine priority areas and targets post-lab. Subsequently, implementation also ran into the election period, during which ministers and civil servants were again otherwise engaged.
Finally, BRN has suffered sometimes from a lack of commitment from the top. The TDC, for example, has not met for over a year.
BRN AS AN IMPLEMENTING AGENCY FOR MOFP
Although on the face of things, BRN is exactly the kind of agency Tanzania needs to implement some priority areas within FYDP II, this brief appraisal of its performance suggests that certain aspects of its operation will need to be adapted or improved if it is to be a credible partner for the MOFP. More forceful support from the top; timely disbursal from the Ministry of Finance; more vigorous inter-ministerial coordination, and a more innovative approach to public private partnerships seem essential.
BRN may also need to learn to work in a more politically savvy and flexible way. As we have seen, industrial policy creates winners and losers, both of which may attempt to subvert the legal system in order to further their interests. It is not obvious that BRN’s labs, in which all known stakeholders sit down face to face, are necessarily the best way to manage the political struggles that surround industrial rent creation. In the first place, not all the salient players will necessarily wish to attend such events, since they prefer to operate in the shadows. Further, even if they do attend, they may not reveal their true hands in such a public setting. Building coalitions to successfully implement industrial policy may sometimes involve working in a more covert way.
The entire spirit of BRN, as the name suggests, is about fast, visible results. But successful industrial policy takes time. Putting all the inputs in place for a world class Special Economic Zone, for example, may take several years. It may take even longer before the first firms have begun to populate the zone and have successfully begun to export. And it may take even longer before successful industrial clusters have grown up in and around the zone. Although a long-term process such as this can certainly be broken up into discrete, shorter term milestones, the big results may only be visible in the medium to long term.
Currently BRN is closely associated with the Office of the President and it depends on the authority of the President to deliver results. However, some of the industrial projects with which it is likely to be associated may not bear fruit within the lifetime of a particular Presidency, creating a potential incentive and accountability problem.
BRN has in the past prioritised projects according to their probable impact, and their relative ease of implementation, adopting a balanced portfolio of projects, with some providing quick and easy wins, and others taking somewhat longer to bear fruit, but with major implications for sustainable development. It is
SUPPORTING THE PREPARATION OF TANZANIA’S SECOND FIVE YEAR DEVELOPMENT PLAN (FYDP II) 2016/17 – 2021/22
231
worth noting that most industrial policy initiatives will be comparably difficult to implement, and, as mentioned above, comparatively long in gestation.
DETERMINING PRIORITIES
The Planning Commission is a think tank in the President’s Office tasked with strategic thinking on the national economy, and with providing advice to the government on medium and long-term strategies for economic development. Historically, the POPC in Tanzania has assisted the government in setting broad strategic or macro-level priorities, while BRN has been concerned with the nitty gritty of micro-level implementation. These respective areas of expertise should continue. However, there is a meso level where the expertise of both the MOFP and BRN, together with the political judgement of the President and Cabinet, are important and overlapping. The MOFP, BRN and the Cabinet must sit down together to narrow the MOFP’s long list of priorities into NKRAs, and then further work must be done to discover implementable projects and targets for the NKRAs. As an input to this process, more research may need to be commissioned into the probable impact of various potential projects, and also the ease of implementation, with the latter paying due attention to political economy issues. Chapter 9, and the table at the end is one specific input into this process.