tanzania: productive jobs wanted - world bank · pdf filetanzania: productive jobs wanted ......
TRANSCRIPT
September 2014 www.worldbank.org/tanzania
TANZANIA:
PRODUCTIVE JOBS WANTED
Pub
lic D
iscl
osur
e A
utho
rized
Pub
lic D
iscl
osur
e A
utho
rized
Pub
lic D
iscl
osur
e A
utho
rized
Pub
lic D
iscl
osur
e A
utho
rized
Pub
lic D
iscl
osur
e A
utho
rized
Pub
lic D
iscl
osur
e A
utho
rized
Pub
lic D
iscl
osur
e A
utho
rized
Pub
lic D
iscl
osur
e A
utho
rized

i
TABLE OF CONTENTS Acknowledgments ........................................................................................................................................ vi
Abbreviations and Acronyms ...................................................................................................................... vii
EXECUTIVE SUMMARY ................................................................................................................................. 1
INTRODUCTION .......................................................................................................................................... 11
PART 1: SETTING THE STAGE: Productive firms create productive jobs .................................................... 15
1.1. Why do Jobs matter? .................................................................................................................. 15
1.2. How do we create productive jobs? ........................................................................................... 21
1.3. What do Tanzanian businesses look like? ................................................................................... 24
1.3.1. Characteristics of small non-farm businesses ..................................................................... 25
1.3.2. Characteristics of farms and agriculture ............................................................................. 29
1.3.3. Characteristics of formal exporters ..................................................................................... 33
1.4. Concluding remarks and next steps ............................................................................................ 36
PART 2: DRIVERS OF CHANGE: What makes firms create jobs? ................................................................ 37
2.1 Which firms create jobs? ............................................................................................................ 37
2.1.1. Dynamic non-farm businesses ............................................................................................ 38
2.1.2. Dynamic farms .................................................................................................................... 42
2.1.3. Dynamic exporters .............................................................................................................. 49
2.2 What ingredients produce successful firms? .............................................................................. 52
2.2.1. Connectivity ........................................................................................................................ 53
2.2.2. Access to finance ................................................................................................................. 60
2.2.3. Skills and Education ............................................................................................................. 71
2.2.4. Labor market competitiveness ............................................................................................ 75
2.2.5. Administrative burden ........................................................................................................ 79
2.2.6. Innovation and technology ................................................................................................. 83
2.2.7. Access to affordable electricity ........................................................................................... 88
2.2.8. Land development .............................................................................................................. 89
2.3. How can Tanzania cultivate productive firms? ............................................................................ 91
2.3.1 Clusters as a means to promote economies of scale .......................................................... 91
2.3.2 Regional Integration .......................................................................................................... 103
2.3.3 Foreign Direct Investment ................................................................................................. 108
2.3.4 Technological breakthroughs ............................................................................................ 111
ii
2.4. Concluding remarks and next steps .......................................................................................... 117
PART 3: TOWARD AN ACTION PLAN TO CREATE JOBS ............................................................................. 119
3.1. Pillar 1: Pushing the development of productive small non-farm businesses .......................... 123
Action 1: Building owner assets ........................................................................................................ 125
Action 2: Access to basic infrastructure for connectivity .................................................................. 130
Action 3: Reduce the burden associated with excessive administrative procedures and insecurity 131
Action 4: Achieving economies of scale ............................................................................................ 134
Sector Focus: Light manufacturing —Leather ................................................................................... 139
3.2. Pillar 2: Improving agricultural productivity ............................................................................. 145
Action 5: Improve connectivity and market access .......................................................................... 147
Action 6: Enhancing the use of quality inputs .................................................................................. 151
Action 7: Promote equity and efficiency through market based mechanisms ................................. 154
Action 8: Ensure transparency and consistency in Government policies ......................................... 159
Sector Focus: Agribusiness—High-value vegetables and fruits ........................................................ 161
3.3 Pillar 3: Moving to Export Markets ........................................................................................... 166
Action 9: Breaking the trap of informality ........................................................................................ 166
Action 10: Enhancing quality at production ...................................................................................... 174
Action 11: Improving connectivity and access to markets ................................................................ 181
Action 12: Think regional .................................................................................................................. 188
Sector Focus: Potential opportunities but tourism as a safe bet ..................................................... 194
3.4 Concluding remarks and next steps .......................................................................................... 204
List of Figures Figure 1: Tanzania’s rapidly growing labor force corresponds with slow decline in poverty ...................... 17 Figure 2: Tanzania has one the lowest earnings per worker in the world .................................................. 17 Figure 3: The skill composition of the Tanzanian labor force is equivalent to one for Thailand in 1975 .... 20 Figure 4: Drivers of jobs in Thailand – SME creation, agricultural employment and exports ..................... 22 Figure 5: One of the highest entrepreneurship rates in the world ............................................................ 25 Figure 6: The predominance of self-employment and young firms ........................................................... 26 Figure 7: Bigger and more non-farm businesses along economic development ........................................ 28 Figure 8: The fastest growing sectors in Tanzania, % change in the number of firms between 2008/9 and 2010/11 ....................................................................................................................................................... 29 Figure 9: Agricultural output and total factor productivity, 1961-2006 ...................................................... 30 Figure 10: Tanzania economic structure and agricultural GDP composition .............................................. 31 Figure 11 : Share of crop in total production value – top 10 crops, 2010/11 ............................................. 32 Figure 12: The surge in exports during the 2000 by categories. ................................................................. 34
iii
Figure 13: Crop Productivity in East Africa and China ................................................................................. 43 Figure 14: Drivers of agricultural productivity ............................................................................................ 47 Figure 15: Fertilizer use and distance ......................................................................................................... 48 Figure 16: Key Factors that Raise Firm’s Probability to Export (Export Propensity) ................................... 50 Figure 17: Key Factors that Raise a Firm’s Ratio of Exports to Total Sales in % (Export Intensity) .............. 50 Figure 18: Trading costs and distance are closely correlated ...................................................................... 58 Figure 19: Use of a Bank Account –an international comparison ............................................................... 70 Figure 20: Skills that are extremely hard to find in Tanzania (% firms) ....................................................... 74 Figure 21: The relatively high taxation of labor in Tanzania (effective marginal tax rates, %) .................... 78 Figure 22: If you were an investor, how would you feel about investing in Tanzania? ............................... 80 Figure 23: The complexity of the tax and administrative regimes for three selected sectors .................... 81 Figure 24: Regional comparison of innovation performance ..................................................................... 84 Figure 25: Concentration among Formal Manufacturing Industries, ISIC Two-Digit Level, Tanzania 2007 87 Figure 26: Electricity is the most severe constraints for Tanzanian businesses .......................................... 88 Figure 27: Operating Costs of Tanzanian firms............................................................................................ 89 Figure 28: Backward and Forward Linkages in Tanzania – the opportunities linked to services ............... 97 Figure 29: Labor requirements are considerably higher for vegetables than for cereals ........................... 97 Figure 30: Tanzanian firms naturally concentrate in selected locations ..................................................... 99 Figure 31: Vertical Integration in the Bakhresa Group .............................................................................. 102 Figure 32: The surge in transit trade ......................................................................................................... 105 Figure 33: Matching domestic and regional imports ................................................................................ 106 Figure 34: Insecurity at the borders .......................................................................................................... 107 Figure 35: Key elements in a typical staples value chain .......................................................................... 108 Figure 36: Mobile financial services (M-Pesa, Z-Pesa, etc.) use by quarter, 2010/11............................... 114 Figure 37: Mobile money use of farmers – purposes, 2010/11 ................................................................ 115 Figure 38: Growth opportunities for Tanzanian exports in leather .......................................................... 145
List of Tables Table 1: Export Growth Decomposition of Tanzania, Kenya, and Uganda: 2000-2010 ............................... 34 Table 2: Main products exported by Tanzanian firms during the last five years ......................................... 35 Table 3: Profits by non-farm businesses ( TZS)............................................................................................ 40 Table 4: The main determinants of profits for non-farm businesses (pooled model) ................................ 41 Table 5: Explanatory factors of agriculture productivity in Tanzania (by Crop) .......................................... 45 Table 6: Distance and input use .................................................................................................................. 48 Table 7: Size matters for exporters – but less so for regional trade ........................................................... 51 Table 8: Factors that affect growth of firms ................................................................................................ 53 Table 9 : Service availability in rural communities ...................................................................................... 55 Table 10: Farmers’ choose the type of crops to grow depending on their location ................................... 57 Table 11: Comparison of port efficiency for containers between Dar-es-Salaam and Mombasa, May-June 2012 ............................................................................................................................................................ 59 Table 12: The global cost associated to the port inefficiency in 2012 ($million equivalent) ...................... 60 Table 13: Characteristics of non-farm businesses by access strand category ............................................. 62 Table 14: Market share of MFIs in Tanzania ................................................................................................ 63 Table 15: Village banks, their characteristics and examples ...................................................................... 64 Table 16: Enabling environment indicators across countries ...................................................................... 68 Table 17: A snapshot of education levels and earnings in Tanzania ........................................................... 71

iv
Table 18: Monthly Wages in Light Manufacturing, by Skill Level, Five Countries (in US$) ......................... 76 Table 19: Labor Productivity in Light Manufacturing Sectors, Five Countries ............................................ 76 Table 20: Business cost of employing workers ............................................................................................ 77 Table 21: Innovation and firm performance ............................................................................................... 84 Table 22: Competition spurs innovation ..................................................................................................... 86 Table 23: Revealed comparative advantage in Tanzania’s exports for 2009 ............................................... 93 Table 24: Top 30 Products Tanzania Does Not Export with Highest Proximity to Current Export Basket ... 95 Table 25: Matching import and exports, US$ Million, average 2008-11 .................................................... 96 Table 26: Ownership of ICT and transportation assets, 2008/09 and 2010/11 ....................................... 113 Table 27: Cell phones, productivity, and commercialization – descriptive evidence, NPS 2008/09 and 2010/11 ..................................................................................................................................................... 115 Table 28: Summary of actions ................................................................................................................... 121 Table 29: Skills Needed by Self-Employed................................................................................................. 126 Table 30: Top 30 merchandise exports from Tanzania to EAC markets .................................................... 193 Table 31: Matrix for specific reform actions in the tourism industry ........................................................ 197 Table 32: Tourism Spatial and Product Diversification: Policy Actions ...................................................... 201
List of Boxes
Box 1: Business as usual will not be sufficient to catch up with emerging countries ................................. 19
Box 2: Small non-farm businesses as a vector of employment: Let the numbers speak ............................ 23
Box 3: 8 Facts about firms operating in Tanzania ........................................................................................ 26
Box 4: Mama Rosa’s Hair Salon: Location, skills, and networking (and only sometimes bribing) .............. 38
Box 5: Who creates new businesses? ......................................................................................................... 39
Box 6: Commercialization through partnerships ........................................................................................ 42
Box 7: Dynamic exporters: A maturing process through innovation and diversification ........................... 49
Box 8: Complexity of the tax regime on businesses .................................................................................... 81
Box 9: A brief history of the development of Special Economic Zones in Tanzania .................................. 100
Box 10: EAC as an integrated trade community ........................................................................................ 103
Box 11: Destination markets for new products ......................................................................................... 103
Box 12: The views of Chinese investors .................................................................................................... 109
Box 13: How Reuters Market Light generates hyperlocalized information ............................................... 111
Box 14: Growing small businesses in an environment of distrust............................................................ 124
Box 15: The Senegalese experience .......................................................................................................... 127
Box 16: Tanzania Virtual Business Incubator (VBI) .................................................................................... 127
Box 17: Micro-franchise Against Malaria in Kenya .................................................................................... 128
Box 18: Pilot Project - Promoting small informal businesses with the Ilala Municipal Council ................ 129
Box 19: World Bank Lagos Urban Transport Project ................................................................................. 131
Box 20: Simplifying business registration procedures at the municipal level ........................................... 132
Box 21: Successful microfinance models in Tanzania................................................................................ 136
Box 22: Lobbying for better standards by All Island Three-Wheeler Drivers’ Welfare Association .......... 137
Box 23: Featured Business Incubators in Africa ........................................................................................ 138
v
Box 24: Swahiliwood- Tanzania’s movie industry as a growing niche ....................................................... 139
Box 25: The production of a pair of shoes is cheaper in Tanzania than in China ...................................... 142
Box 26: Ethiopian Rural Travel & Transport Program (ERTTP) .................................................................. 149
Box 27: Warehouse Receipt System .......................................................................................................... 150
Box 28: Irrigation - value for money .......................................................................................................... 152
Box 29: National Agricultural Input Voucher Scheme (NAIVS) ................................................................. 153
Box 30: Potential of the COMESA Green Pass initiative ............................................................................ 154
Box 31: Access to information through ICT ............................................................................................... 156
Box 32: Access to finance and micro-insurance through ICT .................................................................... 156
Box 33: Contract farming in the Sugar industry in Tanzania ..................................................................... 157
Box 34: Southern Agricultural Growth Corridor of Tanzania (SAGCOT) .................................................... 158
Box 35: Government Commitment as a key to success in land reform in Ethiopia .................................. 161
Box 36: The Main Constraints in Wheat Milling ........................................................................................ 163
Box 37: High value vegetables in Tanzania - the seeds of a competitive cluster ...................................... 165
Box 38: Equity for Africa – Leasing to SMEs .............................................................................................. 169
Box 39: The Bankque Misr microcredit program in Eqypt ........................................................................ 171
Box 40: Export promotion done well, by ProChile in Chile ....................................................................... 173
Box 41: Addressing Coordination Failures in Taiwan’s cordless telephone industry ................................ 174
Box 42: Lack of standards leads food producer to import inputs ............................................................. 175
Box 43: Pharmacy Accreditation Programs for Informal Retail Operators – Tanzania .............................. 175
Box 44: Training programs based on public/private partnerships: The Kenya experience ....................... 178
Box 45: Potential for gains from joint infrastructure in Fishing Industry .................................................. 180
Box 46: Opportunities for Government to address coordination failures ................................................ 181
Box 47: How to improve the port efficiency ............................................................................................. 182
Box 48: Dry Port- Plans for the Kisarawe Freight Station .......................................................................... 185
Box 49: Rehabilitation of railways on central corridor .............................................................................. 188
Box 50: Potential employment in natural gas ........................................................................................... 194
Box 51: Key Concerns by the Business Community on Tanzania’s Policy (1999) and Act (2008). ............. 199
vi
Acknowledgments This Country Economic Memorandum (CEM) for Tanzania was prepared by Jacques Morisset and Mahjabeen Haji. We are grateful for the invaluable contributions from: Alan Roe, Andrea Dall’Olio, Arun Joshi, Austin Kilroy, Célestin Monga, Cristian Ugarte, David Rohrbach, Elisa Gamberoni, Francis Ratsimbazafy, Isis Gaddis, Hinh T. Dinh, Josaphat Kweka, Julie Regolo, Louise Fox, Murat Şeker, Olivier Cadot, Paul Brenton, Remy Pigeois, Robert Stone, Shwetlena Sabarwal, Victoria Cunningham, Waly Wane, Yiye Lu, and Yutaka Yoshino.
Background papers prepared for the CEM include the following: 1. Alan Roe and Robert Stone (January 2013), “SMEs and Their Financing in Tanzania: Background Note
for the World Bank”, Oxford Policy Management. 2. Austin Kilroy (2013), “Competitive Industries for Jobs in Tanzania,” Draft Report, World Bank,
Washington DC. 3. Elisa Gamberoni and Mahjabeen Haji (2013), “Individual Characteristics and Business Dynamics: An
Analysis of Male and Female Entrepreneurs in Tanzania,” World Bank, Washington, DC. 4. Hinh T. Dinh and Célestin Monga (2013). “Light Manufacturing in Tanzania: A Reform Agenda for Job
Creation and Prosperity,” Directions in Development, Washington, DC: World Bank. 5. Josaphat Kweka (December 2013) “Commercial Banking and Financial Inclusion in Tanzania: Are
There Options?” Draft Report, World Bank, Washington DC. 6. Josaphat Kweka and Cristian Ugarte (2013), “SMEs at the Center stage of Competitiveness and Job
Creation: What do we know and Need to know for Tanzania?” Draft Report, World Bank. 7. Murat Seker (December 2012), “Innovation Performance in Tanzania,” Draft Report, World Bank,
Washington DC. 8. Olivier Cadot, Julie Regolo, and Yutaka Yoshino (2013), Firm-level patterns of export expansion:
Evidence from Tanzania,” World Bank, Washington DC. 9. Shwetlena Sabarwal (2013), “Skills for SMEs - A Situation Analysis for Tanzania”, Draft Report, World
Bank, Washington DC. 10. Waly Wane and Isis Gaddis (2013), “Structural Transformation in the Agricultural Sector through Bold
Initiatives”, Draft Report, World Bank, Washington DC. 11. Yutaka Yoshino with Olivier Cadot, Francis Ratsimbazafy, and Julie Regolo (2013), “Uncovering
Drivers for Growth and Diversification Of Tanzania’s Exports and Exporters,“ Draft Report, World Bank, Washington DC.
This report benefited from several different consultations with different groups of stakeholders, including government officials, businessmen and others in Tanzania. These consultations took place between October 2013 and April 2014, and we thank the Planning commission and Tanzania Private Sector Foundation for facilitating these consultations. In October 2013, a workshop was organized in Washington D.C., with the participation of World Bank and academic experts as well as key Tanzanian policy makers, including Benno Ndulu, Servacius Likwelile, Philip Mpango, Longinus Rutasitara, Joseph Massawe, Danny Leipziger, Jim Adams, Marcelo Giugale, Gaiv Tata, Deon P. Filmer, and Ejaz Ghani. Lastly, the report was enriched by focused topic discussions at the Business Environment Labs in February - April 2013 and March 2014 as part of Big Results Now initiative.
The report also benefited from the insights of several peer reviewers, John Page, Celestin Monga, Bill Maloney, and Samuel Wangwe. The team received guidance from Albert Zeufack and Philippe Dongier. Jamie Yang edited the report, while Justina Kajange provided invaluable assistance during its preparation.
vii
Abbreviations and Acronyms
AfDB African Development Bank AgFIMS Agricultural Finance Markets Scoping ASDP Agricultural Sector Development Programme BDS Business Development Services BoT Bank of Tanzania BRAC Building Resources across Communities BRELA Business Registration and Licensing Agency BRN Big Results Now BWM SEZ Benjamin William Mkapa – Special Economic Zone CCRO Certificates of Customary Rights of Occupancy CEMAC Economic Community of Central African States CGP COMESA Green Pass COMESA Common Market for Eastern and Southern Africa DANIDA Danish International Development Agency DART Dar es Salaam Rapid Transit DRC Democratic Republic of the Congo EABC East Africa Business Council EAC East African Community ECLOF Ecumenical Church Loan Fund ECOWAS Economic Community of Western Africa States EMTR Effective Marginal Tax Rate EPZA Export Processing Zones Authority ERTTP Ethiopian Rural Travel & Transport Program EU European Union FCFA Foreign Currency Fluctuation Account FDI Foreign Direct Investment FINCA Foundation for International Community Assistance FONDEF Fonds de développement de l’enseignement technique et de la formation
professionnelle FPC Formation Professionnelle Continue GDP Gross Domestic Product GFZB Ghana Free Zones Board GIF Growth Identification framework GRO Granted Rights of Occupancy GSM Global System for Mobile communications HBS Household Budget Survey (HBS) HH Household ICBT Informal Cross Border Trade ICT Information and Communication Technology IFC International Finance Corporation
viii
IKSL IFFCO Kisan Sanchar Limited ILFS Integrated Labour Force Survey IMC Ilala Municipal Council INEFOP National Institute for Employment and Vocational Training IPI Investment Promotion Intermediary IT Information Technology KM Kilometer KWFT Kenya Women’s Finance Trust LAMATA Lagos Metropolitan Area Transport Authority LGA Local Government Authority LLC Limited Liability Company LPI Logistics Performance Index LVHV low-volume high-value MAFC Ministry of Agriculture, Food Security and Cooperatives MFDI Media for Development International MFI Microfinance institution NACTE National Council for Technical Education NAIVS National Agricultural Input Voucher Scheme NGO Non-Government Organization NMB National Microfinance Bank NPS National Panel Survey NTB Non-tariff barrier OTRI Overall Trade Restrictiveness Index PCG Partial Credit Guarantee PRIDE Promotion of Rural Initiative and Development Enterprises REC Regional Economic Communities REPOA Policy Research for Development RML Reuters Market Light SABITIA South African Business and Technology Incubator Association SADC Southern Africa Development Community SAGCOT Southern Agricultural Growth Corridor of Tanzania SEDA Small Enterprise Development Agency SEI Stockholm Environment Institute SEZ Special Economic Zones SIDO Small Industries Development Organization SME Small and Medium Enterprise SUMATRA Surface and Marine Transport Regulatory Authority TAHA Tanzania Horticultural Association TANAPA Tanzania National Parks TANROADS Tanzania National Roads Agency TBIF Technology and Business Incubation Facility TCAA Tanzania Civil Aviation Authority TFDA Tanzania Food and Drug Agency TFP Total Factor Productivity
ix
TICTS Tanzania International Container Terminal Services TIN Tax Identification Number TPA Tanzania Ports Authority TRA Tanzania Revenue Authority TZS Tanzanian Shilling UAE United Arab Emirates UN United Nations UNCTAD United Nations Conference on Trade Development US$ United States Dollars USA United States of America USAID United States Agency for International Development VAT Value Added Tax VBI Virtual Business Incubator VICOBA Village community bank VSLA Village savings and Loans Association WBES World Business Environment Survey WRS Warehouse Receipt System YOSEFO Youth Self Employment Foundation ZATI Zanzibar Association of Tourism Investors

x
1
EXECUTIVE SUMMARY
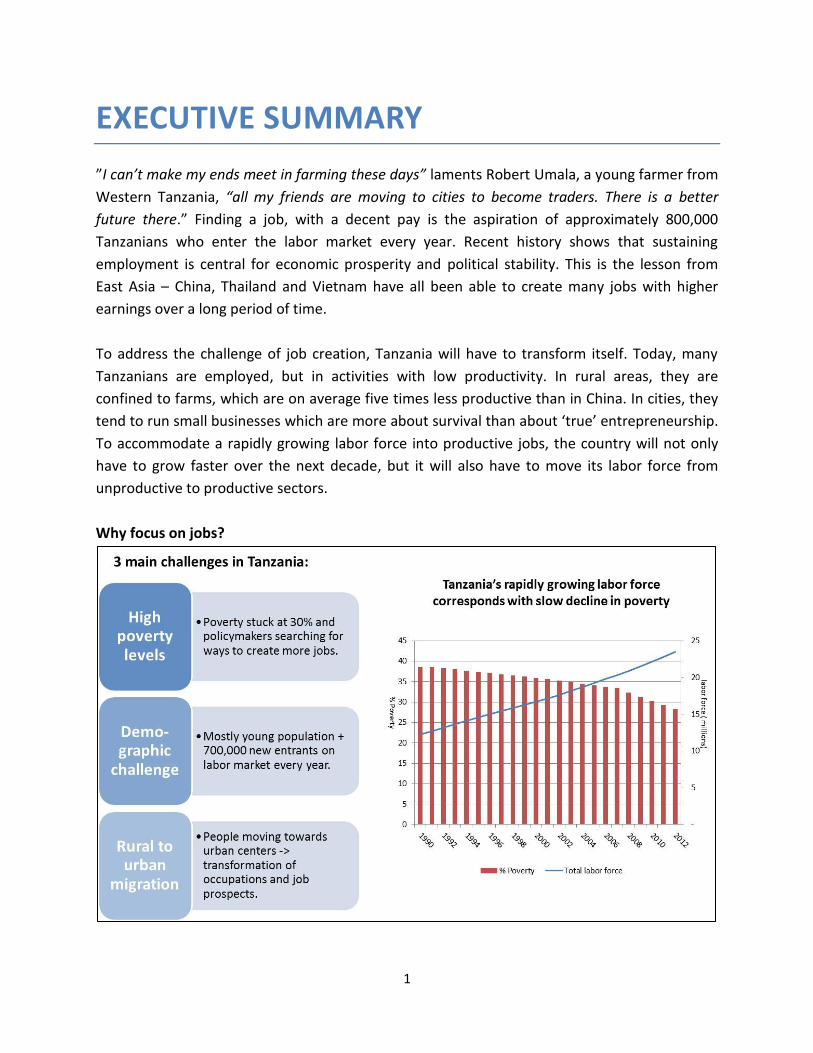
”I can’t make my ends meet in farming these days” laments Robert Umala, a young farmer from
Western Tanzania, “all my friends are moving to cities to become traders. There is a better
future there.” Finding a job, with a decent pay is the aspiration of approximately 800,000
Tanzanians who enter the labor market every year. Recent history shows that sustaining
employment is central for economic prosperity and political stability. This is the lesson from
East Asia – China, Thailand and Vietnam have all been able to create many jobs with higher
earnings over a long period of time.
To address the challenge of job creation, Tanzania will have to transform itself. Today, many
Tanzanians are employed, but in activities with low productivity. In rural areas, they are
confined to farms, which are on average five times less productive than in China. In cities, they
tend to run small businesses which are more about survival than about ‘true’ entrepreneurship.
To accommodate a rapidly growing labor force into productive jobs, the country will not only
have to grow faster over the next decade, but it will also have to move its labor force from
unproductive to productive sectors.
Why focus on jobs?
2
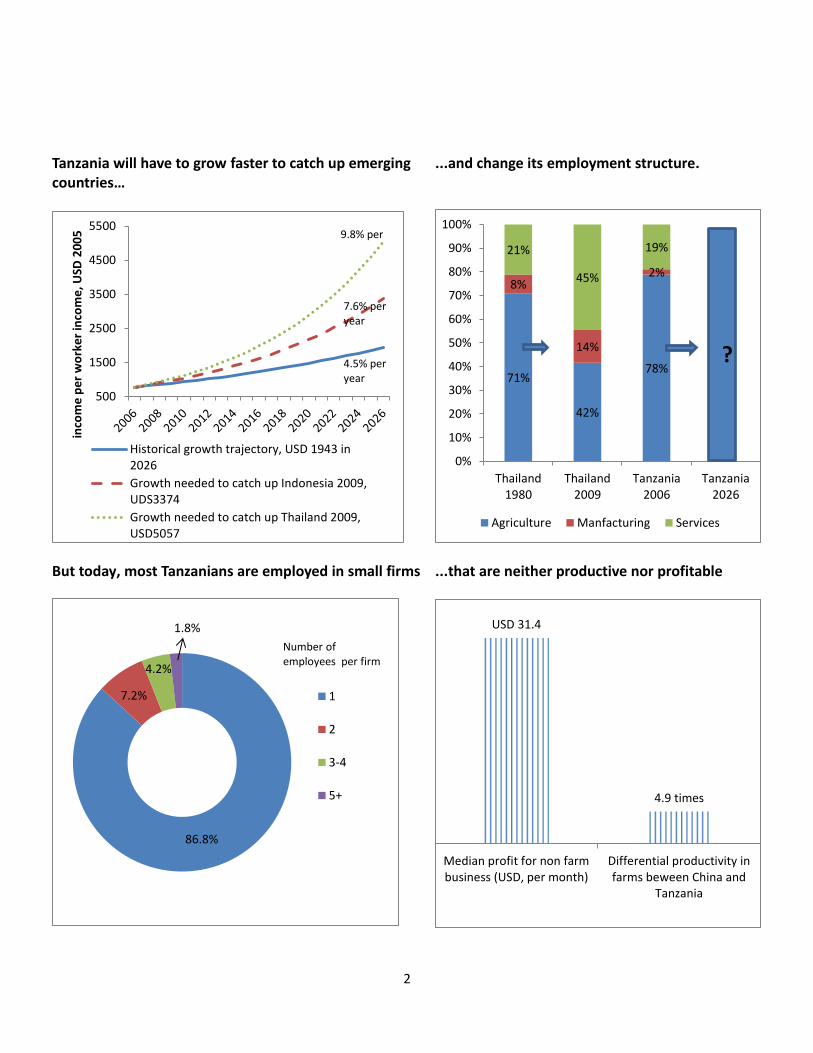
Tanzania will have to grow faster to catch up emerging countries…
...and change its employment structure.
But today, most Tanzanians are employed in small firms
...that are neither productive nor profitable
500
1500
2500
3500
4500
5500
inco
me
pe
r w
ork
er
inco
me
, USD
20
05
Historical growth trajectory, USD 1943 in2026
Growth needed to catch up Indonesia 2009,UDS3374
Growth needed to catch up Thailand 2009,USD5057
9.8% per
7.6% per year
4.5% per year
71%
42%
78%
8%
14%
2%
21%
45%
19%
0%
10%
20%
30%
40%
50%
60%
70%
80%
90%
100%
Thailand1980
Thailand2009
Tanzania2006
Tanzania2026
Agriculture Manfacturing Services
?
86.8%
7.2%
4.2%
1.8%
1
2
3-4
5+
Number of employees per firm
USD 31.4
4.9 times
Median profit for non farmbusiness (USD, per month)
Differential productivity infarms beween China and
Tanzania
3
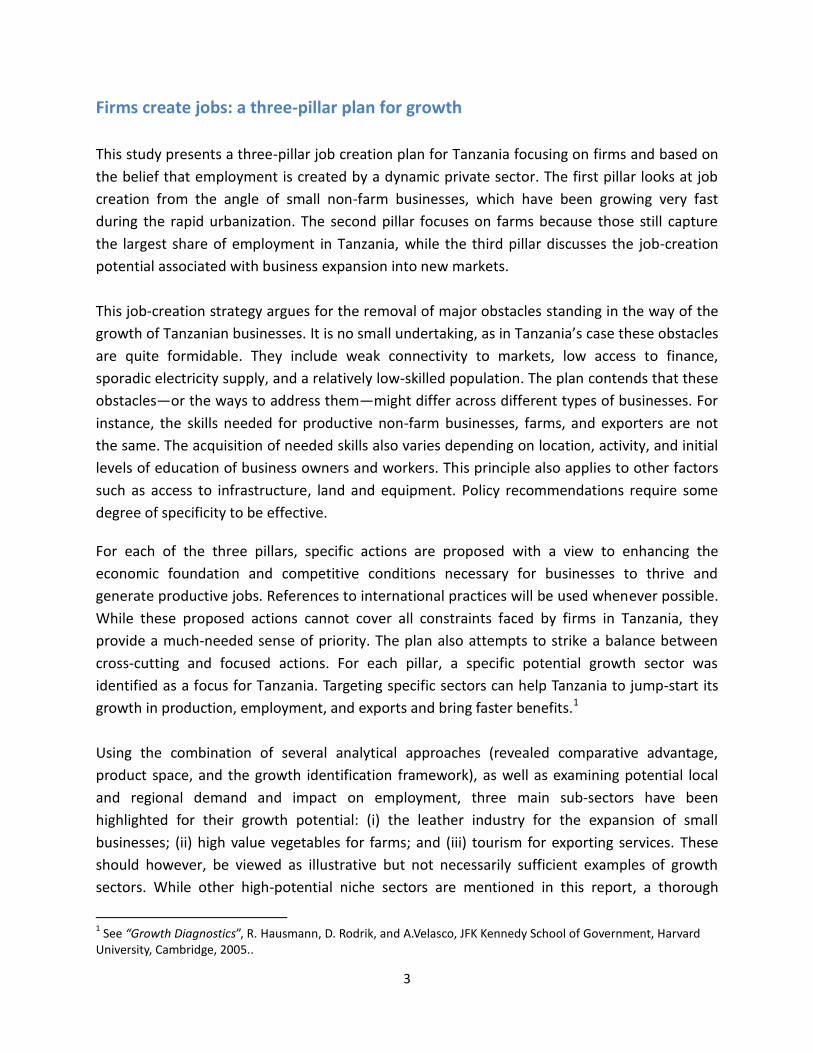
Firms create jobs: a three-pillar plan for growth
This study presents a three-pillar job creation plan for Tanzania focusing on firms and based on
the belief that employment is created by a dynamic private sector. The first pillar looks at job
creation from the angle of small non-farm businesses, which have been growing very fast
during the rapid urbanization. The second pillar focuses on farms because those still capture
the largest share of employment in Tanzania, while the third pillar discusses the job-creation
potential associated with business expansion into new markets.
This job-creation strategy argues for the removal of major obstacles standing in the way of the
growth of Tanzanian businesses. It is no small undertaking, as in Tanzania’s case these obstacles
are quite formidable. They include weak connectivity to markets, low access to finance,
sporadic electricity supply, and a relatively low-skilled population. The plan contends that these
obstacles—or the ways to address them—might differ across different types of businesses. For
instance, the skills needed for productive non-farm businesses, farms, and exporters are not
the same. The acquisition of needed skills also varies depending on location, activity, and initial
levels of education of business owners and workers. This principle also applies to other factors
such as access to infrastructure, land and equipment. Policy recommendations require some
degree of specificity to be effective.
For each of the three pillars, specific actions are proposed with a view to enhancing the
economic foundation and competitive conditions necessary for businesses to thrive and
generate productive jobs. References to international practices will be used whenever possible.
While these proposed actions cannot cover all constraints faced by firms in Tanzania, they
provide a much-needed sense of priority. The plan also attempts to strike a balance between
cross-cutting and focused actions. For each pillar, a specific potential growth sector was
identified as a focus for Tanzania. Targeting specific sectors can help Tanzania to jump-start its
growth in production, employment, and exports and bring faster benefits.1
Using the combination of several analytical approaches (revealed comparative advantage,
product space, and the growth identification framework), as well as examining potential local
and regional demand and impact on employment, three main sub-sectors have been
highlighted for their growth potential: (i) the leather industry for the expansion of small
businesses; (ii) high value vegetables for farms; and (iii) tourism for exporting services. These
should however, be viewed as illustrative but not necessarily sufficient examples of growth
sectors. While other high-potential niche sectors are mentioned in this report, a thorough
1 See “Growth Diagnostics”, R. Hausmann, D. Rodrik, and A.Velasco, JFK Kennedy School of Government, Harvard
University, Cambridge, 2005..
4
exploration of their related industries’ potential for growth and job creation is outside the scope
of this report.
While each pillar is important in itself, it is their combined application that would really yield
greater results. To a large extent, Tanzania’s capacity to create jobs will depend on improving
the conditions of small firms operating in urban areas. However, this capacity will also depend
on the success of the agriculture sector, which should not only produce more food for the
growing urban population, but also create job opportunities and promote development in rural
towns and secondary cities. The development of urban jobs in the processing industries will
also be determined to a large extent by the availability of affordable inputs, including food,
cotton, wood and hides. Exporters can create additional jobs by reaching out to new markets,
and at the same time, help to accelerate the maturation of small firms by providing further
incentives to invest and compete on local and regional markets. Cultivating these types of
synergies should be a priority for policy-makers.
Pillar 1: Pushing small non-farm businesses to grow
Today there are about five million non-farm businesses in Tanzania, which mostly consist of
household enterprises (HEs).2 This number is growing fast at approximately 10-15 percent per
year, fueled by rapid urbanization and by lack of other employment options for the majority of
Tanzanian workers. As a result, about half of small non-farm businesses are located in urban
centers today. They are very small (95 percent of them report less than two employees,
including the owner) with little specialization, and tend to operate only a few hours per day or a
few days a week. Many of these businesses disappear relatively quickly to re-emerge later
under a different name and, sometimes, engaging in other types of activities.
Most of these small businesses are not destined to grow. However, if only 20 percent of them
could double their employment base in a year, almost one million additional jobs could be
created in the economy. This figure is not insignificant: It underscores the premise that small
firms can become central vectors of employment growth in Tanzania, as witnessed in most
industrial and emerging economies.
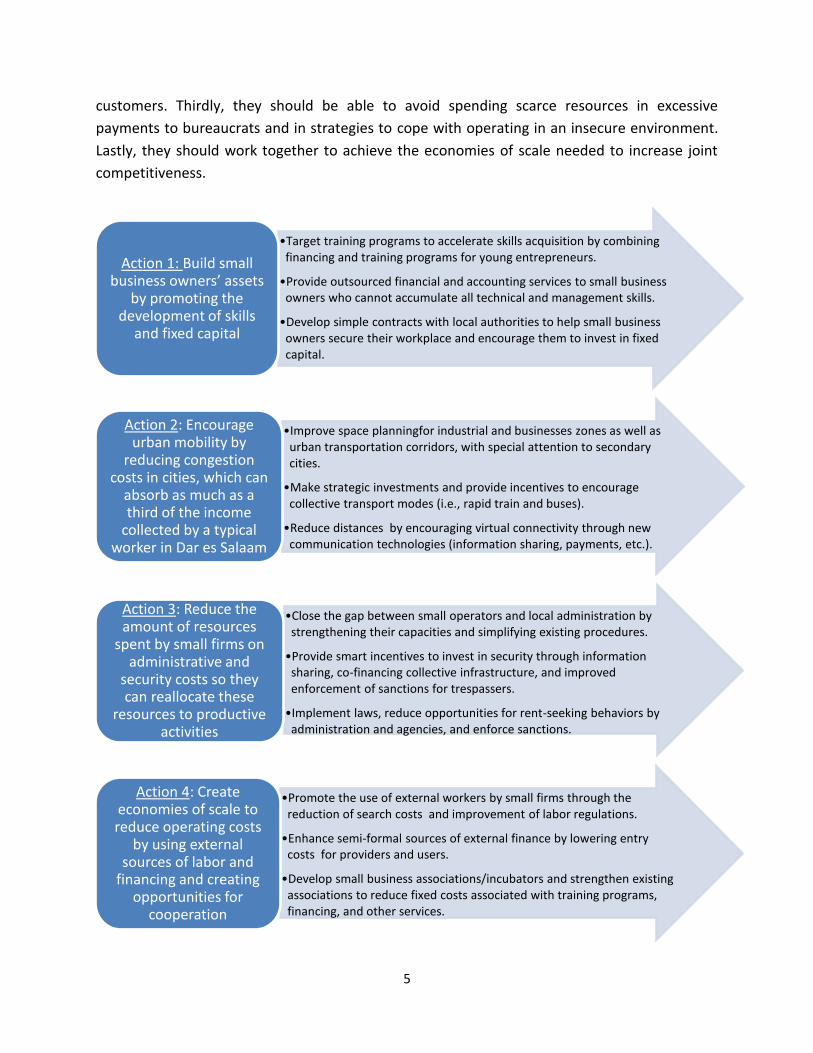
Pushing small firms to grow requires a combination of four actions. First, business owners
should be able to enhance two main assets – their own skills as well as their fixed capital.
Secondly, they should be better connected physically and virtually to their suppliers and
2 ‘Household Enterprises’ as defined in Kweka, J. & L. Fox (2011) are small informal non-farm businesses owned by
households. These enterprises include self-employed people running informal businesses and family members working in those businesses.
5
customers. Thirdly, they should be able to avoid spending scarce resources in excessive
payments to bureaucrats and in strategies to cope with operating in an insecure environment.
Lastly, they should work together to achieve the economies of scale needed to increase joint
competitiveness.
•Target training programs to accelerate skills acquisition by combining financing and training programs for young entrepreneurs.
•Provide outsourced financial and accounting services to small business owners who cannot accumulate all technical and management skills.
•Develop simple contracts with local authorities to help small business owners secure their workplace and encourage them to invest in fixed capital.
Action 1: Build small business owners’ assets
by promoting the development of skills
and fixed capital
•Improve space planningfor industrial and businesses zones as well as urban transportation corridors, with special attention to secondary cities.
•Make strategic investments and provide incentives to encourage collective transport modes (i.e., rapid train and buses).
•Reduce distances by encouraging virtual connectivity through new communication technologies (information sharing, payments, etc.).
Action 2: Encourage urban mobility by
reducing congestion costs in cities, which can
absorb as much as a third of the income
collected by a typical worker in Dar es Salaam
•Close the gap between small operators and local administration by strengthening their capacities and simplifying existing procedures.
•Provide smart incentives to invest in security through information sharing, co-financing collective infrastructure, and improved enforcement of sanctions for trespassers.
•Implement laws, reduce opportunities for rent-seeking behaviors by administration and agencies, and enforce sanctions.
Action 3: Reduce the amount of resources
spent by small firms on administrative and
security costs so they can reallocate these
resources to productive activities
•Promote the use of external workers by small firms through the reduction of search costs and improvement of labor regulations.
•Enhance semi-formal sources of external finance by lowering entry costs for providers and users.
•Develop small business associations/incubators and strengthen existing associations to reduce fixed costs associated with training programs, financing, and other services.
Action 4: Create economies of scale to reduce operating costs
by using external sources of labor and
financing and creating opportunities for
cooperation
6
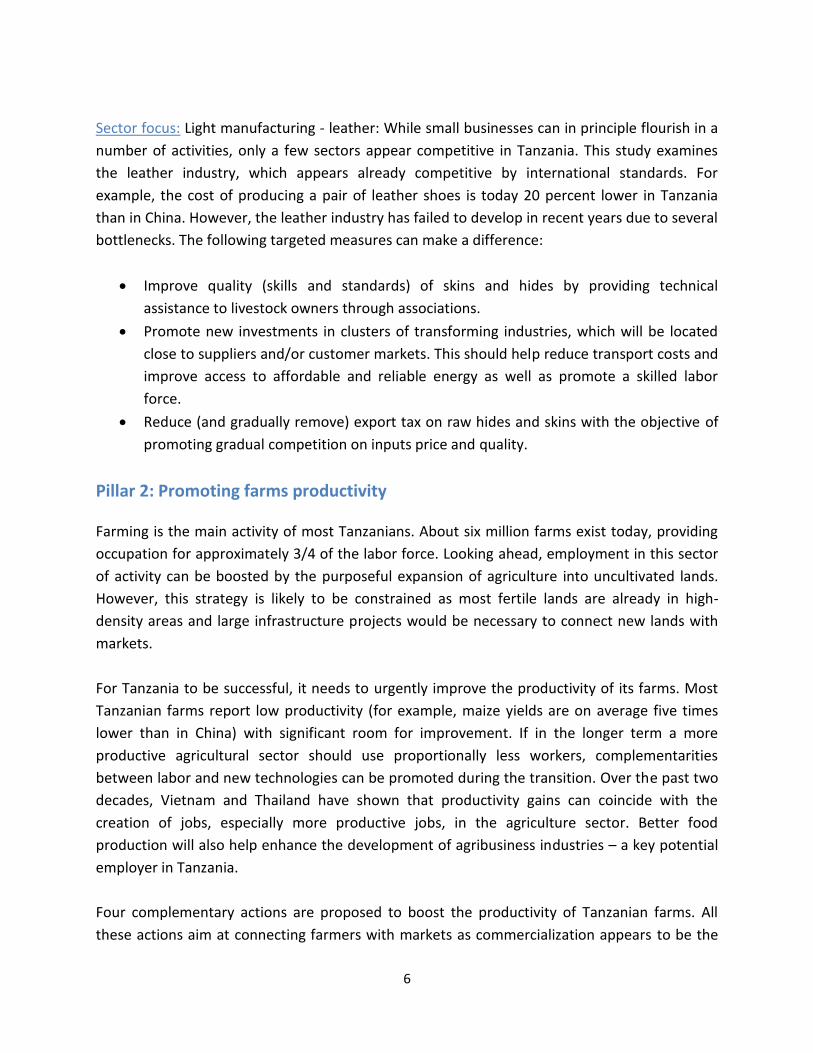
Sector focus: Light manufacturing - leather: While small businesses can in principle flourish in a
number of activities, only a few sectors appear competitive in Tanzania. This study examines
the leather industry, which appears already competitive by international standards. For
example, the cost of producing a pair of leather shoes is today 20 percent lower in Tanzania
than in China. However, the leather industry has failed to develop in recent years due to several
bottlenecks. The following targeted measures can make a difference:
Improve quality (skills and standards) of skins and hides by providing technical
assistance to livestock owners through associations.
Promote new investments in clusters of transforming industries, which will be located
close to suppliers and/or customer markets. This should help reduce transport costs and
improve access to affordable and reliable energy as well as promote a skilled labor
force.
Reduce (and gradually remove) export tax on raw hides and skins with the objective of
promoting gradual competition on inputs price and quality.
Pillar 2: Promoting farms productivity Farming is the main activity of most Tanzanians. About six million farms exist today, providing
occupation for approximately 3/4 of the labor force. Looking ahead, employment in this sector
of activity can be boosted by the purposeful expansion of agriculture into uncultivated lands.
However, this strategy is likely to be constrained as most fertile lands are already in high-
density areas and large infrastructure projects would be necessary to connect new lands with
markets.
For Tanzania to be successful, it needs to urgently improve the productivity of its farms. Most
Tanzanian farms report low productivity (for example, maize yields are on average five times
lower than in China) with significant room for improvement. If in the longer term a more
productive agricultural sector should use proportionally less workers, complementarities
between labor and new technologies can be promoted during the transition. Over the past two
decades, Vietnam and Thailand have shown that productivity gains can coincide with the
creation of jobs, especially more productive jobs, in the agriculture sector. Better food
production will also help enhance the development of agribusiness industries – a key potential
employer in Tanzania.
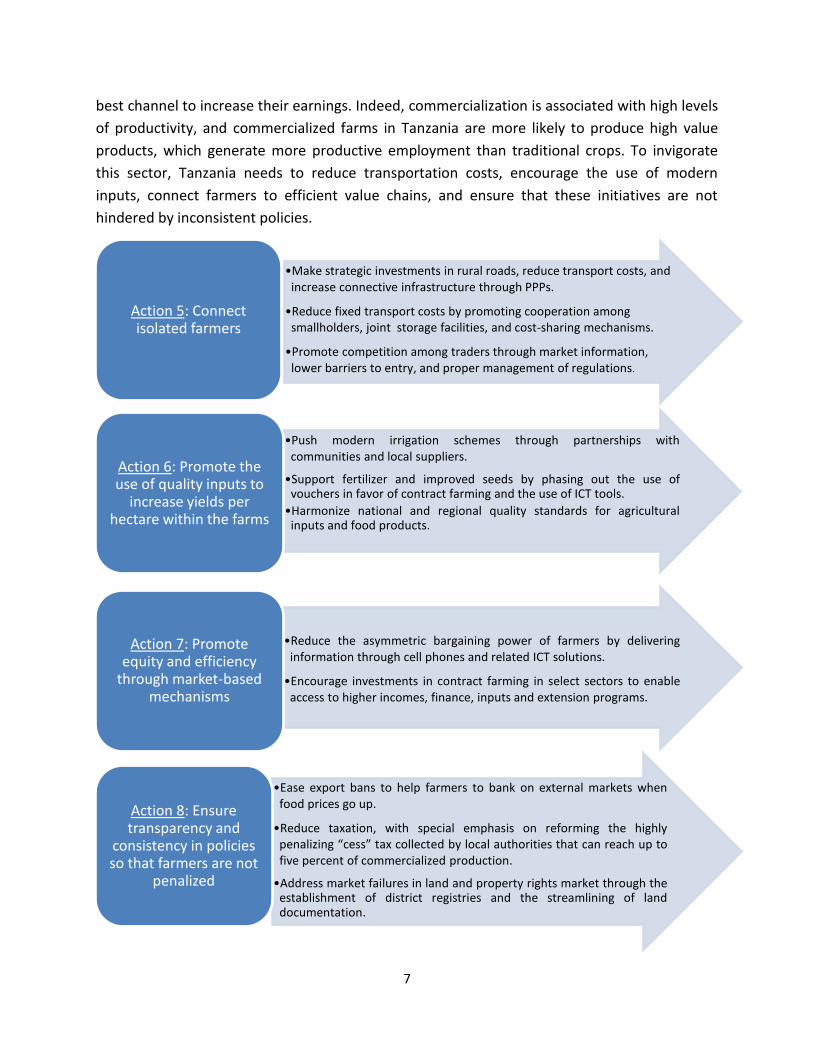
Four complementary actions are proposed to boost the productivity of Tanzanian farms. All
these actions aim at connecting farmers with markets as commercialization appears to be the
7
best channel to increase their earnings. Indeed, commercialization is associated with high levels
of productivity, and commercialized farms in Tanzania are more likely to produce high value
products, which generate more productive employment than traditional crops. To invigorate
this sector, Tanzania needs to reduce transportation costs, encourage the use of modern
inputs, connect farmers to efficient value chains, and ensure that these initiatives are not
hindered by inconsistent policies.
•Make strategic investments in rural roads, reduce transport costs, and increase connective infrastructure through PPPs.
•Reduce fixed transport costs by promoting cooperation among smallholders, joint storage facilities, and cost-sharing mechanisms.
•Promote competition among traders through market information, lower barriers to entry, and proper management of regulations.
Action 5: Connect isolated farmers
•Push modern irrigation schemes through partnerships with communities and local suppliers.
•Support fertilizer and improved seeds by phasing out the use of vouchers in favor of contract farming and the use of ICT tools.
•Harmonize national and regional quality standards for agricultural inputs and food products.
Action 6: Promote the use of quality inputs to
increase yields per hectare within the farms
•Reduce the asymmetric bargaining power of farmers by delivering information through cell phones and related ICT solutions.
•Encourage investments in contract farming in select sectors to enable access to higher incomes, finance, inputs and extension programs.
Action 7: Promote equity and efficiency
through market-based mechanisms
•Ease export bans to help farmers to bank on external markets when food prices go up.
•Reduce taxation, with special emphasis on reforming the highly penalizing “cess” tax collected by local authorities that can reach up to five percent of commercialized production.
•Address market failures in land and property rights market through the establishment of district registries and the streamlining of land documentation.
Action 8: Ensure transparency and
consistency in policies so that farmers are not
penalized

8
Sector focus: Agribusiness - high value vegetables: The development of productive farms will
not only boost agricultural production and employment but it will also lead to better inputs,
which in turn can be transformed into more value-added products. The potential for agriculture
and agribusiness is high for Tanzania, but expectations must be set appropriately. Most of the
sector is currently non-competitive because of the high costs associated with inputs as well as
their relatively low quality. The production of high value vegetables (and fruits), however, is
seen as a realistic opportunity, as it ranks high in all the analytical tools used by this study to
identify Tanzania’s existing and latent advantages. This sub-sector has performed well in recent
years, and offers strong potential in view of the sustained demand on domestic, regional and
international markets.
The following measures are proposed to boost this activity:
Develop contract farming between farms and processing companies. These should be
designed to facilitate access to inputs (seeds, fertilizers) and training for farmers, while
processors should be able to secure good quality products.
Accelerate cluster formation around strategic locations, taking advantage of accessibility
to transport and technology as well as skill transfers through joint ventures. One focus
should be the Kilimanjaro/Arusha region, which has the benefit of proximity to Kenya.
Promote quality products by improving the regulatory framework and coordinating
capacity building programs for farmers on quality and hygiene standards.
Encourage the packaging industry.
Pillar 3: Moving toward export markets
Domestic firms expanding into foreign markets are likely to create employment. They are also
expected to benefit from technology transfers that will not only increase their productivity but
also that of other local firms through linkages. This strategy has been central to the creation of
productive jobs in many emerging economies, especially in East Asia.
In spite of fast growing exports over the past decade, Tanzanian exporters are still to catch up.
Only one out 10,000 firms sells its products to foreign markets compared to, for example, one
out of 500 in the US. Exporters appear to be more productive and larger than non-exporters.
However, while some firms were created large with the immediate ambition to export,
especially in mining, others went through gradual growth. They started selling to domestic
markets, and slowly moved on to regional and global markets. Many Tanzanian exporters went
through this maturing process in recent years.
9
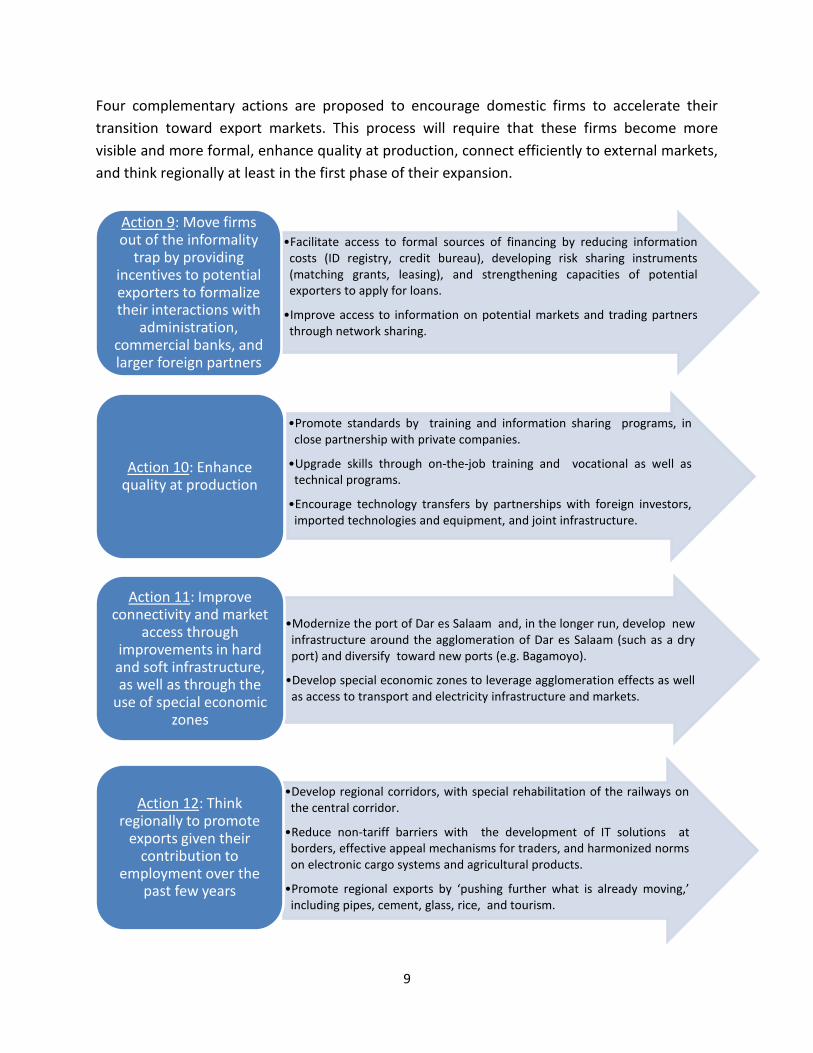
Four complementary actions are proposed to encourage domestic firms to accelerate their
transition toward export markets. This process will require that these firms become more
visible and more formal, enhance quality at production, connect efficiently to external markets,
and think regionally at least in the first phase of their expansion.
•Facilitate access to formal sources of financing by reducing information costs (ID registry, credit bureau), developing risk sharing instruments (matching grants, leasing), and strengthening capacities of potential exporters to apply for loans.
•Improve access to information on potential markets and trading partners through network sharing.
Action 9: Move firms out of the informality
trap by providing incentives to potential exporters to formalize their interactions with
administration, commercial banks, and larger foreign partners
•Promote standards by training and information sharing programs, in close partnership with private companies.
•Upgrade skills through on-the-job training and vocational as well as technical programs.
•Encourage technology transfers by partnerships with foreign investors, imported technologies and equipment, and joint infrastructure.
Action 10: Enhance quality at production
•Modernize the port of Dar es Salaam and, in the longer run, develop new infrastructure around the agglomeration of Dar es Salaam (such as a dry port) and diversify toward new ports (e.g. Bagamoyo).
•Develop special economic zones to leverage agglomeration effects as well as access to transport and electricity infrastructure and markets.
Action 11: Improve connectivity and market
access through improvements in hard and soft infrastructure, as well as through the
use of special economic zones
•Develop regional corridors, with special rehabilitation of the railways on the central corridor.
•Reduce non-tariff barriers with the development of IT solutions at borders, effective appeal mechanisms for traders, and harmonized norms on electronic cargo systems and agricultural products.
•Promote regional exports by ‘pushing further what is already moving,’ including pipes, cement, glass, rice, and tourism.
Action 12: Think regionally to promote
exports given their contribution to
employment over the past few years

10
Sector focus: Services - tourism: Total exports have been growing quickly (over 15 percent per
year during the 2000s) and prospects are good in both merchandise and services. There are also
many opportunities in light manufacturing and agriculture, as emphasized by the combined
methodologies used in the report, as well as opportunities related to the development of off-
shore natural gas reserves in the south of the country. Although the exploitation of natural gas
reserves is not expected to create many direct jobs, there are job creation opportunities during
the construction phase, and more indirectly, through the emergence of forward and backward
linkages with domestic firms. At this stage, however, immediate attention should be on
services such as tourism, where Tanzania already owns some latent comparative advantages in
transit services (since Tanzania is a regional hub), and where the potential exists for job
creation through the multiplier (direct and indirect) effect associated with its development.
To foster the employment potential of tourism, the following measures are proposed:
Improve the policy and institutional environment by revising the Tourism Policy
(1999) and Tourism Act (2008) in close cooperation with the private sector.
Foster an enabling environment for private sector growth in the tourism industry,
including small businesses, by rationalizing procedures for licenses and controls.
Develop linkages with the local economy by strengthening local capacities, including
at the community level, for the provision of food, accommodation and other
services to tourists.
Diversify tourism products and attractions, beyond the over-utilized northern circuit
and Zanzibar, by promoting infrastructure development as well as innovative
marketing and branding initiatives, with special attention to the South.
Next Steps
The proposed action plan identifies 12 key actions organized around three pillars to promote
the creation of productive jobs in Tanzania. For many, this number may appear too high
(especially given that these actions are subdivided into even more itemized measures).
However, the challenge of productive employment cannot realistically be met by a few
superficial actions. It is cross- cutting in nature, and the magnitude of the reforms needed to
encourage the creation of productive jobs requires the adoption and implementation of a
comprehensive action plan.
The goal of this study is to contribute to the debate around job creation in Tanzania by
proposing a direction for policy-making. Only when a consensus emerges among stakeholders
should the implementation of the selected actions be discussed in more detail, including timing,
financing, and the allocation of responsibilities among implementation agencies, ministries,
development partners, and the private sector. This next step will be crucial as actions are of
little use if they are not implementable.
11
INTRODUCTION
For Tanzania, creating jobs entails a simple rule: her employment base has to grow faster
than her labor force. This is easier said than done, especially given that her active population is
projected to double over the next two decades. As a result, the country will have to grow
faster, move workers from unproductive to productive jobs, or improve the productivity of
workers in their current occupations. Successful economies have managed these three forces
by adopting smart policies.
Generating and managing these transformational forces will imply the expansion of private
businesses. Without new or growing firms, it is difficult to imagine the creation of jobs at
massive scale. In turn, a dynamic private sector requires a combination of factors that are not
always easy to realize; including friendly business environment, connectivity, skills, and access
to finance as well as energy. The contribution of these factors is important for all firms but their
order of importance varies depending on various characteristics. Small traders operating in Dar
es Salaam are certainly less constrained by unreliable access to electricity than large
agribusiness industries. Skills for ICT firms are quite different from those needed for running a
farm. These differences have to be taken into account in the diagnostic to subsequently inform
decision makers in a concrete and useful way.
The objective of this study is to better understand what it takes to promote dynamic firms
and so create additional productive jobs in Tanzania. Productive jobs for the purposes of this
report are defined as those that yield sufficient returns to labor such that the worker and
his/her dependents are permitted a level of consumption above the poverty line.3 In order to
achieve employment in a sustained way, three fundamentals need to be in place: growing non-
farm businesses in urban centers, productive farms, and firms capable to expand toward
regional and global markets. The first ones, driven by agglomeration effects, should offer a
platform to young migrants, while the second ones will provide occupations to the
predominantly rural labor force. Dynamic exporters are central as their expansion to new
markets will provide not only opportunities for new jobs but also for technology as well as skill
transfers that in turn will generate further employment in local firms through linkages. This
study focuses on how to promote these three fundamentals, with special attention to the
mechanisms that will lead local firms to grow and hire more workers over time.
3 International Labor Office, Employment Sector (2012), “Understanding deficits of productive employment and
setting targets: a methodological guide,” ILO Employment Sector, Geneva.
12
There have been several government initiatives in Tanzania that have targeted development
from different angles throughout the last few decades.4 These initiatives have had varying
levels of success, and have been taken into consideration throughout the report. While this
report builds on these initiatives and their lessons, it adds value through the following:
A focus on jobs: Most existing national strategies have broader goals of growth and
poverty alleviation (such as poverty alleviation in the Five-Year Plan and Mkukuta)
rather than a clear focus on jobs. Others focus on certain components of job growth
(such as the Big Results Now initiative; the seventh in the series of BRNs, which looks at
improving the business environment). This report is the first comprehensive strategy
document for Tanzania that presents a multi-faceted plan for job creation.
A multi-sector approach: Since productive jobs arise from a series of interrelated factors
(ranging from skills to connectivity and business environment), this report attempts to
combine these factors in a unified framework. It emphasizes the need to develop
synergies not only between various factors (for example, skills go with technology, and
technology goes with skills) but also across different types of firms (e.g., efficient
commercial farms are a prerequisite for the development of transformative industries).
A deliberate effort to translate evidence-based analysis into concrete actions: Analysis
must inform policy by identifying priorities. These priorities should, in turn, lead to
concrete actions. While an implementation plan is beyond the scope of this report, the
analysis informs the three pillars and 12 corresponding priority actions identified for job
growth. This sequencing approach is expected to enhance ownership and accountability
by local stakeholders, and therefore increase the likelihood of successful
implementation over time.
No blue print applies to all sectors and firms: While the report has identified common
factors of success for job creation, it explicitly recognizes that the impact of these
factors differ by type of firm. It reinforces that policies have to be combined effectively,
and appropriately targeted across firms with different characteristics.
4 This includes the Tanzania Mini-Tiger Plan 2020, Integrated Industrial Development Strategy 2025 (including
‘Kilimo Kwanza’), and the Five Year Development Plan 2011/12 – 2015/16 for infrastructure, agriculture, human capital business environment, and Institutional reforms, among others. A comprehensive list of these strategies, instruments used, and current status can be found in the background paper for the CEM by Austin Kilroy (2013), “Competitive Industries for Jobs in Tanzania,” Draft Report, World Bank, Washington DC.
13
The study is largely informed by background papers created for this report5, and is organized
in three parts. The first one sets up the stage by describing the challenge faced by Tanzania in
terms of job creation. After explaining why jobs are central not only for economic development
but also for social cohesion, it examines the relationships between employment and firms. This
relationship is analyzed by apprehending the 11 million of businesses operating in Tanzania,
with a distinction between non-farm businesses, farms, and exporters. These three categories
of businesses have all a central but differentiated role to play in Tanzania's quest for more
productive jobs.
The second part focuses on dynamic firms that are, almost by definition, those that will
create more opportunities for employment. For each of the above category, the underlying
causes for their success will be studied in detail. While common factors (such as connectivity,
access to finance, and skill development) will be identified, special emphasis is given to their
differentiated impacts on firms. We also explore how successful economies were able to
accelerate the transformation of their firms, including through clustering of firms, partnerships
with foreign investors, regional trade, and simple innovations.
The third and last part proposes a three-pillar plan to promote productive jobs in Tanzania.
This plan identifies 12 areas for policy actions balancing between cross cutting reforms and
focused measures. It aims at contributing to the policy debate within Tanzania by identifying
priorities for both the short and longer terms.
5 Most details and technical analysis cited can be found in the background papers, and we refer extensively to them
in this report.

14

15
PART 1: SETTING THE STAGE: Productive firms create productive jobs
Business as usual will not suffice: Tanzania will have to grow faster, move to more productive sectors, and increase efficiency to provide enough jobs for its young and growing population.
Both international experience and recent evidence from Tanzania indicate that three different sector elements are essential to catalyze job growth: (i) entrepreneurship and growth in small non-farm enterprises; (ii) increased productivity of farms and agriculture; and, (iii) expansion towards a new customer base, principally in foreign markets.
While firms operating in Tanzania display characteristics typically found in a poor country (small, young, informal, unspecialized, rural), timid signs of transformation (greater urbanization, formalization, and specialization) have been seen.
Though still small, the number of exporting firms that engage in manufacturing activities and sales of new products to new markets has increased in recent years.
Why jobs are so important? Why has it been so difficult to create productive jobs in Tanzania?
How do we create jobs? Why do firms drive job creation? What kinds of firms are more likely to
create productive jobs?
1.1. Why do Jobs matter?
Productive jobs pave the way out of poverty. As average household incomes rise by 2 percent
per year, national poverty rates are reduced between 1.2 percent and 7 percent.6 Jobs generate
a sense of belonging, of social identity, and of self-esteem or personal satisfaction. Every
additional job created spreads welfare within society and thus ensures that all of its members
share and contribute to its growth.
Economies that have been able to combine GDP growth with job growth—sustainably
increasing worker income—have been successful in reducing poverty. A recent World Bank
study indicates that in 10 out of 16 countries that attained substantial poverty decline during 6 Source: IFC Jobs Study, Assessing Private Sector Contributions to Job Creation and Poverty Reduction, January
2013.
16
the 2000s, labor incomes explained more than 40 percent of the poverty reduction.7 The
contribution of labor to growth is of two kinds: (1) extensive, when more workers are employed
in existing production process or (2) intensive, when existing workers become more efficient.
Successful countries have been able to generate a combination of these two effects.8
Achieving economic growth with higher labor income creates a virtuous circle of economic
growth and helps promote social cohesion as well as political stability. On the economic front,
higher labor income increase poor households’ wealth encouraging them to spend more
(demand-side stimulus) and to invest more in human and physical capital (supply-side
stimulus). 9 Socially, an increase in labor income promotes equity and social cohesion.
Ultimately, participation of the population in the growth process helps to maintain political
stability.
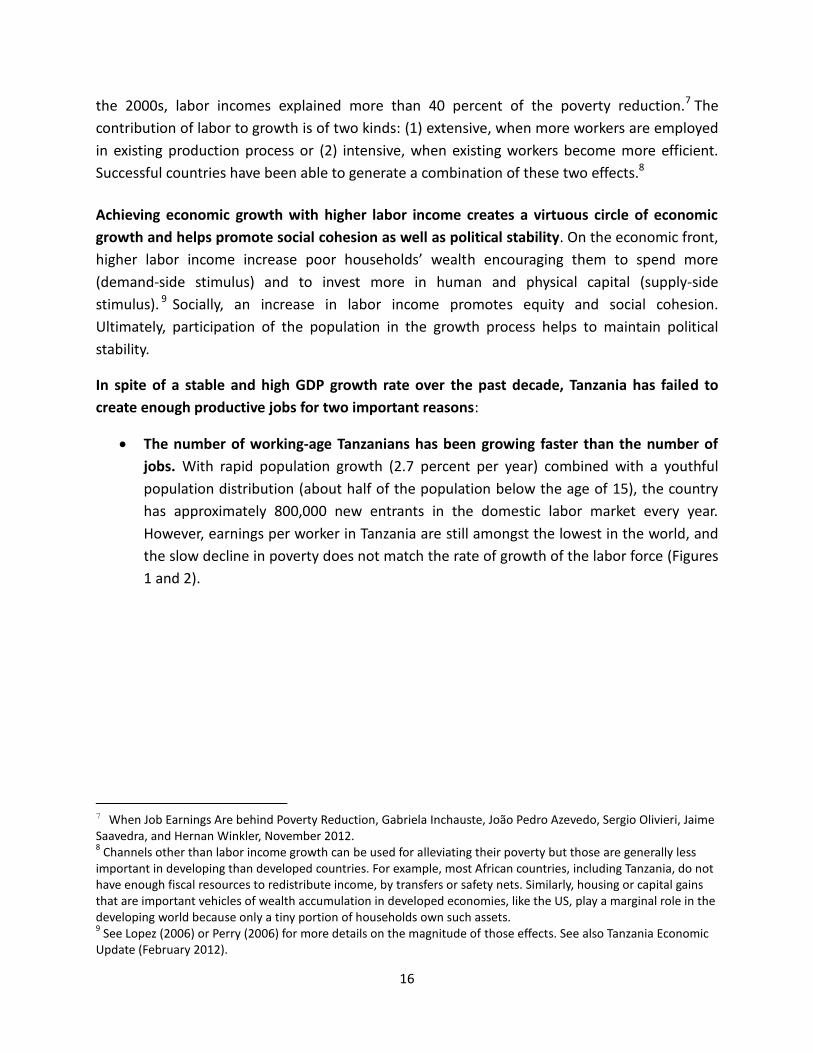
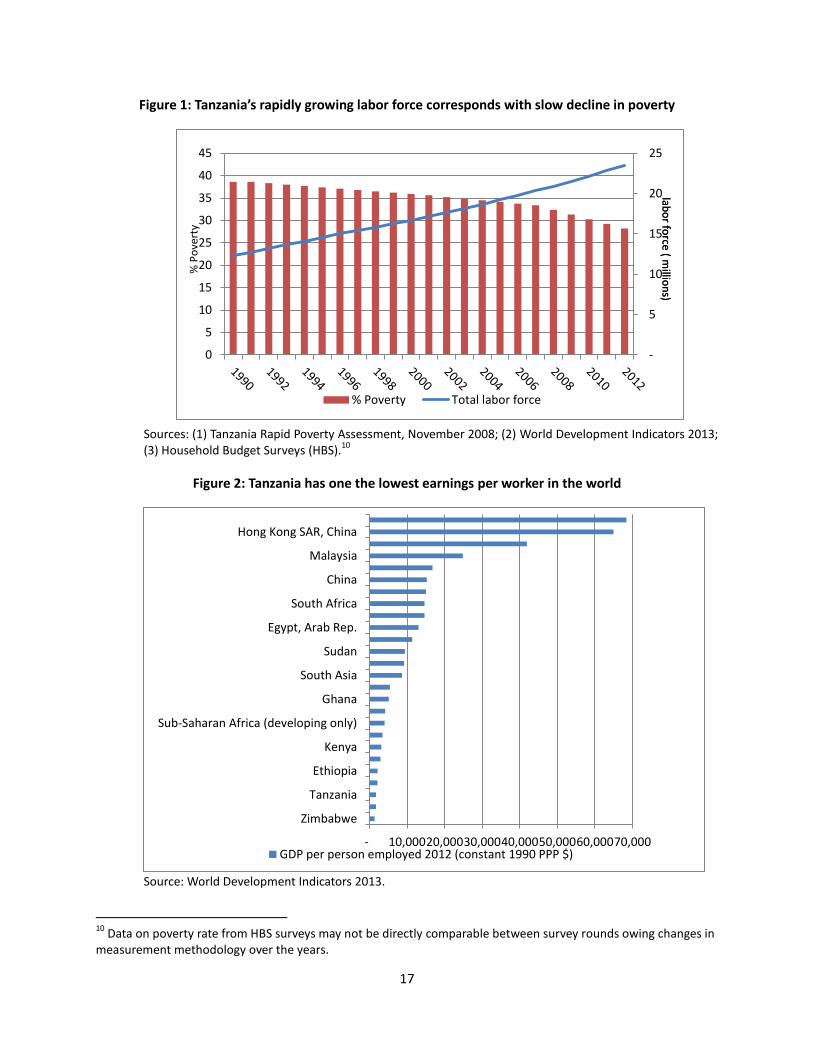
In spite of a stable and high GDP growth rate over the past decade, Tanzania has failed to
create enough productive jobs for two important reasons:
The number of working-age Tanzanians has been growing faster than the number of
jobs. With rapid population growth (2.7 percent per year) combined with a youthful
population distribution (about half of the population below the age of 15), the country
has approximately 800,000 new entrants in the domestic labor market every year.
However, earnings per worker in Tanzania are still amongst the lowest in the world, and
the slow decline in poverty does not match the rate of growth of the labor force (Figures
1 and 2).
7 When Job Earnings Are behind Poverty Reduction, Gabriela Inchauste, João Pedro Azevedo, Sergio Olivieri, Jaime Saavedra, and Hernan Winkler, November 2012. 8 Channels other than labor income growth can be used for alleviating their poverty but those are generally less
important in developing than developed countries. For example, most African countries, including Tanzania, do not have enough fiscal resources to redistribute income, by transfers or safety nets. Similarly, housing or capital gains that are important vehicles of wealth accumulation in developed economies, like the US, play a marginal role in the developing world because only a tiny portion of households own such assets. 9 See Lopez (2006) or Perry (2006) for more details on the magnitude of those effects. See also Tanzania Economic
Update (February 2012).
17
Figure 1: Tanzania’s rapidly growing labor force corresponds with slow decline in poverty
Sources: (1) Tanzania Rapid Poverty Assessment, November 2008; (2) World Development Indicators 2013; (3) Household Budget Surveys (HBS).
10
Figure 2: Tanzania has one the lowest earnings per worker in the world
Source: World Development Indicators 2013.
10
Data on poverty rate from HBS surveys may not be directly comparable between survey rounds owing changes in measurement methodology over the years.
-
5
10
15
20
25
0
5
10
15
20
25
30
35
40
45
% Poverty Total labor force
labo
r force ( m
illion
s) lab
or fo
rce ( millio
ns)
% P
ove
rty
- 10,000 20,000 30,000 40,000 50,000 60,000 70,000
Zimbabwe
Tanzania
Ethiopia
Kenya
Sub-Saharan Africa (developing only)
Ghana
South Asia
Sudan
Egypt, Arab Rep.
South Africa
China
Malaysia
Hong Kong SAR, China
GDP per person employed 2012 (constant 1990 PPP $)
18
Firms, the primary vehicle of job growth, face many constraints in Tanzania that have
reduced their productivity and their appetite for hiring over time. Jobs are mainly
created by private firms: The public sector accounts for less than 5 percent of total
employment. To create jobs, however, firms need to be productive and find a good
reason to employ workers.
Tanzania has three options for producing enough jobs for its booming population: growing
faster, shifting to more productive sectors, or increasing the productivity of its existing labor
force.
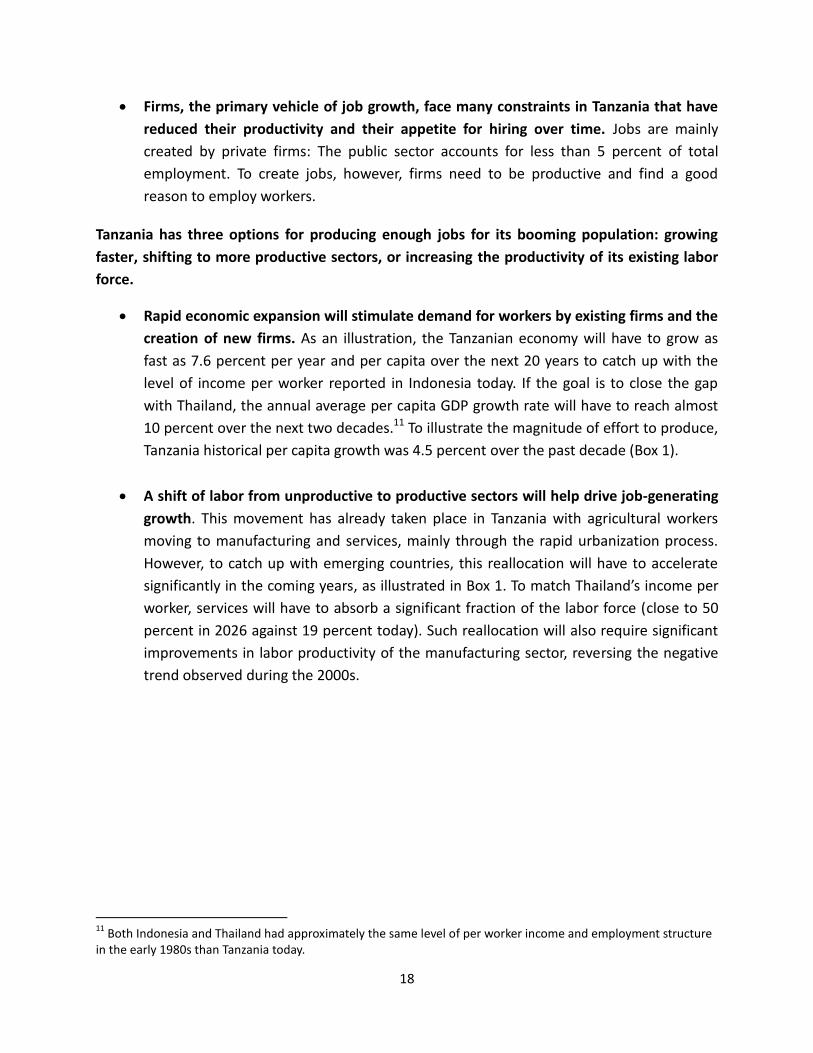
Rapid economic expansion will stimulate demand for workers by existing firms and the
creation of new firms. As an illustration, the Tanzanian economy will have to grow as
fast as 7.6 percent per year and per capita over the next 20 years to catch up with the
level of income per worker reported in Indonesia today. If the goal is to close the gap
with Thailand, the annual average per capita GDP growth rate will have to reach almost
10 percent over the next two decades.11 To illustrate the magnitude of effort to produce,
Tanzania historical per capita growth was 4.5 percent over the past decade (Box 1).
A shift of labor from unproductive to productive sectors will help drive job-generating
growth. This movement has already taken place in Tanzania with agricultural workers
moving to manufacturing and services, mainly through the rapid urbanization process.
However, to catch up with emerging countries, this reallocation will have to accelerate
significantly in the coming years, as illustrated in Box 1. To match Thailand’s income per
worker, services will have to absorb a significant fraction of the labor force (close to 50
percent in 2026 against 19 percent today). Such reallocation will also require significant
improvements in labor productivity of the manufacturing sector, reversing the negative
trend observed during the 2000s.
11
Both Indonesia and Thailand had approximately the same level of per worker income and employment structure in the early 1980s than Tanzania today.
19
Box 1: Business as usual will not be sufficient to catch up with emerging countries
1: How much Tanzania has to accelerate its per capital income growth to catch up Indonesia and Thailand (assuming unchanged employment structure)
2: The needed change in the employment structure – the example of Thailand over the past 30 years
Source: World Bank & ILO
500
1500
2500
3500
4500
5500
20
06
20
07
20
08
20
09
20
10
20
11
20
12
20
13
20
14
20
15
20
16
20
17
20
18
20
19
20
20
20
21
20
22
20
23
20
24
20
25
20
26
inco
me
pe
r w
ork
er
inco
me
, US$
20
05
Historical growth trajectory, USD 1943 in 2026
Growth needed to catch up Indonesia 2009, UDS3374
Growth needed to catch up Thailand 2009, USD5057
9.8% per year
7.6% per year
4.5% per year
71%
42%
78%
8%
14%
2%
21%
45%
19%
0%
10%
20%
30%
40%
50%
60%
70%
80%
90%
100%
Thailand 1980 Thailand 2009 Tanzania 2006 Tanzania 2026
Shar
e o
f to
tal l
abo
r fo
rce
Agriculture Manfacturing Services
?
20
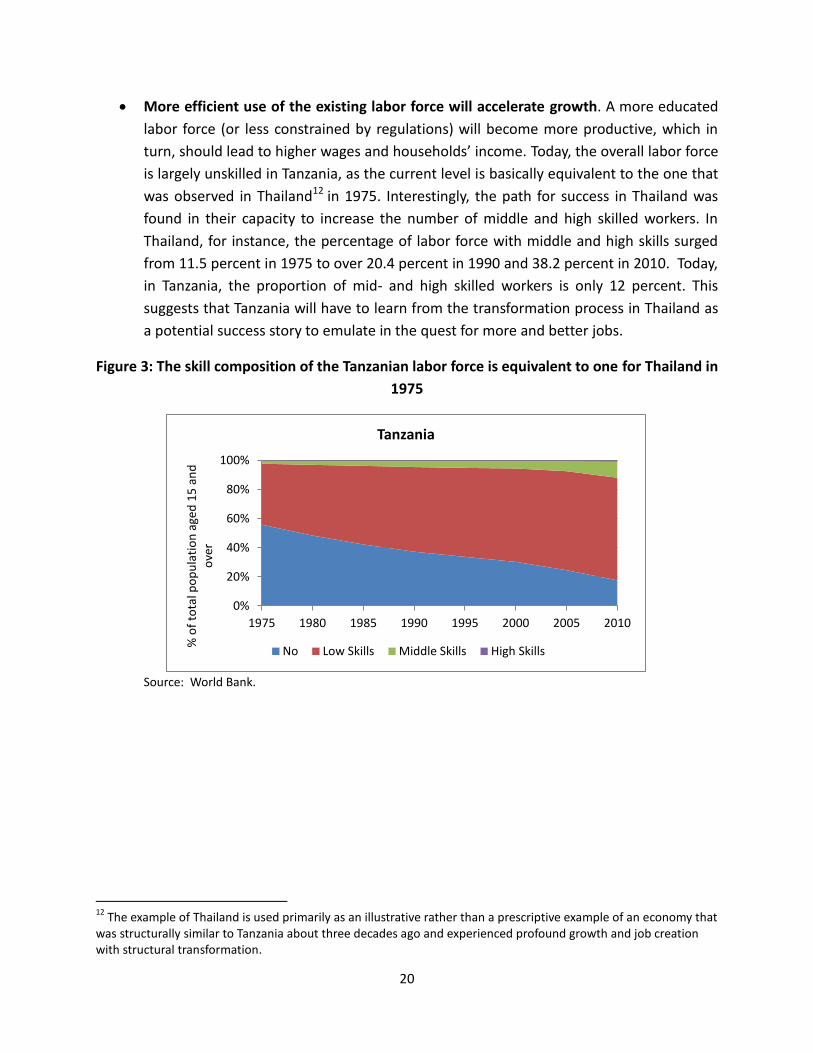
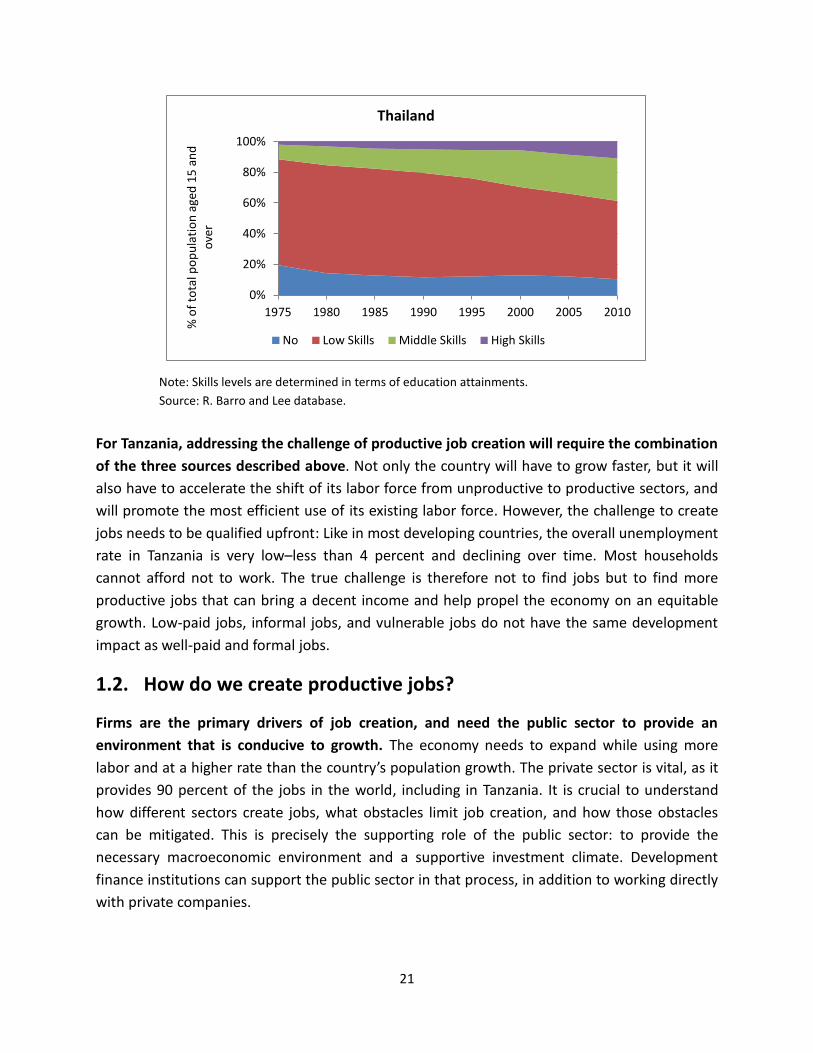
More efficient use of the existing labor force will accelerate growth. A more educated
labor force (or less constrained by regulations) will become more productive, which in
turn, should lead to higher wages and households’ income. Today, the overall labor force
is largely unskilled in Tanzania, as the current level is basically equivalent to the one that
was observed in Thailand12 in 1975. Interestingly, the path for success in Thailand was
found in their capacity to increase the number of middle and high skilled workers. In
Thailand, for instance, the percentage of labor force with middle and high skills surged
from 11.5 percent in 1975 to over 20.4 percent in 1990 and 38.2 percent in 2010. Today,
in Tanzania, the proportion of mid- and high skilled workers is only 12 percent. This
suggests that Tanzania will have to learn from the transformation process in Thailand as
a potential success story to emulate in the quest for more and better jobs.
Figure 3: The skill composition of the Tanzanian labor force is equivalent to one for Thailand in
1975
Source: World Bank.
12
The example of Thailand is used primarily as an illustrative rather than a prescriptive example of an economy that was structurally similar to Tanzania about three decades ago and experienced profound growth and job creation with structural transformation.
0%
20%
40%
60%
80%
100%
1975 1980 1985 1990 1995 2000 2005 2010
% o
f to
tal p
op
ula
tio
n a
ged
15
an
d
ove
r
Tanzania
No Low Skills Middle Skills High Skills
21
Note: Skills levels are determined in terms of education attainments.
Source: R. Barro and Lee database.
For Tanzania, addressing the challenge of productive job creation will require the combination
of the three sources described above. Not only the country will have to grow faster, but it will
also have to accelerate the shift of its labor force from unproductive to productive sectors, and
will promote the most efficient use of its existing labor force. However, the challenge to create
jobs needs to be qualified upfront: Like in most developing countries, the overall unemployment
rate in Tanzania is very low–less than 4 percent and declining over time. Most households
cannot afford not to work. The true challenge is therefore not to find jobs but to find more
productive jobs that can bring a decent income and help propel the economy on an equitable
growth. Low-paid jobs, informal jobs, and vulnerable jobs do not have the same development
impact as well-paid and formal jobs.
1.2. How do we create productive jobs?
Firms are the primary drivers of job creation, and need the public sector to provide an
environment that is conducive to growth. The economy needs to expand while using more
labor and at a higher rate than the country’s population growth. The private sector is vital, as it
provides 90 percent of the jobs in the world, including in Tanzania. It is crucial to understand
how different sectors create jobs, what obstacles limit job creation, and how those obstacles
can be mitigated. This is precisely the supporting role of the public sector: to provide the
necessary macroeconomic environment and a supportive investment climate. Development
finance institutions can support the public sector in that process, in addition to working directly
with private companies.
0%
20%
40%
60%
80%
100%
1975 1980 1985 1990 1995 2000 2005 2010
% o
f to
tal p
op
ula
tio
n a
ged
15
an
d
ove
r
Thailand
No Low Skills Middle Skills High Skills

22
Experience in successful countries suggests that small non-farm businesses, farms and
agriculture, and export-oriented firms are the primary catalysts of productive job growth.
Thailand, for example, have seen its income per worker multiplied by 3.2 between 1980 and
2012 through the creation of non-farm businesses, additional employment in agriculture, and
surging exports (Figure 4).
Figure 4: Drivers of jobs in Thailand – SME creation, agricultural employment and exports
Source: World Bank
The creation and expansion of small non-farm businesses have been key to job growth
in industrial and middle- income countries. In middle-income countries, starts up
businesses have been a major vector of employment creation. The registration rates of
new firms in these countries have been ten to twenty times faster (in proportion to the
total population) than in most African countries, including Tanzania.13 This vector has not
yet reached its potential in Tanzania. As illustrated in Box 2, if only 20 percent of existing
small non-farm businesses (with less than two employees) can double their employment
base, this would lead to the creation of almost one million additional direct jobs.14 More
indirect jobs would be created through linkages and higher income in households.
Promoting micro and small businesses can generate big rewards for Tanzania. This
would require a change in policy-making –not at the fringe but at its core – as discussed
later in this report.
13
Ghani, 2013 14
This is used mainly for illustrative purposes, with note that a marginal change in the number of employees may amount to a more fundamental shift within operational business models of firms with less than 2 employees.
0.0
5.0
10.0
15.0
20.0
25.0
30.0
0.0
0.5
1.0
1.5
2.0
2.5
3.0
3.5
19
88
19
89
19
90
19
91
19
92
19
93
19
94
19
95
19
96
19
97
19
98
19
99
20
00
20
01
20
02
20
03
20
04
20
05
20
06
20
07
20
08
20
09
Ind
ex
Mill
ion
Number of Smes Number of employees agriculture
export index value (right hand axis)

23
Box 2: Small non-farm businesses as a vector of employment: Let the numbers speak
Total non- farm businesses 5m fraction of firms with 2 or less
workers x 0.94
4.7m firms accounted for almost all job creation
between 2008/9 and 2010/11
GOAL: Get a higher share of small firms to stimulate job creation
If 20% of existing firms (with 2 or less workers) double their workforce = 940,000 New jobs created
Source: Calculations based on NPS 2008/9 and 2010/11
The agricultural sector shows great potential for poverty reduction and the creation of
productive jobs through increases in agricultural productivity. For Tanzania, agriculture
accounts for 25 percent of GDP, and the sector employs 75 percent of the total labor
force. The process of agriculture transformation has potential for both more jobs and
more productive jobs along the value chain as illustrated by Thailand and Vietnam.
These two countries have managed to create productive jobs in their agricultural sector
by diversifying from food staples to higher value commodities to access value-added
supply chains, and increasing agricultural exports through improved product quality and
safety. They achieved it even though rising incomes and urbanization also leads to
structural transformation, where the labor force is gradually moving away from
agricultural activities toward manufacturing and services. For Tanzania, the current
challenge is to realize its potential to create more productive jobs in the agriculture
sector through greater linkages between commercialization and transformation
activities, and productivity improvements within the farms through improved inputs
knowledge, and technology.
Lastly, the success of export-oriented strategies has been well documented in East
Asian countries. Indeed, an increase in sales from exports creates twice as many jobs as
a dollar in sales from domestic demand. Moreover, exporting firms pay 9 percent more
than jobs in firms that export less.15 Tanzanian firms need to be competitive with foreign
firms to be able to trade its products on foreign markets. While exporting is not the only
way of achieving economic growth and increased job creation, it is one of the few
strategies that encourages greater demand for Tanzanian products, and increases access
to knowledge and technology through greater exposure to global markets. The challenge
for Tanzania would be to promote the emergence of new exporters or the extension of
Source: IFC Jobs Study, Assessing Private Sector Contributions to Job Creation and Poverty Reduction, January 2013.
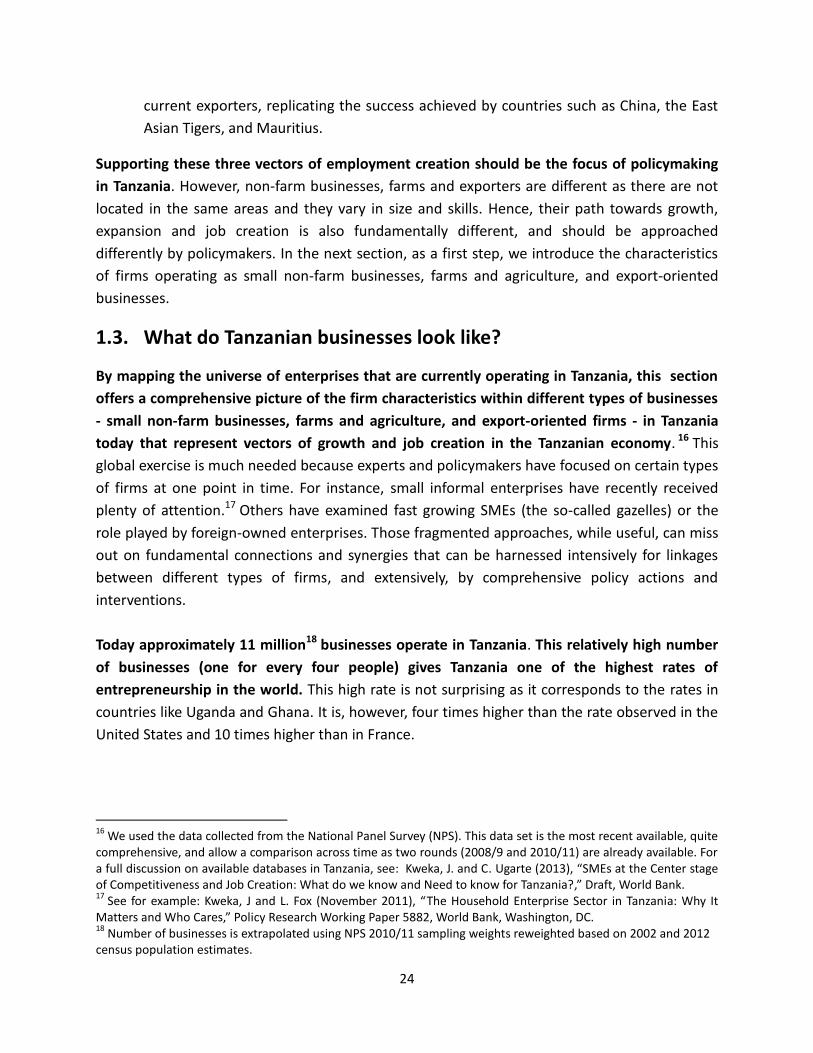
24
current exporters, replicating the success achieved by countries such as China, the East
Asian Tigers, and Mauritius.
Supporting these three vectors of employment creation should be the focus of policymaking
in Tanzania. However, non-farm businesses, farms and exporters are different as there are not
located in the same areas and they vary in size and skills. Hence, their path towards growth,
expansion and job creation is also fundamentally different, and should be approached
differently by policymakers. In the next section, as a first step, we introduce the characteristics
of firms operating as small non-farm businesses, farms and agriculture, and export-oriented
businesses.
1.3. What do Tanzanian businesses look like?
By mapping the universe of enterprises that are currently operating in Tanzania, this section
offers a comprehensive picture of the firm characteristics within different types of businesses
- small non-farm businesses, farms and agriculture, and export-oriented firms - in Tanzania
today that represent vectors of growth and job creation in the Tanzanian economy. 16 This
global exercise is much needed because experts and policymakers have focused on certain types
of firms at one point in time. For instance, small informal enterprises have recently received
plenty of attention.17 Others have examined fast growing SMEs (the so-called gazelles) or the
role played by foreign-owned enterprises. Those fragmented approaches, while useful, can miss
out on fundamental connections and synergies that can be harnessed intensively for linkages
between different types of firms, and extensively, by comprehensive policy actions and
interventions.
Today approximately 11 million18 businesses operate in Tanzania. This relatively high number
of businesses (one for every four people) gives Tanzania one of the highest rates of
entrepreneurship in the world. This high rate is not surprising as it corresponds to the rates in
countries like Uganda and Ghana. It is, however, four times higher than the rate observed in the
United States and 10 times higher than in France.
16
We used the data collected from the National Panel Survey (NPS). This data set is the most recent available, quite comprehensive, and allow a comparison across time as two rounds (2008/9 and 2010/11) are already available. For a full discussion on available databases in Tanzania, see: Kweka, J. and C. Ugarte (2013), “SMEs at the Center stage of Competitiveness and Job Creation: What do we know and Need to know for Tanzania?,” Draft, World Bank. 17
See for example: Kweka, J and L. Fox (November 2011), “The Household Enterprise Sector in Tanzania: Why It Matters and Who Cares,” Policy Research Working Paper 5882, World Bank, Washington, DC. 18
Number of businesses is extrapolated using NPS 2010/11 sampling weights reweighted based on 2002 and 2012 census population estimates.
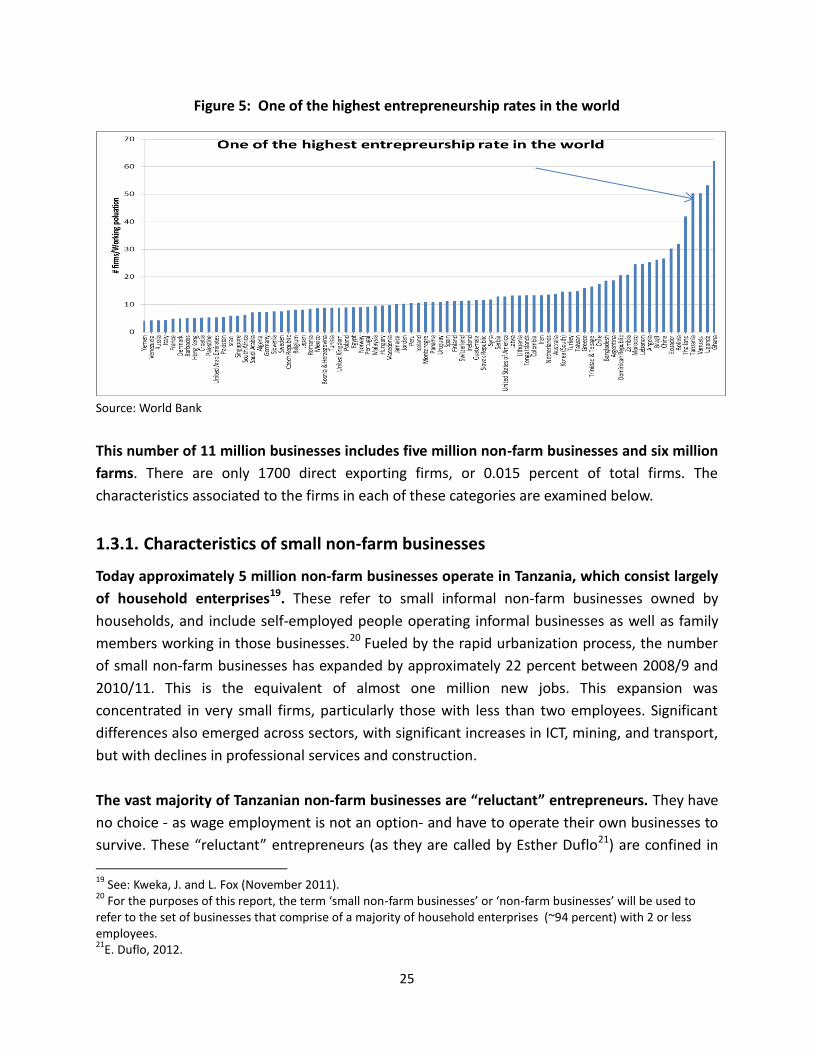
25
Figure 5: One of the highest entrepreneurship rates in the world
Source: World Bank
This number of 11 million businesses includes five million non-farm businesses and six million
farms. There are only 1700 direct exporting firms, or 0.015 percent of total firms. The
characteristics associated to the firms in each of these categories are examined below.
1.3.1. Characteristics of small non-farm businesses
Today approximately 5 million non-farm businesses operate in Tanzania, which consist largely
of household enterprises19. These refer to small informal non-farm businesses owned by
households, and include self-employed people operating informal businesses as well as family
members working in those businesses.20 Fueled by the rapid urbanization process, the number
of small non-farm businesses has expanded by approximately 22 percent between 2008/9 and
2010/11. This is the equivalent of almost one million new jobs. This expansion was
concentrated in very small firms, particularly those with less than two employees. Significant
differences also emerged across sectors, with significant increases in ICT, mining, and transport,
but with declines in professional services and construction.
The vast majority of Tanzanian non-farm businesses are “reluctant” entrepreneurs. They have
no choice - as wage employment is not an option- and have to operate their own businesses to
survive. These “reluctant” entrepreneurs (as they are called by Esther Duflo21) are confined in
19
See: Kweka, J. and L. Fox (November 2011). 20
For the purposes of this report, the term ‘small non-farm businesses’ or ‘non-farm businesses’ will be used to refer to the set of businesses that comprise of a majority of household enterprises (~94 percent) with 2 or less employees. 21
E. Duflo, 2012.
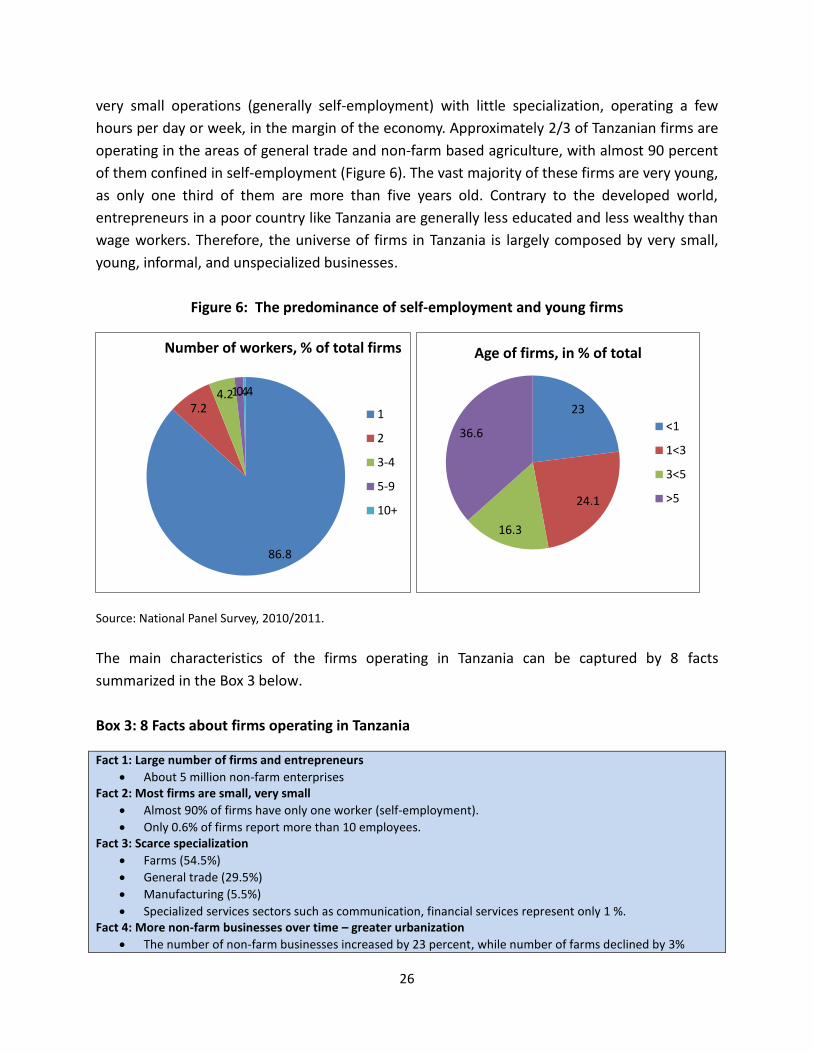
26
very small operations (generally self-employment) with little specialization, operating a few
hours per day or week, in the margin of the economy. Approximately 2/3 of Tanzanian firms are
operating in the areas of general trade and non-farm based agriculture, with almost 90 percent
of them confined in self-employment (Figure 6). The vast majority of these firms are very young,
as only one third of them are more than five years old. Contrary to the developed world,
entrepreneurs in a poor country like Tanzania are generally less educated and less wealthy than
wage workers. Therefore, the universe of firms in Tanzania is largely composed by very small,
young, informal, and unspecialized businesses.
Figure 6: The predominance of self-employment and young firms
Source: National Panel Survey, 2010/2011.
The main characteristics of the firms operating in Tanzania can be captured by 8 facts
summarized in the Box 3 below.
Box 3: 8 Facts about firms operating in Tanzania
Fact 1: Large number of firms and entrepreneurs
About 5 million non-farm enterprises
Fact 2: Most firms are small, very small
Almost 90% of firms have only one worker (self-employment).
Only 0.6% of firms report more than 10 employees. Fact 3: Scarce specialization
Farms (54.5%)
General trade (29.5%)
Manufacturing (5.5%)
Specialized services sectors such as communication, financial services represent only 1 %. Fact 4: More non-farm businesses over time – greater urbanization
The number of non-farm businesses increased by 23 percent, while number of farms declined by 3%
86.8
7.2 4.2 1.4 0.4
Number of workers, % of total firms
1
2
3-4
5-9
10+
23
24.1
16.3
36.6
Age of firms, in % of total
<1
1<3
3<5
>5

27
between 2008/9 and 2010/11.
8.3% of non-farm businesses increased their employment overall, including 11.2% of SMEs in Dar
Almost half of non-farm businesses are located in urban areas (of which 1/3 are in Dar) Fact 5: Non-farm businesses are young and mobile, but fragile and stunted
¼ are less than one year old and 2/3 less than five years old.
The average business operates 8 months per year.
40 % exit after four years.
Only 6-8 % of non-farm businesses grow. Fact 6: Business owners are predominantly young, uneducated, and possess limited assets
Only 3 % of business owners have post-secondary education (mostly in Dar)
Business owners are generally under 35 years old.
60 % use mobile phones but only 0.6% use internet.
80 % have no rental or property rights on premises.
Few own motor vehicles (1.2%), computers (0.5%), machinery (0.3%), or office equipment (17.3%) Fact 7: Mostly, but not all, Informal
Only 80,000 out of 5.5 million non-farm businesses (1.5 %) are registered in CRE.
But as many as 20 % of small firms report to have some relationship with administration (professional registration, local authority license, daily license).
79.1 % of the non-farm businesses workforce have no contract. Fact 8: Family and women-owned businesses
Only 10 % of non-farm businesses use workers outside their households.
7 % of non-farm businesses report to be member of a business association.
Half of working women own a business (but only ¼ are full time wage workers).
54% of non-farm businesses are owned by women.
Sources: NPS, Agricultural survey, CRE database, and SME survey.
In recent years, Tanzanian firms have shown some (timid) signs of transformation that come
with economic progress. The comparison between Tanzania with Malaysia and the United
States suggests that (i) the size of firms should increase, and (ii) the share of non-farm
businesses should become higher. These trends are illustrated in Figure 7. Against this
background, the most visible of transformation in Tanzania has been the rapid expansion of
non-farms businesses (up by 23 percent between 2008/9 and 2010/11), while the rate of
expansion of farms was negative (-3 percent). As a result, the share of non-farm businesses has
increased from 39.8 percent to 45.5 percent during this period. However, the size of non-farm
businesses has not increased, stagnating around 1.2 employees (including the owner). The vast
majority of new firms have been very small as self-employment surged by 26 percent, while the
number of firms with more than 10 employees remained relatively constant between 2008/9
and 2010/11.
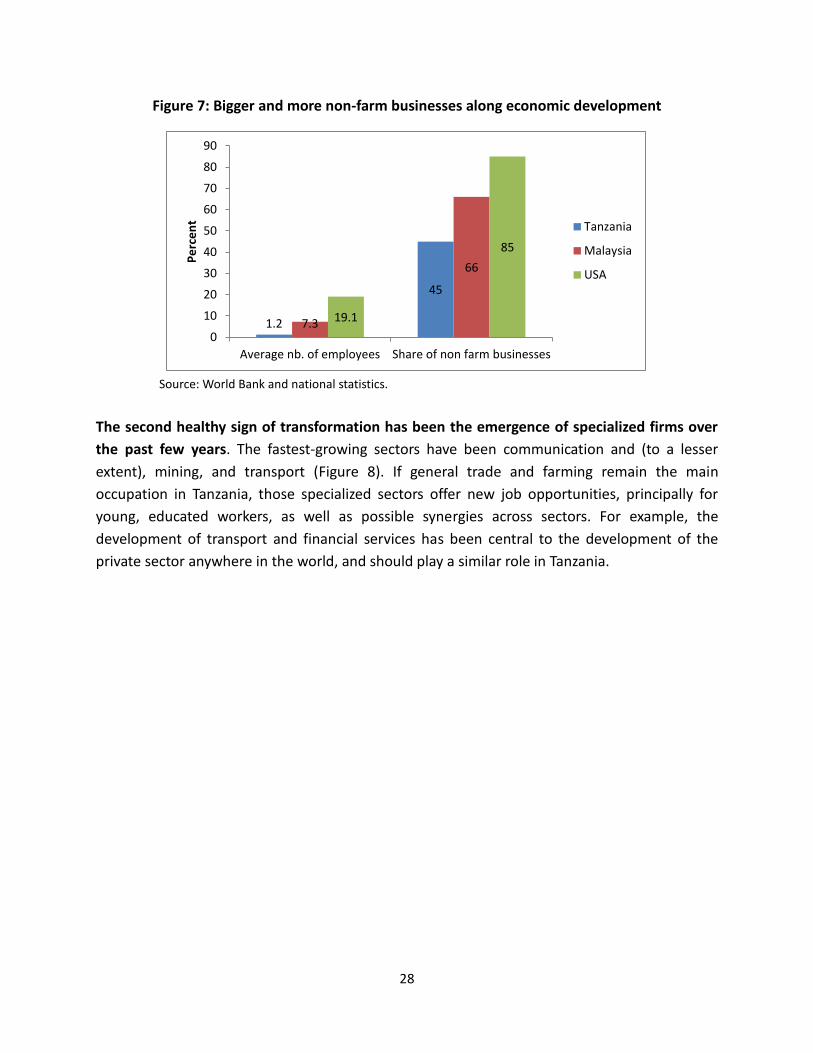
28
Figure 7: Bigger and more non-farm businesses along economic development
Source: World Bank and national statistics.
The second healthy sign of transformation has been the emergence of specialized firms over
the past few years. The fastest-growing sectors have been communication and (to a lesser
extent), mining, and transport (Figure 8). If general trade and farming remain the main
occupation in Tanzania, those specialized sectors offer new job opportunities, principally for
young, educated workers, as well as possible synergies across sectors. For example, the
development of transport and financial services has been central to the development of the
private sector anywhere in the world, and should play a similar role in Tanzania.
1.2
45
7.3
66
19.1
85
0
10
20
30
40
50
60
70
80
90
Average nb. of employees Share of non farm businesses
Pe
rce
nt Tanzania
Malaysia
USA
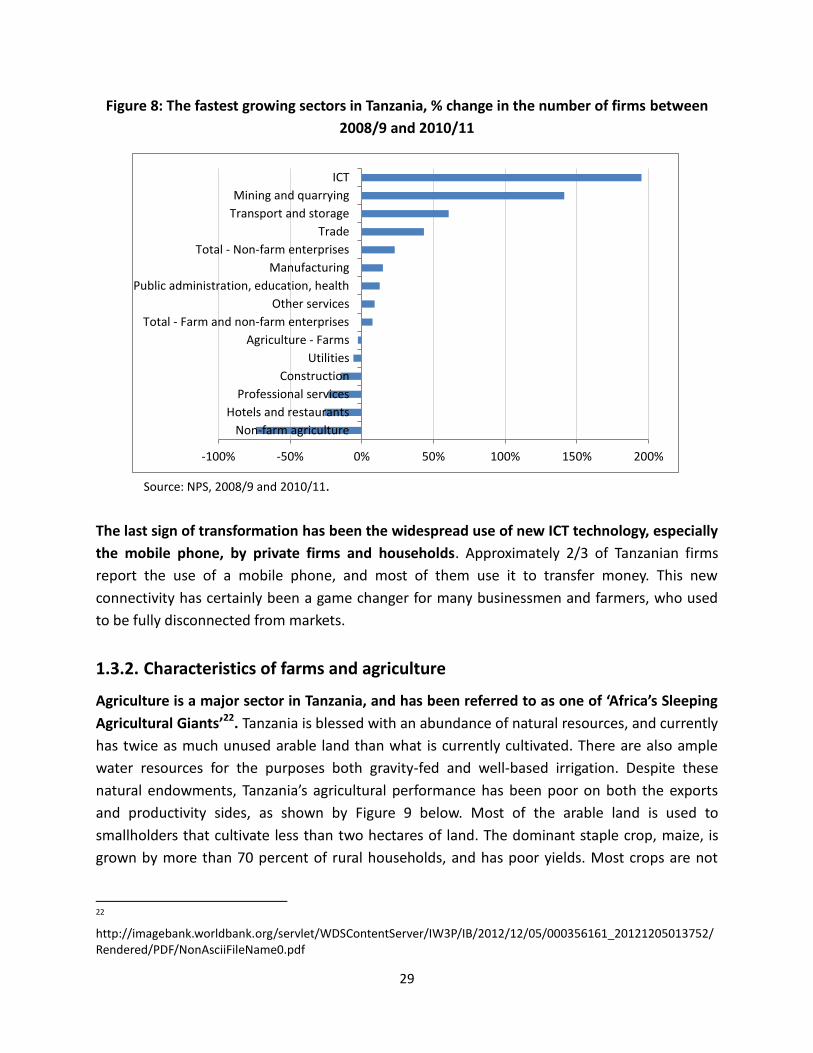
29
Figure 8: The fastest growing sectors in Tanzania, % change in the number of firms between
2008/9 and 2010/11
Source: NPS, 2008/9 and 2010/11.
The last sign of transformation has been the widespread use of new ICT technology, especially
the mobile phone, by private firms and households. Approximately 2/3 of Tanzanian firms
report the use of a mobile phone, and most of them use it to transfer money. This new
connectivity has certainly been a game changer for many businessmen and farmers, who used
to be fully disconnected from markets.
1.3.2. Characteristics of farms and agriculture
Agriculture is a major sector in Tanzania, and has been referred to as one of ‘Africa’s Sleeping
Agricultural Giants’22. Tanzania is blessed with an abundance of natural resources, and currently
has twice as much unused arable land than what is currently cultivated. There are also ample
water resources for the purposes both gravity-fed and well-based irrigation. Despite these
natural endowments, Tanzania’s agricultural performance has been poor on both the exports
and productivity sides, as shown by Figure 9 below. Most of the arable land is used to
smallholders that cultivate less than two hectares of land. The dominant staple crop, maize, is
grown by more than 70 percent of rural households, and has poor yields. Most crops are not
22
http://imagebank.worldbank.org/servlet/WDSContentServer/IW3P/IB/2012/12/05/000356161_20121205013752/Rendered/PDF/NonAsciiFileName0.pdf
-100% -50% 0% 50% 100% 150% 200%
Non-farm agriculture
Hotels and restaurants
Professional services
Construction
Utilities
Agriculture - Farms
Total - Farm and non-farm enterprises
Other services
Public administration, education, health
Manufacturing
Total - Non-farm enterprises
Trade
Transport and storage
Mining and quarrying
ICT

30
planted in irrigated land, and poor productivity is often a result of erratic rainfall, and underuse
of fertilizers and improved seeds due to high prices of inputs.23
Figure 9: Agricultural output and total factor productivity, 1961-2006
Source: Binswanger-Mkhize and Gautam (2010)
The contribution of the agriculture sector to overall GDP has declined relative to the rise of
other sectors, going from an average of 28.8 percent in 2002-05 to 25.3 percent in 2006-10
(Figure 10). Over the past two decades (1990-2011) agricultural performance was decent with
an average growth rate of 3.8 percent. It however barely kept up with population growth, and
agricultural GDP per capita over the same period grew only by 0.9 percent.
Agriculture is dominated by crop farming, which accounts for more than 70 percent of the
sector. The composition of the sector has stayed fairly stable, with the livestock sub-sector
coming in second place and registering a contribution of 15 percent (Figure 10).
23
http://imagebank.worldbank.org/servlet/WDSContentServer/IW3P/IB/2012/12/05/000356161_20121205013752/Rendered/PDF/NonAsciiFileName0.pdf
0
100
200
300
400
Ind
ex
(19
61
= 1
00
)
Tanzania ag output Tanzania Ag TFP
SSA Ag output SSA Ag TFP
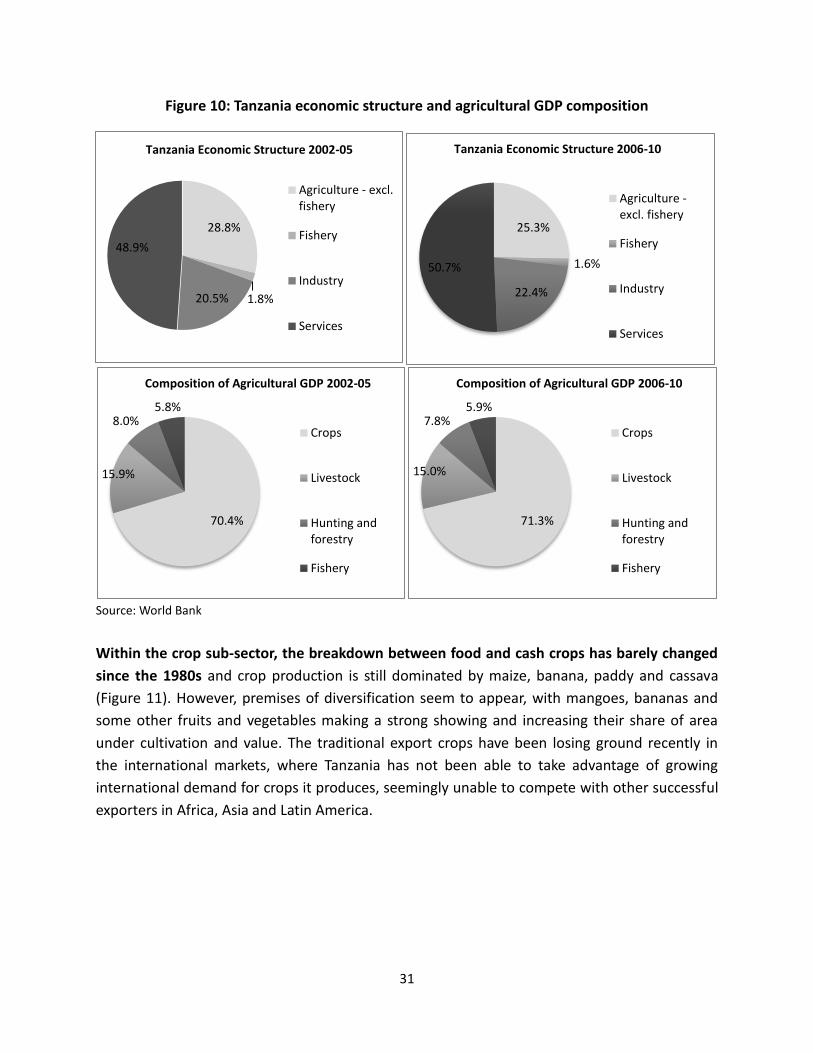
31
Figure 10: Tanzania economic structure and agricultural GDP composition
Source: World Bank
Within the crop sub-sector, the breakdown between food and cash crops has barely changed
since the 1980s and crop production is still dominated by maize, banana, paddy and cassava
(Figure 11). However, premises of diversification seem to appear, with mangoes, bananas and
some other fruits and vegetables making a strong showing and increasing their share of area
under cultivation and value. The traditional export crops have been losing ground recently in
the international markets, where Tanzania has not been able to take advantage of growing
international demand for crops it produces, seemingly unable to compete with other successful
exporters in Africa, Asia and Latin America.
28.8%
1.8% 20.5%
48.9%
Tanzania Economic Structure 2002-05
Agriculture - excl.fishery
Fishery
Industry
Services
25.3%
1.6%
22.4%
50.7%
Tanzania Economic Structure 2006-10
Agriculture -excl. fishery
Fishery
Industry
Services
70.4%
15.9%
8.0% 5.8%
Composition of Agricultural GDP 2002-05
Crops
Livestock
Hunting andforestry
Fishery
71.3%
15.0%
7.8% 5.9%
Composition of Agricultural GDP 2006-10
Crops
Livestock
Hunting andforestry
Fishery

32
Figure 11 : Share of crop in total production value – top 10 crops, 2010/11
Note: Top 10 crops in terms of production value (jointly accounting for 70% of the total value of crop production). Source: NPS 2010/11.
The characteristics, structure and incentives of farms are inherently different from non-farm
businesses. Farms are typically larger and older than non-farm businesses. The average farm
has 2.7 employees, and approximately 75 percent of farms have been in activity for more than
10 years (the average age of a farm in 2008/2009 was 29.2 years). This sector also comprises of
approximately 6 million farms, primarily based in rural areas. These are mostly smallholder
farmers.
Farms employ a larger share of external workers- approximately 40 percent – that are not part
of the household. This highlights the abundance of externally available rural labor that can be
productively utilized during seasons of high agricultural activity, despite a trend towards
urbanization, which shows a decrease of 3 percent in the number of farms between 2008/9 and
2010/11. The process of agricultural transformation has shown success in Thailand, where small
dynamic farms, termed ‘professional farmers’, have shifted towards higher value products that
can be further processed. This involves a different mix of commodities, as well as value-add in
the form of quality, timeliness, food safety, and labor standards in production. This has led to an
increase in product specialization, spurring greater productivity, higher incomes, more jobs
along the value chain, and greater access to export markets.
The potential for transformation and productive job creation in agriculture lies harnessing the
elements of growth that have shown success in other countries. Sources of growth in
agriculture can come from (i) increased inputs such as land, labor, fertilizer or improved seeds,
(ii) changes in the composition of the national crop portfolio with shifts to higher value crops,
(iii) improved productivity (iv) greater linkages with commercial agribusiness through contract
farming opportunities.
25.5%
13.0%
6.2% 5.2% 4.9% 3.7% 3.4% 2.8% 2.5% 2.4%
0.0%
5.0%
10.0%
15.0%
20.0%
25.0%
30.0%
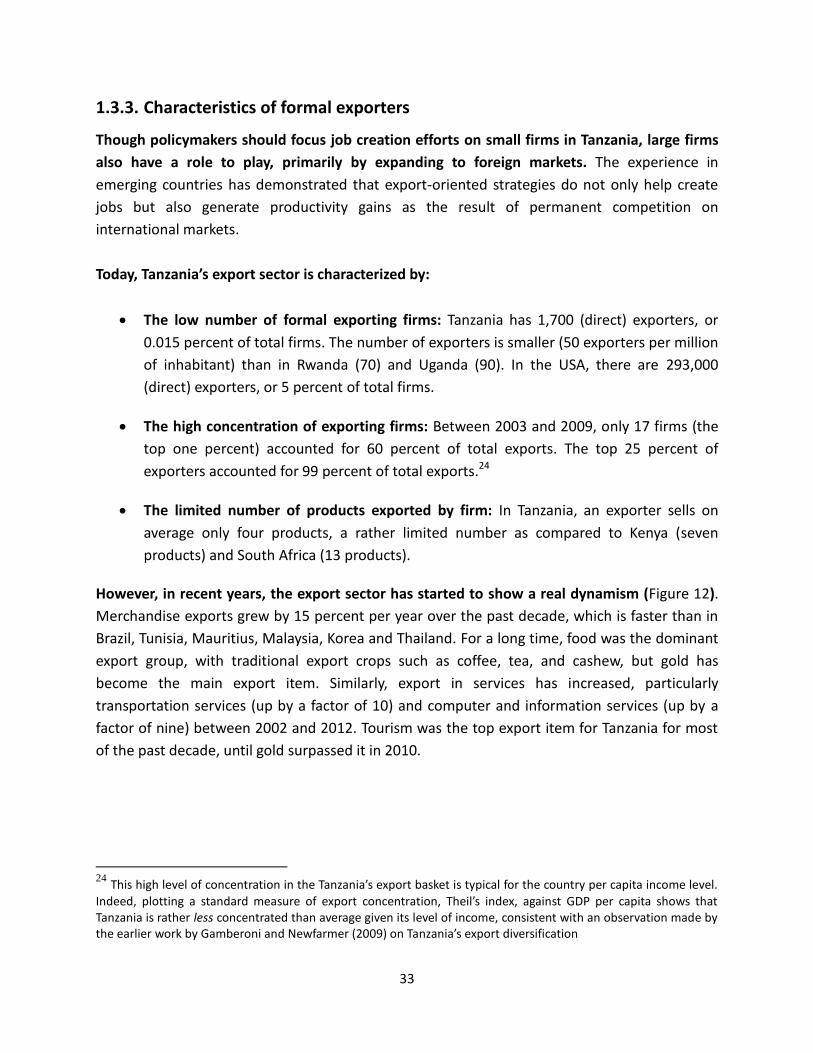
33
1.3.3. Characteristics of formal exporters
Though policymakers should focus job creation efforts on small firms in Tanzania, large firms
also have a role to play, primarily by expanding to foreign markets. The experience in
emerging countries has demonstrated that export-oriented strategies do not only help create
jobs but also generate productivity gains as the result of permanent competition on
international markets.
Today, Tanzania’s export sector is characterized by:
The low number of formal exporting firms: Tanzania has 1,700 (direct) exporters, or
0.015 percent of total firms. The number of exporters is smaller (50 exporters per million
of inhabitant) than in Rwanda (70) and Uganda (90). In the USA, there are 293,000
(direct) exporters, or 5 percent of total firms.
The high concentration of exporting firms: Between 2003 and 2009, only 17 firms (the
top one percent) accounted for 60 percent of total exports. The top 25 percent of
exporters accounted for 99 percent of total exports.24
The limited number of products exported by firm: In Tanzania, an exporter sells on
average only four products, a rather limited number as compared to Kenya (seven
products) and South Africa (13 products).
However, in recent years, the export sector has started to show a real dynamism (Figure 12).
Merchandise exports grew by 15 percent per year over the past decade, which is faster than in
Brazil, Tunisia, Mauritius, Malaysia, Korea and Thailand. For a long time, food was the dominant
export group, with traditional export crops such as coffee, tea, and cashew, but gold has
become the main export item. Similarly, export in services has increased, particularly
transportation services (up by a factor of 10) and computer and information services (up by a
factor of nine) between 2002 and 2012. Tourism was the top export item for Tanzania for most
of the past decade, until gold surpassed it in 2010.
24
This high level of concentration in the Tanzania’s export basket is typical for the country per capita income level.
Indeed, plotting a standard measure of export concentration, Theil’s index, against GDP per capita shows that Tanzania is rather less concentrated than average given its level of income, consistent with an observation made by the earlier work by Gamberoni and Newfarmer (2009) on Tanzania’s export diversification
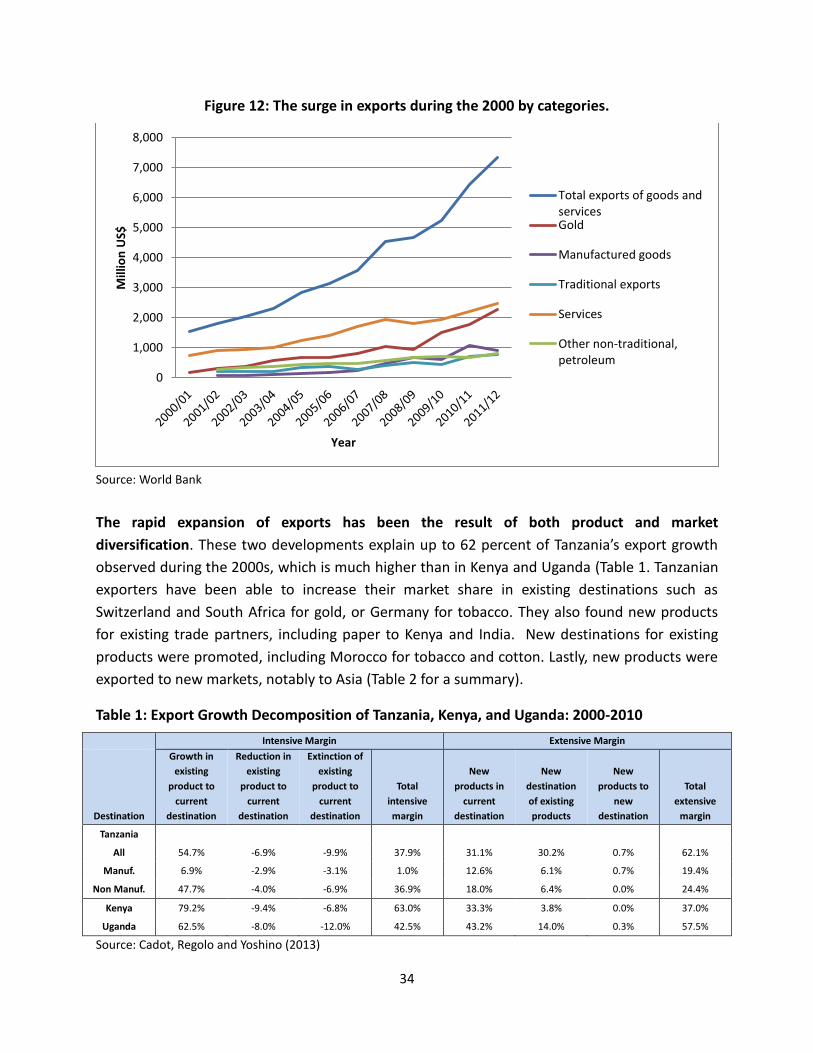
34
Figure 12: The surge in exports during the 2000 by categories.
Source: World Bank
The rapid expansion of exports has been the result of both product and market
diversification. These two developments explain up to 62 percent of Tanzania’s export growth
observed during the 2000s, which is much higher than in Kenya and Uganda (Table 1. Tanzanian
exporters have been able to increase their market share in existing destinations such as
Switzerland and South Africa for gold, or Germany for tobacco. They also found new products
for existing trade partners, including paper to Kenya and India. New destinations for existing
products were promoted, including Morocco for tobacco and cotton. Lastly, new products were
exported to new markets, notably to Asia (Table 2 for a summary).
Table 1: Export Growth Decomposition of Tanzania, Kenya, and Uganda: 2000-2010
Intensive Margin Extensive Margin
Destination
Growth in
existing
product to
current
destination
Reduction in
existing
product to
current
destination
Extinction of
existing
product to
current
destination
Total
intensive
margin
New
products in
current
destination
New
destination
of existing
products
New
products to
new
destination
Total
extensive
margin
Tanzania
All 54.7% -6.9% -9.9% 37.9% 31.1% 30.2% 0.7% 62.1%
Manuf. 6.9% -2.9% -3.1% 1.0% 12.6% 6.1% 0.7% 19.4%
Non Manuf. 47.7% -4.0% -6.9% 36.9% 18.0% 6.4% 0.0% 24.4%
Kenya 79.2% -9.4% -6.8% 63.0% 33.3% 3.8% 0.0% 37.0%
Uganda 62.5% -8.0% -12.0% 42.5% 43.2% 14.0% 0.3% 57.5%
Source: Cadot, Regolo and Yoshino (2013)
0
1,000
2,000
3,000
4,000
5,000
6,000
7,000
8,000
Mill
ion
US$
Year
Total exports of goods andservicesGold
Manufactured goods
Traditional exports
Services
Other non-traditional,petroleum
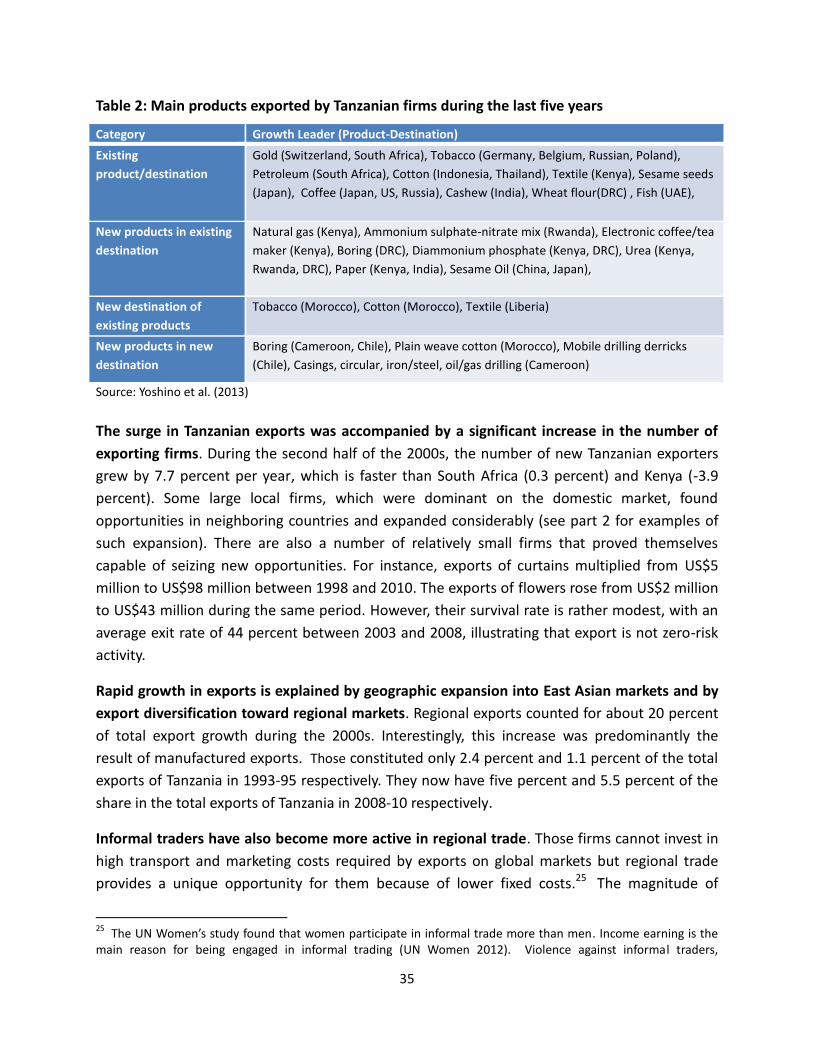
35
Table 2: Main products exported by Tanzanian firms during the last five years
Category Growth Leader (Product-Destination) Existing
product/destination Gold (Switzerland, South Africa), Tobacco (Germany, Belgium, Russian, Poland),
Petroleum (South Africa), Cotton (Indonesia, Thailand), Textile (Kenya), Sesame seeds
(Japan), Coffee (Japan, US, Russia), Cashew (India), Wheat flour(DRC) , Fish (UAE),
New products in existing
destination Natural gas (Kenya), Ammonium sulphate-nitrate mix (Rwanda), Electronic coffee/tea
maker (Kenya), Boring (DRC), Diammonium phosphate (Kenya, DRC), Urea (Kenya,
Rwanda, DRC), Paper (Kenya, India), Sesame Oil (China, Japan),
New destination of
existing products Tobacco (Morocco), Cotton (Morocco), Textile (Liberia)
New products in new
destination Boring (Cameroon, Chile), Plain weave cotton (Morocco), Mobile drilling derricks
(Chile), Casings, circular, iron/steel, oil/gas drilling (Cameroon) Source: Yoshino et al. (2013)
The surge in Tanzanian exports was accompanied by a significant increase in the number of
exporting firms. During the second half of the 2000s, the number of new Tanzanian exporters
grew by 7.7 percent per year, which is faster than South Africa (0.3 percent) and Kenya (-3.9
percent). Some large local firms, which were dominant on the domestic market, found
opportunities in neighboring countries and expanded considerably (see part 2 for examples of
such expansion). There are also a number of relatively small firms that proved themselves
capable of seizing new opportunities. For instance, exports of curtains multiplied from US$5
million to US$98 million between 1998 and 2010. The exports of flowers rose from US$2 million
to US$43 million during the same period. However, their survival rate is rather modest, with an
average exit rate of 44 percent between 2003 and 2008, illustrating that export is not zero-risk
activity.
Rapid growth in exports is explained by geographic expansion into East Asian markets and by
export diversification toward regional markets. Regional exports counted for about 20 percent
of total export growth during the 2000s. Interestingly, this increase was predominantly the
result of manufactured exports. Those constituted only 2.4 percent and 1.1 percent of the total
exports of Tanzania in 1993-95 respectively. They now have five percent and 5.5 percent of the
share in the total exports of Tanzania in 2008-10 respectively.
Informal traders have also become more active in regional trade. Those firms cannot invest in
high transport and marketing costs required by exports on global markets but regional trade
provides a unique opportunity for them because of lower fixed costs.25 The magnitude of
25
The UN Women’s study found that women participate in informal trade more than men. Income earning is the main reason for being engaged in informal trading (UN Women 2012). Violence against informal traders,
36
informal trade is difficult to quantify, but a recent a cross-border survey conducted for the East
Africa Business Council (EABC) found that unrecorded trade volume among EAC countries are
significantly high, particularly at the border posts of Namanga (Kenya-Tanzania border post) and
Malaba (Kenya-Uganda border post), followed by Mtukula (Tanzania-Uganda border post). The
vast majority of informal exports from Tanzania to Uganda are agricultural products, partly
driven by price differentials of same products such as coffee between the two countries. Using
the Uganda ICBT survey data, it is found that in the past five years, $4 million is exported
informally from Tanzania to Uganda across the Tanzania-Uganda border, which is roughly 10
percent of formal exports from Tanzania to Uganda.
Although Tanzania cannot yet be considered a dynamic exporting country, the economy has
become more open to trade, notably through a rapid and sustained increase in exports. This
surge was mostly the result of increasing diversification toward new products and markets. The
number of exporting firms has been growing very fast, arguably from a low base, through the
expansion of large domestic firms toward foreign markets and the emergence of new and
relatively small exporters, especially on regional trade.
1.4. Concluding remarks and next steps
Productive jobs are essential for achieving sustainable rapid and shared economic growth. To
create the jobs needed to support its young and booming population, Tanzania will need to
grow faster, move towards more productive sectors, and make its current workforce more
productive.
Jobs are created by firms. While all firms can potentially help create employment, the
experience in successful countries has shown that productive jobs are more likely to be created
by three kinds of firms: (i) small and medium non-farm businesses; (ii) farms and agriculture;
and, (iii) exporting enterprises. The first ones are generally more dynamic and more prone to
absorb new workers. The second, farms and agriculture, have growth potential with an
abundance of unused natural resources and labor, as well as unfulfilled potential along the
value chain. Exporting firms present the dual advantage of promoting the expansion of sales
together with improvements in productivity required to be competitive on foreign markets.
These three channels are not exclusive but are found in any successful economy. The challenge
for Tanzanian policy makers is to understand better the dynamics of these firms to nourish
recent positive developments. These questions are examined in the next parts of this study.
corruption, lack of knowledge among informal traders on the customs and other trade-related regulations (including benefits from EAC Customs Union protocol) and lack of proper trade-supporting services (e.g., financing) appear to be leading constraints to informal traders.
37
PART 2: DRIVERS OF CHANGE: What makes firms create jobs?
While dynamic firms respond to a common set of forces, there are significant differences across firms and sectors. Farm and non-farm businesses do not exhibit the same type of dependence to size or skills. Exporting firms are more sensitive to connection costs to regional and global markets.
To succeed in Tanzania, a firm has to manage the skills, education, connectivity, access to finance, administrative burdens, labor productivity, innovation, electricity access, and land rights available to it here. By studying the effect of these factors on dynamic firms, policymakers can visualize a clearer path forward.
While major transformations will take time, clustering, regional trade, foreign direct investment, and adoption of new technology have the potential to catalyze growth and generate employment in the shorter term.
Which firms are more likely to create jobs? Why so some firms grow faster than others? How do
different factors affect different sectors? What are the main constraints preventing firms from
growing and employing more workers? Is it possible to accelerate the transformation process of
firms? Which catalysts can help make firms more productive?
2.1 Which firms create jobs?
Dynamic firms create jobs. New firms often create jobs from self-employment or family
employment; existing firms often create jobs by hiring external workers as they grow. Dynamic
firms do not just create jobs—they create productive jobs. Though enterprise growth does not
always generate new jobs, capital investment typically complements rather than substitutes for
labor in most of the dynamic Tanzanian firms.
The objective of this section is to better understand the behavior of dynamic firms in
Tanzania. While there are a series of common factors affecting firms’ performance, there are
also differences by firms and sectors. Our previous analysis has emphasized that (i) non-farm
businesses; (ii) dynamic farms; and (iii) exporting firms are different. For each of these
categories, successful businesses will be identified as well as the reasons for their success.
Expectations should be set from the start: Not all firms will grow and employ more labor. Many
businesses are not capable or interested in growing past a certain point. For many, particularly
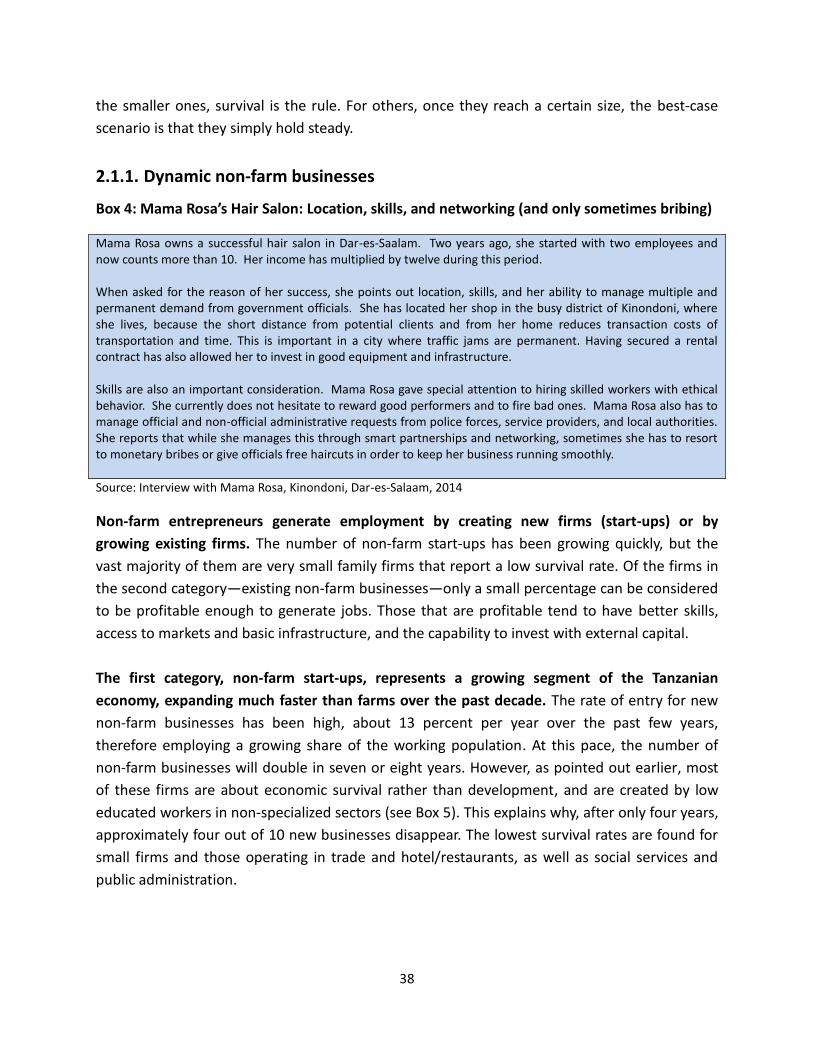
38
the smaller ones, survival is the rule. For others, once they reach a certain size, the best-case
scenario is that they simply hold steady.
2.1.1. Dynamic non-farm businesses
Box 4: Mama Rosa’s Hair Salon: Location, skills, and networking (and only sometimes bribing)
Mama Rosa owns a successful hair salon in Dar-es-Saalam. Two years ago, she started with two employees and now counts more than 10. Her income has multiplied by twelve during this period. When asked for the reason of her success, she points out location, skills, and her ability to manage multiple and permanent demand from government officials. She has located her shop in the busy district of Kinondoni, where she lives, because the short distance from potential clients and from her home reduces transaction costs of transportation and time. This is important in a city where traffic jams are permanent. Having secured a rental contract has also allowed her to invest in good equipment and infrastructure. Skills are also an important consideration. Mama Rosa gave special attention to hiring skilled workers with ethical behavior. She currently does not hesitate to reward good performers and to fire bad ones. Mama Rosa also has to manage official and non-official administrative requests from police forces, service providers, and local authorities. She reports that while she manages this through smart partnerships and networking, sometimes she has to resort to monetary bribes or give officials free haircuts in order to keep her business running smoothly.
Source: Interview with Mama Rosa, Kinondoni, Dar-es-Salaam, 2014
Non-farm entrepreneurs generate employment by creating new firms (start-ups) or by
growing existing firms. The number of non-farm start-ups has been growing quickly, but the
vast majority of them are very small family firms that report a low survival rate. Of the firms in
the second category—existing non-farm businesses—only a small percentage can be considered
to be profitable enough to generate jobs. Those that are profitable tend to have better skills,
access to markets and basic infrastructure, and the capability to invest with external capital.
The first category, non-farm start-ups, represents a growing segment of the Tanzanian
economy, expanding much faster than farms over the past decade. The rate of entry for new
non-farm businesses has been high, about 13 percent per year over the past few years,
therefore employing a growing share of the working population. At this pace, the number of
non-farm businesses will double in seven or eight years. However, as pointed out earlier, most
of these firms are about economic survival rather than development, and are created by low
educated workers in non-specialized sectors (see Box 5). This explains why, after only four years,
approximately four out of 10 new businesses disappear. The lowest survival rates are found for
small firms and those operating in trade and hotel/restaurants, as well as social services and
public administration.

39
Box 5: Who creates new businesses?
Start-ups are generally created in urban centers by entrepreneurs with low education. Family start-ups are also more likely to be female-owned than start-ups with external employees.
Start-ups with external employees are generally created by entrepreneurs with more education and wealth. These entrepreneurs are also more likely to have access to electricity, motor vehicles, and cell phones.
Source: NPS 2008/9, 2010/11
The second vehicle for job creation in this sector is the expansion of dynamic businesses. This
study measures the potential to grow using profitability. While there is no guarantee that
profitable firms will necessarily hire more workers, the reverse is certainly true: Unprofitable
firms are unlikely to increase their workforce. Defining dynamic firms by their profitability,
however, does provide the advantage of being measurable over time. By this metric, data
provided by the NPS26 reveal a scarcity in dynamic enterprises in Tanzania: As shown in Table 3,
90 percent of Tanzanian firm owners report a profit lower than TZS 282,000 (US$ 176), and the
median firm reports a monthly profit of only TZS 150,000 (US$ 94). At this level of profitability,
enterprises are just surviving, and hardly generating employment. However, profitability varies
greatly depending on location, sector, and size as well as owners’ assets and characteristics.
A multivariate regression on NPS data shows that profitability is linked strongly to skills,
market access, infrastructure, access to capital, and sector. The results of the regression, using
the panel data of 3887 observations collected between 2008/9 and 2010/11, are shown in Table
4.
26
The NPS 2008/09 and 2010/11 dataset is based on nationally representative household surveys that cover Dar es Salaam, other urban areas in Mainland, rural areas in Mainland, and Zanzibar. Data on formal and informal enterprise, ownership, and enterprise characteristics are gleaned from these household surveys. Since the survey was not designed specifically for enterprises, larger firms may not be captured well.
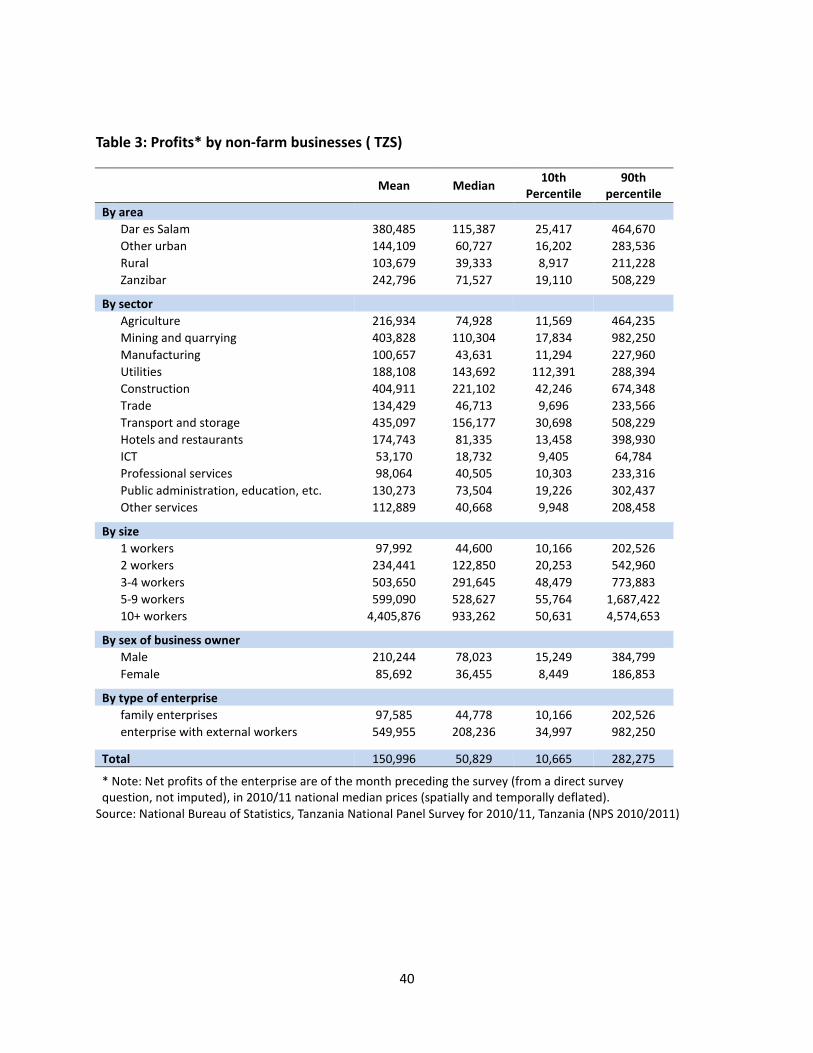
40
Table 3: Profits* by non-farm businesses ( TZS)
Mean Median
10th Percentile
90th percentile
By area
Dar es Salam 380,485 115,387 25,417 464,670
Other urban 144,109 60,727 16,202 283,536
Rural 103,679 39,333 8,917 211,228
Zanzibar 242,796 71,527 19,110 508,229
By sector
Agriculture 216,934 74,928 11,569 464,235
Mining and quarrying 403,828 110,304 17,834 982,250
Manufacturing 100,657 43,631 11,294 227,960
Utilities 188,108 143,692 112,391 288,394
Construction 404,911 221,102 42,246 674,348
Trade 134,429 46,713 9,696 233,566
Transport and storage 435,097 156,177 30,698 508,229
Hotels and restaurants 174,743 81,335 13,458 398,930
ICT 53,170 18,732 9,405 64,784
Professional services 98,064 40,505 10,303 233,316
Public administration, education, etc. 130,273 73,504 19,226 302,437
Other services 112,889 40,668 9,948 208,458
By size
1 workers 97,992 44,600 10,166 202,526
2 workers 234,441 122,850 20,253 542,960
3-4 workers 503,650 291,645 48,479 773,883
5-9 workers 599,090 528,627 55,764 1,687,422
10+ workers 4,405,876 933,262 50,631 4,574,653
By sex of business owner
Male 210,244 78,023 15,249 384,799
Female 85,692 36,455 8,449 186,853
By type of enterprise
family enterprises 97,585 44,778 10,166 202,526
enterprise with external workers 549,955 208,236 34,997 982,250
Total 150,996 50,829 10,665 282,275
* Note: Net profits of the enterprise are of the month preceding the survey (from a direct survey question, not imputed), in 2010/11 national median prices (spatially and temporally deflated).
Source: National Bureau of Statistics, Tanzania National Panel Survey for 2010/11, Tanzania (NPS 2010/2011)
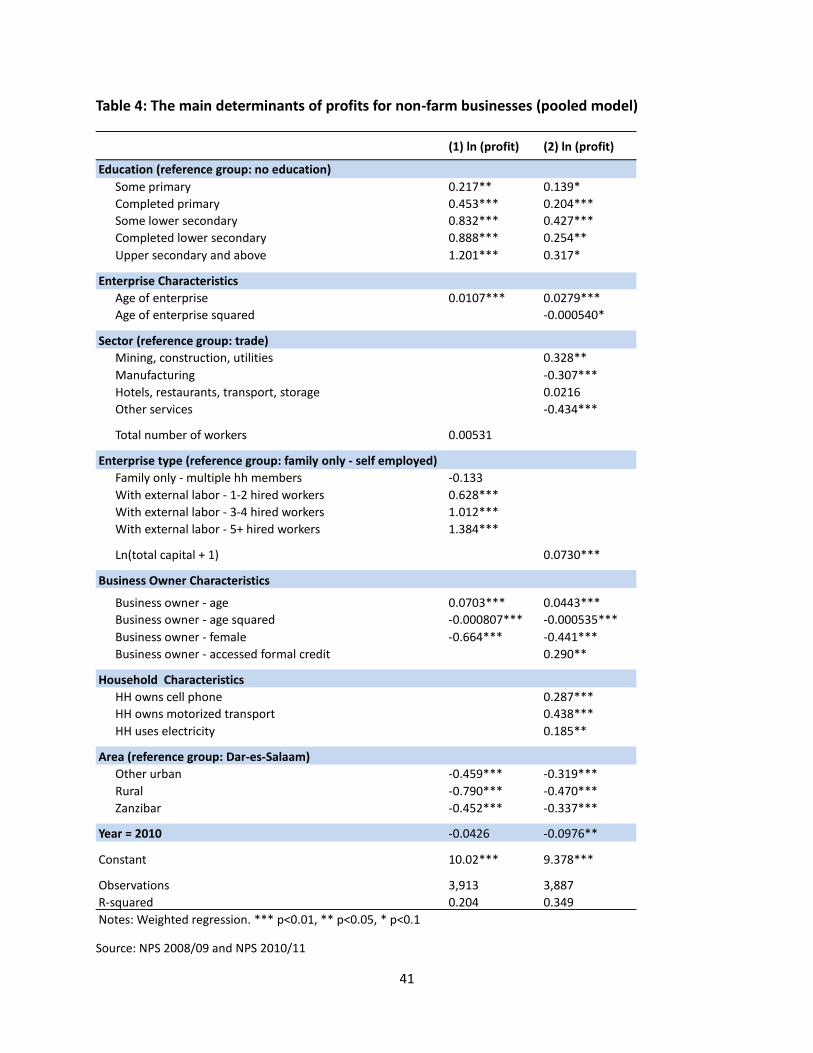
41
Table 4: The main determinants of profits for non-farm businesses (pooled model)
Source: NPS 2008/09 and NPS 2010/11
(1) ln (profit) (2) ln (profit)
Some primary 0.217** 0.139* Completed primary 0.453*** 0.204*** Some lower secondary 0.832*** 0.427*** Completed lower secondary 0.888*** 0.254** Upper secondary and above 1.201*** 0.317*
0.0107*** 0.0279*** -0.000540*
Sector (reference group: trade) Mining, construction, utilities 0.328** Manufacturing -0.307*** Hotels, restaurants, transport, storage 0.0216 Other services -0.434***
Total number of workers 0.00531
Enterprise type (reference group: family only - self employed) -0.133 0.628*** 1.012*** 1.384***
Ln(total capital + 1) 0.0730***
0.0703*** 0.0443*** -0.000807*** -0.000535*** -0.664*** -0.441***
0.290**
0.287*** 0.438*** 0.185**
Area (reference group: Dar-es-Salaam) Other urban -0.459*** -0.319*** Rural -0.790*** -0.470*** Zanzibar -0.452*** -0.337***
Year = 2010 -0.0426 -0.0976**
10.02*** 9.378***
3,913 3,887 0.204 0.349 R-squared
Notes: Weighted regression. *** p<0.01, ** p<0.05, * p<0.1
Family only - multiple hh members With external labor - 1-2 hired workers With external labor - 3-4 hired workers With external labor - 5+ hired workers
HH owns motorized transport HH uses electricity
Constant
Observations
Business owner - age Business owner - age squared Business owner - female Business owner - accessed formal credit
Household Characteristics HH owns cell phone
Age of enterprise squared
Business Owner Characteristics
Education (reference group: no education)
Enterprise Characteristics Age of enterprise
42
Overall, profitable enterprises are those with better skills, access to transport (for markets)
and basic infrastructure (electricity and mobile phone), as well as the ability to invest with the
use of external capital. 27 Location of the business also matters, with businesses that are based
in Dar es Salaam reporting consistently higher profits than those located in other urban areas
and rural areas. Our results also indicate that the sectors of mining, construction, and utilities
report significantly higher profit. By contrast, firms operating in services are less likely to be
profitable. The manufacturing sector also shows low profits, capturing the low productivity
associated to many small-scale operations in beverages, textiles, and furniture.
While these results will be further analyzed in the next section, it is worth underscoring that
the size of the enterprise (as measured by the number of workers) is also important. When
other factors are accounted for, there is an increasing and positive correlation between firm size
and profits, which indicates increasing returns to scale. Firms also appear to be more profitable
in sectors such as mining, construction, utilities; tourism and transport, which indicates the
importance of economies of scale in these sectors.
2.1.2. Dynamic farms
Box 6: Commercialization through partnerships
Many farmers in northwestern Tanzania have not been able to sell their crops because their produce has not always been of sufficiently high quality. As a result, they often could not find buyers for their produce, which meant that tomatoes and other crops often went rotten in the field. Transportation constraints and a lack of information relating to alternative markets meant that farmers had to wait for buyers to come to them.
Linking small farmers to a new buyer, Darsh Industries, one of the country’s main processors of fruit and vegetables, has enabled them to remain in business and created new opportunities. The program trained smallholder farmer groups in post-harvest practices. Through the program, many farmers visited the Darsh processing factory, where they learned how to meet quality standards. The program supplied 800 harvest crates and provided trucks for transport. The supported farmers sold almost 90 tons of tomatoes to the processor in just five weeks, allowing them to earn more than US$ 6,000 collectively.
This sustainable partnership will improve the lives of the farmers by providing them a permanent buyer for their crops. In the next growing season, local smallholders will sell more than 600 tons of produce to Darsh. Some farmer groups are reported to be increasing their levels of production now that they have a ready market for their tomatoes.
Source: USAID Article. “New market connection keeps small farmers in business.” Tanzania Agriculture Productivity
Program (TAPP), Issue #05.
Farming continues to be the main occupation of 2/3 of Tanzanian workers as more lands are
cultivated. Between 2002/03 and 2007/08, the surface of cultivable land increased by 4.5
27
Additional regressions by type of business indicate that for family-run enterprises, electricity is not a significant factor for profits, while enterprises that hire external workers show greater profits with access to electricity.
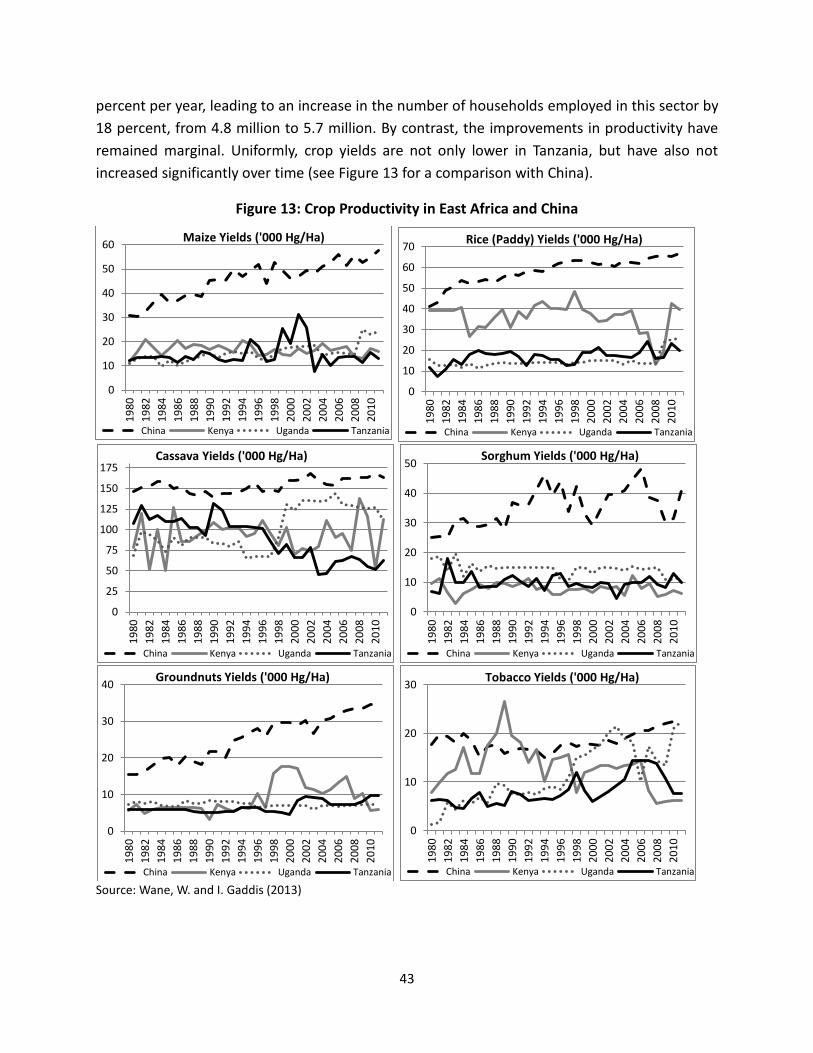
43
percent per year, leading to an increase in the number of households employed in this sector by
18 percent, from 4.8 million to 5.7 million. By contrast, the improvements in productivity have
remained marginal. Uniformly, crop yields are not only lower in Tanzania, but have also not
increased significantly over time (see Figure 13 for a comparison with China).
Figure 13: Crop Productivity in East Africa and China
Source: Wane, W. and I. Gaddis (2013)
0
10
20
30
40
50
60
19
80
19
82
19
84
19
86
19
88
19
90
19
92
19
94
19
96
19
98
20
00
20
02
20
04
20
06
20
08
20
10
Maize Yields ('000 Hg/Ha)
China Kenya Uganda Tanzania
0
10
20
30
40
50
60
70
19
80
19
82
19
84
19
86
19
88
19
90
19
92
19
94
19
96
19
98
20
00
20
02
20
04
20
06
20
08
20
10
Rice (Paddy) Yields ('000 Hg/Ha)
China Kenya Uganda Tanzania
0
25
50
75
100
125
150
175
19
80
19
82
19
84
19
86
19
88
19
90
19
92
19
94
19
96
19
98
20
00
20
02
20
04
20
06
20
08
20
10
Cassava Yields ('000 Hg/Ha)
China Kenya Uganda Tanzania
0
10
20
30
40
50
19
80
19
82
19
84
19
86
19
88
19
90
19
92
19
94
19
96
19
98
20
00
20
02
20
04
20
06
20
08
20
10
Sorghum Yields ('000 Hg/Ha)
China Kenya Uganda Tanzania
0
10
20
30
40
19
80
19
82
19
84
19
86
19
88
19
90
19
92
19
94
19
96
19
98
20
00
20
02
20
04
20
06
20
08
20
10
Groundnuts Yields ('000 Hg/Ha)
China Kenya Uganda Tanzania
0
10
20
30
19
80
19
82
19
84
19
86
19
88
19
90
19
92
19
94
19
96
19
98
20
00
20
02
20
04
20
06
20
08
20
10
Tobacco Yields ('000 Hg/Ha)
China Kenya Uganda Tanzania
44
Cultivating new land will continue to create new agricultural jobs, but the pace of this
extension will decline over time. The remaining pool of arable land that is not yet cultivated
(about 3/4) provides space for new investments. 28 This strategy is at the center of recent
government projects, including the SAGCOT initiatives in the South of the country. However,
assuming a constant annual growth rate of 4.5 percent of land used (rate between 2002/03 and
2007/08), Tanzania will have exhausted all of its cultivable land in less than 20 years.
Furthermore, land pressure already appears in populated areas such as Kilimanjaro, Arusha and
Mbeya. If Tanzania wants to continue to increase its agricultural production, and provide
employment to its rural population, it will have to change strategy.
Successful countries have been able to produce sustainable improvements in the productivity
of their agricultural sector. While productivity gains can be achieved by investments in capital
assets and technology, it can also translate into additional and better jobs. Thailand is a good
example: It grew the number of stable agricultural jobs from 519,000 in 1960 to almost three
million by 2008. As countries develop both the share and number of jobs in agriculture typically
decline. But countries with rich natural endowments of arable land and favorable climates – like
many countries in Africa – can defy this trend, at least in the short term.29
Identifying dynamic farms and their underlying reasons for growth is the first step toward
reinvigorating this sector in Tanzania. Using the dataset provided by the Agricultural Census
(2007/8), we have identified the main factors influencing farms’ productivity in Tanzania by crop
yield (Table 5). Overall, the results are consistent with those found in other studies.30
28
Southern Agricultural Growth Corridor of Tanzania (SAGCOT) website: (http://www.sagcot.com) 29
The substitution of labor by capital and technology is a long term process as revealed by the experience in China and India. While these two countries have been able to realize important gains in agricultural productivity, the share of their labor force employed in this sector only declined gradually over time. Second, diversification toward more labor intensive agricultural products (from maize to vegetables) has proved to be the response for high and better employment in Thailand. 30
Fuglie, Keith and Nin-Pratt, Alejandro. “Chapter 2: A Changing Global Harvest“ in 2012 Global Food Policy Report, IFPRI, March 14, 2013.
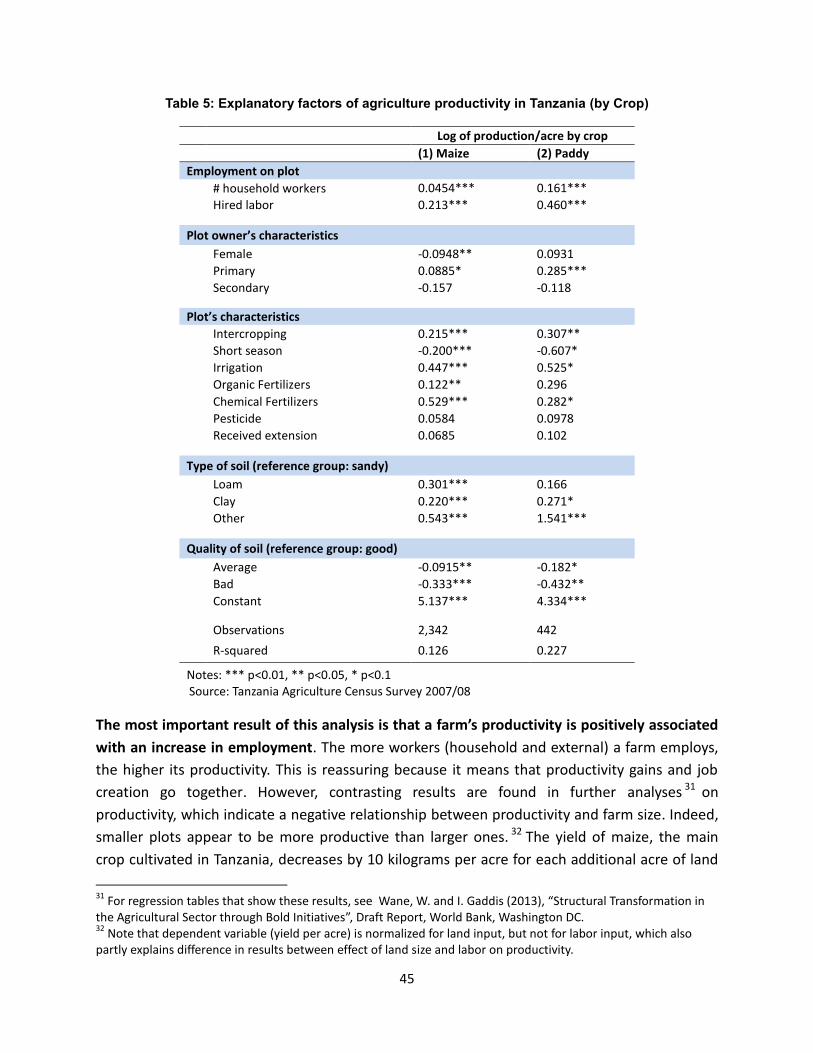
45
Table 5: Explanatory factors of agriculture productivity in Tanzania (by Crop)
Log of production/acre by crop
(1) Maize (2) Paddy
Employment on plot
# household workers 0.0454*** 0.161***
Hired labor 0.213*** 0.460***
Plot owner’s characteristics
Female -0.0948** 0.0931
Primary 0.0885* 0.285***
Secondary -0.157 -0.118
Plot’s characteristics
Intercropping 0.215*** 0.307**
Short season -0.200*** -0.607*
Irrigation 0.447*** 0.525*
Organic Fertilizers 0.122** 0.296
Chemical Fertilizers 0.529*** 0.282*
Pesticide 0.0584 0.0978
Received extension 0.0685 0.102
Type of soil (reference group: sandy)
Loam 0.301*** 0.166
Clay 0.220*** 0.271*
Other 0.543*** 1.541***
Quality of soil (reference group: good)
Average -0.0915** -0.182*
Bad -0.333*** -0.432**
Constant 5.137*** 4.334***
Observations 2,342 442
R-squared 0.126 0.227
Notes: *** p<0.01, ** p<0.05, * p<0.1 Source: Tanzania Agriculture Census Survey 2007/08
The most important result of this analysis is that a farm’s productivity is positively associated
with an increase in employment. The more workers (household and external) a farm employs,
the higher its productivity. This is reassuring because it means that productivity gains and job
creation go together. However, contrasting results are found in further analyses 31 on
productivity, which indicate a negative relationship between productivity and farm size. Indeed,
smaller plots appear to be more productive than larger ones. 32 The yield of maize, the main
crop cultivated in Tanzania, decreases by 10 kilograms per acre for each additional acre of land
31
For regression tables that show these results, see Wane, W. and I. Gaddis (2013), “Structural Transformation in the Agricultural Sector through Bold Initiatives”, Draft Report, World Bank, Washington DC. 32
Note that dependent variable (yield per acre) is normalized for land input, but not for labor input, which also partly explains difference in results between effect of land size and labor on productivity.
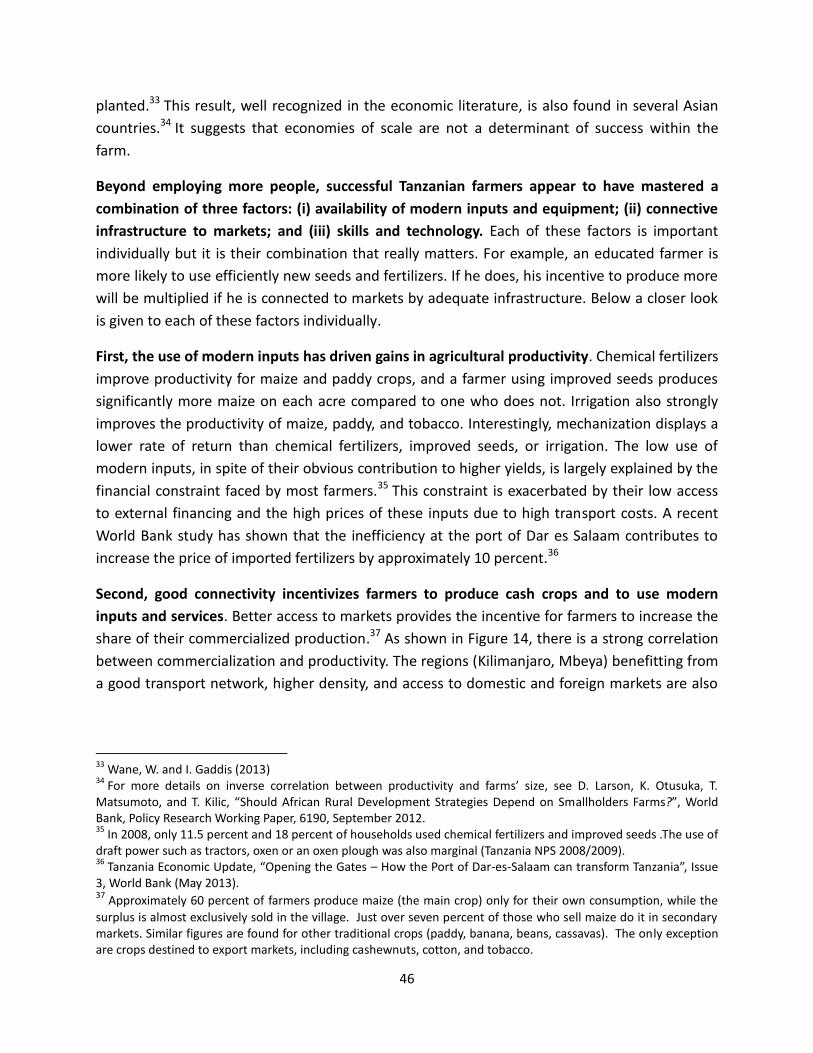
46
planted.33 This result, well recognized in the economic literature, is also found in several Asian
countries.34 It suggests that economies of scale are not a determinant of success within the
farm.
Beyond employing more people, successful Tanzanian farmers appear to have mastered a
combination of three factors: (i) availability of modern inputs and equipment; (ii) connective
infrastructure to markets; and (iii) skills and technology. Each of these factors is important
individually but it is their combination that really matters. For example, an educated farmer is
more likely to use efficiently new seeds and fertilizers. If he does, his incentive to produce more
will be multiplied if he is connected to markets by adequate infrastructure. Below a closer look
is given to each of these factors individually.
First, the use of modern inputs has driven gains in agricultural productivity. Chemical fertilizers
improve productivity for maize and paddy crops, and a farmer using improved seeds produces
significantly more maize on each acre compared to one who does not. Irrigation also strongly
improves the productivity of maize, paddy, and tobacco. Interestingly, mechanization displays a
lower rate of return than chemical fertilizers, improved seeds, or irrigation. The low use of
modern inputs, in spite of their obvious contribution to higher yields, is largely explained by the
financial constraint faced by most farmers.35 This constraint is exacerbated by their low access
to external financing and the high prices of these inputs due to high transport costs. A recent
World Bank study has shown that the inefficiency at the port of Dar es Salaam contributes to
increase the price of imported fertilizers by approximately 10 percent.36
Second, good connectivity incentivizes farmers to produce cash crops and to use modern
inputs and services. Better access to markets provides the incentive for farmers to increase the
share of their commercialized production.37 As shown in Figure 14, there is a strong correlation
between commercialization and productivity. The regions (Kilimanjaro, Mbeya) benefitting from
a good transport network, higher density, and access to domestic and foreign markets are also
33
Wane, W. and I. Gaddis (2013) 34
For more details on inverse correlation between productivity and farms’ size, see D. Larson, K. Otusuka, T. Matsumoto, and T. Kilic, “Should African Rural Development Strategies Depend on Smallholders Farms?”, World Bank, Policy Research Working Paper, 6190, September 2012. 35
In 2008, only 11.5 percent and 18 percent of households used chemical fertilizers and improved seeds .The use of draft power such as tractors, oxen or an oxen plough was also marginal (Tanzania NPS 2008/2009). 36
Tanzania Economic Update, “Opening the Gates – How the Port of Dar-es-Salaam can transform Tanzania”, Issue 3, World Bank (May 2013). 37 Approximately 60 percent of farmers produce maize (the main crop) only for their own consumption, while the
surplus is almost exclusively sold in the village. Just over seven percent of those who sell maize do it in secondary markets. Similar figures are found for other traditional crops (paddy, banana, beans, cassavas). The only exception are crops destined to export markets, including cashewnuts, cotton, and tobacco.
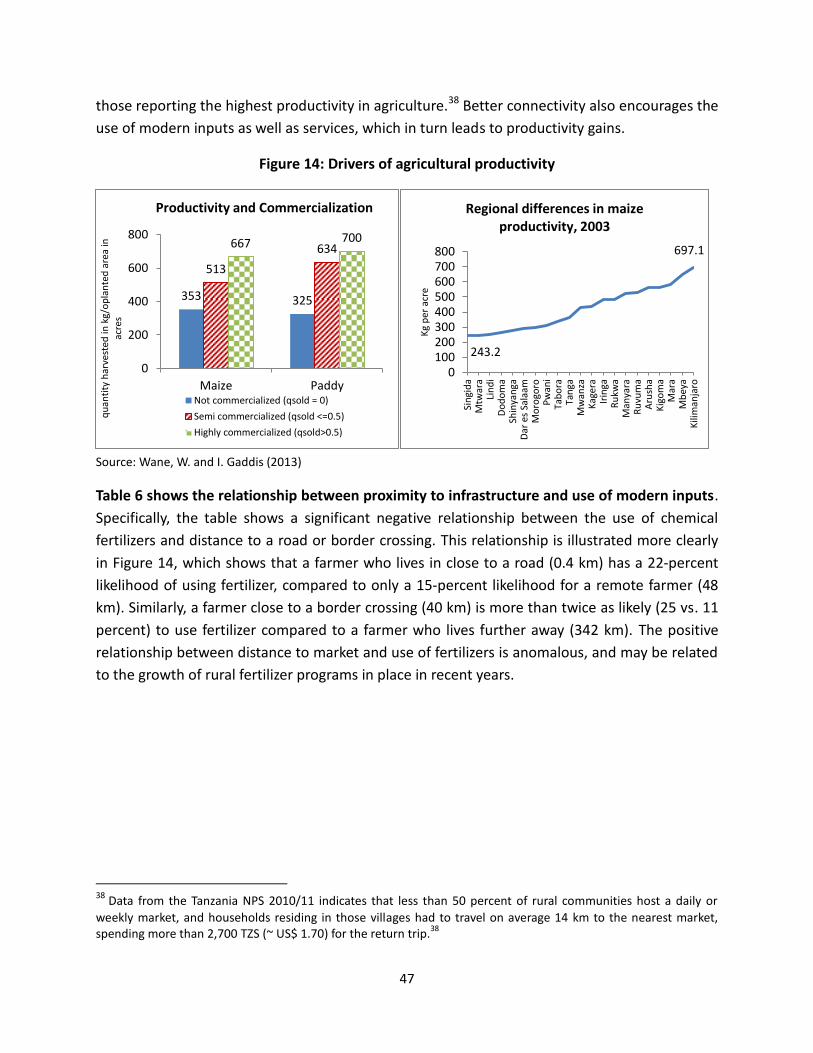
47
those reporting the highest productivity in agriculture.38 Better connectivity also encourages the
use of modern inputs as well as services, which in turn leads to productivity gains.
Figure 14: Drivers of agricultural productivity
Source: Wane, W. and I. Gaddis (2013)
Table 6 shows the relationship between proximity to infrastructure and use of modern inputs.
Specifically, the table shows a significant negative relationship between the use of chemical
fertilizers and distance to a road or border crossing. This relationship is illustrated more clearly
in Figure 14, which shows that a farmer who lives in close to a road (0.4 km) has a 22-percent
likelihood of using fertilizer, compared to only a 15-percent likelihood for a remote farmer (48
km). Similarly, a farmer close to a border crossing (40 km) is more than twice as likely (25 vs. 11
percent) to use fertilizer compared to a farmer who lives further away (342 km). The positive
relationship between distance to market and use of fertilizers is anomalous, and may be related
to the growth of rural fertilizer programs in place in recent years.
38 Data from the Tanzania NPS 2010/11 indicates that less than 50 percent of rural communities host a daily or
weekly market, and households residing in those villages had to travel on average 14 km to the nearest market, spending more than 2,700 TZS (~ US$ 1.70) for the return trip.
38
353 325
513
634 667 700
0
200
400
600
800
Maize Paddy
qu
anti
ty h
arve
sted
in k
g/o
pla
nte
d a
rea
in
acre
s
Productivity and Commercialization
Not commercialized (qsold = 0)
Semi commercialized (qsold <=0.5)
Highly commercialized (qsold>0.5)
243.2
697.1
0100200300400500600700800
Sin
gid
aM
twar
aLi
nd
iD
od
om
aSh
inya
nga
Dar
es
Sala
amM
oro
goro
Pw
ani
Tab
ora
Tan
gaM
wan
zaK
ager
aIr
inga
Ru
kwa
Man
yara
Ru
vum
aA
rush
aK
igo
ma
Mar
aM
bey
aK
ilim
anja
ro
Kg
per
acr
e
Regional differences in maize productivity, 2003
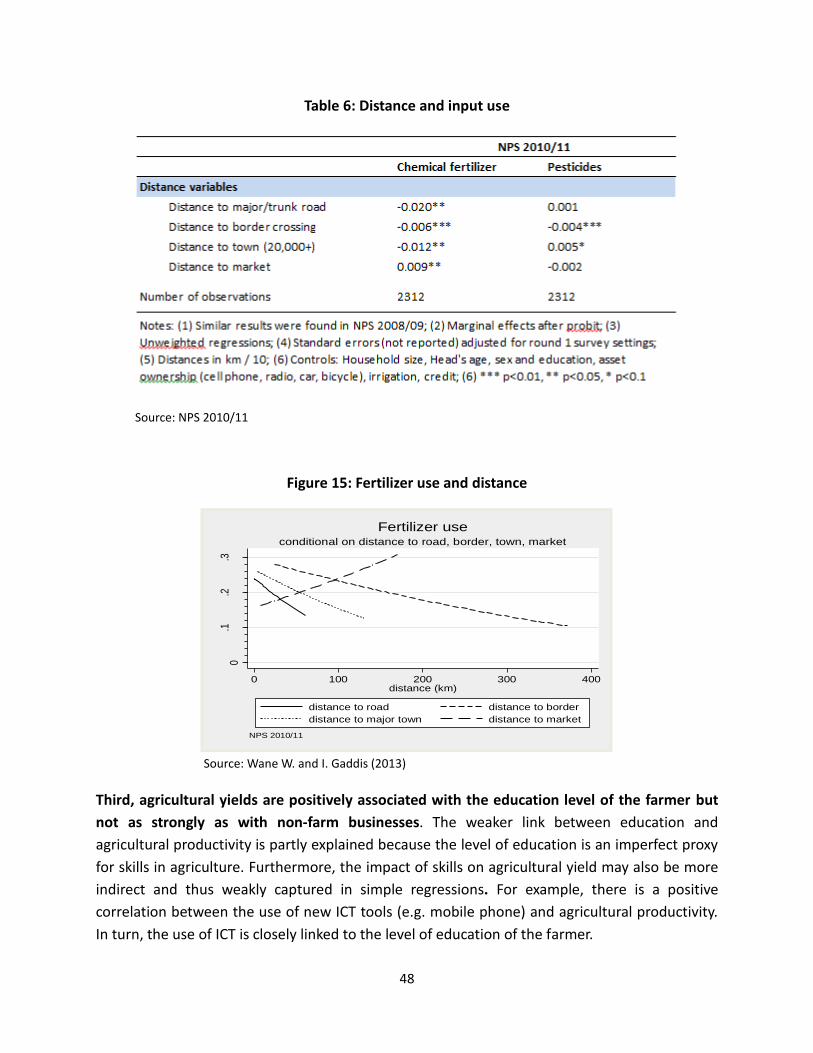
48
Table 6: Distance and input use
Source: NPS 2010/11
Figure 15: Fertilizer use and distance
Source: Wane W. and I. Gaddis (2013)
Third, agricultural yields are positively associated with the education level of the farmer but
not as strongly as with non-farm businesses. The weaker link between education and
agricultural productivity is partly explained because the level of education is an imperfect proxy
for skills in agriculture. Furthermore, the impact of skills on agricultural yield may also be more
indirect and thus weakly captured in simple regressions. For example, there is a positive
correlation between the use of new ICT tools (e.g. mobile phone) and agricultural productivity.
In turn, the use of ICT is closely linked to the level of education of the farmer.
0.1
.2.3
Pro
babi
lity
of u
sing
che
mic
al fe
rtili
zer
0 100 200 300 400distance (km)
distance to road distance to border
distance to major town distance to market
NPS 2010/11
conditional on distance to road, border, town, market
Fertilizer use
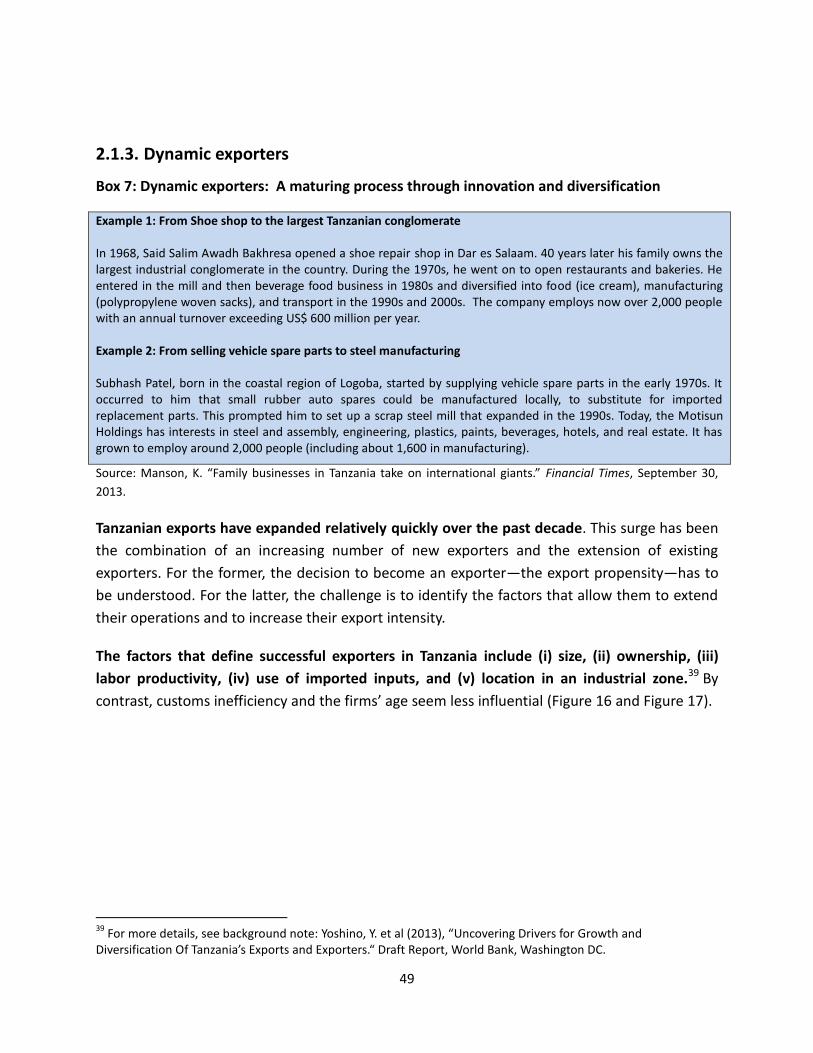
49
2.1.3. Dynamic exporters
Box 7: Dynamic exporters: A maturing process through innovation and diversification
Example 1: From Shoe shop to the largest Tanzanian conglomerate In 1968, Said Salim Awadh Bakhresa opened a shoe repair shop in Dar es Salaam. 40 years later his family owns the largest industrial conglomerate in the country. During the 1970s, he went on to open restaurants and bakeries. He entered in the mill and then beverage food business in 1980s and diversified into food (ice cream), manufacturing (polypropylene woven sacks), and transport in the 1990s and 2000s. The company employs now over 2,000 people with an annual turnover exceeding US$ 600 million per year. Example 2: From selling vehicle spare parts to steel manufacturing Subhash Patel, born in the coastal region of Logoba, started by supplying vehicle spare parts in the early 1970s. It occurred to him that small rubber auto spares could be manufactured locally, to substitute for imported replacement parts. This prompted him to set up a scrap steel mill that expanded in the 1990s. Today, the Motisun Holdings has interests in steel and assembly, engineering, plastics, paints, beverages, hotels, and real estate. It has grown to employ around 2,000 people (including about 1,600 in manufacturing).
Source: Manson, K. “Family businesses in Tanzania take on international giants.” Financial Times, September 30,
2013.
Tanzanian exports have expanded relatively quickly over the past decade. This surge has been
the combination of an increasing number of new exporters and the extension of existing
exporters. For the former, the decision to become an exporter—the export propensity—has to
be understood. For the latter, the challenge is to identify the factors that allow them to extend
their operations and to increase their export intensity.
The factors that define successful exporters in Tanzania include (i) size, (ii) ownership, (iii)
labor productivity, (iv) use of imported inputs, and (v) location in an industrial zone.39 By
contrast, customs inefficiency and the firms’ age seem less influential (Figure 16 and Figure 17).
39
For more details, see background note: Yoshino, Y. et al (2013), “Uncovering Drivers for Growth and Diversification Of Tanzania’s Exports and Exporters.“ Draft Report, World Bank, Washington DC.
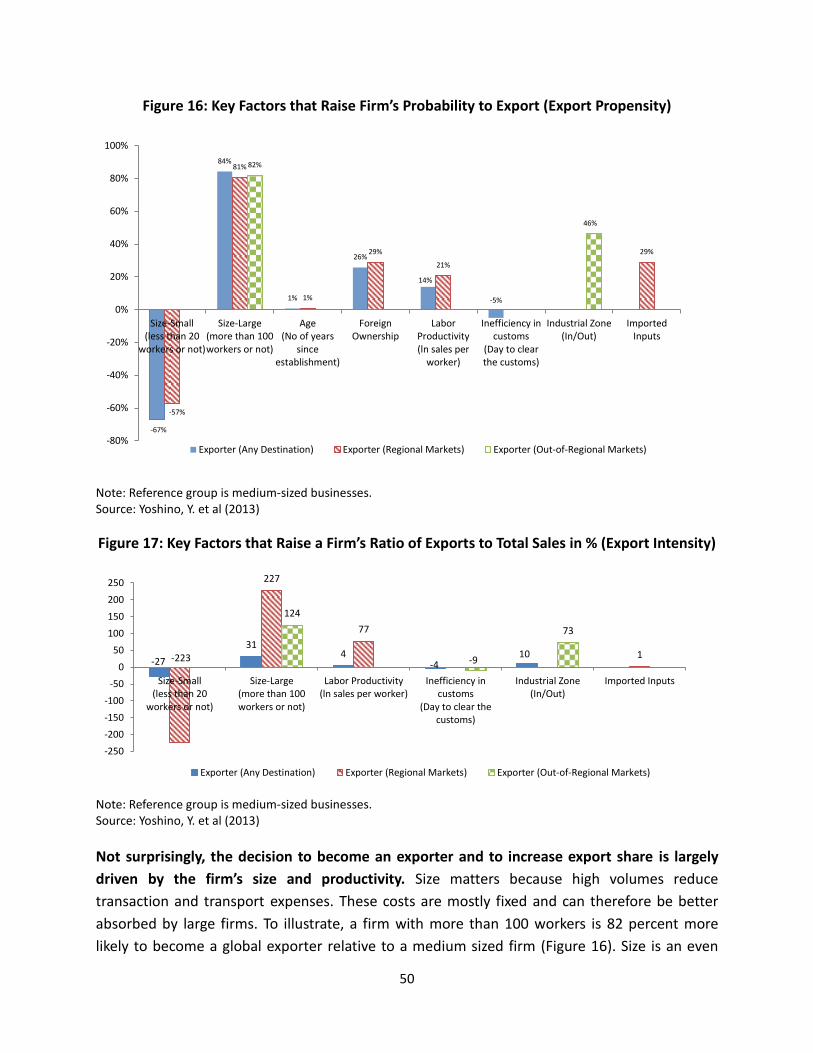
50
Figure 16: Key Factors that Raise Firm’s Probability to Export (Export Propensity)
Note: Reference group is medium-sized businesses. Source: Yoshino, Y. et al (2013)
Figure 17: Key Factors that Raise a Firm’s Ratio of Exports to Total Sales in % (Export Intensity)
Note: Reference group is medium-sized businesses. Source: Yoshino, Y. et al (2013)
Not surprisingly, the decision to become an exporter and to increase export share is largely
driven by the firm’s size and productivity. Size matters because high volumes reduce
transaction and transport expenses. These costs are mostly fixed and can therefore be better
absorbed by large firms. To illustrate, a firm with more than 100 workers is 82 percent more
likely to become a global exporter relative to a medium sized firm (Figure 16). Size is an even
-67%
84%
1%
26%
14%
-5%
-57%
81%
1%
29%
21%
29%
82%
46%
-80%
-60%
-40%
-20%
0%
20%
40%
60%
80%
100%
Size-Small(less than 20
workers or not)
Size-Large(more than 100workers or not)
Age(No of years
sinceestablishment)
ForeignOwnership
LaborProductivity(ln sales per
worker)
Inefficiency incustoms
(Day to clearthe customs)
Industrial Zone(In/Out)
ImportedInputs
Exporter (Any Destination) Exporter (Regional Markets) Exporter (Out-of-Regional Markets)
-27
31 4
-4 10 -223
227
77
1
124
-9
73
-250
-200
-150
-100
-50
0
50
100
150
200
250
Size-Small(less than 20
workers or not)
Size-Large(more than 100workers or not)
Labor Productivity(ln sales per worker)
Inefficiency incustoms
(Day to clear thecustoms)
Industrial Zone(In/Out)
Imported Inputs
Exporter (Any Destination) Exporter (Regional Markets) Exporter (Out-of-Regional Markets)
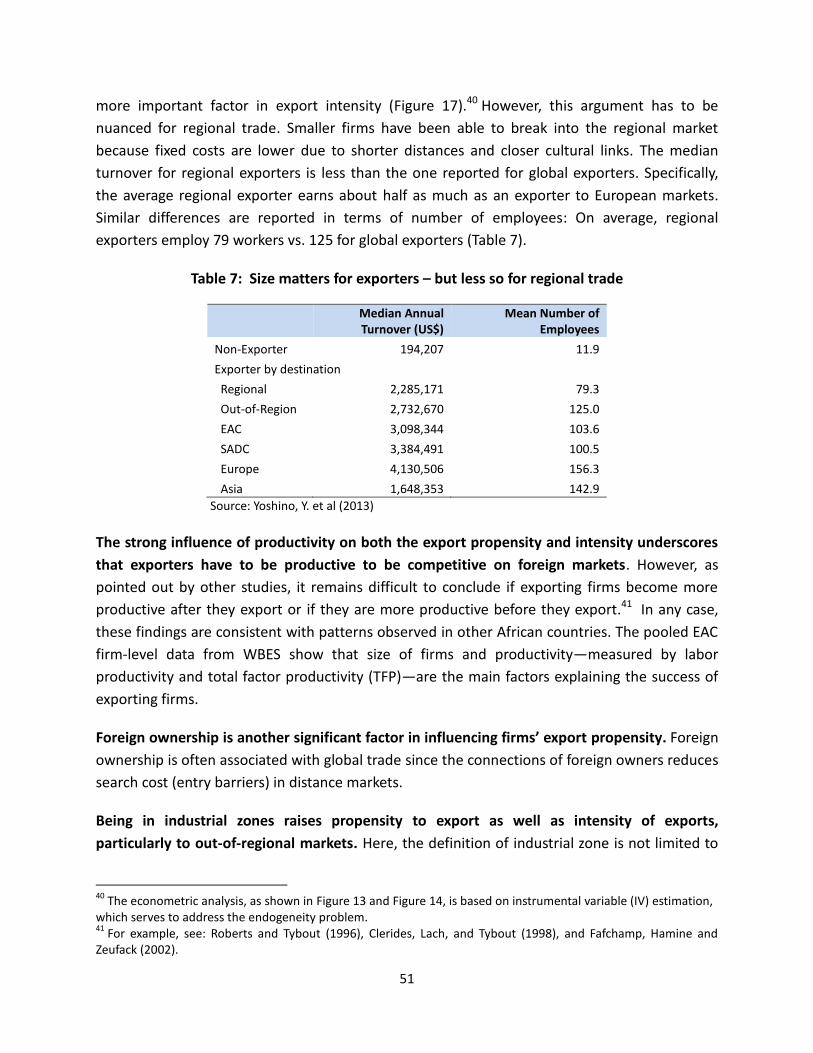
51
more important factor in export intensity (Figure 17).40 However, this argument has to be
nuanced for regional trade. Smaller firms have been able to break into the regional market
because fixed costs are lower due to shorter distances and closer cultural links. The median
turnover for regional exporters is less than the one reported for global exporters. Specifically,
the average regional exporter earns about half as much as an exporter to European markets.
Similar differences are reported in terms of number of employees: On average, regional
exporters employ 79 workers vs. 125 for global exporters (Table 7).
Table 7: Size matters for exporters – but less so for regional trade
Median Annual Turnover (US$)
Mean Number of Employees
Non-Exporter 194,207 11.9
Exporter by destination
Regional 2,285,171 79.3
Out-of-Region 2,732,670 125.0
EAC 3,098,344 103.6
SADC 3,384,491 100.5
Europe 4,130,506 156.3
Asia 1,648,353 142.9
Source: Yoshino, Y. et al (2013)
The strong influence of productivity on both the export propensity and intensity underscores
that exporters have to be productive to be competitive on foreign markets. However, as
pointed out by other studies, it remains difficult to conclude if exporting firms become more
productive after they export or if they are more productive before they export.41 In any case,
these findings are consistent with patterns observed in other African countries. The pooled EAC
firm-level data from WBES show that size of firms and productivity—measured by labor
productivity and total factor productivity (TFP)—are the main factors explaining the success of
exporting firms.
Foreign ownership is another significant factor in influencing firms’ export propensity. Foreign
ownership is often associated with global trade since the connections of foreign owners reduces
search cost (entry barriers) in distance markets.
Being in industrial zones raises propensity to export as well as intensity of exports,
particularly to out-of-regional markets. Here, the definition of industrial zone is not limited to
40
The econometric analysis, as shown in Figure 13 and Figure 14, is based on instrumental variable (IV) estimation, which serves to address the endogeneity problem. 41
For example, see: Roberts and Tybout (1996), Clerides, Lach, and Tybout (1998), and Fafchamp, Hamine and Zeufack (2002).
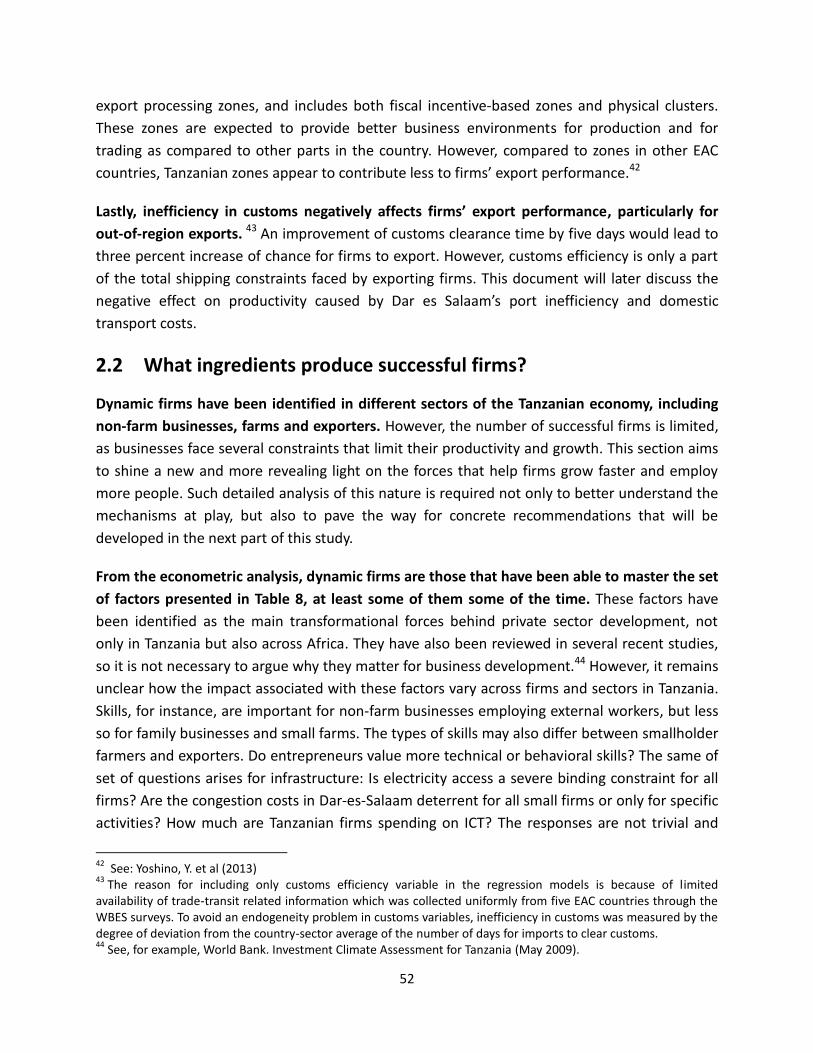
52
export processing zones, and includes both fiscal incentive-based zones and physical clusters.
These zones are expected to provide better business environments for production and for
trading as compared to other parts in the country. However, compared to zones in other EAC
countries, Tanzanian zones appear to contribute less to firms’ export performance.42
Lastly, inefficiency in customs negatively affects firms’ export performance, particularly for
out-of-region exports. 43 An improvement of customs clearance time by five days would lead to
three percent increase of chance for firms to export. However, customs efficiency is only a part
of the total shipping constraints faced by exporting firms. This document will later discuss the
negative effect on productivity caused by Dar es Salaam’s port inefficiency and domestic
transport costs.
2.2 What ingredients produce successful firms?
Dynamic firms have been identified in different sectors of the Tanzanian economy, including
non-farm businesses, farms and exporters. However, the number of successful firms is limited,
as businesses face several constraints that limit their productivity and growth. This section aims
to shine a new and more revealing light on the forces that help firms grow faster and employ
more people. Such detailed analysis of this nature is required not only to better understand the
mechanisms at play, but also to pave the way for concrete recommendations that will be
developed in the next part of this study.
From the econometric analysis, dynamic firms are those that have been able to master the set
of factors presented in Table 8, at least some of them some of the time. These factors have
been identified as the main transformational forces behind private sector development, not
only in Tanzania but also across Africa. They have also been reviewed in several recent studies,
so it is not necessary to argue why they matter for business development.44 However, it remains
unclear how the impact associated with these factors vary across firms and sectors in Tanzania.
Skills, for instance, are important for non-farm businesses employing external workers, but less
so for family businesses and small farms. The types of skills may also differ between smallholder
farmers and exporters. Do entrepreneurs value more technical or behavioral skills? The same of
set of questions arises for infrastructure: Is electricity access a severe binding constraint for all
firms? Are the congestion costs in Dar-es-Salaam deterrent for all small firms or only for specific
activities? How much are Tanzanian firms spending on ICT? The responses are not trivial and
42
See: Yoshino, Y. et al (2013) 43
The reason for including only customs efficiency variable in the regression models is because of limited availability of trade-transit related information which was collected uniformly from five EAC countries through the WBES surveys. To avoid an endogeneity problem in customs variables, inefficiency in customs was measured by the degree of deviation from the country-sector average of the number of days for imports to clear customs. 44
See, for example, World Bank. Investment Climate Assessment for Tanzania (May 2009).
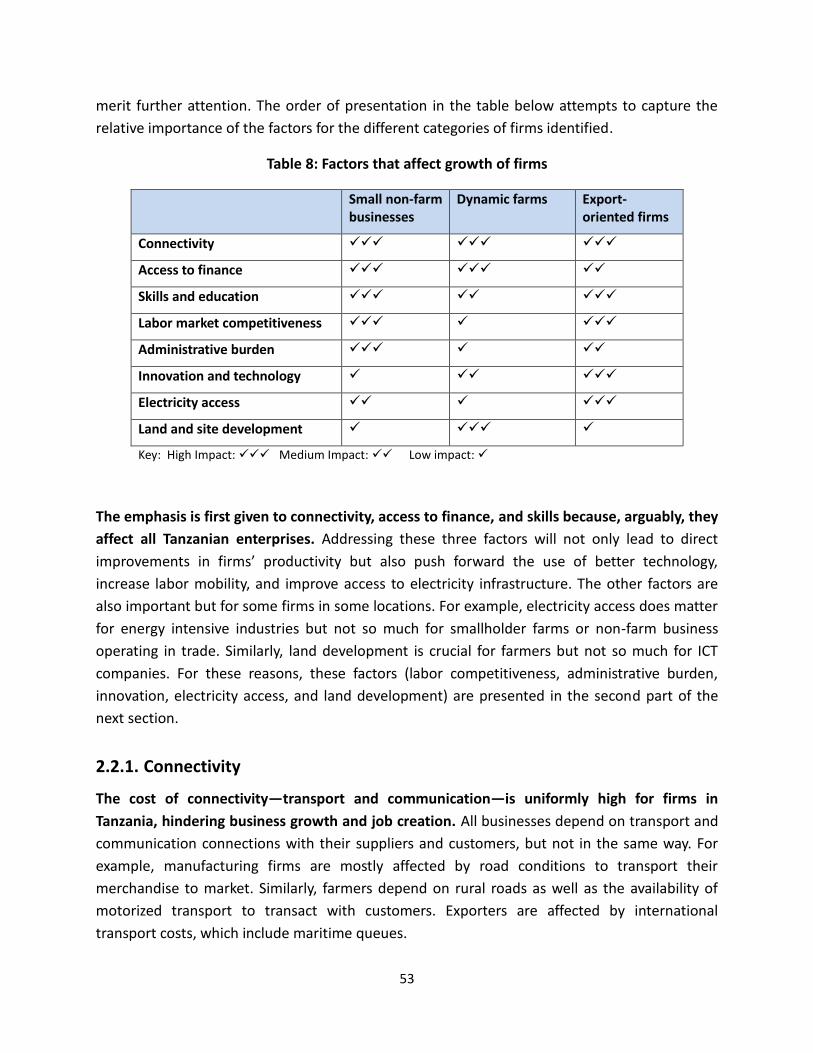
53
merit further attention. The order of presentation in the table below attempts to capture the
relative importance of the factors for the different categories of firms identified.
Table 8: Factors that affect growth of firms
Small non-farm businesses
Dynamic farms Export-oriented firms
Connectivity
Access to finance
Skills and education
Labor market competitiveness
Administrative burden
Innovation and technology
Electricity access
Land and site development
Key: High Impact: Medium Impact: Low impact:
The emphasis is first given to connectivity, access to finance, and skills because, arguably, they
affect all Tanzanian enterprises. Addressing these three factors will not only lead to direct
improvements in firms’ productivity but also push forward the use of better technology,
increase labor mobility, and improve access to electricity infrastructure. The other factors are
also important but for some firms in some locations. For example, electricity access does matter
for energy intensive industries but not so much for smallholder farms or non-farm business
operating in trade. Similarly, land development is crucial for farmers but not so much for ICT
companies. For these reasons, these factors (labor competitiveness, administrative burden,
innovation, electricity access, and land development) are presented in the second part of the
next section.
2.2.1. Connectivity
The cost of connectivity—transport and communication—is uniformly high for firms in
Tanzania, hindering business growth and job creation. All businesses depend on transport and
communication connections with their suppliers and customers, but not in the same way. For
example, manufacturing firms are mostly affected by road conditions to transport their
merchandise to market. Similarly, farmers depend on rural roads as well as the availability of
motorized transport to transact with customers. Exporters are affected by international
transport costs, which include maritime queues.
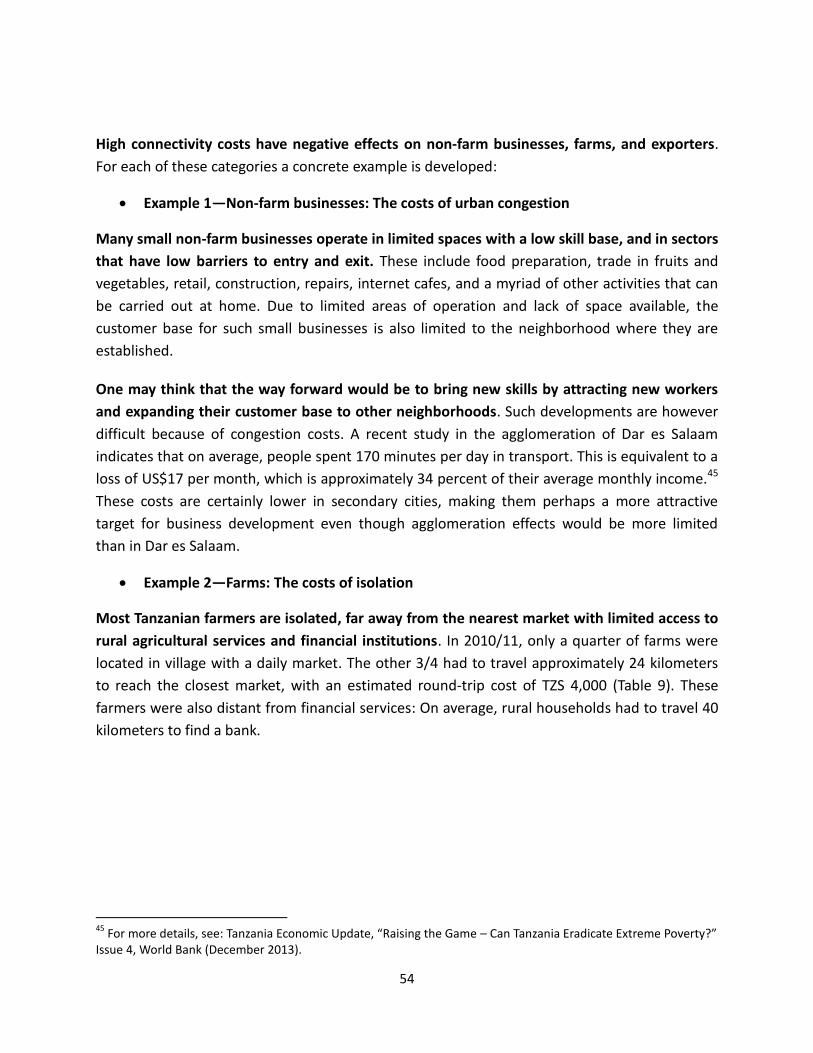
54
High connectivity costs have negative effects on non-farm businesses, farms, and exporters.
For each of these categories a concrete example is developed:
Example 1—Non-farm businesses: The costs of urban congestion
Many small non-farm businesses operate in limited spaces with a low skill base, and in sectors
that have low barriers to entry and exit. These include food preparation, trade in fruits and
vegetables, retail, construction, repairs, internet cafes, and a myriad of other activities that can
be carried out at home. Due to limited areas of operation and lack of space available, the
customer base for such small businesses is also limited to the neighborhood where they are
established.
One may think that the way forward would be to bring new skills by attracting new workers
and expanding their customer base to other neighborhoods. Such developments are however
difficult because of congestion costs. A recent study in the agglomeration of Dar es Salaam
indicates that on average, people spent 170 minutes per day in transport. This is equivalent to a
loss of US$17 per month, which is approximately 34 percent of their average monthly income.45
These costs are certainly lower in secondary cities, making them perhaps a more attractive
target for business development even though agglomeration effects would be more limited
than in Dar es Salaam.
Example 2—Farms: The costs of isolation
Most Tanzanian farmers are isolated, far away from the nearest market with limited access to
rural agricultural services and financial institutions. In 2010/11, only a quarter of farms were
located in village with a daily market. The other 3/4 had to travel approximately 24 kilometers
to reach the closest market, with an estimated round-trip cost of TZS 4,000 (Table 9). These
farmers were also distant from financial services: On average, rural households had to travel 40
kilometers to find a bank.
45
For more details, see: Tanzania Economic Update, “Raising the Game – Can Tanzania Eradicate Extreme Poverty?” Issue 4, World Bank (December 2013).
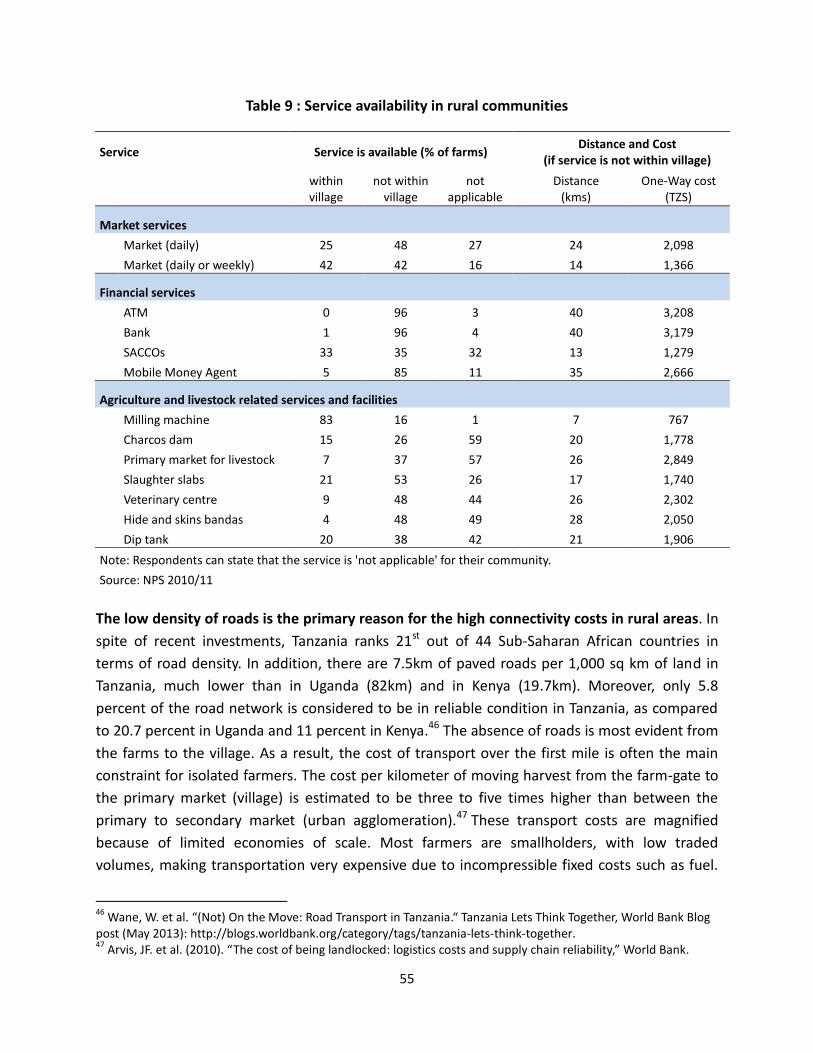
55
Table 9 : Service availability in rural communities
Service Service is available (% of farms) Distance and Cost
(if service is not within village)
within village
not within village
not applicable
Distance
(kms) One-Way cost
(TZS)
Market services
Market (daily) 25 48 27
24 2,098
Market (daily or weekly) 42 42 16 14 1,366
Financial services
ATM 0 96 3
40 3,208
Bank 1 96 4
40 3,179
SACCOs 33 35 32
13 1,279
Mobile Money Agent 5 85 11 35 2,666
Agriculture and livestock related services and facilities
Milling machine 83 16 1
7 767
Charcos dam 15 26 59
20 1,778
Primary market for livestock 7 37 57
26 2,849
Slaughter slabs 21 53 26
17 1,740
Veterinary centre 9 48 44
26 2,302
Hide and skins bandas 4 48 49
28 2,050
Dip tank 20 38 42 21 1,906
Note: Respondents can state that the service is 'not applicable' for their community.
Source: NPS 2010/11
The low density of roads is the primary reason for the high connectivity costs in rural areas. In
spite of recent investments, Tanzania ranks 21st out of 44 Sub-Saharan African countries in
terms of road density. In addition, there are 7.5km of paved roads per 1,000 sq km of land in
Tanzania, much lower than in Uganda (82km) and in Kenya (19.7km). Moreover, only 5.8
percent of the road network is considered to be in reliable condition in Tanzania, as compared
to 20.7 percent in Uganda and 11 percent in Kenya.46 The absence of roads is most evident from
the farms to the village. As a result, the cost of transport over the first mile is often the main
constraint for isolated farmers. The cost per kilometer of moving harvest from the farm-gate to
the primary market (village) is estimated to be three to five times higher than between the
primary to secondary market (urban agglomeration).47 These transport costs are magnified
because of limited economies of scale. Most farmers are smallholders, with low traded
volumes, making transportation very expensive due to incompressible fixed costs such as fuel.
46
Wane, W. et al. “(Not) On the Move: Road Transport in Tanzania.“ Tanzania Lets Think Together, World Bank Blog post (May 2013): http://blogs.worldbank.org/category/tags/tanzania-lets-think-together. 47
Arvis, JF. et al. (2010). “The cost of being landlocked: logistics costs and supply chain reliability,” World Bank.
56
Aggregating individual harvests through associations is relatively difficult at the farm level—this
process can take place at a later stage when merchandise is transported from the village to at
the wholesale market.
The second factor that influences transport costs is the quantity of administrative barriers
that slow down the movement of goods and labor. For instance, there are 29 roadblocks
between Dar es Salaam and the Zambian border.48
The third factor behind high transport costs is the limited access to modern transportation
modes. Today, only 4.2 percent of farmers report ownership of a car, truck or motorcycle.49 In
addition, there are few trucks available at the farm-gate or even at the village. Railways are also
not available in many regions. These restricted options reduce the bargaining power of farmers,
who often have to pay high prices to transporters.
High transport costs also undermine the productivity of Tanzanian farms by reducing their
propensity to use modern inputs and limiting their choice of crops. As examined earlier in
Section 2.1.2, the use of fertilizers dramatically declines with distance from a road. The use of
pesticides and improved seeds also declines with distance even though this relationship is
weaker and less consistent than for fertilizer. The second way through which distance negatively
affects farm productivity is by restricting the choice of crops. Controlling for other variables,
Table 10 shows how various distance variables affect the likelihood to engage in the production
of pulses/nuts, fruits, vegetables and cash crops, relative to traditional food crops (cereals,
tubers, roots). The greater the distances to roads, markets and borders, the lower the
probability for the farmer to grow higher value crops.50
48
See: Msamba, V. P. (2012). “Non-Tariff Barriers along the Dar Corridor,“ Baseline Survey. 49
Tanzania NPS 2010/11. 50
The coefficients for all distance variables, other than ‘distance to nearest population center’ are negatively related to the probability of growing higher value crops. This may be partly related to issues of multicollinearity between distance variables.
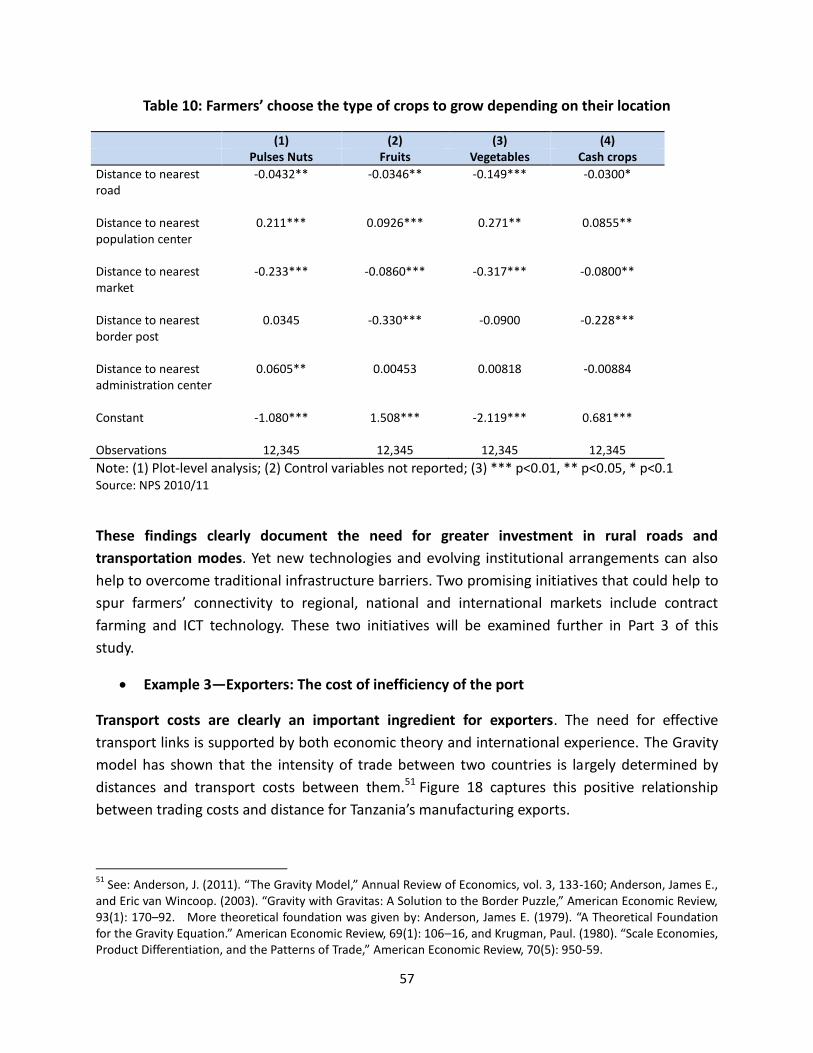
57
Table 10: Farmers’ choose the type of crops to grow depending on their location
(1) (2) (3) (4) Pulses Nuts Fruits Vegetables Cash crops
Distance to nearest road
-0.0432** -0.0346** -0.149*** -0.0300*
Distance to nearest population center
0.211*** 0.0926*** 0.271** 0.0855**
Distance to nearest market
-0.233*** -0.0860*** -0.317*** -0.0800**
Distance to nearest border post
0.0345 -0.330*** -0.0900 -0.228***
Distance to nearest administration center
0.0605** 0.00453 0.00818 -0.00884
Constant -1.080*** 1.508*** -2.119*** 0.681*** Observations 12,345 12,345 12,345 12,345
Note: (1) Plot-level analysis; (2) Control variables not reported; (3) *** p<0.01, ** p<0.05, * p<0.1 Source: NPS 2010/11
These findings clearly document the need for greater investment in rural roads and
transportation modes. Yet new technologies and evolving institutional arrangements can also
help to overcome traditional infrastructure barriers. Two promising initiatives that could help to
spur farmers’ connectivity to regional, national and international markets include contract
farming and ICT technology. These two initiatives will be examined further in Part 3 of this
study.
Example 3—Exporters: The cost of inefficiency of the port
Transport costs are clearly an important ingredient for exporters. The need for effective
transport links is supported by both economic theory and international experience. The Gravity
model has shown that the intensity of trade between two countries is largely determined by
distances and transport costs between them.51 Figure 18 captures this positive relationship
between trading costs and distance for Tanzania’s manufacturing exports.
51
See: Anderson, J. (2011). “The Gravity Model,” Annual Review of Economics, vol. 3, 133-160; Anderson, James E., and Eric van Wincoop. (2003). “Gravity with Gravitas: A Solution to the Border Puzzle,” American Economic Review, 93(1): 170–92. More theoretical foundation was given by: Anderson, James E. (1979). “A Theoretical Foundation for the Gravity Equation.” American Economic Review, 69(1): 106–16, and Krugman, Paul. (1980). “Scale Economies, Product Differentiation, and the Patterns of Trade,” American Economic Review, 70(5): 950-59.

58
Figure 18: Trading costs and distance are closely correlated
Source: Y. Yoshino et al, 2013
Trading costs and distance are obviously correlated, but not absolutely. Virtual connectivity
that is facilitated by the development of new technologies has reduced the importance of
distance for a large variety of sectors, notably services. Also, the most direct route is not always
the most cost-effective one, as it is currently less costly to take a plane from Dar es Salaam to
Maputo via Johannesburg than to fly directly between these two cities, despite the fact that
Johannesburg is located considerably further away.
Since approximately 90 percent of Tanzania’s international transactions transit through the
port of Dar es Salaam, exports have been greatly affected by the efficiency of this facility.
Although international transport and trade costs are partially determined by factors other than
the port, it is difficult to foresee a large reduction in costs without a big improvement in port
efficiency. The delay at the port (on average 20 days) is three times higher than the time spent
on transporting goods by road from Dar-es-Salaam to the Zambian border.52
The port of Dar es Salaam is important not only for Tanzania but also for neighboring
countries. Access to the ocean is a big natural advantage for Tanzania, since transport costs are
automatically higher for Zambia, Eastern DRC, Rwanda, Burundi and Uganda, with all of these
countries having to transit their merchandise through the port of Dar es Salaam. As a result,
transit trade accounts for as much as 50 percent of exports and 32 percent of imports, making
the Dar es Salaam port the second most important gateway for regional trade in East Africa
after Mombasa.
52
This is the average time from the gate in Dar-es-Salaam to Kasumulu on the corridor. See: Msamba, V. P. (2012). op. cit.
KEN
MWIUGA
RWABDI
ZWE
ZMB
MDGETHSYC
MOZ
SWZ
BWAMUS
YEM
SDN
NAM
CMR
GAB
SAU
ZAF
QAT
ARE
BHROMN
KWT
EGYNGA
JOR
ISR
SYR
LBNGHA
NER
CYPLKA
IRN
CIV
BFA
GRC
ARM
MLT
TUR
IND
ALB
TUN
BGR
PAK
ROM
BIH
ITA
DZAHRV
HUN
SVN
UKR
SVK
BGDAUT
GMBMAR
SEN
CHE
CZEPOL
ESP
RUS
MYS
LUX
PRT
THAFRADEU
SGPLVA
BEL
NLD
DNKIDN
GBR
FINSWE
NOR
VNM
IRL
HKG
BRA
PHL
ISL
CHN
KOR
ARG
PRY
JPN
CHL
AUS
DOM
USA
PER
COLNZL
CAN
ECU
CRI
SLV MEX
0
500
1000
1500
Man
ufac
ture
Tra
ding
Cos
t fro
m T
anza
nia
0 5000 10000 15000 20000Distance from Tanzania
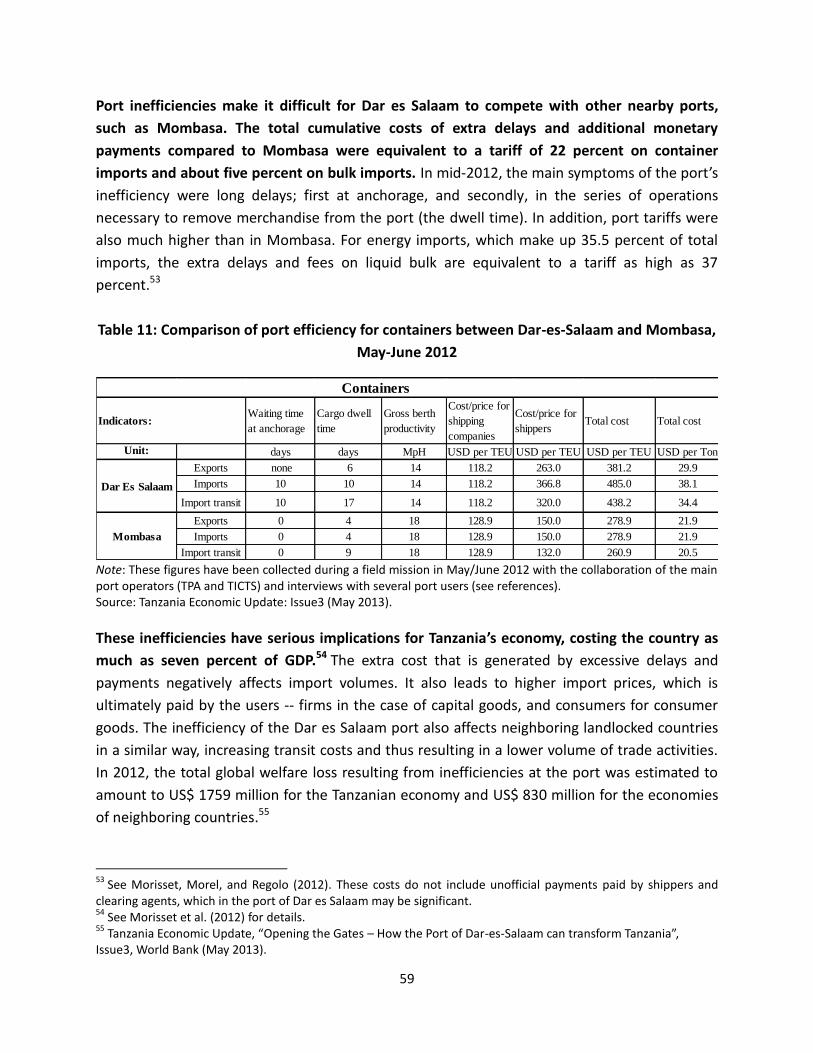
59
Port inefficiencies make it difficult for Dar es Salaam to compete with other nearby ports,
such as Mombasa. The total cumulative costs of extra delays and additional monetary
payments compared to Mombasa were equivalent to a tariff of 22 percent on container
imports and about five percent on bulk imports. In mid-2012, the main symptoms of the port’s
inefficiency were long delays; first at anchorage, and secondly, in the series of operations
necessary to remove merchandise from the port (the dwell time). In addition, port tariffs were
also much higher than in Mombasa. For energy imports, which make up 35.5 percent of total
imports, the extra delays and fees on liquid bulk are equivalent to a tariff as high as 37
percent.53
Table 11: Comparison of port efficiency for containers between Dar-es-Salaam and Mombasa,
May-June 2012
Note: These figures have been collected during a field mission in May/June 2012 with the collaboration of the main port operators (TPA and TICTS) and interviews with several port users (see references). Source: Tanzania Economic Update: Issue3 (May 2013).
These inefficiencies have serious implications for Tanzania’s economy, costing the country as
much as seven percent of GDP.54 The extra cost that is generated by excessive delays and
payments negatively affects import volumes. It also leads to higher import prices, which is
ultimately paid by the users -- firms in the case of capital goods, and consumers for consumer
goods. The inefficiency of the Dar es Salaam port also affects neighboring landlocked countries
in a similar way, increasing transit costs and thus resulting in a lower volume of trade activities.
In 2012, the total global welfare loss resulting from inefficiencies at the port was estimated to
amount to US$ 1759 million for the Tanzanian economy and US$ 830 million for the economies
of neighboring countries.55
53
See Morisset, Morel, and Regolo (2012). These costs do not include unofficial payments paid by shippers and clearing agents, which in the port of Dar es Salaam may be significant. 54
See Morisset et al. (2012) for details. 55
Tanzania Economic Update, “Opening the Gates – How the Port of Dar-es-Salaam can transform Tanzania”, Issue3, World Bank (May 2013).
Unit: days days MpH USD per TEU USD per TEU USD per TEU USD per Ton
Exports none 6 14 118.2 263.0 381.2 29.9
Imports 10 10 14 118.2 366.8 485.0 38.1
Import transit 10 17 14 118.2 320.0 438.2 34.4
Exports 0 4 18 128.9 150.0 278.9 21.9
Imports 0 4 18 128.9 150.0 278.9 21.9
Import transit 0 9 18 128.9 132.0 260.9 20.5
Containers
Indicators:Waiting time
at anchorage
Cargo dwell
time
Gross berth
productivity
Dar Es Salaam
Mombasa
Total cost Total cost
Cost/price for
shipping
companies
Cost/price for
shippers
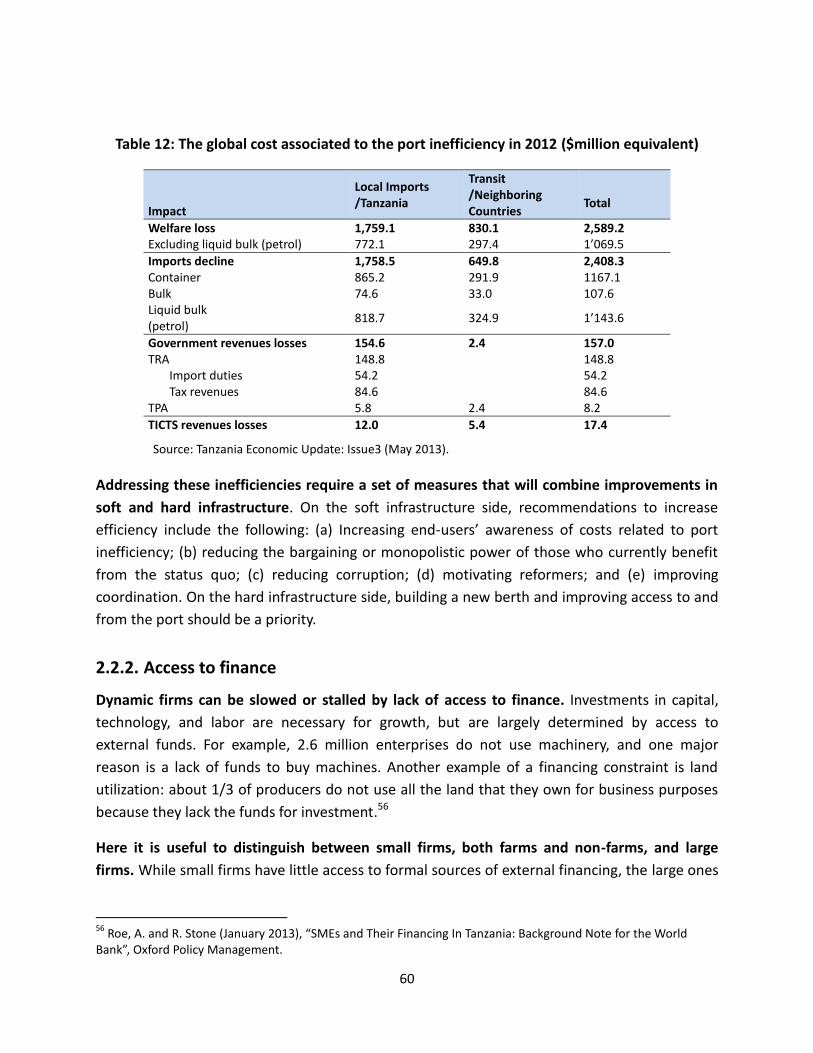
60
Table 12: The global cost associated to the port inefficiency in 2012 ($million equivalent)
Impact
Local Imports /Tanzania
Transit /Neighboring Countries
Total
Welfare loss 1,759.1 830.1 2,589.2 Excluding liquid bulk (petrol) 772.1 297.4 1’069.5
Imports decline 1,758.5 649.8 2,408.3 Container 865.2 291.9 1167.1 Bulk 74.6 33.0 107.6 Liquid bulk (petrol)
818.7 324.9 1’143.6
Government revenues losses 154.6 2.4 157.0 TRA 148.8 148.8 Import duties 54.2 54.2 Tax revenues 84.6 84.6 TPA 5.8 2.4 8.2
TICTS revenues losses 12.0 5.4 17.4
Source: Tanzania Economic Update: Issue3 (May 2013).
Addressing these inefficiencies require a set of measures that will combine improvements in
soft and hard infrastructure. On the soft infrastructure side, recommendations to increase
efficiency include the following: (a) Increasing end-users’ awareness of costs related to port
inefficiency; (b) reducing the bargaining or monopolistic power of those who currently benefit
from the status quo; (c) reducing corruption; (d) motivating reformers; and (e) improving
coordination. On the hard infrastructure side, building a new berth and improving access to and
from the port should be a priority.
2.2.2. Access to finance
Dynamic firms can be slowed or stalled by lack of access to finance. Investments in capital,
technology, and labor are necessary for growth, but are largely determined by access to
external funds. For example, 2.6 million enterprises do not use machinery, and one major
reason is a lack of funds to buy machines. Another example of a financing constraint is land
utilization: about 1/3 of producers do not use all the land that they own for business purposes
because they lack the funds for investment.56
Here it is useful to distinguish between small firms, both farms and non-farms, and large
firms. While small firms have little access to formal sources of external financing, the large ones
56
Roe, A. and R. Stone (January 2013), “SMEs and Their Financing In Tanzania: Background Note for the World Bank”, Oxford Policy Management.
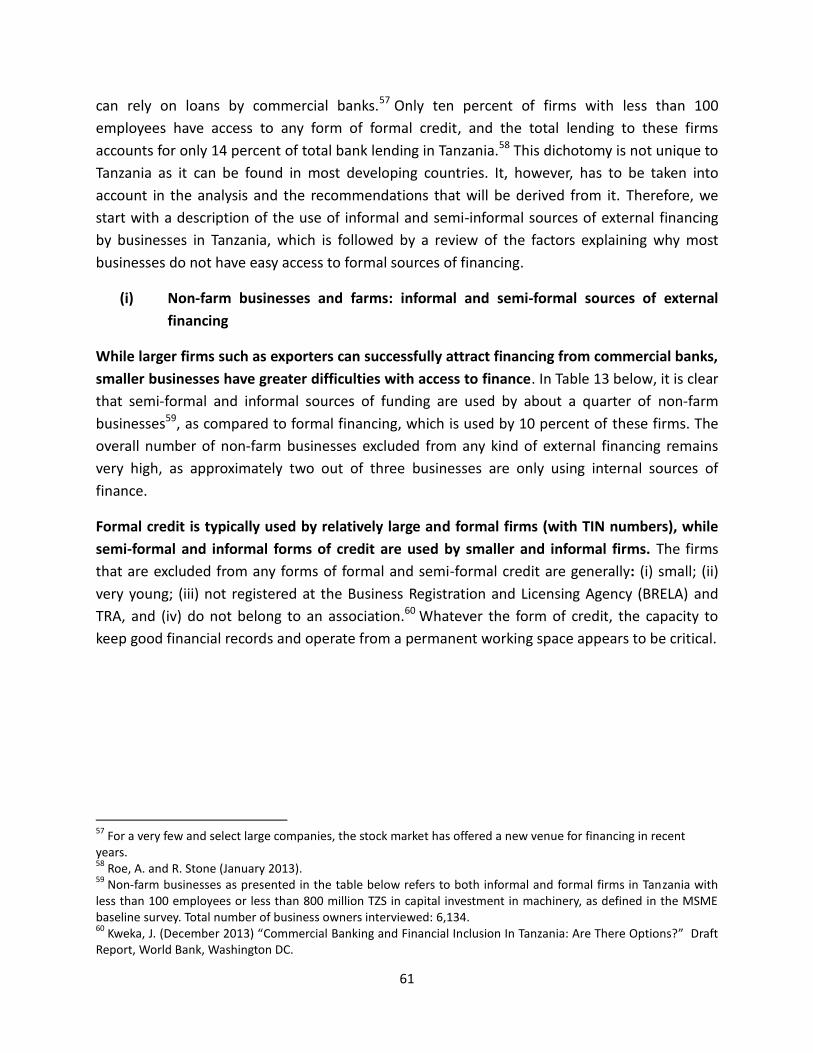
61
can rely on loans by commercial banks.57 Only ten percent of firms with less than 100
employees have access to any form of formal credit, and the total lending to these firms
accounts for only 14 percent of total bank lending in Tanzania.58 This dichotomy is not unique to
Tanzania as it can be found in most developing countries. It, however, has to be taken into
account in the analysis and the recommendations that will be derived from it. Therefore, we
start with a description of the use of informal and semi-informal sources of external financing
by businesses in Tanzania, which is followed by a review of the factors explaining why most
businesses do not have easy access to formal sources of financing.
(i) Non-farm businesses and farms: informal and semi-formal sources of external
financing
While larger firms such as exporters can successfully attract financing from commercial banks,
smaller businesses have greater difficulties with access to finance. In Table 13 below, it is clear
that semi-formal and informal sources of funding are used by about a quarter of non-farm
businesses59, as compared to formal financing, which is used by 10 percent of these firms. The
overall number of non-farm businesses excluded from any kind of external financing remains
very high, as approximately two out of three businesses are only using internal sources of
finance.
Formal credit is typically used by relatively large and formal firms (with TIN numbers), while
semi-formal and informal forms of credit are used by smaller and informal firms. The firms
that are excluded from any forms of formal and semi-formal credit are generally: (i) small; (ii)
very young; (iii) not registered at the Business Registration and Licensing Agency (BRELA) and
TRA, and (iv) do not belong to an association.60 Whatever the form of credit, the capacity to
keep good financial records and operate from a permanent working space appears to be critical.
57
For a very few and select large companies, the stock market has offered a new venue for financing in recent years. 58
Roe, A. and R. Stone (January 2013). 59
Non-farm businesses as presented in the table below refers to both informal and formal firms in Tanzania with less than 100 employees or less than 800 million TZS in capital investment in machinery, as defined in the MSME baseline survey. Total number of business owners interviewed: 6,134. 60
Kweka, J. (December 2013) “Commercial Banking and Financial Inclusion In Tanzania: Are There Options?” Draft Report, World Bank, Washington DC.
62
Table 13: Characteristics of non-farm businesses by access strand category
FORMAL (10%) SEMI-FORMAL INFORMAL
(12%) EXCLUDED
(69%)
Bank/ Insurance Other
SACCO MFI Other
(2.2%) (2.4%) (5.8%)
Median monthly turnover (TZS ‘000) 600 195 300 280 240 210 150
Median monthly turnover (US$) 375 122 188 175 150 131 94
Median age (yrs) of the business 3 8 4 5 4 3 3
% with permanent working space 82% 43% 59% 50% 54% 54% 54%
% Registered with BRELA 8% 0% 6% 3% 4% 3% 3%
% with a TIN 32% 48% 9% 4% 1% 3% 2%
% that keep written financial records 82% 84% 52% 58% 61% 44% 35%
% belong to a business association 15% 27% 47% 29% 9% 14% 2% % who had relevant training 39% 13% 36% 22% 30% 30% 26%
Note: Formal Other = People who use products from formal institutions such as postal office which are not supervised by either the BOT or the Insurance Commissioner. Source: Financial Sector Deepening Trust of Tanzania (FSDT), MSME Baseline Survey 2010, Final Presentation Report, May 2012.
As the result of limited access to formal credit by commercial banks, small and informal
businesses have been using semi-formal and informal sources of financing. Semi-formal
sources of financing have captured the attention of policy makers in recent years because they
can serve to bridge the gap, albeit imperfectly, between supply and demand for credit. The
importance of inclusive finance is also recognized by the government of Tanzania as a key driver
of economic growth and poverty reduction.61 In Tanzania, semi-formal initiatives include: (a)
microfinance institutions; (b) village community banking; (c) supplier/trade credit; and (d)
mobile banking options. These are briefly described below.
a) Microfinance institutions. Microfinance institutions (MFIs) provide financial services to
Tanzanian households and small enterprises, mostly in the form of microcredit. While the
microfinance industry in Tanzania is relatively young and limited in scale, it has expanded in the
last decade, and serves to provide a semi-formal financing mechanism for small businesses with
lower transaction costs than commercial banks. However, due to higher risk of default,
61
Bank of Tanzania (2014), “Tanzania National Financial Inclusion Framework,” A Public-Private Stakeholders’ Initiative for 2014-2016.
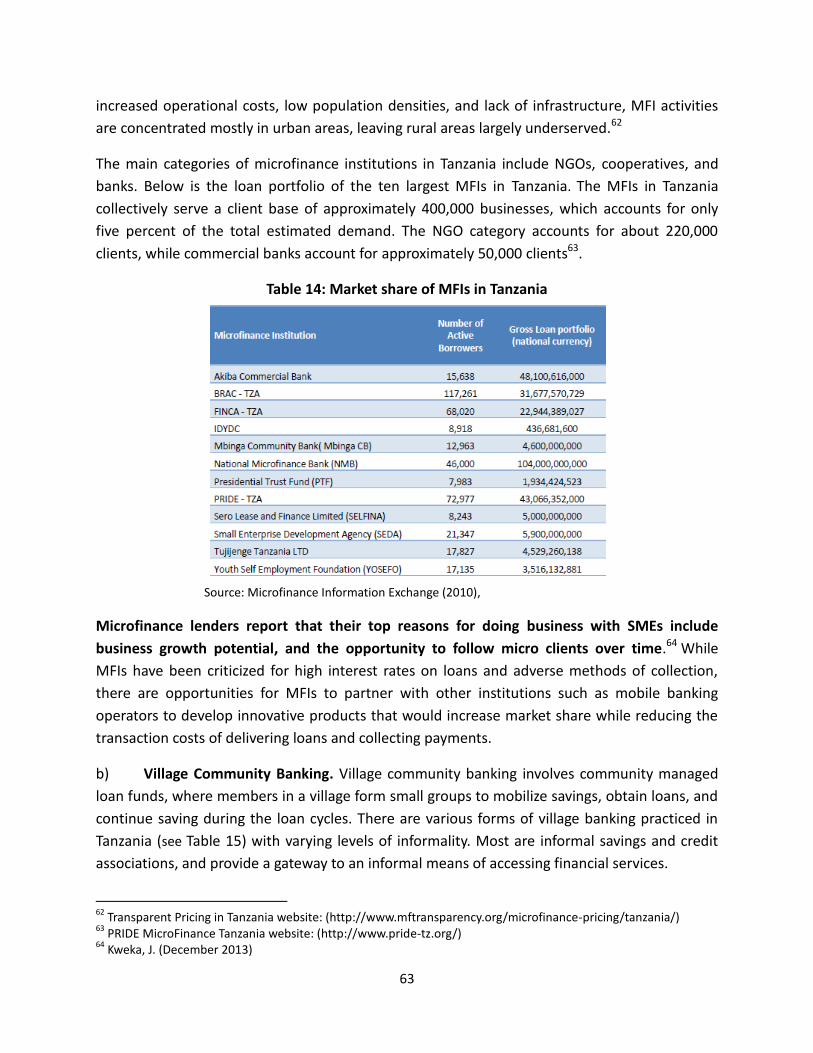
63
increased operational costs, low population densities, and lack of infrastructure, MFI activities
are concentrated mostly in urban areas, leaving rural areas largely underserved.62
The main categories of microfinance institutions in Tanzania include NGOs, cooperatives, and
banks. Below is the loan portfolio of the ten largest MFIs in Tanzania. The MFIs in Tanzania
collectively serve a client base of approximately 400,000 businesses, which accounts for only
five percent of the total estimated demand. The NGO category accounts for about 220,000
clients, while commercial banks account for approximately 50,000 clients63.
Table 14: Market share of MFIs in Tanzania
Source: Microfinance Information Exchange (2010),
Microfinance lenders report that their top reasons for doing business with SMEs include
business growth potential, and the opportunity to follow micro clients over time.64 While
MFIs have been criticized for high interest rates on loans and adverse methods of collection,
there are opportunities for MFIs to partner with other institutions such as mobile banking
operators to develop innovative products that would increase market share while reducing the
transaction costs of delivering loans and collecting payments.
b) Village Community Banking. Village community banking involves community managed
loan funds, where members in a village form small groups to mobilize savings, obtain loans, and
continue saving during the loan cycles. There are various forms of village banking practiced in
Tanzania (see Table 15) with varying levels of informality. Most are informal savings and credit
associations, and provide a gateway to an informal means of accessing financial services.
62
Transparent Pricing in Tanzania website: (http://www.mftransparency.org/microfinance-pricing/tanzania/) 63
PRIDE MicroFinance Tanzania website: (http://www.pride-tz.org/) 64
Kweka, J. (December 2013)
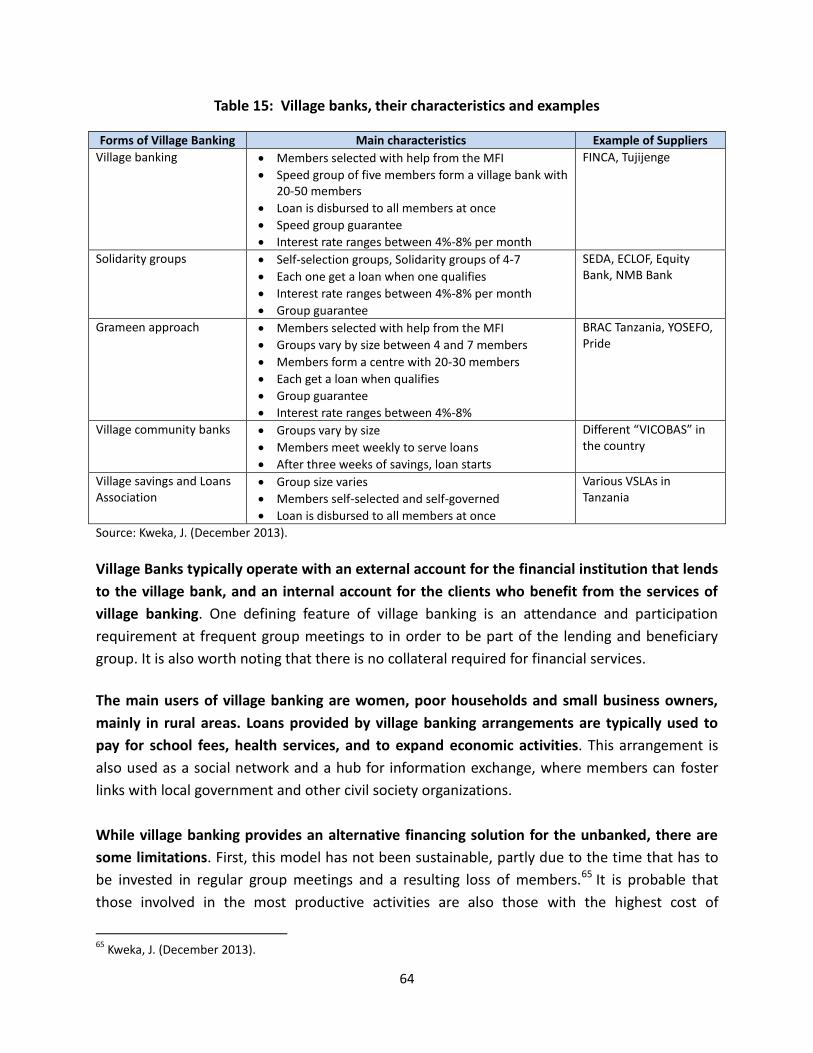
64
Table 15: Village banks, their characteristics and examples
Forms of Village Banking Main characteristics Example of Suppliers
Village banking Members selected with help from the MFI
Speed group of five members form a village bank with 20-50 members
Loan is disbursed to all members at once
Speed group guarantee
Interest rate ranges between 4%-8% per month
FINCA, Tujijenge
Solidarity groups Self-selection groups, Solidarity groups of 4-7
Each one get a loan when one qualifies
Interest rate ranges between 4%-8% per month
Group guarantee
SEDA, ECLOF, Equity Bank, NMB Bank
Grameen approach Members selected with help from the MFI
Groups vary by size between 4 and 7 members
Members form a centre with 20-30 members
Each get a loan when qualifies
Group guarantee
Interest rate ranges between 4%-8%
BRAC Tanzania, YOSEFO, Pride
Village community banks Groups vary by size
Members meet weekly to serve loans
After three weeks of savings, loan starts
Different “VICOBAS” in the country
Village savings and Loans Association
Group size varies
Members self-selected and self-governed
Loan is disbursed to all members at once
Various VSLAs in Tanzania
Source: Kweka, J. (December 2013).
Village Banks typically operate with an external account for the financial institution that lends
to the village bank, and an internal account for the clients who benefit from the services of
village banking. One defining feature of village banking is an attendance and participation
requirement at frequent group meetings to in order to be part of the lending and beneficiary
group. It is also worth noting that there is no collateral required for financial services.
The main users of village banking are women, poor households and small business owners,
mainly in rural areas. Loans provided by village banking arrangements are typically used to
pay for school fees, health services, and to expand economic activities. This arrangement is
also used as a social network and a hub for information exchange, where members can foster
links with local government and other civil society organizations.
While village banking provides an alternative financing solution for the unbanked, there are
some limitations. First, this model has not been sustainable, partly due to the time that has to
be invested in regular group meetings and a resulting loss of members.65 It is probable that
those involved in the most productive activities are also those with the highest cost of
65
Kweka, J. (December 2013).
65
participating in group meetings. A second limitation to the sustainability of village banks is the
typically small operational portfolio and high risk of default, where even small losses can
threaten group lending operations. Thirdly, the model is highly reliant on external funding,
which affects operational sustainability. Moreover, in rural areas, cash needs vary by agriculture
season such that it does not make sense to spread borrowing and savings evenly throughout
the year. Finally, the low level of managerial and technical capacity poses significant business
and governance risks, also affecting sustainability. Despite limitations associated with village
banking, it is worth noting that there are reduced transaction costs in searching for mechanisms
outside the village area, and this form of finance does provide an alternative to formal credit for
those in rural areas without access to any other forms of financial services.
c) Supplier and trade credit. Supplier credit is typically used as a means of short-term
financing, where a supplier fulfills an order without requiring cash up-front on delivery. Unlike
microfinance, supplier credit is practiced widely in both urban and rural areas. In agriculture for
instance, trade credit is predominantly practiced in contract farming,66 where a farmer is
supplied with farm inputs as a credit on agreement that the buyer of the harvest will deduct the
credit from the sales. Households frequently use trade credit for consumer goods and trade
merchandise; and SMEs use trade credit to purchase stocks of goods and services, merchandise,
raw materials, inputs and equipment/machinery with an established grace period or
outstanding credit.
Approximately 50 percent of households report using trade credit from traders, buyers,
processors, retail kiosks, and through non-monetary loans. In addition to other types of trade
credit, a majority of households (92 percent) use credit from retail kiosks, and a quarter of
households use non-monetary items in trade credit, which includes items such as radios and
livestock. Other types of trade credit include credits against harvest from buyers, credits from
middle men, and credits from processors. While a majority of households report that it is easier
to conduct business and meet obligations through the use of trade credit, a large share
acknowledge that it is the only option available to them. 67
One main component for supplier credit is trust, particularly from repeated transactions or
membership to an affinity group (i.e., ethnic, family, community groups/affiliations). While
trade credit is widely utilized as an alternative financing method in Tanzania, inefficiencies still
exist due to information asymmetries. For example, farmers and livestock keepers in rural areas
can get lower prices for their produce from contracts with providers of supplier credit/inputs
due to lack of awareness of market demand and the absence of effective competition and
regulation. Additionally, lending to those only within a network/affinity group may be less risky,
66
Kweka, J. (December 2013). 67
Tanzania Finscope Survey Data (2009)
66
but it also may not be as efficient. However, there is potential to widen the scope of supplier
financing by actively encouraging the formation of networks and clusters (see Section 2.3.1 for
further discussion of clusters) to leverage this alternative form of financing.
d) Mobile banking. Mobile phone access and usage is high in Tanzania (70 percent of
households)68, and many users engage in mobile money transactions. For many households,
mobile-based remittances serve as a primary point of entry into semi-formal financial systems
and use of financial services.69 It is estimated that about 20 percent of mobile phone owners
use mobile phones to send or receive money.70
Mobile banking and associated payment technologies reduce the transaction costs of financial
access, particularly with barriers such as formalization and proximity. Other benefits of mobile
money include lower risk of delivery and default, given that information can be collected on
payment history through mobile phone usage. This reduction in transaction costs is especially
significant in areas with low population densities and low per capita income, which
encompasses most cities outside of Dar es Salaam. In fact, Tanzania ranks near the bottom in
bank branch penetration, with an average of less than 0.5 bank branches per 1,000 square
kilometers. It is then not surprising that about 47 percent of unbanked households in Tanzania
cite distance, among other factors, as the reason that they do not have a bank account.
While mobile technologies offer a commercially viable way of reaching customers previously
excluded from formal financial services, these technologies are more likely to function as
complements rather than substitutes to traditional bank financing. Also, in largely cash based
developing economies such as Tanzania, other factors such as the regulatory environment, the
number of cash-in points, and the ease with which cash can be transferred into and out of the
mobile system are key to successful mobile banking operations. In some countries, including
Brazil, India, Kenya and Mexico, there is evidence that correspondent banking71 has had a
significant impact on financial inclusion. For example, in 2006, the Federal Reserve Bank of India
set a mandate for banks to provide basic financial services to unbanked villages. Banks
essentially used a combination of new branches, fixed location businesses, correspondent
68
Mobile phone access includes both households that own mobile phones and those that can readily access one when needed. Source: Tanzania Finscope Survey Data (2009). 69
World Bank (2014), “Global Financial Development Report 2014: Financial Inclusion,” Washington, DC: World Bank. 70
Kweka, J. (December 2013) 71
‘Correspondent banking’ leverages mobile technologies and new delivery channels to provide financial services. A banking correspondent is a representative of a bank who operates transactions on behalf of one or more banks outside the bank’s branch network. (World Bank 2014 Financial Inclusion Report).
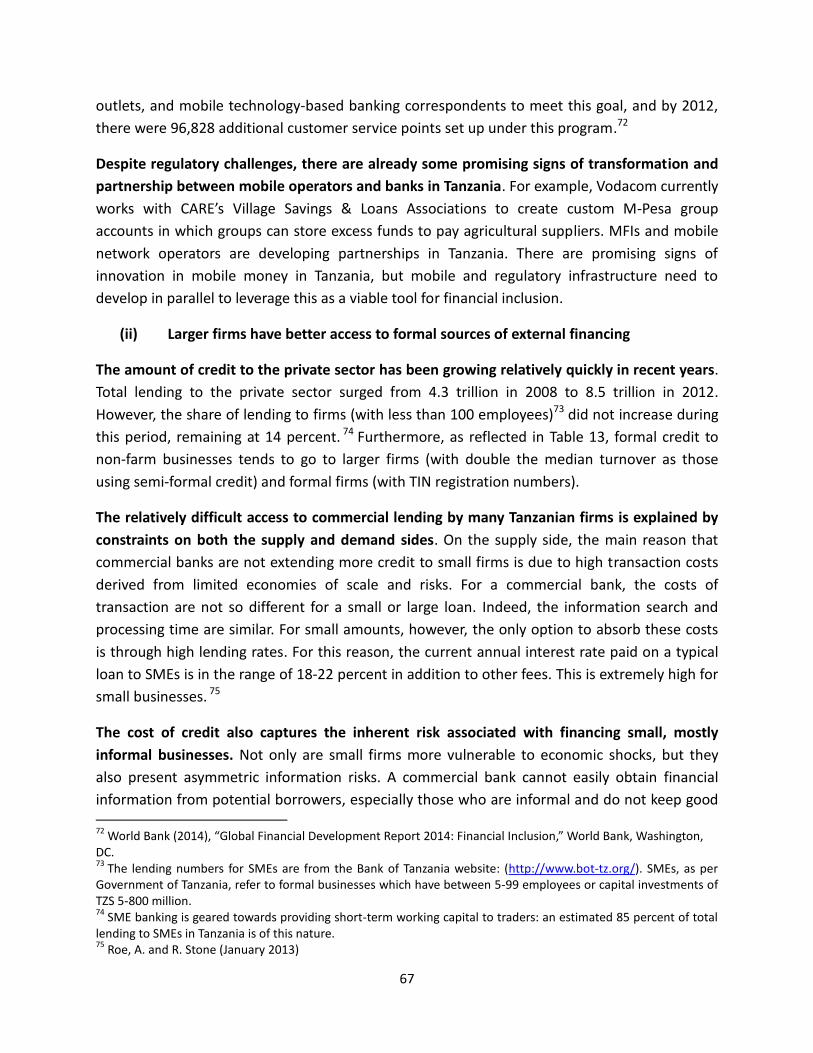
67
outlets, and mobile technology-based banking correspondents to meet this goal, and by 2012,
there were 96,828 additional customer service points set up under this program.72
Despite regulatory challenges, there are already some promising signs of transformation and
partnership between mobile operators and banks in Tanzania. For example, Vodacom currently
works with CARE’s Village Savings & Loans Associations to create custom M-Pesa group
accounts in which groups can store excess funds to pay agricultural suppliers. MFIs and mobile
network operators are developing partnerships in Tanzania. There are promising signs of
innovation in mobile money in Tanzania, but mobile and regulatory infrastructure need to
develop in parallel to leverage this as a viable tool for financial inclusion.
(ii) Larger firms have better access to formal sources of external financing
The amount of credit to the private sector has been growing relatively quickly in recent years.
Total lending to the private sector surged from 4.3 trillion in 2008 to 8.5 trillion in 2012.
However, the share of lending to firms (with less than 100 employees)73 did not increase during
this period, remaining at 14 percent. 74 Furthermore, as reflected in Table 13, formal credit to
non-farm businesses tends to go to larger firms (with double the median turnover as those
using semi-formal credit) and formal firms (with TIN registration numbers).
The relatively difficult access to commercial lending by many Tanzanian firms is explained by
constraints on both the supply and demand sides. On the supply side, the main reason that
commercial banks are not extending more credit to small firms is due to high transaction costs
derived from limited economies of scale and risks. For a commercial bank, the costs of
transaction are not so different for a small or large loan. Indeed, the information search and
processing time are similar. For small amounts, however, the only option to absorb these costs
is through high lending rates. For this reason, the current annual interest rate paid on a typical
loan to SMEs is in the range of 18-22 percent in addition to other fees. This is extremely high for
small businesses. 75
The cost of credit also captures the inherent risk associated with financing small, mostly
informal businesses. Not only are small firms more vulnerable to economic shocks, but they
also present asymmetric information risks. A commercial bank cannot easily obtain financial
information from potential borrowers, especially those who are informal and do not keep good 72
World Bank (2014), “Global Financial Development Report 2014: Financial Inclusion,” World Bank, Washington, DC. 73
The lending numbers for SMEs are from the Bank of Tanzania website: (http://www.bot-tz.org/). SMEs, as per Government of Tanzania, refer to formal businesses which have between 5-99 employees or capital investments of TZS 5-800 million. 74
SME banking is geared towards providing short-term working capital to traders: an estimated 85 percent of total lending to SMEs in Tanzania is of this nature. 75
Roe, A. and R. Stone (January 2013)

68
financial records. It is worth underscoring that the absence of information is partly rooted in
systematic issues that prevent the easy identification of potential borrowers. Tanzania, for
example, does not have a consistent national ID system. The most common form of
documentation, held by 80.7 percent of households, is the voter ID card. However, only 33
percent of non-farm businesses with 5-49 employees have a Tax Identification Number (TIN)
and only 14 percent are registered with the Business Registration and Licensing Agency (BRELA).
Of those non-farm businesses that had applied for and been refused a loan, 7.4 percent said
that the reason was that their business was not registered. 76 Kenya, Rwanda and South Africa
are ahead of Tanzania in promoting reliable ID systems.
This asymmetric information problem can be mitigated by the establishment of credit
reference bureaus or credit verification systems. While efforts are underway to bring credit
reference projects in Tanzania, the current lack of a credit reference system poses an important
constraint to bank lending to SMEs, particularly with concerns around collateral and recovering
bad loans, which is time consuming and fraught with difficulties. Recent initiatives in Nigeria,
South Africa, and Rwanda have proved the benefits associated with the establishment of private
credit bureau.77
Table 16: Enabling environment indicators across countries
Kenya Nigeria Rwanda
South Africa
Tanzania
Private credit bureau coverage (% of adults) 4.9 4.1 7.1 54.0 0.0
Positive and negative data shared? No Yes Yes Yes n/a
Depth of credit information index (out of 6) 4 4 6 6 0
Unique ID perceived as reliable? Yes No Yes Yes No
Movable collateral registry functional? Yes No Yes No No
Days required to enforce a contract 465 457 230 600 462
Source: Berg, G. and M. Fuchs (August 2013)
Traditional bank financing (secured or cash-flow based) is often not available due to the lack
of adequate collateral or the opaque modus operandi of many non-farm businesses. In order
to limit the risk for commercial banks, the BoT’s requirements are stringent. All loans have to be
secured by collateral of at least 125 percent of the value of the loan. While some flexibility has
been recently introduced,78 those regulations have contributed to the increased cost of
76
Tanzania Finscope Survey Data (2009) 77
Berg, G. and M. Fuchs, (August 2013), “Bank Financing of SMEs in Five Sub-Saharan African Countries: The Role of Competition, Innovation, and the Government,” World Bank Policy Research Working Paper No. 6563. 78
In reality, it is permissible for banks to lend up to 5 percent of their capital on an unsecured basis, as well as a further 10 percent that can be lent on a partially secured basis.

69
commercial credit. The regulations have also reduced the incentives for commercial banks to
innovate and develop new instruments, including leasing and coordinating with
telecommunication platforms to develop new products. For agro-finance, collateral is also an
issue, as the absence of land guarantees and informal titling arrangements pose limit the ability
to access finance.
Government borrowing also poses the risk of crowding out lending to the private sector. In
Tanzania, banks continue to hold a large share of government securities in their balance
sheets79. The rise in interest rates on government securities decreases banks’ incentives to lend
to SMEs by placing an effective floor for yields (exclusive of risk premium). This is common in
financial systems like Tanzania that have weaker regulatory and legal structures, where there is
an inverse relationship between the willingness to lend to risky private enterprises and the
availability of more secure investment opportunities, such as government securities.80
On the demand side, the main reason for the limited use of commercial credit is that many
firms’ owners are not banked. Indeed, the first step to have access to credit is to get a banking
account to establish a relationship with the potential lender. Financial inclusion remains
extremely limited in Tanzania, with only 8.4 percent of households having a bank account.
Urban households and businesses are more banked than rural ones (18.4 percent vs. 5.1
percent). The main reason given by firms’ owners for not having a bank account is the lack of a
regular source of income, as cited by 83.2 percent of the unbanked sample. From those that are
banked, 34.8 percent are self-employed and 27.1 percent are wage workers, while farmers,
casual workers and the unemployed make up the rest of the sample. About a fifth of the
unbanked sample reported that they didn’t know how to open a bank account, suggesting
further information barriers.81
Most account owners do not use their bank accounts to get credit but rather to send
remittances, pay wages, and receive government payments. This is shown below in Figure 19
with comparative countries. When firms and households do get credit, most of the time it is not
a for business purposes. The top reason for borrowing is for funerals, followed by medical
expenses and daily household expenses. Less than 5 percent of loans received by households
are for business expansion or investment purposes.82
79
Total bank lending in Tanzania in 2011 amounted to 7.6 trillion, and banks’ investments in government securities made up 2 trillion Tanzanian shillings at the end of 2011. Source: The Banking Regulation Review: 4
th edition (April
2013), Law Business Research. 80
Berg, G. and Fuchs, M. (August 2013). 81
Tanzania Finscope Survey Data (2009). 82
Kweka, J. (December 2013)
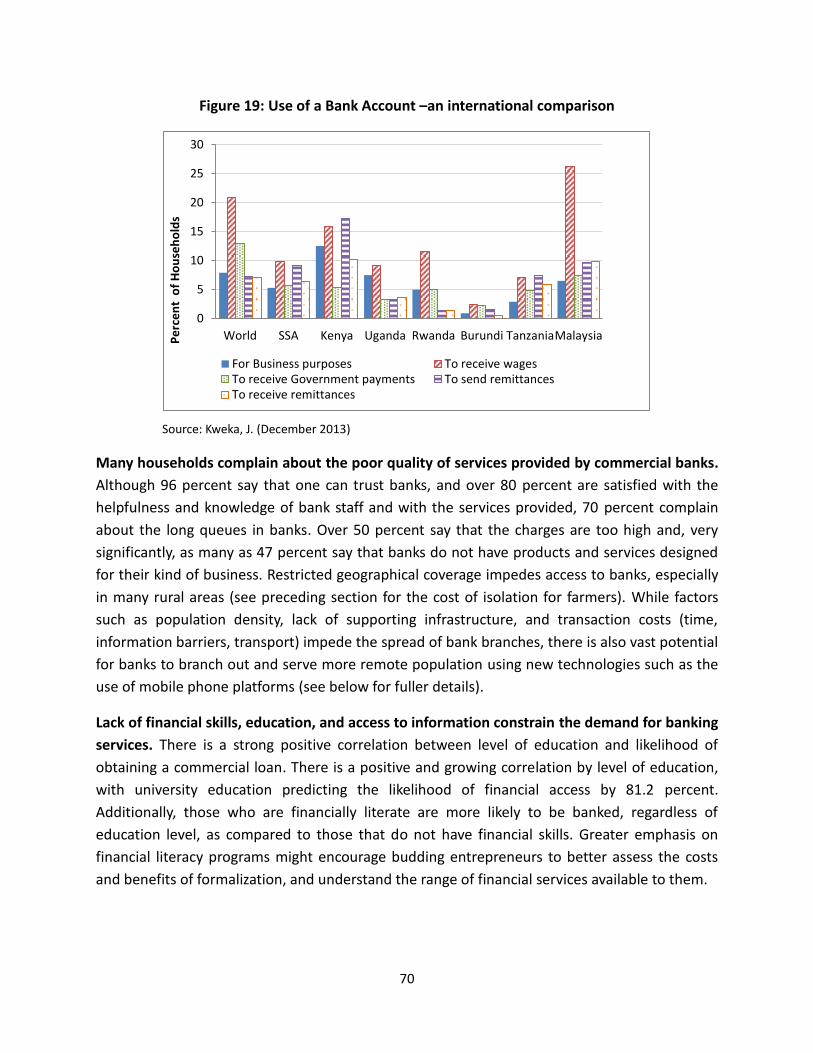
70
Figure 19: Use of a Bank Account –an international comparison
Source: Kweka, J. (December 2013)
Many households complain about the poor quality of services provided by commercial banks.
Although 96 percent say that one can trust banks, and over 80 percent are satisfied with the
helpfulness and knowledge of bank staff and with the services provided, 70 percent complain
about the long queues in banks. Over 50 percent say that the charges are too high and, very
significantly, as many as 47 percent say that banks do not have products and services designed
for their kind of business. Restricted geographical coverage impedes access to banks, especially
in many rural areas (see preceding section for the cost of isolation for farmers). While factors
such as population density, lack of supporting infrastructure, and transaction costs (time,
information barriers, transport) impede the spread of bank branches, there is also vast potential
for banks to branch out and serve more remote population using new technologies such as the
use of mobile phone platforms (see below for fuller details).
Lack of financial skills, education, and access to information constrain the demand for banking
services. There is a strong positive correlation between level of education and likelihood of
obtaining a commercial loan. There is a positive and growing correlation by level of education,
with university education predicting the likelihood of financial access by 81.2 percent.
Additionally, those who are financially literate are more likely to be banked, regardless of
education level, as compared to those that do not have financial skills. Greater emphasis on
financial literacy programs might encourage budding entrepreneurs to better assess the costs
and benefits of formalization, and understand the range of financial services available to them.
0
5
10
15
20
25
30
World SSA Kenya Uganda Rwanda Burundi TanzaniaMalaysiaPe
rce
nt
of
Ho
use
ho
lds
For Business purposes To receive wagesTo receive Government payments To send remittancesTo receive remittances

71
Though there are clear signs of progress, access to finance—particularly for small
enterprises—remains limited by asymmetric information, high credit risk, and the difficulties
of formalization.
2.2.3. Skills and Education
All firms need skills and education to become productive and create employment.
Unfortunately, the average Tanzanian worker remains largely unskilled and uneducated. Despite
the near-universal enrollment in primary schools, the proportion of the labor force with middle
and high-level skills remains very low, with less than 12 percent of the total population having
completed lower secondary education (see Table 17). Significant improvements in education
and skills development are needed, and a better understanding of how they affect firms can
help shape policy.
Table 17: A snapshot of education levels and earnings in Tanzania
% of Population
(1)
Marginal wage effect by year of schooling (%)
(2)
Median total annual income (TZS '000)
(3)
No Primary Education 18.0% - 111
Incomplete Primary 14.0% - 140
Complete Primary 46.0% 8.0% 404
Incomplete Lower Secondary 11.0% 14.0% 458
Complete Lower Secondary 9.0% 25.0% 1,990
Upper Secondary & University 3.0% 64.0% 4,667
Note: Average years of schooling = 7 (growing, but still one of the lowest in the world) (1) More than 3/4 of Tanzanians have not completed lower secondary education (2) Education pays of at the highest level
(3) Income for educated workers (with > upper secondary education) is 40 times higher than for others. Source: NPS (2010/11)
The positive impact associated with education on profitability varies between small non-farm
businesses, farms, and exporters. Among non-farm-businesses, there is a difference between
those that use external workers and family-run businesses. The level of education is a significant
determinant for firms with external workers through two interrelated effects: (i) more educated
owners; and (ii) more educated employees.83 These firms are more likely to hire workers based
on their competency rather than their connections to the household. By contrast, education
does not appear to be a significant parameter for family-run businesses. Most of them are run
83
Analysis using pooled data from Tanzania NPS 2008/09 and 2010/11 shows that education has strong effects on
profits for enterprises that hire external workers, and the returns increase with owner level of education. These results are robust to a variety of specifications which control for a considerable array of entrepreneurial and firm characteristics.
72
by “reluctant” entrepreneurs84 who have no other choice because of their low level of
education. Moreover, for these firms, the level of education is not the primary criterion for
hiring employees as most firms operate in non-specialized activities that require limited skills
and education.
(i) Small non-farm businesses: The positive impact of education on non-farm businesses is
also nonlinear: there are increasing returns associated with education in Tanzania. In other
words, a worker with post-secondary education will earn 40 times more than a worker without
education; while a worker with completed primary education will only earn approximately four
times more. The low return associated to primary and secondary education levels is to a large
extent explained by the relatively low quality of education. While it is beyond the scope of this
study to discuss the poor quality of schooling in Tanzania, the empirical evidence indicates that
an additional year of study in secondary education will not significantly modify the potential
earnings of students on the job market. The high rate of return associated with post-secondary
education is also caused by the structural excess demand on the labor market, as the number of
graduates is lower than 3 percent of the total population85. This excess demand is exacerbated
by the crowding out of qualified workers by the public and para-public sector (capturing
approximately 80 percent of these workers).86
The average level of education of women is still lower than men in Tanzania (39 percent of
adult women are illiterate as compared to 25 percent of adult men).87 Male entrepreneurs
also earn consistently more than female entrepreneurs, on average.88 In addition to a difference
in skills and education, this could be due to differences in available time for conducting business
with household responsibilities, differences in human and physical capital, and differential
access to networks (social capital). Female-owned firms have also been found to be smaller in
scale, particularly in terms of employees, sales and capital stock, and less productive than their
male counterparts. Female entrepreneurs also tend to transit to entrepreneurship from unpaid
family work. Men, by contrast, become entrepreneurs after holding a wage job. The transition is
therefore more difficult for women entrepreneurs; to some extent, less preparation explains
why their profits are lower at least in the first few years of operations. 89 While the evidence is
84
Banerjee, A. and E. Duflo (2011), “Poor Economics: A Radical Rethinking of the Way to Fight Global Poverty”, Penguin Books, ISBN 978-1-58648-798-0. 85
Tanzania NPS 2010/2011 86
If more educated are more likely to come from advantaged backgrounds, then the seeming returns to education could be in part the returns to family background or connection in labor markets. 87
‘Adult’ is defined as 15 years of age or above. Source: World Development Indicators 2013, World Bank. 88
This is well documented in the literature (see WDR 2012 for a review). 89
Gamberoni, E. and M. Haji (2013), “Individual Characteristics and Business Dynamics: An Analysis of Male and Female Entrepreneurs in Tanzania,” World Bank, Washington, DC.
73
mixed, improved education, such as training or literacy programs for female entrepreneurs, may
have a positive effect on firms’ profitability.
(ii) Farms: Education does matter for productivity, but not as much as it matters for non-farm
businesses with external workers. The returns from education appear lower for farm
businesses, possibly reflecting the lower degree of specialization required in the agricultural
sector. However, the type of skills needed to run a farm may not be well captured by the level of
education since these skills are different and generally acquired through alternative channels.
(iii) Exporters: Skills and education (particularly managerial skills) are central determinants for
exporters. Labor productivity, which is linked to skills, determines to a large extent the ability of
a firm to become an exporter and to expand its operations over time. Like for non-farm
businesses, but with even more magnitude, the rates of return associated to education increase
with the level of education. In other words, investing in high education pays-off for workers that
want to work in exporting firms.
For all firms, there is a strong complementarity between skills and capital investment. The
positive effect associated with education is magnified in capital-intensive sectors such as
industry and mining. It is also higher in technology-intensive sectors, including communication
and financial services. These findings, consistent with the existing empirical literature both at
the micro and macro-levels90, emphasize that skilled workers are more productive with the
appropriate technology and equipment. Note that the inverse relation is also true: technology
also requires skilled workers.
Entrepreneurs report that certain types of skills are more difficult to find than others.
Numerical and behavioral skills are those which are the most sought after, followed by technical
and communication skills (Figure 20).
90
See, for example, Acemoglu, D. (2001). “Productivity Differences,” The Quarterly Journal of Economics, 116 (2): 563-606.
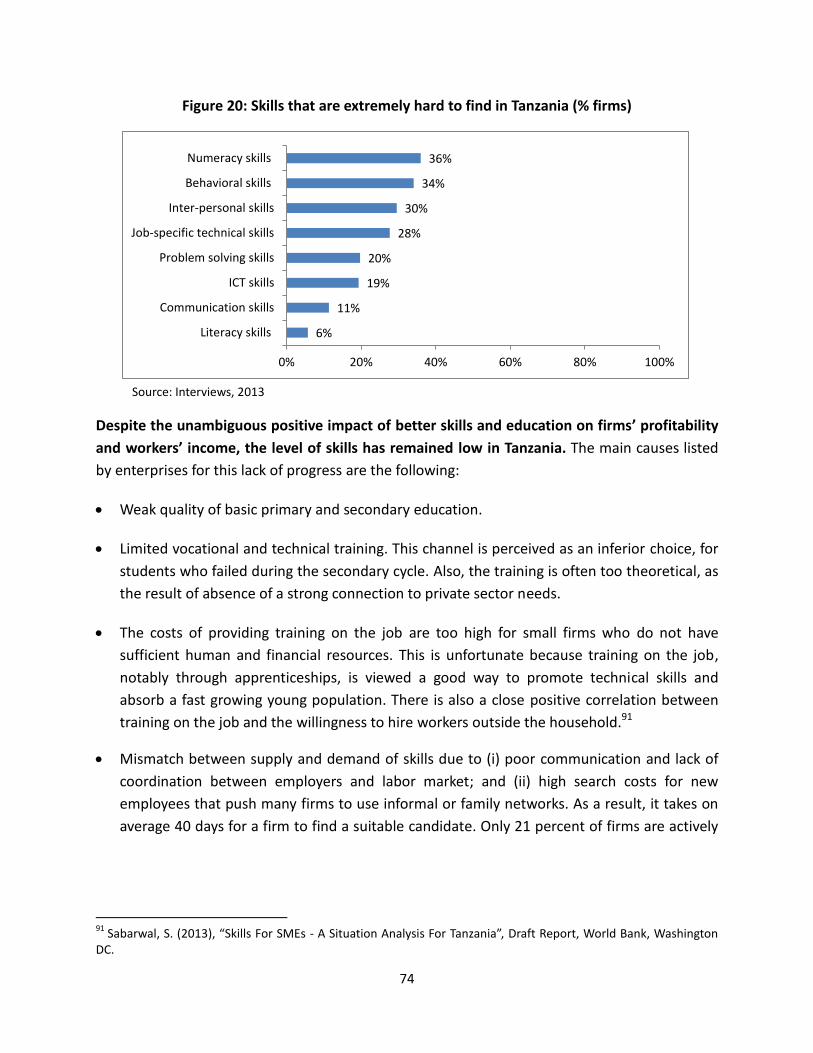
74
Figure 20: Skills that are extremely hard to find in Tanzania (% firms)
Source: Interviews, 2013
Despite the unambiguous positive impact of better skills and education on firms’ profitability
and workers’ income, the level of skills has remained low in Tanzania. The main causes listed
by enterprises for this lack of progress are the following:
Weak quality of basic primary and secondary education.
Limited vocational and technical training. This channel is perceived as an inferior choice, for
students who failed during the secondary cycle. Also, the training is often too theoretical, as
the result of absence of a strong connection to private sector needs.
The costs of providing training on the job are too high for small firms who do not have
sufficient human and financial resources. This is unfortunate because training on the job,
notably through apprenticeships, is viewed a good way to promote technical skills and
absorb a fast growing young population. There is also a close positive correlation between
training on the job and the willingness to hire workers outside the household.91
Mismatch between supply and demand of skills due to (i) poor communication and lack of
coordination between employers and labor market; and (ii) high search costs for new
employees that push many firms to use informal or family networks. As a result, it takes on
average 40 days for a firm to find a suitable candidate. Only 21 percent of firms are actively
91
Sabarwal, S. (2013), “Skills For SMEs - A Situation Analysis For Tanzania”, Draft Report, World Bank, Washington DC.
6%
11%
19%
20%
28%
30%
34%
36%
0% 20% 40% 60% 80% 100%
Literacy skills
Communication skills
ICT skills
Problem solving skills
Job-specific technical skills
Inter-personal skills
Behavioral skills
Numeracy skills

75
hiring beyond relatives’ network and only 2.7 percent have contact with education
institutes.92
Improving the level of skill and education is inherently a long-term investment, and requires
the combination of multiple initiatives. In the short and medium terms, the government can
however take concrete steps, in close collaboration with the private sector, to address some
specific gaps around workforce skill acquisition and deployment. These include linking
vocational training programs with private sector needs. Additionally, well-designed and targeted
on-the-job training programs are necessary, as well as focusing on soft skills.
2.2.4. Labor market competitiveness
At first sight, one of Tanzania’s comparative advantages lies in its low wages. However, the
cost of labor in Tanzania is not competitive due to low labor productivity.
This statement is best illustrated by examining the current situation in the light manufacturing
sector. The monthly wage for an unskilled Tanzanian worker ranges between US$ 93 and US$
173 in the textile sector, which is approximately three times lower than in China.93 With this
kind of difference, one would expect that Tanzania would be able to attract more industries in
light manufacturing sectors. However, this has not happened yet, at least not on a large scale.
One reason is that while nominal wages are competitive with China and other emerging
countries, they are comparable to those in Vietnam and Zambia and in fact significantly higher
than in Ethiopia or Madagascar. A worker operating in the leather industry, for example, would
earn half as much in Ethiopia as compared to Tanzania.94
Unfortunately, overall labor productivity appears low in Tanzania, even by regional standards.
Tanzanian workers are not only half as productive (on average) as workers in China (except for
agribusiness), but they are also less productive than workers in countries with similar or lower
nominal wages, including Vietnam and Ethiopia (Table 18). To a large extent, this is explained by
the lack of skilled labor available in the country.95
92
Sabarwal, S. (2013) 93
Dinh, H. and C. Monga (2013). “Light Manufacturing in Tanzania: A Reform Agenda for Job Creation and Prosperity,” Directions in Development, Washington, DC: World Bank. 94
The close positive relationship between labor productivity and skill development is a well-established fact in the economic literature. See for example: Banerji, A. et al. (2010). ”Stepping Skills for more jobs and higher productivity,” World Bank. This relationship, however, has been not corroborated in Tanzania because of the absence of robust data on labor productivity over time or across firms. 95
Today, 70 percent of Tanzanian small-business owners have less than seven years of education. In China and Vietnam, nearly 90 percent of small-business owners have more than some secondary education; in Tanzania, this is true among only 20 percent of small-business owners. Source: Dinh, H., D. Mavridis, and H. Nguyen. (November 2010). “The Binding Constraint on Firms’ Growth in Developing Countries,” World Bank, Washington DC.
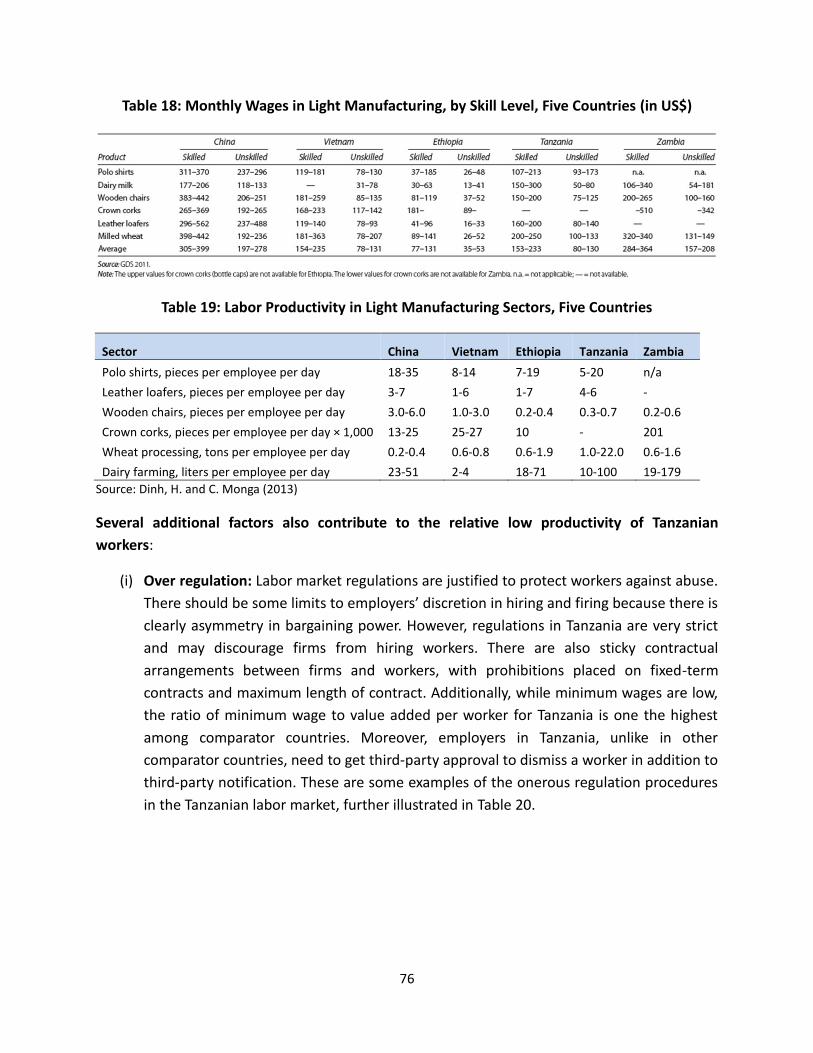
76
Table 18: Monthly Wages in Light Manufacturing, by Skill Level, Five Countries (in US$)
Table 19: Labor Productivity in Light Manufacturing Sectors, Five Countries
Sector China Vietnam Ethiopia Tanzania Zambia
Polo shirts, pieces per employee per day 18-35 8-14 7-19 5-20 n/a
Leather loafers, pieces per employee per day 3-7 1-6 1-7 4-6 -
Wooden chairs, pieces per employee per day 3.0-6.0 1.0-3.0 0.2-0.4 0.3-0.7 0.2-0.6
Crown corks, pieces per employee per day × 1,000 13-25 25-27 10 - 201
Wheat processing, tons per employee per day 0.2-0.4 0.6-0.8 0.6-1.9 1.0-22.0 0.6-1.6
Dairy farming, liters per employee per day 23-51 2-4 18-71 10-100 19-179
Source: Dinh, H. and C. Monga (2013)
Several additional factors also contribute to the relative low productivity of Tanzanian
workers:
(i) Over regulation: Labor market regulations are justified to protect workers against abuse.
There should be some limits to employers’ discretion in hiring and firing because there is
clearly asymmetry in bargaining power. However, regulations in Tanzania are very strict
and may discourage firms from hiring workers. There are also sticky contractual
arrangements between firms and workers, with prohibitions placed on fixed-term
contracts and maximum length of contract. Additionally, while minimum wages are low,
the ratio of minimum wage to value added per worker for Tanzania is one the highest
among comparator countries. Moreover, employers in Tanzania, unlike in other
comparator countries, need to get third-party approval to dismiss a worker in addition to
third-party notification. These are some examples of the onerous regulation procedures
in the Tanzanian labor market, further illustrated in Table 20.
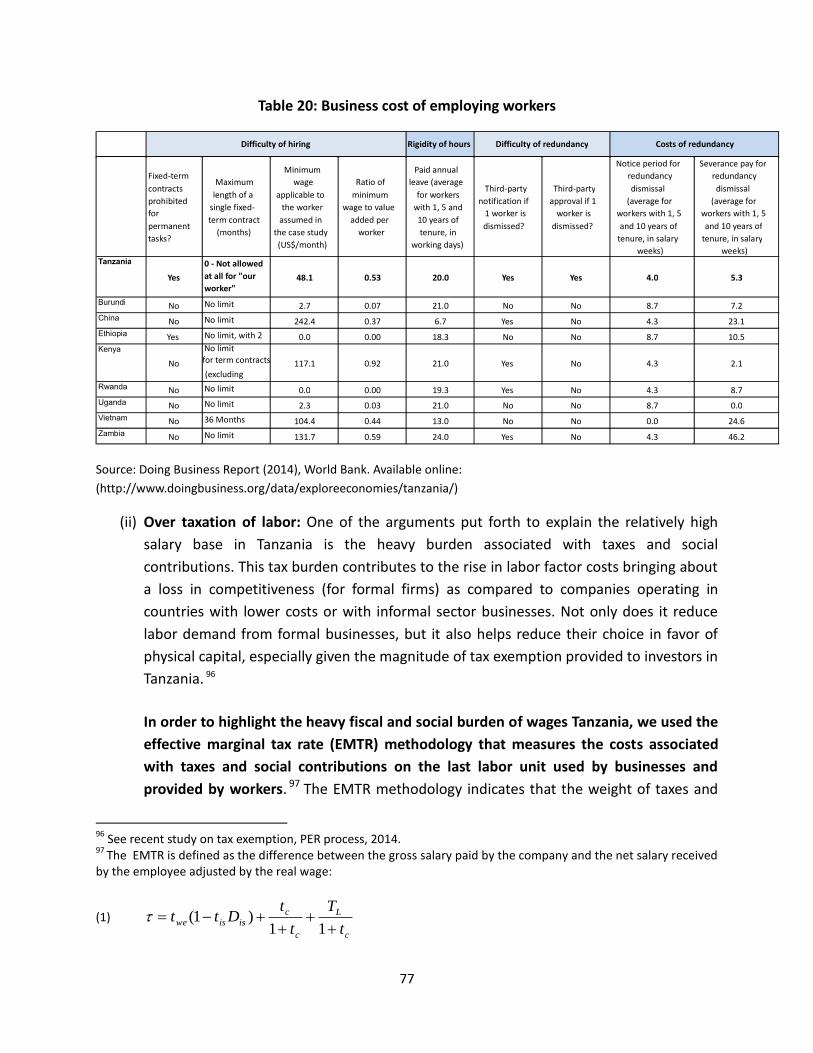
77
Table 20: Business cost of employing workers
Source: Doing Business Report (2014), World Bank. Available online:
(http://www.doingbusiness.org/data/exploreeconomies/tanzania/)
(ii) Over taxation of labor: One of the arguments put forth to explain the relatively high
salary base in Tanzania is the heavy burden associated with taxes and social
contributions. This tax burden contributes to the rise in labor factor costs bringing about
a loss in competitiveness (for formal firms) as compared to companies operating in
countries with lower costs or with informal sector businesses. Not only does it reduce
labor demand from formal businesses, but it also helps reduce their choice in favor of
physical capital, especially given the magnitude of tax exemption provided to investors in
Tanzania. 96
In order to highlight the heavy fiscal and social burden of wages Tanzania, we used the
effective marginal tax rate (EMTR) methodology that measures the costs associated
with taxes and social contributions on the last labor unit used by businesses and
provided by workers. 97 The EMTR methodology indicates that the weight of taxes and
96
See recent study on tax exemption, PER process, 2014. 97 The EMTR is defined as the difference between the gross salary paid by the company and the net salary received by the employee adjusted by the real wage:
(1) c
L
c
c
isiswet
T
t
tDtt
11)1(
Rigidity of hours Difficulty of hiring Costs of redundancy Difficulty of redundancy
Fixed-term contracts prohibited for permanent tasks?
Maximum length of a
single fixed- term contract
(months)
Minimum wage
applicable to the worker
assumed in the case study (US$/month)
Ratio of minimum
wage to value added per
worker
Paid annual leave (average
for workers with 1, 5 and 10 years of tenure, in
working days)
Third-party notification if
1 worker is dismissed?
Third-party approval if 1
worker is dismissed?
Notice period for redundancy dismissal
(average for workers with 1, 5 and 10 years of
tenure, in salary weeks)
Severance pay for redundancy dismissal
(average for workers with 1, 5 and 10 years of
tenure, in salary weeks)
Tanzania Yes
0 - Not allowed at all for "our worker"
48.1 0.53 20.0 Yes Yes 4.0 5.3
Burundi No No limit 2.7 0.07 21.0 No No 8.7 7.2 China No No limit 242.4 0.37 6.7 Yes No 4.3 23.1 Ethiopia Yes No limit, with 2
exceptions 0.0 0.00 18.3 No No 8.7 10.5
Kenya No for term contracts
(excluding 117.1 0.92 21.0 Yes No 4.3 2.1
Rwanda No No limit 0.0 0.00 19.3 Yes No 4.3 8.7 Uganda No No limit 2.3 0.03 21.0 No No 8.7 0.0 Vietnam No 36 Months 104.4 0.44 13.0 No No 0.0 24.6 Zambia No No limit 131.7 0.59 24.0 Yes No 4.3 46.2
No limit
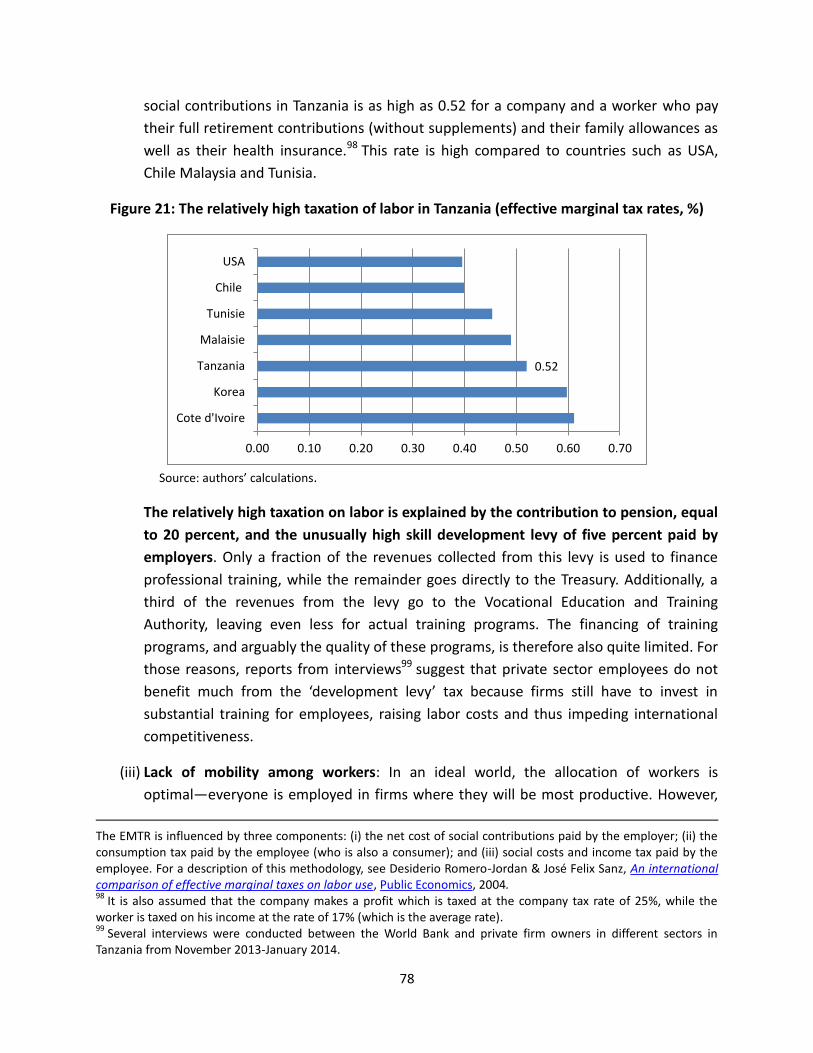
78
social contributions in Tanzania is as high as 0.52 for a company and a worker who pay
their full retirement contributions (without supplements) and their family allowances as
well as their health insurance.98 This rate is high compared to countries such as USA,
Chile Malaysia and Tunisia.
Figure 21: The relatively high taxation of labor in Tanzania (effective marginal tax rates, %)
Source: authors’ calculations.
The relatively high taxation on labor is explained by the contribution to pension, equal
to 20 percent, and the unusually high skill development levy of five percent paid by
employers. Only a fraction of the revenues collected from this levy is used to finance
professional training, while the remainder goes directly to the Treasury. Additionally, a
third of the revenues from the levy go to the Vocational Education and Training
Authority, leaving even less for actual training programs. The financing of training
programs, and arguably the quality of these programs, is therefore also quite limited. For
those reasons, reports from interviews99 suggest that private sector employees do not
benefit much from the ‘development levy’ tax because firms still have to invest in
substantial training for employees, raising labor costs and thus impeding international
competitiveness.
(iii) Lack of mobility among workers: In an ideal world, the allocation of workers is
optimal—everyone is employed in firms where they will be most productive. However,
The EMTR is influenced by three components: (i) the net cost of social contributions paid by the employer; (ii) the consumption tax paid by the employee (who is also a consumer); and (iii) social costs and income tax paid by the employee. For a description of this methodology, see Desiderio Romero-Jordan & José Felix Sanz, An international comparison of effective marginal taxes on labor use, Public Economics, 2004. 98
It is also assumed that the company makes a profit which is taxed at the company tax rate of 25%, while the worker is taxed on his income at the rate of 17% (which is the average rate). 99
Several interviews were conducted between the World Bank and private firm owners in different sectors in Tanzania from November 2013-January 2014.
0.52
0.00 0.10 0.20 0.30 0.40 0.50 0.60 0.70
Cote d'Ivoire
Korea
Tanzania
Malaisie
Tunisie
Chile
USA
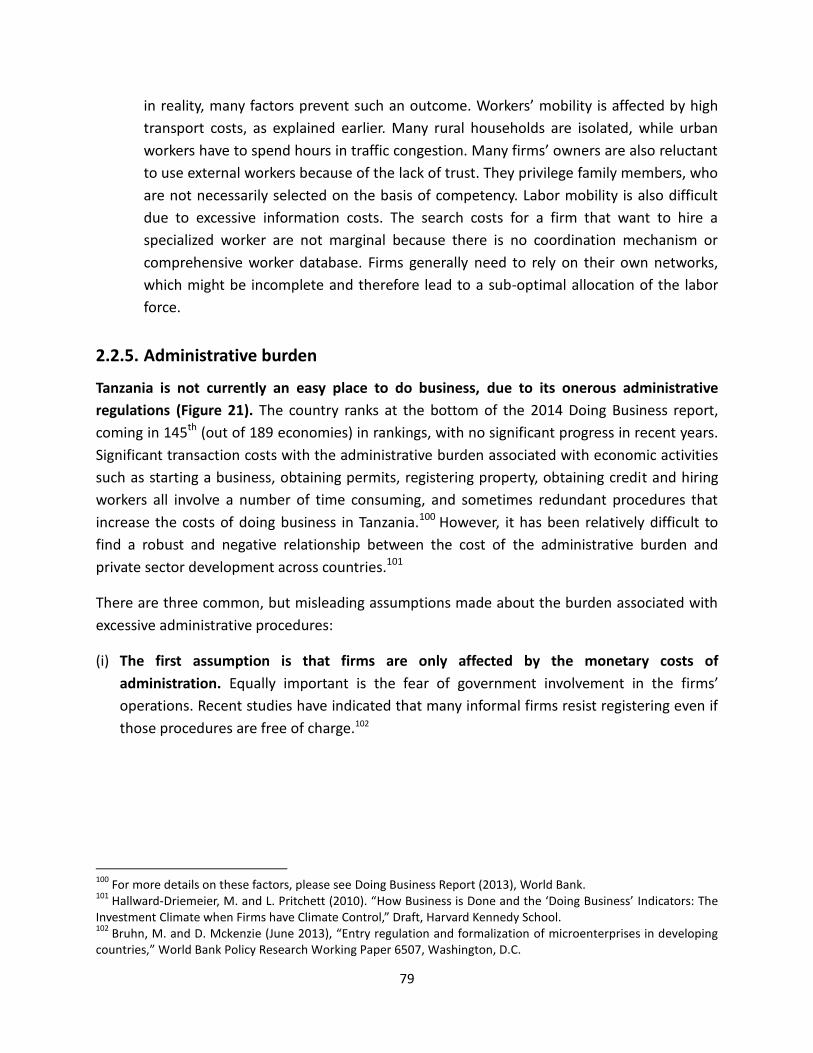
79
in reality, many factors prevent such an outcome. Workers’ mobility is affected by high
transport costs, as explained earlier. Many rural households are isolated, while urban
workers have to spend hours in traffic congestion. Many firms’ owners are also reluctant
to use external workers because of the lack of trust. They privilege family members, who
are not necessarily selected on the basis of competency. Labor mobility is also difficult
due to excessive information costs. The search costs for a firm that want to hire a
specialized worker are not marginal because there is no coordination mechanism or
comprehensive worker database. Firms generally need to rely on their own networks,
which might be incomplete and therefore lead to a sub-optimal allocation of the labor
force.
2.2.5. Administrative burden
Tanzania is not currently an easy place to do business, due to its onerous administrative
regulations (Figure 21). The country ranks at the bottom of the 2014 Doing Business report,
coming in 145th (out of 189 economies) in rankings, with no significant progress in recent years.
Significant transaction costs with the administrative burden associated with economic activities
such as starting a business, obtaining permits, registering property, obtaining credit and hiring
workers all involve a number of time consuming, and sometimes redundant procedures that
increase the costs of doing business in Tanzania.100 However, it has been relatively difficult to
find a robust and negative relationship between the cost of the administrative burden and
private sector development across countries.101
There are three common, but misleading assumptions made about the burden associated with
excessive administrative procedures:
(i) The first assumption is that firms are only affected by the monetary costs of
administration. Equally important is the fear of government involvement in the firms’
operations. Recent studies have indicated that many informal firms resist registering even if
those procedures are free of charge.102
100
For more details on these factors, please see Doing Business Report (2013), World Bank. 101
Hallward-Driemeier, M. and L. Pritchett (2010). “How Business is Done and the ‘Doing Business’ Indicators: The Investment Climate when Firms have Climate Control,” Draft, Harvard Kennedy School. 102
Bruhn, M. and D. Mckenzie (June 2013), “Entry regulation and formalization of microenterprises in developing countries,” World Bank Policy Research Working Paper 6507, Washington, D.C.
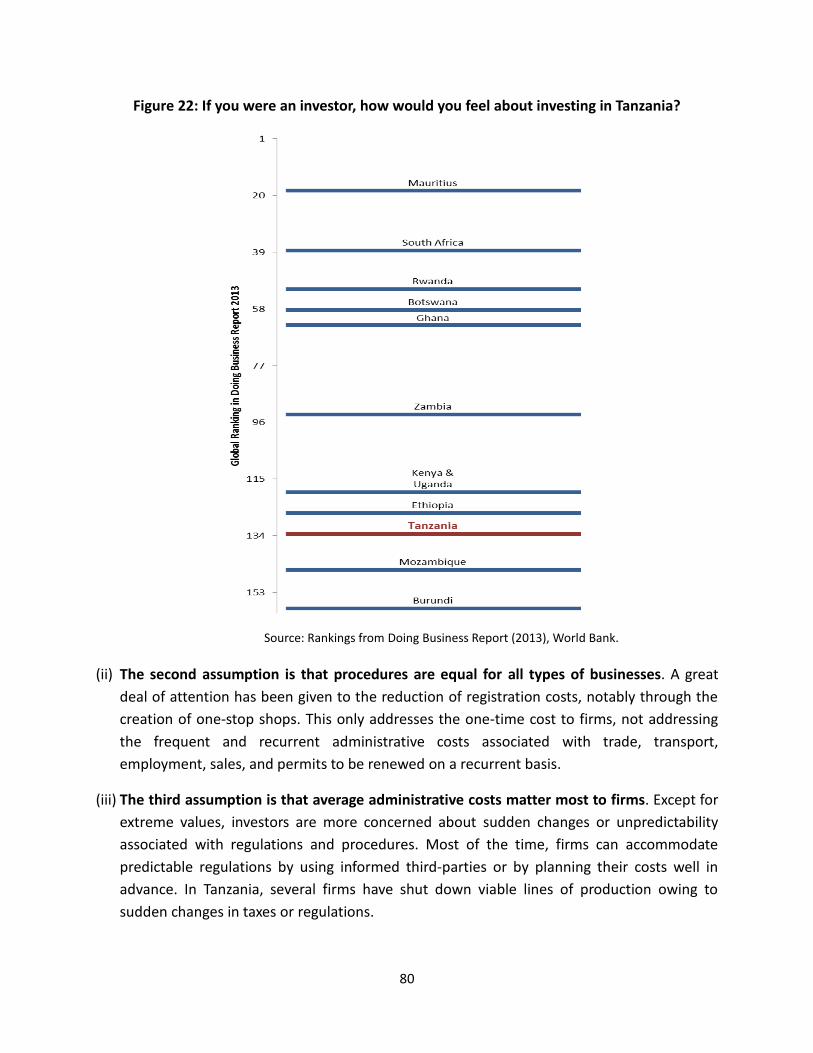
80
Figure 22: If you were an investor, how would you feel about investing in Tanzania?
Source: Rankings from Doing Business Report (2013), World Bank.
(ii) The second assumption is that procedures are equal for all types of businesses. A great
deal of attention has been given to the reduction of registration costs, notably through the
creation of one-stop shops. This only addresses the one-time cost to firms, not addressing
the frequent and recurrent administrative costs associated with trade, transport,
employment, sales, and permits to be renewed on a recurrent basis.
(iii) The third assumption is that average administrative costs matter most to firms. Except for
extreme values, investors are more concerned about sudden changes or unpredictability
associated with regulations and procedures. Most of the time, firms can accommodate
predictable regulations by using informed third-parties or by planning their costs well in
advance. In Tanzania, several firms have shut down viable lines of production owing to
sudden changes in taxes or regulations.
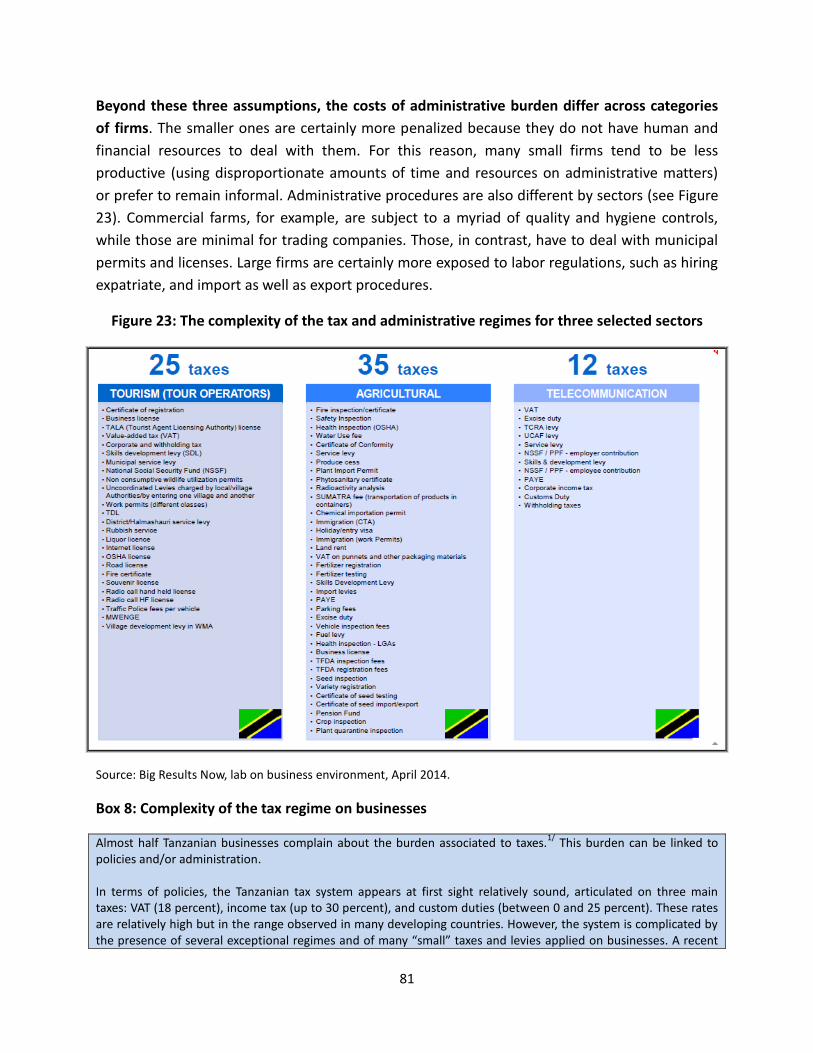
81
Beyond these three assumptions, the costs of administrative burden differ across categories
of firms. The smaller ones are certainly more penalized because they do not have human and
financial resources to deal with them. For this reason, many small firms tend to be less
productive (using disproportionate amounts of time and resources on administrative matters)
or prefer to remain informal. Administrative procedures are also different by sectors (see Figure
23). Commercial farms, for example, are subject to a myriad of quality and hygiene controls,
while those are minimal for trading companies. Those, in contrast, have to deal with municipal
permits and licenses. Large firms are certainly more exposed to labor regulations, such as hiring
expatriate, and import as well as export procedures.
Figure 23: The complexity of the tax and administrative regimes for three selected sectors
Source: Big Results Now, lab on business environment, April 2014.
Box 8: Complexity of the tax regime on businesses
Almost half Tanzanian businesses complain about the burden associated to taxes.1/
This burden can be linked to policies and/or administration. In terms of policies, the Tanzanian tax system appears at first sight relatively sound, articulated on three main taxes: VAT (18 percent), income tax (up to 30 percent), and custom duties (between 0 and 25 percent). These rates are relatively high but in the range observed in many developing countries. However, the system is complicated by the presence of several exceptional regimes and of many “small” taxes and levies applied on businesses. A recent
82
study documented about fifty pages of exceptions in the VAT Act (1997, Income Tax Act (2004), the EAC Customs management Act (2004), the EPZ Act (2002), and the Special Economic Zones Act (2006).
2/ Among small taxes and
levies are those collected on labor as well as the myriad of fees collected by agencies and local authorities. The tax system is also overly complex for small businesses, who cannot comply with requirement needed to pay, for example, the VAT in the absence of proper financial records. The complexity of the current taxation regime negatively affects its administration. First, it is more time consuming for tax inspectors as well as for taxpayers to understand. Second, monitoring and controls become a perilous and expensive exercise for tax administration when exceptions become the rule. Third, the more complex is the system, the easier is for involved parties to circumvent it. There is indeed a close positive relationship between the complexity of the tax system and corruption as well as evasion. The Tanzanian authorities have launched a series of initiatives to streamline the current tax system. The VAT Act is under review to reduce exceptions, while the revised Tax Administration Act should help simplify procedures, in particular for small businesses. TRA has also intensified the use of computerized systems to facilitate and control tax payments. The BRN lab on Business Environment has also recommended a number of ways to streamline business taxes and widen the tax base.
3/ However, most successful countries (including Mauritius and Senegal) are
those that have taken bold measures to make “normal” regime more attractive. These countries have lowered their income tax rates (down to 15 percent in Mauritius) and considerably reduce the number of small taxes and levies. Only when the normal regime is attractive, the elimination of complex (and often unfair) tax exceptions can be considered and accepted by private businesses.
1/ Source: World Bank Enterprise Survey. 2/ Public Expenditure Review, Actions plans for implementation of the study on tax exemption, Ministry of Finance and Danida, 2014. 3/ Big Results Now Lab (March 2014)
Location also matters for administrative costs. As an example, businesses can only be
registered from Dar es Salaam, and the process requires signatures from Business Registration
and Licensing Agency (BRELA) registrar which is located in Dar. This makes it difficult for
businesses located outside of Dar, and other methods (couriering documents) incur additional
costs, as well as additional transaction time. Business licensing also incurs additional costs. Until
2013, licenses were issued once and without fees; however, from July 2013, annual renewal of
licenses and payment of license fees were reintroduced. Businesses also need to register for a
Tax Identification Number (TIN), and while there are TRA offices present outside of Dar, the
travel to the TRA office is still a constraint for smaller enterprises.
While reducing administrative costs is important, it seems to be just as relevant to increase
benefits, reduce distance between firms and administrations, and reduce uncertainty. By
complying with procedures, firms should be able to get concrete benefits such as access to
credit and to training programs. The emphasis should be given to procedures that affect
enterprises on a regular basis. Last but not least, predictability and transparency in the
regulatory environment is essential as uncertainty is one major barrier to private investment.103
103
See, for example: Dixit, A. and R. Pindyck (1994) “Investment under Uncertainty,” ISBN:9780691034102
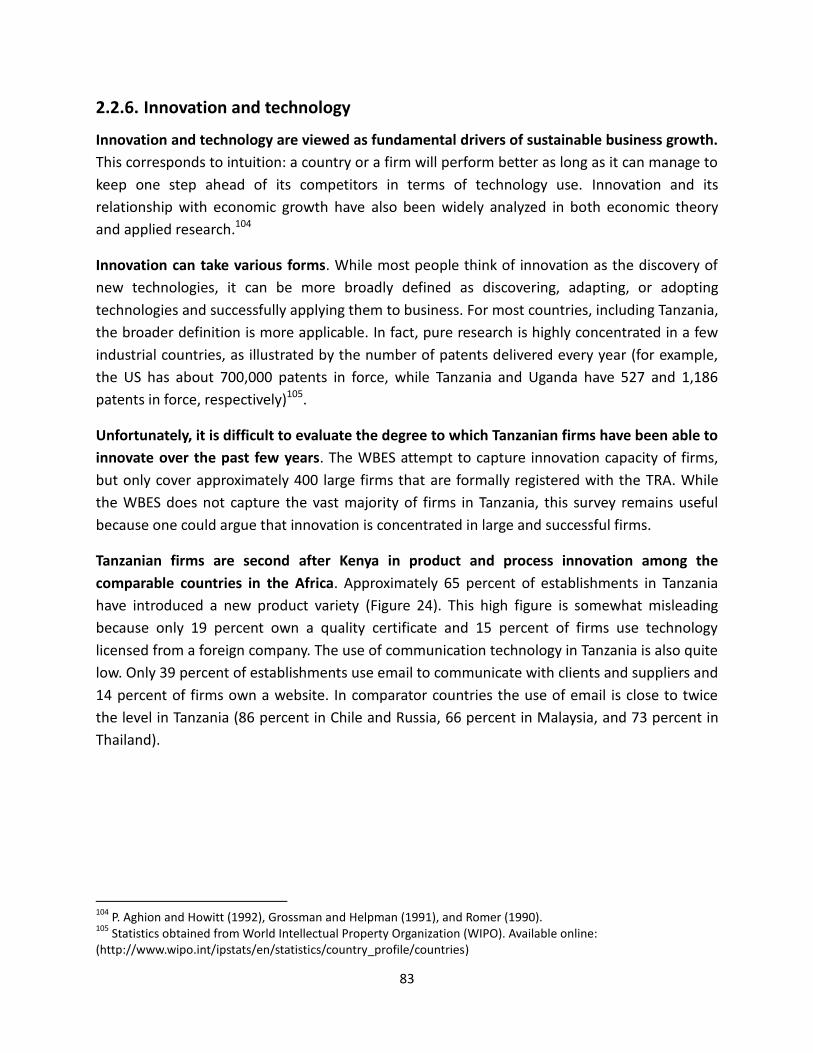
83
2.2.6. Innovation and technology
Innovation and technology are viewed as fundamental drivers of sustainable business growth.
This corresponds to intuition: a country or a firm will perform better as long as it can manage to
keep one step ahead of its competitors in terms of technology use. Innovation and its
relationship with economic growth have also been widely analyzed in both economic theory
and applied research.104
Innovation can take various forms. While most people think of innovation as the discovery of
new technologies, it can be more broadly defined as discovering, adapting, or adopting
technologies and successfully applying them to business. For most countries, including Tanzania,
the broader definition is more applicable. In fact, pure research is highly concentrated in a few
industrial countries, as illustrated by the number of patents delivered every year (for example,
the US has about 700,000 patents in force, while Tanzania and Uganda have 527 and 1,186
patents in force, respectively)105.
Unfortunately, it is difficult to evaluate the degree to which Tanzanian firms have been able to
innovate over the past few years. The WBES attempt to capture innovation capacity of firms,
but only cover approximately 400 large firms that are formally registered with the TRA. While
the WBES does not capture the vast majority of firms in Tanzania, this survey remains useful
because one could argue that innovation is concentrated in large and successful firms.
Tanzanian firms are second after Kenya in product and process innovation among the
comparable countries in the Africa. Approximately 65 percent of establishments in Tanzania
have introduced a new product variety (Figure 24). This high figure is somewhat misleading
because only 19 percent own a quality certificate and 15 percent of firms use technology
licensed from a foreign company. The use of communication technology in Tanzania is also quite
low. Only 39 percent of establishments use email to communicate with clients and suppliers and
14 percent of firms own a website. In comparator countries the use of email is close to twice
the level in Tanzania (86 percent in Chile and Russia, 66 percent in Malaysia, and 73 percent in
Thailand).
104
P. Aghion and Howitt (1992), Grossman and Helpman (1991), and Romer (1990). 105
Statistics obtained from World Intellectual Property Organization (WIPO). Available online: (http://www.wipo.int/ipstats/en/statistics/country_profile/countries)
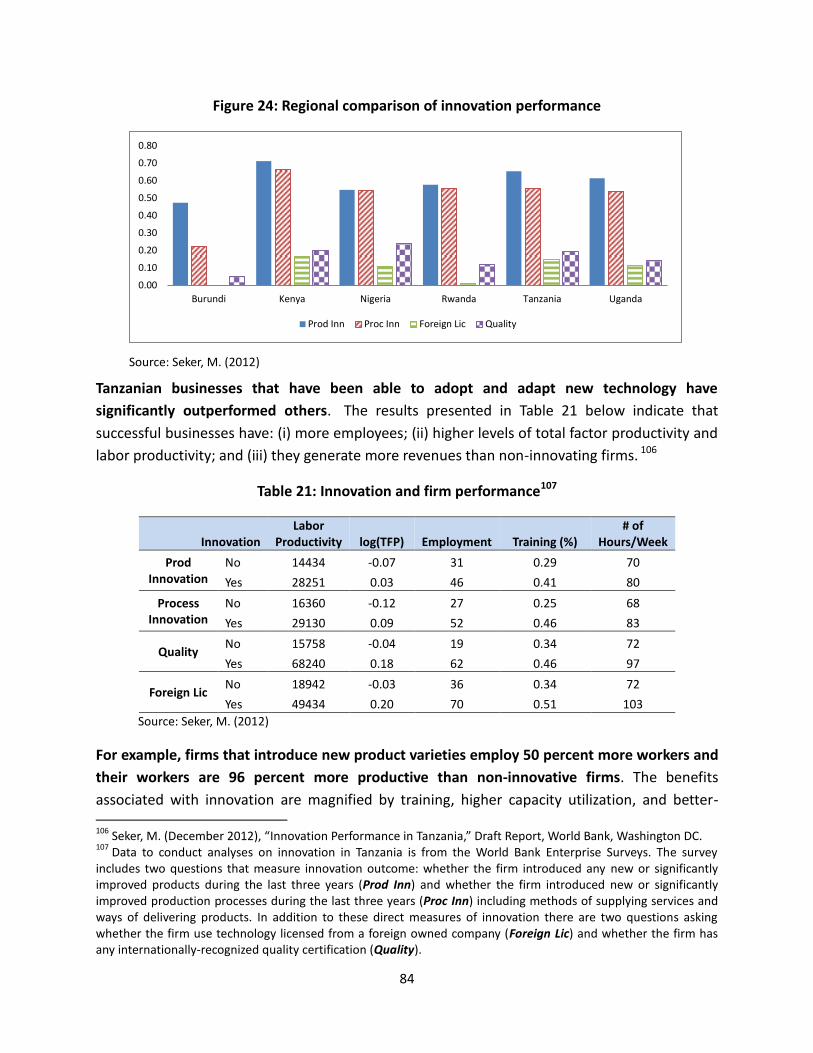
84
Figure 24: Regional comparison of innovation performance
Source: Seker, M. (2012)
Tanzanian businesses that have been able to adopt and adapt new technology have
significantly outperformed others. The results presented in Table 21 below indicate that
successful businesses have: (i) more employees; (ii) higher levels of total factor productivity and
labor productivity; and (iii) they generate more revenues than non-innovating firms. 106
Table 21: Innovation and firm performance107
Innovation Labor
Productivity log(TFP) Employment Training (%) # of
Hours/Week
Prod Innovation
No 14434 -0.07 31 0.29 70
Yes 28251 0.03 46 0.41 80
Process Innovation
No 16360 -0.12 27 0.25 68
Yes 29130 0.09 52 0.46 83
Quality No 15758 -0.04 19 0.34 72
Yes 68240 0.18 62 0.46 97
Foreign Lic No 18942 -0.03 36 0.34 72
Yes 49434 0.20 70 0.51 103
Source: Seker, M. (2012)
For example, firms that introduce new product varieties employ 50 percent more workers and
their workers are 96 percent more productive than non-innovative firms. The benefits
associated with innovation are magnified by training, higher capacity utilization, and better- 106
Seker, M. (December 2012), “Innovation Performance in Tanzania,” Draft Report, World Bank, Washington DC. 107
Data to conduct analyses on innovation in Tanzania is from the World Bank Enterprise Surveys. The survey includes two questions that measure innovation outcome: whether the firm introduced any new or significantly improved products during the last three years (Prod Inn) and whether the firm introduced new or significantly improved production processes during the last three years (Proc Inn) including methods of supplying services and ways of delivering products. In addition to these direct measures of innovation there are two questions asking whether the firm use technology licensed from a foreign owned company (Foreign Lic) and whether the firm has any internationally-recognized quality certification (Quality).
0.00
0.10
0.20
0.30
0.40
0.50
0.60
0.70
0.80
Burundi Kenya Nigeria Rwanda Tanzania Uganda
Prod Inn Proc Inn Foreign Lic Quality
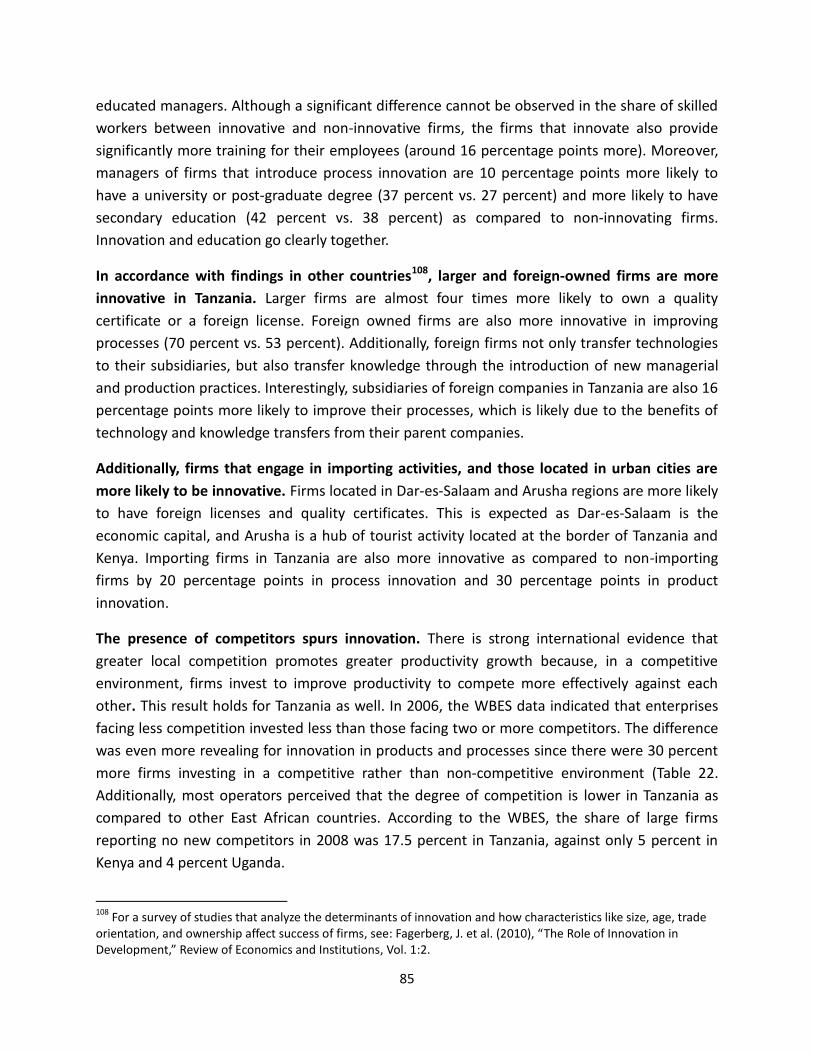
85
educated managers. Although a significant difference cannot be observed in the share of skilled
workers between innovative and non-innovative firms, the firms that innovate also provide
significantly more training for their employees (around 16 percentage points more). Moreover,
managers of firms that introduce process innovation are 10 percentage points more likely to
have a university or post-graduate degree (37 percent vs. 27 percent) and more likely to have
secondary education (42 percent vs. 38 percent) as compared to non-innovating firms.
Innovation and education go clearly together.
In accordance with findings in other countries108, larger and foreign-owned firms are more
innovative in Tanzania. Larger firms are almost four times more likely to own a quality
certificate or a foreign license. Foreign owned firms are also more innovative in improving
processes (70 percent vs. 53 percent). Additionally, foreign firms not only transfer technologies
to their subsidiaries, but also transfer knowledge through the introduction of new managerial
and production practices. Interestingly, subsidiaries of foreign companies in Tanzania are also 16
percentage points more likely to improve their processes, which is likely due to the benefits of
technology and knowledge transfers from their parent companies.
Additionally, firms that engage in importing activities, and those located in urban cities are
more likely to be innovative. Firms located in Dar-es-Salaam and Arusha regions are more likely
to have foreign licenses and quality certificates. This is expected as Dar-es-Salaam is the
economic capital, and Arusha is a hub of tourist activity located at the border of Tanzania and
Kenya. Importing firms in Tanzania are also more innovative as compared to non-importing
firms by 20 percentage points in process innovation and 30 percentage points in product
innovation.
The presence of competitors spurs innovation. There is strong international evidence that
greater local competition promotes greater productivity growth because, in a competitive
environment, firms invest to improve productivity to compete more effectively against each
other. This result holds for Tanzania as well. In 2006, the WBES data indicated that enterprises
facing less competition invested less than those facing two or more competitors. The difference
was even more revealing for innovation in products and processes since there were 30 percent
more firms investing in a competitive rather than non-competitive environment (Table 22.
Additionally, most operators perceived that the degree of competition is lower in Tanzania as
compared to other East African countries. According to the WBES, the share of large firms
reporting no new competitors in 2008 was 17.5 percent in Tanzania, against only 5 percent in
Kenya and 4 percent Uganda.
108
For a survey of studies that analyze the determinants of innovation and how characteristics like size, age, trade orientation, and ownership affect success of firms, see: Fagerberg, J. et al. (2010), “The Role of Innovation in Development,” Review of Economics and Institutions, Vol. 1:2.
86
Table 22: Competition spurs innovation
Source: Yoshino et al (2013).
The Tanzanian economy reveals a high concentration in most manufacturing sectors despite
increasing competition from imports. Most manufacturing sectors in Tanzania show high
concentration indexes (such as the Herfindahl-Hirschman index), and the top three or four firms
produce more than 50 percent of domestic production in their ISIC group. The food products
and beverages sector is much less concentrated than other sectors, such as leather and leather
products, apparel, textiles, and wood products (Figure 25).
Av. Investment as % of Value-
Added
% of Enterprises Introduced
New Products or Processes
No or 1
competitor
2 or more
competitors
No or 1
competitor
2 or more
competitors
Burundi 59.08% 14.25% 40.00% 57.89%
Kenya 3.77% 13.33% 70.00% 80.62%
Rwanda 31.96% 8.45% 77.78% 70.83%
Tanzania 31.50% 43.00% 53.33% 81.05%
Uganda 23.76% 13.67% 70.00% 83.65%
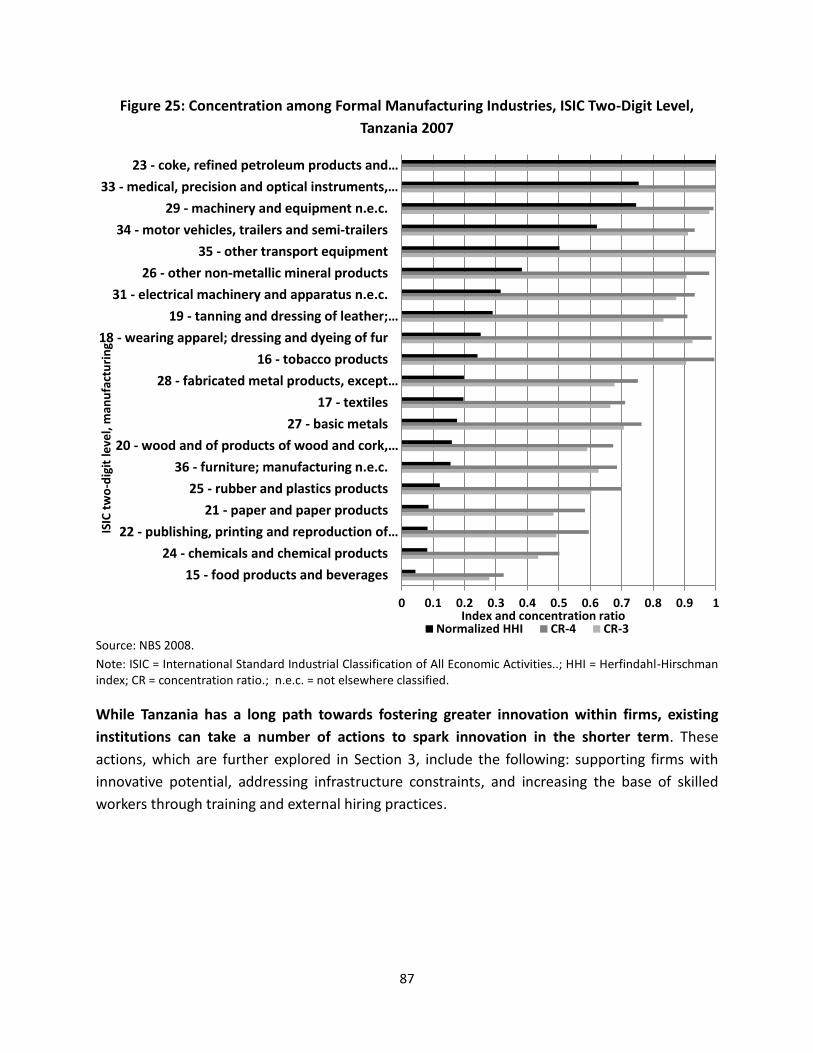
87
Figure 25: Concentration among Formal Manufacturing Industries, ISIC Two-Digit Level,
Tanzania 2007
Source: NBS 2008.
Note: ISIC = International Standard Industrial Classification of All Economic Activities..; HHI = Herfindahl-Hirschman index; CR = concentration ratio.; n.e.c. = not elsewhere classified.
While Tanzania has a long path towards fostering greater innovation within firms, existing
institutions can take a number of actions to spark innovation in the shorter term. These
actions, which are further explored in Section 3, include the following: supporting firms with
innovative potential, addressing infrastructure constraints, and increasing the base of skilled
workers through training and external hiring practices.
0 0.1 0.2 0.3 0.4 0.5 0.6 0.7 0.8 0.9 1
15 - food products and beverages
24 - chemicals and chemical products
22 - publishing, printing and reproduction of…
21 - paper and paper products
25 - rubber and plastics products
36 - furniture; manufacturing n.e.c.
20 - wood and of products of wood and cork,…
27 - basic metals
17 - textiles
28 - fabricated metal products, except…
16 - tobacco products
18 - wearing apparel; dressing and dyeing of fur
19 - tanning and dressing of leather;…
31 - electrical machinery and apparatus n.e.c.
26 - other non-metallic mineral products
35 - other transport equipment
34 - motor vehicles, trailers and semi-trailers
29 - machinery and equipment n.e.c.
33 - medical, precision and optical instruments,…
23 - coke, refined petroleum products and…
Index and concentration ratio
ISIC
tw
o-d
igit
leve
l, m
anu
fact
uri
ng
Normalized HHI CR-4 CR-3
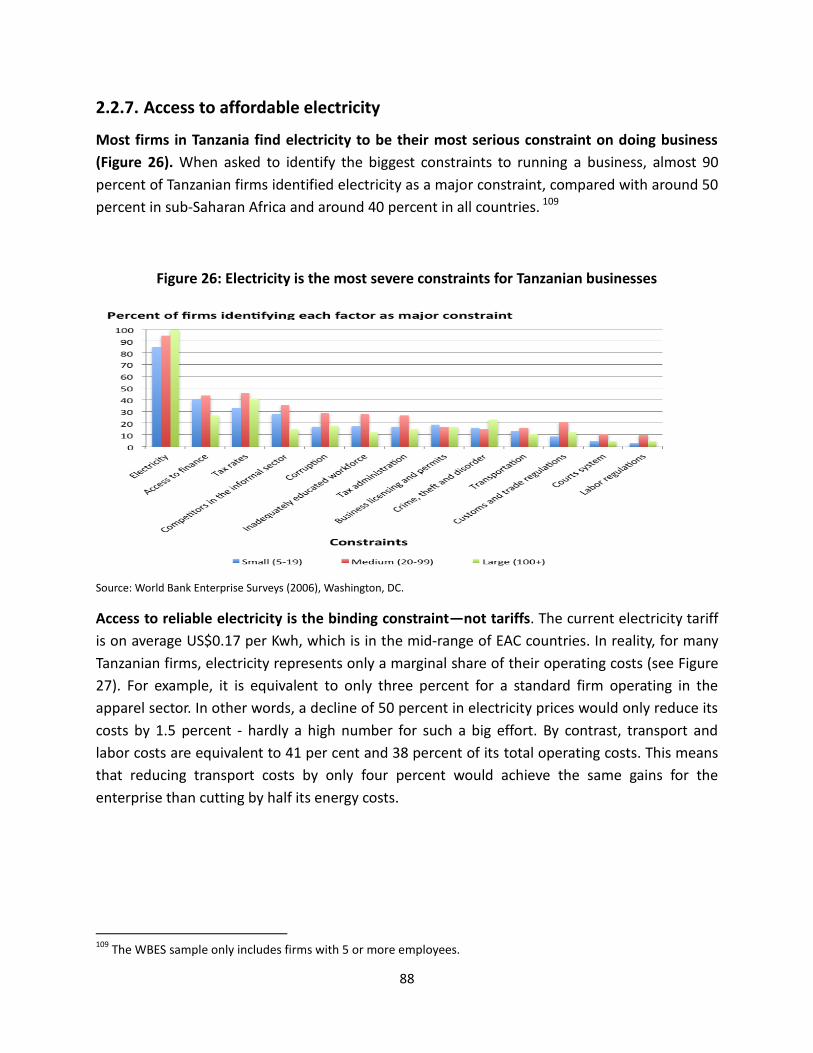
88
2.2.7. Access to affordable electricity
Most firms in Tanzania find electricity to be their most serious constraint on doing business
(Figure 26). When asked to identify the biggest constraints to running a business, almost 90
percent of Tanzanian firms identified electricity as a major constraint, compared with around 50
percent in sub-Saharan Africa and around 40 percent in all countries. 109
Figure 26: Electricity is the most severe constraints for Tanzanian businesses
Source: World Bank Enterprise Surveys (2006), Washington, DC.
Access to reliable electricity is the binding constraint—not tariffs. The current electricity tariff
is on average US$0.17 per Kwh, which is in the mid-range of EAC countries. In reality, for many
Tanzanian firms, electricity represents only a marginal share of their operating costs (see Figure
27). For example, it is equivalent to only three percent for a standard firm operating in the
apparel sector. In other words, a decline of 50 percent in electricity prices would only reduce its
costs by 1.5 percent - hardly a high number for such a big effort. By contrast, transport and
labor costs are equivalent to 41 per cent and 38 percent of its total operating costs. This means
that reducing transport costs by only four percent would achieve the same gains for the
enterprise than cutting by half its energy costs.
109
The WBES sample only includes firms with 5 or more employees.
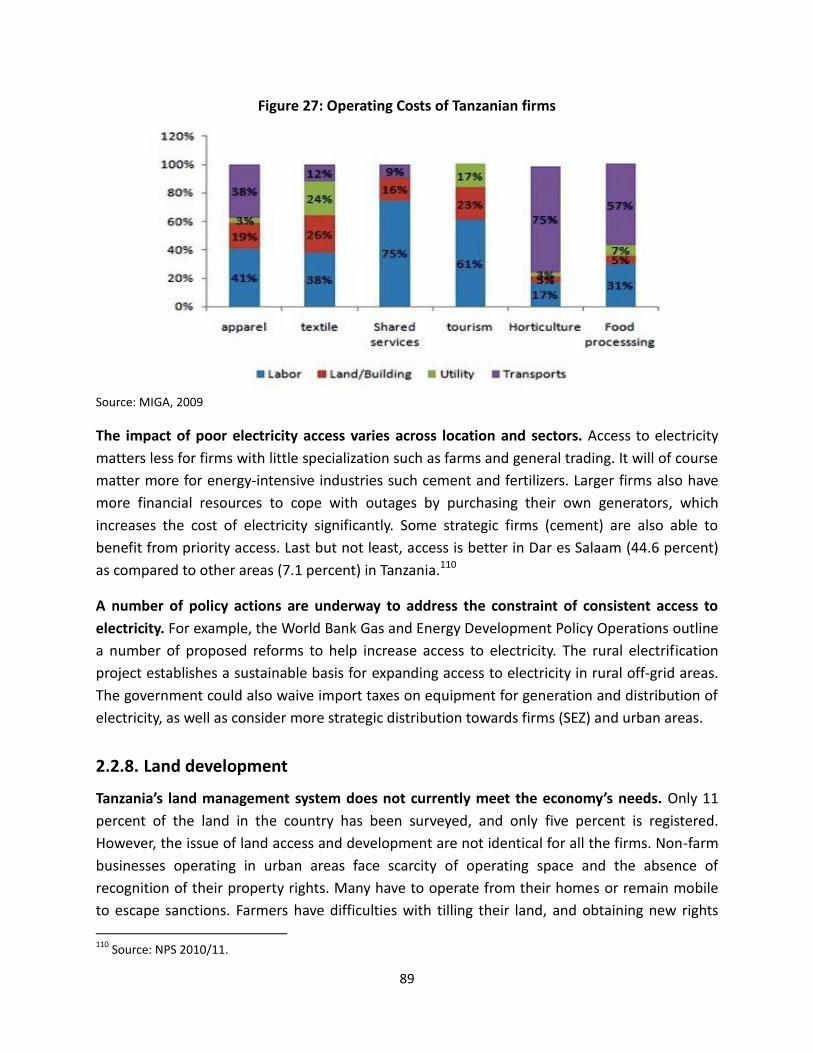
89
Figure 27: Operating Costs of Tanzanian firms
Source: MIGA, 2009
The impact of poor electricity access varies across location and sectors. Access to electricity
matters less for firms with little specialization such as farms and general trading. It will of course
matter more for energy-intensive industries such cement and fertilizers. Larger firms also have
more financial resources to cope with outages by purchasing their own generators, which
increases the cost of electricity significantly. Some strategic firms (cement) are also able to
benefit from priority access. Last but not least, access is better in Dar es Salaam (44.6 percent)
as compared to other areas (7.1 percent) in Tanzania.110
A number of policy actions are underway to address the constraint of consistent access to
electricity. For example, the World Bank Gas and Energy Development Policy Operations outline
a number of proposed reforms to help increase access to electricity. The rural electrification
project establishes a sustainable basis for expanding access to electricity in rural off-grid areas.
The government could also waive import taxes on equipment for generation and distribution of
electricity, as well as consider more strategic distribution towards firms (SEZ) and urban areas.
2.2.8. Land development
Tanzania’s land management system does not currently meet the economy’s needs. Only 11
percent of the land in the country has been surveyed, and only five percent is registered.
However, the issue of land access and development are not identical for all the firms. Non-farm
businesses operating in urban areas face scarcity of operating space and the absence of
recognition of their property rights. Many have to operate from their homes or remain mobile
to escape sanctions. Farmers have difficulties with tilling their land, and obtaining new rights
110
Source: NPS 2010/11.

90
has proved to be arduous for new investors in those sectors. Exporters, generally large firms, are
competing to access land close to connective infrastructure, reducing their transport costs
toward foreign markets. These different situations call for differentiated solutions.
Non-farm businesses: Access to land and business operation is an operational constraint
among both small and large non-farm businesses in urban areas. Many small companies are
run by owners in their homes or in small workshops, often encroaching on sidewalks or public
land. Such companies need land to expand and grow, and they need secure property rights so
they may use land as collateral for loans. Larger companies need factory space, storage facilities,
and showrooms. Without adequate storage space, companies have to purchase inputs in small
quantities at retail prices rather than in large quantities at wholesale prices.
To support the development of non-farm businesses in urban agglomerations, the
Government has sought to increase the area of industrial land available by developing
industrial parks and sector clusters (special economic zones). In these specific locations,
businesses can benefit from reduced complexity in the process of land titling, and a streamlined
number and type of land rights. The creation of one-stop-shop arrangements for business
licensing procedures and multiple outlets in those areas in Tanzania may also encourage greater
business registration.
Farms: Access to land ownership is a crucial and major constraint. One contributing factor is
the confusing and cumbersome set of procedures associated with land allocation. For example,
property registration takes average of eight procedures and 68 days.111 Also, unlike neighboring
countries, there is no land bank for foreign investors, and making land requests through the
Tanzanian Investment Center can take years.
Tenure rights are weak in rural areas. Of the 12 million plots used for agriculture production in
2010/2011, approximately 87 percent were owned by farming households, significantly more
than in Kenya or Uganda. Farmers claim to have a title for 12 percent of the plots they own, but
only a third of these are officially recognized titles: Certificates of Customary Rights of
Occupancy (CCROs) or Granted Rights of Occupancy (GRO). 112 Others are semi-formal
documents such as inheritance letters or letters of allocation from the village government,
which do not provide full security. This limited recognition of land holdings undermines farmers’
ability to buy and sell land, and to use their land as collateral for credit.
In theory, current land legislation (revised in first decade of the 2000s) strengthens the
security of land tenure and makes land use more productive. This is promoted through a highly
111
Source: World Bank’s Doing Indicators, 2013. 112
Tanzania Economic Update, “Spreading the Wings: From Growth to Shared Prosperity” Issue 2, World Bank (October 2012).
91
decentralized process of land demarcation, titling, registration, and conflict resolution. It divides
land into three categories, each with its own rules: village land (70 percent of the total,
administered by village councils), reserved land (28 percent, administered under various laws),
and general land (two percent, administered by the commissioner of lands).113 In reality
however, progress on implementation of land reform has been slow. For rural land reform, the
sector could become more productive if smallholders had titles to their land. This would allow
owners to make their own decisions about whether to buy or sell land, and be able to use their
land as collateral for credit.
2.3. How can Tanzania cultivate productive firms?
Cultivating dynamic firms has to be a priority for Tanzania’s policy makers. Many necessary
transformations will take time to show concrete results: for example, upgrading the skills of the
labor force or building connective infrastructure takes time. For this reason, implementation has
to be initiated with a sense of urgency, so that reforms will not be delayed further in time.
At the same time, Tanzania’s leaders should consider complementary actions—catalysts of
growth—that can accelerate the transformation process of firms in the shorter term. On the
basis of recent international experience, four possible catalysts can be envisioned: (i)
clustering of firms; (ii) regional integration; (iii) foreign direct investment; and (iv) simple
technological changes. Clusters can help promote agglomeration effects that generate
economies of scale within and around the firms. Regional integration has already been a driving
force behind the expansion of Tanzanian exports, notably in the manufacturing sector. Foreign
Direct Investment by multinationals can bring to the Tanzanian economy two missing assets:
new technology and connection to global networks. Lastly, simple technological innovations
that are practical for use by a large number of firms can produce rapid and significant
improvements in firms’ productivity, as evidenced by the recent and significant rise in the use of
mobile phones. The remainder of this section examines how these four potential catalysts could
accelerate the growth of the Tanzanian economy.
2.3.1 Clusters as a means to promote economies of scale
Clusters have received a great deal of attention in the economic literature over the past
decade.114 The success of several emerging countries, partly built around clusters of enterprises,
has inspired a number of researchers and policymakers. The main argument is that in addition
to knowledge/information spillovers within clusters, they also encourage agglomeration effects,
113
Tanzania Economic Update: Issue2 (October 2012) 114
For a review of the early literature on clusters, see: Porter, M. (November 1998), “Clusters and the New Economics of Competition,” Harvard Business Review.
92
which in turn stimulate economies of scale within and around the firms. For example, a firm will
have better access to a large pool of skilled workers or customers in an urban agglomeration
than if it was isolated in a sparsely populated area. Clusters can also aggregate access to
infrastructure, such as electricity or roads, facilitating the development as well as reducing costs
of production and commercialization for firms in the cluster.
Clusters can also be a useful incubator to start and prioritize the implementation of reforms.
Many reforms or investments cannot be implemented simultaneously all over the territory, and
a sequencing approach is often needed. For example, it can be justified for the state to privilege
the provision of infrastructure and social services around locations with a high density of firms,
not only for resource efficiency but also to maximize the intended benefits. Other actions have
differentiated impacts on firms, depending on their activities and needs. A firm operating in the
communication industry is certainly more sensitive to the availability of skilled labor than a
farm. The reverse is true for access to land and site development. Therefore, clustering offers to
policy-makers a possible way to adjust their actions to the specific needs of firms, depending on
their sector and location.
Three kinds of clusters can be developed in an economy like Tanzania. The first one is around
products, in the sense that firms evolving in the same sector might see some benefits to work
together. Cost of supply or customer search can be arguably reduced through economies of
scale. The second cluster is around locations where firms assemble to cut the cost of
infrastructure, notably in terms of connectivity and electricity. The third cluster can be
developed around affinities, since people who know each other have a tendency to work
together, especially in an unpredictable business environment.
(i) Clusters around products
Economic history reminds us that a country should not attempt to produce all products. Since
A. Smith and R. Ricardo, we have known that some specialization is needed for each country to
build and consolidate its strengths and accelerate its economic development. Therefore, policy
makers have often been tempted to select specific products or industries. They have relied on
an important and vibrant strand of the economic literature to inform, as much as possible, their
choices. This literature went through cycles and, in recent times, has seen a revival through the
inspiration of various well known economists, including Harvard’s Professors R. Haussman and
D. Rodrick as well as former World Bank Chief Economist J. Lin.
For this study, a combination of approaches has been used to select specific products and
industries. The first approach is to identify the set of products based on Tanzania's comparative
advantage in exporting. The second approach is to explore import substitution opportunities,
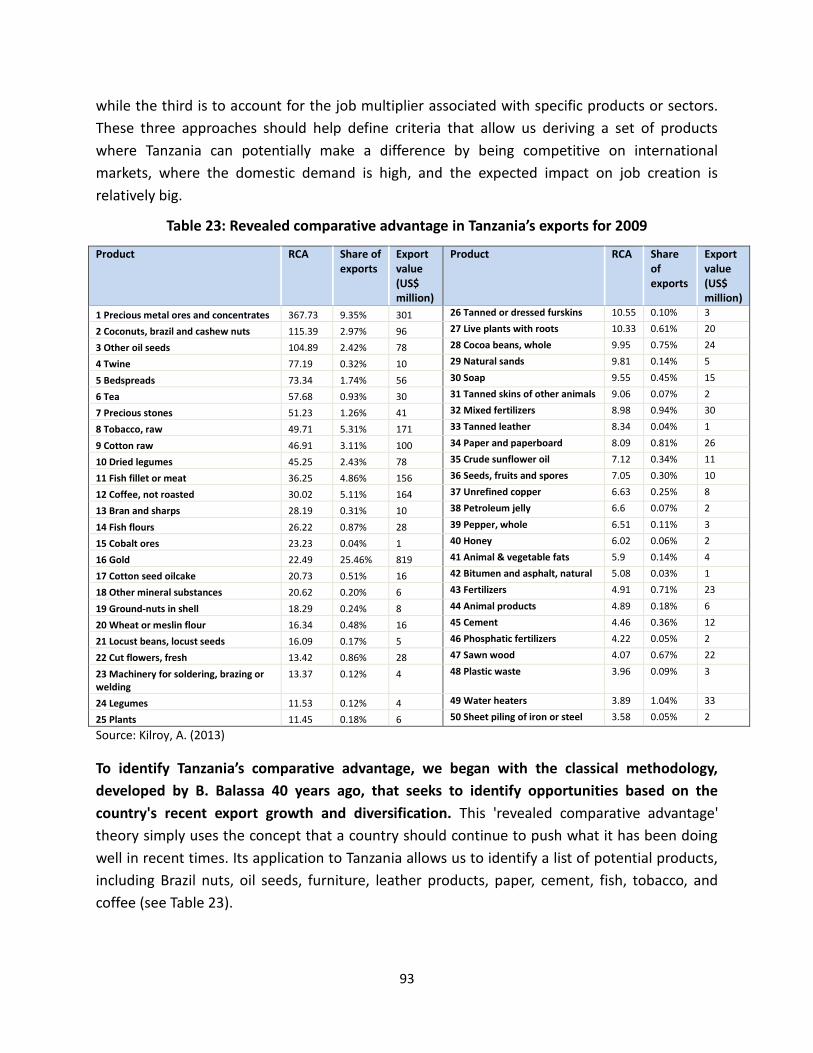
93
while the third is to account for the job multiplier associated with specific products or sectors.
These three approaches should help define criteria that allow us deriving a set of products
where Tanzania can potentially make a difference by being competitive on international
markets, where the domestic demand is high, and the expected impact on job creation is
relatively big.
Table 23: Revealed comparative advantage in Tanzania’s exports for 2009
Product RCA Share of exports
Export value (US$ million)
Product RCA Share of exports
Export value (US$ million)
1 Precious metal ores and concentrates 367.73 9.35% 301 26 Tanned or dressed furskins 10.55 0.10% 3
2 Coconuts, brazil and cashew nuts 115.39 2.97% 96 27 Live plants with roots 10.33 0.61% 20
3 Other oil seeds 104.89 2.42% 78 28 Cocoa beans, whole 9.95 0.75% 24
4 Twine 77.19 0.32% 10 29 Natural sands 9.81 0.14% 5
5 Bedspreads 73.34 1.74% 56 30 Soap 9.55 0.45% 15
6 Tea 57.68 0.93% 30 31 Tanned skins of other animals 9.06 0.07% 2
7 Precious stones 51.23 1.26% 41 32 Mixed fertilizers 8.98 0.94% 30
8 Tobacco, raw 49.71 5.31% 171 33 Tanned leather 8.34 0.04% 1
9 Cotton raw 46.91 3.11% 100 34 Paper and paperboard 8.09 0.81% 26
10 Dried legumes 45.25 2.43% 78 35 Crude sunflower oil 7.12 0.34% 11
11 Fish fillet or meat 36.25 4.86% 156 36 Seeds, fruits and spores 7.05 0.30% 10
12 Coffee, not roasted 30.02 5.11% 164 37 Unrefined copper 6.63 0.25% 8
13 Bran and sharps 28.19 0.31% 10 38 Petroleum jelly 6.6 0.07% 2
14 Fish flours 26.22 0.87% 28 39 Pepper, whole 6.51 0.11% 3
15 Cobalt ores 23.23 0.04% 1 40 Honey 6.02 0.06% 2
16 Gold 22.49 25.46% 819 41 Animal & vegetable fats 5.9 0.14% 4
17 Cotton seed oilcake 20.73 0.51% 16 42 Bitumen and asphalt, natural 5.08 0.03% 1
18 Other mineral substances 20.62 0.20% 6 43 Fertilizers 4.91 0.71% 23
19 Ground-nuts in shell 18.29 0.24% 8 44 Animal products 4.89 0.18% 6
20 Wheat or meslin flour 16.34 0.48% 16 45 Cement 4.46 0.36% 12
21 Locust beans, locust seeds 16.09 0.17% 5 46 Phosphatic fertilizers 4.22 0.05% 2
22 Cut flowers, fresh 13.42 0.86% 28 47 Sawn wood 4.07 0.67% 22
23 Machinery for soldering, brazing or welding
13.37 0.12% 4 48 Plastic waste 3.96 0.09% 3
24 Legumes 11.53 0.12% 4 49 Water heaters 3.89 1.04% 33
25 Plants 11.45 0.18% 6 50 Sheet piling of iron or steel 3.58 0.05% 2
Source: Kilroy, A. (2013)
To identify Tanzania’s comparative advantage, we began with the classical methodology,
developed by B. Balassa 40 years ago, that seeks to identify opportunities based on the
country's recent export growth and diversification. This 'revealed comparative advantage'
theory simply uses the concept that a country should continue to push what it has been doing
well in recent times. Its application to Tanzania allows us to identify a list of potential products,
including Brazil nuts, oil seeds, furniture, leather products, paper, cement, fish, tobacco, and
coffee (see Table 23).
94
The second analytical tool to determine comparative advantage is the ‘product space
approach’ developed by R. Haussman and his associates, with the idea that the country
should focus on exporting products similar to the ones that have shown strong recent
growth.115 If Tanzania has witnessed an expansion in flower exports, it should also consider
value added vegetables such as cucumbers. Using the proximity measurement developed by
Hausmann, Hwang, and Rodrik (2006), we have identified the top 30 products that have not
been exported by Tanzania but have relatively high proximity to the country’s current export
basket (Table 24).116 Good bets appear in the following categories: (i) Agriculture: Rice, nuts,
vegetables (cucumber, lettuce); (ii) Agri-business: preserved fruits, processed meat; and (iii)
Manufacturing: sheepskins, rubber tires, wool, silk, paper and pulp products, hand woven
tapestry.
115
The analytical framework of product space analysis developed by Hausmann, Hwang, and Rodrik (2006), indicates likelihood that a particular product gains comparative advantage (RCA>1) in the future by estimating how the product is close to products which already have comparative advantage. 116
The proximity to the current export basket is computed as weighted average proximity to products Tanzania is currently exporting, weighted by individual products’ share in the total exports by Tanzania.
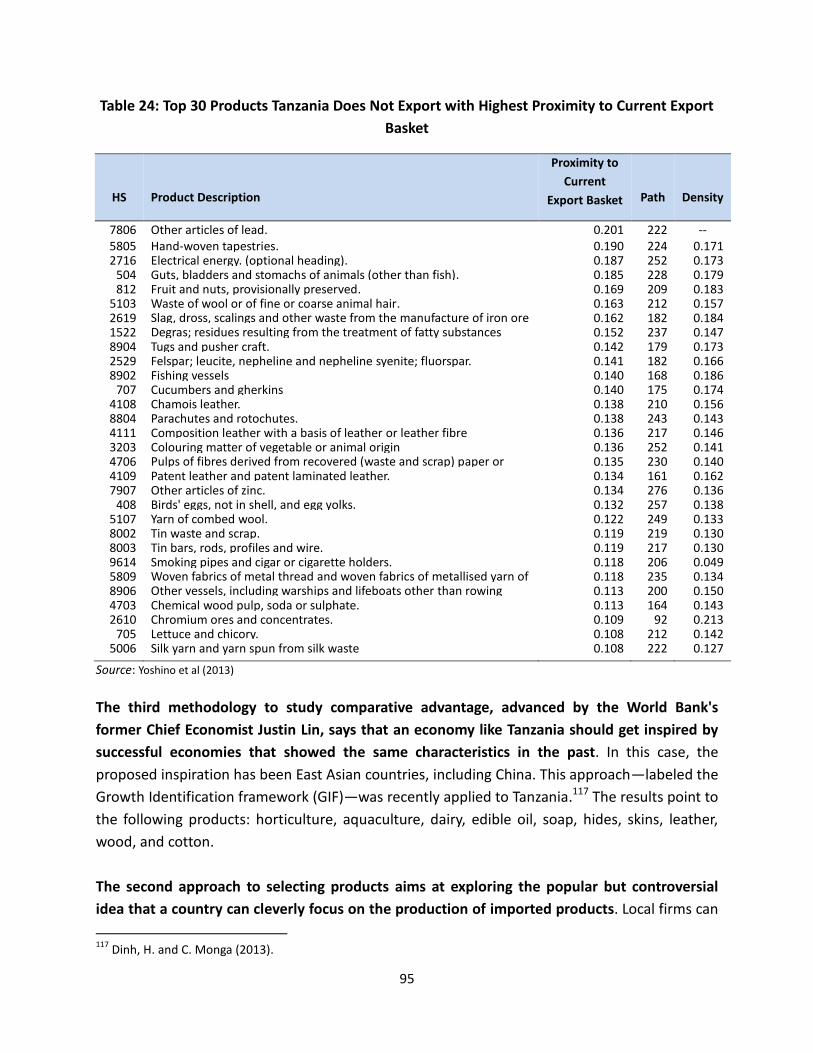
95
Table 24: Top 30 Products Tanzania Does Not Export with Highest Proximity to Current Export
Basket
HS Product Description
Proximity to
Current
Export Basket Path Density
7806 Other articles of lead. 0.201 222 -- 5805 Hand-woven tapestries. 0.190 224 0.171 2716 Electrical energy. (optional heading). 0.187 252 0.173
504 Guts, bladders and stomachs of animals (other than fish). 0.185 228 0.179 812 Fruit and nuts, provisionally preserved. 0.169 209 0.183
5103 Waste of wool or of fine or coarse animal hair. 0.163 212 0.157 2619 Slag, dross, scalings and other waste from the manufacture of iron ore
steel.
0.162 182 0.184 1522 Degras; residues resulting from the treatment of fatty substances
oanimal or vegetable waxes.
0.152 237 0.147 8904 Tugs and pusher craft. 0.142 179 0.173 2529 Felspar; leucite, nepheline and nepheline syenite; fluorspar. 0.141 182 0.166 8902 Fishing vessels 0.140 168 0.186
707 Cucumbers and gherkins 0.140 175 0.174 4108 Chamois leather. 0.138 210 0.156 8804 Parachutes and rotochutes. 0.138 243 0.143 4111 Composition leather with a basis of leather or leather fibre 0.136 217 0.146 3203 Colouring matter of vegetable or animal origin 0.136 252 0.141 4706 Pulps of fibres derived from recovered (waste and scrap) paper or
paperboard
0.135 230 0.140 4109 Patent leather and patent laminated leather. 0.134 161 0.162 7907 Other articles of zinc. 0.134 276 0.136
408 Birds' eggs, not in shell, and egg yolks. 0.132 257 0.138 5107 Yarn of combed wool. 0.122 249 0.133 8002 Tin waste and scrap. 0.119 219 0.130 8003 Tin bars, rods, profiles and wire. 0.119 217 0.130 9614 Smoking pipes and cigar or cigarette holders. 0.118 206 0.049 5809 Woven fabrics of metal thread and woven fabrics of metallised yarn of
heading No. 56.05
0.118 235 0.134 8906 Other vessels, including warships and lifeboats other than rowing
boats.
0.113 200 0.150 4703 Chemical wood pulp, soda or sulphate. 0.113 164 0.143 2610 Chromium ores and concentrates. 0.109 92 0.213
705 Lettuce and chicory. 0.108 212 0.142 5006 Silk yarn and yarn spun from silk waste 0.108 222 0.127
Source: Yoshino et al (2013)
The third methodology to study comparative advantage, advanced by the World Bank's
former Chief Economist Justin Lin, says that an economy like Tanzania should get inspired by
successful economies that showed the same characteristics in the past. In this case, the
proposed inspiration has been East Asian countries, including China. This approach—labeled the
Growth Identification framework (GIF)—was recently applied to Tanzania.117 The results point to
the following products: horticulture, aquaculture, dairy, edible oil, soap, hides, skins, leather,
wood, and cotton.
The second approach to selecting products aims at exploring the popular but controversial
idea that a country can cleverly focus on the production of imported products. Local firms can
117
Dinh, H. and C. Monga (2013).
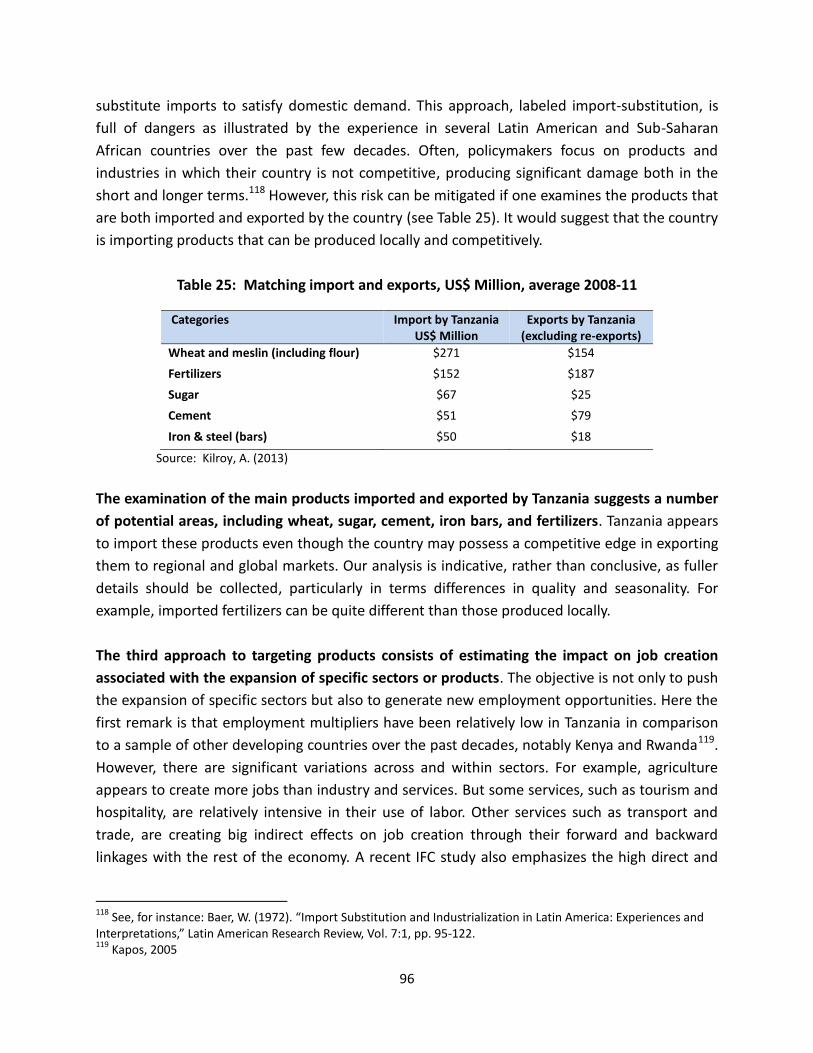
96
substitute imports to satisfy domestic demand. This approach, labeled import-substitution, is
full of dangers as illustrated by the experience in several Latin American and Sub-Saharan
African countries over the past few decades. Often, policymakers focus on products and
industries in which their country is not competitive, producing significant damage both in the
short and longer terms.118 However, this risk can be mitigated if one examines the products that
are both imported and exported by the country (see Table 25). It would suggest that the country
is importing products that can be produced locally and competitively.
Table 25: Matching import and exports, US$ Million, average 2008-11
Categories Import by Tanzania US$ Million
Exports by Tanzania (excluding re-exports)
Wheat and meslin (including flour) $271 $154
Fertilizers $152 $187
Sugar $67 $25
Cement $51 $79
Iron & steel (bars) $50 $18
Source: Kilroy, A. (2013)
The examination of the main products imported and exported by Tanzania suggests a number
of potential areas, including wheat, sugar, cement, iron bars, and fertilizers. Tanzania appears
to import these products even though the country may possess a competitive edge in exporting
them to regional and global markets. Our analysis is indicative, rather than conclusive, as fuller
details should be collected, particularly in terms differences in quality and seasonality. For
example, imported fertilizers can be quite different than those produced locally.
The third approach to targeting products consists of estimating the impact on job creation
associated with the expansion of specific sectors or products. The objective is not only to push
the expansion of specific sectors but also to generate new employment opportunities. Here the
first remark is that employment multipliers have been relatively low in Tanzania in comparison
to a sample of other developing countries over the past decades, notably Kenya and Rwanda119.
However, there are significant variations across and within sectors. For example, agriculture
appears to create more jobs than industry and services. But some services, such as tourism and
hospitality, are relatively intensive in their use of labor. Other services such as transport and
trade, are creating big indirect effects on job creation through their forward and backward
linkages with the rest of the economy. A recent IFC study also emphasizes the high direct and
118
See, for instance: Baer, W. (1972). “Import Substitution and Industrialization in Latin America: Experiences and Interpretations,” Latin American Research Review, Vol. 7:1, pp. 95-122. 119
Kapos, 2005
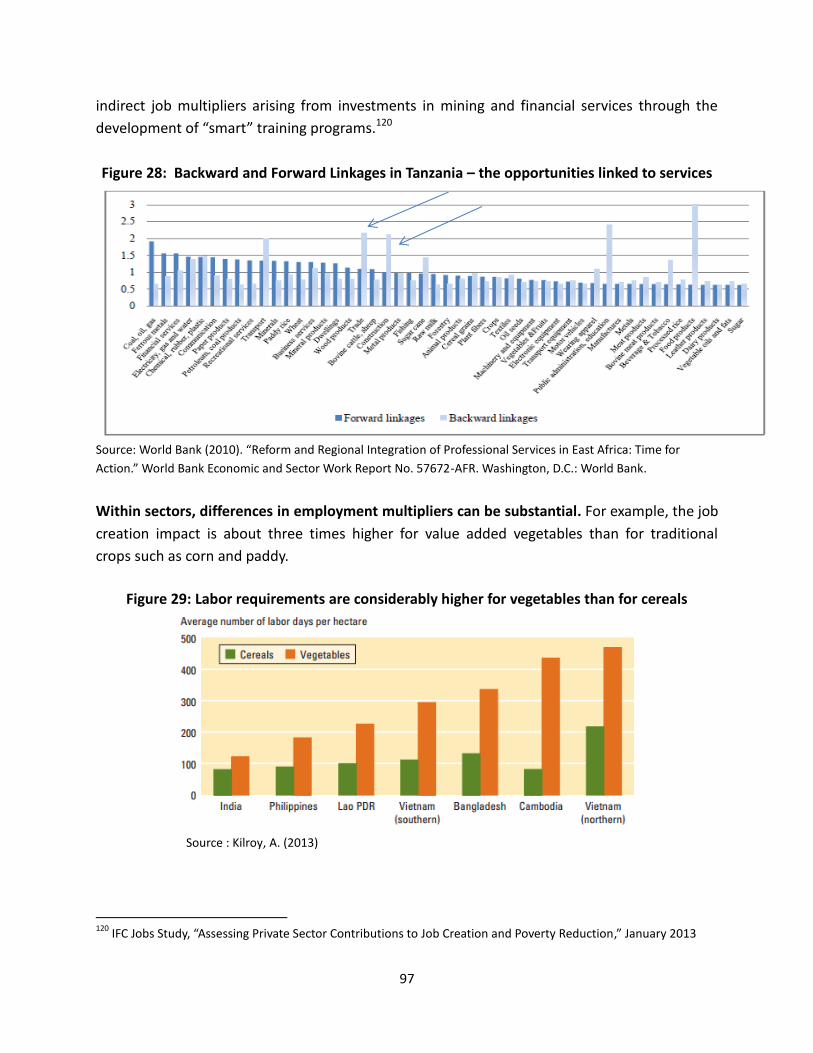
97
indirect job multipliers arising from investments in mining and financial services through the
development of “smart” training programs.120
Figure 28: Backward and Forward Linkages in Tanzania – the opportunities linked to services
Source: World Bank (2010). “Reform and Regional Integration of Professional Services in East Africa: Time for
Action.” World Bank Economic and Sector Work Report No. 57672-AFR. Washington, D.C.: World Bank.
Within sectors, differences in employment multipliers can be substantial. For example, the job
creation impact is about three times higher for value added vegetables than for traditional
crops such as corn and paddy.
Figure 29: Labor requirements are considerably higher for vegetables than for cereals
Source : Kilroy, A. (2013)
120
IFC Jobs Study, “Assessing Private Sector Contributions to Job Creation and Poverty Reduction,” January 2013
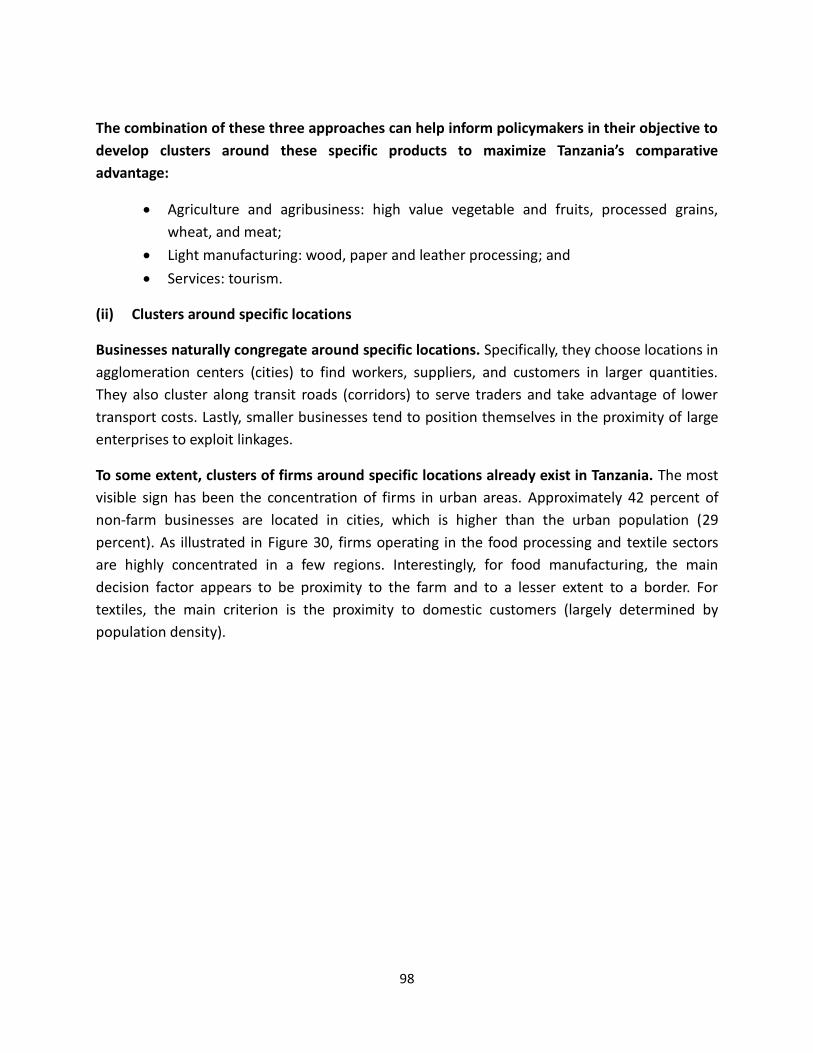
98
The combination of these three approaches can help inform policymakers in their objective to
develop clusters around these specific products to maximize Tanzania’s comparative
advantage:
Agriculture and agribusiness: high value vegetable and fruits, processed grains,
wheat, and meat;
Light manufacturing: wood, paper and leather processing; and
Services: tourism.
(ii) Clusters around specific locations
Businesses naturally congregate around specific locations. Specifically, they choose locations in
agglomeration centers (cities) to find workers, suppliers, and customers in larger quantities.
They also cluster along transit roads (corridors) to serve traders and take advantage of lower
transport costs. Lastly, smaller businesses tend to position themselves in the proximity of large
enterprises to exploit linkages.
To some extent, clusters of firms around specific locations already exist in Tanzania. The most
visible sign has been the concentration of firms in urban areas. Approximately 42 percent of
non-farm businesses are located in cities, which is higher than the urban population (29
percent). As illustrated in Figure 30, firms operating in the food processing and textile sectors
are highly concentrated in a few regions. Interestingly, for food manufacturing, the main
decision factor appears to be proximity to the farm and to a lesser extent to a border. For
textiles, the main criterion is the proximity to domestic customers (largely determined by
population density).
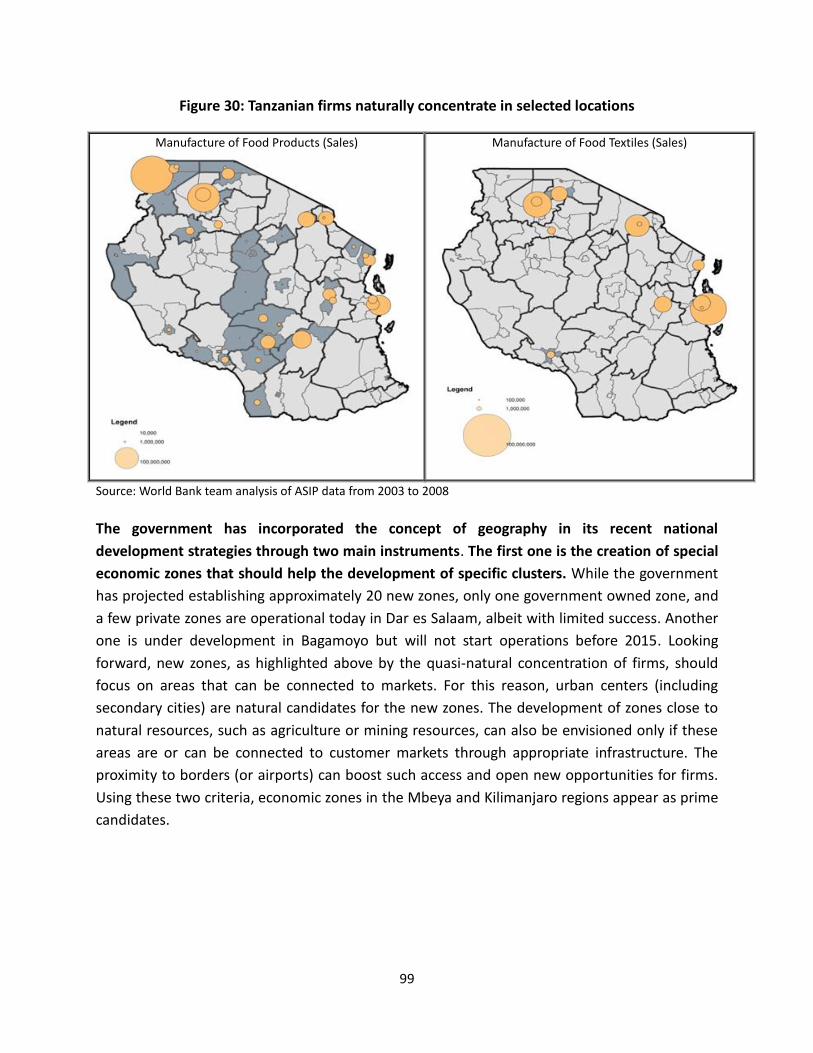
99
Figure 30: Tanzanian firms naturally concentrate in selected locations
Manufacture of Food Products (Sales)
Manufacture of Food Textiles (Sales)
Source: World Bank team analysis of ASIP data from 2003 to 2008
The government has incorporated the concept of geography in its recent national
development strategies through two main instruments. The first one is the creation of special
economic zones that should help the development of specific clusters. While the government
has projected establishing approximately 20 new zones, only one government owned zone, and
a few private zones are operational today in Dar es Salaam, albeit with limited success. Another
one is under development in Bagamoyo but will not start operations before 2015. Looking
forward, new zones, as highlighted above by the quasi-natural concentration of firms, should
focus on areas that can be connected to markets. For this reason, urban centers (including
secondary cities) are natural candidates for the new zones. The development of zones close to
natural resources, such as agriculture or mining resources, can also be envisioned only if these
areas are or can be connected to customer markets through appropriate infrastructure. The
proximity to borders (or airports) can boost such access and open new opportunities for firms.
Using these two criteria, economic zones in the Mbeya and Kilimanjaro regions appear as prime
candidates.

100
Box 9: A brief history of the development of Special Economic Zones in Tanzania
Source: Dinh, H. and C. Monga (2013).
The second instrument is establishing corridors. The government of Tanzania, especially in its
latest initiative called “Big Results, Now”, has emphasized the strategic importance of corridors.
The development of corridors arises partly from Tanzania’s role as a hub for several neighboring
countries. The port of Dar es Salaam is the magnet for many regional firms as it is their main
entry and exit to global markets. This is evidenced by the importance of transit trade, which
accounts for one-third of traded merchandise going through the gates of the port. The fast-
growing Dar es Salaam agglomeration is also attractive for many firms, both within and outside
of Tanzania, which will use corridors to transport their merchandise.
The government has given priority to two main corridors: (i) the central corridor that links Dar
es Salaam with Isaka and Mwanza and ultimately Burundi and DRC; and (2) the Southern
corridor that connects Dar es Salaam with Zambia and DRC. The government priority is the
renovation of the railways on the central corridor, which will considerably reduce transport
costs as well as provide competition to trucking companies. Given its scale, this project will take
about 8 years, even though it should be implemented in different phases. The development of
the Southern corridor is partly associated with the SAGCOT project, 121 which promotes
agriculture commercialization through partnerships between smallholder farmers and large
commercial farms, and between government and large investors.
121
SAGCOT aims to promote commercial farming along the corridor by (i) strengthening infrastructure, including transport, power supply, irrigation, and storage facilities; (ii) developing clusters to connect smallholders to agricultural businesses through contract farming; (iii) improving support services among farmers; and (iv) developing new financing mechanisms for farmers and agribusinesses. Source: www.sagcot.com
The government of Tanzania enacted the EPZs Act in 2002 and established the Export Processing Zones Authority (EPZA) in 2006. It has created both EPZ industrial parks, where investors locate their operations together in a designated zone, and stand-alone EPZs, which receive that designation from the EPZA. In 2006, the government launched a special economic zones (SEZs) program as part of the Mini-Tiger Plan to attract foreign and domestic investment in all sectors through high-quality infrastructure, desirable fiscal packages, business and social support services, assistance in cluster formation, and minimal regulation. The program includes EPZs, free ports, free trade zones, specialized industrial clusters, agricultural free zones, industrial parks for SMEs, microenterprise manufacturing parks, and information and communication technology parks. The Integrated Industrial Development Strategy 2025 (IIDS) proposes the clustering of SEZs in various locations, with an emphasis on waterfront areas in three development corridors (Bagamoyo, Mtwara, and Tanga). While the SEZs initially had their own administrative body, the 2011 Economic Zones Law unified the EPZ and SEZ schemes by structuring the EPZ scheme as a subset of the SEZ scheme and gave oversight authority for both programs to the EPZA. In November 2012, the government adopted SEZ regulations to implement the 2011 act for the unified EPZ-SEZ regime.
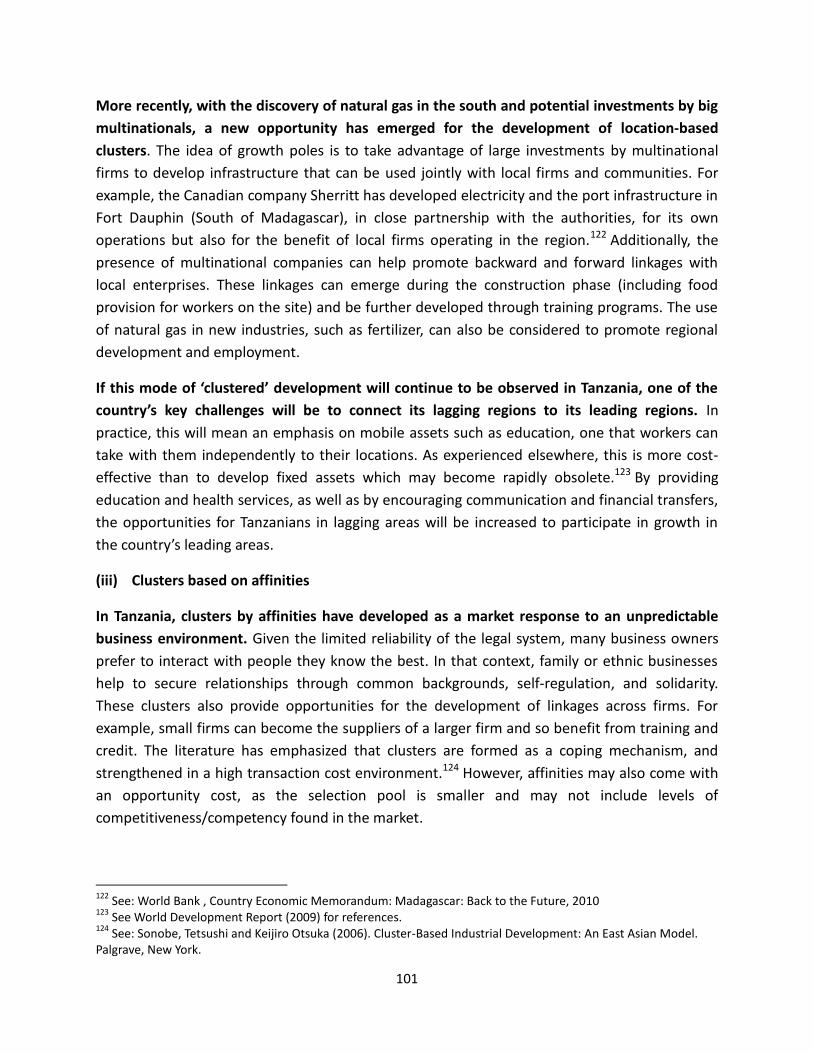
101
More recently, with the discovery of natural gas in the south and potential investments by big
multinationals, a new opportunity has emerged for the development of location-based
clusters. The idea of growth poles is to take advantage of large investments by multinational
firms to develop infrastructure that can be used jointly with local firms and communities. For
example, the Canadian company Sherritt has developed electricity and the port infrastructure in
Fort Dauphin (South of Madagascar), in close partnership with the authorities, for its own
operations but also for the benefit of local firms operating in the region.122 Additionally, the
presence of multinational companies can help promote backward and forward linkages with
local enterprises. These linkages can emerge during the construction phase (including food
provision for workers on the site) and be further developed through training programs. The use
of natural gas in new industries, such as fertilizer, can also be considered to promote regional
development and employment.
If this mode of ‘clustered’ development will continue to be observed in Tanzania, one of the
country’s key challenges will be to connect its lagging regions to its leading regions. In
practice, this will mean an emphasis on mobile assets such as education, one that workers can
take with them independently to their locations. As experienced elsewhere, this is more cost-
effective than to develop fixed assets which may become rapidly obsolete.123 By providing
education and health services, as well as by encouraging communication and financial transfers,
the opportunities for Tanzanians in lagging areas will be increased to participate in growth in
the country’s leading areas.
(iii) Clusters based on affinities
In Tanzania, clusters by affinities have developed as a market response to an unpredictable
business environment. Given the limited reliability of the legal system, many business owners
prefer to interact with people they know the best. In that context, family or ethnic businesses
help to secure relationships through common backgrounds, self-regulation, and solidarity.
These clusters also provide opportunities for the development of linkages across firms. For
example, small firms can become the suppliers of a larger firm and so benefit from training and
credit. The literature has emphasized that clusters are formed as a coping mechanism, and
strengthened in a high transaction cost environment.124 However, affinities may also come with
an opportunity cost, as the selection pool is smaller and may not include levels of
competitiveness/competency found in the market.
122
See: World Bank , Country Economic Memorandum: Madagascar: Back to the Future, 2010 123
See World Development Report (2009) for references. 124
See: Sonobe, Tetsushi and Keijiro Otsuka (2006). Cluster-Based Industrial Development: An East Asian Model. Palgrave, New York.
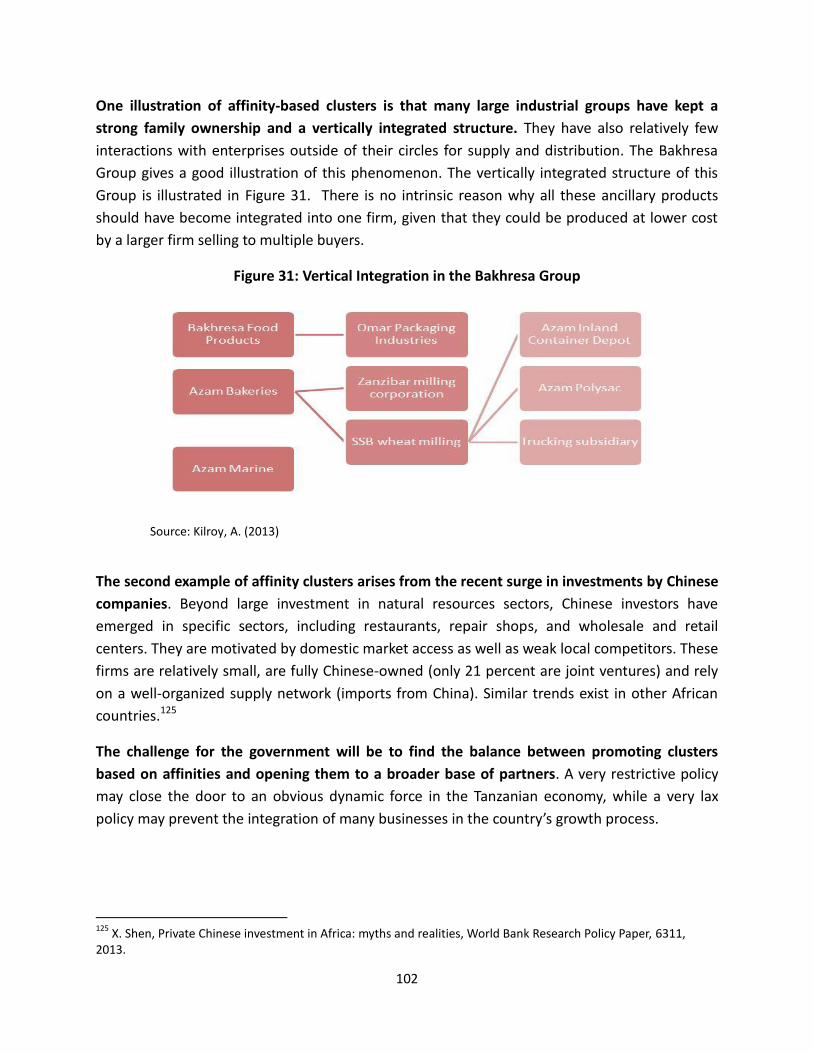
102
One illustration of affinity-based clusters is that many large industrial groups have kept a
strong family ownership and a vertically integrated structure. They have also relatively few
interactions with enterprises outside of their circles for supply and distribution. The Bakhresa
Group gives a good illustration of this phenomenon. The vertically integrated structure of this
Group is illustrated in Figure 31. There is no intrinsic reason why all these ancillary products
should have become integrated into one firm, given that they could be produced at lower cost
by a larger firm selling to multiple buyers.
Figure 31: Vertical Integration in the Bakhresa Group
Source: Kilroy, A. (2013)
The second example of affinity clusters arises from the recent surge in investments by Chinese
companies. Beyond large investment in natural resources sectors, Chinese investors have
emerged in specific sectors, including restaurants, repair shops, and wholesale and retail
centers. They are motivated by domestic market access as well as weak local competitors. These
firms are relatively small, are fully Chinese-owned (only 21 percent are joint ventures) and rely
on a well-organized supply network (imports from China). Similar trends exist in other African
countries.125
The challenge for the government will be to find the balance between promoting clusters
based on affinities and opening them to a broader base of partners. A very restrictive policy
may close the door to an obvious dynamic force in the Tanzanian economy, while a very lax
policy may prevent the integration of many businesses in the country’s growth process.
125
X. Shen, Private Chinese investment in Africa: myths and realities, World Bank Research Policy Paper, 6311, 2013.

103
2.3.2 Regional Integration
Regional integration has already been a real force behind the development of Tanzanian firms
in recent years. The first part of this study has emphasized that not only have regional exports
expanded in the last few years, but they have also largely consisted of manufacturing products.
Small firms have largely contributed to this expansion. These two trends (manufacturing and
small firms) are certainly good news for employment.
Box 10: EAC as an integrated trade community
EAC is by far the most integrated regional economic communities (RECs) in terms of relative size of intra-REC exports among 4 major RECs in Sub-Saharan Africa—Southern Africa Development Community (SADC), Economic Community of Western Africa States (ECOWAS), Economic Community of Central African States (CEMAC), and EAC. Intra-EAC exports account for 21 percent of total exports of EAC countries and the relative size of intra-EAC exports has been rising since 2005, the year the customs union was established in EAC.
Source: Yoshino et al (2013)
There are at least three main reasons why regional exports have surged in recent years. The
first reason is that trade expansion within regional markets has been facilitated by proximity,
which considerably reduces transaction costs for potential exporters. Within the EAC, not only
are transport costs relatively low, but cultural and linguistic links have also helped promote
networks between regional traders. Everything else being equal, a Tanzanian firm is 10 percent
more likely to export to EAC or SADC markets than to the EU.126 Importantly, this regional
expansion has been facilitated at the policy level by progress in trade integration within EAC and
COMESA. Over time, it has become cheaper for firms to move products within these regions
thanks to declining tariffs and non-tariff costs.
Box 11: Destination markets for new products
The entry decisions of Tanzanian firms follow the logic of the gravity equation. That is, new destinations are large, nearby, and culturally similar markets. New products are introduced where firms have already been exporting. Regional markets thus have some advantage over non-regional markets in terms of facilitating new exports.
Also, firms seem to imitate the patterns of success of their compatriot exporters to certain destinations, suggesting existence of knowledge externalities. This observation is important for policy, as it suggests that there may be “knowledge externalities” at the extensive margin, potentially justifying government support for an export-promotion agency. Recent empirical studies show that exporters’ clustering may matter as it may provide more presence and visibility on foreign markets, therefore augmenting the survival rate beyond the second year after penetration (Cadot et al. 2011). (Also see e.g. Lederman, Olarreaga and Payton 2006, Volpe 2011, Cadot et al. 2012).
Interestingly, firm’s choice for entering into new export market—either in terms of product or destination—negatively correlates with the firm’s previous-year export turnover, suggesting that entry is more active for small
126
See Yoshino et al (2013)

104
exporters.
Source: Cadot, Regolo, and Yoshino (2013)
The second reason is that regional trade expansion has made easier by similarities between
domestic and regional demands. Many Tanzanian exporters are selling products developed for
their local market to other EAC countries. This has allowed them to shorten their adaptation
process to export markets. As indicated below, such incremental expansion has been followed
by a number of Tanzanian emerging exporters:
“We have a policy here: whatever we’re producing, we must first be able to satisfy the local market
before we try exporting. Once we’re sure about quality and reliability of ice cream then we can
begin investing in exporting…to Malawi, Mozambique, Uganda, Rwanda. The same with juices.
Actually we don’t think about exporting until we’ve captured 50 percent of the local market. Look
at how companies have failed by just gearing their production scale to exports and then the
market dries up!”
-- Food processor, Dar es Salaam, October 2012.
Estimator LPM LPM LPM LPM
Dependent var. δ fpdt δ fpdt δ fpdt δ fpdt
(1) (2) (3) (4)
Destination characteristics
Dest. GDP (log) 0.00284*** 0.00121*** 0.00121*** 0.00119***
(3.23e-05) (2.82e-05) (2.82e-05) (7.10e-05)
Distance (log) -0.00464*** -0.00239*** -0.00239*** -0.00237***
(0.000120) (0.000111) (0.000111) (0.000275)
Comm. Lang. 0.00350*** 0.00105*** 0.00105*** 0.00101***
(0.000172) (0.000160) (0.000160) (0.000363)
Comm. Border 0.0725*** 0.0419*** 0.0419*** 0.0415***
(0.000748) (0.000663) (0.000663) (0.00163)
Count of firms on market d at t -1 0.0124*** 0.0124*** 0.0128***
(0.000235) (0.000235) (0.000400)
Firm characteristics
Exporter at t -1 0.00289*** 0.00281*** 0.00220***
(0.000187) (0.000188) (0.000384)
Lagged export value (if exporter at t -1) -0.000525*** -0.000520*** -0.000551***
(1.30e-05) (1.31e-05) (2.60e-05)
Served dest. d at t -1 0.287*** 0.287*** 0.288***
(0.00313) (0.00313) (0.0360)
Exported prod. p at t -1 0.000341* 0.000345* 0.000662
(0.000201) (0.000202) (0.000405)
Constant 0.0135*** 0.0109*** 0.0108*** 0.0122
(0.000969) (0.000933) (0.000945) (2.019)
Product FE No No No Yes
Time FE No No Yes Yes
Observations 2,447,644 2,447,644 2,447,644 2,447,644
Number of (f,p,d ) cells 18,266 18,266 18,266 18,266
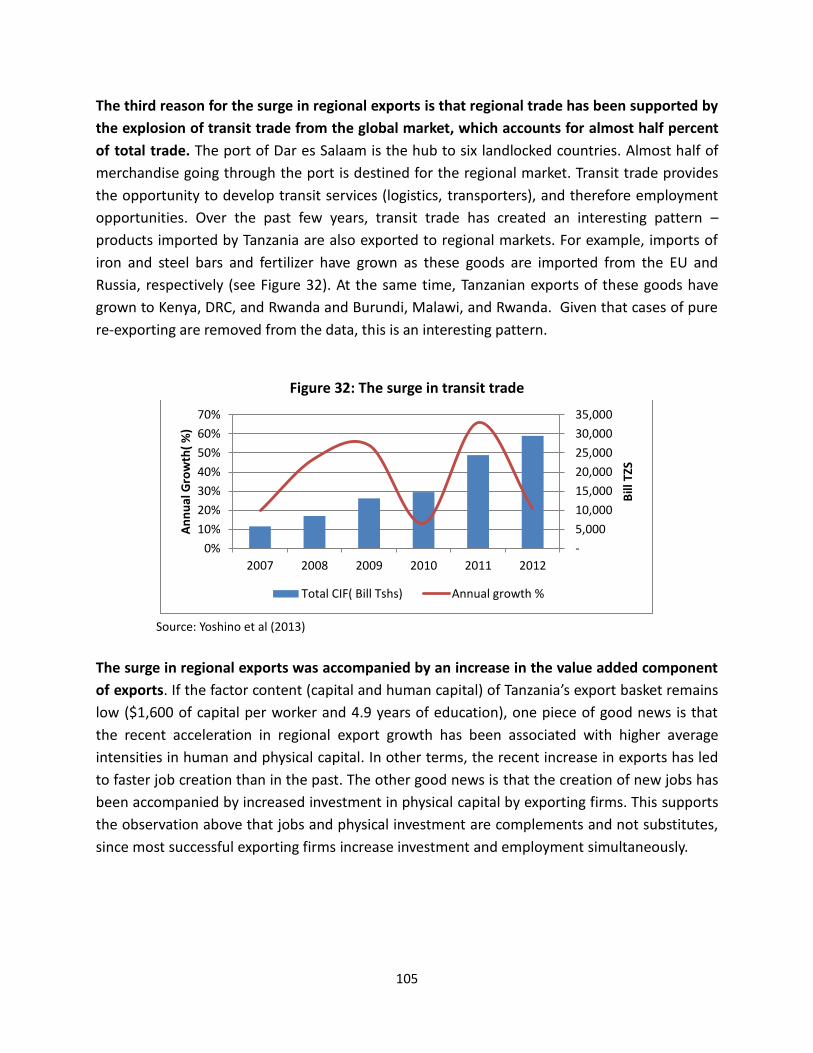
105
The third reason for the surge in regional exports is that regional trade has been supported by
the explosion of transit trade from the global market, which accounts for almost half percent
of total trade. The port of Dar es Salaam is the hub to six landlocked countries. Almost half of
merchandise going through the port is destined for the regional market. Transit trade provides
the opportunity to develop transit services (logistics, transporters), and therefore employment
opportunities. Over the past few years, transit trade has created an interesting pattern –
products imported by Tanzania are also exported to regional markets. For example, imports of
iron and steel bars and fertilizer have grown as these goods are imported from the EU and
Russia, respectively (see Figure 32). At the same time, Tanzanian exports of these goods have
grown to Kenya, DRC, and Rwanda and Burundi, Malawi, and Rwanda. Given that cases of pure
re-exporting are removed from the data, this is an interesting pattern.
Figure 32: The surge in transit trade
Source: Yoshino et al (2013)
The surge in regional exports was accompanied by an increase in the value added component
of exports. If the factor content (capital and human capital) of Tanzania’s export basket remains
low ($1,600 of capital per worker and 4.9 years of education), one piece of good news is that
the recent acceleration in regional export growth has been associated with higher average
intensities in human and physical capital. In other terms, the recent increase in exports has led
to faster job creation than in the past. The other good news is that the creation of new jobs has
been accompanied by increased investment in physical capital by exporting firms. This supports
the observation above that jobs and physical investment are complements and not substitutes,
since most successful exporting firms increase investment and employment simultaneously.
-
5,000
10,000
15,000
20,000
25,000
30,000
35,000
0%
10%
20%
30%
40%
50%
60%
70%
2007 2008 2009 2010 2011 2012
Bill
TZS
An
nu
al G
row
th(
%)
Total CIF( Bill Tshs) Annual growth %
106
Figure 33: Matching domestic and regional imports
Source: Kilroy, A. (2013)
Tanzania has recently shown some progress in overall trade facilitation, however there is
room for improvement. There has been a general improvement in the Logistics Performance
Index (LPI) for Tanzania—from 137th position in 2007 to 95th position in 2010, to 88th position
in 2012. The improvement in the overall performance since 2010 has been driven by better
infrastructure and logistics; however, the country has suffered setbacks in customs and
timeliness. Also, Tanzania is still well behind the leading countries in Sub-Saharan Africa (South
Africa and Mauritius) and Asian countries such as China, India, Indonesia, Malaysia, and
Thailand.127
There are also several non-infrastructure factors that currently constrain trade. Non-
infrastructure factors include limited investment in modern trucking and shipping capacity. This
is a key factor constraint that limits the movement of goods to areas of strong demand. Other
factors affecting regional trade in staples are export and import bans, variable import tariffs and
127
World Bank Logistics Performance Index, website: (http://web.worldbank.org/trade).
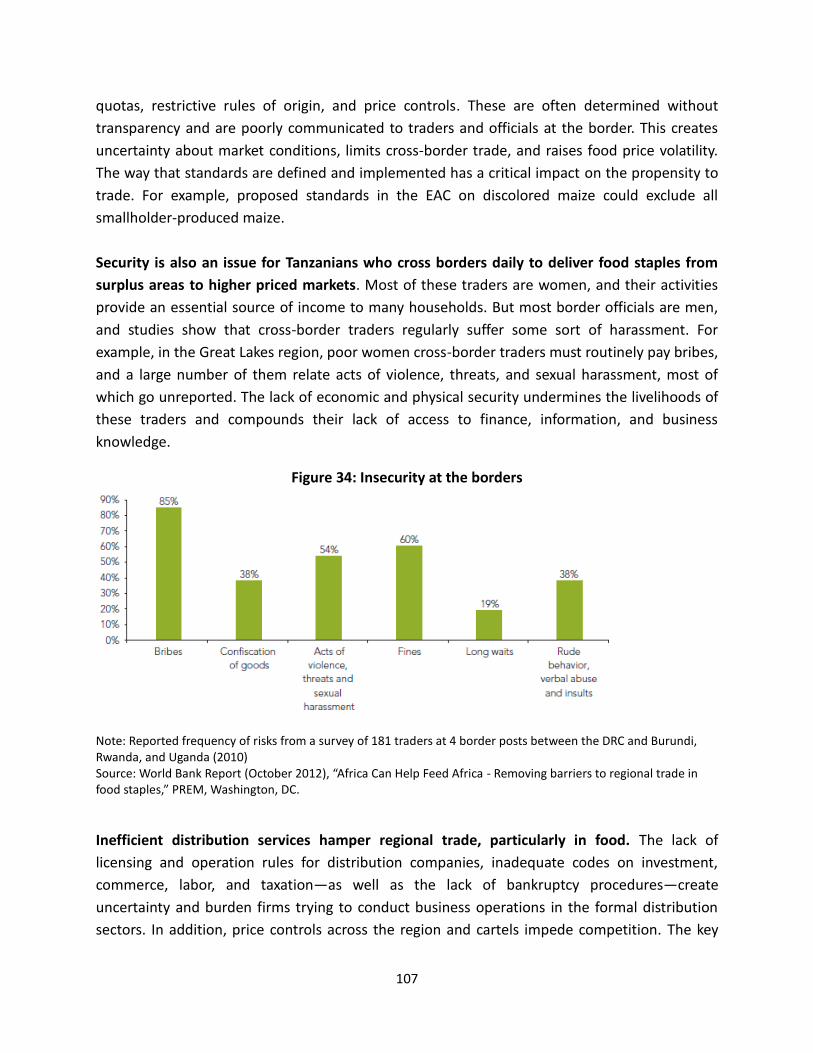
107
quotas, restrictive rules of origin, and price controls. These are often determined without
transparency and are poorly communicated to traders and officials at the border. This creates
uncertainty about market conditions, limits cross-border trade, and raises food price volatility.
The way that standards are defined and implemented has a critical impact on the propensity to
trade. For example, proposed standards in the EAC on discolored maize could exclude all
smallholder-produced maize.
Security is also an issue for Tanzanians who cross borders daily to deliver food staples from
surplus areas to higher priced markets. Most of these traders are women, and their activities
provide an essential source of income to many households. But most border officials are men,
and studies show that cross-border traders regularly suffer some sort of harassment. For
example, in the Great Lakes region, poor women cross-border traders must routinely pay bribes,
and a large number of them relate acts of violence, threats, and sexual harassment, most of
which go unreported. The lack of economic and physical security undermines the livelihoods of
these traders and compounds their lack of access to finance, information, and business
knowledge.
Figure 34: Insecurity at the borders
Note: Reported frequency of risks from a survey of 181 traders at 4 border posts between the DRC and Burundi, Rwanda, and Uganda (2010) Source: World Bank Report (October 2012), “Africa Can Help Feed Africa - Removing barriers to regional trade in food staples,” PREM, Washington, DC.
Inefficient distribution services hamper regional trade, particularly in food. The lack of
licensing and operation rules for distribution companies, inadequate codes on investment,
commerce, labor, and taxation—as well as the lack of bankruptcy procedures—create
uncertainty and burden firms trying to conduct business operations in the formal distribution
sectors. In addition, price controls across the region and cartels impede competition. The key
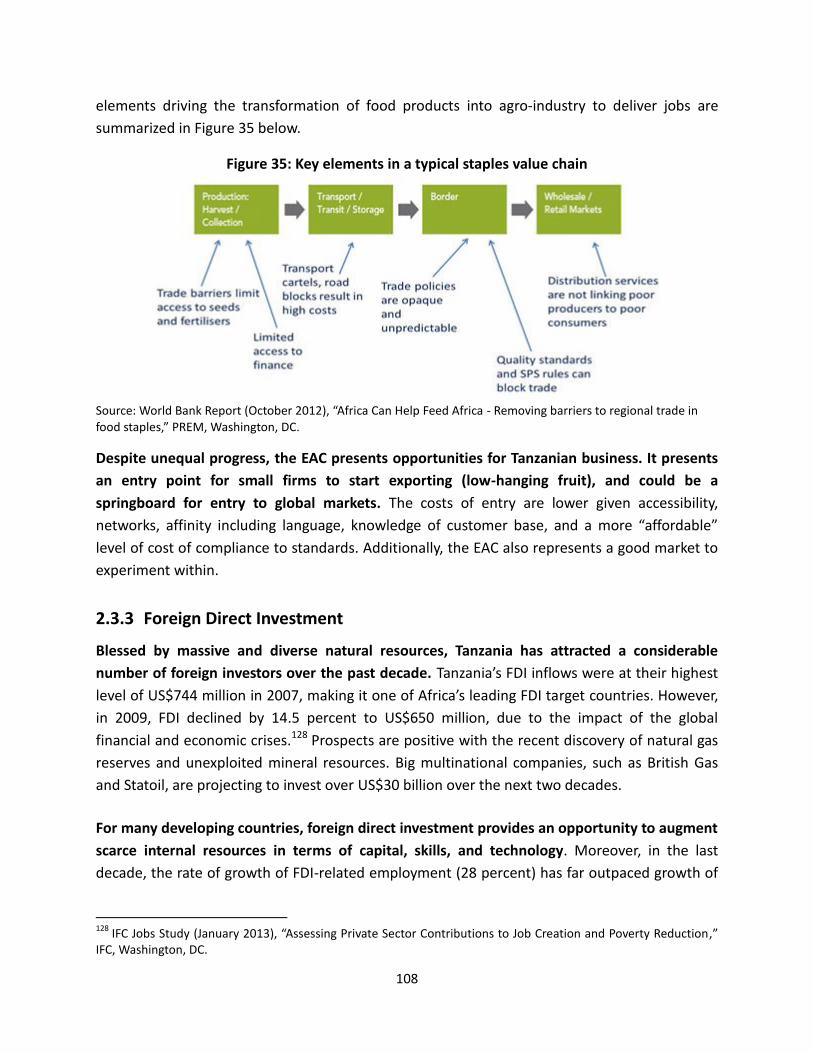
108
elements driving the transformation of food products into agro-industry to deliver jobs are
summarized in Figure 35 below.
Figure 35: Key elements in a typical staples value chain
Source: World Bank Report (October 2012), “Africa Can Help Feed Africa - Removing barriers to regional trade in food staples,” PREM, Washington, DC.
Despite unequal progress, the EAC presents opportunities for Tanzanian business. It presents
an entry point for small firms to start exporting (low-hanging fruit), and could be a
springboard for entry to global markets. The costs of entry are lower given accessibility,
networks, affinity including language, knowledge of customer base, and a more “affordable”
level of cost of compliance to standards. Additionally, the EAC also represents a good market to
experiment within.
2.3.3 Foreign Direct Investment
Blessed by massive and diverse natural resources, Tanzania has attracted a considerable
number of foreign investors over the past decade. Tanzania’s FDI inflows were at their highest
level of US$744 million in 2007, making it one of Africa’s leading FDI target countries. However,
in 2009, FDI declined by 14.5 percent to US$650 million, due to the impact of the global
financial and economic crises.128 Prospects are positive with the recent discovery of natural gas
reserves and unexploited mineral resources. Big multinational companies, such as British Gas
and Statoil, are projecting to invest over US$30 billion over the next two decades.
For many developing countries, foreign direct investment provides an opportunity to augment
scarce internal resources in terms of capital, skills, and technology. Moreover, in the last
decade, the rate of growth of FDI-related employment (28 percent) has far outpaced growth of
128
IFC Jobs Study (January 2013), “Assessing Private Sector Contributions to Job Creation and Poverty Reduction,” IFC, Washington, DC.
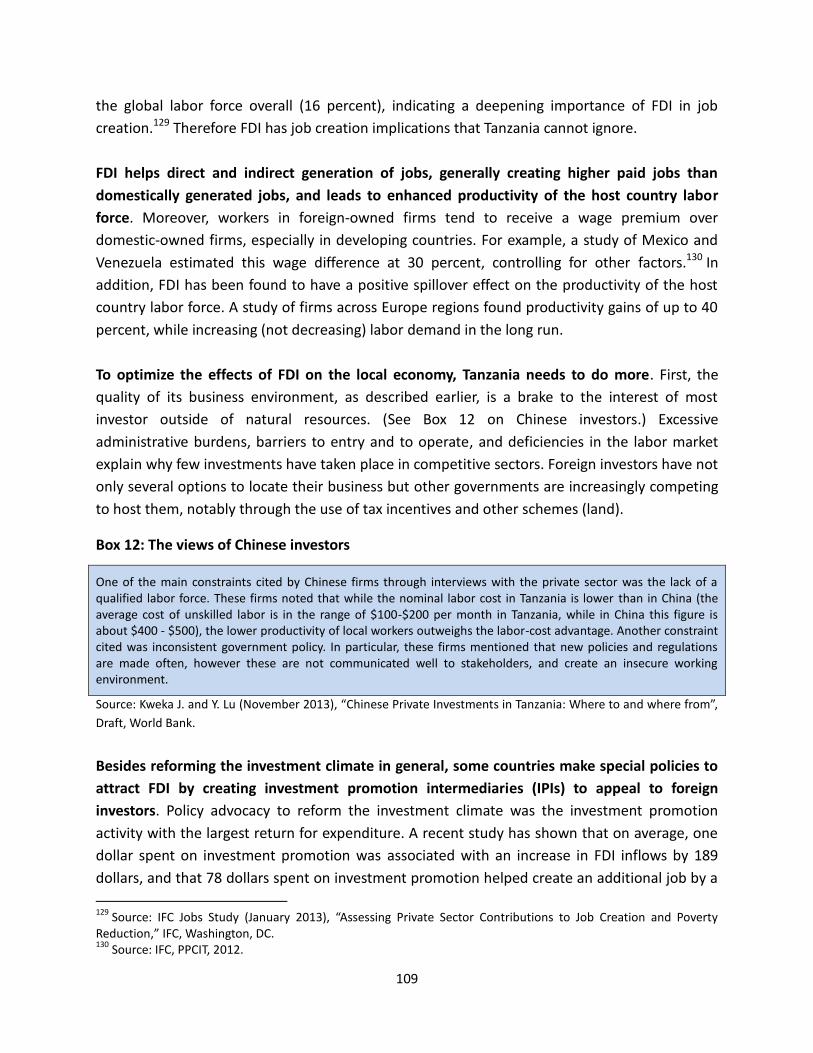
109
the global labor force overall (16 percent), indicating a deepening importance of FDI in job
creation.129 Therefore FDI has job creation implications that Tanzania cannot ignore.
FDI helps direct and indirect generation of jobs, generally creating higher paid jobs than
domestically generated jobs, and leads to enhanced productivity of the host country labor
force. Moreover, workers in foreign-owned firms tend to receive a wage premium over
domestic-owned firms, especially in developing countries. For example, a study of Mexico and
Venezuela estimated this wage difference at 30 percent, controlling for other factors.130 In
addition, FDI has been found to have a positive spillover effect on the productivity of the host
country labor force. A study of firms across Europe regions found productivity gains of up to 40
percent, while increasing (not decreasing) labor demand in the long run.
To optimize the effects of FDI on the local economy, Tanzania needs to do more. First, the
quality of its business environment, as described earlier, is a brake to the interest of most
investor outside of natural resources. (See Box 12 on Chinese investors.) Excessive
administrative burdens, barriers to entry and to operate, and deficiencies in the labor market
explain why few investments have taken place in competitive sectors. Foreign investors have not
only several options to locate their business but other governments are increasingly competing
to host them, notably through the use of tax incentives and other schemes (land).
Box 12: The views of Chinese investors
One of the main constraints cited by Chinese firms through interviews with the private sector was the lack of a qualified labor force. These firms noted that while the nominal labor cost in Tanzania is lower than in China (the average cost of unskilled labor is in the range of $100-$200 per month in Tanzania, while in China this figure is about $400 - $500), the lower productivity of local workers outweighs the labor-cost advantage. Another constraint cited was inconsistent government policy. In particular, these firms mentioned that new policies and regulations are made often, however these are not communicated well to stakeholders, and create an insecure working environment.
Source: Kweka J. and Y. Lu (November 2013), “Chinese Private Investments in Tanzania: Where to and where from”,
Draft, World Bank.
Besides reforming the investment climate in general, some countries make special policies to
attract FDI by creating investment promotion intermediaries (IPIs) to appeal to foreign
investors. Policy advocacy to reform the investment climate was the investment promotion
activity with the largest return for expenditure. A recent study has shown that on average, one
dollar spent on investment promotion was associated with an increase in FDI inflows by 189
dollars, and that 78 dollars spent on investment promotion helped create an additional job by a
129
Source: IFC Jobs Study (January 2013), “Assessing Private Sector Contributions to Job Creation and Poverty Reduction,” IFC, Washington, DC. 130
Source: IFC, PPCIT, 2012.
110
foreign affiliate.131 However, one has to be careful attributing all the effects to investment
promotion expenditures, since those governments spending money on investment promotion
may also be the ones that are generally more welcoming toward private investment.
Nevertheless, agencies that promote FDI help address information asymmetries and overcome
burdensome bureaucratic procedures. In a recent survey of executives with site selection
responsibilities, 47 percent indicated a strong likelihood that they would use the IPI website,
and 83 percent responded that they would make direct inquiries with IPIs during the site
selection process. 132 A well-functioning investment promotion intermediary can provide
valuable customer service to a foreign investor looking for investment opportunities, and can
therefore help increase FDI inflows into a country.
Foreign direct investment serves as an important complement to domestic investment as a
source of external capital and technology transfers. Domestic savings in developing countries
such as Tanzania are small. It is widely accepted that the successful impact of FDI flows into the
country hinges on the level of progress in education, technology, infrastructure, and financial
markets. This means that comprehensive policies are needed—such as export promotion
schemes or policies that promote local technological competence—to better harness
technology transfers and the new equipment, standards, and training brought about by FDI.
Particularly for the agriculture industry, substantial new FDI, preferably by joint venture, is
needed in all stages of the supply chain to replace old equipment and upgrade technology.
Foreign companies are also a good channel to connect to global markets with their networks
and knowledge of customers’ preferences.
By using foreign companies to develop the local labor force and local firms, East Asian
countries like Singapore and Malaysia have been successful in first taking advantage of FDI
and then attracting more. Training of local workers has been a priority, as each trained worker
became himself a vector of transmission of new technics and skills. These countries have also
encouraged the training of local suppliers, therefore multiplying the spillovers associated with
FDI on the domestic economy. These effects have been promoted through partnerships
between foreign and local companies as well as incentives provided by governments.
131
An analysis of 30,000 high value-added FDI projects shows that government-provided information and assistance significantly influenced investor decisions to locate in one economy or another.43 According to another recent study of 156 countries, there is a strong positive correlation between a country’s investment facilitation performances—based on the IFC Global Investment Promotion Best Practices (GIPB) framework—and its FDI inflows. It compares each country’s average annual FDI inflows from 2000 to 2010 with its average performance in the three GIPB reviews. The study found that a 1 percentage point increase in performance was associated with a 1.5 percentage point increase in FDI inflows (controlling for other factors). Source: IFC Jobs Study (January 2013), “Assessing Private Sector Contributions to Job Creation and Poverty Reduction,” IFC, Washington, DC. 132
IFC Jobs Study (January 2013), “Assessing Private Sector Contributions to Job Creation and Poverty Reduction,” IFC, Washington, DC.
111
Technology transfers and skill development are public goods, with huge externalities for the
host economy, that are likely to be underinvested if the private sector is left alone in the
decision process.
2.3.4 Technological breakthroughs
Economic progress is driven by innovation and technological improvements: A firm, and a
country, will remain competitive as long as it can preserve a technological edge against its
competitors. Earlier, we have seen that most Tanzanian firms are not devoting many resources
to innovation, even in its broader definition (the adoption and adaption of new technologies).
This is expected in a country where most businesses have only limited financial and human
resources.
Simple innovations can make a difference in a country’s quest towards higher productivity
and employment. Simple innovations are powerful because they can be used by many firms
and households. Because of their large and rapid dissemination, they have a transformational
value not only for individual firms but also for sectors, and ultimately the whole economy itself
(see Box 13 for one international example).
Box 13: How Reuters Market Light generates hyperlocalized information
An international news giant launched Reuters Market Light (RML) in 2007 to provide market prices and weather and crop advisory services to farmers in India. Invented by a Reuters employee, this service offers highly customizable market information to farmers through text messages delivered to mobile phones. To subscribe, farmers call a toll-free number to activate the service in the local language and specify the crops and markets in which they have an interest. Farmers receive four to five SMS alerts with relevant information each day. Initial studies show that farmers who receive the service typically gain 5–10 percent more income. RML is one of India’s largest market information services, serving 250,000 customers across tens of thousands of villages. It delivers customized information to India’s farming sector covering over 250 crops, 1,000 markets, and 3,000 weather locations across 13 Indian states in 8 local languages. The company employs over 300 office staff in eight states to process localized agricultural information. The teams, organized according to content type, scour media sources for agricultural news (including market prices, pest and disease reports, government programs, weather reports, and local news). This information is sorted by geography and sent to the appropriate subscribers. RML’s growth shows that embracing a wide network of people— including, in this case, price collectors, agricultural institutes, and other information providers—is a vital success factor for mobile applications ecosystems. Such detailed processing can involve large sunk costs with relatively high monthly operating costs of $4 a customer. There is a trade-off between the provision of local information and scalability. Local teams are needed to collect data, and expansion into new areas may involve additional content provision costs, limiting economies of scale. Costs therefore climb in parallel with new subscribers. Because it relies solely on income from this single service, RML’s market remains relatively small and is not yet profitable. RML has sought to reach as many customers as possible through a number of strategies, including sales offices in
112
postal offices, local shops, input suppliers, and banks. Customers obtain RML through basic SMS using prepaid scratch cards that give access to the service for a given amount of time. RML competes with traditional information services (radio, market intermediaries, newspapers) and other services that use mobile phones. IFFCO Kisan Sanchar Limited (IKSL) offers similar market information for rural farmers but uses voice messages so illiterate farmers can use the service. Achieving economies of scale is essential for profitability. In 2009 RML reportedly crossed the $1 million sales mark.
Source: World Bank (2012), “Information and Communications for Development 2012: Maximizing Mobile,” World
Bank, Washington, DC.
For Tanzania, the potential positive impact associated to technological breakthrough can be
illustrated by two examples: mobile phones and irrigation schemes.
(i) The mobile phone revolution is ongoing and far-reaching
The most recent and visible innovation breakthrough in Tanzania has been the adoption of
mobile phones. While most Tanzanians, notably in rural areas, have not benefited from most of
the new technologies (e.g., automobiles, TVs, fridges) introduced in the last century, they now
own a mobile phone. This tool brings them a myriad of new possibilities, ranging from new
information channels to money transfers and payments. These multiple usages have already led
to improvements in agricultural productivity and commercialization.
In Tanzania, mobile phones have nearly caught up with radios as the main tool used for real-
time information gathering. As in most parts of sub-Saharan Africa, mobile phones provide
first-time phone connectivity to broad sections of the population, due to fact that landlines are
virtually nonexistent (at just one percent of the population). While there is still a considerable
wealth and education gradient in mobile phone ownership, access to cell phones has also
reached the poor and rural population. Almost half of all farmers owned a cell phone in
2010/11, while 62 percent owned a radio.
Much of the population with newly acquired virtual connectivity only has very limited
physical connectivity. Across all quintiles, ownership of mobile phones is much more frequent
than ownership of cars or motorbikes. Public transport in rural areas, if it exists at all, is costly
and time consuming due to the poor state of road infrastructure and limited competition. All of
this suggests that the use of mobile phones significantly reduces transaction costs associated
with gathering information about prices and technologies for many households who used to be
isolated from markets. This is also true for small businesses and smallholders that can now
connect virtually to their suppliers and customers. For example, approximately three quarters of
commercial farmers report using cell phones to obtain business-relevant information, half of
them even on a daily basis. Mobile phones are hence a more important medium for accessing
business-related information than radios (used by 63 percent of commercial farmers), TV (12
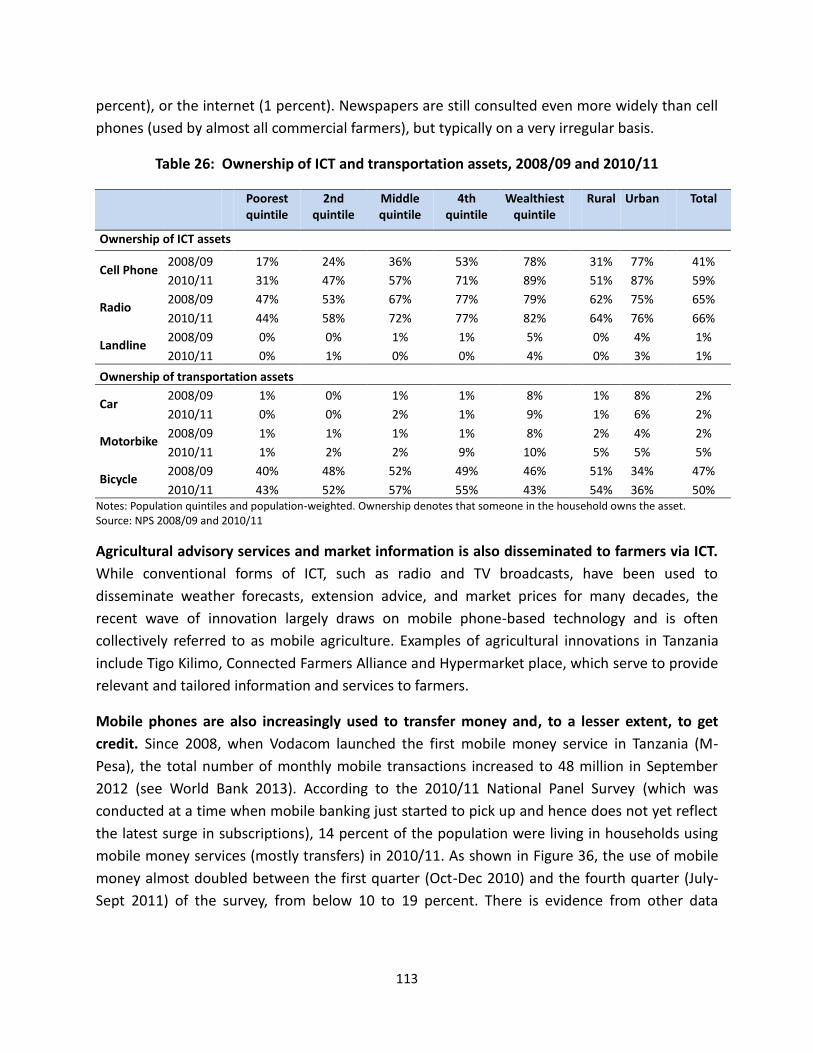
113
percent), or the internet (1 percent). Newspapers are still consulted even more widely than cell
phones (used by almost all commercial farmers), but typically on a very irregular basis.
Table 26: Ownership of ICT and transportation assets, 2008/09 and 2010/11
Poorest quintile
2nd quintile
Middle quintile
4th quintile
Wealthiest quintile
Rural Urban Total
Ownership of ICT assets
Cell Phone 2008/09 17% 24% 36% 53% 78% 31% 77% 41%
2010/11
31% 47% 57% 71% 89%
51% 87%
59%
Radio 2008/09 47% 53% 67% 77% 79%
62% 75%
65%
2010/11
44% 58% 72% 77% 82%
64% 76%
66%
Landline 2008/09 0% 0% 1% 1% 5%
0% 4%
1%
2010/11 0% 1% 0% 0% 4% 0% 3% 1%
Ownership of transportation assets
Car 2008/09 1% 0% 1% 1% 8% 1% 8% 2%
2010/11
0% 0% 2% 1% 9% 1% 6%
2%
Motorbike 2008/09
1% 1% 1% 1% 8% 2% 4%
2%
2010/11
1% 2% 2% 9% 10% 5% 5%
5%
Bicycle 2008/09 40% 48% 52% 49% 46% 51% 34%
47%
2010/11 43% 52% 57% 55% 43% 54% 36% 50% Notes: Population quintiles and population-weighted. Ownership denotes that someone in the household owns the asset. Source: NPS 2008/09 and 2010/11
Agricultural advisory services and market information is also disseminated to farmers via ICT.
While conventional forms of ICT, such as radio and TV broadcasts, have been used to
disseminate weather forecasts, extension advice, and market prices for many decades, the
recent wave of innovation largely draws on mobile phone-based technology and is often
collectively referred to as mobile agriculture. Examples of agricultural innovations in Tanzania
include Tigo Kilimo, Connected Farmers Alliance and Hypermarket place, which serve to provide
relevant and tailored information and services to farmers.
Mobile phones are also increasingly used to transfer money and, to a lesser extent, to get
credit. Since 2008, when Vodacom launched the first mobile money service in Tanzania (M-
Pesa), the total number of monthly mobile transactions increased to 48 million in September
2012 (see World Bank 2013). According to the 2010/11 National Panel Survey (which was
conducted at a time when mobile banking just started to pick up and hence does not yet reflect
the latest surge in subscriptions), 14 percent of the population were living in households using
mobile money services (mostly transfers) in 2010/11. As shown in Figure 36, the use of mobile
money almost doubled between the first quarter (Oct-Dec 2010) and the fourth quarter (July-
Sept 2011) of the survey, from below 10 to 19 percent. There is evidence from other data
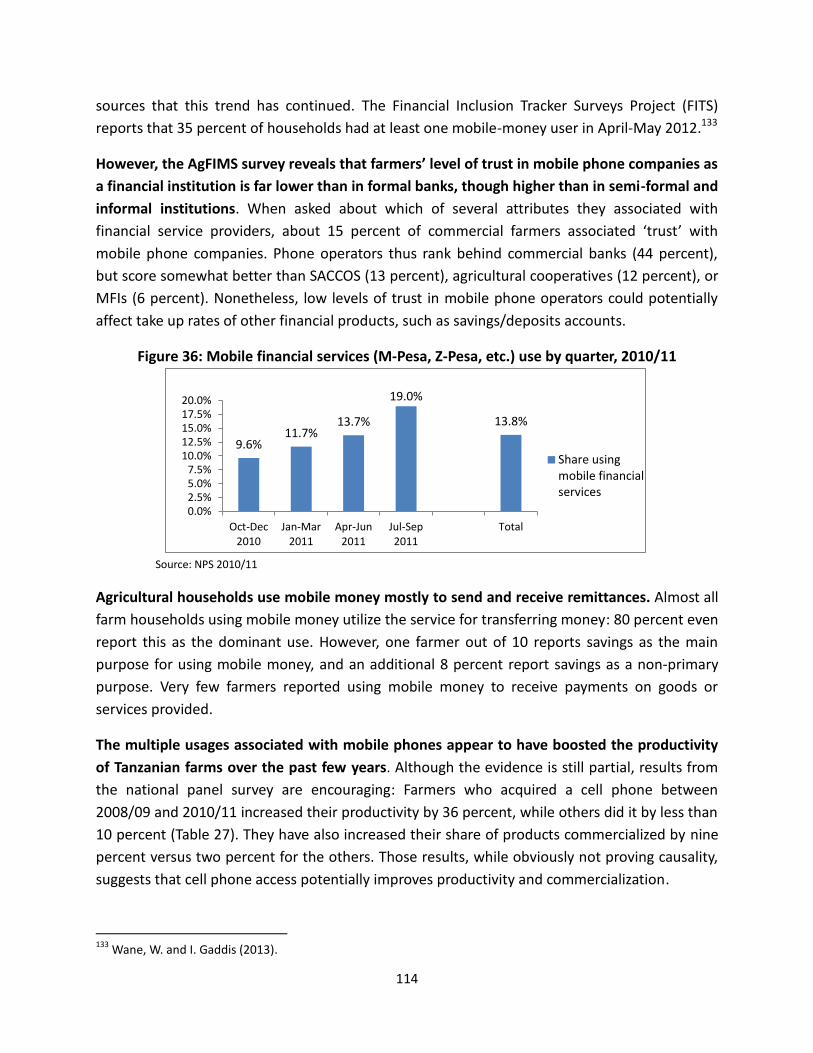
114
sources that this trend has continued. The Financial Inclusion Tracker Surveys Project (FITS)
reports that 35 percent of households had at least one mobile-money user in April-May 2012.133
However, the AgFIMS survey reveals that farmers’ level of trust in mobile phone companies as
a financial institution is far lower than in formal banks, though higher than in semi-formal and
informal institutions. When asked about which of several attributes they associated with
financial service providers, about 15 percent of commercial farmers associated ‘trust’ with
mobile phone companies. Phone operators thus rank behind commercial banks (44 percent),
but score somewhat better than SACCOS (13 percent), agricultural cooperatives (12 percent), or
MFIs (6 percent). Nonetheless, low levels of trust in mobile phone operators could potentially
affect take up rates of other financial products, such as savings/deposits accounts.
Figure 36: Mobile financial services (M-Pesa, Z-Pesa, etc.) use by quarter, 2010/11
Source: NPS 2010/11
Agricultural households use mobile money mostly to send and receive remittances. Almost all
farm households using mobile money utilize the service for transferring money: 80 percent even
report this as the dominant use. However, one farmer out of 10 reports savings as the main
purpose for using mobile money, and an additional 8 percent report savings as a non-primary
purpose. Very few farmers reported using mobile money to receive payments on goods or
services provided.
The multiple usages associated with mobile phones appear to have boosted the productivity
of Tanzanian farms over the past few years. Although the evidence is still partial, results from
the national panel survey are encouraging: Farmers who acquired a cell phone between
2008/09 and 2010/11 increased their productivity by 36 percent, while others did it by less than
10 percent (Table 27). They have also increased their share of products commercialized by nine
percent versus two percent for the others. Those results, while obviously not proving causality,
suggests that cell phone access potentially improves productivity and commercialization.
133
Wane, W. and I. Gaddis (2013).
9.6% 11.7%
13.7%
19.0%
13.8%
0.0%2.5%5.0%7.5%
10.0%12.5%15.0%17.5%20.0%
Oct-Dec2010
Jan-Mar2011
Apr-Jun2011
Jul-Sep2011
Total
Share usingmobile financialservices
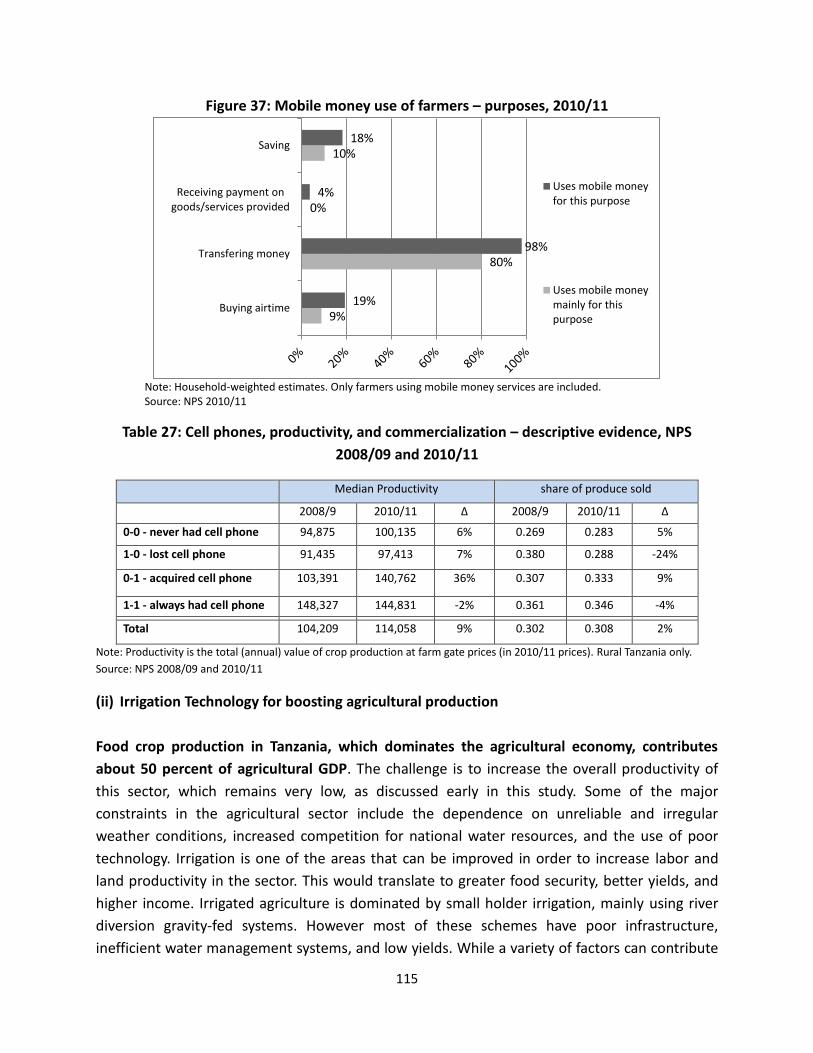
115
Figure 37: Mobile money use of farmers – purposes, 2010/11
Note: Household-weighted estimates. Only farmers using mobile money services are included. Source: NPS 2010/11
Table 27: Cell phones, productivity, and commercialization – descriptive evidence, NPS
2008/09 and 2010/11
Median Productivity share of produce sold
2008/9 2010/11 Δ 2008/9 2010/11 Δ
0-0 - never had cell phone 94,875 100,135 6% 0.269 0.283 5%
1-0 - lost cell phone 91,435 97,413 7% 0.380 0.288 -24%
0-1 - acquired cell phone 103,391 140,762 36% 0.307 0.333 9%
1-1 - always had cell phone 148,327 144,831 -2% 0.361 0.346 -4%
Total 104,209 114,058 9% 0.302 0.308 2%
Note: Productivity is the total (annual) value of crop production at farm gate prices (in 2010/11 prices). Rural Tanzania only.
Source: NPS 2008/09 and 2010/11
(ii) Irrigation Technology for boosting agricultural production
Food crop production in Tanzania, which dominates the agricultural economy, contributes
about 50 percent of agricultural GDP. The challenge is to increase the overall productivity of
this sector, which remains very low, as discussed early in this study. Some of the major
constraints in the agricultural sector include the dependence on unreliable and irregular
weather conditions, increased competition for national water resources, and the use of poor
technology. Irrigation is one of the areas that can be improved in order to increase labor and
land productivity in the sector. This would translate to greater food security, better yields, and
higher income. Irrigated agriculture is dominated by small holder irrigation, mainly using river
diversion gravity-fed systems. However most of these schemes have poor infrastructure,
inefficient water management systems, and low yields. While a variety of factors can contribute
9%
80%
0%
10%
19%
98%
4%
18%
Buying airtime
Transfering money
Receiving payment ongoods/services provided
Saving
Uses mobile moneyfor this purpose
Uses mobile moneymainly for thispurpose
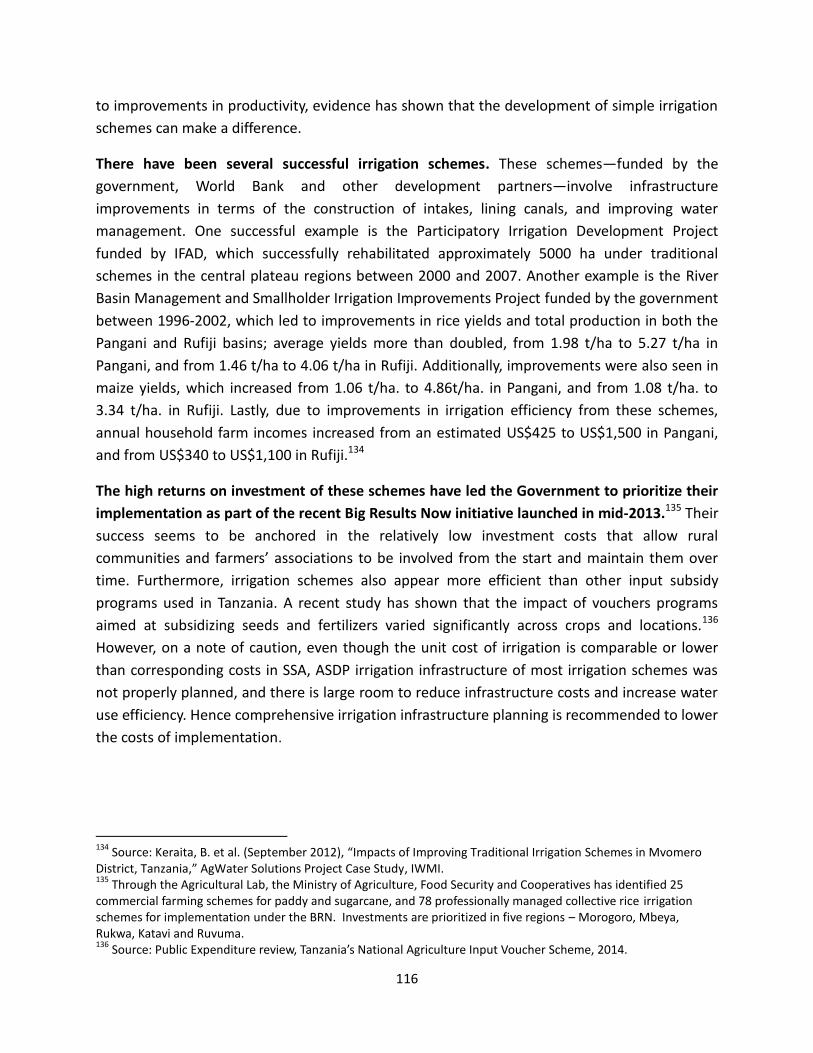
116
to improvements in productivity, evidence has shown that the development of simple irrigation
schemes can make a difference.
There have been several successful irrigation schemes. These schemes—funded by the
government, World Bank and other development partners—involve infrastructure
improvements in terms of the construction of intakes, lining canals, and improving water
management. One successful example is the Participatory Irrigation Development Project
funded by IFAD, which successfully rehabilitated approximately 5000 ha under traditional
schemes in the central plateau regions between 2000 and 2007. Another example is the River
Basin Management and Smallholder Irrigation Improvements Project funded by the government
between 1996-2002, which led to improvements in rice yields and total production in both the
Pangani and Rufiji basins; average yields more than doubled, from 1.98 t/ha to 5.27 t/ha in
Pangani, and from 1.46 t/ha to 4.06 t/ha in Rufiji. Additionally, improvements were also seen in
maize yields, which increased from 1.06 t/ha. to 4.86t/ha. in Pangani, and from 1.08 t/ha. to
3.34 t/ha. in Rufiji. Lastly, due to improvements in irrigation efficiency from these schemes,
annual household farm incomes increased from an estimated US$425 to US$1,500 in Pangani,
and from US$340 to US$1,100 in Rufiji.134
The high returns on investment of these schemes have led the Government to prioritize their
implementation as part of the recent Big Results Now initiative launched in mid-2013.135 Their
success seems to be anchored in the relatively low investment costs that allow rural
communities and farmers’ associations to be involved from the start and maintain them over
time. Furthermore, irrigation schemes also appear more efficient than other input subsidy
programs used in Tanzania. A recent study has shown that the impact of vouchers programs
aimed at subsidizing seeds and fertilizers varied significantly across crops and locations.136
However, on a note of caution, even though the unit cost of irrigation is comparable or lower
than corresponding costs in SSA, ASDP irrigation infrastructure of most irrigation schemes was
not properly planned, and there is large room to reduce infrastructure costs and increase water
use efficiency. Hence comprehensive irrigation infrastructure planning is recommended to lower
the costs of implementation.
134
Source: Keraita, B. et al. (September 2012), “Impacts of Improving Traditional Irrigation Schemes in Mvomero District, Tanzania,” AgWater Solutions Project Case Study, IWMI. 135
Through the Agricultural Lab, the Ministry of Agriculture, Food Security and Cooperatives has identified 25 commercial farming schemes for paddy and sugarcane, and 78 professionally managed collective rice irrigation schemes for implementation under the BRN. Investments are prioritized in five regions – Morogoro, Mbeya, Rukwa, Katavi and Ruvuma. 136
Source: Public Expenditure review, Tanzania’s National Agriculture Input Voucher Scheme, 2014.

117
2.4. Concluding remarks and next steps
Jobs are created by dynamic firms and entrepreneurs, who respond positively to a number of
common factors. These include access to finance, skills, and basic infrastructure, among others.
Variations in effects of these factors can be found in different types of firms and across sectors.
For example, non-farm businesses are highly influenced by skills and location, while farms are
more sensitive to infrastructure connectivity. The role associated to firms’ size can be contrasted
between exporters and farms since big is good for exports, while not necessarily for productivity
in agriculture.
If dynamic businesses exist in Tanzania, many are constrained by a set of limiting factors.
Those factors are relatively well known and should not surprise Tanzanian policy-makers. They
include the low availability of skilled workers, the underdevelopment of connective
infrastructure, the difficult access to affordable external funds, the limited usage of new
technologies, low electricity access, unpredictable rules associated to land development, and a
business environment that is not conducive to competitive and fair relationships between firms
and Government’s administrations (heavy administrative burden), among firms themselves
(insufficient competition), and between firms and their employees (over regulation and
taxation).
The novelty of our analysis, if any, has been to show that the effects associated with these
factors on firms’ dynamism and job creation are not always straightforward. While investing in
education is desirable, its effects vary considerably depending on its level, quality, and the need
of enterprises. The cost of transaction is the critical factor determining firms’ access to finance
and any initiative has to be tailored to account for their variability across types of enterprises.
The burden of excessive administrative barriers is not felt equally by all private operators. For
example, incumbents may see it as a useful barrier to entry against new competitor. They are
also more difficult to absorb by small firms with limited human and financial resources. These
few examples illustrate the importance for policy-making to go beyond the obvious and tailor
interventions and reforms according to the specific needs of firms and workers.
The challenge for Tanzania is speed. While the country is unambiguously on a transformative
path, its pace appears to be relatively slow. The education structure of its labor force is
equivalent today to the one prevailing in Thailand 40 years ago. The development of its
infrastructure is one of the lowest on the continent. For those reasons, actions have to be
implemented as soon as possible to get the results on the ground in the shortest timeframe.
However, this might not be sufficient since considerable time is required to educate a new
generation of workers, to build roads, and to modernize the port of Dar es Salaam.

118
International experience in successful emerging countries provides some insight on how to
accelerate the transformational process of firms in Tanzania. Possible catalysts include
clustering of firms, regional development, foreign direct investment, and dissemination of
simple technological breakthroughs. To some extent, these catalysts have already been
incorporated in the design of national strategies in Tanzania but more needs to be done.
The next step is to gather the lessons from these analyses and formulate an action plan.
119
PART 3: TOWARD AN ACTION PLAN TO CREATE JOBS
A three-pillar plan is proposed for developing jobs in Tanzania that involves specific attention to firms on the belief that employment is created by a dynamic private sector. The first pillar looks at job creation from the angle of small non-farm businesses, which have been growing very fast under the rapid urbanization process. The second pillar focuses on farms because those still capture the largest share of employment in Tanzania, while the third pillar discusses the job-creation potential associated with firms’ extension into new markets.
For each of the three pillars, a set of specific actions will be proposed with the objective to strike a balance between cross-cutting and focused actions. A specific sector is selected for each pillar as a focus for Tanzania. Targeting specific sectors can help Tanzania to jump-start its growth in production, employment, and exports.
While each pillar is important in itself, the combination of pillars is what really matters for success.
Though job creation is a primary concern of politicians and policymakers around the world,
only a handful of Sub-Saharan African countries have developed comprehensive employment
strategies. Tanzania is not yet among them, despite having developed sophisticated national
strategies on growth and poverty alleviation.
This part presents a three-pillar plan for developing jobs in Tanzania that involves specific
attention to firms on the belief that employment is created by a dynamic private sector. The
first pillar looks at job creation from the angle of small non-farm businesses, which have been
growing very fast under the rapid urbanization process. The second pillar focuses on farms
because those still capture the largest share of employment in Tanzania, while the third pillar
discusses the job-creation potential associated with firms’ extension into new markets.
This job-creation strategy is derived from the analysis proposed in the first two parts of this
study. It argues that jobs are created by (private) firms and this requires removing all the
obstacles that stand in the way of growth of Tanzanian businesses. It also assumes that these
obstacles—or the way to address them—might differ across types of businesses. For instance,
120
the skills needed for productive non-farm businesses, farms, and exporters are not the same.
The way to acquire skills also varies depending on the location, the activity, and the initial level
of education of business owners and workers. Policy recommendations require some degree of
specificity to be effective.
The plan is developed with a vision in mind for Tanzania: Economic prosperity will only be
attained if the country can create enough productive jobs for its rapidly growing labor force.
This will require the emergence of many dynamic small non-farm businesses—the main source
of employment for new entrants on the labor market in urban areas. Concurrently, farms will
have to become more productive; not only to increase food production but also to help
promote the development of labor-intensive transformation industries. Lastly, the expansion of
competitive firms toward export markets leads to growth of production (at the firm-level,
industry-level, and country-level) and hence, growth of employment. The challenge for the
Tanzanian policymakers is not only to stimulate these three forces but also to manage them
appropriately over time.
For each of the three pillars, specific actions will be proposed with the objective to create the
economic foundation and competitive conditions necessary for businesses to thrive and so
offer opportunities for the creation of productive jobs. The plan is articulated around 12 key
actions. These actions will not cover all constraints faced by firms in Tanzania, but will provide a
much needed sense of priority. The plan also attempts to strike a balance between cross-
cutting and focused actions.
For each pillar, a specific sector was selected as a focus for Tanzania. Targeting specific sectors
can help Tanzania to jump-start its growth in production, employment, and exports and bring
faster benefits.137 Using the analysis in section 2, leather manufacturing, fruit and vegetable
agribusiness, and tourism services were selected as industries in which Tanzania has a
competitive advantage. Recent international experience shows that targeted policies are
successful when they are allocated to competitive sectors and allocated in such a way as to
preserve or increase competition.138 Lastly, the analysis of specific value chains is only
representative of a larger group of industries in which comparative advantages have been
identified for Tanzania. Focusing on specific industries highlights the constraints and challenges
that exist at each stage of the value chain, and provides valuable information on which we may
base targeted recommendations.
137
See: Hausmann, R. et al. (March 2005), “Growth Diagnostics,” JFK Kennedy School of Government, Harvard University, Cambridge, MA. 138
For more details, see: Aghion, P. et al. (2012), “Industrial Policy and Competition,” NBER Working Paper No. 18048.
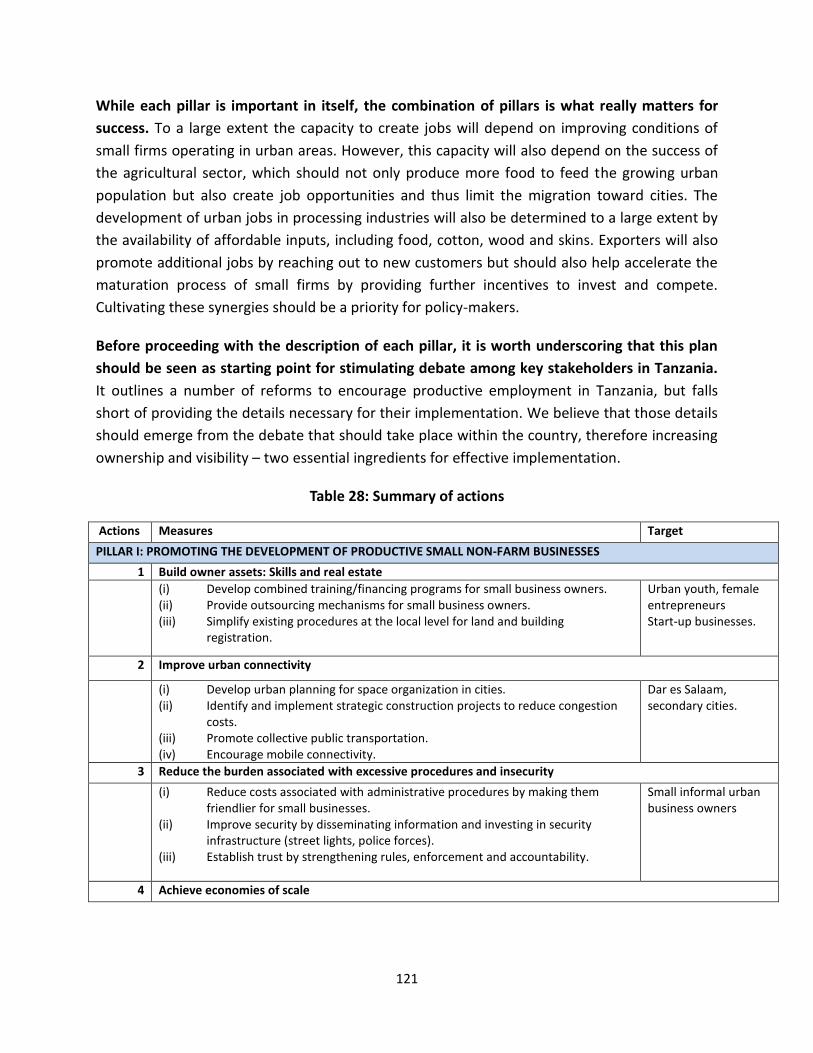
121
While each pillar is important in itself, the combination of pillars is what really matters for
success. To a large extent the capacity to create jobs will depend on improving conditions of
small firms operating in urban areas. However, this capacity will also depend on the success of
the agricultural sector, which should not only produce more food to feed the growing urban
population but also create job opportunities and thus limit the migration toward cities. The
development of urban jobs in processing industries will also be determined to a large extent by
the availability of affordable inputs, including food, cotton, wood and skins. Exporters will also
promote additional jobs by reaching out to new customers but should also help accelerate the
maturation process of small firms by providing further incentives to invest and compete.
Cultivating these synergies should be a priority for policy-makers.
Before proceeding with the description of each pillar, it is worth underscoring that this plan
should be seen as starting point for stimulating debate among key stakeholders in Tanzania.
It outlines a number of reforms to encourage productive employment in Tanzania, but falls
short of providing the details necessary for their implementation. We believe that those details
should emerge from the debate that should take place within the country, therefore increasing
ownership and visibility – two essential ingredients for effective implementation.
Table 28: Summary of actions
Actions Measures Target
PILLAR I: PROMOTING THE DEVELOPMENT OF PRODUCTIVE SMALL NON-FARM BUSINESSES
1 Build owner assets: Skills and real estate
(i) Develop combined training/financing programs for small business owners. (ii) Provide outsourcing mechanisms for small business owners. (iii) Simplify existing procedures at the local level for land and building
registration.
Urban youth, female entrepreneurs Start-up businesses.
2 Improve urban connectivity
(i) Develop urban planning for space organization in cities. (ii) Identify and implement strategic construction projects to reduce congestion
costs. (iii) Promote collective public transportation. (iv) Encourage mobile connectivity.
Dar es Salaam, secondary cities.
3 Reduce the burden associated with excessive procedures and insecurity
(i) Reduce costs associated with administrative procedures by making them friendlier for small businesses.
(ii) Improve security by disseminating information and investing in security infrastructure (street lights, police forces).
(iii) Establish trust by strengthening rules, enforcement and accountability.
Small informal urban business owners
4 Achieve economies of scale
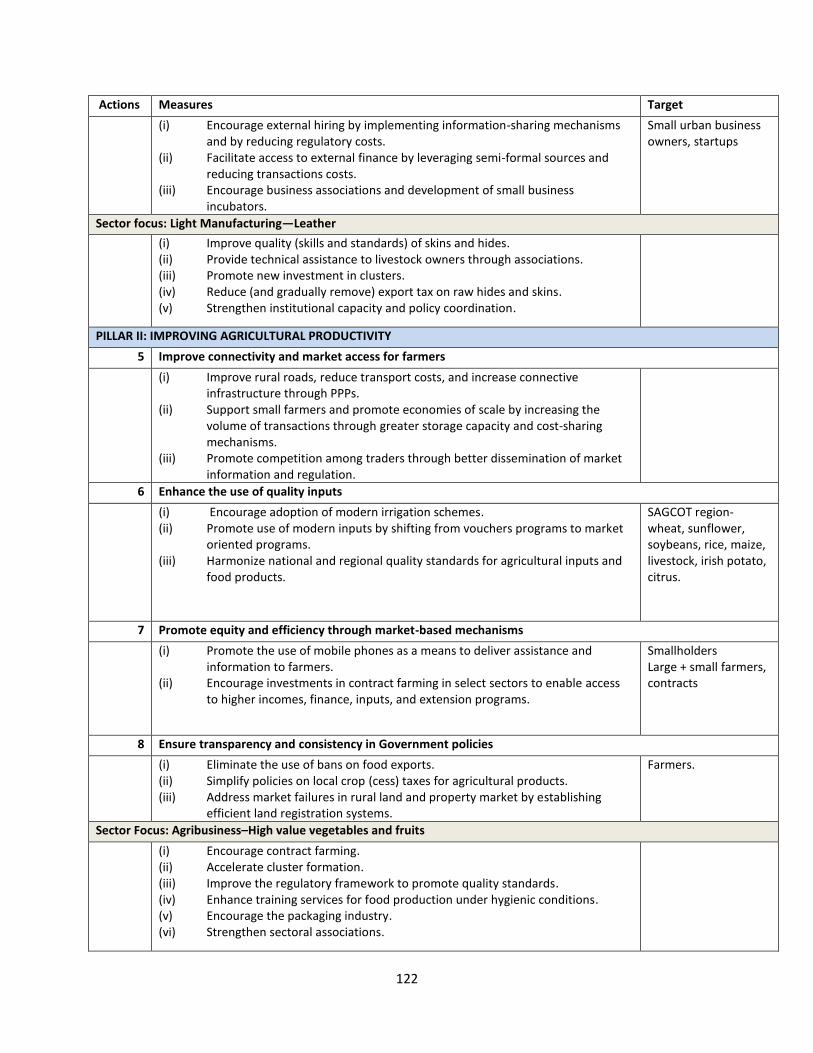
122
Actions Measures Target
(i) Encourage external hiring by implementing information-sharing mechanisms and by reducing regulatory costs.
(ii) Facilitate access to external finance by leveraging semi-formal sources and reducing transactions costs.
(iii) Encourage business associations and development of small business incubators.
Small urban business owners, startups
Sector focus: Light Manufacturing—Leather
(i) Improve quality (skills and standards) of skins and hides. (ii) Provide technical assistance to livestock owners through associations. (iii) Promote new investment in clusters. (iv) Reduce (and gradually remove) export tax on raw hides and skins. (v) Strengthen institutional capacity and policy coordination.
PILLAR II: IMPROVING AGRICULTURAL PRODUCTIVITY
5 Improve connectivity and market access for farmers
(i) Improve rural roads, reduce transport costs, and increase connective infrastructure through PPPs.
(ii) Support small farmers and promote economies of scale by increasing the volume of transactions through greater storage capacity and cost-sharing mechanisms.
(iii) Promote competition among traders through better dissemination of market information and regulation.
6 Enhance the use of quality inputs
(i) Encourage adoption of modern irrigation schemes. (ii) Promote use of modern inputs by shifting from vouchers programs to market
oriented programs. (iii) Harmonize national and regional quality standards for agricultural inputs and
food products.
SAGCOT region- wheat, sunflower, soybeans, rice, maize, livestock, irish potato, citrus.
7 Promote equity and efficiency through market-based mechanisms
(i) Promote the use of mobile phones as a means to deliver assistance and information to farmers.
(ii) Encourage investments in contract farming in select sectors to enable access to higher incomes, finance, inputs, and extension programs.
Smallholders Large + small farmers, contracts
8 Ensure transparency and consistency in Government policies
(i) Eliminate the use of bans on food exports. (ii) Simplify policies on local crop (cess) taxes for agricultural products. (iii) Address market failures in rural land and property market by establishing
efficient land registration systems.
Farmers.
Sector Focus: Agribusiness–High value vegetables and fruits
(i) Encourage contract farming. (ii) Accelerate cluster formation. (iii) Improve the regulatory framework to promote quality standards. (iv) Enhance training services for food production under hygienic conditions. (v) Encourage the packaging industry. (vi) Strengthen sectoral associations.
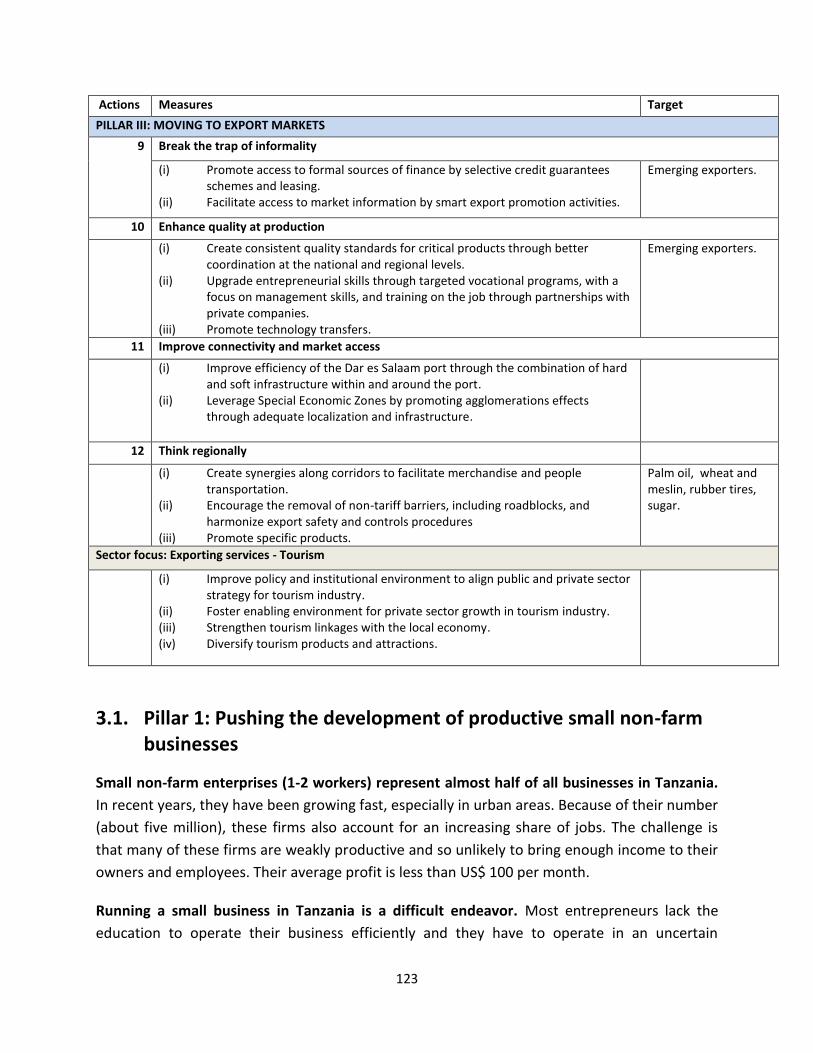
123
Actions Measures Target
PILLAR III: MOVING TO EXPORT MARKETS
9
Break the trap of informality
(i) Promote access to formal sources of finance by selective credit guarantees schemes and leasing.
(ii) Facilitate access to market information by smart export promotion activities.
Emerging exporters.
10 Enhance quality at production
(i) Create consistent quality standards for critical products through better coordination at the national and regional levels.
(ii) Upgrade entrepreneurial skills through targeted vocational programs, with a focus on management skills, and training on the job through partnerships with private companies.
(iii) Promote technology transfers.
Emerging exporters.
11 Improve connectivity and market access
(i) Improve efficiency of the Dar es Salaam port through the combination of hard and soft infrastructure within and around the port.
(ii) Leverage Special Economic Zones by promoting agglomerations effects through adequate localization and infrastructure.
12 Think regionally
(i) Create synergies along corridors to facilitate merchandise and people transportation.
(ii) Encourage the removal of non-tariff barriers, including roadblocks, and harmonize export safety and controls procedures
(iii) Promote specific products.
Palm oil, wheat and meslin, rubber tires, sugar.
Sector focus: Exporting services - Tourism
(i) Improve policy and institutional environment to align public and private sector strategy for tourism industry.
(ii) Foster enabling environment for private sector growth in tourism industry. (iii) Strengthen tourism linkages with the local economy. (iv) Diversify tourism products and attractions.
3.1. Pillar 1: Pushing the development of productive small non-farm businesses
Small non-farm enterprises (1-2 workers) represent almost half of all businesses in Tanzania.
In recent years, they have been growing fast, especially in urban areas. Because of their number
(about five million), these firms also account for an increasing share of jobs. The challenge is
that many of these firms are weakly productive and so unlikely to bring enough income to their
owners and employees. Their average profit is less than US$ 100 per month.
Running a small business in Tanzania is a difficult endeavor. Most entrepreneurs lack the
education to operate their business efficiently and they have to operate in an uncertain
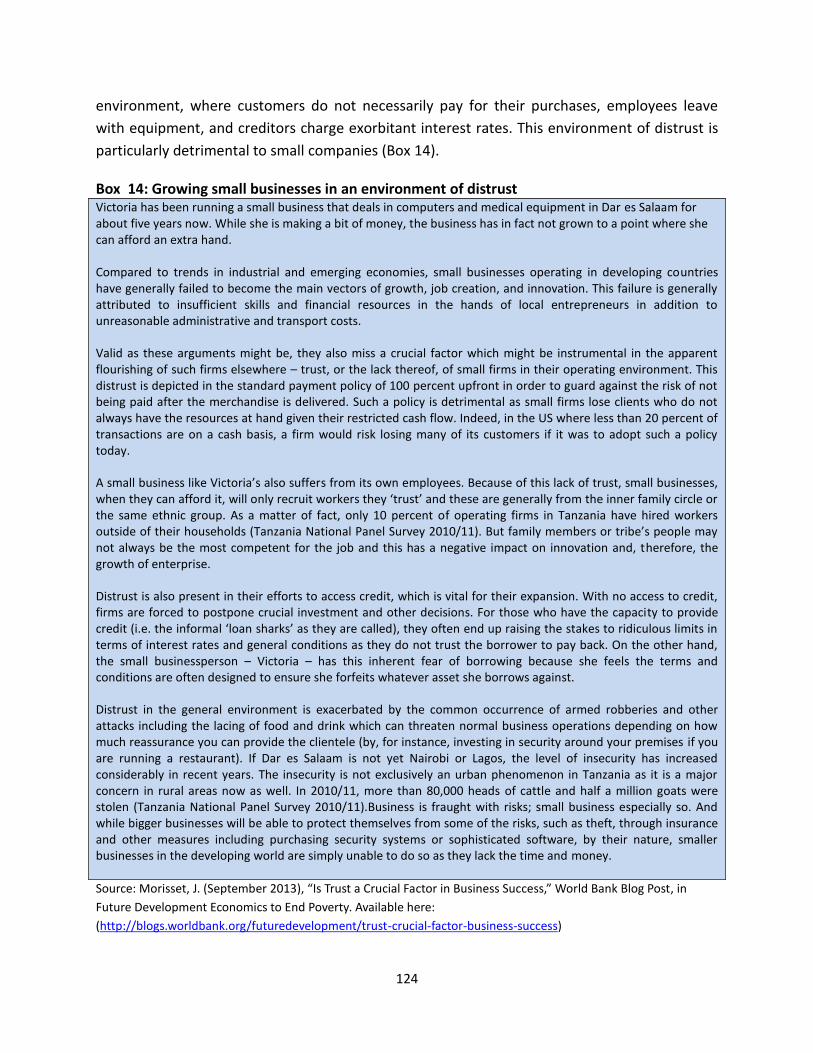
124
environment, where customers do not necessarily pay for their purchases, employees leave
with equipment, and creditors charge exorbitant interest rates. This environment of distrust is
particularly detrimental to small companies (Box 14).
Box 14: Growing small businesses in an environment of distrust Victoria has been running a small business that deals in computers and medical equipment in Dar es Salaam for about five years now. While she is making a bit of money, the business has in fact not grown to a point where she can afford an extra hand. Compared to trends in industrial and emerging economies, small businesses operating in developing countries have generally failed to become the main vectors of growth, job creation, and innovation. This failure is generally attributed to insufficient skills and financial resources in the hands of local entrepreneurs in addition to unreasonable administrative and transport costs.
Valid as these arguments might be, they also miss a crucial factor which might be instrumental in the apparent flourishing of such firms elsewhere – trust, or the lack thereof, of small firms in their operating environment. This distrust is depicted in the standard payment policy of 100 percent upfront in order to guard against the risk of not being paid after the merchandise is delivered. Such a policy is detrimental as small firms lose clients who do not always have the resources at hand given their restricted cash flow. Indeed, in the US where less than 20 percent of transactions are on a cash basis, a firm would risk losing many of its customers if it was to adopt such a policy today.
A small business like Victoria’s also suffers from its own employees. Because of this lack of trust, small businesses, when they can afford it, will only recruit workers they ‘trust’ and these are generally from the inner family circle or the same ethnic group. As a matter of fact, only 10 percent of operating firms in Tanzania have hired workers outside of their households (Tanzania National Panel Survey 2010/11). But family members or tribe’s people may not always be the most competent for the job and this has a negative impact on innovation and, therefore, the growth of enterprise.
Distrust is also present in their efforts to access credit, which is vital for their expansion. With no access to credit, firms are forced to postpone crucial investment and other decisions. For those who have the capacity to provide credit (i.e. the informal ‘loan sharks’ as they are called), they often end up raising the stakes to ridiculous limits in terms of interest rates and general conditions as they do not trust the borrower to pay back. On the other hand, the small businessperson – Victoria – has this inherent fear of borrowing because she feels the terms and conditions are often designed to ensure she forfeits whatever asset she borrows against.
Distrust in the general environment is exacerbated by the common occurrence of armed robberies and other attacks including the lacing of food and drink which can threaten normal business operations depending on how much reassurance you can provide the clientele (by, for instance, investing in security around your premises if you are running a restaurant). If Dar es Salaam is not yet Nairobi or Lagos, the level of insecurity has increased considerably in recent years. The insecurity is not exclusively an urban phenomenon in Tanzania as it is a major concern in rural areas now as well. In 2010/11, more than 80,000 heads of cattle and half a million goats were stolen (Tanzania National Panel Survey 2010/11).Business is fraught with risks; small business especially so. And while bigger businesses will be able to protect themselves from some of the risks, such as theft, through insurance and other measures including purchasing security systems or sophisticated software, by their nature, smaller businesses in the developing world are simply unable to do so as they lack the time and money.
Source: Morisset, J. (September 2013), “Is Trust a Crucial Factor in Business Success,” World Bank Blog Post, in
Future Development Economics to End Poverty. Available here:
(http://blogs.worldbank.org/futuredevelopment/trust-crucial-factor-business-success)
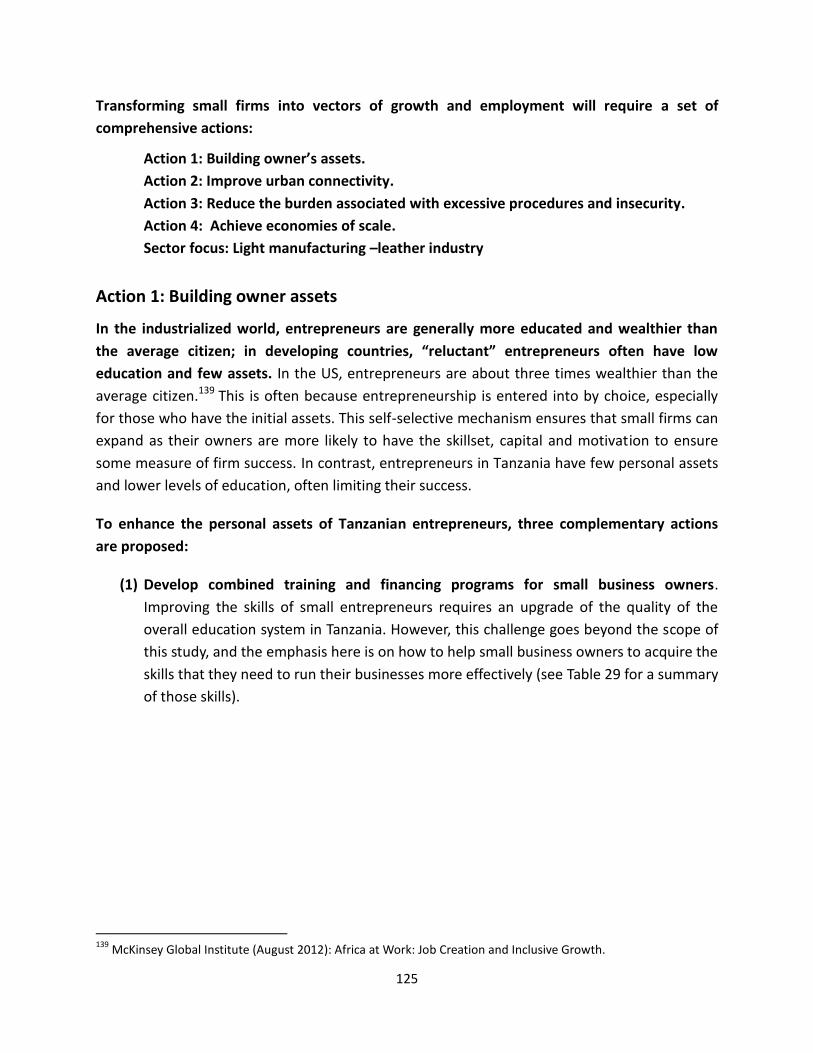
125
Transforming small firms into vectors of growth and employment will require a set of
comprehensive actions:
Action 1: Building owner’s assets.
Action 2: Improve urban connectivity.
Action 3: Reduce the burden associated with excessive procedures and insecurity.
Action 4: Achieve economies of scale.
Sector focus: Light manufacturing –leather industry
Action 1: Building owner assets
In the industrialized world, entrepreneurs are generally more educated and wealthier than
the average citizen; in developing countries, “reluctant” entrepreneurs often have low
education and few assets. In the US, entrepreneurs are about three times wealthier than the
average citizen.139 This is often because entrepreneurship is entered into by choice, especially
for those who have the initial assets. This self-selective mechanism ensures that small firms can
expand as their owners are more likely to have the skillset, capital and motivation to ensure
some measure of firm success. In contrast, entrepreneurs in Tanzania have few personal assets
and lower levels of education, often limiting their success.
To enhance the personal assets of Tanzanian entrepreneurs, three complementary actions
are proposed:
(1) Develop combined training and financing programs for small business owners.
Improving the skills of small entrepreneurs requires an upgrade of the quality of the
overall education system in Tanzania. However, this challenge goes beyond the scope of
this study, and the emphasis here is on how to help small business owners to acquire the
skills that they need to run their businesses more effectively (see Table 29 for a summary
of those skills).
139
McKinsey Global Institute (August 2012): Africa at Work: Job Creation and Inclusive Growth.
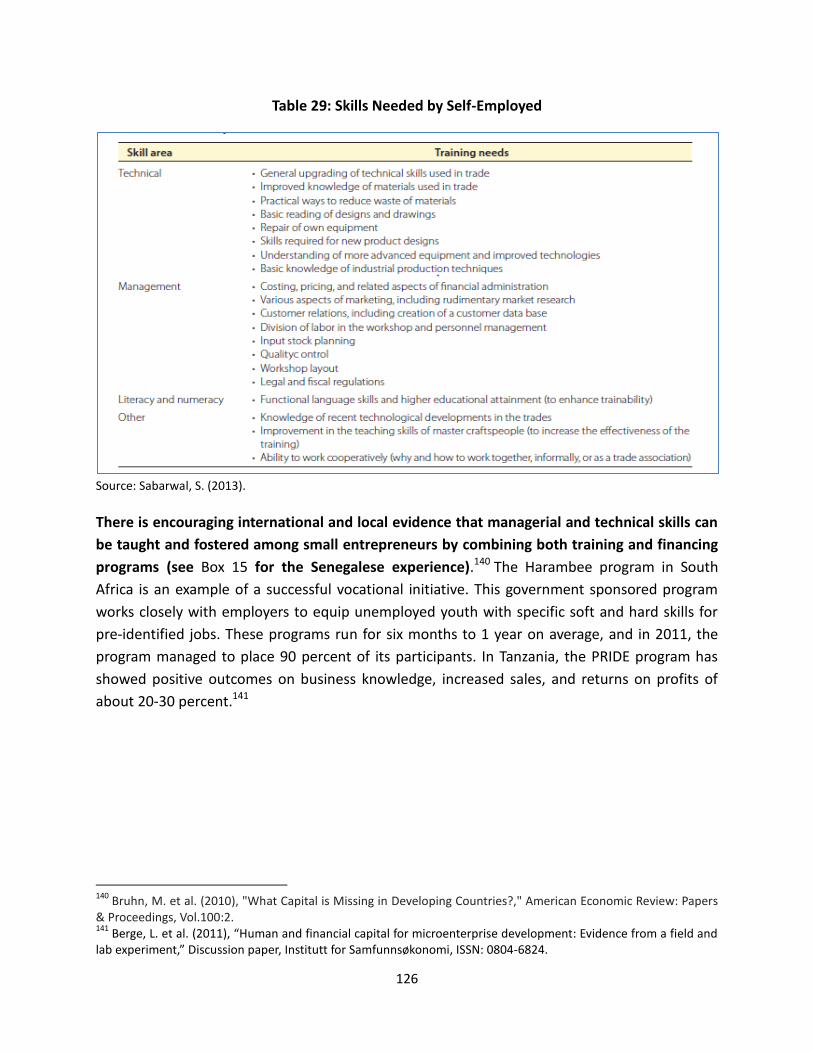
126
Table 29: Skills Needed by Self-Employed
Source: Sabarwal, S. (2013).
There is encouraging international and local evidence that managerial and technical skills can
be taught and fostered among small entrepreneurs by combining both training and financing
programs (see Box 15 for the Senegalese experience).140 The Harambee program in South
Africa is an example of a successful vocational initiative. This government sponsored program
works closely with employers to equip unemployed youth with specific soft and hard skills for
pre-identified jobs. These programs run for six months to 1 year on average, and in 2011, the
program managed to place 90 percent of its participants. In Tanzania, the PRIDE program has
showed positive outcomes on business knowledge, increased sales, and returns on profits of
about 20-30 percent.141
140
Bruhn, M. et al. (2010), "What Capital is Missing in Developing Countries?," American Economic Review: Papers & Proceedings, Vol.100:2. 141
Berge, L. et al. (2011), “Human and financial capital for microenterprise development: Evidence from a field and lab experiment,” Discussion paper, Institutt for Samfunnsøkonomi, ISSN: 0804-6824.
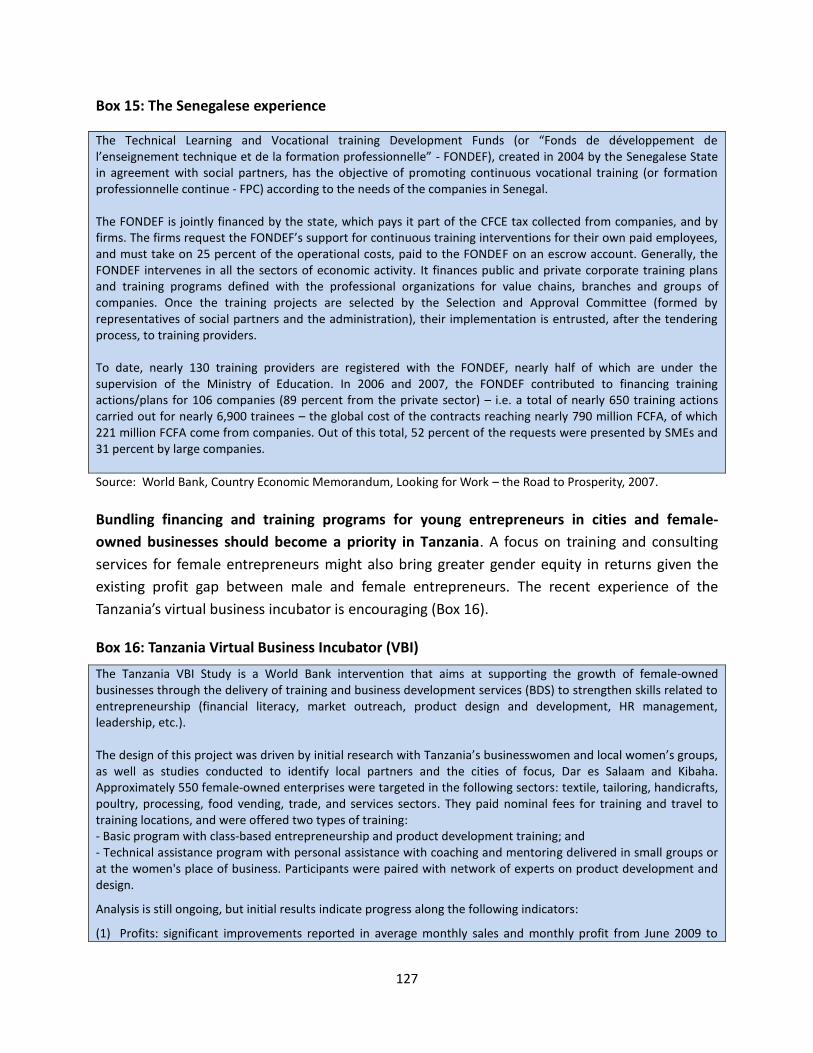
127
Box 15: The Senegalese experience
The Technical Learning and Vocational training Development Funds (or “Fonds de développement de l’enseignement technique et de la formation professionnelle” - FONDEF), created in 2004 by the Senegalese State in agreement with social partners, has the objective of promoting continuous vocational training (or formation professionnelle continue - FPC) according to the needs of the companies in Senegal. The FONDEF is jointly financed by the state, which pays it part of the CFCE tax collected from companies, and by firms. The firms request the FONDEF’s support for continuous training interventions for their own paid employees, and must take on 25 percent of the operational costs, paid to the FONDEF on an escrow account. Generally, the FONDEF intervenes in all the sectors of economic activity. It finances public and private corporate training plans and training programs defined with the professional organizations for value chains, branches and groups of companies. Once the training projects are selected by the Selection and Approval Committee (formed by representatives of social partners and the administration), their implementation is entrusted, after the tendering process, to training providers. To date, nearly 130 training providers are registered with the FONDEF, nearly half of which are under the supervision of the Ministry of Education. In 2006 and 2007, the FONDEF contributed to financing training actions/plans for 106 companies (89 percent from the private sector) – i.e. a total of nearly 650 training actions carried out for nearly 6,900 trainees – the global cost of the contracts reaching nearly 790 million FCFA, of which 221 million FCFA come from companies. Out of this total, 52 percent of the requests were presented by SMEs and 31 percent by large companies.
Source: World Bank, Country Economic Memorandum, Looking for Work – the Road to Prosperity, 2007.
Bundling financing and training programs for young entrepreneurs in cities and female-
owned businesses should become a priority in Tanzania. A focus on training and consulting
services for female entrepreneurs might also bring greater gender equity in returns given the
existing profit gap between male and female entrepreneurs. The recent experience of the
Tanzania’s virtual business incubator is encouraging (Box 16).
Box 16: Tanzania Virtual Business Incubator (VBI)
The Tanzania VBI Study is a World Bank intervention that aims at supporting the growth of female-owned businesses through the delivery of training and business development services (BDS) to strengthen skills related to entrepreneurship (financial literacy, market outreach, product design and development, HR management, leadership, etc.). The design of this project was driven by initial research with Tanzania’s businesswomen and local women’s groups, as well as studies conducted to identify local partners and the cities of focus, Dar es Salaam and Kibaha. Approximately 550 female-owned enterprises were targeted in the following sectors: textile, tailoring, handicrafts, poultry, processing, food vending, trade, and services sectors. They paid nominal fees for training and travel to training locations, and were offered two types of training: - Basic program with class-based entrepreneurship and product development training; and - Technical assistance program with personal assistance with coaching and mentoring delivered in small groups or at the women's place of business. Participants were paired with network of experts on product development and design.
Analysis is still ongoing, but initial results indicate progress along the following indicators:
(1) Profits: significant improvements reported in average monthly sales and monthly profit from June 2009 to
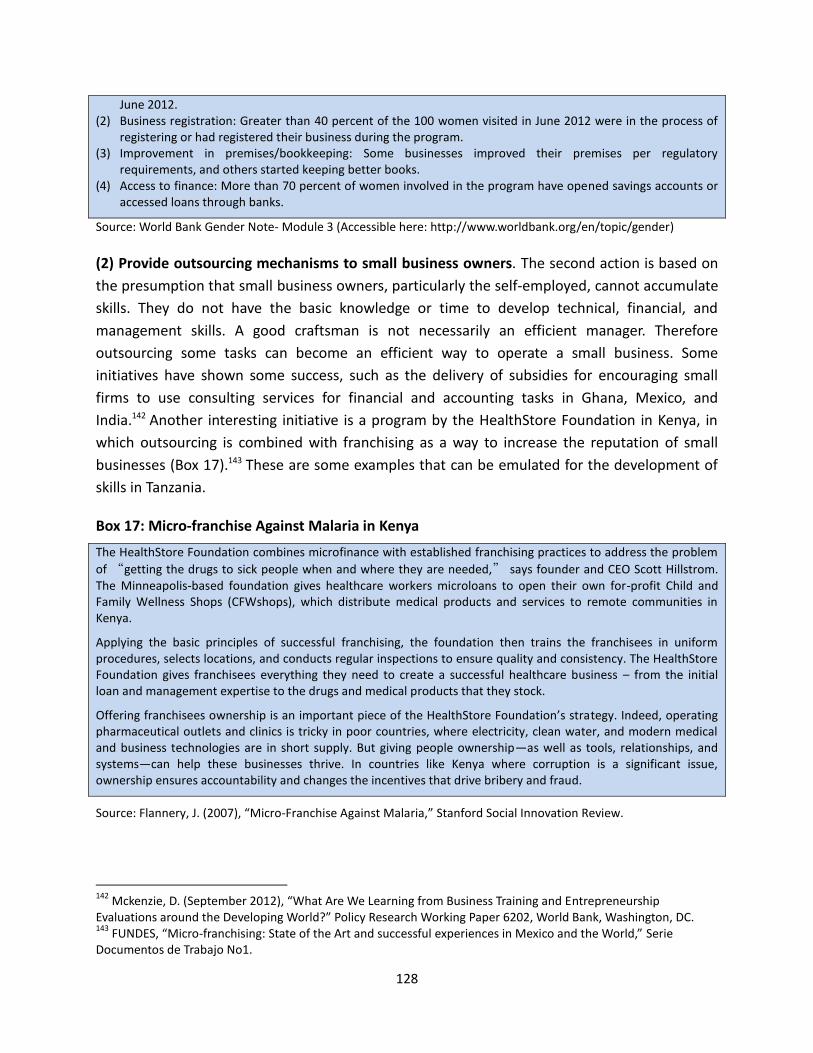
128
June 2012. (2) Business registration: Greater than 40 percent of the 100 women visited in June 2012 were in the process of
registering or had registered their business during the program. (3) Improvement in premises/bookkeeping: Some businesses improved their premises per regulatory
requirements, and others started keeping better books. (4) Access to finance: More than 70 percent of women involved in the program have opened savings accounts or
accessed loans through banks.
Source: World Bank Gender Note- Module 3 (Accessible here: http://www.worldbank.org/en/topic/gender)
(2) Provide outsourcing mechanisms to small business owners. The second action is based on
the presumption that small business owners, particularly the self-employed, cannot accumulate
skills. They do not have the basic knowledge or time to develop technical, financial, and
management skills. A good craftsman is not necessarily an efficient manager. Therefore
outsourcing some tasks can become an efficient way to operate a small business. Some
initiatives have shown some success, such as the delivery of subsidies for encouraging small
firms to use consulting services for financial and accounting tasks in Ghana, Mexico, and
India.142 Another interesting initiative is a program by the HealthStore Foundation in Kenya, in
which outsourcing is combined with franchising as a way to increase the reputation of small
businesses (Box 17).143 These are some examples that can be emulated for the development of
skills in Tanzania.
Box 17: Micro-franchise Against Malaria in Kenya
The HealthStore Foundation combines microfinance with established franchising practices to address the problem
of “getting the drugs to sick people when and where they are needed,” says founder and CEO Scott Hillstrom. The Minneapolis-based foundation gives healthcare workers microloans to open their own for-profit Child and Family Wellness Shops (CFWshops), which distribute medical products and services to remote communities in Kenya.
Applying the basic principles of successful franchising, the foundation then trains the franchisees in uniform procedures, selects locations, and conducts regular inspections to ensure quality and consistency. The HealthStore Foundation gives franchisees everything they need to create a successful healthcare business – from the initial loan and management expertise to the drugs and medical products that they stock.
Offering franchisees ownership is an important piece of the HealthStore Foundation’s strategy. Indeed, operating pharmaceutical outlets and clinics is tricky in poor countries, where electricity, clean water, and modern medical and business technologies are in short supply. But giving people ownership—as well as tools, relationships, and systems—can help these businesses thrive. In countries like Kenya where corruption is a significant issue, ownership ensures accountability and changes the incentives that drive bribery and fraud.
Source: Flannery, J. (2007), “Micro-Franchise Against Malaria,” Stanford Social Innovation Review.
142
Mckenzie, D. (September 2012), “What Are We Learning from Business Training and Entrepreneurship Evaluations around the Developing World?” Policy Research Working Paper 6202, World Bank, Washington, DC. 143
FUNDES, “Micro-franchising: State of the Art and successful experiences in Mexico and the World,” Serie Documentos de Trabajo No1.
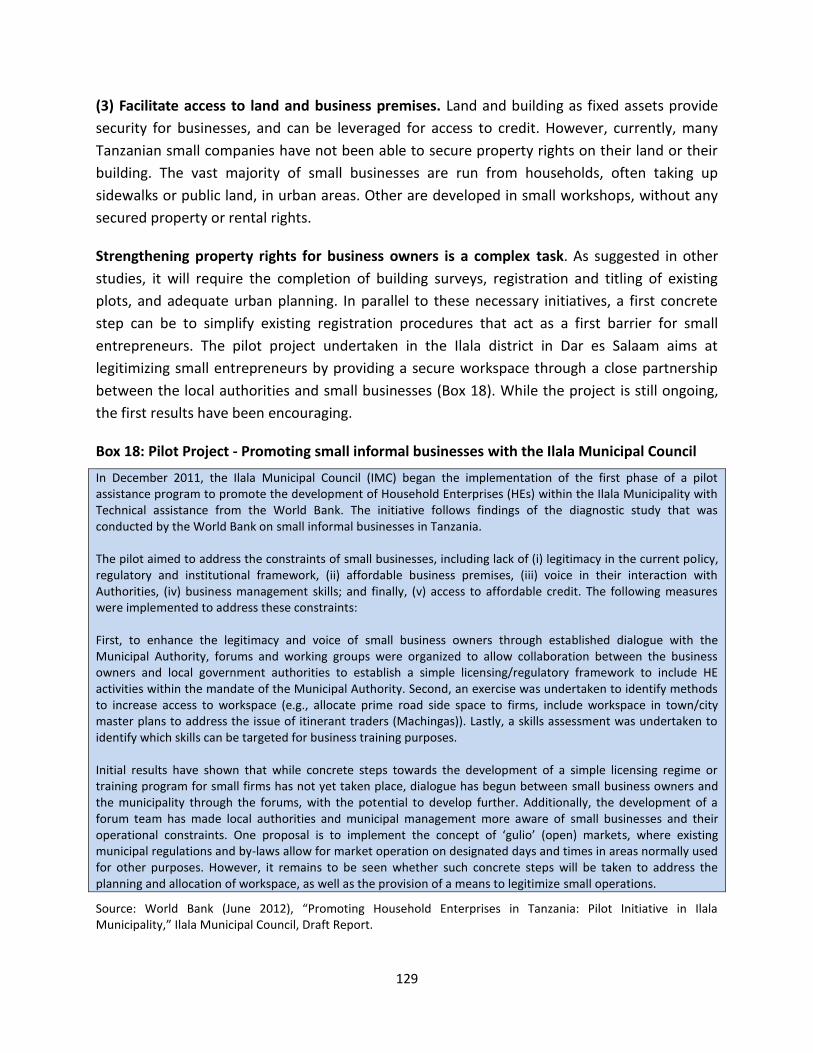
129
(3) Facilitate access to land and business premises. Land and building as fixed assets provide
security for businesses, and can be leveraged for access to credit. However, currently, many
Tanzanian small companies have not been able to secure property rights on their land or their
building. The vast majority of small businesses are run from households, often taking up
sidewalks or public land, in urban areas. Other are developed in small workshops, without any
secured property or rental rights.
Strengthening property rights for business owners is a complex task. As suggested in other
studies, it will require the completion of building surveys, registration and titling of existing
plots, and adequate urban planning. In parallel to these necessary initiatives, a first concrete
step can be to simplify existing registration procedures that act as a first barrier for small
entrepreneurs. The pilot project undertaken in the Ilala district in Dar es Salaam aims at
legitimizing small entrepreneurs by providing a secure workspace through a close partnership
between the local authorities and small businesses (Box 18). While the project is still ongoing,
the first results have been encouraging.
Box 18: Pilot Project - Promoting small informal businesses with the Ilala Municipal Council
In December 2011, the Ilala Municipal Council (IMC) began the implementation of the first phase of a pilot assistance program to promote the development of Household Enterprises (HEs) within the Ilala Municipality with Technical assistance from the World Bank. The initiative follows findings of the diagnostic study that was conducted by the World Bank on small informal businesses in Tanzania. The pilot aimed to address the constraints of small businesses, including lack of (i) legitimacy in the current policy, regulatory and institutional framework, (ii) affordable business premises, (iii) voice in their interaction with Authorities, (iv) business management skills; and finally, (v) access to affordable credit. The following measures were implemented to address these constraints: First, to enhance the legitimacy and voice of small business owners through established dialogue with the Municipal Authority, forums and working groups were organized to allow collaboration between the business owners and local government authorities to establish a simple licensing/regulatory framework to include HE activities within the mandate of the Municipal Authority. Second, an exercise was undertaken to identify methods to increase access to workspace (e.g., allocate prime road side space to firms, include workspace in town/city master plans to address the issue of itinerant traders (Machingas)). Lastly, a skills assessment was undertaken to identify which skills can be targeted for business training purposes. Initial results have shown that while concrete steps towards the development of a simple licensing regime or training program for small firms has not yet taken place, dialogue has begun between small business owners and the municipality through the forums, with the potential to develop further. Additionally, the development of a forum team has made local authorities and municipal management more aware of small businesses and their operational constraints. One proposal is to implement the concept of ‘gulio’ (open) markets, where existing municipal regulations and by-laws allow for market operation on designated days and times in areas normally used for other purposes. However, it remains to be seen whether such concrete steps will be taken to address the planning and allocation of workspace, as well as the provision of a means to legitimize small operations.
Source: World Bank (June 2012), “Promoting Household Enterprises in Tanzania: Pilot Initiative in Ilala Municipality,” Ilala Municipal Council, Draft Report.
130
Action 2: Access to basic infrastructure for connectivity
Small firms face high transportation costs, which limit their access to resources, skills, and
customers. The average congestion cost in Dar es Salaam is today estimated to be equivalent to
US$20 per person per month (about 30 percent of the average monthly salary earned by a
typical worker in Dar).
Addressing the challenge of urban mobility requires strategic planning and implementation:
First, urban planning is required for organizing space for both business development
and for transportation. This should include the development of Dar es Salaam –the
fastest growing city in the country- but also secondary cities.
Second, when planning is completed, transportation projects should be selected, if
possible, through competitive processes (see Box 19 for the example of Lagos). As an
illustration, the Dar es Salaam Rapid Transit (DART) project aims to reduce congestion
costs by the construction of trunk roads, bus stations and terminals, and pedestrian
walkways. Viable and affordable public transportation modes are important to achieve
gains in efficiency. In cities like Dar es-Salaam, this means safer and better organized
transportation networks involving better systems for payment collection, assuring riders
of seats and routes, marked buses, and having a central mechanism for user
feedback/complaints. In that context, as discussed in more detail in pillar 3, the strategic
importance of the port of Dar es Salaam for the Tanzanian economy as well as the
development of special economic zones for businesses should receive special attention.
Such improvements are more likely to happen when competition is promoted in the
transport sector. Competition can also be facilitated in the trucking industry by disclosing
tariffs and promoting the purchase of motor vehicles by small firms’ associations. There
is also a role for private firms, which can reduce the cost of transportation for employees
by providing mass transit services, and selling this as a benefit to attract good employees
(like some successful firms in Dar do to provide lunch to employees).
Another critical aspect for improving connectivity for small business owners is
leveraging the gains from mobile phones. Mobile phones are not only used for
communication but also to collect information and to send and receive remittances. For
example, GPS systems can track buses and inform customers of arrival times and delays.
Such tracking systems can also monitor the movements of goods in trucks. Suppliers can
be paid through phones. Customers can be contacted through SMS messages or email
campaigns. Businesses can get credit through phones (see more in the next pillar). In
short, all these possibilities offer opportunities to reduce transaction and transportation
costs and so significantly increase efficiencies for business owners.
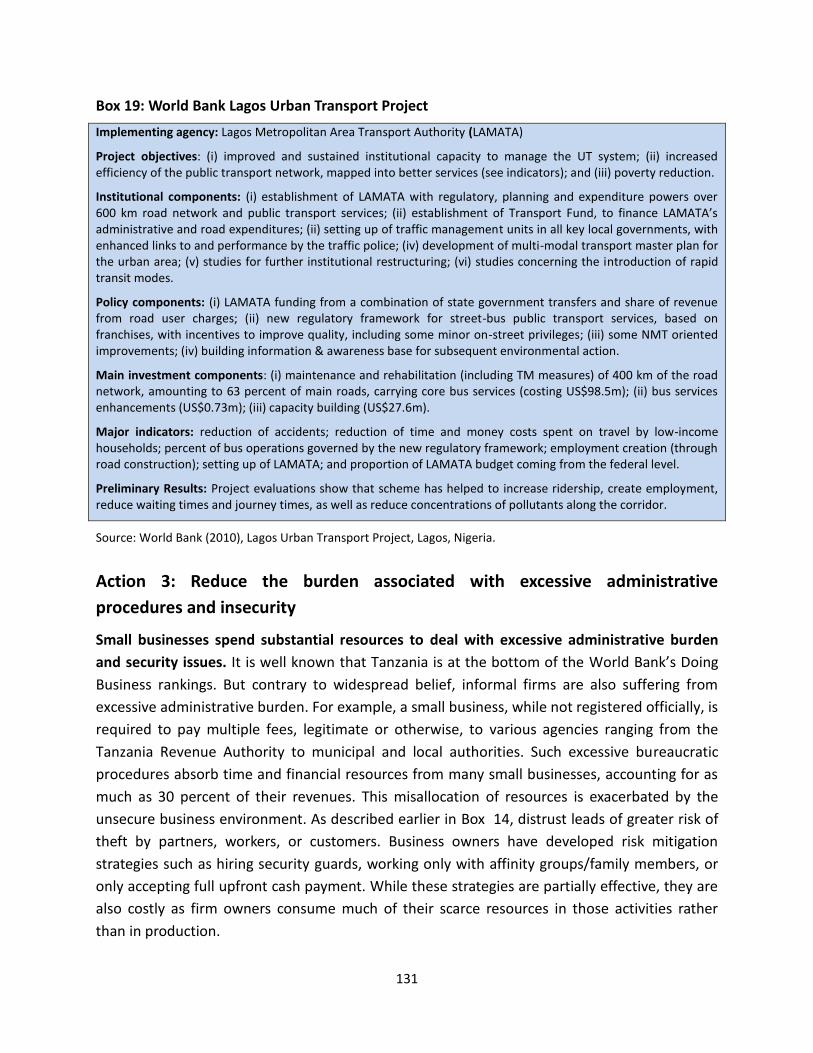
131
Box 19: World Bank Lagos Urban Transport Project
Implementing agency: Lagos Metropolitan Area Transport Authority (LAMATA)
Project objectives: (i) improved and sustained institutional capacity to manage the UT system; (ii) increased efficiency of the public transport network, mapped into better services (see indicators); and (iii) poverty reduction.
Institutional components: (i) establishment of LAMATA with regulatory, planning and expenditure powers over 600 km road network and public transport services; (ii) establishment of Transport Fund, to finance LAMATA’s administrative and road expenditures; (ii) setting up of traffic management units in all key local governments, with enhanced links to and performance by the traffic police; (iv) development of multi-modal transport master plan for the urban area; (v) studies for further institutional restructuring; (vi) studies concerning the introduction of rapid transit modes.
Policy components: (i) LAMATA funding from a combination of state government transfers and share of revenue from road user charges; (ii) new regulatory framework for street-bus public transport services, based on franchises, with incentives to improve quality, including some minor on-street privileges; (iii) some NMT oriented improvements; (iv) building information & awareness base for subsequent environmental action.
Main investment components: (i) maintenance and rehabilitation (including TM measures) of 400 km of the road network, amounting to 63 percent of main roads, carrying core bus services (costing US$98.5m); (ii) bus services enhancements (US$0.73m); (iii) capacity building (US$27.6m).
Major indicators: reduction of accidents; reduction of time and money costs spent on travel by low-income households; percent of bus operations governed by the new regulatory framework; employment creation (through road construction); setting up of LAMATA; and proportion of LAMATA budget coming from the federal level.
Preliminary Results: Project evaluations show that scheme has helped to increase ridership, create employment, reduce waiting times and journey times, as well as reduce concentrations of pollutants along the corridor.
Source: World Bank (2010), Lagos Urban Transport Project, Lagos, Nigeria.
Action 3: Reduce the burden associated with excessive administrative
procedures and insecurity
Small businesses spend substantial resources to deal with excessive administrative burden
and security issues. It is well known that Tanzania is at the bottom of the World Bank’s Doing
Business rankings. But contrary to widespread belief, informal firms are also suffering from
excessive administrative burden. For example, a small business, while not registered officially, is
required to pay multiple fees, legitimate or otherwise, to various agencies ranging from the
Tanzania Revenue Authority to municipal and local authorities. Such excessive bureaucratic
procedures absorb time and financial resources from many small businesses, accounting for as
much as 30 percent of their revenues. This misallocation of resources is exacerbated by the
unsecure business environment. As described earlier in Box 14, distrust leads of greater risk of
theft by partners, workers, or customers. Business owners have developed risk mitigation
strategies such as hiring security guards, working only with affinity groups/family members, or
only accepting full upfront cash payment. While these strategies are partially effective, they are
also costly as firm owners consume much of their scarce resources in those activities rather
than in production.
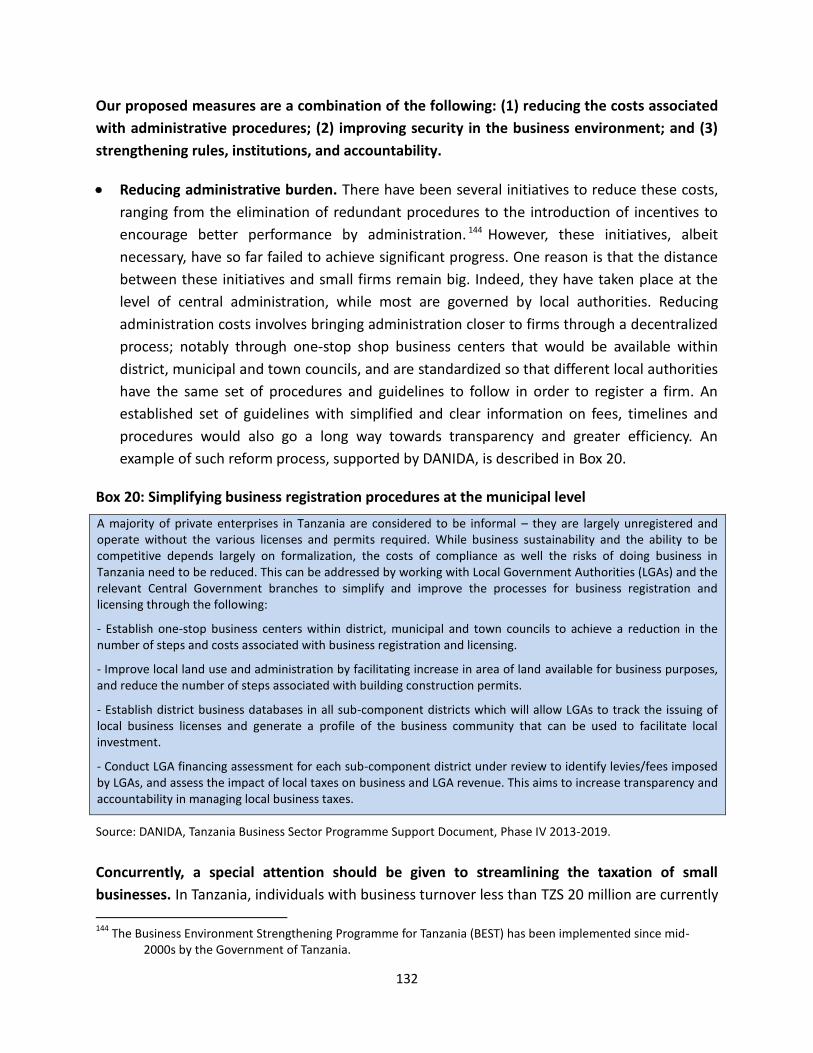
132
Our proposed measures are a combination of the following: (1) reducing the costs associated
with administrative procedures; (2) improving security in the business environment; and (3)
strengthening rules, institutions, and accountability.
Reducing administrative burden. There have been several initiatives to reduce these costs,
ranging from the elimination of redundant procedures to the introduction of incentives to
encourage better performance by administration. 144 However, these initiatives, albeit
necessary, have so far failed to achieve significant progress. One reason is that the distance
between these initiatives and small firms remain big. Indeed, they have taken place at the
level of central administration, while most are governed by local authorities. Reducing
administration costs involves bringing administration closer to firms through a decentralized
process; notably through one-stop shop business centers that would be available within
district, municipal and town councils, and are standardized so that different local authorities
have the same set of procedures and guidelines to follow in order to register a firm. An
established set of guidelines with simplified and clear information on fees, timelines and
procedures would also go a long way towards transparency and greater efficiency. An
example of such reform process, supported by DANIDA, is described in Box 20.
Box 20: Simplifying business registration procedures at the municipal level
A majority of private enterprises in Tanzania are considered to be informal – they are largely unregistered and operate without the various licenses and permits required. While business sustainability and the ability to be competitive depends largely on formalization, the costs of compliance as well the risks of doing business in Tanzania need to be reduced. This can be addressed by working with Local Government Authorities (LGAs) and the relevant Central Government branches to simplify and improve the processes for business registration and licensing through the following:
- Establish one-stop business centers within district, municipal and town councils to achieve a reduction in the number of steps and costs associated with business registration and licensing.
- Improve local land use and administration by facilitating increase in area of land available for business purposes, and reduce the number of steps associated with building construction permits.
- Establish district business databases in all sub-component districts which will allow LGAs to track the issuing of local business licenses and generate a profile of the business community that can be used to facilitate local investment.
- Conduct LGA financing assessment for each sub-component district under review to identify levies/fees imposed by LGAs, and assess the impact of local taxes on business and LGA revenue. This aims to increase transparency and accountability in managing local business taxes.
Source: DANIDA, Tanzania Business Sector Programme Support Document, Phase IV 2013-2019.
Concurrently, a special attention should be given to streamlining the taxation of small
businesses. In Tanzania, individuals with business turnover less than TZS 20 million are currently
144
The Business Environment Strengthening Programme for Tanzania (BEST) has been implemented since mid-2000s by the Government of Tanzania.
133
subject to presumptive income tax. The current system is excessively complex to administer
with a mixture of ad valorem and specific taxes with separate structures for enterprises. The
way forward would be to introduce a simpler system with a flat tax (in the range of three
percent on enterprises turnover below a certain threshold.145 This proposal would contribute to
incentivizing microbusinesses to participate in the system by reducing their compliance costs.
Based on national consultations, the Government in the Finance Act 2012 has introduced a nil-
band (zero-band) as the first round of reform, exempting entrepreneurs with less than TZS 4
million of turnover from the presumptive tax. The Government should now consider
introducing the flat tax as suggested above.
Lastly, an effort should be made to reduce the number of (central and local) agencies that
collect their revenue through fees and inspections. Some firms, for example, may be visited by
nine different regulatory agents over a 3 week period. Some of these agencies might not be
necessary or their collection effort can be centralized, for instance in TRA, which will reduce
opportunities for corruption. Lastly, transparency and efficiency through the publication of the
performance of all administrations interacting with businesses should be encouraged. By
making this information public, the Government will increase accountability and develop a
sense of competition between agencies, with the high performer being recognized by top policy
makers every year.146
(2) Improving security in the business environment. Security is a typical public good. Private
firms are unlikely to invest enough resources in it because they expect that their neighbors will
invest instead of them. Government intervention is therefore justified, which can take various
complementary forms:
The Government can help disseminate information on security issues and so increase
the awareness of business owners and communities.
Greater investment in security and strategic placement of trained police forces is critical
to enforce a more secure operational and investment environment.
Additionally, investments in critical infrastructure such as street lights and storage
facilities would encourage an environment of greater security.
The Government could help mobilize industry and firm associations to invest collectively
in security, by providing financial incentives.
(3) Strengthening institutions, rule of law, and accountability. Restoring trust in the operating
environment in Tanzania is a long term effort and there is no straight route to take. In every
society, there are mechanisms to ensure the implementation of collective rules and to sanction
145
This recommendation is derived from the TRA study carried on in 20111. 146
McKinsey Global Institute (August 2012): Africa at Work: Job Creation and Inclusive Growth.

134
trespassers.147 In a country like Tanzania, if traditional mechanisms are still at play in rural areas,
they have not been replaced by other options in urban areas. The vast the majority of
Tanzanians do not trust the institutions that are supposed to protect them. In 2009, almost 90
percent of Tanzanians believed that the police force and judges were corrupt.148 While the rules
do generally exist on paper, implementation has been inconsistent.
Strengthening institutions will require parallel measures on incentives to follow the law,
effective sanctions for those who circumvent it, and an overall increase in transparency in
legal enforcement systems. Beyond these traditional measures, the use of both formal and
informal mechanisms can help restore confidence and accountability. Specifically, reputation-
based systems such as trading relations between suppliers and customers can grow into an
information exchange system between business associations that share information about
customer payment history, and this can lead to the growth of credit bureaus. On the
government side, one measure to increase accountability would be to set an example and
publish the tax collection figures from large enterprises as well as income statements of
policymakers and business leaders. Input from the media is also important to include in the
reform process as they publicize illegal actions by government officials, and can help citizens to
hold their government accountable. Lastly, speeding up the processing of cases in the courts, as
well as increasing access to other dispute resolution mechanisms (i.e., small claims court) will
reduce court costs while upholding integrity of legal processes.
Action 4: Achieving economies of scale
Dynamic firms are those who are able to achieve economies of scale, allowing them to reduce
their fixed costs and so to become competitive. Such growth is facilitated by three essential
channels: (1) hiring workers external to the household; (2) accessing external sources of
finance; and (3) participating in firms’ associations that reduce transaction costs to obtain
information. Good policy can support these actions:
(1) Encourage external hiring by improving information availability and reducing regulatory
costs. Due to information asymmetries, lack of trust, and uncertainties in the business
environment, smaller firms in Tanzania prefer to hire their employees within their networks,
ethnic groups, and in particular, within their families. 149 While this practice mitigates risk to a
147
In the US, a strong justice system and accompanying institutions play this role with reasonable effectiveness. In France, this is ensured by collective groups, such as public employees, labor unions, and business associations. In China, the combination of central power and cultural heritage offers those safeguards. 148
Source: National Governance and Corruption Survey, 2009 149
Approximately 79 percent of firms interviewed reported relying on referrals or networks for identifying and recruiting employees. Only about 21 percent of firms appear to undertake an active search for employees through job advertisements, and 2.7 percent find employees through educational institute. Source: Sabarwal, S. (2013).
135
certain extent, empirical evidence suggests that hiring on a competitive basis with a larger pool
of workers is more efficient for matching skills to jobs.
Policymakers can encourage active external hiring by reducing the cost of hiring. This can be
done through the combination of (i) improving search mechanisms for potential employees and
(ii) lowering regulatory costs. Often, firms will not hire external workers because the search
process is lengthy and the costs are high. There is no central database and the few existing
employment agencies do not target small businesses. The Government can play a coordination
role and provide employment and information services through the creation of a National
Research Observatory for Employment and Qualifications, as Tunisia did in 2000 in order to
develop a labor market information system and database on the skills available in the labor
market.150
As with many other business operations, reducing the administrative burden in hiring will be
helpful. When a firm wants to hire an external worker, it has to deal with an extensive series of
permits, authorizations, and fees. While these are generally well-intended to protect workers,
they also act as a disincentive for firms to hire. In that sense, the current taxation of labor by
five percent (used to partially finance labor training programs) is too high by international
standards. More generally, a review of labor regulations is encouraged to reduce the
transaction cost of hiring.
(2) Encourage the use of external finance by promoting informal and semi-informal channels.
The Tanzanian financial system is characterized by its duality: on the hand, a few firms have
access to formal external finance; on the other hand, the vast majority of small firms have to
use other channels because of high transaction costs. The emphasis here is given to the second
category, while the question of how enhance access to formal credit is addressed in Action 9.
Most of the firms captured in this first pillar are indeed too small to get ready access to formal
banking.
While a majority of small firms will not be able to easily access formal sources of finance
without significant growth, there are semi-formal channels that can serve as a stepping stone
towards access to formal finance. There are a few key steps that the government could assist
with in order to promote and create a more robust system of semi-formal financing. In rural
areas, there is a need to strengthen village banking associations. In urban areas, government
initiatives could include the promotion of clusters (firm associations and economic zones) to
leverage supplier credit, supporting microfinance institutions, and creating an enabling
environment for mobile banking platforms. One relatively successful microfinance institution in
150
Fourcase, B. (2006), “Labour market and training observatories in the Maghreb countries,” Vocational Training Policy Analysis, ISSN 0378-5068.
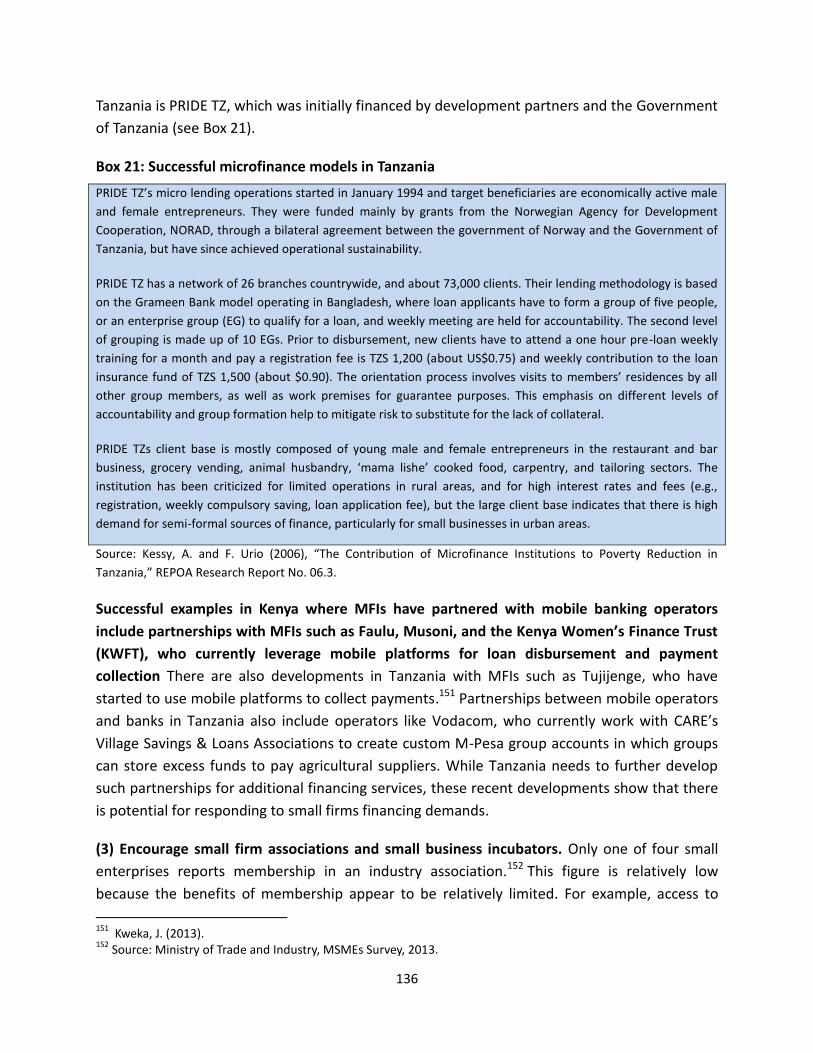
136
Tanzania is PRIDE TZ, which was initially financed by development partners and the Government
of Tanzania (see Box 21).
Box 21: Successful microfinance models in Tanzania
PRIDE TZ’s micro lending operations started in January 1994 and target beneficiaries are economically active male
and female entrepreneurs. They were funded mainly by grants from the Norwegian Agency for Development
Cooperation, NORAD, through a bilateral agreement between the government of Norway and the Government of
Tanzania, but have since achieved operational sustainability.
PRIDE TZ has a network of 26 branches countrywide, and about 73,000 clients. Their lending methodology is based
on the Grameen Bank model operating in Bangladesh, where loan applicants have to form a group of five people,
or an enterprise group (EG) to qualify for a loan, and weekly meeting are held for accountability. The second level
of grouping is made up of 10 EGs. Prior to disbursement, new clients have to attend a one hour pre-loan weekly
training for a month and pay a registration fee is TZS 1,200 (about US$0.75) and weekly contribution to the loan
insurance fund of TZS 1,500 (about $0.90). The orientation process involves visits to members’ residences by all
other group members, as well as work premises for guarantee purposes. This emphasis on different levels of
accountability and group formation help to mitigate risk to substitute for the lack of collateral.
PRIDE TZs client base is mostly composed of young male and female entrepreneurs in the restaurant and bar
business, grocery vending, animal husbandry, ‘mama lishe’ cooked food, carpentry, and tailoring sectors. The
institution has been criticized for limited operations in rural areas, and for high interest rates and fees (e.g.,
registration, weekly compulsory saving, loan application fee), but the large client base indicates that there is high
demand for semi-formal sources of finance, particularly for small businesses in urban areas.
Source: Kessy, A. and F. Urio (2006), “The Contribution of Microfinance Institutions to Poverty Reduction in
Tanzania,” REPOA Research Report No. 06.3.
Successful examples in Kenya where MFIs have partnered with mobile banking operators
include partnerships with MFIs such as Faulu, Musoni, and the Kenya Women’s Finance Trust
(KWFT), who currently leverage mobile platforms for loan disbursement and payment
collection There are also developments in Tanzania with MFIs such as Tujijenge, who have
started to use mobile platforms to collect payments.151 Partnerships between mobile operators
and banks in Tanzania also include operators like Vodacom, who currently work with CARE’s
Village Savings & Loans Associations to create custom M-Pesa group accounts in which groups
can store excess funds to pay agricultural suppliers. While Tanzania needs to further develop
such partnerships for additional financing services, these recent developments show that there
is potential for responding to small firms financing demands.
(3) Encourage small firm associations and small business incubators. Only one of four small
enterprises reports membership in an industry association.152 This figure is relatively low
because the benefits of membership appear to be relatively limited. For example, access to
151
Kweka, J. (2013). 152
Source: Ministry of Trade and Industry, MSMEs Survey, 2013.
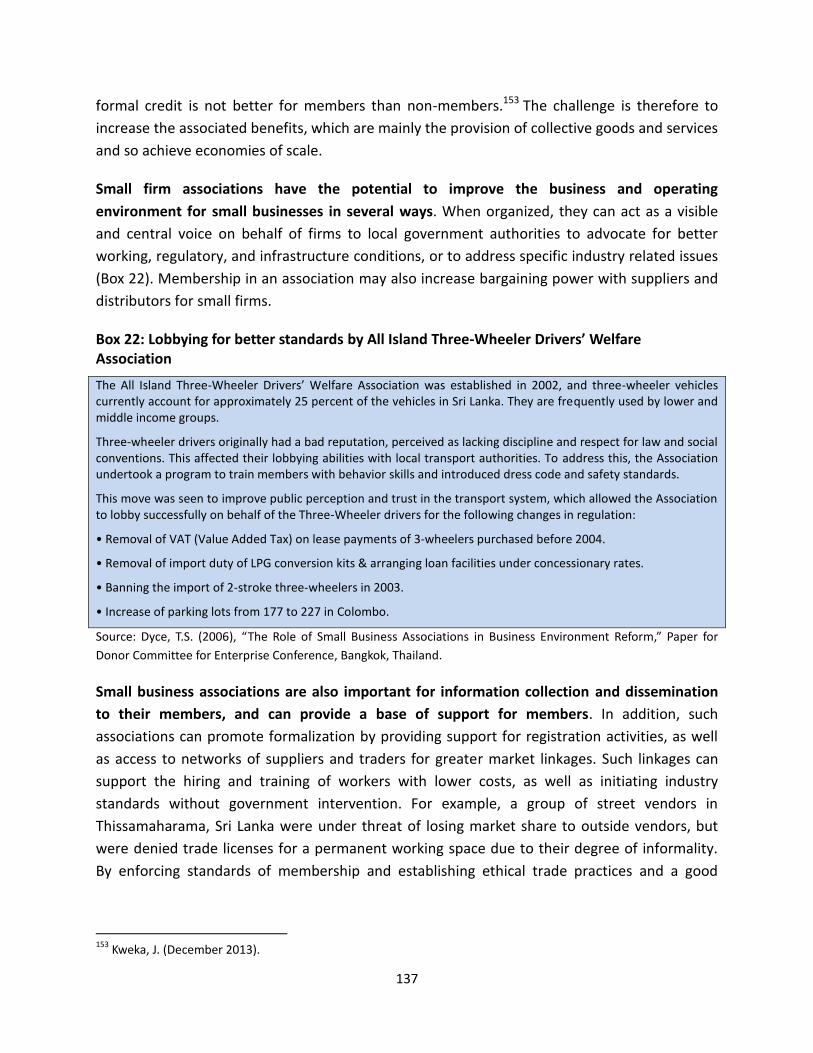
137
formal credit is not better for members than non-members.153 The challenge is therefore to
increase the associated benefits, which are mainly the provision of collective goods and services
and so achieve economies of scale.
Small firm associations have the potential to improve the business and operating
environment for small businesses in several ways. When organized, they can act as a visible
and central voice on behalf of firms to local government authorities to advocate for better
working, regulatory, and infrastructure conditions, or to address specific industry related issues
(Box 22). Membership in an association may also increase bargaining power with suppliers and
distributors for small firms.
Box 22: Lobbying for better standards by All Island Three-Wheeler Drivers’ Welfare Association
The All Island Three-Wheeler Drivers’ Welfare Association was established in 2002, and three-wheeler vehicles currently account for approximately 25 percent of the vehicles in Sri Lanka. They are frequently used by lower and middle income groups.
Three-wheeler drivers originally had a bad reputation, perceived as lacking discipline and respect for law and social conventions. This affected their lobbying abilities with local transport authorities. To address this, the Association undertook a program to train members with behavior skills and introduced dress code and safety standards.
This move was seen to improve public perception and trust in the transport system, which allowed the Association to lobby successfully on behalf of the Three-Wheeler drivers for the following changes in regulation:
• Removal of VAT (Value Added Tax) on lease payments of 3-wheelers purchased before 2004.
• Removal of import duty of LPG conversion kits & arranging loan facilities under concessionary rates.
• Banning the import of 2-stroke three-wheelers in 2003.
• Increase of parking lots from 177 to 227 in Colombo.
Source: Dyce, T.S. (2006), “The Role of Small Business Associations in Business Environment Reform,” Paper for
Donor Committee for Enterprise Conference, Bangkok, Thailand.
Small business associations are also important for information collection and dissemination
to their members, and can provide a base of support for members. In addition, such
associations can promote formalization by providing support for registration activities, as well
as access to networks of suppliers and traders for greater market linkages. Such linkages can
support the hiring and training of workers with lower costs, as well as initiating industry
standards without government intervention. For example, a group of street vendors in
Thissamaharama, Sri Lanka were under threat of losing market share to outside vendors, but
were denied trade licenses for a permanent working space due to their degree of informality.
By enforcing standards of membership and establishing ethical trade practices and a good
153
Kweka, J. (December 2013).
138
reputation, the Street Vendors Association enabled these informal street vendors to obtain
trade licenses from the Local Authorities in order to establish permanent trade stalls.154
Small firm associations need support from the government for many reasons. First, firms are
also competitors and may not collaborate efficiently without a neutral broker. Second, most
small firms do not have sufficient human and financial resources to finance associations.
Further, there is always a risk of free-riders, pushing others to invest less in collective actions.
Therefore, the Government should consider assistance to these associations so that they can
get organized and acquire skills. This would, in turn, enable associations to provide financial
competence, information, and dispute resolution services to their members.
Economies of scale for small firms can also be fostered by business incubators. These provide
a protected environment for business start-ups in a specific location, and include access to
financial assistance, advisory services, subsidized workspace and administrative assistance, and
access to business networks. While there are a number of external factors that affect the
likelihood of business success, the evidence suggests that the successful completion of a
business incubation program increases the chances of business survival as well as reduces the
cost of services provided to SMEs. 155 There are several business incubator programs currently
in place in Africa (see Box 23 for examples).
Box 23: Featured Business Incubators in Africa
154
Dyce, T.S. (2006). 155
Buys, A.J. (October 2007), “Key success factors for business incubation in South Africa: the Godisa case study,” South African Journal of Science, Vol 103:9-10.
Incubators and accelerators, though in their infancy in Africa, have demonstrated some success. See below for examples:
South Africa: South Africa has over 20 incubators supporting entrepreneurs in sectors as diverse as horticulture, construction, chemicals, ICT, biotechnology, metal fabrication, furniture manufacturing, and platinum beneficiation. Most are supported by the national government and to a lesser extent by provincial and local governments. The South African Business and Technology Incubator Association (SABTIA) was formed by incubator professionals and has since become an organization representing incubators in southern Africa.
Ghana: BusyInternet, an urban business incubator founded around an internet café, provides business services and office space rentals to local entrepreneurs. In a country where business premises require a three-year up-front rental payment, BusyInternet enables entrepreneurs to start businesses with minimal financial resources and reduced risk. Access to facilities, connectivity, and support services, as well as the possibility to interact with other entrepreneurs, are some of the basic obstacles that business incubators help fledgling entrepreneurs overcome.
Angola: Initiated in 2005 by the National Institute for Employment and Vocational Training (INEFOP), the incubator serves as a one-stop business service center with offerings such as training workshops in entrepreneurship, business advisory and consulting services, credit facilitation, linkage and referrals. This
139
Source: InfoDev (2013), “Business Incubation in Sub-Saharan Africa,” Document No. 325.
Sector Focus: Light manufacturing —Leather
The focus of this section is to delve into the potential of the leather industry as one that has
been identified with high growth potential; however, it is worth stepping back to note that
the prospect for growth of small firms lies in many different sectors. The opportunities that
arise in each economy are sometimes spontaneous, idiosyncratic and not necessarily
predictable nor visible in the catalyst stages. Often, such opportunities are driven by a
combination of individual, economic and cultural factors. While small and informal firms have
several barriers that reduce the likelihood of growth, some niche industries are able to gain
traction and spur growth simultaneously along the value chain of the industry. An example of
one such industry in Tanzania is the movie industry (see Box 24), which illustrates how growth
presents multiple opportunities for development and job creation.
Box 24: Swahiliwood- Tanzania’s movie industry as a growing niche
The Tanzanian film industry is a nascent and largely informal industry, but one that is fast-growing and gaining popularity within the Tanzanian population. Until about six years ago, the industry was dominated by the distribution of pirated films from Hollywood, Bollwood, and Nollywood, but has since moved towards domestic production of movies in the Kiswahili language. Currently, there are about 10 new low-budget movies produced per week in Tanzania, and about 4-6 that are released into the market, which also includes Swahili speaking countries within the East African Community. Production: There are about 50 independent producers in Tanzania, of which 70 percent are based in Dar es Salaam. Most production companies consist of one producer, while other crewmembers are hired on a freelance basis. Often, producers play multiple roles (acting, directing, editing, etc.) to reduce costs. A typical production house can produce a finished low budget/low quality film in a short period of time, often even less than one week. The cost of production for a budget film is also low, typically costing less than US$ 5,000. Distribution: While there are about 24 small distributors in the market, there is one leading distributor, Steps Entertainment, which has a quasi-monopoly on distribution networks around the country, and its own chain of wholesale outlets. Distributors play multiple roles along the value chain of movie production and distribution. They often invest in films prior to production, and are responsible for PR, advertising, and duplication costs and services. However, distribution companies typically purchase the film and all film rights in a lump sum payment instead of a royalty arrangement. This means that the producer does not see benefits from the number of DVDs sold or, in the opposite scenario, does not bear the loss. Films are bought from producers at rates ranging from US$ 800 – 11,500, and these films are marketed via SMS, poster advertising, and wholesale distribution networks across the country.
incubator focuses particularly on youth in the context of a post-conflict environment.
Rwanda: Established by the Kigali Institute of Science and Technology, the Technology and Business Incubation Facility (TBIF) provides office space, shared resources and a seed-financing scheme to 20 incubatees, many of whom are young students from its academic community. The overall objective of TBIF is to integrate ICT across incubator and incubatee business processes in order to enhance the outcomes, impact and outreach of TBIF to the target community of graduates.

140
There is currently little competition in distribution, partly because fixed costs are relatively high. Margins do not appear too high, as DVDs are typically sold between US$ 1-2. However, perhaps as the result of success, there are initiatives underway to promote greater competition and introduce a royalty-based system with another smaller but fast growing distributor called Proin Promotions Ltd. Target audience: There about 10,000 video exhibition halls (Bandas) and approximately 25,000 video rental libraries across the country that mainly target lower income segments of the population. The cost to rent a movie from an outlet is approximately TZS 500 (US$ 0.31) while the cost to watch a movie in a Banda is TZS 100-200 (US$ 0.06 - 0.13). With an average of approximately 62 customers per day, a Banda makes revenues of approximately TZS 12,000 per day (US$ 7.50). Potential for growth and capacity building: Currently, low margins and low quality characterize the Tanzanian film industry. However there is potential for greater organization, growth, and better quality production as audiences demand better firms, and as Tanzanian films expand into regional markets. Within this fast growing but niche industry, there are some potential opportunities for building industry infrastructure, and creating jobs along the value chain. Potential demand appears high since 76 percent of outlet owners that were interviewed cited three-fold growth of their outlets in the last 3 years. The industry suffers, however, from several bottlenecks ranging from low technical capacity, and relatively high marketing and distribution costs. These bottlenecks can be addressed by the following measures: 1. Capacity building efforts are critical for growth within the film industry. Currently, there is a clear demand and a varied audience for Tanzanian-produced film and media ; however technical capacity, funding, equipment and film education is missing. Through education, technical training, and support of the industry by the government/ donors, these skills can be nurtured to promote the growth of Tanzanian talent in acting and production. Media for Development International is an example of a NGO that is currently working to incubate such talent through the use of donor funds to produce socially conscious programming, while nurturing local acting and technical production skills to produce high quality Tanzanian films.
2. There is also space to introduce competition at the intermediary levels of distribution, as currently, distributors play multiple roles along the value chain. This could be fulfilled by the entry of specialized private marketing firms, transporters, and the growth of private outlets, which would encourage greater competition and growth within the industry.
3. Technology changes from DVD format to other platforms may also spur growth, as these changes can lower costs and diversify distribution channels, as well as reach more customers. Currently, the DVDs are distributed by extensive intermediary networks that include costs of transportation (bus/train networks) and time. However, with the growth of the internet as well as mobile payment platforms, it is possible to foresee a reduction in time as well as costs of distribution with more instantaneous delivery of films to sales outlets and end customers.
4. Partnerships with other forms of media (i.e., mobile phone companies) might also serve to help dissemination and lower distribution costs as media companies can use their own networks for advertising purposes. This would introduce more competition in the distribution market, foster growth of synergistic partnerships in the private sector, as well as provide more choice for producers looking to promote their films.
5. The creation and support of producer associations is important for producers to help overcome barriers involved in the process of commercialization of their films. Small business associations have been shown to be effective in facilitating regulatory changes and creating standards, however, it is critical for producers to be able to work together to advance shared agendas such as the introduction of a royalty-based system to retain intellectual property rights as well as financially benefit from the popularity of their films. In addition, such associations would facilitate the sharing of market information, creating shared industry norms, as well as informing on technical production techniques.
6. The government also has an important role to play in terms of introducing standards, greater structure,
141
and law and regulation to inform industry practices. They can also assist with facilitating the flow of information within the industry, and encouraging the process of formalization for greater transparency and competition within the film industry.
Source: (1) Kamin, Louise, “Swahiliwood: A Platform for Enter-Educate Feature Films”, MFDI, September 2011 (2)
Interviews with MFDI creative staff and founder, John Riber.
While there is promise in emerging sectors such as in the production of movies for the
domestic and regional markets, the leather industry might offer a relatively short-term
opportunity for growth. The light manufacturing sector exemplifies many of the issues
highlighted in actions 1-4, but has strong potential for growth, particularly in leather, if decisive
actions are taken. Tanzania has several national and economic advantages that favor light
industrial development, including low labor costs, rich natural resources, a growing domestic
market, and preferential access to major global markets. In principle, the availability of many
different inputs, ranging from cotton to wood and precious minerals, should attract domestic
and foreign investors.
Tanzania also has the third largest livestock population in Africa (after Sudan and Ethiopia)
and has the potential to produce about 2.6 million hides and 2.6 million skins annually. The
country also has a cost advantage in production as compared to a country like China. For
example, this cost advantage is estimated around US$ 2.2 for a US$ 18 pair of shoes compared
to China (Box 25). This cost advantage could be further used to feed the potential regional and
international demand (preferential access to major industrial countries). Tanzania also has a
large domestic market.
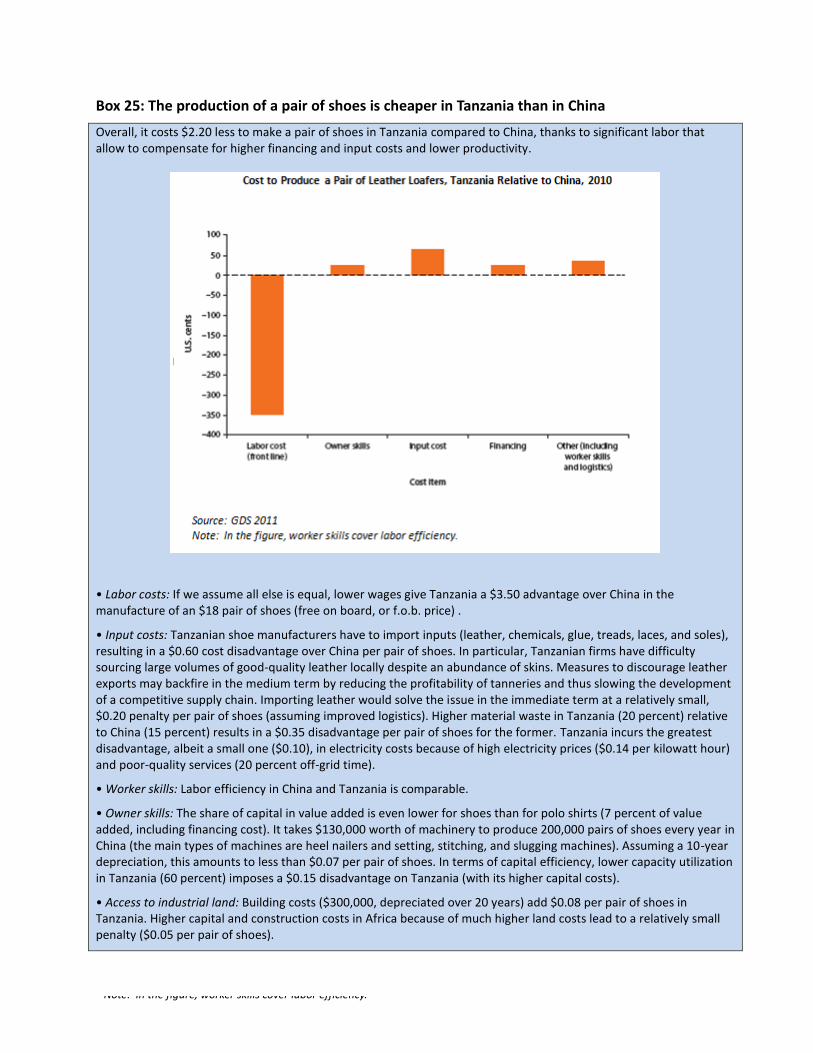
142
Cost to Produce a Pair of Leather Loafers, Tanzania Relative to China, 2010
Source: GDS 2011 Note: In the figure, worker skills cover labor efficiency.
Box 25: The production of a pair of shoes is cheaper in Tanzania than in China
Overall, it costs $2.20 less to make a pair of shoes in Tanzania compared to China, thanks to significant labor that allow to compensate for higher financing and input costs and lower productivity.
• Labor costs: If we assume all else is equal, lower wages give Tanzania a $3.50 advantage over China in the manufacture of an $18 pair of shoes (free on board, or f.o.b. price) .
• Input costs: Tanzanian shoe manufacturers have to import inputs (leather, chemicals, glue, treads, laces, and soles), resulting in a $0.60 cost disadvantage over China per pair of shoes. In particular, Tanzanian firms have difficulty sourcing large volumes of good-quality leather locally despite an abundance of skins. Measures to discourage leather exports may backfire in the medium term by reducing the profitability of tanneries and thus slowing the development of a competitive supply chain. Importing leather would solve the issue in the immediate term at a relatively small, $0.20 penalty per pair of shoes (assuming improved logistics). Higher material waste in Tanzania (20 percent) relative to China (15 percent) results in a $0.35 disadvantage per pair of shoes for the former. Tanzania incurs the greatest disadvantage, albeit a small one ($0.10), in electricity costs because of high electricity prices ($0.14 per kilowatt hour) and poor-quality services (20 percent off-grid time).
• Worker skills: Labor efficiency in China and Tanzania is comparable.
• Owner skills: The share of capital in value added is even lower for shoes than for polo shirts (7 percent of value added, including financing cost). It takes $130,000 worth of machinery to produce 200,000 pairs of shoes every year in China (the main types of machines are heel nailers and setting, stitching, and slugging machines). Assuming a 10-year depreciation, this amounts to less than $0.07 per pair of shoes. In terms of capital efficiency, lower capacity utilization in Tanzania (60 percent) imposes a $0.15 disadvantage on Tanzania (with its higher capital costs).
• Access to industrial land: Building costs ($300,000, depreciated over 20 years) add $0.08 per pair of shoes in Tanzania. Higher capital and construction costs in Africa because of much higher land costs lead to a relatively small penalty ($0.05 per pair of shoes).

143
• Financing costs: On the basis of the same assumptions as in the case of apparel, we find that the higher financing costs in Tanzania incur only a $0.25 disadvantage per pair of shoes because the share of capital is small: a $500,000 investment (including $300,000 for the premises) for a plant that can produce 200,000 pairs of shoes a year.
• Trade logistics costs: No information is available on this constraint because Tanzania does not export shoes.
• Overhead and regulatory costs (such as taxes): China shows lower overhead costs because of clustering within industrial parks. Tanzania does not export loafers; so, no information is available on product quality, delivery, and brand and firm reputation.
Source: Dinh, H. and C. Monga (2013).
The Tanzanian’s leather industry, in spite of those advantages, is nonetheless in disarray. The
value chain is broken, and there is only a small downstream production industry. Tanzania has
failed to capitalize on this potential comparative advantage, since manufacturing activities have
(at best) stagnated over the past few years with large trade deficits in sectors with latent
comparative advantage, incomplete domestic value chains, and small manufacturing
enterprises. About three-quarters of locally produced raw hides and skins are now exported,
and 95 percent of the remainder is exported after some processing. Only a small share of the
raw material reaches the high-value segment of the production chain (finished leather, leather
footwear, and other leather products), and the few small companies still active in this segment
produce mainly for the local market, leaving Tanzania with a large trade deficit in the leather
products market.
The main issues faced by this sector are found at the input level. The hides and skins produced
in Tanzania are of poor quality, which forces processing firms to import leather at higher costs.
The poor quality of domestic inputs is embedded in many reasons. In Tanzania’s pastoral
smallholder system, farmers keep livestock mainly for milk and meat. The production of high-
quality hides and skins is not a goal in itself since only 10 percent of the overall country
livestock is marketed. Up to 52 percent of livestock owners did not get any cash income out of
their animals in 2011. To maximize milk and meat production, farmers keep their animals as
long as possible; so, by the time the animals are slaughtered, the skins have suffered extensive
damage. In addition, pre-slaughter defects account for about 40 percent of all defects among
hides and skins. The production of hides and skins also suffer from multiple issues:
Poor animal husbandry practices
Inadequate disease control;156
Lack of appropriate slaughtering skills, practices, and equipment;
Poor storage and preservation techniques;
Lack of grading of raw hides and skins.
156
With less than 30 percent of owners reporting having vaccinated their livestock over the previous 12 months, morbidity rates of cattles and goats were 42 and 29 percent respectively in 2010/11.
144
When hides and skin reach the market, about three-quarters of them are exported in raw form;
including roughly one-third smuggled illegally through Kenya and Uganda to avoid the export
tax. The main destinations of all exports are China and Pakistan. The incentives to export are
reduced because the (high) export tax cuts into profit margins, and grading and marketing
arrangements lack transparency.
Tanzania has great potential for expanding the leather products sector if production
constraints can be eased along the supply chain. Policy recommendations are as follows:
(1) Improve quality (skills and standards) of skins and hides. This can be done by taking the
following actions:
(i) Instituting vaccination programs to reduce diseases
(ii) Building storage capacity to improve preservation
(iii) Improving the legal and regulatory framework: The government is currently revising the
1963 Hides and Skins Trade Act, and the new legislation should establish a grading and
market information system on prices to ensure that farmers receive fair price for hides
and skins. Enforcement mechanisms should be strengthened for regulations on
slaughtering, preserving, and transporting livestock. Well-trained independent
inspectors and collection center graders are also important and should be encouraged.
(2) Provide technical assistance to livestock owners, through associations. To assist owners,
the government should facilitate the enhancement of extension services, particularly in
crossbreeding, disease control, slaughtering, preservation, and quality improvement,
including in hides and skins. Donor support will be needed to launch and run these
programs. The sector associations in Tanzania should represent the interests of their
members in dialogues with the government and other stakeholders and provide services to
their members, such as training and information. However, their current institutional
capacity and financial resources are limited.
(3) Promote new investment in clusters. Investment in new technology in leather tanning and
products is essential if the industry is to be renewed. Foreign direct investment (FDI),
preferably in cooperation with local companies, should be encouraged, and industrial
clusters should be formed for the leather industry. This should be supplemented by training
in entrepreneurship and in management, technical, and design skills. Specific cluster
locations (agglomeration effects down the chain) should be favored, building on the
existence of 3 firms in Dar and 7 firms in Moshi/Arusha (out of 17 firms). Concurrently,
encouraging the establishment of modern slaughterhouses would vastly improve the
offtake ratio.
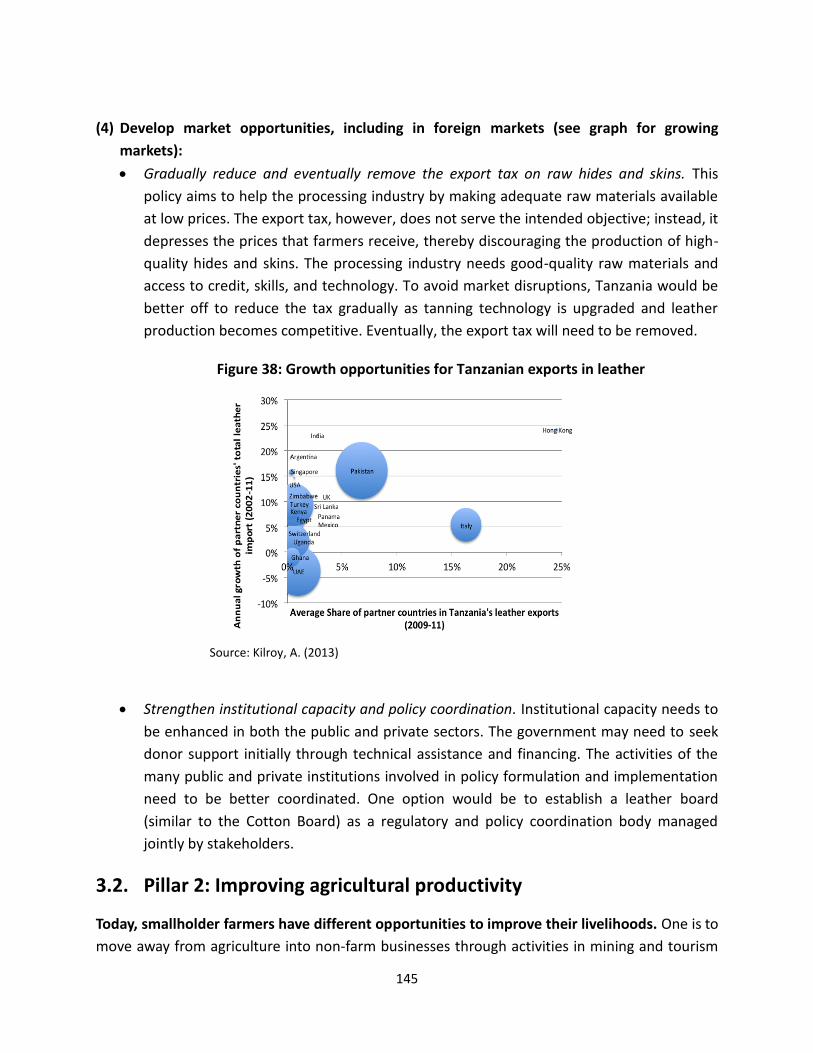
145
(4) Develop market opportunities, including in foreign markets (see graph for growing
markets):
Gradually reduce and eventually remove the export tax on raw hides and skins. This
policy aims to help the processing industry by making adequate raw materials available
at low prices. The export tax, however, does not serve the intended objective; instead, it
depresses the prices that farmers receive, thereby discouraging the production of high-
quality hides and skins. The processing industry needs good-quality raw materials and
access to credit, skills, and technology. To avoid market disruptions, Tanzania would be
better off to reduce the tax gradually as tanning technology is upgraded and leather
production becomes competitive. Eventually, the export tax will need to be removed.
Figure 38: Growth opportunities for Tanzanian exports in leather
Source: Kilroy, A. (2013)
Strengthen institutional capacity and policy coordination. Institutional capacity needs to
be enhanced in both the public and private sectors. The government may need to seek
donor support initially through technical assistance and financing. The activities of the
many public and private institutions involved in policy formulation and implementation
need to be better coordinated. One option would be to establish a leather board
(similar to the Cotton Board) as a regulatory and policy coordination body managed
jointly by stakeholders.
3.2. Pillar 2: Improving agricultural productivity
Today, smallholder farmers have different opportunities to improve their livelihoods. One is to
move away from agriculture into non-farm businesses through activities in mining and tourism
146
(the creation of employment in tourism activities is explored further in Pillar 3). Another option
is to migrate to cities, including secondary agglomeration and Dar es Salaam. A recent study
found that migration to rural towns and secondary cities has been a successful strategy for rural
households.157 For farmers who remain in agricultural activities, it is possible to: (i) diversify
from crops to non-crop related activities such as rearing livestock (explored in leather example
in Pillar 1); (ii) transition from traditional to non-traditional high value crops (explored later in
this section); and (iii) move away from farming-intensive activities towards transformation and
commercialization along the value chain.
In this pillar, the emphasis is on improving agricultural productivity, particularly through
commercialization. There is strong evidence that opportunities for commercialization will
provide incentives for farmers to become more productive, which in turn will lead them to
expand their production and to employ more workers. Commercialization will also generate
further employment opportunities along the value chain, notably in transports and packaging as
well as in processing. . For example, it has been found in countries as diverse as Madagascar,
Colombia and Guinea that farmers connected to markets are up to twice as productive as
isolated ones. In Tanzania, regions with the highest level of connectivity and the greatest
opportunity for commercialization have also been the most productive. This evidence suggests
that increased income for farmers can be achieved through a combination of incentives and
actions aimed at encouraging market access and higher productivity. This calls for four actions
that apply to all agricultural producers, and a focus on the high-value fruit and vegetable sector:
Action 5: Improve connectivity and market access
Action 6: Enhance the use of quality inputs
Action 7: Promote equity and efficiency through market-based mechanisms
Action 8: Ensure transparency and consistency in Government policies
Sector Focus: Agribusiness—High-value fruits and vegetables
These actions are not necessarily new for Tanzanian policymakers who have integrated them
through various initiatives at different points in time. However, we encourage a
comprehensive reform program rather than a prioritization of any one action to address the
development of income and employment growth through agricultural production. In particular,
it is critical to combine the actions proposed effectively for developing agricultural production.
For example, stimulating the adoption of improved inputs by subsidies might be a waste of
public resources if farmers are then penalized by roadblocks and excessive taxation. The
priorities will also differ depending on variations in crops and locations. In some regions, water
157
Christiaensen, L., De Weerdt, J. and Todo, I. (2013), “Urbanization and Poverty Reduction. The Role of Rural Diversification and Secondary Towns.” Policy Research Working Paper 6422, World Bank, Washington DC.
147
management is the main issue, while in other areas, transportation costs are a higher
constraint. These examples illustrate the need for authorities to think flexibly and to be
responsive to context in the formulation and implementation of policy to achieve these
objectives.
The role for government in these interventions is also not advocated for as a direct role (such as
implementation of the National Agricultural Voucher Scheme (Box 29)), but rather as a
regulator, as well as supporter and investor in market-based instruments, such the PPP
arrangement for the development of the Southern Agricultural Growth Corridor of Tanzania
(Box 34), and promoting the use of mobile phone technology and farming contracts for the
growth of smallholder communities (see Action 7). Below are a number of actions for policy
reform in this context.
Action 5: Improve connectivity and market access
Today, on average, a Tanzanian farmer is 32.5 km away from the nearest market place, with
poor road infrastructure, inadequate transportation and poor links to other farmers. These
high logistical costs paired with low volume transactions prevent the emergence of economies
of scale. This largely explains the absence of large wholesalers and traders in many rural areas.
For many small farmers, gaining access to markets remains a remote possibility. Even when
wholesalers and traders visit their locations, they pay low prices to farmers because of high
fixed costs that reduc their margins. Partly for this reason, the Government has often played a
direct role by buying grain (National Food Reserve Agency) or setting floor prices (cashew).
However there is a role for both government and partnerships with the private sector improving
connectivity and market access for farmers.
Moreover, traders may take advantage of their dominant position relative to small farmers.
Small farmers are generally not well informed about market prices and have little bargaining
power. This lack of bargaining power explains findings which show that poor producers of maize
and sorghum receive a farm-gate price that is 30 and 80 percent lower, respectively, than that
paid to wealthier farmers. Another example is that farm-gate prices were on average 30 percent
lower for Tanzanian coffee farmers in Kagera compared to farmers operating in an adjacent
valley in Uganda Rakai in 2008-10.158
To address these inefficiencies, we propose the following actions:
(i) Improve rural roads, reduce costs of transportation, and increase and connective
infrastructure through public-private partnerships.
158
Tanzania Economic Update: Issue2 (October 2012).
148
(ii) Support small farmers and promote economies of scale by increasing the volume of
transactions through greater storage capacity and cost-sharing mechanisms.
(iii) Promote competition among traders through better dissemination of market
information and regulation.
(1) The lack of adequate roads is perceived as the most significant problem by rural
households.159 The road network is limited and the quality of roadwork is also often extremely
poor in Tanzania, with only an estimated five percent of the road network being in good
condition.160 In addition, only 0.8 percent of Tanzanian farmers own a truck or a car to transport
their output.
Low transportation cost is critical to help increase the level of commercialization of
agriculture. The propensity of Tanzanian rural households to commercialize is higher when they
are closer to a road. Similar results were found in Colombia where a reduction in transit time led
to a 50 to 200 percent improvement in yields. Not only do lower transports costs help farmers
to transport their products from the farm to markets, but they enable sellers to reach them
more effectively. These combined effects create a virtuous circle; better access to markets and
inputs increasing productivity and income which in turn provides traders with greater incentives
to meet the needs of farmers through the provision of inputs, which in turn results in further
increases in productivity.
Improving farmers’ connectivity requires an improvement of rural roads. Since 2008, the
Government has placed increased emphasis on road building and maintenance, and the budget
allocation for roads has increased fivefold, reaching TZS 2.1 trillion in the 2011/12 budget. This
is good news because investments in the building and rehabilitation of rural roads probably
offer the highest rates of return, at least for public investment projects. In terms of
transportation costs, it is often the ‘final mile’ connecting primary producers to networks that is
most significant. While the unit cost of building and maintaining those roads is relatively low,
the number and extent of roads required is so vast that the government will have to prioritize
expenditure in this area. In the determination of priorities, the authorities should focus on
locations where roads are expected to produce the largest short term positive impact so that
the support for road building is consolidated through a demonstration of its benefits. A number
of clusters have already been identified by the government. However, authorities should also
balance their expenditure on new roads with investments in the maintenance of the existing
road system (see Box 26 for the Ethiopian experience).
159 Source: REPOA (December 2007), Presentation: Views of the People, Government of Tanzania. 160
Wane, W. and I. Gaddis (2013).
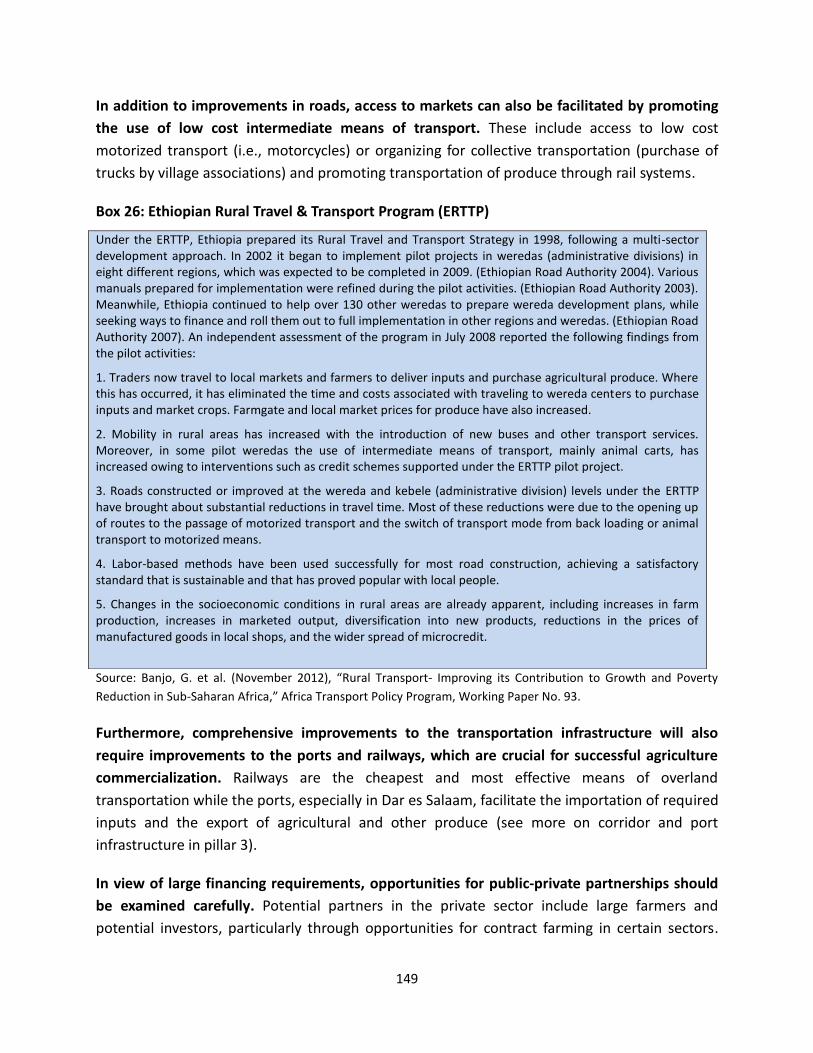
149
In addition to improvements in roads, access to markets can also be facilitated by promoting
the use of low cost intermediate means of transport. These include access to low cost
motorized transport (i.e., motorcycles) or organizing for collective transportation (purchase of
trucks by village associations) and promoting transportation of produce through rail systems.
Box 26: Ethiopian Rural Travel & Transport Program (ERTTP)
Source: Banjo, G. et al. (November 2012), “Rural Transport- Improving its Contribution to Growth and Poverty
Reduction in Sub-Saharan Africa,” Africa Transport Policy Program, Working Paper No. 93.
Furthermore, comprehensive improvements to the transportation infrastructure will also
require improvements to the ports and railways, which are crucial for successful agriculture
commercialization. Railways are the cheapest and most effective means of overland
transportation while the ports, especially in Dar es Salaam, facilitate the importation of required
inputs and the export of agricultural and other produce (see more on corridor and port
infrastructure in pillar 3).
In view of large financing requirements, opportunities for public-private partnerships should
be examined carefully. Potential partners in the private sector include large farmers and
potential investors, particularly through opportunities for contract farming in certain sectors.
Under the ERTTP, Ethiopia prepared its Rural Travel and Transport Strategy in 1998, following a multi-sector development approach. In 2002 it began to implement pilot projects in weredas (administrative divisions) in eight different regions, which was expected to be completed in 2009. (Ethiopian Road Authority 2004). Various manuals prepared for implementation were refined during the pilot activities. (Ethiopian Road Authority 2003). Meanwhile, Ethiopia continued to help over 130 other weredas to prepare wereda development plans, while seeking ways to finance and roll them out to full implementation in other regions and weredas. (Ethiopian Road Authority 2007). An independent assessment of the program in July 2008 reported the following findings from the pilot activities:
1. Traders now travel to local markets and farmers to deliver inputs and purchase agricultural produce. Where this has occurred, it has eliminated the time and costs associated with traveling to wereda centers to purchase inputs and market crops. Farmgate and local market prices for produce have also increased.
2. Mobility in rural areas has increased with the introduction of new buses and other transport services. Moreover, in some pilot weredas the use of intermediate means of transport, mainly animal carts, has increased owing to interventions such as credit schemes supported under the ERTTP pilot project.
3. Roads constructed or improved at the wereda and kebele (administrative division) levels under the ERTTP have brought about substantial reductions in travel time. Most of these reductions were due to the opening up of routes to the passage of motorized transport and the switch of transport mode from back loading or animal transport to motorized means.
4. Labor-based methods have been used successfully for most road construction, achieving a satisfactory standard that is sustainable and that has proved popular with local people.
5. Changes in the socioeconomic conditions in rural areas are already apparent, including increases in farm production, increases in marketed output, diversification into new products, reductions in the prices of manufactured goods in local shops, and the wider spread of microcredit.
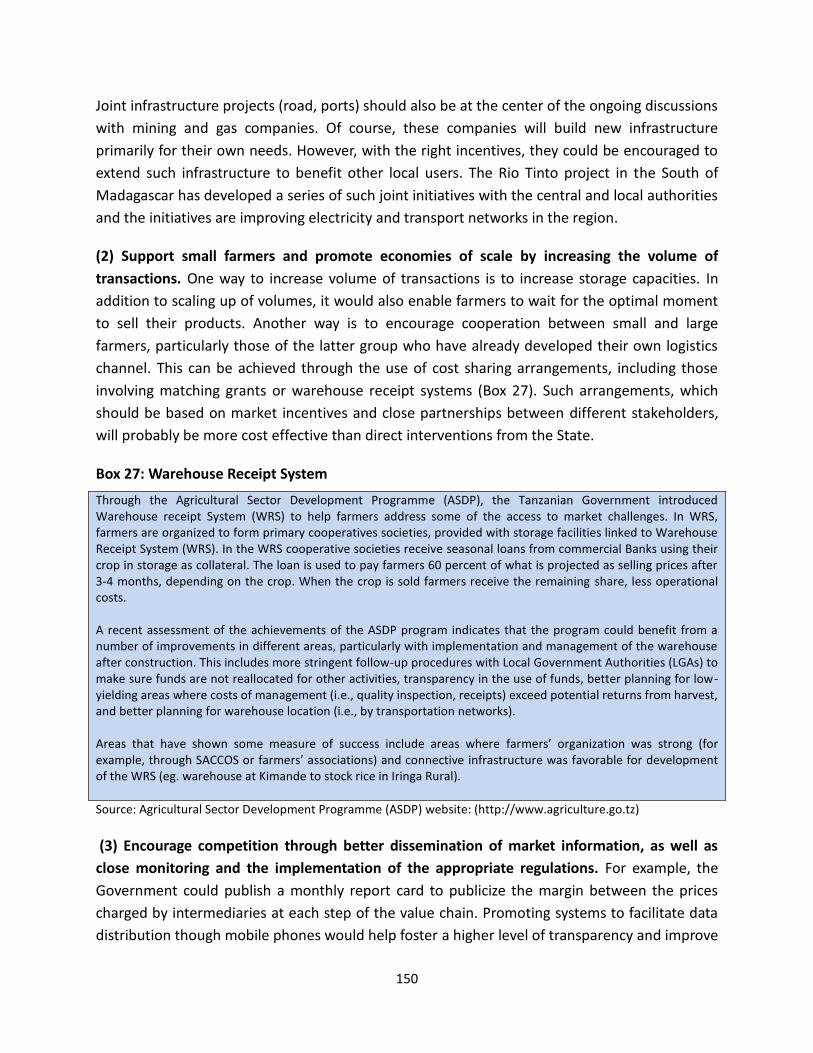
150
Joint infrastructure projects (road, ports) should also be at the center of the ongoing discussions
with mining and gas companies. Of course, these companies will build new infrastructure
primarily for their own needs. However, with the right incentives, they could be encouraged to
extend such infrastructure to benefit other local users. The Rio Tinto project in the South of
Madagascar has developed a series of such joint initiatives with the central and local authorities
and the initiatives are improving electricity and transport networks in the region.
(2) Support small farmers and promote economies of scale by increasing the volume of
transactions. One way to increase volume of transactions is to increase storage capacities. In
addition to scaling up of volumes, it would also enable farmers to wait for the optimal moment
to sell their products. Another way is to encourage cooperation between small and large
farmers, particularly those of the latter group who have already developed their own logistics
channel. This can be achieved through the use of cost sharing arrangements, including those
involving matching grants or warehouse receipt systems (Box 27). Such arrangements, which
should be based on market incentives and close partnerships between different stakeholders,
will probably be more cost effective than direct interventions from the State.
Box 27: Warehouse Receipt System
Through the Agricultural Sector Development Programme (ASDP), the Tanzanian Government introduced Warehouse receipt System (WRS) to help farmers address some of the access to market challenges. In WRS, farmers are organized to form primary cooperatives societies, provided with storage facilities linked to Warehouse Receipt System (WRS). In the WRS cooperative societies receive seasonal loans from commercial Banks using their crop in storage as collateral. The loan is used to pay farmers 60 percent of what is projected as selling prices after 3-4 months, depending on the crop. When the crop is sold farmers receive the remaining share, less operational costs. A recent assessment of the achievements of the ASDP program indicates that the program could benefit from a number of improvements in different areas, particularly with implementation and management of the warehouse after construction. This includes more stringent follow-up procedures with Local Government Authorities (LGAs) to make sure funds are not reallocated for other activities, transparency in the use of funds, better planning for low-yielding areas where costs of management (i.e., quality inspection, receipts) exceed potential returns from harvest, and better planning for warehouse location (i.e., by transportation networks). Areas that have shown some measure of success include areas where farmers’ organization was strong (for example, through SACCOS or farmers’ associations) and connective infrastructure was favorable for development of the WRS (eg. warehouse at Kimande to stock rice in Iringa Rural).
Source: Agricultural Sector Development Programme (ASDP) website: (http://www.agriculture.go.tz)
(3) Encourage competition through better dissemination of market information, as well as
close monitoring and the implementation of the appropriate regulations. For example, the
Government could publish a monthly report card to publicize the margin between the prices
charged by intermediaries at each step of the value chain. Promoting systems to facilitate data
distribution though mobile phones would help foster a higher level of transparency and improve

151
competition. Homogenous information is a primary condition to ensure fair trade. The
publication of such information would help reduce farmers’ perceptions that they are often
cheated by traders and would help to correct market imperfections.
To achieve better dissemination of information, it is necessary to define areas of
responsibility for the publication of this information. At present, it is not clear which regulatory
agency is responsible for monitoring and correcting market imperfections or abuse in marketing
channels in Tanzania. The Government should focus on demarcating information dissemination
and regulatory responsibilities and refrain from direct interventions in the logistical chain to the
fullest extent possible.
Action 6: Enhancing the use of quality inputs
The vast majority of farmers operating in Tanzania are smallholders who use obsolete
technology, barely producing enough to feed their household. As mentioned earlier, small
farmers lack modern tools, good seeds, fertilizers, and reliable irrigation schemes. The
immediate key target must therefore be to move these farmers ‘from hoe to plough’, utilizing
either animal-drawn or tractor services. In the medium term, if Tanzania wants to compete
internationally, farmers will have to (i) adopt the best new varieties for every major crop and (ii)
maximize the efficiency of fertilizer and water use. However, Tanzanian farmers do not need a
radical jump in productivity to gain additional income from agriculture. To illustrate, if their
average yields in maize were to reach those reported today in Zambia or in Vietnam, their level
of production would multiply by 1.7 or 2.9, respectively.
The government should first identify what inputs bring the most value for money to farmers,
harmonize regional quality standards for inputs, and make it easy for farmers to access them.
Therefore the following three actions are highlighted:
(1) Encourage adoption of high-value irrigation schemes. Water resources are important for
the expansion of agriculture, and increased competition for national water resources suggests
that efficiency with water use and storage (i.e., water harvesting) is critical for expansion
initiatives, particularly for irrigation activities. Recent experience seems to indicate that the
implementation of both large scale and localized simple irrigation schemes have been able to
boost yields, suggesting that this should remain a high priority for the government (Box 28). The
government should continue to sponsor both large scale as well as community-driven programs
to build new infrastructure in villages.
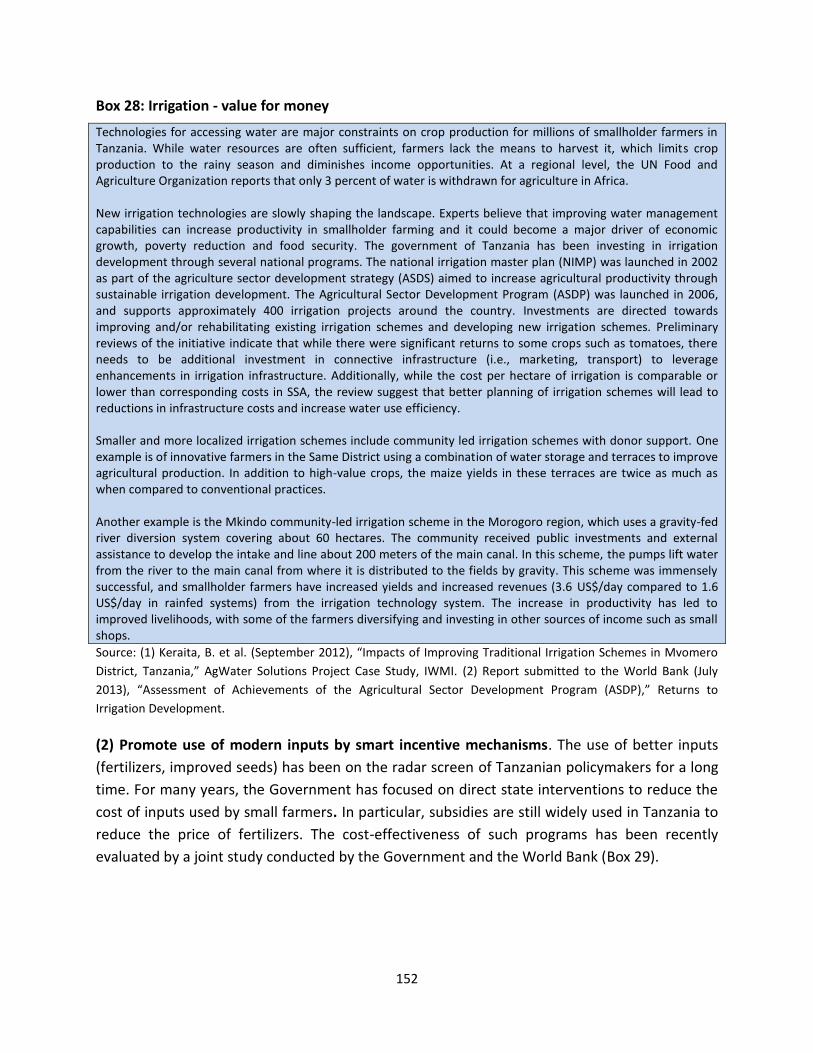
152
Box 28: Irrigation - value for money
Technologies for accessing water are major constraints on crop production for millions of smallholder farmers in Tanzania. While water resources are often sufficient, farmers lack the means to harvest it, which limits crop production to the rainy season and diminishes income opportunities. At a regional level, the UN Food and Agriculture Organization reports that only 3 percent of water is withdrawn for agriculture in Africa. New irrigation technologies are slowly shaping the landscape. Experts believe that improving water management capabilities can increase productivity in smallholder farming and it could become a major driver of economic growth, poverty reduction and food security. The government of Tanzania has been investing in irrigation development through several national programs. The national irrigation master plan (NIMP) was launched in 2002 as part of the agriculture sector development strategy (ASDS) aimed to increase agricultural productivity through sustainable irrigation development. The Agricultural Sector Development Program (ASDP) was launched in 2006, and supports approximately 400 irrigation projects around the country. Investments are directed towards improving and/or rehabilitating existing irrigation schemes and developing new irrigation schemes. Preliminary reviews of the initiative indicate that while there were significant returns to some crops such as tomatoes, there needs to be additional investment in connective infrastructure (i.e., marketing, transport) to leverage enhancements in irrigation infrastructure. Additionally, while the cost per hectare of irrigation is comparable or lower than corresponding costs in SSA, the review suggest that better planning of irrigation schemes will lead to reductions in infrastructure costs and increase water use efficiency. Smaller and more localized irrigation schemes include community led irrigation schemes with donor support. One example is of innovative farmers in the Same District using a combination of water storage and terraces to improve agricultural production. In addition to high-value crops, the maize yields in these terraces are twice as much as when compared to conventional practices. Another example is the Mkindo community-led irrigation scheme in the Morogoro region, which uses a gravity-fed river diversion system covering about 60 hectares. The community received public investments and external assistance to develop the intake and line about 200 meters of the main canal. In this scheme, the pumps lift water from the river to the main canal from where it is distributed to the fields by gravity. This scheme was immensely successful, and smallholder farmers have increased yields and increased revenues (3.6 US$/day compared to 1.6 US$/day in rainfed systems) from the irrigation technology system. The increase in productivity has led to improved livelihoods, with some of the farmers diversifying and investing in other sources of income such as small shops.
Source: (1) Keraita, B. et al. (September 2012), “Impacts of Improving Traditional Irrigation Schemes in Mvomero
District, Tanzania,” AgWater Solutions Project Case Study, IWMI. (2) Report submitted to the World Bank (July
2013), “Assessment of Achievements of the Agricultural Sector Development Program (ASDP),” Returns to
Irrigation Development.
(2) Promote use of modern inputs by smart incentive mechanisms. The use of better inputs
(fertilizers, improved seeds) has been on the radar screen of Tanzanian policymakers for a long
time. For many years, the Government has focused on direct state interventions to reduce the
cost of inputs used by small farmers. In particular, subsidies are still widely used in Tanzania to
reduce the price of fertilizers. The cost-effectiveness of such programs has been recently
evaluated by a joint study conducted by the Government and the World Bank (Box 29).
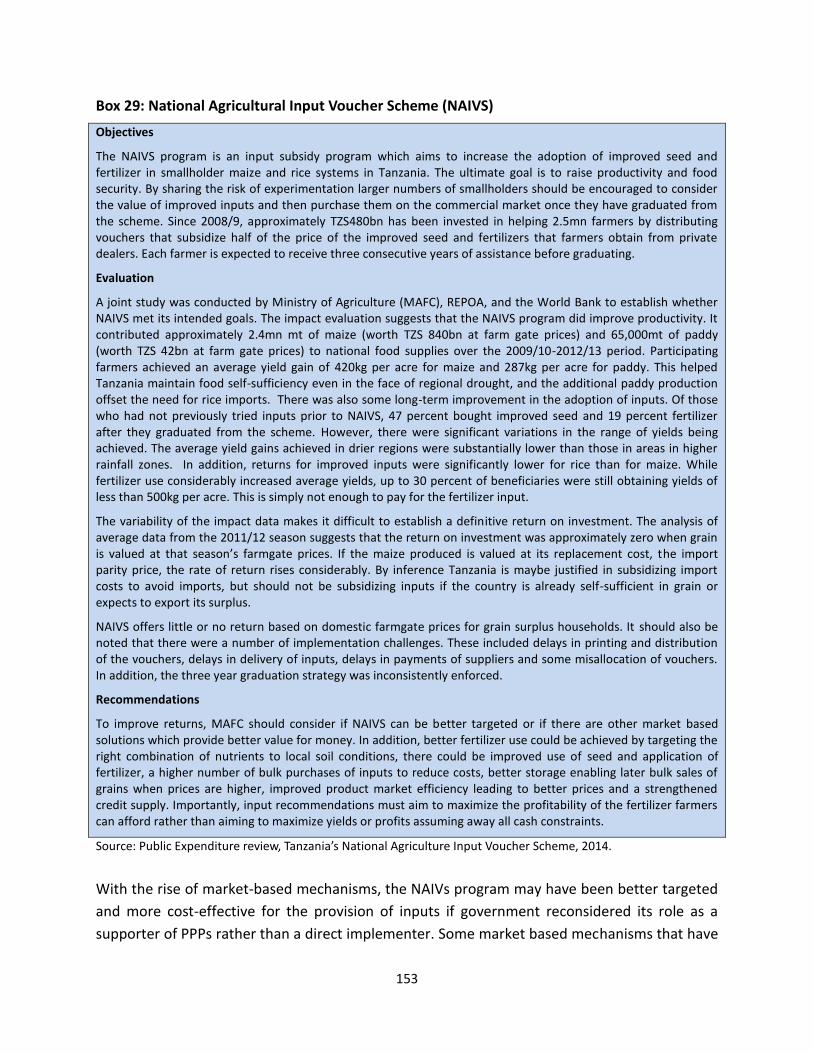
153
Box 29: National Agricultural Input Voucher Scheme (NAIVS)
Objectives
The NAIVS program is an input subsidy program which aims to increase the adoption of improved seed and fertilizer in smallholder maize and rice systems in Tanzania. The ultimate goal is to raise productivity and food security. By sharing the risk of experimentation larger numbers of smallholders should be encouraged to consider the value of improved inputs and then purchase them on the commercial market once they have graduated from the scheme. Since 2008/9, approximately TZS480bn has been invested in helping 2.5mn farmers by distributing vouchers that subsidize half of the price of the improved seed and fertilizers that farmers obtain from private dealers. Each farmer is expected to receive three consecutive years of assistance before graduating.
Evaluation
A joint study was conducted by Ministry of Agriculture (MAFC), REPOA, and the World Bank to establish whether NAIVS met its intended goals. The impact evaluation suggests that the NAIVS program did improve productivity. It contributed approximately 2.4mn mt of maize (worth TZS 840bn at farm gate prices) and 65,000mt of paddy (worth TZS 42bn at farm gate prices) to national food supplies over the 2009/10-2012/13 period. Participating farmers achieved an average yield gain of 420kg per acre for maize and 287kg per acre for paddy. This helped Tanzania maintain food self-sufficiency even in the face of regional drought, and the additional paddy production offset the need for rice imports. There was also some long-term improvement in the adoption of inputs. Of those who had not previously tried inputs prior to NAIVS, 47 percent bought improved seed and 19 percent fertilizer after they graduated from the scheme. However, there were significant variations in the range of yields being achieved. The average yield gains achieved in drier regions were substantially lower than those in areas in higher rainfall zones. In addition, returns for improved inputs were significantly lower for rice than for maize. While fertilizer use considerably increased average yields, up to 30 percent of beneficiaries were still obtaining yields of less than 500kg per acre. This is simply not enough to pay for the fertilizer input.
The variability of the impact data makes it difficult to establish a definitive return on investment. The analysis of average data from the 2011/12 season suggests that the return on investment was approximately zero when grain is valued at that season’s farmgate prices. If the maize produced is valued at its replacement cost, the import parity price, the rate of return rises considerably. By inference Tanzania is maybe justified in subsidizing import costs to avoid imports, but should not be subsidizing inputs if the country is already self-sufficient in grain or expects to export its surplus.
NAIVS offers little or no return based on domestic farmgate prices for grain surplus households. It should also be noted that there were a number of implementation challenges. These included delays in printing and distribution of the vouchers, delays in delivery of inputs, delays in payments of suppliers and some misallocation of vouchers. In addition, the three year graduation strategy was inconsistently enforced.
Recommendations
To improve returns, MAFC should consider if NAIVS can be better targeted or if there are other market based solutions which provide better value for money. In addition, better fertilizer use could be achieved by targeting the right combination of nutrients to local soil conditions, there could be improved use of seed and application of fertilizer, a higher number of bulk purchases of inputs to reduce costs, better storage enabling later bulk sales of grains when prices are higher, improved product market efficiency leading to better prices and a strengthened credit supply. Importantly, input recommendations must aim to maximize the profitability of the fertilizer farmers can afford rather than aiming to maximize yields or profits assuming away all cash constraints.
Source: Public Expenditure review, Tanzania’s National Agriculture Input Voucher Scheme, 2014.
With the rise of market-based mechanisms, the NAIVs program may have been better targeted
and more cost-effective for the provision of inputs if government reconsidered its role as a
supporter of PPPs rather than a direct implementer. Some market based mechanisms that have
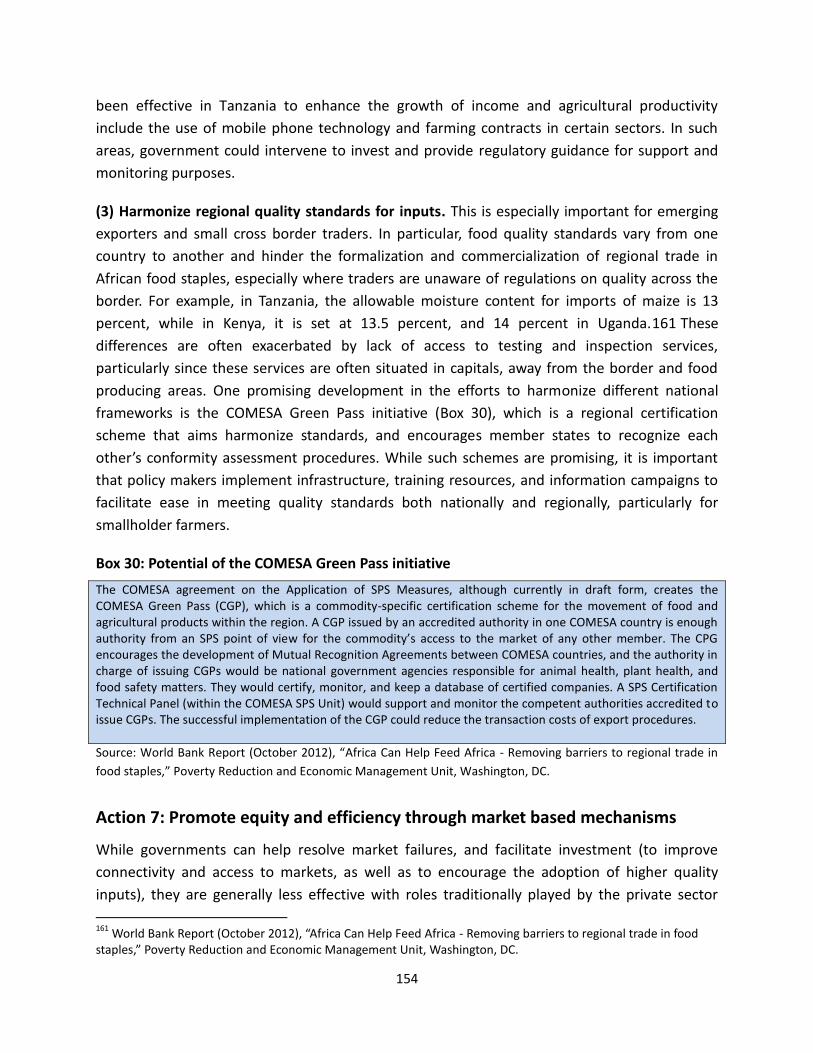
154
been effective in Tanzania to enhance the growth of income and agricultural productivity
include the use of mobile phone technology and farming contracts in certain sectors. In such
areas, government could intervene to invest and provide regulatory guidance for support and
monitoring purposes.
(3) Harmonize regional quality standards for inputs. This is especially important for emerging
exporters and small cross border traders. In particular, food quality standards vary from one
country to another and hinder the formalization and commercialization of regional trade in
African food staples, especially where traders are unaware of regulations on quality across the
border. For example, in Tanzania, the allowable moisture content for imports of maize is 13
percent, while in Kenya, it is set at 13.5 percent, and 14 percent in Uganda.161 These
differences are often exacerbated by lack of access to testing and inspection services,
particularly since these services are often situated in capitals, away from the border and food
producing areas. One promising development in the efforts to harmonize different national
frameworks is the COMESA Green Pass initiative (Box 30), which is a regional certification
scheme that aims harmonize standards, and encourages member states to recognize each
other’s conformity assessment procedures. While such schemes are promising, it is important
that policy makers implement infrastructure, training resources, and information campaigns to
facilitate ease in meeting quality standards both nationally and regionally, particularly for
smallholder farmers.
Box 30: Potential of the COMESA Green Pass initiative
The COMESA agreement on the Application of SPS Measures, although currently in draft form, creates the COMESA Green Pass (CGP), which is a commodity-specific certification scheme for the movement of food and agricultural products within the region. A CGP issued by an accredited authority in one COMESA country is enough authority from an SPS point of view for the commodity’s access to the market of any other member. The CPG encourages the development of Mutual Recognition Agreements between COMESA countries, and the authority in charge of issuing CGPs would be national government agencies responsible for animal health, plant health, and food safety matters. They would certify, monitor, and keep a database of certified companies. A SPS Certification Technical Panel (within the COMESA SPS Unit) would support and monitor the competent authorities accredited to issue CGPs. The successful implementation of the CGP could reduce the transaction costs of export procedures.
Source: World Bank Report (October 2012), “Africa Can Help Feed Africa - Removing barriers to regional trade in
food staples,” Poverty Reduction and Economic Management Unit, Washington, DC.
Action 7: Promote equity and efficiency through market based mechanisms
While governments can help resolve market failures, and facilitate investment (to improve
connectivity and access to markets, as well as to encourage the adoption of higher quality
inputs), they are generally less effective with roles traditionally played by the private sector
161
World Bank Report (October 2012), “Africa Can Help Feed Africa - Removing barriers to regional trade in food staples,” Poverty Reduction and Economic Management Unit, Washington, DC.
155
such as determining which commodity supply chains are more likely to be profitable. Instead,
the role of government is better suited to encourage more private sector investment with
particular support for those investments that have the potential to generate employment and
income growth for smallholder communities. In light of this, we propose two main market-
based mechanisms in order to enable farmers to obtain fair prices and get access inputs and a
number of other services, such as access to finance and information and training through
extension services. These mechanisms include: (i) promoting the use of mobile phones as a
means to deliver assistance and information to farmers; and (ii) contract farming.
(1) The Government should consider the use of mobile telephone technology as a means to
deliver assistance to farmers. Mobile phone use is widespread in Tanzania, with 50 percent of
people in rural areas now using them. While it is still too early to fully assess the impact of
these constantly evolving new technologies, the evidence suggests that ICT access has
beneficial impacts on smallholder farmers by enhancing spatial arbitrage and reducing price
dispersion through mechanisms such as greater marketing efficiency.162 Indeed, the use of cell
phones has shown some measure of success in parts of Tanzania such as Rungwe district,
where farmers have increased their levels of marketed production, and managed to sell at
higher prices with greater access to price information.163 This is consistent with findings in
Mozambique, Kenya and Uganda.164 New technology also enables small farmers to reach out to
markets. Recent initiatives have shown, for example, that the virtual distance between services
providers (banks and wholesalers) can be reduced significantly with these new communication
tools. In Sri Lanka, the partnership between CISCO and village communities contributed to the
connection of 1,000 villages in 2009. Such efforts should be supported by the government.
There are already a number of existing initiatives in Tanzania, and others are being implemented
in Kenya (see Box 31 for more details).
162
For a review of this literature, see Wane, W. and I. Gaddis (2013). 163
The reverse causality is also true since cell phone coverage is better in areas with higher population density, and so better market linkages. 164
For details, see Mwakaje, A. G. (2010), “Information and Communication Technology for Rural Farmers market Access in Tanzania,” Journal of Information Technology Impact, Vol. 10:2.
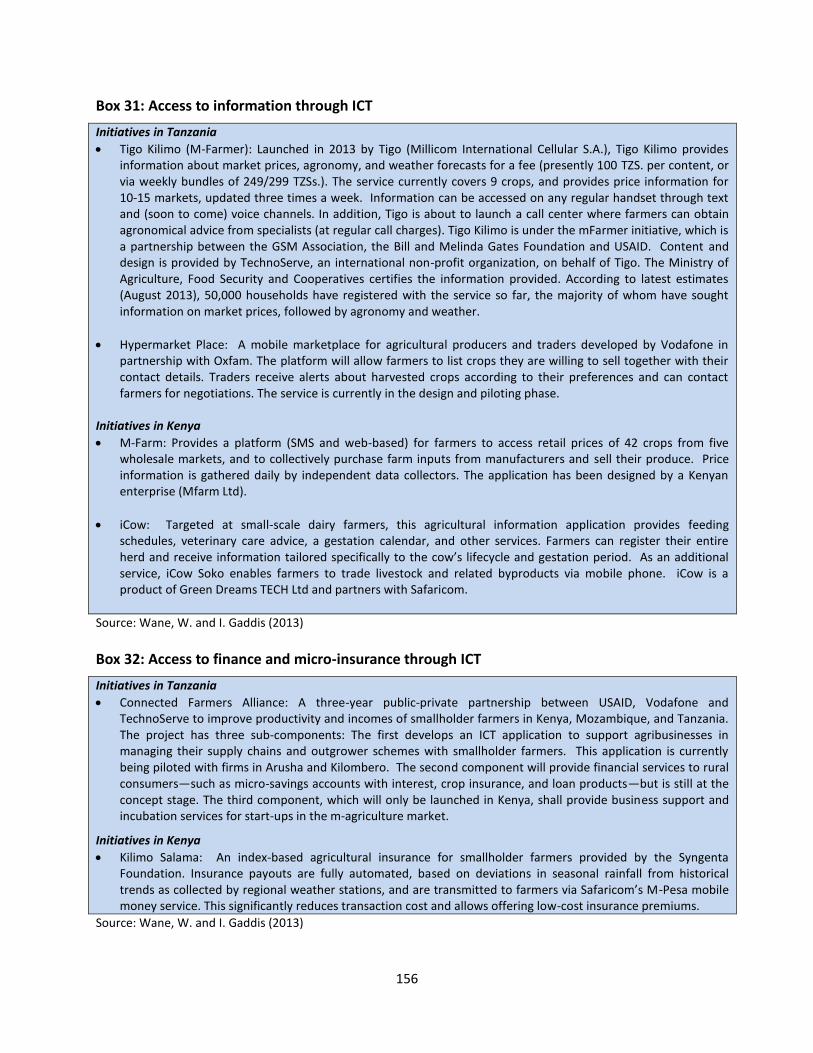
156
Box 31: Access to information through ICT
Initiatives in Tanzania
Tigo Kilimo (M-Farmer): Launched in 2013 by Tigo (Millicom International Cellular S.A.), Tigo Kilimo provides information about market prices, agronomy, and weather forecasts for a fee (presently 100 TZS. per content, or via weekly bundles of 249/299 TZSs.). The service currently covers 9 crops, and provides price information for 10-15 markets, updated three times a week. Information can be accessed on any regular handset through text and (soon to come) voice channels. In addition, Tigo is about to launch a call center where farmers can obtain agronomical advice from specialists (at regular call charges). Tigo Kilimo is under the mFarmer initiative, which is a partnership between the GSM Association, the Bill and Melinda Gates Foundation and USAID. Content and design is provided by TechnoServe, an international non-profit organization, on behalf of Tigo. The Ministry of Agriculture, Food Security and Cooperatives certifies the information provided. According to latest estimates (August 2013), 50,000 households have registered with the service so far, the majority of whom have sought information on market prices, followed by agronomy and weather.
Hypermarket Place: A mobile marketplace for agricultural producers and traders developed by Vodafone in partnership with Oxfam. The platform will allow farmers to list crops they are willing to sell together with their contact details. Traders receive alerts about harvested crops according to their preferences and can contact farmers for negotiations. The service is currently in the design and piloting phase.
Initiatives in Kenya
M-Farm: Provides a platform (SMS and web-based) for farmers to access retail prices of 42 crops from five wholesale markets, and to collectively purchase farm inputs from manufacturers and sell their produce. Price information is gathered daily by independent data collectors. The application has been designed by a Kenyan enterprise (Mfarm Ltd).
iCow: Targeted at small-scale dairy farmers, this agricultural information application provides feeding schedules, veterinary care advice, a gestation calendar, and other services. Farmers can register their entire herd and receive information tailored specifically to the cow’s lifecycle and gestation period. As an additional service, iCow Soko enables farmers to trade livestock and related byproducts via mobile phone. iCow is a product of Green Dreams TECH Ltd and partners with Safaricom.
Source: Wane, W. and I. Gaddis (2013)
Box 32: Access to finance and micro-insurance through ICT
Initiatives in Tanzania
Connected Farmers Alliance: A three-year public-private partnership between USAID, Vodafone and TechnoServe to improve productivity and incomes of smallholder farmers in Kenya, Mozambique, and Tanzania. The project has three sub-components: The first develops an ICT application to support agribusinesses in managing their supply chains and outgrower schemes with smallholder farmers. This application is currently being piloted with firms in Arusha and Kilombero. The second component will provide financial services to rural consumers—such as micro-savings accounts with interest, crop insurance, and loan products—but is still at the concept stage. The third component, which will only be launched in Kenya, shall provide business support and incubation services for start-ups in the m-agriculture market.
Initiatives in Kenya
Kilimo Salama: An index-based agricultural insurance for smallholder farmers provided by the Syngenta Foundation. Insurance payouts are fully automated, based on deviations in seasonal rainfall from historical trends as collected by regional weather stations, and are transmitted to farmers via Safaricom’s M-Pesa mobile money service. This significantly reduces transaction cost and allows offering low-cost insurance premiums.
Source: Wane, W. and I. Gaddis (2013)
157
Assistance to farmers can also be provided through facilitating farming contracts with large
farmers. Contracts of this sort are used to link smallholder farmers with large farmers and/or
processing companies. Small farmers can obtain cheaper inputs, improved access to modern
technologies, and the use of transportation and marketing channels previously only available to
large farmers. The large farmers and/or processing companies would benefit from higher
quality, and more stable outputs from small farmers.
(2) Contract farming is prevalent amongst a number of traditional cash crops, such as sugar, tobacco, tea, coffee and cotton, and is increasingly being promoted for selected other high value crops. It has shown promising results in these industries. For example, contracted farmers in the sugar industry are using better inputs, receive more credit, and have better access to new technologies (Box 33). As a result, they have been selling more of their product and generating higher incomes.
Box 33: Contract farming in the Sugar industry in Tanzania
The sugar industry is one of the oldest industries in Tanzania, dating back to the 1930s, when the Tanganyika Plantation Company started its operations in Moshi. Sugarcane remains an important cash crop in the country today, with a production of just under 290,000 tons of raw sugar in 2012. However, unlike in the case of tobacco, tea or cotton, sugar is produced mostly for domestic consumption, and Tanzania remains a net importer of sugar. Three of the four major sugar companies contract smallholder farmers through sugarcane outgrower schemes- Kilombero Sugar Company Limited (KSC), Mtibwa Sugar Estate Limited (MSE), and Kagera Sugar Limited (KSL). Each outgrower association supplies a specific factory in its vicinity, and since sugarcane is a bulky and highly perishable commodity, transportation costs are high and factories can only source from smallholders in close proximity. The sugarcane outgrower associations and the sugar companies negotiate the sugarcane supply agreement under which farmers sell sugarcane to the factories. The cane supply agreement specifies the price for sugarcane, arrangements for credit and transport (if provided under the contract), payment modalities, and other matters pertaining to the growing of cane and organization of the harvest. The sugarcane supply agreement typically includes a clause that the price paid to the farmer increases with the sucrose level in the stem, which incentivizes good farming practices. It can also induce unintended behavior (i.e., deliberately burning fields to claim accidental burning compensation) for farmers that cannot harvest at times when sucrose levels peak due to limited processing capacity and congestion at factories. These limits in processing capacity also lead to quota systems for farmers, where production cannot be absorbed by processing factories. While this highlights the need for additional investment in agro-processing capacity, inconsistent government policies also limit incentives for further investments. Overall, farmers have largely benefitted from organizing around buyers through contract farming schemes. In addition to gaining from more consistent income, commercial banks such as CRDB and NMB have outgrower loan schemes that provide credit to sugarcane outgrowers (and outgrower associations) for inputs and other costs of production via a tripartite agreement between the sugar companies, outgrowers and the respective bank (IFC 2012). The companies’ commitment to buy sugarcane produced by the outgrowers acts as collateral. The KSC outgrowers and their communities also benefit from the Kilombero Community Trust. The Trust, which has been established with support from IFC from 2003 to 2005, is endowed with estate farmland and uses the proceeds of its farming activities to fund infrastructure investments, new technology, extension advice, and other community services.
Source: Wane, W. and I. Gaddis (2013).
158
Initiatives to leverage synergies between smallholders and large farms are at the center of
the new SAGCOT initiative launched by the Tanzanian Government (Box 34). Large scale farms
can help provide technology (including services) and financial transfers to rural communities.
They can also create economies of scale that would reduce transportation and marketing costs
by integrating smallholders into supply chains. Lastly, they can create new job opportunities in
rural areas if investments are directed at utilizing previously unexploited arable land.165
However, the integration of large scale and smallholders’ farms will require the implementation
of appropriate policies on land rights, integrated water management, access to inputs and
finance, distribution infrastructure, and trade policies.
Box 34: Southern Agricultural Growth Corridor of Tanzania (SAGCOT)
The Southern Agricultural Growth Corridor of Tanzania (SAGCOT) initiative, spearheaded by the President of Tanzania, aims to bring about major transformation in Tanzania agriculture through a strategy of agribusiness-led development. The focus of the initiative is to promote partnerships between large farms, agro-processors and traders and smallholders through ‘outgrower’ schemes. The SAGCOT initiative seeks to attract US$2.1 billion of new agribusiness investment over the next 20 years to bring at least 350,000 additional hectares into commercial production in ways that bring smallholders into internationally competitive supply chains. The initiative aims to create at least 420,000 new employment opportunities and permanently lift more than 2 million people out of poverty. The goal is to significantly and sustainably increase smallholder productivity and incomes in Tanzania as well as create other job opportunities along the value chains.
Source: Southern Agricultural Growth Corridor of Tanzania (SAGCOT) website: (www.sagcot.com)
Contract farming, on average, has shown positive impacts on producer incomes. The empirical
evidence from the study of coffee contracts in Kilimanjaro (Tanzania (2012)) and from other
countries (Madagascar (2008), Mozambique (2004), Uganda (2005), and Indonesia (2002))
suggest increased producer incomes through contract farming arrangements.166 However, such
schemes are also risky, and can be difficult to implement. Contracts are not easily enforceable
in a rural developing country context, and contract breach is a common problem. One of the
main challenges is ‘side-selling’ whereby a farmer receives inputs on credit from one company
but sells his produce to another company to avoid loan repayment, which leads to a process of
adverse selection and market failure. Another is the asymmetry in terms of market power and
contract savvy between small-scale farmers and processors, which can result in agreements
that are biased against the farmers.
The development of technology and farm contracts, as a means to assist farmers, is linked to
market incentives. Rather than intervening directly, the authorities should become regulators
to address market deficiencies. These include the lack of access to reliable information and the
165
Recent estimate for Africa is that large scale farming has the potential to create up to six million additional jobs. See: McKinsey Global Institute (August 2012): Africa at Work: Job Creation and Inclusive Growth. 166
Wane, W. and I. Gaddis (2013).
159
asymmetric bargaining power between small and large farmers. Specifically, the role of the
Government should be to facilitate the formation of farmers’ communities or associations
(affinity based, resource-based or activity based) so that smallholders can better defend their
rights and interact more effectively with large investors. Importantly, stable and consistent
policies are critical to promote investment in contract farming sectors (i.e., sudden changes in
export policies or unexpected tariffs on inputs will discourage investment and exacerbate risk).
If well-managed, the use of ICT and farm contracts can help increase the quantitative and
qualitative supply response of farmers to improved market access, including those who
currently survive through subsistence farming. The success of similar initiatives in India and Sri
Lanka has enabled billions of smallholder farmers, including women, to move out of poverty by
creating partnerships between farmers, wholesalers, and service providers. Such partnerships
have proved to be more cost-effective and sustainable than direct interventions by the State.167
Action 8: Ensure transparency and consistency in Government policies
Agricultural policies in Tanzania have been erratic and inconsistent, and have been known to
be reversed without notification. Policies have also not been transparent, which encourages an
environment of high risk in transactions and widespread uncertainty. While farmers are affected
by a wide range of policies, three policies in particular have attracted much attention over the
past years. These include export bans, local taxation and land policies. These policies not only
penalize farmers, they are also inconsistent with the Government’s strategy of promoting
commercial agriculture.
To address such inconsistencies, it is important to encourage transparent and consistent
sector policies. This can be done through the following actions:
(1) Easing bans on food exports. In recent years, the Government, as in a number of other
countries, has periodically banned the export of its staple crop, maize. This ban, recently
eliminated, has been justified for a long time as a measure to ensure national food security and
to protect citizens from food prices increases. Such a ban might be justifiable as a means to
protect consumers in the short term. However, it creates significant costs for farmers who lose
revenues as a result. It also undermines incentives to increase production in the longer run,
leading to significant losses in potential production levels, in the range of 8 to 10 percent for
maize by 2017. Bans are also inconsistent with the use of public money to support programs for
farmers. For example, in 2010/11, many villages located in close proximity to the borders with
DRC, Zambia, or Kenya recorded increased levels of production of maize as a result of good
rainfalls and the increased use of fertilizers as a result of the voucher subsidy system. However,
167
See for example, Brizzi, A. (2009), “The Power of Community Driven Innovations: The Power of Voice and Scale,” The World Bank, Stockholm.
160
these farmers could not sell most of their increased output because of the export ban and were
only able to make sales through informal channels with a relatively high degree of risk. This
resulted in huge losses for farmers and wasted the financial resources of the government.
Rather than through such bans, poor urban consumers should be protected through direct
transfers. Such direct transfers would be more equitable for consumers and would penalize
farmers less.
(2) Simplify policies on local crop taxes. Local taxation is often excessive and penalizes small
farmers. While the government has provided small farmers with vouchers to enable them to
purchase cheaper fertilizer through the National Agricultural Input Voucher Scheme and other
input subsidy programs, it has, in parallel, negated the benefits of this through the imposition of
excessive and multiple taxes as well as cumbersome procedures. There are multiple non-tariff
measures applied on agricultural products. Some are reasonable for maintaining hygiene and
other standards, but others are redundant and excessive. The local tax (“cess”) imposed on
grain movements by districts, and even villages, amounts to approximately 3 to 5 percent of the
wholesale value for each transaction. This may sound insignificant. However, 5 percent of the
wholesale value may amount to 8 percent of the farmgate price, which may be the difference
between a profit and a loss for a smallholder farmer. Worse, its multiplicity contributes to delays
and illegal rent seeking. This local tax also contributes to the bias against rural activities, since
businesses in urban areas are not required to pay a similar tax. An effective tax system involves
not only low rates but also, and above all, simplicity, neutrality, and clarity.
(3) Address market failures in the rural land and property market by establishing efficient
land registration systems. Tenure rights are weak in rural areas, and as discussed earlier in
Section 2.2.8, the limited recognition of land holdings undermines farmers’ ability to protect
their land against speculators or large scale investors, and to use their land as a basis for lower
risk when obtaining credit. Additionally, the use of multiple land documents - of which only a
third are officially recognized titles, such as the Customary Rights of Occupancy (CCROs) and
Granted Rights of Occupancy (GROs) - need to be streamlined, especially in Tanzania where
local government authorities are generally in charge of implementation of policy, and complex
policies often lead to uneven implementation at the village council level. Importantly, an
increase is recommended in the number of GROs and CCROs issued as official titles to replace
semi-formal documents such as inheritance letters, or letters of allocation from the village
government, which do not provide full tenure security. It is also important to set up land
information systems through topographical mapping, and to establish a secure and moveable
registry for land titles through establishment of district registries. This would enable the
potential development of rural land markets, and allow small holder farmers to gain security
and access credit and growth opportunities with more secure tenure rights.
161
Box 35: Government Commitment as a key to success in land reform in Ethiopia
During 2003–05, Ethiopia delineated and adjudicated 20 million land parcels and issued about 5 million land certificates in three of its main regions (Amhara, Oromia, and Southern Nations Nationalities, Peoples’ Region [SNNPR]), a pace matched only by Vietnam in the 1990s after it abandoned collective farming. Ethiopia’s registration methodology did not survey or map land boundaries, but it provided enough security of tenure to have a significant impact on investment and gender equity (Deininger et al. 2007). Moreover, its land registration program was undertaken without support from development partners; support came only after completion of the program and went for piloting various approaches to mapping boundaries in the second stage of registration. While not all is well in Ethiopia’s land policy, especially given restrictions on renting, selling, and mortgaging rural land, Ethiopian authorities clearly are committed to improving land administration and management.
Source: Byamugisha, F. (May 2013), “Securing Africa’s Land for Shared Prosperity- A Program to Scale up Reforms
and Investments,” ISBN: 978-0-8213-9810-4, World Bank, Washington DC.
Sector Focus: Agribusiness—High-value vegetables and fruits
Tanzania has clear natural advantages in land and weather conditions. There is also a large
domestic and regional demand, as well as opportunities on export markets, boosted by
preferential access to major global markets. However, to be effective, policies will have to
target products where economies of scale can be realized. This can be promoted by the
production of quality products through use of farming contracts, which would trigger
agglomeration effects that will reduce the transportation and marketing costs, as well as
increase connectivity. The example of high-value vegetables will be used as an illustration.
Agro-processing is already the dominant manufacturing sector in Tanzania. This sector
consists of 287 formal companies, contributing 55 percent of the manufacturing value added
and 65 percent of the manufacturing employment in the country.168 More than 80 percent of
the companies are small. Food products contribute to more than half the value added in agro
processing. Beverages, fish products, grain mill products, and animal and vegetable fats and oils
are the largest components of the food processing segment. Agro processing, which resource-
based and labor intensive, is also well situated in the country with strong backward and forward
links to the economy.
In spite of this promising existing base, the agro-processing sector has not really surged in
recent years. While individual success stories can be found, agro-processing companies have
been facing many constraints along the value chain. The first constraint, as described in detail in
Actions 5-8, has been the limited availability of good quality agricultural products. Only a small
share of agricultural products is currently commercialized by Tanzanian farmers. Tanzanian
agriculture is dominated by smallholder farms that practice mostly subsistence farming using
traditional inputs and techniques and produce low yields and low-quality products. Limited
168
Dinh, H. and C. Monga (2013).
162
access to land is a major constraint on the establishment of larger commercial farms. When
commercialized, most agricultural products are sold to foreign markets without processing,
which forfeits substantial gains in employment and value added activities. Tanzania also has
large trade deficits in some agro processing industries, such as dairy products and edible oil.
This also implies a loss of potential employment and value added activities, as well as a
substantial loss in foreign exchange.
Beyond the lack of good and affordable inputs, there are also multiple constraints for agro-
processing companies. Those can be illustrated by the example of wheat milling (Box 36). The
price of electricity and the low labor productivity explain that processing costs are
approximately 20 percent higher in Tanzania than in China. This cost comparison does not
include transportation costs that are obviously much higher in Tanzania (for more details see
part 2 on connectivity).
Any breakthrough in agro-processing will require significant improvements along the full
value chain. The starting point should be at the farm level, to ensure good quality inputs, but
most of recommendations have been captured in the other actions in the second pillar. The
emphasis is given to what can be done at the processing level by proposing the six following
measures:
(1) Encourage contract farming: Contract farming could address the lack of access among small
farmers to agricultural inputs and services, while formalizing the connection between
smallholders and the agro processing industry. Tanzania is using contract farming in a series of
subsectors, including sugar, tea, coffee, cotton and tobacco. 169 This can potentially be
replicated in other industries, including selected high value vegetables and fruits.
(2) Accelerate cluster formation: Cluster formation requires collaboration among stakeholders,
including local governments, the Export Processing Zones Authority (EPZA), and sector
associations, to build the needed infrastructure, establish supply chain management, create
training-with-production services, and develop market links. The cluster approach should
facilitate access to electricity and reduce transportation as well as marketing costs.
169
Wane, W. and I. Gaddis (2013) show that in the Kilimanjaro region, coffee contracts with prior village-level grading have increased producer incomes. This is explained by the fact that the grading process awards quality premiums to individual producers, thereby incentivizing quality-enhancing production practices.
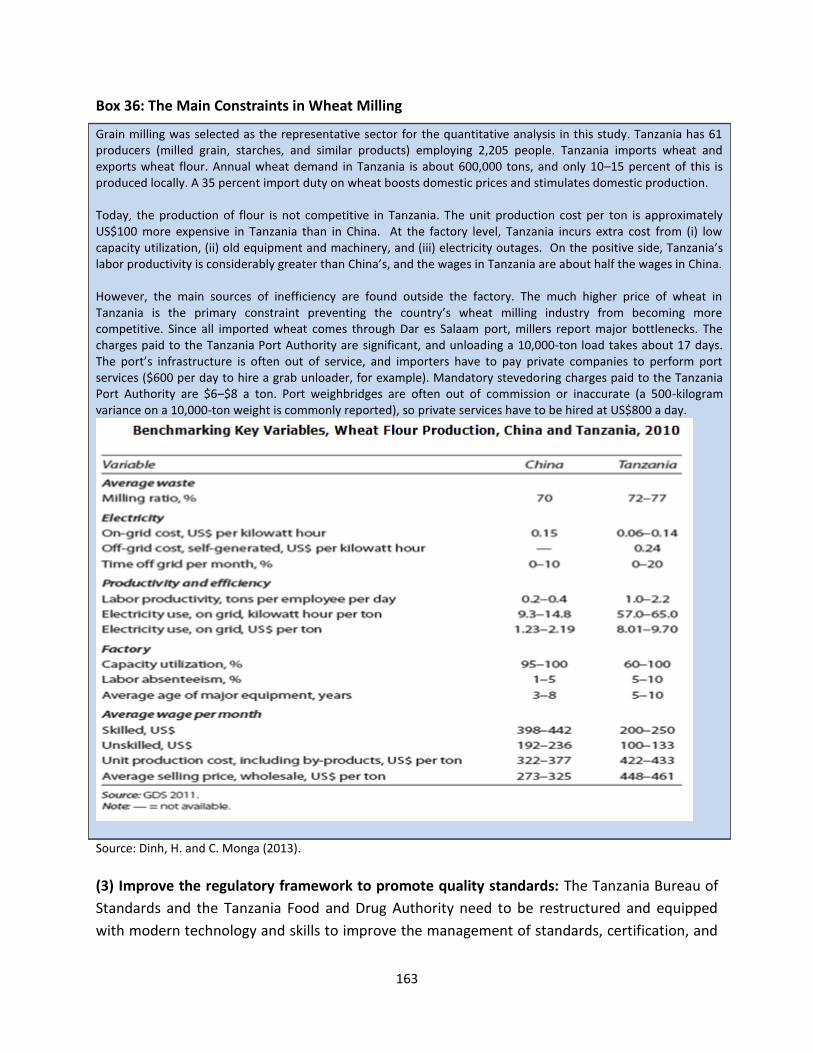
163
Box 36: The Main Constraints in Wheat Milling
Grain milling was selected as the representative sector for the quantitative analysis in this study. Tanzania has 61 producers (milled grain, starches, and similar products) employing 2,205 people. Tanzania imports wheat and exports wheat flour. Annual wheat demand in Tanzania is about 600,000 tons, and only 10–15 percent of this is produced locally. A 35 percent import duty on wheat boosts domestic prices and stimulates domestic production. Today, the production of flour is not competitive in Tanzania. The unit production cost per ton is approximately US$100 more expensive in Tanzania than in China. At the factory level, Tanzania incurs extra cost from (i) low capacity utilization, (ii) old equipment and machinery, and (iii) electricity outages. On the positive side, Tanzania’s labor productivity is considerably greater than China’s, and the wages in Tanzania are about half the wages in China. However, the main sources of inefficiency are found outside the factory. The much higher price of wheat in Tanzania is the primary constraint preventing the country’s wheat milling industry from becoming more competitive. Since all imported wheat comes through Dar es Salaam port, millers report major bottlenecks. The charges paid to the Tanzania Port Authority are significant, and unloading a 10,000-ton load takes about 17 days. The port’s infrastructure is often out of service, and importers have to pay private companies to perform port services ($600 per day to hire a grab unloader, for example). Mandatory stevedoring charges paid to the Tanzania Port Authority are $6–$8 a ton. Port weighbridges are often out of commission or inaccurate (a 500-kilogram variance on a 10,000-ton weight is commonly reported), so private services have to be hired at US$800 a day.
Source: Dinh, H. and C. Monga (2013).
(3) Improve the regulatory framework to promote quality standards: The Tanzania Bureau of
Standards and the Tanzania Food and Drug Authority need to be restructured and equipped
with modern technology and skills to improve the management of standards, certification, and
164
control.170 The Tanzania Food and Drug Authority is drafting the National Food Safety Policy,
which is expected to address the numerous anomalies, duplications, and restrictions in the food
industry that are impeding the industry’s development.
(4) Enhance training services for food production under hygienic conditions: Several training
initiatives have been established or proposed for small agro processing companies, including
one for training in food processing and production centers at the Small Industries Development
Organization (SIDO), to be financed by the Korea International Cooperation Agency. Similar
programs should be developed through donor-financed technical assistance organized by
various associations and the Vocational Education and Training Authority in areas where agro
processing companies are concentrated. Training can also be conducted in clusters.
(5) Encourage the packaging industry: An assessment is needed to identify the packaging needs
in agro processing. A feasibility study should be carried out to assess the investment
opportunities in the production of packaging materials. Once this work is completed, the
government could encourage foreign direct investment in agro processing, preferably in
partnership with local entrepreneurs.
(6) Strengthen sectoral associations: Sectoral associations provide critical services to their
members, including advocacy, policy dialogue, technical assistance, training in skills and
standards, and market information. These associations should be fully represented on the
Tanzania Agricultural Council. Policies affecting agriculture and agro processing are formulated
and implemented by a wide range of public and private institutions. The council can provide
critical policy coordination. To do this properly, the council needs to be represented at the
private sector umbrella institutions, such as the Tanzania National Business Council and the
Tanzania Private Sector Foundation. Substantial technical assistance should be mobilized
among the donor community to strengthen the capacity of sectoral associations and the
Tanzania Agricultural Council.
Although these measures are targeted to the food processing industry, they remain relatively
broad. To be more concrete, we illustrate their possible implementation for one specific line of
product: high value vegetables and fruits (Box 37). Not only does Tanzania have a clear
comparative advantage in this sub-sector, but the existence of clusters around the poles of Dar
es Salaam and Kilimanjaro/Arusha should also limit the costs of new infrastructure, and help
enhance productivity as well as lower transportation and marketing costs in this sector.
170 There are 17 pieces of legislation on food safety, food quality, and food quality control; these are implemented
by 18 different institutions (TPSF and CCP 2010). This burdens companies with time-consuming and costly licensing and inspection procedures for food production, distribution, import, and export.
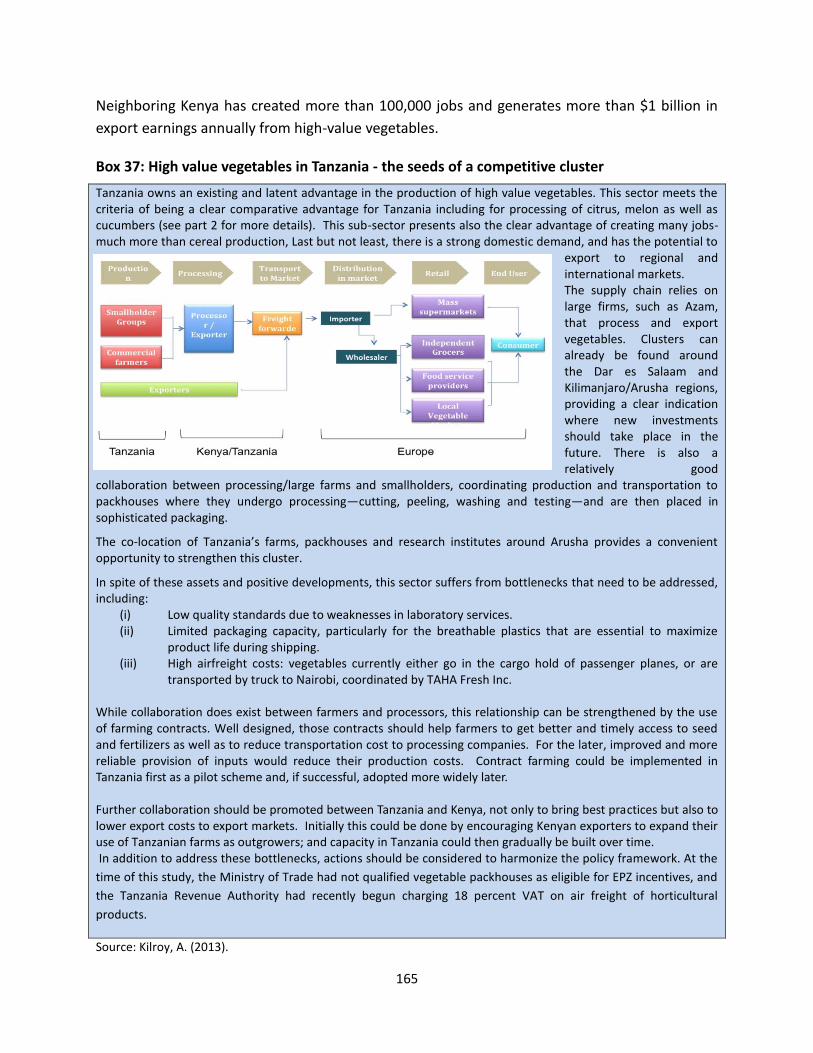
165
Neighboring Kenya has created more than 100,000 jobs and generates more than $1 billion in
export earnings annually from high-value vegetables.
Box 37: High value vegetables in Tanzania - the seeds of a competitive cluster
Tanzania owns an existing and latent advantage in the production of high value vegetables. This sector meets the criteria of being a clear comparative advantage for Tanzania including for processing of citrus, melon as well as cucumbers (see part 2 for more details). This sub-sector presents also the clear advantage of creating many jobs- much more than cereal production, Last but not least, there is a strong domestic demand, and has the potential to
export to regional and international markets. The supply chain relies on large firms, such as Azam, that process and export vegetables. Clusters can already be found around the Dar es Salaam and Kilimanjaro/Arusha regions, providing a clear indication where new investments should take place in the future. There is also a relatively good
collaboration between processing/large farms and smallholders, coordinating production and transportation to packhouses where they undergo processing—cutting, peeling, washing and testing—and are then placed in sophisticated packaging.
The co-location of Tanzania’s farms, packhouses and research institutes around Arusha provides a convenient opportunity to strengthen this cluster.
In spite of these assets and positive developments, this sector suffers from bottlenecks that need to be addressed, including:
(i) Low quality standards due to weaknesses in laboratory services. (ii) Limited packaging capacity, particularly for the breathable plastics that are essential to maximize
product life during shipping. (iii) High airfreight costs: vegetables currently either go in the cargo hold of passenger planes, or are
transported by truck to Nairobi, coordinated by TAHA Fresh Inc.
While collaboration does exist between farmers and processors, this relationship can be strengthened by the use of farming contracts. Well designed, those contracts should help farmers to get better and timely access to seed and fertilizers as well as to reduce transportation cost to processing companies. For the later, improved and more reliable provision of inputs would reduce their production costs. Contract farming could be implemented in Tanzania first as a pilot scheme and, if successful, adopted more widely later. Further collaboration should be promoted between Tanzania and Kenya, not only to bring best practices but also to lower export costs to export markets. Initially this could be done by encouraging Kenyan exporters to expand their use of Tanzanian farms as outgrowers; and capacity in Tanzania could then gradually be built over time. In addition to address these bottlenecks, actions should be considered to harmonize the policy framework. At the
time of this study, the Ministry of Trade had not qualified vegetable packhouses as eligible for EPZ incentives, and
the Tanzania Revenue Authority had recently begun charging 18 percent VAT on air freight of horticultural
products.
Source: Kilroy, A. (2013).
166
3.3 Pillar 3: Moving to Export Markets
One way for firms to grow and create jobs is to expand to new markets. While the domestic
market represents obvious opportunities, the low purchasing power of many households limits
its size. There are niches, however, where imports can be substituted by domestic production,
such as edible oil and wheat as identified in the second part of this study. Over time, improved
living conditions and higher income will also create a new demand for products. However, as
evidenced by the success of several emerging countries, notably in Asia, the expansion toward
export markets remains a sure bet for sustained expansion.
Expanding to foreign market assumes that firms are competitive. While many Tanzanian firms
are not yet competitive, some of them have been able to compete on regional and global
markets in recent years. The number of exporters has grown on average by seven percent per
year during the 2000s, and there are a series of small firms that have become major exporters
in recent years. The challenge for Tanzania is to sustain and amplify this trend in the coming
years
The main objective behind this pillar is to help domestic firms to become exporters on foreign
markets. While some exporters enter with the initial objective to sell abroad (notably in natural
resources sectors such as mining, coffee and tea), others are cultivated through a maturing
process. Their starting point is the local market and gradually, with experience and productivity
improvements, they turn to export markets.
This maturing process can be accelerated with the right set of policies. The action plan focuses
on four cross-cutting subjects, and suggests a focus on the tourism industry:
Action 9: Breaking the trap of informality
Action 10: Enhancing quality at production
Action 11: Improving connectivity and market access
Action 12: Thinking regionally
Sector focus: Exporting services—Tourism
Action 9: Breaking the trap of informality
For many small businesses, informality is not a problem. They can accommodate of the loose
regulatory framework and its weak implementation. However, for growing firms, informality
becomes problematic. First, they are more visible and can be targeted more easily by rent-
seeking officials, and the law and justice systems. Second, and more importantly, growing firms
need access to finance, training and information. Those are difficult to get for informal firms as

167
commercial banks will require them to register even before applying for a loan. Foreign trading
partners will also prefer to interact with registered firms for security and guarantees.
Breaking the trap of informality is a crucial step forward for growing firms at the brink of
expansion, specifically to foreign markets. To encourage them, the reduction of costs
associated with formality is necessary, including the rationalization of current procedures (see
pillar 1 for fuller details).
Here the emphasis is given to the incentives that may encourage informal firms to become
formal with a specific attention to two channels: (i) access to formal financing; and (ii) access
to market information. The basic argument is that by enhancing these two channels, dynamic
firms will be encouraged to become formal, which in turn will favor their access to finance and
information and ultimately their prospects to grow even faster and create additional productive
jobs.
(i) Access to formal credit is critical for firms that have the potential to breakthrough into
exporting activities. Financial support is an important contributor to innovation and it is usually
among the most cited constraints by firms in developing countries. In Tanzania, firms lack
financial support to carry out innovation-related activities to increase capacity, diversify into
new products/processes, or move along the value chain in production. It is particularly
important to facilitate the graduation of small non-farm businesses from informal and semi-
formal sources of finance towards formal financing.
However, as explained earlier, their access is limited because of high transaction costs on both
the demand and supply sides. On the supply side, commercial banks have to spend
considerable time on collecting information on potential borrowers. This cost is amplified
because of the absence of collective information centers (such as credit bureau) and of the high
degree of informality that prevent the identification of borrowers and the provision of
adequate guarantees. On the demand side, many entrepreneurs may not have the financial
literacy to apply for loans.
The aim should therefore be to reduce existing transactions costs for both firms and
commercial banks. This can be achieved by the combination of (i) initiatives aimed at reducing
information costs; (ii) the promotion of new products and services; and (iii) internal
organization of commercial banks.
One way to reduce the costs of information is to set up collective mechanisms for the collection
of relevant information. The development of the credit bureau is a step in the right direction, as
168
shown by the recent successful experience in Rwanda. 171 There is also a need to implement a
national ID system to facilitate the information tracking of applicants over time, as was done
successfully in Kenya, Rwanda and South Africa.172 These actions on the supply-side ought to be
completed by programs of financial literacy for small firm owners. The use of mobile banking
can also be an effective way to reduce those costs, principally for isolated potential customers
(as described in pillar 2).
An important constraint to formal credit is associated with the lack of collateral or a reliable
collateral recovery system. This problem is exacerbated by conservative regulation around
collateral. Specifically, the BoT currently requires that loans should be backed by collateral
equivalent to 125% of the loan amount. This legislation further deters bank lending to SMEs as
experimentation in unsecured lending will typically require a regulatory exemption. Currently,
most unsecured lending is used for salary loans that are only indirectly relevant to SMEs.
Beyond the further necessary reforms in land titling, it is important as a minimum to (i)
document systematically the time and costs involved in perfecting collateral and (ii) clarify the
presently opaque and ambiguous processes involved in recovering collateral when loans go bad.
Some reconsideration of the present BoT regulatory limits might also be helpful. Even these
minimal steps towards reform would be helpful for the market and could be used also to
advocate specific future actions for faster progress
Access to formal credit requested adapted instruments to the need to small firms. Today, the
range on offer remains limited and with some notable exceptions the rate of innovation in
recent years has been weak. The products on offer seem to have been driven more by what the
banks would like to offer rather than the desire to meet the needs of an identified market
segment.:
The first instrument would be to revisit the use of Selective Credit Guarantees, which
is a revolving loan fund facilitating lending at sub-market rates. This scheme was
largely unsuccessful in Tanzania, and only operational between 2005 and 2008. All these
schemes have been suspended while government considers what the future financing
and governance arrangements. International evidence suggests that that a reformulated
system of credit guarantees for commercial banks could be a critical component of any
long-term framework to promote SME financing schemes (DFID, 2005 or WB, 2008), 173
171
McKinsey Global Institute (August 2012): Africa at Work: Job Creation and Inclusive Growth. 172 Berg, G. and M. Fuchs (August 2013)
173 Beck T., et al. (November 2008), “Bank Financing for SMEs around the World Drivers, Obstacles, Business
Models, and Lending Practices,” Policy Research Working Paper 4785, The World Bank Development Research Group Finance and Private Sector Team, WPS4785.
169
In depth consultancy advice174 on this transformation was given, including the need to
complete the new institutional arrangements to establish a new credit guarantee entity outside
the BOT to be referred to as the Tanzania Credit Guarantee Corporation (TCGC). This was to be a
new licensed and regulated non-bank financial institution (NBFI) registered as a joint stock
company.
The second instrument is leasing. Leasing products in Tanzania remains highly
underdeveloped, especially for smaller sized transactions: some commercial banks are
involved in larger leasing-type transactions (circa $300,000-400,000 per transaction).
Leasing essentially provides financing for capital assets such as equipment and vehicles.
Leasing institutions/banks purchase the equipment and provide it to firms for a certain
amount of time. During this time, firms make payments to the leasing company, and
business reliability is assessed on consistency of lease payments rather than credit
history or collateral. At the end of the lease period, the business typically gains
ownership of the equipment.175 The incentives may not be well aligned for leasing
companies, as they are required to pay withholding tax on lease payments on behalf of
lessees. Leasing companies also have to pay input VAT on the purchase of the assets
they then lease to their clients. This is recovered by charging the full amount of output
VAT at the beginning of the lease, rather than smoothing this over the life of the lease,
making it a potentially expensive financing option. Lastly, while there are VAT
exemptions on some equipment categories (i.e., agricultural equipment), leasing
companies do not necessarily benefit from these exemptions. 176 Despite these
limitations, there is potential to scale up leasing activities with the introduction of a few
innovative schemes.177 For example, the IFC leasing facility in Africa, launched in 2008
works as a five-year, multi-country advisory services program aimed at introducing
leasing as an innovative financial instrument across Sub-Saharan Africa. There are also
some small-scale initiatives that have shown a measure of success in Tanzania (see Box
38).
Box 38: Equity for Africa – Leasing to SMEs
Equity for Africa (EFA) is a UK charity operating in Moshi, Tanzania in the foothills of Mt Kilimanjaro. Through its Tanzanian subsidiary, Equity for Tanzania (EFTA), EFA leases a range of equipment to SMEs in agri-business, manufacturing and services to customers who are often excluded from traditional bank finance either due to low levels of formality or a lack of sufficient collateral necessary for a bank loan. Customers are usually in the smaller end of the SME spectrum, typically employing 2-19 individuals. Capital needs for EFA’s customers cover maize
174
See Cardno Emerging Markets, Bank of Tanzania, Long-term Advisor for Credit Guarantee Schemes, Interim Report, October 2010. 175
World Bank (2014), “Global Financial Development Report 2014: Financial Inclusion,” World Bank, Washington, DC. 176
Roe, A. and R. Stone (January 2013) 177
Kweka, J. (December 2013).
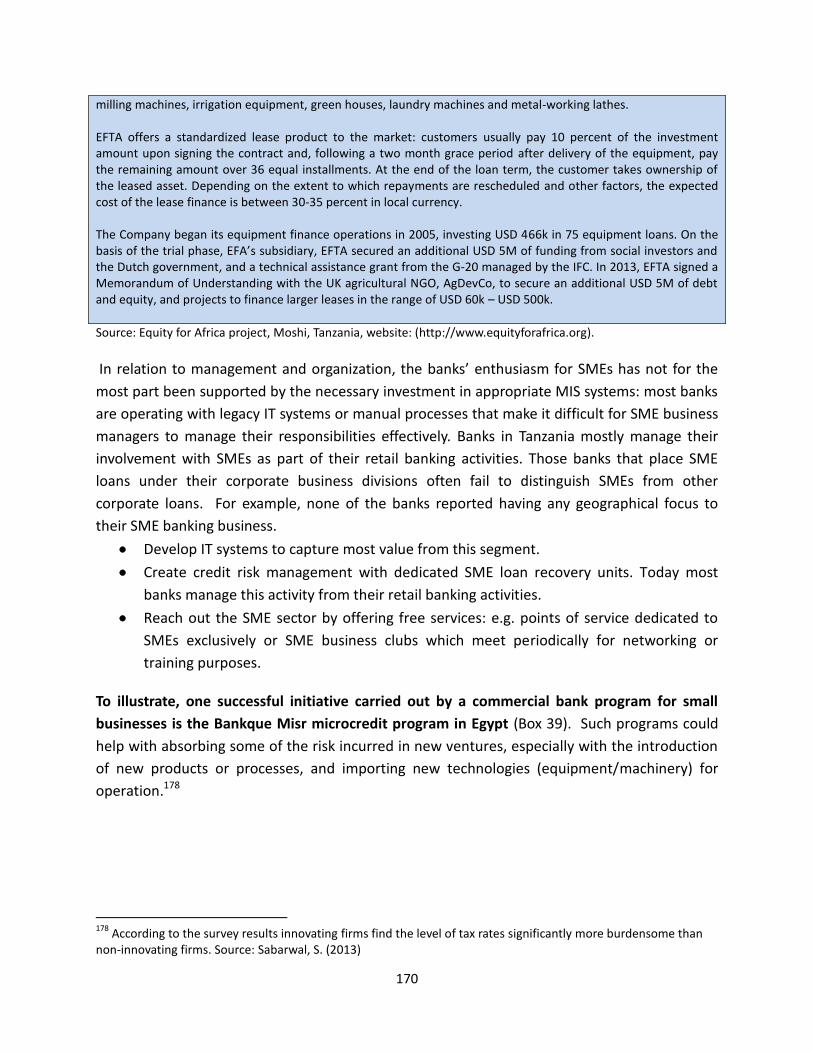
170
milling machines, irrigation equipment, green houses, laundry machines and metal-working lathes. EFTA offers a standardized lease product to the market: customers usually pay 10 percent of the investment amount upon signing the contract and, following a two month grace period after delivery of the equipment, pay the remaining amount over 36 equal installments. At the end of the loan term, the customer takes ownership of the leased asset. Depending on the extent to which repayments are rescheduled and other factors, the expected cost of the lease finance is between 30-35 percent in local currency. The Company began its equipment finance operations in 2005, investing USD 466k in 75 equipment loans. On the basis of the trial phase, EFA’s subsidiary, EFTA secured an additional USD 5M of funding from social investors and the Dutch government, and a technical assistance grant from the G-20 managed by the IFC. In 2013, EFTA signed a Memorandum of Understanding with the UK agricultural NGO, AgDevCo, to secure an additional USD 5M of debt and equity, and projects to finance larger leases in the range of USD 60k – USD 500k.
Source: Equity for Africa project, Moshi, Tanzania, website: (http://www.equityforafrica.org).
In relation to management and organization, the banks’ enthusiasm for SMEs has not for the
most part been supported by the necessary investment in appropriate MIS systems: most banks
are operating with legacy IT systems or manual processes that make it difficult for SME business
managers to manage their responsibilities effectively. Banks in Tanzania mostly manage their
involvement with SMEs as part of their retail banking activities. Those banks that place SME
loans under their corporate business divisions often fail to distinguish SMEs from other
corporate loans. For example, none of the banks reported having any geographical focus to
their SME banking business.
Develop IT systems to capture most value from this segment.
Create credit risk management with dedicated SME loan recovery units. Today most
banks manage this activity from their retail banking activities.
Reach out the SME sector by offering free services: e.g. points of service dedicated to
SMEs exclusively or SME business clubs which meet periodically for networking or
training purposes.
To illustrate, one successful initiative carried out by a commercial bank program for small
businesses is the Bankque Misr microcredit program in Egypt (Box 39). Such programs could
help with absorbing some of the risk incurred in new ventures, especially with the introduction
of new products or processes, and importing new technologies (equipment/machinery) for
operation.178
178
According to the survey results innovating firms find the level of tax rates significantly more burdensome than non-innovating firms. Source: Sabarwal, S. (2013)
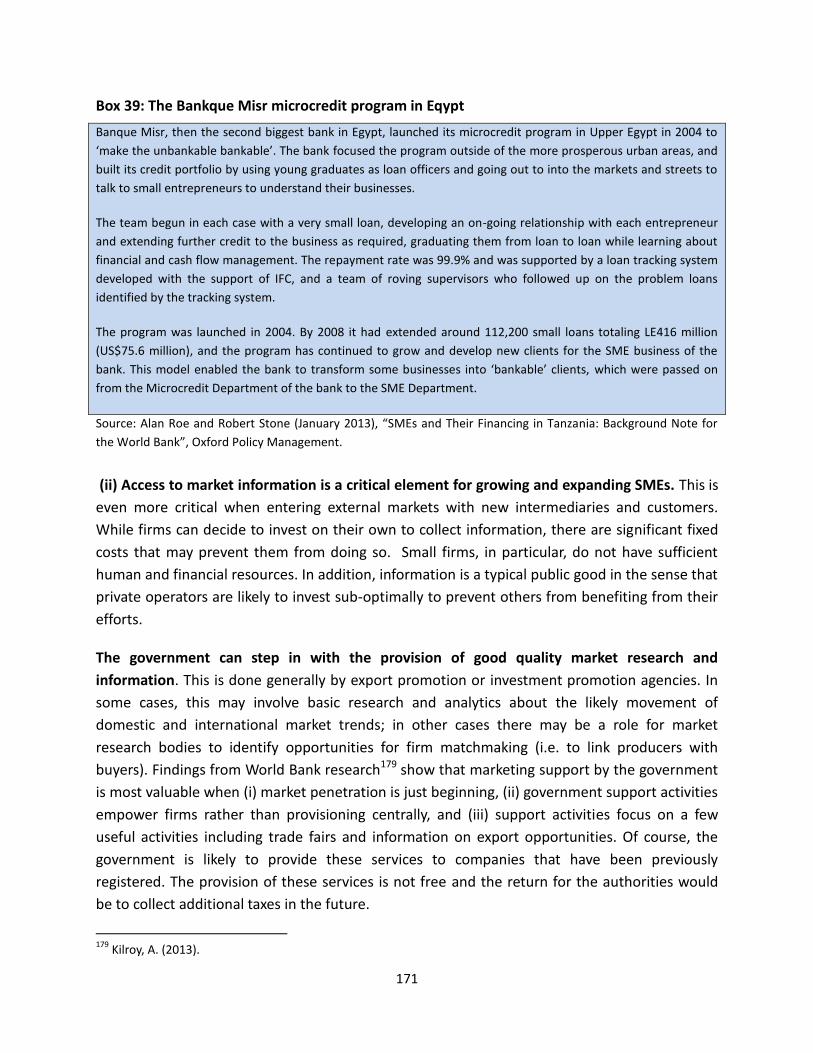
171
Box 39: The Bankque Misr microcredit program in Eqypt
Banque Misr, then the second biggest bank in Egypt, launched its microcredit program in Upper Egypt in 2004 to
‘make the unbankable bankable’. The bank focused the program outside of the more prosperous urban areas, and
built its credit portfolio by using young graduates as loan officers and going out to into the markets and streets to
talk to small entrepreneurs to understand their businesses.
The team begun in each case with a very small loan, developing an on-going relationship with each entrepreneur
and extending further credit to the business as required, graduating them from loan to loan while learning about
financial and cash flow management. The repayment rate was 99.9% and was supported by a loan tracking system
developed with the support of IFC, and a team of roving supervisors who followed up on the problem loans
identified by the tracking system.
The program was launched in 2004. By 2008 it had extended around 112,200 small loans totaling LE416 million
(US$75.6 million), and the program has continued to grow and develop new clients for the SME business of the
bank. This model enabled the bank to transform some businesses into ‘bankable’ clients, which were passed on
from the Microcredit Department of the bank to the SME Department.
Source: Alan Roe and Robert Stone (January 2013), “SMEs and Their Financing in Tanzania: Background Note for
the World Bank”, Oxford Policy Management.
(ii) Access to market information is a critical element for growing and expanding SMEs. This is
even more critical when entering external markets with new intermediaries and customers.
While firms can decide to invest on their own to collect information, there are significant fixed
costs that may prevent them from doing so. Small firms, in particular, do not have sufficient
human and financial resources. In addition, information is a typical public good in the sense that
private operators are likely to invest sub-optimally to prevent others from benefiting from their
efforts.
The government can step in with the provision of good quality market research and
information. This is done generally by export promotion or investment promotion agencies. In
some cases, this may involve basic research and analytics about the likely movement of
domestic and international market trends; in other cases there may be a role for market
research bodies to identify opportunities for firm matchmaking (i.e. to link producers with
buyers). Findings from World Bank research179 show that marketing support by the government
is most valuable when (i) market penetration is just beginning, (ii) government support activities
empower firms rather than provisioning centrally, and (iii) support activities focus on a few
useful activities including trade fairs and information on export opportunities. Of course, the
government is likely to provide these services to companies that have been previously
registered. The provision of these services is not free and the return for the authorities would
be to collect additional taxes in the future.
179
Kilroy, A. (2013).
172
The government could also assist with the provision of market information through industry
associations or private/public organizations. For industry associations, this would mean a shift
from their current emphasis on political lobbying towards productive support to their members.
For public/private organizations, this would involve a shift toward export rather than domestic
activities (see Box 40 on Pro-Chile). This would include collecting current market prices for
commodities, and market clearing information on unmet demand and sources of surplus, as
well as information on opportunities for growth. This role in information facilitation could also
include sector-specific export promotion and investment promotion. Policy advocacy activities
can be introduced in order to increase the competitiveness of industries. Box 41 provides a
useful example from Taiwan.
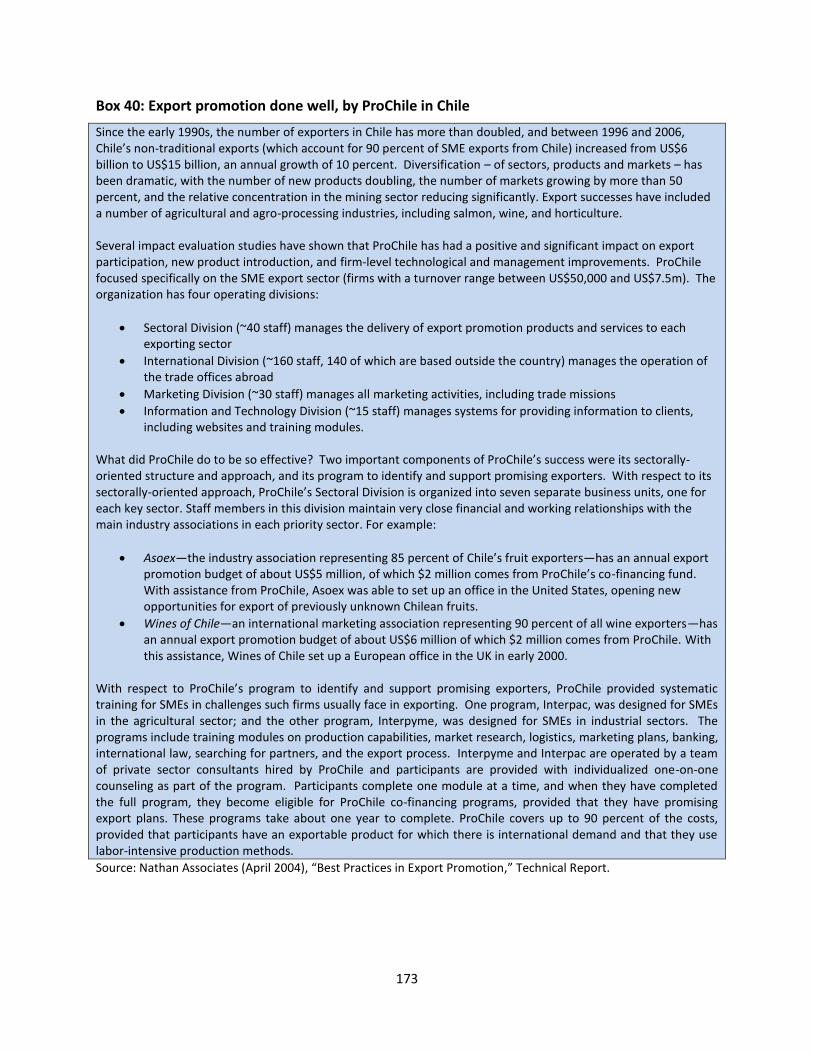
173
Box 40: Export promotion done well, by ProChile in Chile
Since the early 1990s, the number of exporters in Chile has more than doubled, and between 1996 and 2006, Chile’s non-traditional exports (which account for 90 percent of SME exports from Chile) increased from US$6 billion to US$15 billion, an annual growth of 10 percent. Diversification – of sectors, products and markets – has been dramatic, with the number of new products doubling, the number of markets growing by more than 50 percent, and the relative concentration in the mining sector reducing significantly. Export successes have included a number of agricultural and agro-processing industries, including salmon, wine, and horticulture. Several impact evaluation studies have shown that ProChile has had a positive and significant impact on export participation, new product introduction, and firm-level technological and management improvements. ProChile focused specifically on the SME export sector (firms with a turnover range between US$50,000 and US$7.5m). The organization has four operating divisions:
Sectoral Division (~40 staff) manages the delivery of export promotion products and services to each exporting sector
International Division (~160 staff, 140 of which are based outside the country) manages the operation of the trade offices abroad
Marketing Division (~30 staff) manages all marketing activities, including trade missions
Information and Technology Division (~15 staff) manages systems for providing information to clients, including websites and training modules.
What did ProChile do to be so effective? Two important components of ProChile’s success were its sectorally-oriented structure and approach, and its program to identify and support promising exporters. With respect to its sectorally-oriented approach, ProChile’s Sectoral Division is organized into seven separate business units, one for each key sector. Staff members in this division maintain very close financial and working relationships with the main industry associations in each priority sector. For example:
Asoex—the industry association representing 85 percent of Chile’s fruit exporters—has an annual export promotion budget of about US$5 million, of which $2 million comes from ProChile’s co-financing fund. With assistance from ProChile, Asoex was able to set up an office in the United States, opening new opportunities for export of previously unknown Chilean fruits.
Wines of Chile—an international marketing association representing 90 percent of all wine exporters—has an annual export promotion budget of about US$6 million of which $2 million comes from ProChile. With this assistance, Wines of Chile set up a European office in the UK in early 2000.
With respect to ProChile’s program to identify and support promising exporters, ProChile provided systematic training for SMEs in challenges such firms usually face in exporting. One program, Interpac, was designed for SMEs in the agricultural sector; and the other program, Interpyme, was designed for SMEs in industrial sectors. The programs include training modules on production capabilities, market research, logistics, marketing plans, banking, international law, searching for partners, and the export process. Interpyme and Interpac are operated by a team of private sector consultants hired by ProChile and participants are provided with individualized one-on-one counseling as part of the program. Participants complete one module at a time, and when they have completed the full program, they become eligible for ProChile co-financing programs, provided that they have promising export plans. These programs take about one year to complete. ProChile covers up to 90 percent of the costs, provided that participants have an exportable product for which there is international demand and that they use labor-intensive production methods.
Source: Nathan Associates (April 2004), “Best Practices in Export Promotion,” Technical Report.

174
Box 41: Addressing Coordination Failures in Taiwan’s cordless telephone industry
When Taiwan’s exports of cordless telephones rose by 250 percent in the early 1980s, a number of low-overhead ‘underground’ factories began producing cheap and bad quality versions to gain market share. Foreign buyers began to complain of unreliable quality. In response, Taiwan’s Industrial Development Bureau (IDB) in the Ministry of Economic Affairs called a meeting of the largest producers and urged them to form a joint export company. It incentivized this action through a combination of sticks (e.g. a threatened tax scrutiny if they did not) and carrots (e.g. assistance in setting up the company and in preventing underground factories from exporting). Even if the joint export company consisted of a handful of staff and a telephone, it could act as a trusted broker to international markets.
Source: Kilroy, A. (2013)
Action 10: Enhancing quality at production
For a firm to be competitive, quality is crucial, particularly for educated consumers in
industrial countries. This focus on quality is even more important for products in which
Tanzania presents an existing or latent comparative advantage, such as food, leather, and wood
products. In industrial countries, the most important barrier for Tanzanian exports is not tariffs
but non-tariff barriers such as quality and hygiene standards.180
A three-pronged approach is proposed to help emerging and existing Tanzanian exporters to
meet standards. The first focuses on the adoption of quality standards, while the second seeks
to upgrade the business skills of firms’ owners. The third prong consists of promoting
technology transfers along the value chain, with the objective to improve quality. These three
actions should be seen as complementary since enhancing quality supposes some basic
knowledge about required standards on exporting markets, the capacity to understand and
implement them, and some necessary infrastructure.
(1) Create consistent quality standards. Standards are trade-enhancing because they reduce
information asymmetries, signal quality to buyers, and create a common language among
buyers and suppliers, thus reducing market failure and overall transaction costs. They also allow
for better access into larger markets (developed countries) for Tanzanian products. Within
sectors, the lack of quality standards are a key constraint for dynamic producers, who have the
ability and drive to increase quality standards, but no industry standards to benchmark against.
A lack of standards essentially means there is a tendency to the lowest common denominator,
unless there are other ways to brand and differentiate items. This is a particular problem in the
leather industry, where the quality of hides is variable, and the food industry, which has
unpredictable and substandard inputs. Often, large producers in need of high quality inputs
180
See: Cadot, O. et al. (May 2011), “Success and Failure of African Exporters,” Policy Research Working Paper, World Bank, Washington, DC.
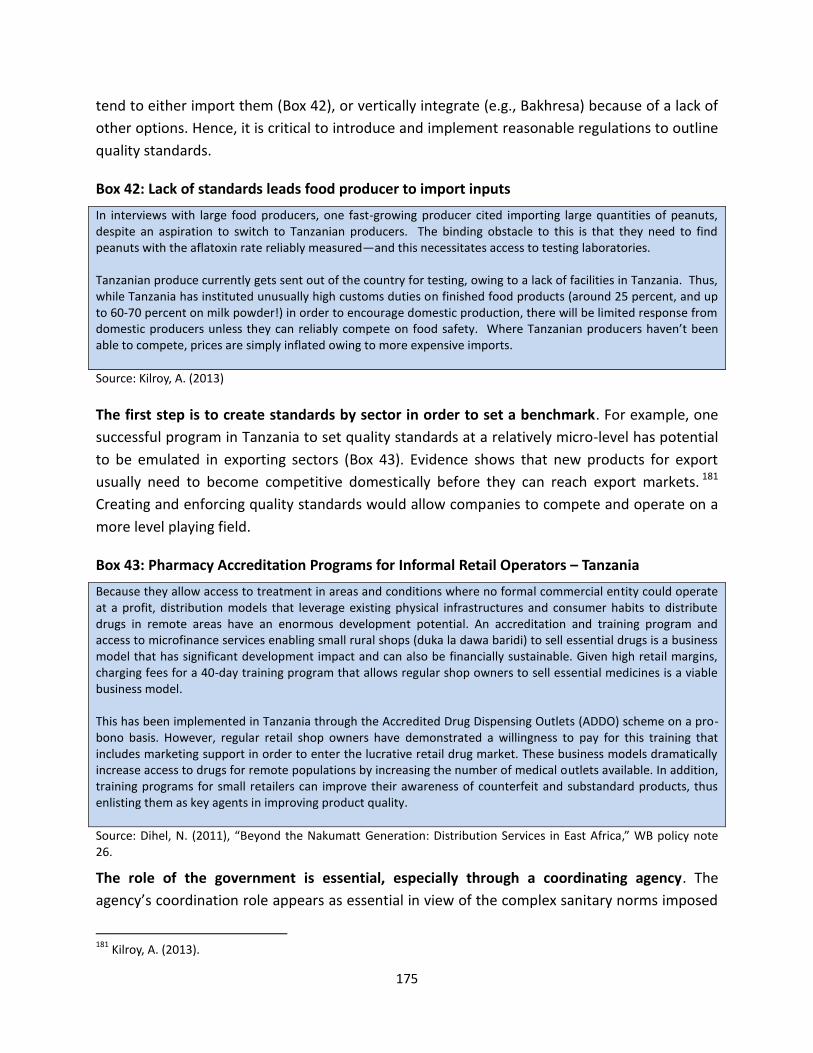
175
tend to either import them (Box 42), or vertically integrate (e.g., Bakhresa) because of a lack of
other options. Hence, it is critical to introduce and implement reasonable regulations to outline
quality standards.
Box 42: Lack of standards leads food producer to import inputs
In interviews with large food producers, one fast-growing producer cited importing large quantities of peanuts, despite an aspiration to switch to Tanzanian producers. The binding obstacle to this is that they need to find peanuts with the aflatoxin rate reliably measured—and this necessitates access to testing laboratories. Tanzanian produce currently gets sent out of the country for testing, owing to a lack of facilities in Tanzania. Thus, while Tanzania has instituted unusually high customs duties on finished food products (around 25 percent, and up to 60-70 percent on milk powder!) in order to encourage domestic production, there will be limited response from domestic producers unless they can reliably compete on food safety. Where Tanzanian producers haven’t been able to compete, prices are simply inflated owing to more expensive imports.
Source: Kilroy, A. (2013)
The first step is to create standards by sector in order to set a benchmark. For example, one
successful program in Tanzania to set quality standards at a relatively micro-level has potential
to be emulated in exporting sectors (Box 43). Evidence shows that new products for export
usually need to become competitive domestically before they can reach export markets. 181
Creating and enforcing quality standards would allow companies to compete and operate on a
more level playing field.
Box 43: Pharmacy Accreditation Programs for Informal Retail Operators – Tanzania
Because they allow access to treatment in areas and conditions where no formal commercial entity could operate at a profit, distribution models that leverage existing physical infrastructures and consumer habits to distribute drugs in remote areas have an enormous development potential. An accreditation and training program and access to microfinance services enabling small rural shops (duka la dawa baridi) to sell essential drugs is a business model that has significant development impact and can also be financially sustainable. Given high retail margins, charging fees for a 40-day training program that allows regular shop owners to sell essential medicines is a viable business model. This has been implemented in Tanzania through the Accredited Drug Dispensing Outlets (ADDO) scheme on a pro-bono basis. However, regular retail shop owners have demonstrated a willingness to pay for this training that includes marketing support in order to enter the lucrative retail drug market. These business models dramatically increase access to drugs for remote populations by increasing the number of medical outlets available. In addition, training programs for small retailers can improve their awareness of counterfeit and substandard products, thus enlisting them as key agents in improving product quality.
Source: Dihel, N. (2011), “Beyond the Nakumatt Generation: Distribution Services in East Africa,” WB policy note 26.
The role of the government is essential, especially through a coordinating agency. The
agency’s coordination role appears as essential in view of the complex sanitary norms imposed
181
Kilroy, A. (2013).
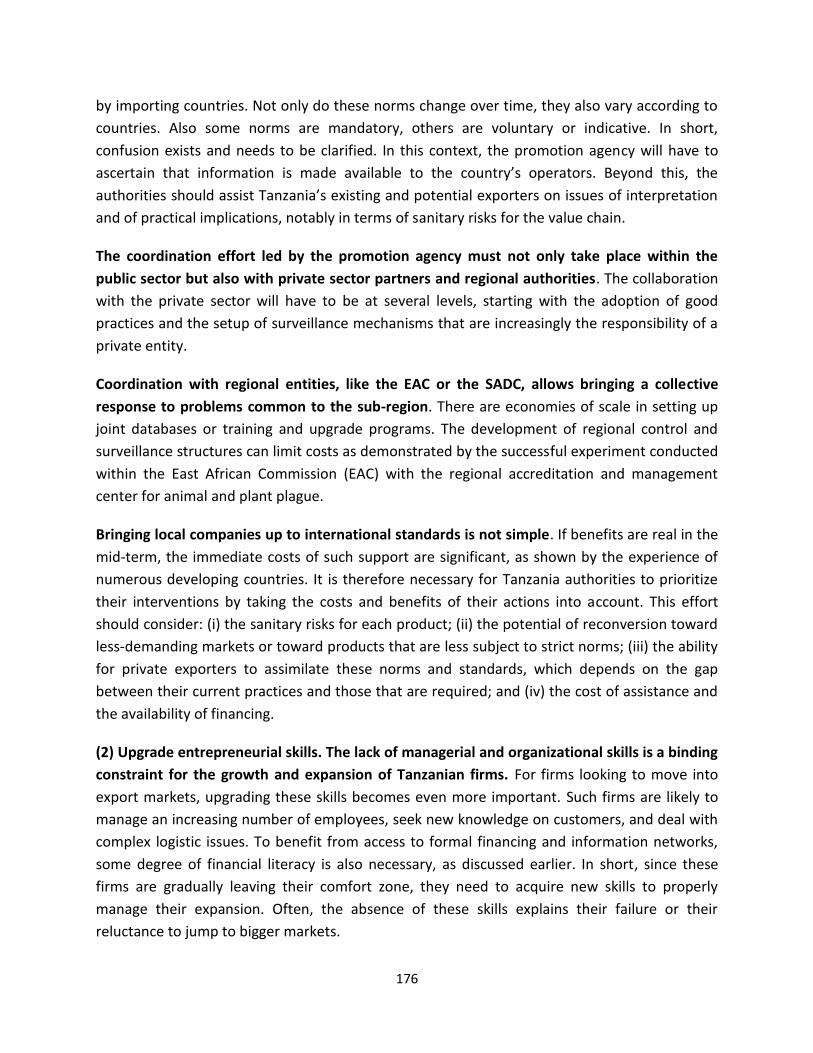
176
by importing countries. Not only do these norms change over time, they also vary according to
countries. Also some norms are mandatory, others are voluntary or indicative. In short,
confusion exists and needs to be clarified. In this context, the promotion agency will have to
ascertain that information is made available to the country’s operators. Beyond this, the
authorities should assist Tanzania’s existing and potential exporters on issues of interpretation
and of practical implications, notably in terms of sanitary risks for the value chain.
The coordination effort led by the promotion agency must not only take place within the
public sector but also with private sector partners and regional authorities. The collaboration
with the private sector will have to be at several levels, starting with the adoption of good
practices and the setup of surveillance mechanisms that are increasingly the responsibility of a
private entity.
Coordination with regional entities, like the EAC or the SADC, allows bringing a collective
response to problems common to the sub-region. There are economies of scale in setting up
joint databases or training and upgrade programs. The development of regional control and
surveillance structures can limit costs as demonstrated by the successful experiment conducted
within the East African Commission (EAC) with the regional accreditation and management
center for animal and plant plague.
Bringing local companies up to international standards is not simple. If benefits are real in the
mid-term, the immediate costs of such support are significant, as shown by the experience of
numerous developing countries. It is therefore necessary for Tanzania authorities to prioritize
their interventions by taking the costs and benefits of their actions into account. This effort
should consider: (i) the sanitary risks for each product; (ii) the potential of reconversion toward
less-demanding markets or toward products that are less subject to strict norms; (iii) the ability
for private exporters to assimilate these norms and standards, which depends on the gap
between their current practices and those that are required; and (iv) the cost of assistance and
the availability of financing.
(2) Upgrade entrepreneurial skills. The lack of managerial and organizational skills is a binding
constraint for the growth and expansion of Tanzanian firms. For firms looking to move into
export markets, upgrading these skills becomes even more important. Such firms are likely to
manage an increasing number of employees, seek new knowledge on customers, and deal with
complex logistic issues. To benefit from access to formal financing and information networks,
some degree of financial literacy is also necessary, as discussed earlier. In short, since these
firms are gradually leaving their comfort zone, they need to acquire new skills to properly
manage their expansion. Often, the absence of these skills explains their failure or their
reluctance to jump to bigger markets.

177
One measure to facilitate the acquisition of these skills at an early age is to include
entrepreneurial and vocational training in the education system. The target would be
relatively educated youth, building on their basic knowledge to improve specific skills. This
would be different from the training programs proposed in the first pillar, which aims at
providing basic knowledge to uneducated workers. This curriculum can be designed with a
practical component to supplement theoretical learning. This has already been successfully
implemented in other countries such as Singapore, where students receive one year of
mandatory entrepreneurship education within the primary school system. In Mexico, students
learn basic economics and business skills before high school, and progress to creating and
managing their own businesses by the time they are 18 years old. The education system in
Mauritius also provides entrepreneurship classes at the primary level. These programs
emphasize group learning, hands-on experience, critical thinking, and decision making skills.
Such best practices can be emulated to increase entrepreneurial education in Tanzania.182
Closer partnerships with the private sector in the design and funding of technical training
programs will help better target those skills that employers have cited as the most important
gaps—management and behavioral skills followed by technical skills.
Currently, Tanzania has two vocational and technical education structures to target skill
building: the VETA and NACTE systems. This structure results in service duplication and other
inefficiencies. The post-technical training employment rate is reported to be only 14 percent183.
There is an urgent need to improve the delivery and design of these services, notably through
private sector involvement. Lessons from international experience have shown that vocational
training programs are most effective when closely aligned with the needs of potential
employers.
The training bodies would be more efficient if the vocational and technical education systems
were unified, where VETA becomes exclusively responsible for skill delivery and NACTE for
accrediting and regulating training. This can be done in coordination with the private
providers, with potential employers in the private sector to ensure quality and match skills.184
Indeed, for such programs to be successful, it is necessary to include mentorship and
networking programs where the private sector can partner with universities to provide support
to budding entrepreneurs. Companies in the private sector can be incentivized to participate in
these skill-building programs through subsidies and tax advantages. Additionally, other
resources such as internet-based training in entrepreneurial management can be leveraged as a 182
Omidyar Network (2012), “Understanding Africa’s Challenges to Creating Opportunity-driven Entrepreneurship,” Developed with Monitor Group. 183
Sabarwal, S. (2013) 184
The recent Big Results Now labs on Business Environment held in March 2014 also released specific recommendations on streamlining and restructuring vocational and technical education systems in Tanzania.
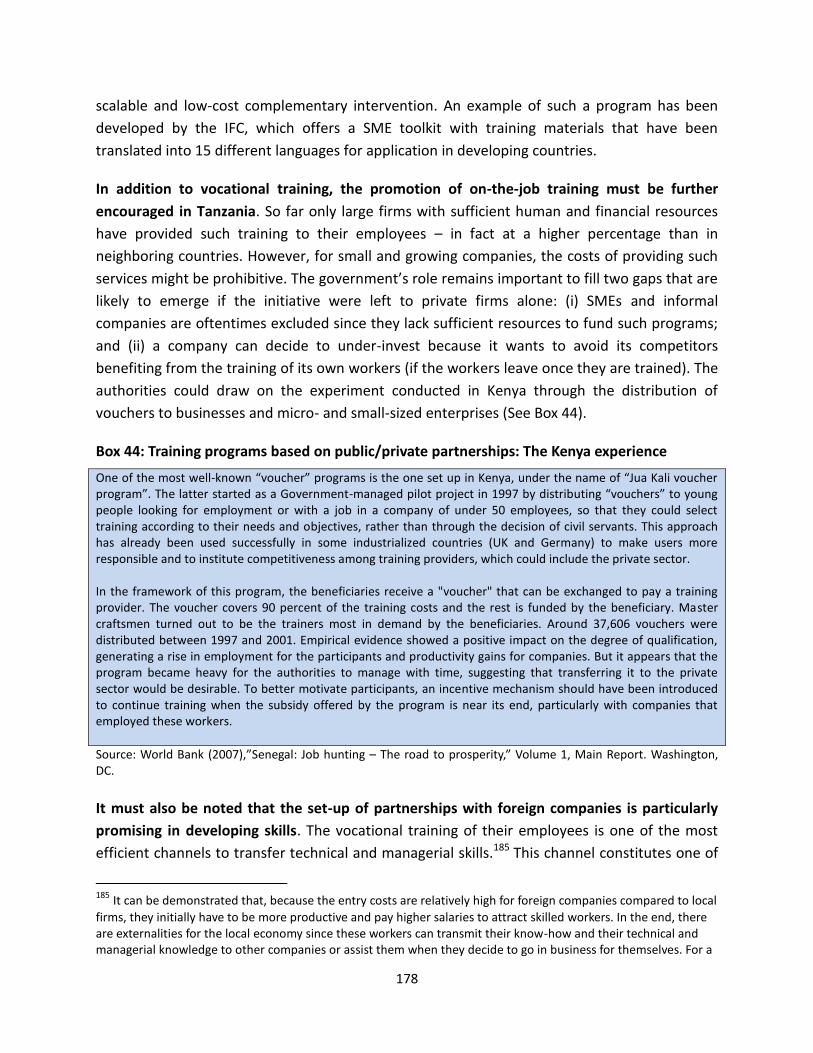
178
scalable and low-cost complementary intervention. An example of such a program has been
developed by the IFC, which offers a SME toolkit with training materials that have been
translated into 15 different languages for application in developing countries.
In addition to vocational training, the promotion of on-the-job training must be further
encouraged in Tanzania. So far only large firms with sufficient human and financial resources
have provided such training to their employees – in fact at a higher percentage than in
neighboring countries. However, for small and growing companies, the costs of providing such
services might be prohibitive. The government’s role remains important to fill two gaps that are
likely to emerge if the initiative were left to private firms alone: (i) SMEs and informal
companies are oftentimes excluded since they lack sufficient resources to fund such programs;
and (ii) a company can decide to under-invest because it wants to avoid its competitors
benefiting from the training of its own workers (if the workers leave once they are trained). The
authorities could draw on the experiment conducted in Kenya through the distribution of
vouchers to businesses and micro- and small-sized enterprises (See Box 44).
Box 44: Training programs based on public/private partnerships: The Kenya experience
One of the most well-known “voucher” programs is the one set up in Kenya, under the name of “Jua Kali voucher program”. The latter started as a Government-managed pilot project in 1997 by distributing “vouchers” to young people looking for employment or with a job in a company of under 50 employees, so that they could select training according to their needs and objectives, rather than through the decision of civil servants. This approach has already been used successfully in some industrialized countries (UK and Germany) to make users more responsible and to institute competitiveness among training providers, which could include the private sector. In the framework of this program, the beneficiaries receive a "voucher" that can be exchanged to pay a training provider. The voucher covers 90 percent of the training costs and the rest is funded by the beneficiary. Master craftsmen turned out to be the trainers most in demand by the beneficiaries. Around 37,606 vouchers were distributed between 1997 and 2001. Empirical evidence showed a positive impact on the degree of qualification, generating a rise in employment for the participants and productivity gains for companies. But it appears that the program became heavy for the authorities to manage with time, suggesting that transferring it to the private sector would be desirable. To better motivate participants, an incentive mechanism should have been introduced to continue training when the subsidy offered by the program is near its end, particularly with companies that employed these workers.
Source: World Bank (2007),”Senegal: Job hunting – The road to prosperity,” Volume 1, Main Report. Washington, DC.
It must also be noted that the set-up of partnerships with foreign companies is particularly
promising in developing skills. The vocational training of their employees is one of the most
efficient channels to transfer technical and managerial skills.185 This channel constitutes one of
185 It can be demonstrated that, because the entry costs are relatively high for foreign companies compared to local
firms, they initially have to be more productive and pay higher salaries to attract skilled workers. In the end, there are externalities for the local economy since these workers can transmit their know-how and their technical and managerial knowledge to other companies or assist them when they decide to go in business for themselves. For a
179
the bases of the South-East Asian countries’ success, who have capitalized on the advantages
provided by the arrival of foreign companies by training their workers who then used their skills
in the local economy.
For this reason, countries like Malaysia and Tunisia have placed the development of
continuous training programs with foreign companies at the heart of their strategy. The
Tanzanian Government should define a proactive policy when negotiating with foreign firms.
This could include setting up incentives in return for continuous education programs, not only
within these companies but also for local SMEs working around the sector. This approach
should be extended to the firms that are selected to carry out large-scale public works (road,
port sites, etc.). Establishing training programs should be a part of their terms of reference and
impact on their selection process. The development of human capital is one of the tangible
benefits that foreign investments can bring a country like Tanzania. This applies even for short-
term projects, since local workers who are trained will stay in the country whereas capital is
mobile and can leave at any time.
(3) Promote technology transfers. Quality will be enhanced by technology. For Tanzanian firms,
technology upgrade is generally the result of the adoption of adaption of innovations developed
elsewhere rather than the outcome of internal research and development efforts. In turn, the
acquisition of new technologies is facilitated for firms (i) using a large share of imported inputs
and equipment, (ii) reporting foreign or joint ownership, and (iii) operating in a competitive
environment.
These findings indicate that policy makers should consider reducing the importation cost
associated with quality inputs and equipment. Concurrently, the promotion of foreign
investment (and joint venture with domestic capital) should be used as a channel to bring new
technologies and skills. Lastly, experience indicates that competition within and between
sectors remains the most effective channel to encourage investment in new technologies.
Using new technologies, beyond the above orientations, might be difficult for a number of individual businesses because of their human and financial constraints. Joint infrastructure and shared production facilities could lower costs and facilitate improvements in product quality. This involves warehousing, cold storage, treatment facilities, and other types of investment that have large minimum sizes for efficiencies at scale, and that would be too costly for individual firm investment. See Box 45 for example of opportunities in Tanzania’s fishing industry.
theoretical approach and empirical evidence of these effects in the case of Denmark, cf. Nikolaj Malchow-Møller, James R. Markusen, and Bertel Schjerning (March 2007), “Foreign Firms, Domestic Wages,” NBER Working paper, N. 13001.

180
Box 45: Potential for gains from joint infrastructure in Fishing Industry
Fishermen around Mwanza contribute 80 percent of Tanzania’s fish, an industry which contributes 1.4 percent of Tanzania’s GDP. Fish for export are supplied to processors, who sell to their network of European Union and Middle East customers. Tanzania faces stiff competition from Vietnam and China, but commands a premium price because it is wild caught rather than farm-raised. Tanzania’s fish industry is reaching maximum production capacity (numbers of fish in Lake Victoria are declining from overfishing), but may have an opportunity to increase the quality and price of fish that are exported. In particular, fisherman and processors could keep more of available profit margins if they were able to process and pack the catch in a supermarket-ready format. This means having access to (i) storage facilities (fixed and mobile cold rooms), and (ii) packaging materials to cater to frozen and fresh fish. Some Tanzanian fish businesses have invested in storage facilities, but cannot do so efficiently at small scale. Government could consider incentivizing the provision of these shared facilities and club goods through a targeted matching grant for investors in them. Incidentally, this requires wider action on electricity (or local power generation), since the main binding constraint on investors in storage facilities is the unreliability of electrical power, since outages can cause very large liabilities for wasted produce in storage.
Source: Kilroy, A. (2013).
There are also certain industries that benefit from joint infrastructure. In these industries, the
probability of survival increases with the number of firms exporting the same product to the
same destination from the same country, suggesting the existence of cross-firm synergies from
clusters. Some Tanzanian entrepreneurs have already invested in such joint infrastructure
facilities. On example of this is DN Products Ltd in Tanzania, which has a timber treatment
facility in Dar es Salaam. This facility is available to other firms to utilize for treating their timber
with alkaline prior to woodworking or furniture production, but other industries may require
public investments, which can then be leased to the private sector to run.
In addition to supporting the financing of joint infrastructure for firms, the government could
in the shorter term assist small firms by providing information on opportunities to build such
infrastructure, and by providing a forum to help solve coordination failures (see Box 46). In
particular, the government should create an entity that can provide ongoing support to clusters
beyond the initial strategy formation stage. This can be led by someone with substantial private
sector experience, and key tasks would include assisting clusters with market and technology
research, monitoring progress against cluster goals, and provide matching grants for cluster
upgrading initiatives.
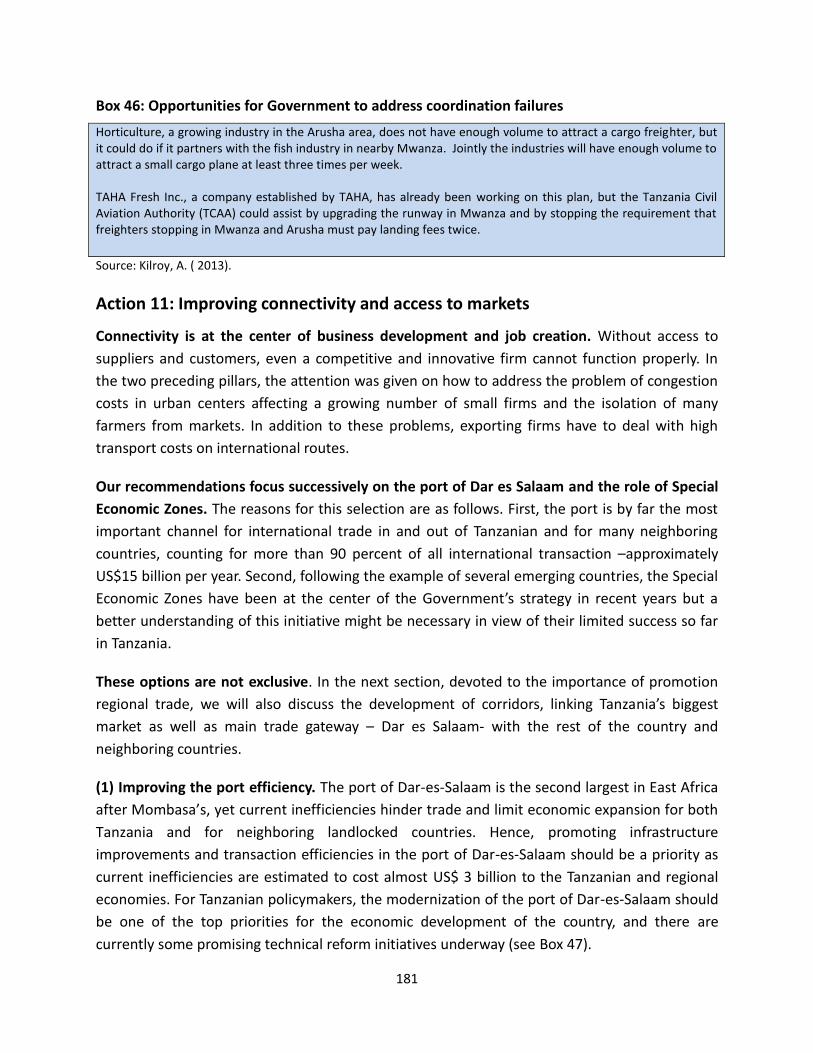
181
Box 46: Opportunities for Government to address coordination failures
Horticulture, a growing industry in the Arusha area, does not have enough volume to attract a cargo freighter, but it could do if it partners with the fish industry in nearby Mwanza. Jointly the industries will have enough volume to attract a small cargo plane at least three times per week. TAHA Fresh Inc., a company established by TAHA, has already been working on this plan, but the Tanzania Civil Aviation Authority (TCAA) could assist by upgrading the runway in Mwanza and by stopping the requirement that freighters stopping in Mwanza and Arusha must pay landing fees twice.
Source: Kilroy, A. ( 2013).
Action 11: Improving connectivity and access to markets
Connectivity is at the center of business development and job creation. Without access to
suppliers and customers, even a competitive and innovative firm cannot function properly. In
the two preceding pillars, the attention was given on how to address the problem of congestion
costs in urban centers affecting a growing number of small firms and the isolation of many
farmers from markets. In addition to these problems, exporting firms have to deal with high
transport costs on international routes.
Our recommendations focus successively on the port of Dar es Salaam and the role of Special
Economic Zones. The reasons for this selection are as follows. First, the port is by far the most
important channel for international trade in and out of Tanzanian and for many neighboring
countries, counting for more than 90 percent of all international transaction –approximately
US$15 billion per year. Second, following the example of several emerging countries, the Special
Economic Zones have been at the center of the Government’s strategy in recent years but a
better understanding of this initiative might be necessary in view of their limited success so far
in Tanzania.
These options are not exclusive. In the next section, devoted to the importance of promotion
regional trade, we will also discuss the development of corridors, linking Tanzania’s biggest
market as well as main trade gateway – Dar es Salaam- with the rest of the country and
neighboring countries.
(1) Improving the port efficiency. The port of Dar-es-Salaam is the second largest in East Africa
after Mombasa’s, yet current inefficiencies hinder trade and limit economic expansion for both
Tanzania and for neighboring landlocked countries. Hence, promoting infrastructure
improvements and transaction efficiencies in the port of Dar-es-Salaam should be a priority as
current inefficiencies are estimated to cost almost US$ 3 billion to the Tanzanian and regional
economies. For Tanzanian policymakers, the modernization of the port of Dar-es-Salaam should
be one of the top priorities for the economic development of the country, and there are
currently some promising technical reform initiatives underway (see Box 47).
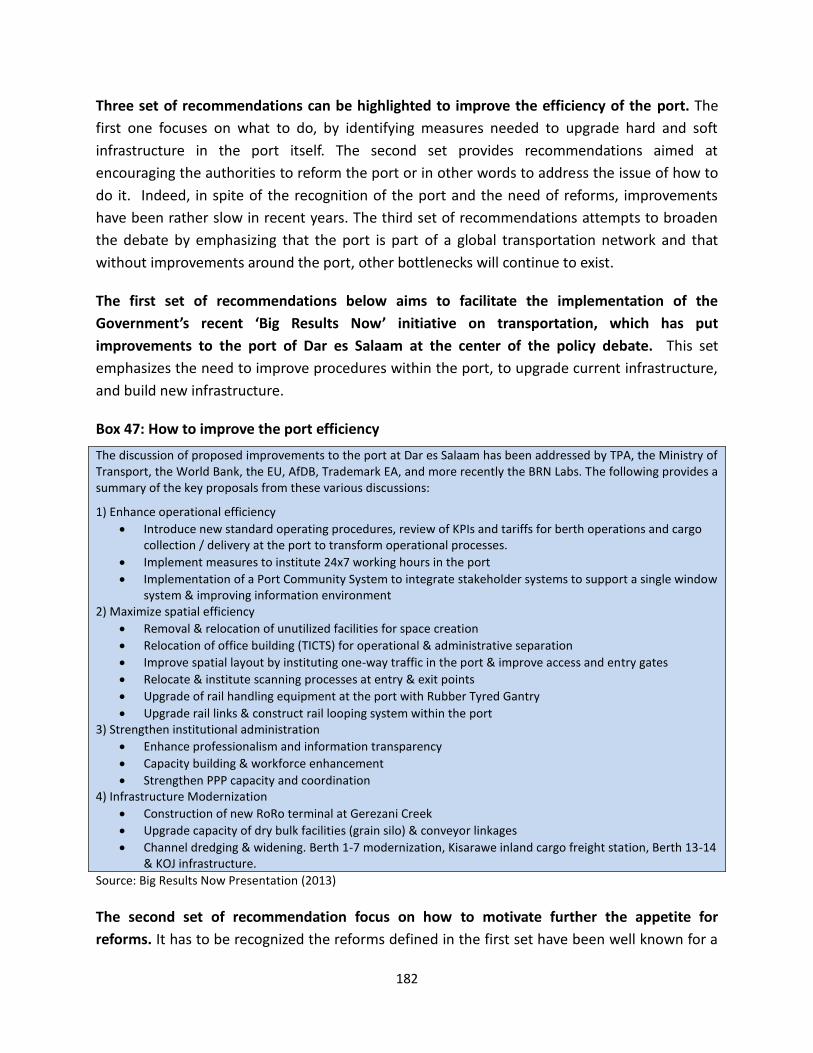
182
Three set of recommendations can be highlighted to improve the efficiency of the port. The
first one focuses on what to do, by identifying measures needed to upgrade hard and soft
infrastructure in the port itself. The second set provides recommendations aimed at
encouraging the authorities to reform the port or in other words to address the issue of how to
do it. Indeed, in spite of the recognition of the port and the need of reforms, improvements
have been rather slow in recent years. The third set of recommendations attempts to broaden
the debate by emphasizing that the port is part of a global transportation network and that
without improvements around the port, other bottlenecks will continue to exist.
The first set of recommendations below aims to facilitate the implementation of the
Government’s recent ‘Big Results Now’ initiative on transportation, which has put
improvements to the port of Dar es Salaam at the center of the policy debate. This set
emphasizes the need to improve procedures within the port, to upgrade current infrastructure,
and build new infrastructure.
Box 47: How to improve the port efficiency
The discussion of proposed improvements to the port at Dar es Salaam has been addressed by TPA, the Ministry of Transport, the World Bank, the EU, AfDB, Trademark EA, and more recently the BRN Labs. The following provides a summary of the key proposals from these various discussions:
1) Enhance operational efficiency
Introduce new standard operating procedures, review of KPIs and tariffs for berth operations and cargo collection / delivery at the port to transform operational processes.
Implement measures to institute 24x7 working hours in the port
Implementation of a Port Community System to integrate stakeholder systems to support a single window system & improving information environment
2) Maximize spatial efficiency
Removal & relocation of unutilized facilities for space creation
Relocation of office building (TICTS) for operational & administrative separation
Improve spatial layout by instituting one-way traffic in the port & improve access and entry gates
Relocate & institute scanning processes at entry & exit points
Upgrade of rail handling equipment at the port with Rubber Tyred Gantry
Upgrade rail links & construct rail looping system within the port 3) Strengthen institutional administration
Enhance professionalism and information transparency
Capacity building & workforce enhancement
Strengthen PPP capacity and coordination 4) Infrastructure Modernization
Construction of new RoRo terminal at Gerezani Creek
Upgrade capacity of dry bulk facilities (grain silo) & conveyor linkages
Channel dredging & widening. Berth 1-7 modernization, Kisarawe inland cargo freight station, Berth 13-14 & KOJ infrastructure.
Source: Big Results Now Presentation (2013)
The second set of recommendation focus on how to motivate further the appetite for
reforms. It has to be recognized the reforms defined in the first set have been well known for a
183
relatively long time. There is also a consensus around them. However, they have been
implemented slowly by the Tanzanian authorities. The recommendations below seek to provide
incentives for reforms by increasing benefits for reformers and losses for those who advocate in
favor or status quo. They are based on the need to provide more information on the current
costs associated to the inefficiency of the costs, to leverage the bargaining power of current
beneficiaries, to fight corruption, and to broaden the decision process to those who are losing
because of the current inefficiency. These measures are summarized as follows:
(a) Increasing end-users’ awareness of costs related to port inefficiency: Many end users are not
aware of the negative impact of the inefficiencies at the port on their welfare. There is a need to
better explain and quantify the costs associated with the current situation to all stakeholders in
Tanzania and in the sub-region. The Government should take the lead in facilitating economic
studies, mobilizing consumer groups and small business associations, conducting end-user
surveys and creating a public awareness campaign including an information booklet setting out
key processes and describing who is responsible for each of these processes.
(b) Reducing the bargaining power of those who currently benefit from the status quo: This
objective can be achieved by reducing existing conflicts of interest that contribute to the risk of
collusive behavior at the expense of end-users. The first action should be to make the
connections between TICTS and decision-makers transparent. This could be achieved by making
public the names of the main local stakeholders of this company. The second action should be
to eliminate the dual role of the TPA, which currently acts as both the landlord and as one of the
two operators in the port. In addition, measures should be implemented to promote greater
transparency in the financial accounts of the TPA.
Promoting a higher level of competition could also reduce the monopolistic power of current
port operators. This can be achieved either through a ‘big bang’ approach or through an
incremental approach. The former would involve the introduction of new port operators and/or
the privatization of the operating arm of TPA. The latter approach could be implemented by
privatizing some activities, such as handling operations and maintenance, or by modifying some
existing practices in the port that reduce the level of competition.
The following measures could be implemented, in descending order of priority: (a) modifying
the call sequencing system for vessels from the current ‘first come, first serve’ system to fixed
berthing windows for shipping lines; (b) refocusing the role of SUMATRA by adopting
transparent regulations based on benchmarks, rather than on discretionary rules; (c) revising
the legal restriction preventing shipping companies from involvement in logistics activities,
since the cost of fragmentation of logistics services is a key source of inefficiency (even though
it might favor the use of local labor); (d) improving the efficiency of freight forwarders and
184
clearing agents by removing inappropriate regulations, increasing transparency in their tariffs
and activities, and penalizing those who operate outside the law. There is no clear reason for
current regulations that stipulate that only local agents can clear cargo in Tanzania and that
shipping agents and lines cannot participate in logistical activities.
(c) Reducing corruption: This would involve the imposition of a true zero-tolerance of
corruption policy through a clear commitment from the top authorities, with serious
monitoring and, when needed, credible sanctions. The use of benchmarks through an
automated system would help monitor the performance of port operators and the TRA. To
reduce corruption, procedures should be simplified through the effective implementation and
use of a one-stop clearing process. In addition, the number of taxes and exemptions should be
reduced. There is also a need for the following actions: (a) Provide good remuneration packages
and working conditions for customs agents to reduce the temptation to engage in corrupt
practices; (b) intensify internal and external controls; and (c) implement credible sanctions in
case of abuses or misuses. Customers should have access to independent and inexpensive
appeal mechanisms.
The methodology used to calculate wharfage fees should be modified from a value-based
system to a fixed-rate system. This would spare agents from the need to negotiate with
clearing agents and importers and contribute both to speeding up the process and to
reinforcing collaboration between private and public operators within the port. Another
important action would be to revise the structure of storage fees so that the structure
encourages importers to minimize the period in which their goods remain in storage.
Thus, the fee structure should penalize importers who store their merchandise for excessive
periods, except if the cause of the delay is due to lengthy clearance processes. Importers who
repeatedly abandon cargo should also be penalized, with the Government instructing the TRA
to auction all abandoned cargo in a timely manner and allocating a budget for the destruction
of cargo that cannot be auctioned or re-exported to points of origin after a delay.
(d) Motivating reformers: The staff of the TPA and TRA could be motivated by the introduction
of performance-based incentives. Such an approach was implemented in the port of Douala in
2010 with successful results. Since the implementation of such a system, the number of
transactions cleared by tax and customs administration has increased by more than 10 percent
and tax revenues have gone up by US$ 16.5 million.
(e) Improving coordination: Coordination failures have long been recognized as a cause of
inefficiency, with these failures justifying the creation of the Port Improvement Committee that
attempts to regroup the most important players involved in the functioning of the port.
However, this committee chaired by the TPA is not efficient due to the conflicting interests of its
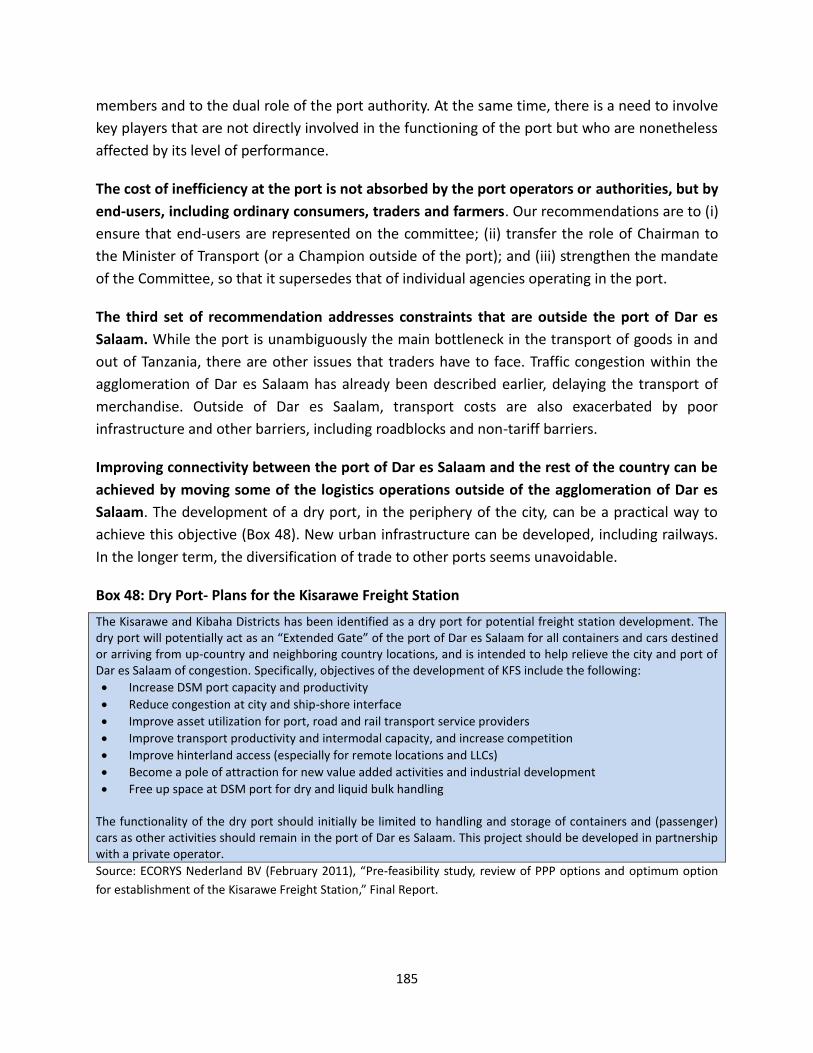
185
members and to the dual role of the port authority. At the same time, there is a need to involve
key players that are not directly involved in the functioning of the port but who are nonetheless
affected by its level of performance.
The cost of inefficiency at the port is not absorbed by the port operators or authorities, but by
end-users, including ordinary consumers, traders and farmers. Our recommendations are to (i)
ensure that end-users are represented on the committee; (ii) transfer the role of Chairman to
the Minister of Transport (or a Champion outside of the port); and (iii) strengthen the mandate
of the Committee, so that it supersedes that of individual agencies operating in the port.
The third set of recommendation addresses constraints that are outside the port of Dar es
Salaam. While the port is unambiguously the main bottleneck in the transport of goods in and
out of Tanzania, there are other issues that traders have to face. Traffic congestion within the
agglomeration of Dar es Salaam has already been described earlier, delaying the transport of
merchandise. Outside of Dar es Saalam, transport costs are also exacerbated by poor
infrastructure and other barriers, including roadblocks and non-tariff barriers.
Improving connectivity between the port of Dar es Salaam and the rest of the country can be
achieved by moving some of the logistics operations outside of the agglomeration of Dar es
Salaam. The development of a dry port, in the periphery of the city, can be a practical way to
achieve this objective (Box 48). New urban infrastructure can be developed, including railways.
In the longer term, the diversification of trade to other ports seems unavoidable.
Box 48: Dry Port- Plans for the Kisarawe Freight Station
The Kisarawe and Kibaha Districts has been identified as a dry port for potential freight station development. The dry port will potentially act as an “Extended Gate” of the port of Dar es Salaam for all containers and cars destined or arriving from up-country and neighboring country locations, and is intended to help relieve the city and port of Dar es Salaam of congestion. Specifically, objectives of the development of KFS include the following:
Increase DSM port capacity and productivity
Reduce congestion at city and ship-shore interface
Improve asset utilization for port, road and rail transport service providers
Improve transport productivity and intermodal capacity, and increase competition
Improve hinterland access (especially for remote locations and LLCs)
Become a pole of attraction for new value added activities and industrial development
Free up space at DSM port for dry and liquid bulk handling The functionality of the dry port should initially be limited to handling and storage of containers and (passenger) cars as other activities should remain in the port of Dar es Salaam. This project should be developed in partnership with a private operator.
Source: ECORYS Nederland BV (February 2011), “Pre-feasibility study, review of PPP options and optimum option
for establishment of the Kisarawe Freight Station,” Final Report.
186
(2) Leverage Special Economic Zones. One way to reduce connectivity costs is to reduce
distances. Clustering firms in specific locations—for example in well-designed special economic
zones—has been an approach chosen by many countries, including Tanzania. One objective of
this is to cut the distance from supply and/or customer markets. The second objective is to
promote synergies across firms established in the cluster. China has demonstrated the benefit of
the special economic zones by reducing transport costs to external markets by locating them
close to ports, and by promoting access to cheap and skilled labor for firms established in these
zones.
The Government of Tanzania has followed such a strategy based on the development of
special zones. There are currently SEZs and export processing zones (EPZs) in place in Tanzania.
There are currently 10 sites allocated for SEZ, but only seven of these have been licensed, and
only one operates as a SEZ in Dar es Salaam. Another is under development in Bagamoyo, and
should not start its operations before 2015. The SEZs have been slow to develop, and have had
limited success in attracting investment and creating employment. The government has taken
some steps to strengthen the SEZ regime by integrating the EPZ program into the SEZ regime,
however `effective SEZ building remains critical to developing export-led growth.
There are two issues that should be addressed by the Tanzanian authorities. The first is to
provide incentive to firms to establish in special economic zones. The second is to improve the
existing legal and institutional framework so that these zones can be developed in an effective
way.
Considering the first issue, the main incentives associated to special zones lie in their capacity
to provide infrastructure that (i) will facilitate synergies between enterprises in one location; (ii)
promote access to customers and suppliers markets, and (iii) reduce operational costs such as
electricity and communication. These incentives will be further encouraged if the authorities
reduce the administrative costs associated with registration and operational procedures
including the hiring of labor. These principles suggest that the Tanzanian authorities should
focus on the development of zones by providing infrastructure and by reducing administrative
costs for the firms interested in locating in those zones. Furthermore, these zones should be
located close to supplier and/or customer markets. As an illustration, potential locations for
agribusiness industries should be close to the region of Arusha/Kilimanjaro due to its high
density of farmers, its proximity of domestic and export markets (Kenya), and the existence of a
relatively good road network. The large existing and potential markets and the access to port
are good reasons for the establishment of such zones within and around Dar es Salaam,
including in Bagamoyo.

187
China has developed thriving zones that are located close to access to external markets
(notably through ports) and are well-equipped in terms of connective infrastructure, as well as
electricity and communication. Furthermore, regulations in these zones have made it easier for
firms to establish, trade, and contract workers. An important point is that these zones have
been successful in their capacity to attract firms by their capacity to reduce registration and
operational costs on a permanent basis, rather by the use of generous tax exemption regimes.
Those might useful at one point in time for a specific type of investor (those with short term
horizons in mobile industries such as textile and ICT) but can rarely be attractive on their own.
Tax incentives are also costly in terms of revenues losses for the Government, and introduce
distortions in the allocation of resources in addition to opening a channel for corruption.
Regarding the second issue related to the institutional and legal frameworks, the following
measures are recommended to building the SEZ program:
(i) Clarify roles and expand private sector participation: currently, the Export Processing Zone
Authority (EPZA) acts both as the regulator of zones, and the developer and operator of the
BWM SEZ, which is the only government developed zone. The best practice in this case is to
separate the roles of owner, developer and operator, which allows the regulatory role to remain
independent from individual zones. For example, in Ghana, the free zone program, under the
Ghana Free Zones Board (GFZB) is a good example which separates out the roles. GFZB does not
undertake any zone development and management activities, and instead focuses on planning,
regulation and promotion of free zones. Additionally, private sector representation within board
members is critical to ensure that the private sector is supported within the zones, both from
the development and investing sides.
(iii) Enhance coordination: The EPZA only has partial independence. While it reports through the
Ministry of Industry and Trade, it is not a department of the ministry. This makes it difficult to
coordinately effectively across public sector agencies. To make coordination more effective, the
EPZA can be placed under a central ministry, preferably the same as the Tanzania Investment
Center (TIC) to leverage synergies and strengthen coordination.
(iv) Budgetary autonomy: The EPZA does not currently have a predictable or independent
budget to plan and carry out activities, as it is allocated through the Ministry of Industry and
Trade, and is often affected by political decisions. To promote efficiencies, the EPZA needs an
independent budget with the ability to directly solicit funds to supplement budget allocations.
(v) Establish an operational M&E framework: The current lack of an operational framework to
monitor the SEZ hinders further program development as well as the capacity to learn from past
mistakes. The SEZ authority should add a monitoring framework that allows for data collection
and measures progress against set goals. One country where this has been implemented is the
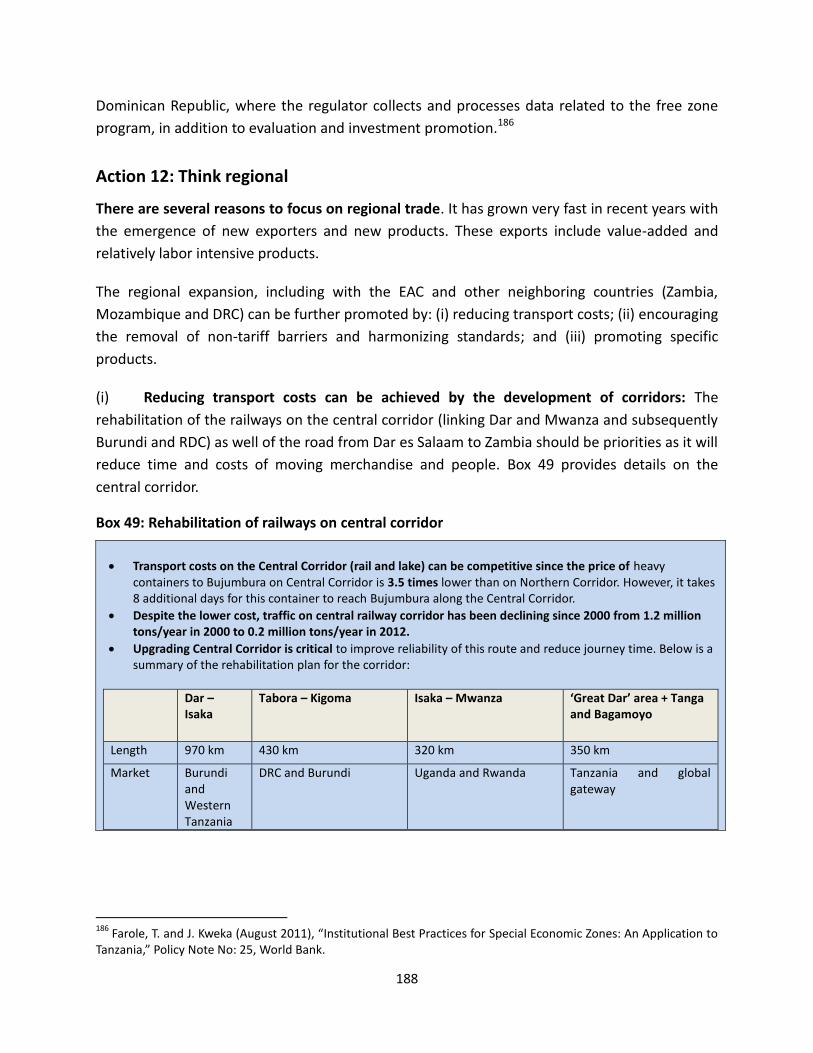
188
Dominican Republic, where the regulator collects and processes data related to the free zone
program, in addition to evaluation and investment promotion.186
Action 12: Think regional
There are several reasons to focus on regional trade. It has grown very fast in recent years with
the emergence of new exporters and new products. These exports include value-added and
relatively labor intensive products.
The regional expansion, including with the EAC and other neighboring countries (Zambia,
Mozambique and DRC) can be further promoted by: (i) reducing transport costs; (ii) encouraging
the removal of non-tariff barriers and harmonizing standards; and (iii) promoting specific
products.
(i) Reducing transport costs can be achieved by the development of corridors: The
rehabilitation of the railways on the central corridor (linking Dar and Mwanza and subsequently
Burundi and RDC) as well of the road from Dar es Salaam to Zambia should be priorities as it will
reduce time and costs of moving merchandise and people. Box 49 provides details on the
central corridor.
Box 49: Rehabilitation of railways on central corridor
Transport costs on the Central Corridor (rail and lake) can be competitive since the price of heavy containers to Bujumbura on Central Corridor is 3.5 times lower than on Northern Corridor. However, it takes 8 additional days for this container to reach Bujumbura along the Central Corridor.
Despite the lower cost, traffic on central railway corridor has been declining since 2000 from 1.2 million tons/year in 2000 to 0.2 million tons/year in 2012.
Upgrading Central Corridor is critical to improve reliability of this route and reduce journey time. Below is a summary of the rehabilitation plan for the corridor:
Dar – Isaka
Tabora – Kigoma Isaka – Mwanza ‘Great Dar’ area + Tanga and Bagamoyo
Length 970 km 430 km 320 km 350 km
Market Burundi and Western Tanzania
DRC and Burundi Uganda and Rwanda Tanzania and global gateway
186
Farole, T. and J. Kweka (August 2011), “Institutional Best Practices for Special Economic Zones: An Application to Tanzania,” Policy Note No: 25, World Bank.
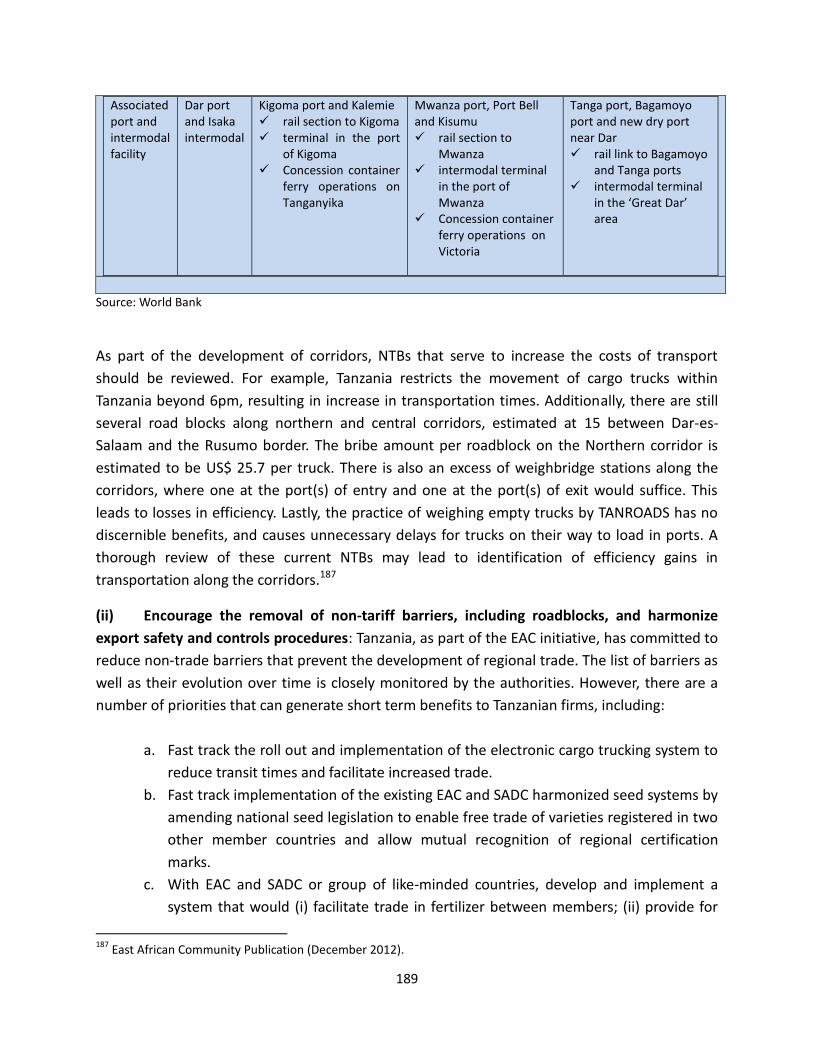
189
Associated port and intermodal facility
Dar port and Isaka intermodal
Kigoma port and Kalemie rail section to Kigoma terminal in the port
of Kigoma Concession container
ferry operations on Tanganyika
Mwanza port, Port Bell and Kisumu rail section to
Mwanza intermodal terminal
in the port of Mwanza
Concession container ferry operations on Victoria
Tanga port, Bagamoyo port and new dry port near Dar rail link to Bagamoyo
and Tanga ports intermodal terminal
in the ‘Great Dar’ area
Source: World Bank
As part of the development of corridors, NTBs that serve to increase the costs of transport
should be reviewed. For example, Tanzania restricts the movement of cargo trucks within
Tanzania beyond 6pm, resulting in increase in transportation times. Additionally, there are still
several road blocks along northern and central corridors, estimated at 15 between Dar-es-
Salaam and the Rusumo border. The bribe amount per roadblock on the Northern corridor is
estimated to be US$ 25.7 per truck. There is also an excess of weighbridge stations along the
corridors, where one at the port(s) of entry and one at the port(s) of exit would suffice. This
leads to losses in efficiency. Lastly, the practice of weighing empty trucks by TANROADS has no
discernible benefits, and causes unnecessary delays for trucks on their way to load in ports. A
thorough review of these current NTBs may lead to identification of efficiency gains in
transportation along the corridors.187
(ii) Encourage the removal of non-tariff barriers, including roadblocks, and harmonize
export safety and controls procedures: Tanzania, as part of the EAC initiative, has committed to
reduce non-trade barriers that prevent the development of regional trade. The list of barriers as
well as their evolution over time is closely monitored by the authorities. However, there are a
number of priorities that can generate short term benefits to Tanzanian firms, including:
a. Fast track the roll out and implementation of the electronic cargo trucking system to
reduce transit times and facilitate increased trade.
b. Fast track implementation of the existing EAC and SADC harmonized seed systems by
amending national seed legislation to enable free trade of varieties registered in two
other member countries and allow mutual recognition of regional certification
marks.
c. With EAC and SADC or group of like-minded countries, develop and implement a
system that would (i) facilitate trade in fertilizer between members; (ii) provide for
187
East African Community Publication (December 2012).
190
acceptance of fertilizer compounds and/or blends approved by another member;
and (iii) allow shipments of fertilizer inspected by another member.
d. A mutual recognition of EAC rules and certificates of origin would reduce border
delays and increase volumes and opportunities for trade. Related, EAC standards
bureaus have varying procedures for issuing certification, and conducting inspection
and testing. Harmonizing certificates and inspections for certain products within the
EAC is recommended to facilitate border trade activities.
e. Coordinate working hours to increase security of travel and avoid delays and extra
costs to doing business. Efforts should be made to have the main borders in the EAC
operate 24 hours for the clearance of goods.
f. Coordinate trade liberalization for professional services with regulatory reform by
implementing the EACs Mutual Recognition Agreements (MRAs) of professional
qualifications and licensing requirements in accounting, architectural and
engineering services.
It is worth noting that in terms of market access, Tanzania is fairly liberalized on the export side;
however the overall trade restrictiveness index (OTRI) for import bundles indicates that Tanzania
lags behind regional peers. For example, Kenya, Rwanda and Uganda range between 8 to 12
percent in terms of percent of restrictiveness, while Tanzania shows 53 percent. This is partly
due to tariffs, and a variety of non-tariff barriers that protect local industries. This tends to shift
resources from export-oriented sectors to import-substitution sectors, and create an anti-export
bias by increasing production costs for exports.
There have been efforts to improve border-crossing processes at border posts through the Joint
Border Committees and One-Stop Border Posts initiative. However, non-tariff barriers remain
prevalent in Tanzania, and at this stage, the following measures are recommended (see
complementary actions for promoting regional trade in next section) with the objective to
improve the regulatory and administrative environment for exports:
1. Undertake a review (by Ministry of Planning) of all licenses and permits required to import
and export on the basis of international guidelines and removal of those that undermine
competitiveness by being redundant or duplicate requirements.188
2. Provide greater clarity and transparency over policies affecting trade, including agricultural
trade.
a. Encourage and assist the roll out of IT solutions for trade facilitation across all relevant
ministries and agencies. IT solutions can play a critical role in reducing the costs of
188
The conclusions of the review should be made available for public discussion.
191
compliance for firms and individuals as well as enabling more effective coordination
across ministries. At present, of the government ministries and agencies that are
involved in facilitating international trade, only the Customs section effectively exploit
the opportunities that computerized solutions offer. In addition, a more effective use of
IT is often essential in allowing agencies to improve the efficiency with which they
implement their regulatory responsibilities. For example, Tanzania authorities claim to
be in the process of implementing an electronic cargo tracking system, which would
substantially increase security and decrease delays in transport.189
b. Communicate trade requirements through an official website, which is periodically
updated. Related, ensure that proposed changes by the government to rules and
procedures affecting trade cannot be implemented without at least four weeks’ notice
for traders through an official website and a newspaper listing.
c. Ensure that traders can obtain and submit all necessary documentation, including
licenses and permits, electronically or at the border.190
d. Review testing requirements for exports and remove requirement for testing by
Tanzanian Standards Bureau, Tanzania Food and Drug Agency (FDA), Tanzania Atomic
Energy Commission, and others agencies for export goods that have international test
certificates showing compliance with standards in the destination market. Currently, the
Tanzania FDA requires companies exporting to Tanzania to register products prior to
exporting. This causes loss of markets, and discourages exporting activities.
3. Introduce an appeal mechanism to allow affected traders the opportunity to contest actions
of trade border officials that seem to be incorrect, unfair or arbitrary.191 One possibility that
is used in other countries is to establish an Ombudsman Office for regulatory issues. Support
a crackdown on corruption at the border and in all agencies regulating trade including
through a cell-phone based reporting and feedback system.
Over the longer run, beyond existing barriers associate to merchandise regional trade, relaxing
restrictions on the free movement of labor, including visa and immigration laws, would help
promote the movement of natural persons, establishment of commercial presence, and cross-
border supply of professional services.192 Currently, Tanzania requires a yellow fever card for
189
East African Community Publication (December 2012), “Status of Elimination of Non-Tariff Barriers in the East African Community,” Volume 5. 190
If licenses and permits have to be obtained from large cities such as Dar-es-Salaam that are far from the border, smaller traders (particularly women traders) cannot travel these distances to obtain licenses, which is one reason why they trade informally. 191
Best practices have been defined by the International Ombudsman Association at http://www.ombudsassociation.org/standards. 192
This should include (i) clearly articulating the economic and social motivation for nationality and residency requirements; (ii) developing transparent criteria and procedures for applying any quantitative restrictions on the
192
other nationalities entering the country from the EAC partner states, and imposes several
different entry tariffs for businesspeople entering from partner states. Removal of the tariffs
would serve to increase mobility across Border States, and reduce the cost of cross border
trade. There are also lengthy procedures for the issuing of visas and work permits among EAC
partner states. For example, Tanzania grants visas for 3 months for EAC citizens, but specifically
prohibits either paid or unpaid employment on these entry visas.193
(ii) Promotion of products with high export potential: Tanzania exporters have been
successful in selling some products on regional markets, including the following (by order of
importance): furniture, paper and paperboards, electric transformers, and a variety of
agriculture products (tea, rice, sugar and fish) (see Table 30). Since 2008, the fast growing
export categories have been manufacturing products such as (i) plastic tubes, pipes and hoses
(up by 26384 percent) , (ii) glass bottles, flasks, jars, pots (up by 4626 percent), and (iii)
fertilizers (up by 500 percent), and cement (up by 235 percent). Some food exports have also
surged, including sugar and rice. These trends suggest possible direction for export promotion
following ‘the principle of pushing further what is already moving’ (see part 2.3 for a fuller
discussion on this principle).
Working with EAC partners might also be considered to encourage the emergence of regional
services. As discussed below, the promotion of regional tourism can be useful to not only attract
regional tourists but also reduce marketing and transporting costs of global tourists coming to
the region. There might also be opportunities for professional education hubs in Tanzania.
movement of professionals, such as economic needs tests; (iii) minimizing restrictions on the forms of establishment allowed; and (iv) developing a transparent and consistent framework for accepting professionals with foreign qualifications. 193
East African Community Publication (December 2012).
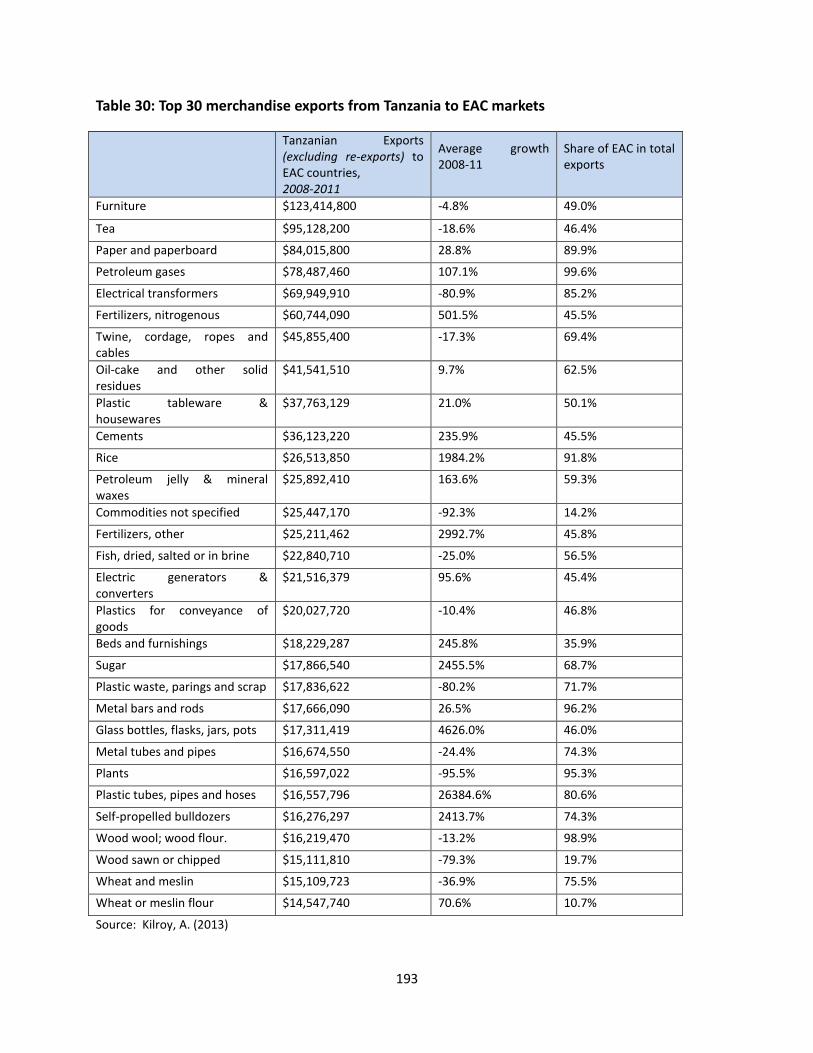
193
Table 30: Top 30 merchandise exports from Tanzania to EAC markets
Tanzanian Exports (excluding re-exports) to EAC countries, 2008-2011
Average growth 2008-11
Share of EAC in total exports
Furniture $123,414,800 -4.8% 49.0%
Tea $95,128,200 -18.6% 46.4%
Paper and paperboard $84,015,800 28.8% 89.9%
Petroleum gases $78,487,460 107.1% 99.6%
Electrical transformers $69,949,910 -80.9% 85.2%
Fertilizers, nitrogenous $60,744,090 501.5% 45.5%
Twine, cordage, ropes and cables
$45,855,400 -17.3% 69.4%
Oil-cake and other solid residues
$41,541,510 9.7% 62.5%
Plastic tableware & housewares
$37,763,129 21.0% 50.1%
Cements $36,123,220 235.9% 45.5%
Rice $26,513,850 1984.2% 91.8%
Petroleum jelly & mineral waxes
$25,892,410 163.6% 59.3%
Commodities not specified $25,447,170 -92.3% 14.2%
Fertilizers, other $25,211,462 2992.7% 45.8%
Fish, dried, salted or in brine $22,840,710 -25.0% 56.5%
Electric generators & converters
$21,516,379 95.6% 45.4%
Plastics for conveyance of goods
$20,027,720 -10.4% 46.8%
Beds and furnishings $18,229,287 245.8% 35.9%
Sugar $17,866,540 2455.5% 68.7%
Plastic waste, parings and scrap $17,836,622 -80.2% 71.7%
Metal bars and rods $17,666,090 26.5% 96.2%
Glass bottles, flasks, jars, pots $17,311,419 4626.0% 46.0%
Metal tubes and pipes $16,674,550 -24.4% 74.3%
Plants $16,597,022 -95.5% 95.3%
Plastic tubes, pipes and hoses $16,557,796 26384.6% 80.6%
Self-propelled bulldozers $16,276,297 2413.7% 74.3%
Wood wool; wood flour. $16,219,470 -13.2% 98.9%
Wood sawn or chipped $15,111,810 -79.3% 19.7%
Wheat and meslin $15,109,723 -36.9% 75.5%
Wheat or meslin flour $14,547,740 70.6% 10.7%
Source: Kilroy, A. (2013)
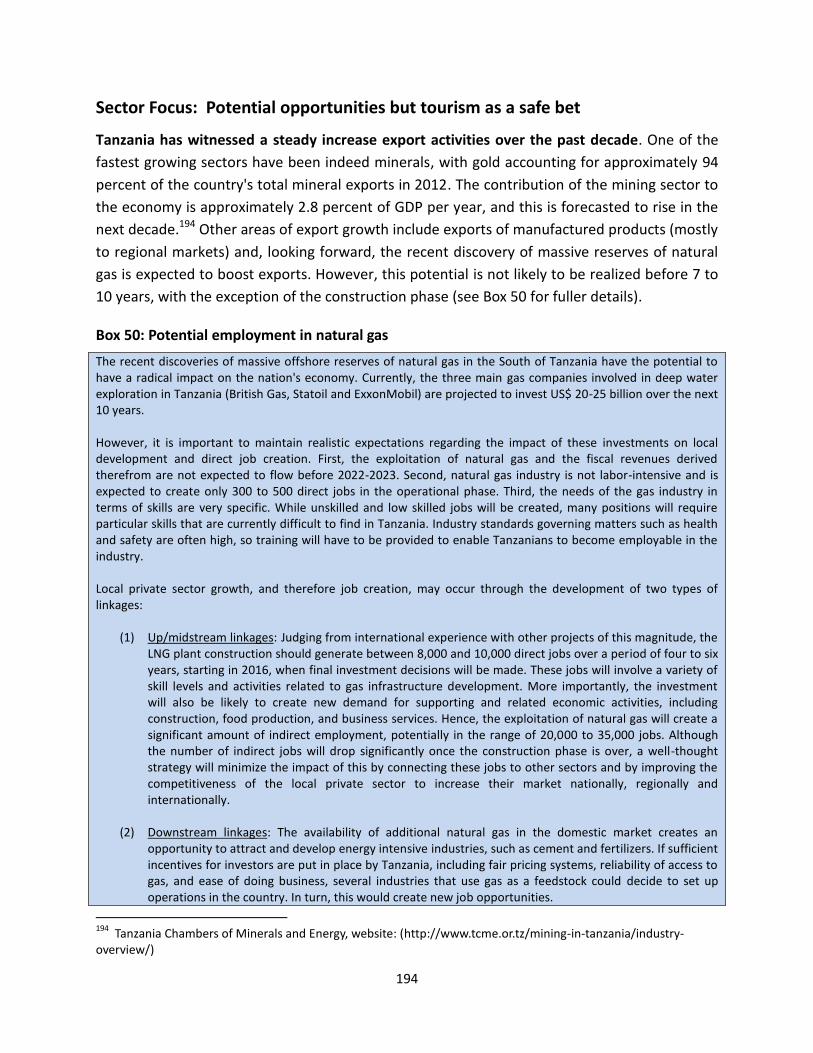
194
Sector Focus: Potential opportunities but tourism as a safe bet
Tanzania has witnessed a steady increase export activities over the past decade. One of the
fastest growing sectors have been indeed minerals, with gold accounting for approximately 94
percent of the country's total mineral exports in 2012. The contribution of the mining sector to
the economy is approximately 2.8 percent of GDP per year, and this is forecasted to rise in the
next decade.194 Other areas of export growth include exports of manufactured products (mostly
to regional markets) and, looking forward, the recent discovery of massive reserves of natural
gas is expected to boost exports. However, this potential is not likely to be realized before 7 to
10 years, with the exception of the construction phase (see Box 50 for fuller details).
Box 50: Potential employment in natural gas
The recent discoveries of massive offshore reserves of natural gas in the South of Tanzania have the potential to have a radical impact on the nation's economy. Currently, the three main gas companies involved in deep water exploration in Tanzania (British Gas, Statoil and ExxonMobil) are projected to invest US$ 20-25 billion over the next 10 years. However, it is important to maintain realistic expectations regarding the impact of these investments on local development and direct job creation. First, the exploitation of natural gas and the fiscal revenues derived therefrom are not expected to flow before 2022-2023. Second, natural gas industry is not labor-intensive and is expected to create only 300 to 500 direct jobs in the operational phase. Third, the needs of the gas industry in terms of skills are very specific. While unskilled and low skilled jobs will be created, many positions will require particular skills that are currently difficult to find in Tanzania. Industry standards governing matters such as health and safety are often high, so training will have to be provided to enable Tanzanians to become employable in the industry. Local private sector growth, and therefore job creation, may occur through the development of two types of linkages:
(1) Up/midstream linkages: Judging from international experience with other projects of this magnitude, the LNG plant construction should generate between 8,000 and 10,000 direct jobs over a period of four to six years, starting in 2016, when final investment decisions will be made. These jobs will involve a variety of skill levels and activities related to gas infrastructure development. More importantly, the investment will also be likely to create new demand for supporting and related economic activities, including construction, food production, and business services. Hence, the exploitation of natural gas will create a significant amount of indirect employment, potentially in the range of 20,000 to 35,000 jobs. Although the number of indirect jobs will drop significantly once the construction phase is over, a well-thought strategy will minimize the impact of this by connecting these jobs to other sectors and by improving the competitiveness of the local private sector to increase their market nationally, regionally and internationally.
(2) Downstream linkages: The availability of additional natural gas in the domestic market creates an opportunity to attract and develop energy intensive industries, such as cement and fertilizers. If sufficient incentives for investors are put in place by Tanzania, including fair pricing systems, reliability of access to gas, and ease of doing business, several industries that use gas as a feedstock could decide to set up operations in the country. In turn, this would create new job opportunities.
194
Tanzania Chambers of Minerals and Energy, website: (http://www.tcme.or.tz/mining-in-tanzania/industry-overview/)
195
In addition to these two types of linkages, the gas industry will also result in the development of new infrastructure, such as ports, that, if strategically planned, could be used to create and boost other economic activities, including through the development of growth poles and special economic zones. Such a strategy has been recently applied by Madagascar, in partnership with Rio Tinto, and in Mozambique, with some degree of success in each case. Furthermore, once substantial fiscal revenues are generated by the industry, the Government will have the opportunity to promote the development of physical and human capital in the country, both of which are key factors for enhancing the overall productivity of the economy and for increasing the number of available productive jobs. This, however, supposes an agreement on how to distribute those revenues between the central and local governments, as well as the capacities to manage and absorb those revenues. These induced jobs, defined as direct and indirect jobs created by the reinvestment of revenues derived by the oil and gas industry, can also be estimated by using multipliers developed in previous studies. The ratio of direct to induced jobs could potentially vary between 6.6 to 8.4, which means that the number of induced jobs created could reach from 60,000 to 80,000 jobs.
Source: World Bank
On top of merchandise exports, Tanzania has shown dynamism in services. Furthermore, the
analysis in part 2 of this study has indicated that Tanzania owns some latent comparative
advantages in transit services (since Tanzania is a regional hub). Tourism is certainly the sub-
sector with the most potential for job creation, given Tanzania’s comparative advantage and
the multiplier (direct and indirect) job effects associated to its development.
Tourism is already a big contributor to the economy of Tanzania. In 2012, tourism contributed
directly and indirectly about US$ four billion (over 13 percent of GDP), and 1.5 percent in total
employment. Tourism is the second largest source of foreign exchange (over US$ 1.7 billion in
2012), narrowly exceeded by gold exports. It is also the third largest recipient sector of FDI after
mining and manufacturing. However, although Tanzania has world class attractions, and over
the last 15 years witnessed rapid growth of visitors, this sector has not yet developed up to its
full potential, especially outside of the congested wildlife-based Northern Circuit. Going the
next step for Tanzania would require clearer political commitment from the top, closer
coordination between the Government and private operators, and the identification of what
and where to promote.
Promoting further the tourism sector in Tanzania can be justified for at least four reasons.
Firstly, countries with tourism assets like Tanzania have a natural comparative advantage in
developing a competitive industry. Tanzania is one of the world’s mega-biodiverse countries
with a globally and regionally unique natural asset base. It’s spectacular and well-protected
natural endowment – including the world’s largest remaining wildlife migration in the
Serengeti, the tallest mountain in Africa, and long, coral-reef fringed, coastline, sets it apart
from its other competitors.
196
Secondly, tourism is a labor intensive industry with significant opportunity to create jobs.
Tourism can enhance job creation by stimulating demand and investment in the economy.
Economic analysis shows tourism as a good case of a labor intensive industry, and one with
significant linkages with many other sectors of the economy (see Kweka et al, 2003). This
means that by promoting tourism, the country can trigger growth in many sectors, some of
which also have high employment multiplier effects (e.g. agriculture). The high multiplier and
linkage effects imply that tourism can add more value to the economy and become a strong
catalyst for structural transformation. Moreover, tourism activities can produce demonstration
effects by putting the country (or regions) on the map of potential investors. In Mauritius, for
instance, some visitors were convinced after their stay to invest in health centers and hospitals.
Thirdly, tourism can help improve the country’s export performance and competitiveness. In
a low income country such as Tanzania, entering and succeeding in export markets is a costly
process for firms. Tourism can encourage export performance and diversification in two ways.
First, through its direct and indirect foreign exchange earnings, tourism has become one of the
three most significant sources of exports in Tanzania. The significant growth of international
tourism industry in Tanzania is associated with rise in export performance. Second, tourism
facilitates learning, acts as a springboard for product promotion abroad and can impart skills
and technology needed to improve competitiveness and supply capacity. According to the
empirical evidence on Nepal195), tourism will improve export performance of firms that are
currently exporting touristic products (promotion effect) and will facilitate entry of new firms
into export markets of touristic products by reducing costs for firms.
Finally, tourism is a magnet for Foreign Direct Investment with potential local value-addition.
Promoting tourism is associated with increased inflows of FDI, which in turn brings many more
benefits to the economy in addition to capital investment (e.g. skills and technology transfer).
Existing evidence (e.g. UNCTAD, 2008) suggests that tourism hotels with significant foreign
ownership pay higher wages, fund more training, and generate more impact in the local
economy. A foreign-owned hotel is 11 times more likely to offer training compared to a locally
owned hotel (UNCTAD, 2008). However, local value addition has been limited by lack of
favorable market conditions such as quality standards, supply chains, and capacity. For
example, hotels operating in Tanzania revealed that 15–25 percent of the local food production
(fruits and vegetables, meats, fish, etc.) were not usable because of low local quality controls.
As a consequence, hotels have to clean, sort, grade, and process and repack items purchased
locally or have to import these products. The UNCTAD study shows that, on average, an
195
Jose Guilherme Reis and Gonzalo Varela (2013), “Can Tourism Encourage Better Export Performance and Diversification in Nepal?” Economic Premise, No. 127. World Bank.
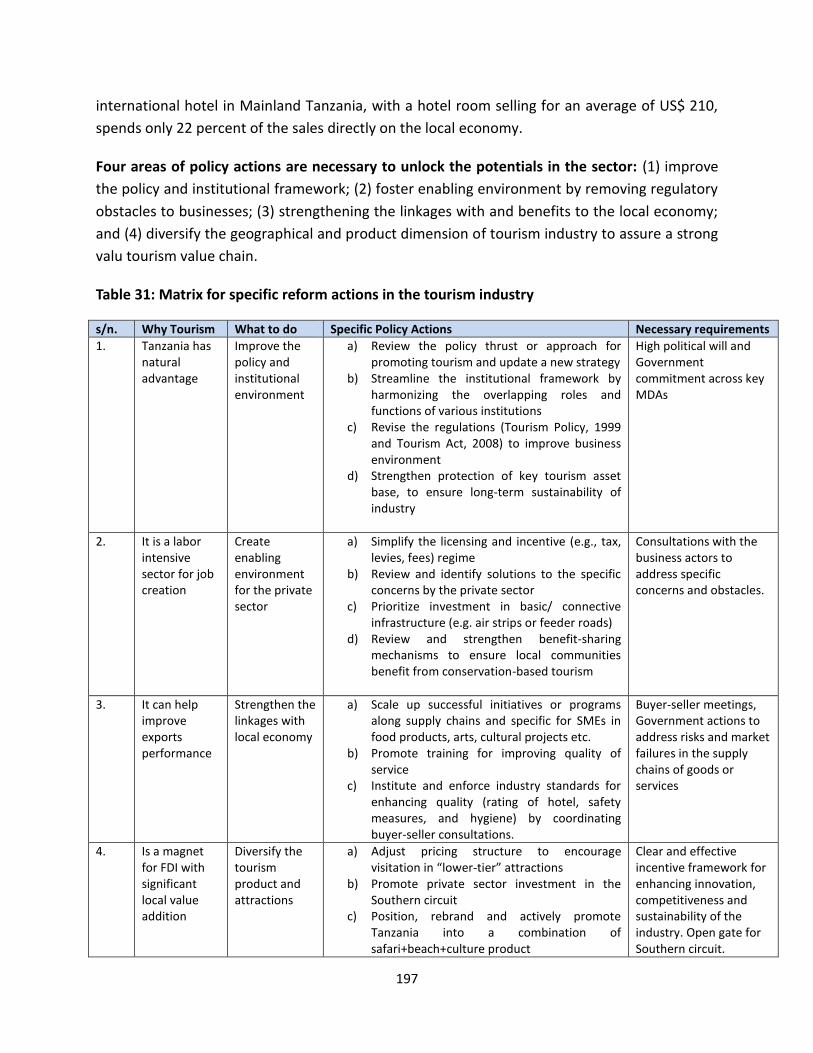
197
international hotel in Mainland Tanzania, with a hotel room selling for an average of US$ 210,
spends only 22 percent of the sales directly on the local economy.
Four areas of policy actions are necessary to unlock the potentials in the sector: (1) improve
the policy and institutional framework; (2) foster enabling environment by removing regulatory
obstacles to businesses; (3) strengthening the linkages with and benefits to the local economy;
and (4) diversify the geographical and product dimension of tourism industry to assure a strong
valu tourism value chain.
Table 31: Matrix for specific reform actions in the tourism industry
s/n. Why Tourism What to do Specific Policy Actions Necessary requirements
1. Tanzania has natural advantage
Improve the policy and institutional environment
a) Review the policy thrust or approach for promoting tourism and update a new strategy
b) Streamline the institutional framework by harmonizing the overlapping roles and functions of various institutions
c) Revise the regulations (Tourism Policy, 1999 and Tourism Act, 2008) to improve business environment
d) Strengthen protection of key tourism asset base, to ensure long-term sustainability of industry
High political will and Government commitment across key MDAs
2. It is a labor intensive sector for job creation
Create enabling environment for the private sector
a) Simplify the licensing and incentive (e.g., tax, levies, fees) regime
b) Review and identify solutions to the specific concerns by the private sector
c) Prioritize investment in basic/ connective infrastructure (e.g. air strips or feeder roads)
d) Review and strengthen benefit-sharing mechanisms to ensure local communities benefit from conservation-based tourism
Consultations with the business actors to address specific concerns and obstacles.
3. It can help improve exports performance
Strengthen the linkages with local economy
a) Scale up successful initiatives or programs along supply chains and specific for SMEs in food products, arts, cultural projects etc.
b) Promote training for improving quality of service
c) Institute and enforce industry standards for enhancing quality (rating of hotel, safety measures, and hygiene) by coordinating buyer-seller consultations.
Buyer-seller meetings, Government actions to address risks and market failures in the supply chains of goods or services
4. Is a magnet for FDI with significant local value addition
Diversify the tourism product and attractions
a) Adjust pricing structure to encourage visitation in “lower-tier” attractions
b) Promote private sector investment in the Southern circuit
c) Position, rebrand and actively promote Tanzania into a combination of safari+beach+culture product
Clear and effective incentive framework for enhancing innovation, competitiveness and sustainability of the industry. Open gate for Southern circuit.
198
(1) Improve the policy and institutional environment to enhance the broader and
transformative role of tourism in the economy. A number of policy issues require review if
Tanzania’s tourism industry is to achieve its full job-creation potential. Firstly, the tourism
sector’s current strategy is not entirely consistent with government’s overall job creation
targets. Arguably, the low-volume high-value (LVHV) approach was a rational response to
the problem of the over-utilised Northern circuit. It provides substantial financial benefits
because many visitors are ready to pay the price for this exceptional asset. However, such
approach might not be optimal for other areas (e.eg. beach tourism) where too high prices
can deter potential visitors. Secondly, the sector suffers from an unfavourable policy and
regulatory environment that has prompted sustained concerns by the business sector. The
Tourism Act (2008) and its related regulations, do not provide the enabling environment nor
investment-friendly regulations. Thirdly, the current institutional framework is inadequate
for delivering key supporting services to the tourism sector. In particular, core transport
infrastructure, access to land, skills, and promotion activities all handicap the tourism
industry. Finally, to enhance sustainability, policy measures are required to diversify the
industry in terms of product and location, and care must be taken to ensure that other
development initiatives do not undermine the wildlife base on which the vast majority of
Tanzania’s tourism depends.
(2) Foster an Effective Enabling Environment for the Private sector. As a private sector led
cross-cutting industry attractive to small investors and corporate entities, tourism is highly
sensitive to an unfavorable business environment. Tanzania’s Tourism Policy (1999), Tourism
Act (2008), and related regulations address a number of key aspects of the industry, but do not
fully provide an enabling environment nor investment friendly regulations (Box 51). Tourism
development is about preservation and attracting the private sector investors; it is about
government policies and activities (such as promotion and marketing) that enable the private
sector to invest, employ, train, etc. This requires both trust and continuous communication
including to communities as well as across the government. By developing tourism value chains
with strong forward and backward linkages, the industry can create considerable pro-poor
growth in Tanzania. However, sustainable development of the industry requires not only the
large scale and foreign investment, but also a dynamic SME sector. Traditional landowners and
community stakeholders have typically been excluded from the tourism development process.
A variety of constraints have made SME development challenging, thus compromising
expansion of local value chains. For tourism to play a more pronounced role in the economy in
general, and in employment generation in particular, such constraints including extensive
regulations, lack of access to productive inputs, and other factors underlying the investment
climate for SMEs need to be addressed.

199
Key policy actions include the following:
a) Revise the regulations in consultation with the private sector to rationalize the current
cumbersome licensing and tax regime.
b) Identify training and skills needs for the industry and support innovations in product
development to enhance competitiveness and develop a broader mix of tourism
offerings.
c) Prioritize investment in key connective infrastructure (e.g., air strips or connecting
roads) that would have immediate impact in unlocking potential attractions or
leveraging existing ones.
d) Revisit the Wildlife Management Area model to ensure tourism benefits adequately
reach communities.
e) Commit to significant dedicated promotion and marketing to enable communication of
offerings and opportunities through policies which enable accountability and efficiency.
Box 51: Key Concerns by the Business Community on Tanzania’s Policy (1999) and Act (2008).
Overlapping functions and parallel institutional structures breed inefficiency and coordination failure and increase transaction cost of dealing with the public sector. Tanzania’s main tourism assets are managed by the Tanzania National Parks (TANAPA), which is self-sustaining and independent of other Government entities. The Tanzania Tourism Board (TTB), Tanzania National Parks Authority (TANAPA) and Ngorongoro Conservation Authority (NCA) undertake parallel promotional programs with little if any synergy.
The sector is extensively regulated (different and often inconsistent licensing requirements) making it particularly difficult for SMEs to enter. The Tourism Act was supposed to add some clarification to standards and requirements for hotels and tour operators, but in many aspects it complicated the situation, to the consternation of many operators. Requirements such as hotel management degrees for all managers should be phased in rather than immediately applicable if not entirely left to market mechanism. The hotel standardization system creates opportunities for corruption (as it is administered by the government). A major shortcoming is the lack of private sector representation on MNRT’s technical advisory committee on the Tourism Act – only three out of 15 members are with the private sector. Also, there are lengthy procedures for business licensing and limitations on the number and kind of allowable imported goods.
Weak incentive framework discourages investment in the sector. Limited product promotion (especially if it is outside of Northern Circuit), and lack of incentives to develop domestic tourism. “Fiscal regime is still far too onerous”. According to TCT and Zanzibar Association of Tourism Investors (ZATI) officials, over 300 laws, fees and regulations are imposed on the industry. The labor supply is low-skilled and opportunities to train employees are very limited (apart from on-the-job training).
Source: Abridged from a report on “Tanzania: Review of Tourism Sector Policy and Strategies” by Scott Wayne
(Consultant), and consultations with key stakeholders during the follow up mission in October, 2011.
(3) Strengthening Tourism Linkages with the Local Economy. There are significant
opportunities for amplifying the benefit of tourism at the local level by promoting forward and
backward linkages with the local economy. The most important of these require assisting local
entrepreneurs to increase the value of their production through the following actions:
200
a) Improve techniques for processing and enforcement of quality standards for fruits and
vegetables, meat, and other food products.
b) Increasing shelf life and hygiene with packaging and storage.
c) Improve the value of locally made furniture through increased capacity and better-
trained employees.
d) Enhance communication between buyers and sellers for timely delivery and availability
(e.g. support central market for hoteliers and bulk market).
Nonetheless, these linkages are not being fully leveraged because of supply side constraints
in limited availability of variety and quantity, as well as relatively low quality. For example,
most of the construction materials are imported, including glass (Spain and Dubai), card locks
(Sweden), and even doors (Kenya). Some of the products from agriculture are not of uniform
quality. This is a big problem especially for big hotels, although small hotels do not seem as
concerned. To ameliorate this problem, the Shoprite supermarket in Dar is facilitating local
producers in the Mbagala area through training and supply contracts to grow and supply
uniform quality fruits and vegetables for their business and other customers, including tourist
hotels. The government could build mechanisms for such initiatives to be scaled to amplify their
impact, or roll these initiatives out to other products/sectors to impart broader impact.
(4) Diversify the tourism product and attractions. It is about what kind of tourism and where
the tourism is developed. There are areas in Tanzania where tourism can be developed that will
support preservation of cultural, heritage and natural assets (including wildlife) while also
generating jobs and firms where it would otherwise be difficult to do..it is again, not just what
but also where. Sustainable tourism in Tanzania will require developing, for example, the
Southern Circuit (Selous, Ruaha, Udzungwa, etc.), in order to relieve pressure on the Northern
Circuit, and to develop a product mix that fully taps the various tourist assets in the country –
and growing demand for tourism across Africa by traditional and intra-African markets. To
achieve successful diversification in terms of geographical span and product mix, Tanzania’s
tourism offer needs to be expanded to keep pace with recent industry trends and to meet the
preferences of the broader, mid-value visitor segment that has higher employment elasticity.
This entails increased emphasis on developing a tourism value chain through diversification sich
as development of the Southern Circuit wildlife viewing opportunities and building up a
combined beach, cultural-heritage, and wildlife safari offer by utilizing coastal areas, historical
sites, and opportunities for community-engaged and adventure tourism. This will require the
following actions:
a) Development of infrastructure to facilitate access and connection to different zones;
land availability, improvement of labor force skills, and promotion of a competitive
product.
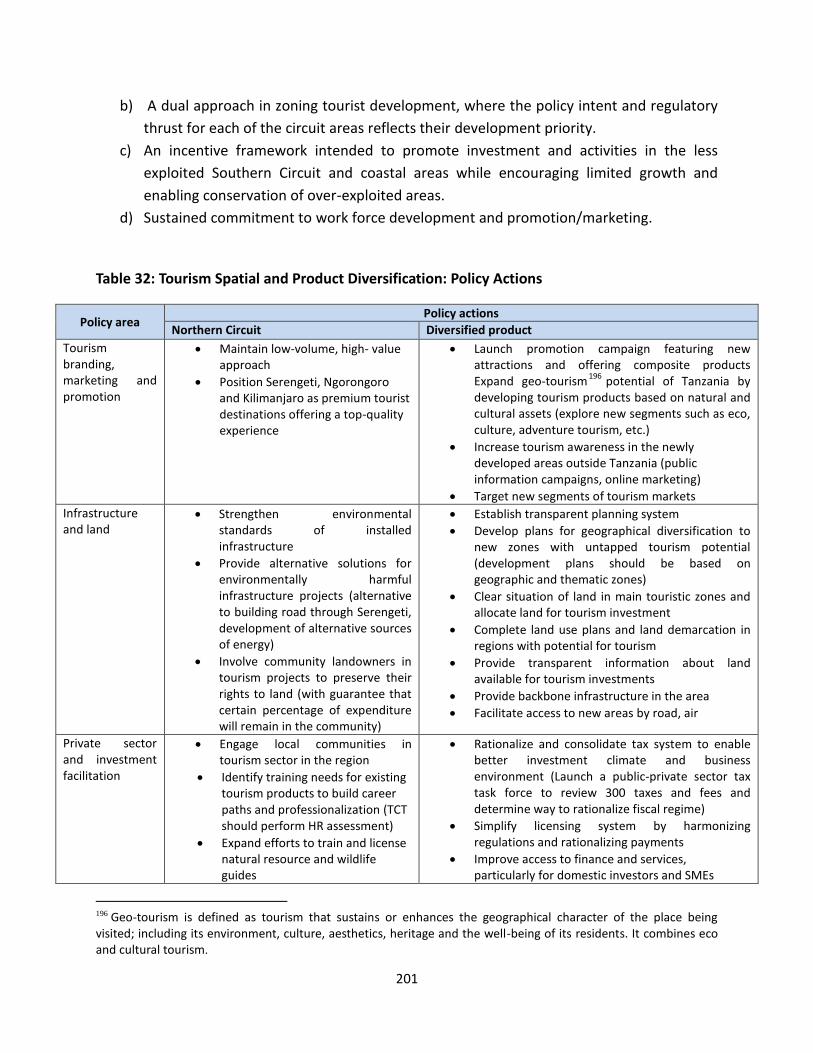
201
b) A dual approach in zoning tourist development, where the policy intent and regulatory
thrust for each of the circuit areas reflects their development priority.
c) An incentive framework intended to promote investment and activities in the less
exploited Southern Circuit and coastal areas while encouraging limited growth and
enabling conservation of over-exploited areas.
d) Sustained commitment to work force development and promotion/marketing.
Table 32: Tourism Spatial and Product Diversification: Policy Actions
Policy area Policy actions
Northern Circuit Diversified product
Tourism branding, marketing and promotion
Maintain low-volume, high- value approach
Position Serengeti, Ngorongoro and Kilimanjaro as premium tourist destinations offering a top-quality experience
Launch promotion campaign featuring new attractions and offering composite products Expand geo-tourism
196 potential of Tanzania by
developing tourism products based on natural and cultural assets (explore new segments such as eco, culture, adventure tourism, etc.)
Increase tourism awareness in the newly developed areas outside Tanzania (public information campaigns, online marketing)
Target new segments of tourism markets
Infrastructure and land
Strengthen environmental standards of installed infrastructure
Provide alternative solutions for environmentally harmful infrastructure projects (alternative to building road through Serengeti, development of alternative sources of energy)
Involve community landowners in tourism projects to preserve their rights to land (with guarantee that certain percentage of expenditure will remain in the community)
Establish transparent planning system
Develop plans for geographical diversification to new zones with untapped tourism potential (development plans should be based on geographic and thematic zones)
Clear situation of land in main touristic zones and allocate land for tourism investment
Complete land use plans and land demarcation in regions with potential for tourism
Provide transparent information about land available for tourism investments
Provide backbone infrastructure in the area
Facilitate access to new areas by road, air
Private sector and investment facilitation
Engage local communities in tourism sector in the region
Identify training needs for existing tourism products to build career paths and professionalization (TCT should perform HR assessment)
Expand efforts to train and license natural resource and wildlife guides
Rationalize and consolidate tax system to enable better investment climate and business environment (Launch a public-private sector tax task force to review 300 taxes and fees and determine way to rationalize fiscal regime)
Simplify licensing system by harmonizing regulations and rationalizing payments
Improve access to finance and services, particularly for domestic investors and SMEs
196 Geo-tourism is defined as tourism that sustains or enhances the geographical character of the place being visited; including its environment, culture, aesthetics, heritage and the well-being of its residents. It combines eco and cultural tourism.

202
Revise purpose of 5 percent levy for the Vocational Education and Training
Establish national demand driven skills training through a public-private partnership and Initiate partnerships with foreign partners (bringing expertise for improving education and standards, providing experience for Tanzanians)
List specific tourism investment opportunities and communicate this information to the public
Open the market for a specific period for management employees
Strengthen linkages of tourism with other sectors of the economy
Develop professional tourism services trainings for a broader mix of tourism products
Institutional capacity
Improve management capacity of tourism attractions in the north for sustainable usage planning
Reinvest part of revenues in the maintenance of the attractions
Improve capacity of National College of Tourism
Develop quality curricula for vocational training programs
Launch private-public dialogue on how and where to expand, what is needed to develop new products
Build internal management and planning capacity of Tourism Division and Board to help grow the sector
Strengthen human resources and funding in both the Tourism Division and Board
Initiate strategic thrust for the new approach across the government
Source: Authors’ analysis based on the perspectives of Stakeholders and existing reports.
One particular issue is about policy intent to promote the Southern corridor. This requires
harmonizing the interest of various entities in Tanzania's public and private sectors with regard
to opening up Selous for tourism versus hunting activities. Hunting generates revenues with
minimum investment but tourism generates jobs with significant investment from the private
sector. Development of the road along the corridor opens up additional potential for coastal
tourism as well as other activities. Such development will help Tanzania to scale up its
competitiveness through product development and diversification as the Northern circuit
becomes increasingly congested.
Implementing a tourism strategy is challenging because of limited capacity and limited
financial as well as human resources. This challenge is further compounded by the lack of
clarity in the existing institutional framework. Tourism is a multi-stakeholder industry with
diverse and at times conflicting interests, including on how to manage and distribute economic
rents among diverse groups ranging from public agencies (National parks, Tourism promoters,
Licensing and regulatory agencies) and private actors (hunters, hoteliers, tour operators,
transport service providers). Tourism is also a delicate industry where risks to both public and
private sectors are potentially high due to sensitivity of market to issues such as safety,
hygiene, security; environmental degradation, and social and cultural sensitivity of the local
community. For these reasons (low capacity, conflicting interests, and risks), success in tourism
industry depends to a large extent on the effectiveness and efficiency of the cooperation
between the Government and private operators.
203
Implementation will also depend on the Government’s commitment to implement identified
actions. It will be important to firstly identify the champion with credibility to bring multiple
stakeholders together and enforce agreed actions. Then a series of actions can be examined for
priority and sequencing, starting with simple to do and those with immediate impact, and
gradually moving to those requiring more efforts. Finally it is important to address the issue of
resources before and throughout implementing the strategy.
Establish a champion with the mandate to captain the industry. As the country
navigates through the complex implementation hurdles, political and sentimental
support is key to realizing results. This is because there are strong political, economic
and social actors who may deter or complicate change due to their respective vested
interests or legitimate concerns. Implementation of the strategy would require regular
consultations with particular stakeholders (especially the business sector) to address
their specific concerns or reinforce their commitment and responsibilities. Their
commitment will certainly depend on the credibility and the longevity of the Champion.
In addition to the broad political actor, there must be a champion of the industry from
the private sector, and from the civil society who best represent and harmonize
interests of their respective stakeholders.
Adopt a gradual and selective approach. Although there are many different policy
actions requiring implementation of the tourism strategy, it is not practical to address
them all at the same time. Instead, to spur implementation, it is critical to sequence and
prioritize these actions in an efficient order. First, move gradually starting with simple
actions, especially those that do not require significant amount of resources or
extensive consultations but will clearly communicate a change of strategy
(demonstration effects). Such actions should include guillotining nuisance regulations
(that require declaration by Minister or Permanent Secretary). Secondly, sequencing
strategically to prioritize (i) now for now actions that would have high and immediate
impact even if such actions require significant resources (infrastructure and capacity
building by targeted programs); (ii) now for later actions that would make it easier to
implement subsequent and ongoing reforms; and (iii) now for all actions that
significantly reduce or remove barriers to entry (e.g. simplifying the licensing regime) or
market failures (e.g. public awareness, information and capacity building). Third and
finally, to avoid a one size fits all approach, there is a need to segment the policy actions
to enhance relevance of the strategy to small versus large scale actors.
Seek Resources to implement the strategy. Most programs fail or are ill-implemented
because funding issues were not given adequate attention from the start. Given
resources constraints, it is important for the government to aggressively seek financing

204
to implement the strategy. Various sources exist for financing tourism investments in
addition to the budgetary and donor resources. Private sector is a significant source of
investment in accommodation, tourism services, promotion, and marketing. However,
the private sector can be leveraged within the PPP arrangement for financing specific
tourism infrastructure investments (magnet investment). Two important and
overlooked sources of finance for tourism development include (a) the contribution of
local community in terms of land and labor, and (b) economic rents that tourism
generates (user fees, taxes and auctions). These rents can be earmarked to ensure the
sustainability of the assets used to generate them (wildlife, national parks, beaches and
cultural amenities), and fund key public goods objectives such as training, standards,
and basic infrastructure.
3.4 Concluding remarks and next steps
The proposed action plan has identified 12 key actions organized around three pillars to
promote the creation of productive jobs in Tanzania. For many, this number may appear too
high (especially given that it is itself subdivided in more detailed measures). However, the
challenge of productive employment cannot be realistically met by a few and limited actions. It
is cross- cutting in nature, and the magnitude of the reforms needed to encourage the creation
of productive jobs requires the adoption and implementation of a comprehensive action plan.
The goal of this study is to contribute to the debate around job creation in Tanzania by
proposing a sense of direction for policy-making. It is only when a consensus emerges among
stakeholders should the implementation of the selected actions be discussed in more detail,
including their timing, financing and the allocation of responsibilities among implementation
agencies, ministries, development partners, and private parties. This next step will be crucial as
actions are of little use if they are not implementable.