supportinginformation - images.nature.com · supportinginformation title: ... idi1...
TRANSCRIPT

1
Supporting information
Title:
Systematic evaluation of sericin protein as a substitute for fetal
bovine serum in cell culture
Author list:
Liyuan Liu1, 2, #, Jinhuan Wang1, #, Shengchang Duan3, #, Lei Chen1, 2, Hui
Xiang1, 4 *, Yang Dong3, *, Wen Wang1,3,*
1 State Key Laboratory of Genetic Resources and Evolution, Kunming
Institute of Zoology, Chinese Academy of Sciences, Kunming 650223,
China.
2 Kunming College of Life Science, University of Chinese Academy of
Sciences, Kunming 650223, China.
3 Kunming University of Science and Technology, 727 South Jingming
Road, Chenggong District, Kunming 650500, China.
4 South China Normal University, Guangzhou 510631, China.
# These authors contributed equally to this work.
* Corresponding author: [email protected]; [email protected];

2
Legends for Supplementary Figures and Tables.
Supplementary Fig. S1.
The automated image analyses was performed using CellProfiler software.
Supplementary Fig. S2.
Cell cycle analysis of sericin protein as a substitute for FBS.
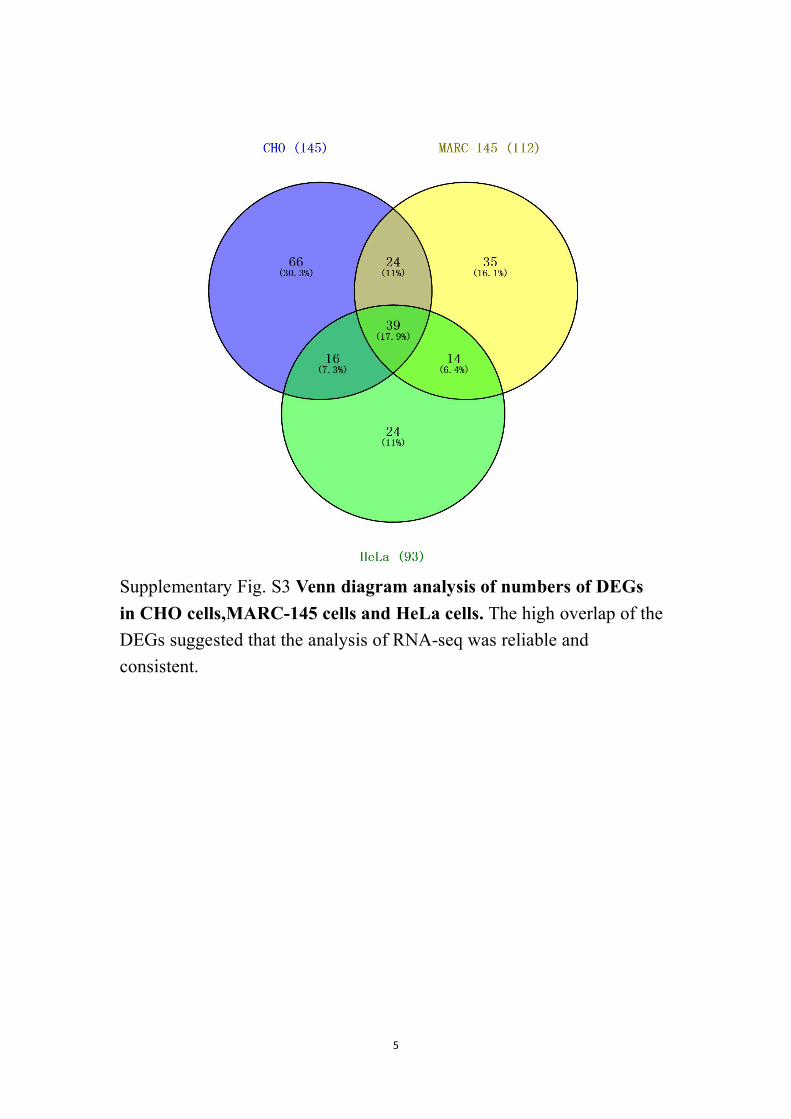
Supplementary Fig. S3.
Venn diagram analysis of numbers of DEGs in CHO cells, MARC-145 cells
and HeLa cells.
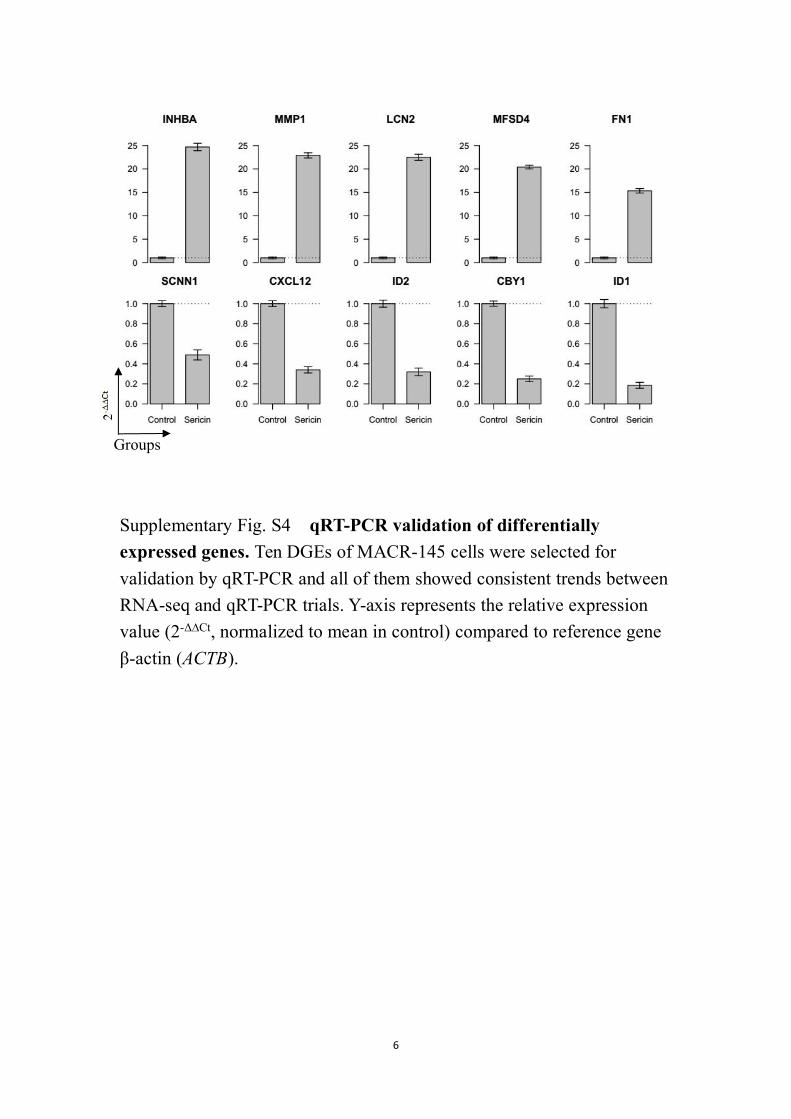
Supplementary Fig. S4.
qRT-PCR validation of differentially expressed genes.
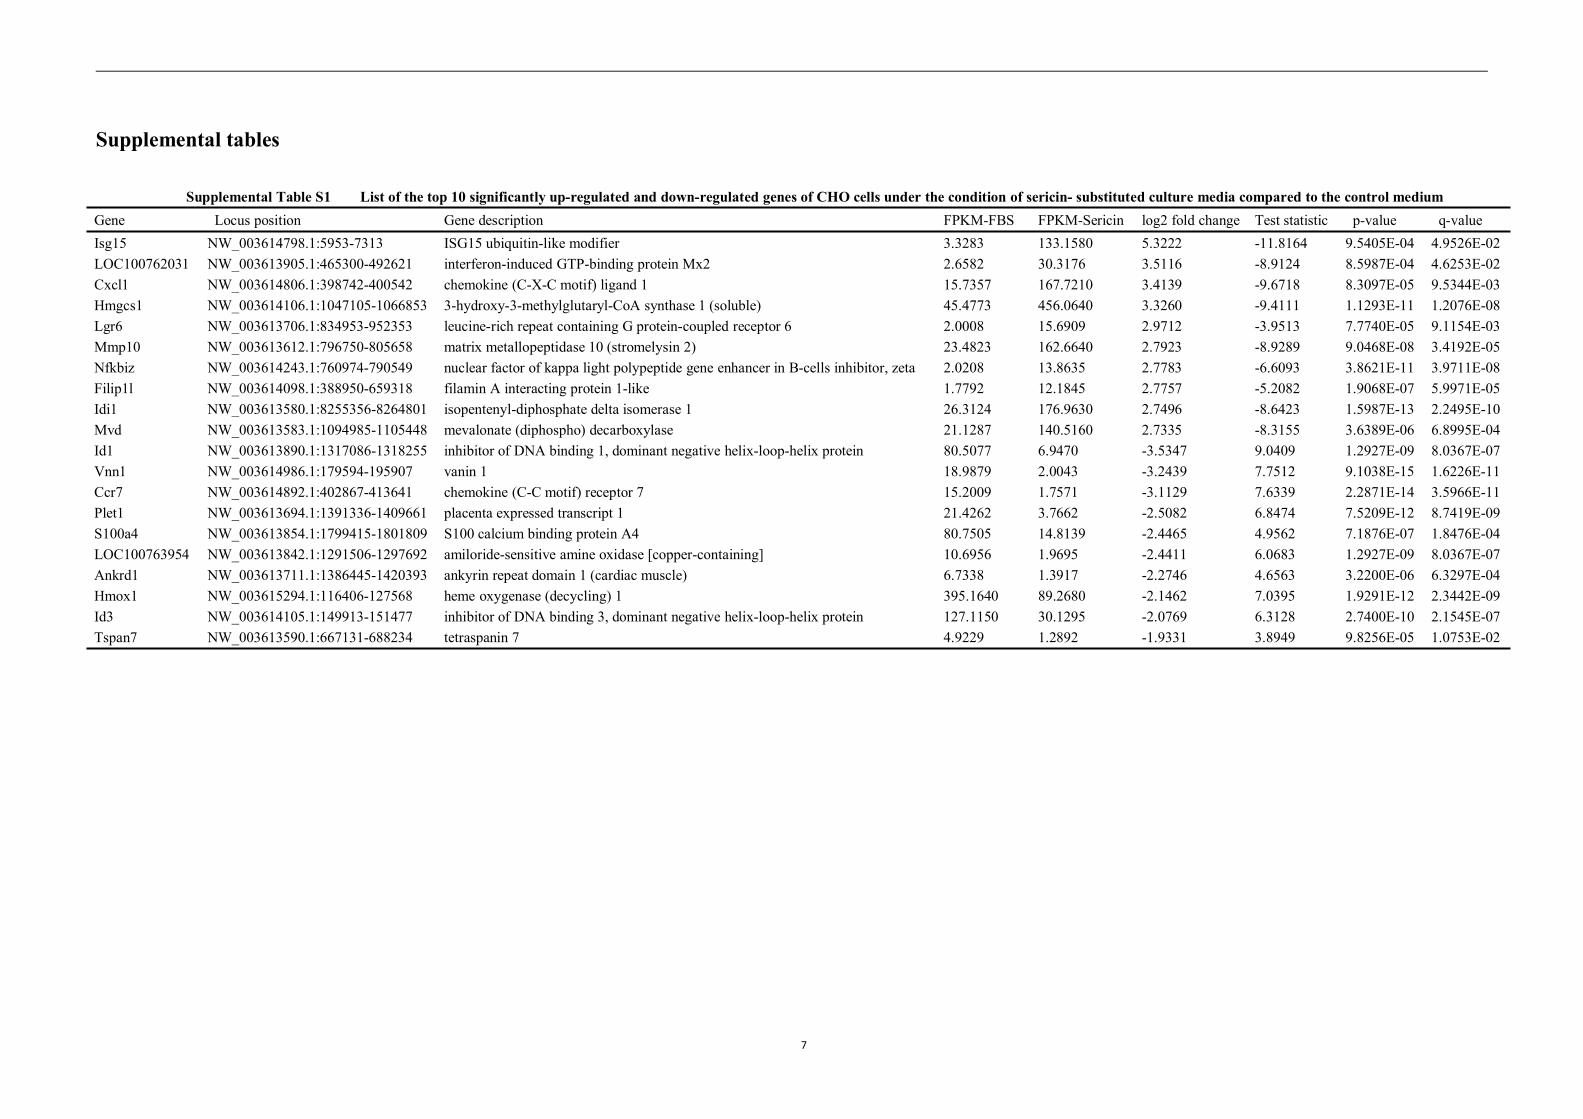
Supplemental Table S1.
List of the top 10 significantly up-regulated and down-regulated genes of CHO
cells under the condition of sericin- substituted culture media compared to the
control medium.
Supplemental Table S2.
List of the top 10 significantly up-regulated and down-regulated genes of HeLa
cells under the condition of sericin- substituted culture media compared to the
control medium.
Supplemental Table S3.
List of the top 10 significantly up-regulated and down-regulated genes of
MARC-145 cells under the condition of sericin- substituted culture media
compared to the control medium.

3
Supplementary Fig. S1 The automated image analyses was performed using CellProfiler software. The figure shows thefluorescence micrographs (left lane), the cell and intercellular space from the image (middle lane), the cell size and outline (rightlane). The automated image analyses showed that no significant difference of cell morphology was observed in cells cultivatedin the sericin-substituted medium. A, B. CHO cells; C, D. MARC-145 cells; E, F. HeLa cells. A, C, E. control medium (10% FBS);B, D, F. sericin-substituted medium (30 μg/ml sericin protein). Scale bars represent 40 μm.
A
B
C
D
E
F

4
(A)
(B)
Supplementary Fig. S2 Cell cycle analysis of sericin protein as asubstitute for FBS. (A) Representative images of flow cytometryanalysis carried out at 80-90% cell confluence. (B) The statistic results offlow cytometry. Cell cycles of the three cell lines were significantlyaggregation in the S phase in the sericin-substituted medium. The numberof cells in the G0/G1-, S- or G2/M-phase is given as percentages of thetotal cell population.
5
Supplementary Fig. S3 Venn diagram analysis of numbers of DEGsin CHO cells,MARC-145 cells and HeLa cells. The high overlap of theDEGs suggested that the analysis of RNA-seq was reliable andconsistent.
6
Groups
Supplementary Fig. S4 qRT-PCR validation of differentiallyexpressed genes. Ten DGEs of MACR-145 cells were selected forvalidation by qRT-PCR and all of them showed consistent trends betweenRNA-seq and qRT-PCR trials. Y-axis represents the relative expressionvalue (2-Δ∆Ct, normalized to mean in control) compared to reference geneβ-actin (ACTB).
7
Supplemental tables
Supplemental Table S1 List of the top 10 significantly up-regulated and down-regulated genes of CHO cells under the condition of sericin- substituted culture media compared to the control mediumGene Locus position Gene description FPKM-FBS FPKM-Sericin log2 fold change Test statistic p-value q-valueIsg15 NW_003614798.1:5953-7313 ISG15 ubiquitin-like modifier 3.3283 133.1580 5.3222 -11.8164 9.5405E-04 4.9526E-02LOC100762031 NW_003613905.1:465300-492621 interferon-induced GTP-binding protein Mx2 2.6582 30.3176 3.5116 -8.9124 8.5987E-04 4.6253E-02Cxcl1 NW_003614806.1:398742-400542 chemokine (C-X-C motif) ligand 1 15.7357 167.7210 3.4139 -9.6718 8.3097E-05 9.5344E-03Hmgcs1 NW_003614106.1:1047105-1066853 3-hydroxy-3-methylglutaryl-CoA synthase 1 (soluble) 45.4773 456.0640 3.3260 -9.4111 1.1293E-11 1.2076E-08Lgr6 NW_003613706.1:834953-952353 leucine-rich repeat containing G protein-coupled receptor 6 2.0008 15.6909 2.9712 -3.9513 7.7740E-05 9.1154E-03Mmp10 NW_003613612.1:796750-805658 matrix metallopeptidase 10 (stromelysin 2) 23.4823 162.6640 2.7923 -8.9289 9.0468E-08 3.4192E-05Nfkbiz NW_003614243.1:760974-790549 nuclear factor of kappa light polypeptide gene enhancer in B-cells inhibitor, zeta 2.0208 13.8635 2.7783 -6.6093 3.8621E-11 3.9711E-08Filip1l NW_003614098.1:388950-659318 filamin A interacting protein 1-like 1.7792 12.1845 2.7757 -5.2082 1.9068E-07 5.9971E-05Idi1 NW_003613580.1:8255356-8264801 isopentenyl-diphosphate delta isomerase 1 26.3124 176.9630 2.7496 -8.6423 1.5987E-13 2.2495E-10Mvd NW_003613583.1:1094985-1105448 mevalonate (diphospho) decarboxylase 21.1287 140.5160 2.7335 -8.3155 3.6389E-06 6.8995E-04Id1 NW_003613890.1:1317086-1318255 inhibitor of DNA binding 1, dominant negative helix-loop-helix protein 80.5077 6.9470 -3.5347 9.0409 1.2927E-09 8.0367E-07Vnn1 NW_003614986.1:179594-195907 vanin 1 18.9879 2.0043 -3.2439 7.7512 9.1038E-15 1.6226E-11Ccr7 NW_003614892.1:402867-413641 chemokine (C-C motif) receptor 7 15.2009 1.7571 -3.1129 7.6339 2.2871E-14 3.5966E-11Plet1 NW_003613694.1:1391336-1409661 placenta expressed transcript 1 21.4262 3.7662 -2.5082 6.8474 7.5209E-12 8.7419E-09S100a4 NW_003613854.1:1799415-1801809 S100 calcium binding protein A4 80.7505 14.8139 -2.4465 4.9562 7.1876E-07 1.8476E-04LOC100763954 NW_003613842.1:1291506-1297692 amiloride-sensitive amine oxidase [copper-containing] 10.6956 1.9695 -2.4411 6.0683 1.2927E-09 8.0367E-07Ankrd1 NW_003613711.1:1386445-1420393 ankyrin repeat domain 1 (cardiac muscle) 6.7338 1.3917 -2.2746 4.6563 3.2200E-06 6.3297E-04Hmox1 NW_003615294.1:116406-127568 heme oxygenase (decycling) 1 395.1640 89.2680 -2.1462 7.0395 1.9291E-12 2.3442E-09Id3 NW_003614105.1:149913-151477 inhibitor of DNA binding 3, dominant negative helix-loop-helix protein 127.1150 30.1295 -2.0769 6.3128 2.7400E-10 2.1545E-07Tspan7 NW_003613590.1:667131-688234 tetraspanin 7 4.9229 1.2892 -1.9331 3.8949 9.8256E-05 1.0753E-02

8
Supplemental Table S2 List of the top 10 significantly up-regulated and down-regulated genes of HeLa cells under the condition of sericin- substituted culture media compared to the control mediumGene Locus position Gene description FPKM-FBS FPKM-Sericin log2 fold change Test statistic p-value q-valueRMRP 9:35657750-35658018 RNA component of mitochondrial RNA processing endoribonuclease 109.7240 632.8730 2.5280 -9.2135 2.4184E-10 2.3113E-08TXNIP 1:145992434-145996600 thioredoxin interacting protein 2.9205 10.4563 1.8401 -6.4076 1.4784E-10 2.2327E-07ABCA13 7:48171457-48647496 ATP-binding cassette, sub-family A (ABC1), member 13 1.7113 4.6117 1.4302 -4.5949 4.3286E-06 2.6634E-03HDAC5 17:44076745-44123702 histone deacetylase 5 8.9266 21.2988 1.2546 -3.9187 8.9037E-05 2.5950E-02ACSS2 20:34844719-34927962 acyl-CoA synthetase short-chain family member 2 41.9626 98.0355 1.2242 -4.0822 4.4608E-05 1.6110E-02CNTNAP1 17:42678888-42699814 contactin associated protein 1 2.4288 5.6122 1.2083 -3.9371 8.2487E-05 2.4915E-02NR4A2 2:156324431-156342348 nuclear receptor subfamily 4, group A, member 2 9.0408 20.6913 1.1945 -4.7671 1.8692E-06 1.2614E-03SCD 10:100347123-100364834 stearoyl-CoA desaturase (delta-9-desaturase) 191.6800 416.8230 1.1207 -4.5259 6.0132E-06 3.4447E-03MOB3B 9:27325208-27530659 MOB kinase activator 3B 1.7812 3.7824 1.0864 -4.5321 5.8390E-06 3.4447E-03NR1D1 17:40019096-40100725 nuclear receptor subfamily 1, group D, member 1 13.5252 28.1467 1.0573 -3.7531 6.6900E-07 4.0870E-02CYP1A1 15:74719541-74725959 cytochrome P450, family 1, subfamily A, polypeptide 1 5.7078 1.1697 -2.2868 7.0436 1.8738E-12 3.1130E-09ID1 20:31605282-31606515 inhibitor of DNA binding 1, dominant negative helix-loop-helix protein 188.3430 39.0386 -2.2704 12.1324 9.4070E-06 1.9739E-07MIR23A 19:13795459-13842799 microRNA 23a 19.4648 6.1407 -1.6644 5.6526 1.5802E-08 2.0193E-05MIR27A 19:13795459-13842899 microRNA 27a 19.4648 6.1407 -1.6644 5.6526 1.5802E-08 2.0193E-05ID3 1:23557917-23559794 inhibitor of DNA binding 3, dominant negative helix-loop-helix protein 142.7590 48.2539 -1.5649 9.0187 3.3478E-10 4.3113E-06SERPINE1 7:101126653-101140192 serpin peptidase inhibitor, clade E , member 1 35.2691 12.3745 -1.5110 7.5259 5.2403E-14 1.0882E-10ID2 2:8666635-8684453 inhibitor of DNA binding 2, dominant negative helix-loop-helix protein 10.4508 3.7016 -1.4974 4.0152 5.9407E-05 1.9739E-02HMOX1 22:35380360-35394214 heme oxygenase 1 13.8197 5.2937 -1.3844 5.4801 4.2500E-08 4.7070E-05PDK4 7:95583498-95596491 pyruvate dehydrogenase kinase, isozyme 4 29.5967 12.7988 -1.2094 5.1725 2.3102E-07 1.8911E-04B4GALT4 3:119211731-119290666 UDP-Gal:betaGlcNAc beta 1,4- galactosyltransferase, polypeptide 4 24.1237 10.6416 -1.1807 4.3590 1.3064E-05 6.0285E-03

9
Supplemental Table S3 List of the top 10 significantly up-regulated and down-regulated genes of MARC-145 cells under the condition of sericin- substituted culture media compared to the control medium
Gene Locus position Gene description FPKM-FBS FPKM-Sericin log2 fold change Test statistic p-value q-valueINHBA 21:16936080-16951547 inhibin, beta A 3.5595 51.0573 3.8424 -7.4084 1.2790E-13 3.0947E-10LCN2 12:9976613-9980870 lipocalin 2 1.7995 20.5503 3.5135 -5.3093 1.1004E-07 8.5890E-05MFSD4 25:23741893-23774451 major facilitator superfamily domain containing 4 1.4822 14.8479 3.3244 -3.6108 3.0527E-04 3.1839E-02MMP1 1:94167205-94176767 matrix metallopeptidase 1 (interstitial collagenase) 38.1203 343.0570 3.1698 -9.6443 1.8300E-05 1.1705E-03FN1 10:101176788-101254716 fibronectin 1 4.8266 36.4082 2.9152 -8.2642 2.2205E-16 6.7160E-13PLAT 8:40163890-40196555 plasminogen activator, tissue 1.2989 7.1571 2.4621 -5.2772 1.3119E-07 9.9199E-05SFRP1 8:39243779-39289088 secreted frizzled-related protein 1 4.9055 26.6830 2.4435 -4.8391 1.3046E-06 6.4424E-04WFDC3 2:18098204-18115049 WAP four-disulfide core domain 3 12.8112 67.7871 2.4036 -4.3964 1.1008E-05 3.1711E-03HES1 15:88220082-88223243 hes family bHLH transcription factor 1 16.1660 81.0575 2.3260 -6.0805 1.1979E-09 1.6104E-06LTBP1 14:74063334-74548875 latent transforming growth factor beta binding protein 1 1.2246 5.7556 2.2326 -4.9550 7.2334E-07 3.8049E-04ID1 2:35997972-36010017 inhibitor of DNA binding 1, dominant negative helix-loop-helix protein 197.8190 17.0491 -3.5364 10.7075 3.3481E-04 3.3616E-02CBY1 19:21318142-21344765 chibby homolog 1 42.1451 4.0154 -3.3917 4.2159 2.4878E-05 5.5594E-03CXCL12 9:40005582-40020529 chemokine (C-X-C motif) ligand 12 68.2679 10.2098 -2.7413 3.5146 4.4049E-04 3.8758E-02ID2 14:98961545-98964882 inhibitor of DNA binding 2, dominant negative helix-loop-helix protein 100.8640 15.6893 -2.6846 8.4064 0.0000E+00 0.0000E+00SCNN1A 11:6383955-6417786 sodium channel, non-voltage-gated 1 alpha subunit 9.9745 1.7986 -2.4714 3.9139 9.0802E-05 1.3358E-02HMOX1 19:18144544-18157971 heme oxygenase (decycling) 1 254.4780 52.6479 -2.2731 8.0190 1.1102E-15 2.9849E-12VGF 28:12017435-12021586 VGF nerve growth factor inducible 38.0295 7.9330 -2.2612 6.3429 2.2555E-10 3.4110E-07STYK1 11:10419663-10475476 serine/threonine/tyrosine kinase 1 7.0743 1.5691 -2.1726 3.8893 1.0052E-04 1.4335E-02BMP4 24:31097537-31104746 bone morphogenetic protein 4 59.1441 13.9183 -2.0873 5.7618 8.3203E-09 9.1512E-06ARRB2 16:4191171-4202385 arrestin, beta 2 4.3486 1.1044 -1.9772 3.6472 2.6508E-04 2.9023E-02