images.nature.com · web viewsupplementary information. genome-wide association study identifies ....
TRANSCRIPT
Supplementary information
Genome-wide association study identifies SESTD1 as a novel risk gene for lithium responsive bipolar disorder
Supplementary Methods
Swedish Quality Register for bipolar disorder (BipoläR) 2
Phenotype definition and assessment 2
Quality control for genotyping 5
Test of Hardy-Weinberg Equilibrium for imputed variant rs116323614 6
Heritability estimation for lithium-responsive bipolar disorder (BD) 6
Supplementary Tables and Figures
Table S1. Subject characteristics for patients with lithium assessment and genotype 8
Table S2. Corresponding number of sample of the objectively and subjectively defined
assessments for lithium response 9
GWAS comparing lithium responding with lithium non-responding BD patients
(Summary statistics in Table S3, quantile-quantile and Manhattan plots in Fig S1, associated
genetic regions in Table S4) 10
GWAS comparing lithium responding BD patients and healthy controls
(Summary statistics in Table S5, quantile-quantile and Manhattan plots in Fig S2, associated
genetic regions in Table S6, region plots of the most associated regions in meta-analysis in
Figure S3) 16
Table S7. Association results of top associated loci from meta-analyses for each sub-sample23
Table S8. Predicted genotype frequencies for rs116323614 in each sample and tests of Hardy-
Weinberg Equilibrium 24
Table S9. Association results for rs116323614 in male and female samples 25
Table S10. Univariate heritability estimates of lithium-responsive BD 26
References 27
1

Supplemental Methods
Swedish Quality Register for BD (BipoläR)
Swedish Quality Register for BD (BipoläR) contains individualized data on diagnoses (i.e.,
BD type 1, type 2, not otherwise specified, or schizoaffective disorder bipolar type), medical
intervention, and outcomes. It also captures basic clinical epidemiological data as well as
longitudinal data on the natural history and clinical course of the disease. Participation is
voluntary for the clinician as well as for the patients. The diagnoses were made according to
the DSM-IV-TR, but the use of structured interviews varies between participating units,
which include both private and public psychiatric outpatient health care units in Sweden.
Psychiatrists who register patients have often specialized in the treatment of mood disorders
and treatment of BDs in particular. Hence, BipoläR contains much more detailed phenotypic
information than other Swedish national registers and provides good validity and high data
quality. Patients were followed-up annually 2005–2013. Until June 2013 when the data were
extracted, 6429 BD patients were registered in BipoläR with the mean total follow-up time
3.1 years (SD=1.7, range 1-9 years).
Phenotype definition and assessment
Phenotype definition for Swedish sample
Subjective assessment included two branches. Participants from Stanley were interviewed
over the phone by trained nurses using a structured questionnaire. Provided a person had
taken lithium for at least 12 months at any point in life, he or she would be asked about the
therapeutic effect regardless of potential side effects. Responses were categorized into four
groups: 1) “Complete remission. No further episodes, became well” (N=660, 62.1%); 2)
2
“Clearly improved, but continued to suffer from mood episodes, or needed additional
treatment” (N=264, 24.9%); 3) “No or questionable treatment effect” (N=86, 8.1%); 4) “Do
not know or do not want to answer” (N=52, 4.9%).
Patients from S:t Göran were assessed by a psychiatrist using a standardized interview
protocol (the Affective Disorders Evaluation) which was previously used in the Systematic
Treatment Enhancement Program of Bipolar Disorder Program (STEP-BD).1 Response was
also categorized into four groups: 1) “Complete response” (N=77, 33.3%); 2) “Markedly
improved or somewhat improved, but continued to suffer from mood episodes, or needed
additional treatment” (N=20, 8.7%); 3) “No or doubtful treatment effect” (N=13, 5.6%). 4)
“No data or used lithium too short time” (N=121, 52.4%).
By adding an objective assessment lithium response in the Swedish sample, we aimed for a
phenotype definition that would correspond more closely to the UK-BDRN subgroup with
excellent and beneficial response to lithium (group 1 and 2 in the UK samples, see below).
We assessed the effectiveness of lithium in preventing mood episodes by using recurrence
data at yearly longitudinal follow-ups extracted from Swedish Quality Register from May
2004 until June 2013. Subjects who had used lithium for at least one year were included.
Responders were defined as having no mood episodes during follow-up (N=159, 16.9%),
while non-responders were those that had at least one mood episode during follow-up
(N=780, 83.1%). The extent to which subjective assessment and objective assessment were in
line with each other is shown in Supplementary Table S2.
Phenotype definition for UK sample
Lithium response information for participants from BDRN was collected by interviews and
reviews of clinical notes and was originally categorized into five groups:
3

1) “Objective evidence for excellent response to lithium prophylaxis” (i.e., frequency of
episodes reduced to <10% of frequency after lithium prophylaxis and/or 2 or more
episodes of illness occurring within weeks of cessation of lithium. This could only be
rated if at least 3 episodes of illness had occurred before lithium prophylaxis and
lithium response had been observed for at least 5 years.) (N=47, 3.0%);
2) “Objective evidence for beneficial response” (i.e., clear reduction in number and/or
severity of episodes following introduction of lithium prophylaxis. This could only be
rated if at least 3 episodes of illness had occurred before lithium prophylaxis and
lithium response had been observed for at least 3 years) (N=117, 7.4%);
3) “Subjective good response” (i.e., self-reported complete or partial remission, but with
an observation period too short to meet objective criteria (<=3 years)) (N=738,
46.8%);
4) “Unsure of response” (i.e., have been on lithium only for a couple of months, or had it
stopped after a brief period due to side effects) (N=603, 38.2%);
5) “No evidence of response to lithium” (i.e., no reduction in number and severity of
episodes following introduction of lithium prophylaxis) (N =73, 4.6%).
Harmonizing the datasets
We treat lithium response as a dichotomous trait based on the subjective and objective
measurements, respectively.
By using subjectively defined lithium response we maximize the sample size. In the Swedish
sample, a total of 1120 subjects had available assessments of lithium response together with
genotyping data that passed quality control. We compared patients who reported complete
remission on lithium (Group 1), N=737, 65.8%) with those who reported partial or no
response (Group 2) and 3), N=383, 34.2%). For the UK subjects, we defined the UK groups
4

1), 2) and 3) as subjective responders (N=902, 57.2%), and the UK groups 4) and 5) as
subjective non-responders to lithium (N=676, 42.8%). This method of categorization is
similar to dichotomous definitions proposed in several previous clinical and genetic papers.2-5
By using objectively defined lithium response, we arrive at a narrower phenotype definition
of lithium response. The definition of objective response in the Swedish sample is given
above. For the UK sample, we categorized the UK groups 1) and 2) as objective responders
(N=164, 10.4% of the total UK sample) and the UK group 5) as objective non-responders
(N=73, 4.6% of the total UK sample). Groups 3) and 4) lack long-term data. With longer
observation, cases in these groups might end up in the response or the non-response group.
We therefore chose to exclude groups 3) and 4) from the objective assessment of UK data.
Quality control for Genotyping
Swedish sample
The quality control exclusionary measures for Swedish subjects were: genotype missingness
rate >5%, ancestry outliers identified via multidimensional scaling (MDS), suspected sample
error or contamination (i.e., subject heterozygosity rate >10%), ambiguous genetic sex, and a
randomly selected member of any pair of subjects identified as related (pi-hat > 0.20).
Exclusionary measures for SNPs were: marked deviations from Hardy-Weinberg equilibrium
(P<1×10⁻⁶), SNP missingness rate >5%, minor allele frequency (MAF) <1%, differential
missingness based on affection status (P<1×10⁻⁶), and differential missingness based on
haplotype (P<1×10⁻¹⁰).
UK sample
5

The quality control exclusionary parameters for the BDRN sample were: subject
heterozygosity rate >15%, subject missingness rate >2%, ambiguous genetic sex, SNP
missingness rate >2%, MAF<1%, marked departure from Hardy-Weinberg equilibrium
(P<5×10⁻⁵), differential missingness for SNPs between cases and controls (P<1×10⁻³) and
differential missingness based on haplotype (P<1×10⁻¹⁰), population outliers identified via
multidimensional scaling, and a random member of each pair of related subjects (defined as
pi-hat >0.10).
Test of Hardy-Weinberg Equilibrium for imputed variant rs116323614
As the calculation for genotype frequencies is not straightforward in dosage (imputed) data, we
used the method provided in the paper “Approximate and Exact Tests of Hardy-Weinberg
Equilibrium Using Uncertain Genotypes”.6 Regarding potential skewing in genotype
distributions, we performed the exact tests of Hardy-Weinberg Equilibrium (HWE). The
results are shown in Table S8.
Heritability estimation for lithium-responsive BD
We first combined the two datasets (Sweden wave 2 and UK) and excluded variants only
existing in one sample or with ambiguous base pair position and strand. We then used GCTA
version 1.24 to filter for cryptic relatedness between individuals (cutoff value 0.025). A total
of 10 786 individuals and 382 330 SNPs were included in the final dataset.
To test for systematic discrepancy between the genotypes produced by the two microarrays
and validate the combined dataset, we did a benchmark analysis with GCTA to estimate the
heritability of BD. The result showed that the heritability of BD was 0.32 (95% CI 0.28 to
6

0.36) in this sample, which was similar to a previous estimate (0.25) in a study applying the
GCTA method.7
We then estimated the heritability of lithium-responsive BD phenotype with subjectively and
objectively defined lithium response, respectively. We specify the prevalence 0.30 since
previous literatures have reported that full lithium responders are about one-third among
lithium treated patients.8,9 We established statistical significance using the likelihood-ratio test
of specific hypothesis (H0: SNP-heritability = 0) and reported the asymptotic 95% CI
(calculated as 1.96 times the standard error).
7
Table S1. Subject characteristics for patients with lithium assessment and genotype
Sweden (N=1822)* UK BDRN (N=2577)Ever taken lithium (%) 61.5 61.2
Lithium responders
Lithium non-responders
Lithium responders
Lithium non-responders
Subjective measurement (available lithium assessment and genotype)
Sample size 737 383 902 676Sex (% male) 38.6 38.5 33.5 26.5Mean age at sampling(Standard deviation)
52.1±13.9 48.8±13.3 48.9±12.3 47.9±12.0
Bipolar disorder type I (%) 59.1 53.7 74.7 68.9Objective measurement (available lithium assessment and genotype)
Sample size 159 780 164 73Sex (% male) 39.6 37.8 43.2 28.8Mean age at sampling(Standard deviation)
57.7±11.9 49.6±13.7 52.2±11.9 48.6±12.4
Bipolar disorder type I (%) 57.9 50.3 80.5 83.6* Swedish sample consists of subjects participating in both the Stanley study and S.t Göran Project
8
Table S2. Corresponding number of sample of the two different assessments for lithium response
Subjective assessmentResponder Non-responder NA Total
Objective assessment
Responder 135 17 7 159Non-responder 324 319 137 780
NA 129 2 275 406Total 588 338 419 1345
The numbers in the table refer to subjects with available lithium assessment and genotype (passed genotyping quality control).
Abbreviations: NA, not applicable, could not be placed into either category.
9
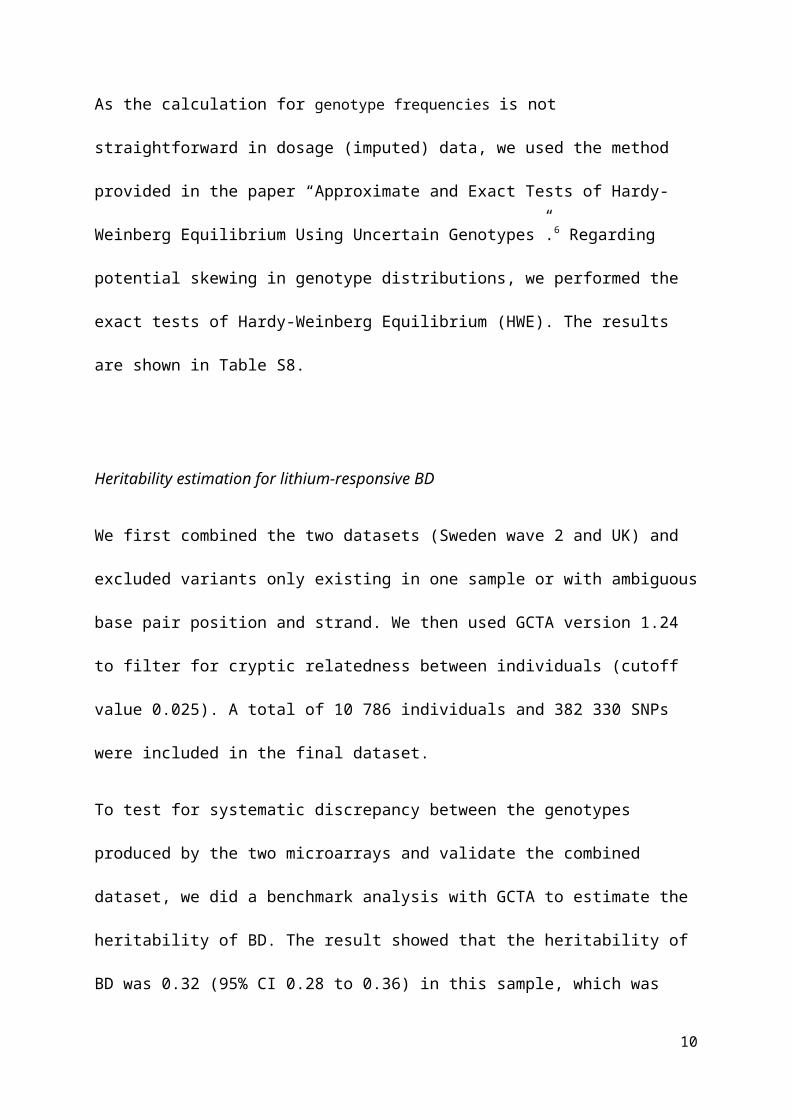
Table S3. Summary statistics for GWAS comparing lithium responding with lithium non-responding bipolar disorder patients (Quantile-quantile and Manhattan plots shown in Fig S1)
Swedish sampleUK
BDRNMeta-
analysisAffymetrix 6.0 (wave 1)
OmniExpress arrays (wave 2)
Subjective measurement
Responders 149 588 902 1639Non-responders 45 338 676 1059
λGC 0.97 1.02 1.00 0.99Quantile-quantile plot A B C D
Manhattan plot I II III IV
Objective measurement
Responders - 159 164 323Non-responders - 780 73 853
λGC - 1.01 1.00 0.97Quantile-quantile plot - E F G
Manhattan plot V VI VII
* λGC: genomic inflation factor, calculated by the median observed χ2 statistic divided by expectation under the null*The quantile-quantile and Manhattan plots for all analyses are in Supplementary Figure S1
A B
10

11

C D
E F
G
12

I
II
III
13

IV
V
VI
14

VII
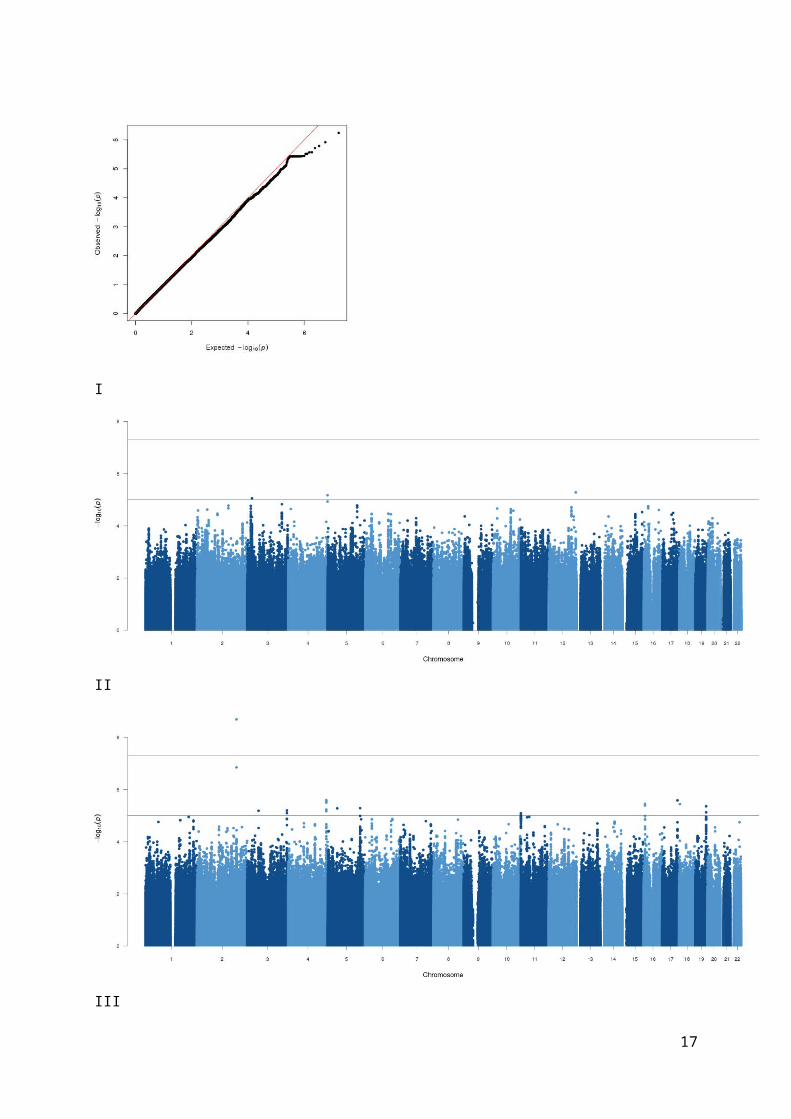
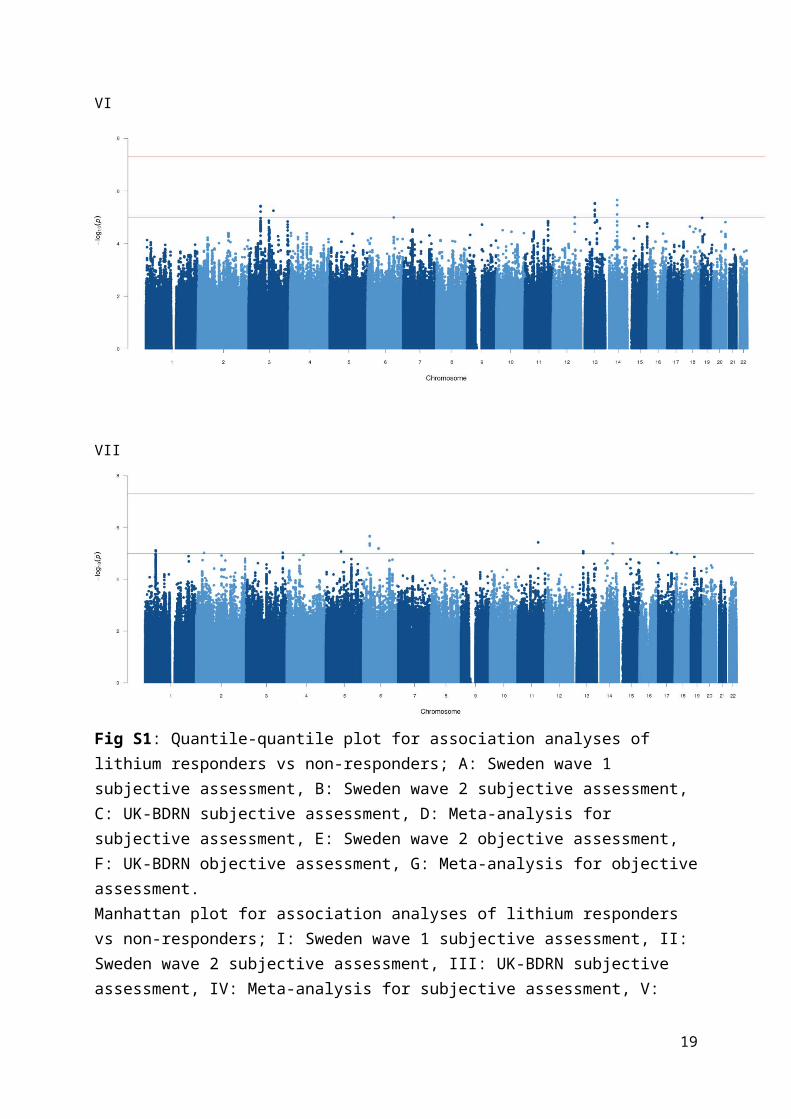
Fig S1: Quantile-quantile plot for association analyses of lithium responders vs non-responders; A: Sweden wave 1 subjective assessment, B: Sweden wave 2 subjective assessment, C: UK-BDRN subjective assessment, D: Meta-analysis for subjective assessment, E: Sweden wave 2 objective assessment, F: UK-BDRN objective assessment, G: Meta-analysis for objective assessment. Manhattan plot for association analyses of lithium responders vs non-responders; I: Sweden wave 1 subjective assessment, II: Sweden wave 2 subjective assessment, III: UK-BDRN subjective assessment, IV: Meta-analysis for subjective assessment, V: Sweden wave 2 objective assessment, VI: UK-BDRN objective assessment, VII: Meta-analysis for objective assessment.
15

Table S4. Summary of top loci for each analysis comparing lithium responders vs non-responders and genes located in these regions
Chr Index SNPA1/A2 Freq OR P-values N Position KB Genes
Sweden wave 1, subjective assessment
12 rs11060299 C/T 0.80 4.675.23×10-
6 68129841278-129886304
45ZNF84,ZNF26,TMEM13
2D,MIR1244-3
4 rs34521094 C/G 0.89 7.526.73×10-
6 10189959142-189992773
34 FRG2
3 rs4858400 A/G 0.85 4.678.86×10-
6243
22417440-22580784163
MIR4273,FRG2C
3 rs13085296 C/T 0.90 5.411.49×10-
5120
166748961-167275775
527
ZBBX,WDR49,SERPINI2
Sweden wave 2, subjective assessment
2 rs56177802 T/C 0.73 2.142.03×10-
9 61190955006-191038244
83 C2orf88
4 rs10013531 C/A 0.53 1.602.54×10-
6106
184452303-184499131
47 FRG2
17 rs3743991 T/C 0.64 1.632.60×10-
6 44 73588067-73717421129
SAP30BP,RECQL5,MYO15B,LOC643008,LOC100130933,LLGL2,ITGB
4
16 rs7185701 A/G 0.87 1.993.52×10-
6138
6652748-6785191132
RBFOX1
Sweden wave 2, objective assessment
6rs11422150
6G/A 0.88 0.43
1.13×10-
6170
31770265-32625494855
NOTCH4, MHC, many genes
19rs14118340
5G/A 0.78 0.50
1.44×10-
6 27 32747302-32979847233
ZNF507,KIR3DP1,KIR2DL4,DPY19L3
13rs11365348
6C/T 0.91 0.40
1.73×10-
6118
50224143-50771235547
TRIM13, ST13P4, MIR3613, many genes
1 rs56207132 C/T 0.85 0.912.64×10-
6 66 50602495-51512469910
OR4F16,OR4F29,LOC100133331,LOC100132287,FAF1,ELAVL4,DMR
TA2,CDKN2CUK-BDRN, subjective assessment
20 rs28691794 C/T 0.90 0.492.11×10-
6 65 61150190-61213367 63MIR133A2,MIR1-
1,C20orf200,C20orf166
2 rs10856800 C/G 0.47 1.432.32×10-
6 49 20716754-20752681 36 No genes
3rs15026564
1G/T 0.94 2.12
2.34×10-
6112
149155106-149252704
98 WWTR1,TM4SF4
19 rs8113341 A/G 0.20 0.662.60×10-
6 88 10125941-10193325 67RDH8,KIR3DP1,KIR2DL4,COL5A3,C3P1,C19o
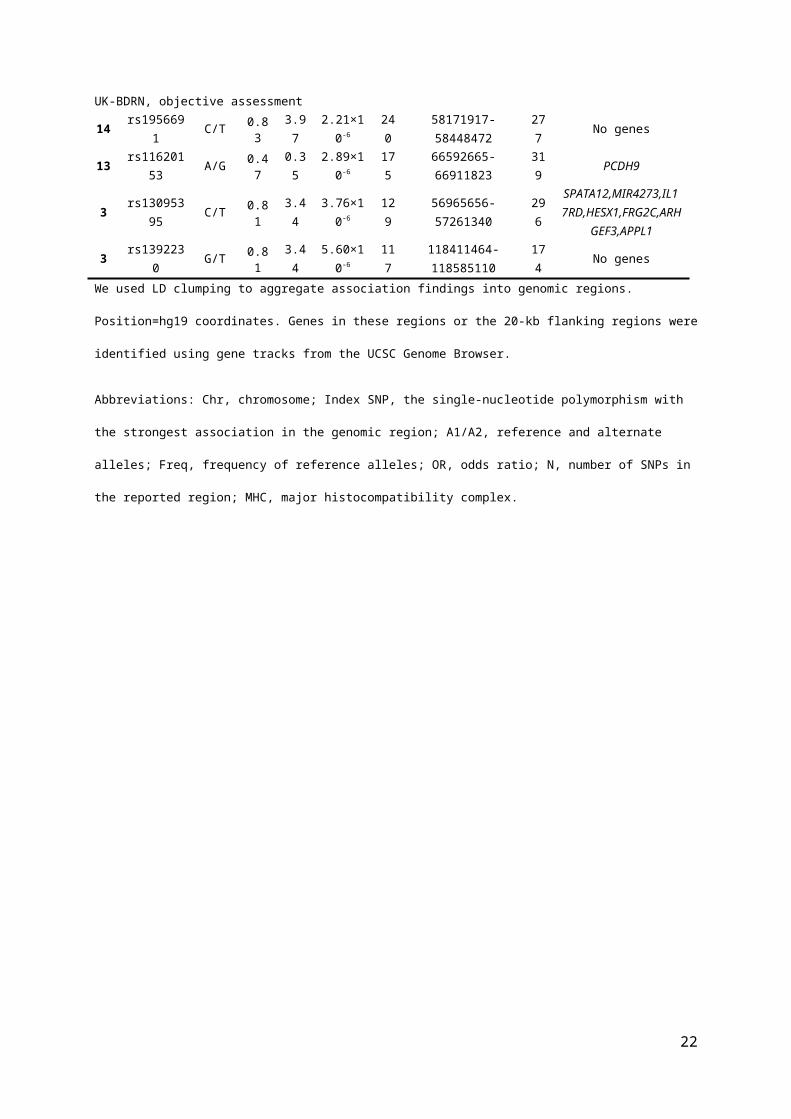
rf66,ANGPTL6UK-BDRN, objective assessment
14 rs1956691 C/T 0.83 3.972.21×10-
6240
58171917-58448472277
No genes
13 rs11620153 A/G 0.47 0.352.89×10-
6175
66592665-66911823319
PCDH9
3 rs13095395 C/T 0.81 3.443.76×10-
6
129
56965656-57261340296
SPATA12,MIR4273,IL17RD,HESX1,FRG2C,ARH
GEF3,APPL1
3 rs1392230 G/T 0.81 3.445.60×10-
6117
118411464-118585110
174
No genes
16
We used LD clumping to aggregate association findings into genomic regions. Position=hg19 coordinates. Genes in these
regions or the 20-kb flanking regions were identified using gene tracks from the UCSC Genome Browser.
Abbreviations: Chr, chromosome; Index SNP, the single-nucleotide polymorphism with the strongest association in the
genomic region; A1/A2, reference and alternate alleles; Freq, frequency of reference alleles; OR, odds ratio; N, number of
SNPs in the reported region; MHC, major histocompatibility complex.
17
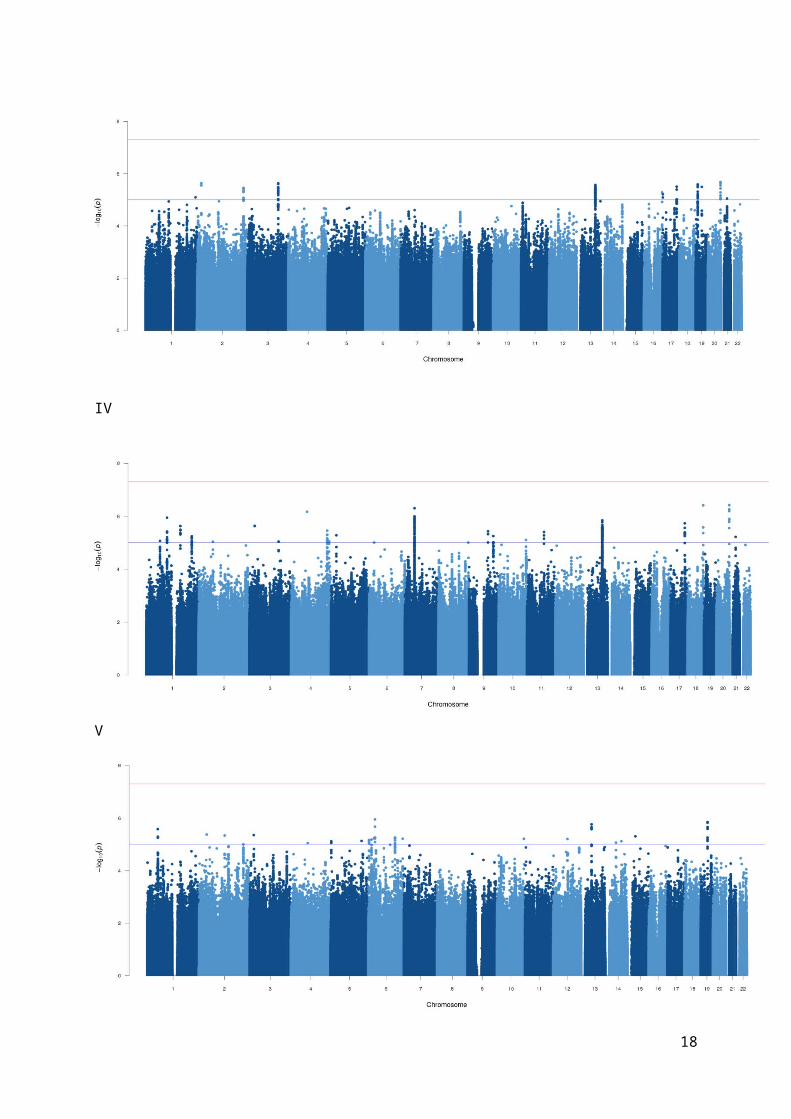
Table S5. Summary statistics for GWAS comparing lithium responders with controls (Quantile-quantile and Manhattan plots shown in Fig S2)
Swedish sampleCardiff sample
Meta-analysisAffymetrix 6.0
(wave 1)OmniExpress arrays
(wave 2)
Subjective measurement
Responders 149 588 902 1565Controls 2215 1271 5413 8899
λGC 1.01 1.04 1.04 1.05Quantile-quantile plot A B C D
Manhattan plot I II III IV
Objective measurement
Responders - 159 164 323Controls - 1271 5413 6684
λGC - 1.01 1.01 1.01Quantile-quantile plot - E F G
Manhattan plot V VI VII
* λGC: genomic inflation factor, calculated by the median observed χ2 statistic divided by expectation under the null*The quantile-quantile and Manhattan plots for all analyses are in Supplementary Figure S2
A B
18
C D
E F
G
19
I
II
III
20

IV
V
VI
21
VII
Fig S2: Quantile-quantile plot for association analyses of lithium responders vs controls; A: Sweden wave 1 subjective assessment, B: Sweden wave 2 subjective assessment, C: UK-BDRN subjective assessment, D: Meta-analysis for subjective assessment, E: Sweden wave 2 objective assessment, F: UK-BDRN objective assessment, G: Meta-analysis for objective assessment Manhattan plot for association analyses of lithium responders vs controls; I: Sweden wave 1 subjective assessment, II: Sweden wave 2 subjective assessment, III: UK-BDRN subjective assessment, IV: Meta-analysis for subjective assessment, V: Sweden wave 2 objective assessment, VI: UK-BDRN objective assessment, VII: Meta-analysis for objective assessment
22

Table S6. Summary of top loci for each analysis comparing lithium responders vs controls and genes located in these regions
Chr Index SNP A1/A2 Freq
OR P-value N Position KB Genes
Sweden wave 1, subjective assessment
9 rs10979017 C/G 0.99 0.20 1.08×10⁻⁸ 4 110461462-110497099 36 No genes
12rs14649927
2C/T 0.98 0.17 2.71×10⁻⁷ 38 84520335-85027937
508
ZNF84,ZNF26,MIR1244-3
2rs11592098
3C/A 0.99 0.15 4.73×10⁻⁷ 4 207525730-207593030 67
MDH1B,LOC200726,DYTN
13 rs9542739 T/C 0.12 2.23 5.48×10⁻⁷ 90 71993107-72366052373
DACH1
Sweden wave 2, subjective assessment
18 rs1442378 T/C 0.33 1.55 5.19×10⁻⁸ 45 4050546-4071783 21 DLGAP1
7 rs6466030 T/C 0.62 0.68 4.04×10⁻⁷ 388 104557060-105064593507
SRPK2,MLL5,LOC723809,LOC100216545,LHFPL3
15 rs4887200 G/C 0.95 0.41 7.57×10⁻⁷ 13 88180809-88537816357
NTRK3
2 rs2091672 A/T 0.30 0.66 7.77×10⁻⁸ 196 140567355-140782556215
No genes
Sweden wave 2, objective assessment
3 rs73186618 C/T 0.99 0.12 4.93×10⁻⁷ 27 19791860-20004093212
RAB5A,MIR4273,FRG2C,EFHB,
C3orf48
11rs38641974
5-/AC 0.94 0.26 7.40×10⁻⁷ 29 107643375-107797271
154
SLC35F2,RAB39
12rs18718043
8G/A 0.99 0.07 9.32×10⁻⁷ 2 121791447-121909328
118
ZNF84,ZNF26,RNF34,MIR1244-
3,KDM2B,ANAPC511 rs71455013 T/A 0.84 0.42 1.26×10⁻⁶ 30 22795964-22810983 15 GAS2
UK-BDRN, subjective assessment
16rs14158927
1A/C 0.96 2.93 1.36×10⁻⁶ 1 81171896-81171896 0 PKD1L2
3 rs3936575 A/G 0.24 0.74 1.41×10⁻⁶ 136 21644870-21783136138
ZNF385D,MIR4273,FRG2C
7rs20153782
2T/- 0.96 0.55 1.56×10⁻⁶ 51 18095574-18479387
384
No genes
7rs19312109
9C/T 0.99 0.39 2.11×10⁻⁶ 23 7477518-7819352
342
RPA3,MIOS,LOC729852,COL28A1
UK-BDRN, objective assessment
11rs14672760
1TA/- 0.99 0.22 1.22×10⁻⁷ 19 112060319-112384063
324
TEX12,PTS,C11orf34,BCO2
3rs14215363
1C/A 0.99 0.20 1.35×10⁻⁷ 222 38809692-39545741
736
XIRP1,WDR48,TTC21A, many genes
19 rs77866734 C/T 0.98 0.23 1.39×10⁻⁷ 13 1528365-1642221114
UQCR11,TCF3,PLK5P,MEX3D,
MBD3,KIR3DP1,KIR2DL4,ADAMTSL5
10 rs28498397 T/C 0.98 0.24 2.21×10⁻⁷ 228 124304753-124872079567
PSTK,LOC399815,IKZF5,FLJ46361,
many genesWe used LD clumping to aggregate association findings into genomic regions. Position=hg19 coordinates. Genes in these
regions or the 20-kb flanking regions were identified using gene tracks from the UCSC Genome Browser.
23

Abbreviations: Chr, chromosome; Index SNP, the single-nucleotide polymorphism with the strongest association in the
genomic region; A1/A2, reference and alternate alleles; Freq, frequency of reference alleles; OR, odds ratio; N, number of
SNPs in the reported region; MHC, major histocompatibility complex.
24

a
b
Figure S3. Region plots of the most associated region in meta-analysis results comparing lithium responders vs controls. SNPs are represented from genome build hg19/1000 Genomes Nov 2014 EUR. The purple diamond marks the most highly associated SNPs. (a) rs116323614 (p=2.74 x 10⁻⁸; OR=3.14). (b) rs146727601 (p=1.33 x 10⁻⁸; OR=3.98).
25

Table S7. Association results of top associated loci from meta-analyses for each sub-sample
Index SNP A1/A2 Sample Freq INFO OR 95% CI P-valueResponders vs non-responders, subjective assessmentsrs73918339 T/C Sweden wave 1 0.92 0.72 0.72 0.24-2.18 0.56
Sweden wave 2 0.91 0.93 0.66 0.46-0.96 0.03UK BDRN 0.90 0.76 0.49 0.37-0.66 2.11×10⁻⁶
rs7240206 C/G Sweden wave 1 0.11 0.83 1.48 0.61-3.56 0.39Sweden wave 2 0.09 0.91 0.56 0.40-0.78 6.70×10⁻⁴
UK BDRN 0.09 0.91 0.57 0.44-0.74 2.54×10⁻⁵
rs116927879 G/A Sweden wave 1 0.89 0.90 1.73 0.81-3.70 0.16Sweden wave 2 0.86 0.82 1.77 1.32-2.38 1.36×10⁻⁴
UK BDRN 0.84 0.86 1.41 1.14-1.74 0.001rs78295376 T/C Sweden wave 1 0.87 0.74 0.73 0.30-1.77 0.49
Sweden wave 2 0.90 0.86 0.61 0.42-0.88 0.008UK BDRN 0.91 0.78 0.52 0.39-0.71 2.21×10⁻⁵
Responders vs non-responders, objective assessmentsrs438475 G/A Sweden wave 2 0.88 0.99 0.43 0.31-0.60 1.13×10⁻⁶
UK BDRN 0.87 0.96 0.73 0.39-1.37 0.33rs113262272 A/- Sweden wave 2 0.71 0.82 1.89 1.36-2.64 1.63×10⁻⁴
UK BDRN 0.71 0.73 2.01 1.21-3.35 0.007rs809 C/T Sweden wave 2 0.54 0.98 0.56 0.44-0.72 7.64×10⁻⁶
UK BDRN 0.48 0.99 0.73 0.49-1.09 0.13rs181812561 G/A Sweden wave 2 0.98 0.66 0.13 0.05-0.33 1.43×10⁻⁵
UK BDRN 0.98 0.64 0.06 0.00-4.29 0.20Responders vs controls, subjective assessmentsrs12144699 G/A Sweden wave 1 0.96 0.77 0.56 0.33-0.97 0.04
Sweden wave 2 0.95 0.75 0.55 0.37-0.82 0.003UK BDRN 0.96 0.71 0.62 0.48-0.81 4.66×10⁻⁴
rs9834970 T/C Sweden wave 1 0.50 0.97 0.68 0.53-0.87 0.002Sweden wave 2 0.50 1.00 0.83 0.71-0.96 0.01UK BDRN 0.51 1.00 0.84 0.76-0.93 9.24×10⁻⁴
rs12493050 G/A Sweden wave 1 0.20 1.00 1.22 0.92-1.61 0.17Sweden wave 2 0.20 0.95 1.25 1.04-1.50 0.02UK BDRN 0.20 1.01 1.28 1.14-1.44 3.72×10⁻⁵
rs4947962 G/C Sweden wave 1 0.11 0.94 1.35 0.95-1.91 0.09Sweden wave 2 0.11 0.97 1.54 1.23-1.94 2.19×10⁻⁴
UK BDRN 0.11 0.94 1.27 1.08-1.48 0.003Responders vs controls, objective assessmentsrs146727601 -/TA Sweden wave 2 0.01 0.74 2.84 1.15-7.14 0.02
UK 0.02 0.82 4.53 2.56-7.69 1.22×10⁻⁷
rs116323614 A/G Sweden wave 2 0.02 0.86 2.84 1.41-5.88 0.004UK 0.03 0.79 3.30 2.00-5.26 1.97×10⁻⁶
rs77866734 C/T Sweden wave 2 0.99 0.90 0.51 0.18-1.43 0.20UK 0.98 0.64 0.23 0.13-0.39 1.39×10⁻⁷
rs142643109 T/G Sweden wave 2 0.99 0.74 0.25 0.09-0.68 0.006UK 0.98 0.75 0.29 0.16-0.51 1.85×10⁻⁵
Abbreviations: Index SNP, the single-nucleotide polymorphism with the strongest association in each meta-analysis; A1/A2,
reference and alternate alleles; Freq, frequency of reference alleles; INFO, imputation info score; OR, odds ratio; CI,
confidence interval.
26

Table S8. Predicted genotype frequencies for rs116323614 in each sample and tests of Hardy-
Weinberg Equilibrium
Sample NNumber of subjects by imputed
genotype Exact Tests of Hardy-Weinberg EquilibriumAA(%) AG(%) GG(%)
Sweden wave 1 3141 2 (0.0007) 132 (0.04) 3007 (0.96) P=0.45
Sweden wave 2 3755 2 (0.0006) 167 (0.04) 3586 (0.95) P=0.84
UK 8035 6 (0.0007) 441 (0.05) 7588 (0.94) P=0.40Method for calculation was from “Approximate and Exact Tests of Hardy-Weinberg Equilibrium Using Uncertain
Genotypes”.6
27
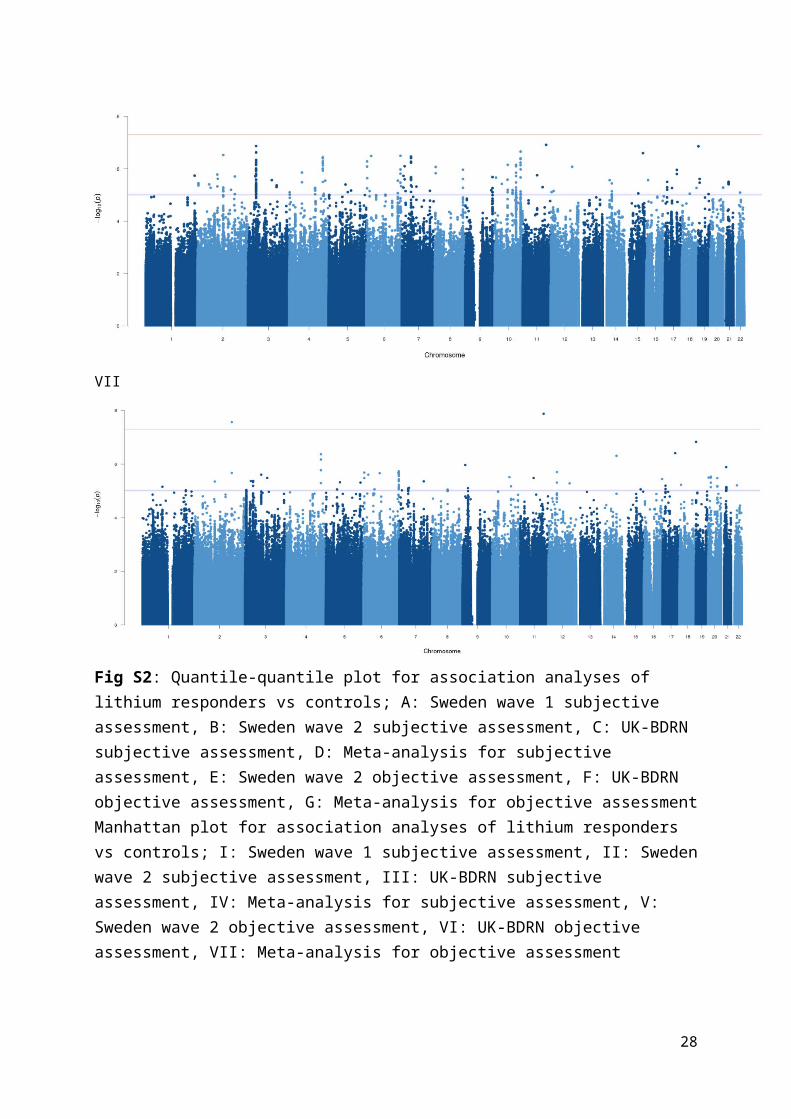
Table S9. Association results for rs116323614 in male and female samples
Sample SexNo of
responder vs. control
Ref allele Freq
OR SE 95% CI P-value
Test for difference between
ORs
Sweden wave 2
Male 63:632 0.02 2.16 0.58 0.69-6.73 0.19
P=0.51Female 96:639 0.02 3.53 0.48 1.38-
9.04 0.008
UKMale 71:2805 0.03 3.00 0.42 1.32-
6.83 0.009P=0.80Femal
e 93:2608 0.03 3.43 0.31 1.87-6.30 8.63×10⁻⁵
Meta-analysi
s
Male 134:3437 0.03 2.67 0.34 1.37-5.22 0.004
P=0.55Female 189:3247 0.03 3.46 0.26 2.07-
5.78 2. 19×10-6
All* 323:6684 0.03 3.10 0.21 2.07-4.64 3.93×10⁻⁸
* Association analysis with adjustment for sex.
Abbreviations: Ref allele Freq, frequency of reference alleles; OR, odds ratio; SE, standard error; 95% CI, 95% confidence
interval.
28

Table S10. Univariate heritability estimates of lithium-responsive BD
Phenotype Cases/Controls* Heritability (h2)* 95%CI P-value*
BD 3824 / 6247 32% 28 to 36 <0.01
Lithium-responsive BD
Subjective definition
Objective definition
1430 / 6247 29% 23 to 36 <0.01
307 / 6247 25% 0 to 51 0.03
* Numbers of cases and controls are after excluding one of each pair of individual with cryptic relatedness using GCTA; h2 is
SNP-heritability on the liability scale; P-values are from likelihood tests of null hypothesis of heritability being 0.
Abbreviations: BD, bipolar disorder; CI, confidence interval
29

References
1. Sachs GS, Thase ME, Otto MW, Bauer M, Miklowitz D, Wisniewski SR et al. Rationale, design, and methods of the systematic treatment enhancement program for bipolar disorder (STEP-BD). Biological psychiatry 2003; 53(11): 1028-1042.
2. Garnham J, Munro A, Slaney C, Macdougall M, Passmore M, Duffy A et al. Prophylactic treatment response in bipolar disorder: results of a naturalistic observation study. Journal of affective disorders 2007; 104(1-3): 185-190.
3. Squassina A, Manchia M, Borg J, Congiu D, Costa M, Georgitsi M et al. Evidence for association of an ACCN1 gene variant with response to lithium treatment in Sardinian patients with bipolar disorder. Pharmacogenomics 2011; 12(11): 1559-1569.
4. Grof P, Duffy A, Cavazzoni P, Grof E, Garnham J, MacDougall M et al. Is response to prophylactic lithium a familial trait? The Journal of clinical psychiatry 2002; 63(10): 942-947.
5. Squassina A, Manchia M, Congiu D, Severino G, Chillotti C, Ardau R et al. The diacylglycerol kinase eta gene and bipolar disorder: a replication study in a Sardinian sample. Molecular psychiatry 2009; 14(4): 350-351.
6. Shriner D. Approximate and exact tests of Hardy-Weinberg equilibrium using uncertain genotypes. Genetic epidemiology 2011; 35(7): 632-637.
7. Cross-Disorder Group of the Psychiatric Genomics Consortium, Lee SH, Ripke S, Neale BM, Faraone SV, Purcell SM et al. Genetic relationship between five psychiatric disorders estimated from genome-wide SNPs. Nature genetics 2013; 45(9): 984-994.
8. Rybakowski JK. Lithium in neuropsychiatry: A 2010 update. The World Journal of Biological Psychiatry 2011; 12(5): 340-348.
9. Garnham J, Munro A, Slaney C, MacDougall M, Passmore M, Duffy A et al. Prophylactic treatment response in bipolar disorder: Results of a naturalistic observation study. Journal of affective disorders; 104(1): 185-190.
30