surface analyzer tivi95 user manual user manual 3
TRANSCRIPT

Surface Analyzer TiVi95 User Manual
PIONEERS IN TISSUE VIABILITY IMAGING
User Manual 3.2 Version 3.2 February 2019

TiVi95 Surface Analyzer
Surface Analyzer TiVi95 Page 1
Dear Valued Customer!
Welcome to the WheelsBridge TiVi95 Skin Surface Analyzer system intended for automatic
analysis of cellulite appearance. The TiVi95 Skin Surface Analyzer was designed especially
for observer-independent analysis of cellulite in association with evaluation of skin care
products and follow up of treatment regimes.
The TiVi95 Skin Surface Analyzer utilizes a highly sensitive digital camera equipped with
polarization filters making it possible to suppress direct surface reflections from the skin
surface. The versatile system software – based on the MATLAB® high performance language
for technical computing – allows for rapid and easy capturing and analysis of images. Among
the many useful features of the TiVi95 Skin Surface Analyzer software the following are of
particular interest:
• Automatic capturing of photos.
• Region of Interest analysis.
• Automatic tracking of cellulite dimples.
• Library function to display up to 6 photos simultaneously.
• Trend monitoring.
• Surface Reflection Analysis
We are convinced that the Surface Analyzer TiVi95 will be a productive tool in the assessment
and follow-up of cellulite appearance following treatment with skin care products.
Thank you for choosing the WheelsBridge TiVi95 Skin Surface Analyzer.
WheelsBridge AB

TiVi95 Surface Analyzer
Surface Analyzer TiVi95 Page 2
Information in this document is subject to change without notice and does not represent a
commitment on the part of WheelsBridge AB. No part of this manual may be reproduced or
transmitted in any form or by any means, electronically or mechanically, including
photocopying and recording, for any purpose without the written permission of WheelsBridge
AB.
Any use of application of WheelsBridge products must be performed by properly trained and
qualified personnel. WheelsBridge AB takes no responsibility for action taken on the basis of
information derived from the use of the product described in this manual or from
consequential damages in connection with furnishing, performance or use of this manual.
Licensee’s limited rights are governed by the license agreement between WheelsBridge AB
and MathWorks. Licensee may not modify or remove any license agreement file
(MarthWorks or third party) that is included with the MCR Libraries (“MCR Library
License”). Licensee of this Application accepts the terms of the MCR Library License.
The Surface nalyzer is not registered as a Medical Device. It is intended for research
applications only.
WheelsBridge is a registered trade mark.
TiVi95 Surface Analyzer
Surface Analyzer TiVi95 Page 3
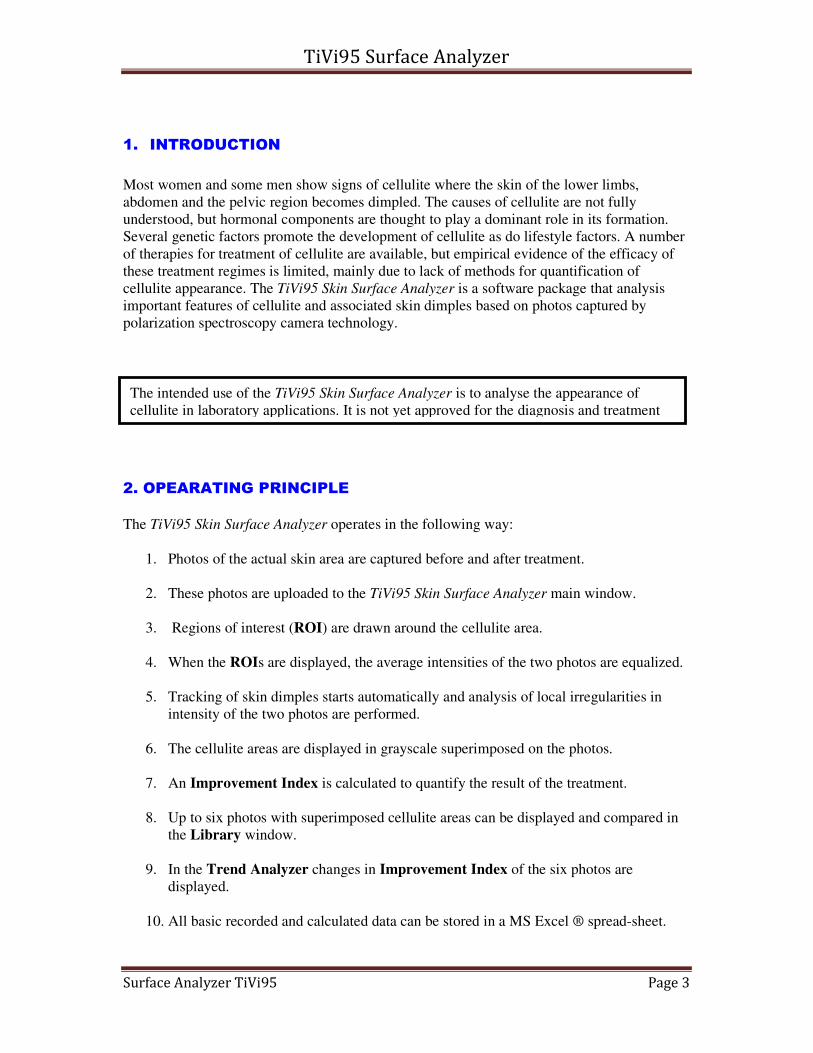
1. INTRODUCTION
Most women and some men show signs of cellulite where the skin of the lower limbs,
abdomen and the pelvic region becomes dimpled. The causes of cellulite are not fully
understood, but hormonal components are thought to play a dominant role in its formation.
Several genetic factors promote the development of cellulite as do lifestyle factors. A number
of therapies for treatment of cellulite are available, but empirical evidence of the efficacy of
these treatment regimes is limited, mainly due to lack of methods for quantification of
cellulite appearance. The TiVi95 Skin Surface Analyzer is a software package that analysis
important features of cellulite and associated skin dimples based on photos captured by
polarization spectroscopy camera technology.
2. OPEARATING PRINCIPLE
The TiVi95 Skin Surface Analyzer operates in the following way:
1. Photos of the actual skin area are captured before and after treatment.
2. These photos are uploaded to the TiVi95 Skin Surface Analyzer main window.
3. Regions of interest (ROI) are drawn around the cellulite area.
4. When the ROIs are displayed, the average intensities of the two photos are equalized.
5. Tracking of skin dimples starts automatically and analysis of local irregularities in
intensity of the two photos are performed.
6. The cellulite areas are displayed in grayscale superimposed on the photos.
7. An Improvement Index is calculated to quantify the result of the treatment.
8. Up to six photos with superimposed cellulite areas can be displayed and compared in
the Library window.
9. In the Trend Analyzer changes in Improvement Index of the six photos are
displayed.
10. All basic recorded and calculated data can be stored in a MS Excel ® spread-sheet.
The intended use of the TiVi95 Skin Surface Analyzer is to analyse the appearance of
cellulite in laboratory applications. It is not yet approved for the diagnosis and treatment

TiVi95 Surface Analyzer
Surface Analyzer TiVi95 Page 4
3. CELLULITE PARAMETERS
The TiVi95 Skin Surface Analyzer automatically tracks areas with low and irregular intensities
associated with skin dimpling. In the Reference photo (generally the photo captured before
treatment) the cellulite areas are displayed in grayscale while the non-cellulite areas are
displayed in colour. As default the threshold value in the Reference photo is set in such a
way that 50% of the photo displays grayscale values (Sensitivity = 1).
In the Second photo (generally the photo captured after treatment) the average intensity is
first made identical to that in the Reference photo. Applying the same threshold as in the
Reference photo the cellulite areas in the Second photo can now be displayed in grayscale.
The Improvement Index when going from the Reference photo to the Second photo is
calculated according to:
Improvement Index =
1 - (Relative grayscale area in Second photo / Relative grayscale area in Reference photo)
When the relative grayscale area in the Second photo is zero, the Improvement Index = 1
(maximal improvement) and when the relative grayscale area in the Second photo is identical
to that of the Reference photo, the Improvement Index = 0 (no improvement).

TiVi95 Surface Analyzer
Surface Analyzer TiVi95 Page 5
In the GETTING STARTED section these and other features are further explained by way of
an example.
3. GETTING STARTED
The basic features of the TiVi95 Skin Surface Analyzer are probably best explained by way of
an example. In the following example it is assumed that the photos Before-0001.jpg and
After-0001.jpg have been captured by a camera with polarizing filters and stored in the
TiVi95demonstration folder. These photos demonstrate cellulite appearance before and after
treatment at somewhat different exposure. The task is to calculate the Improvement Index
for the actual treatment procedure.
1. Open the TiVi95 Skin Surface Analyzer main window.
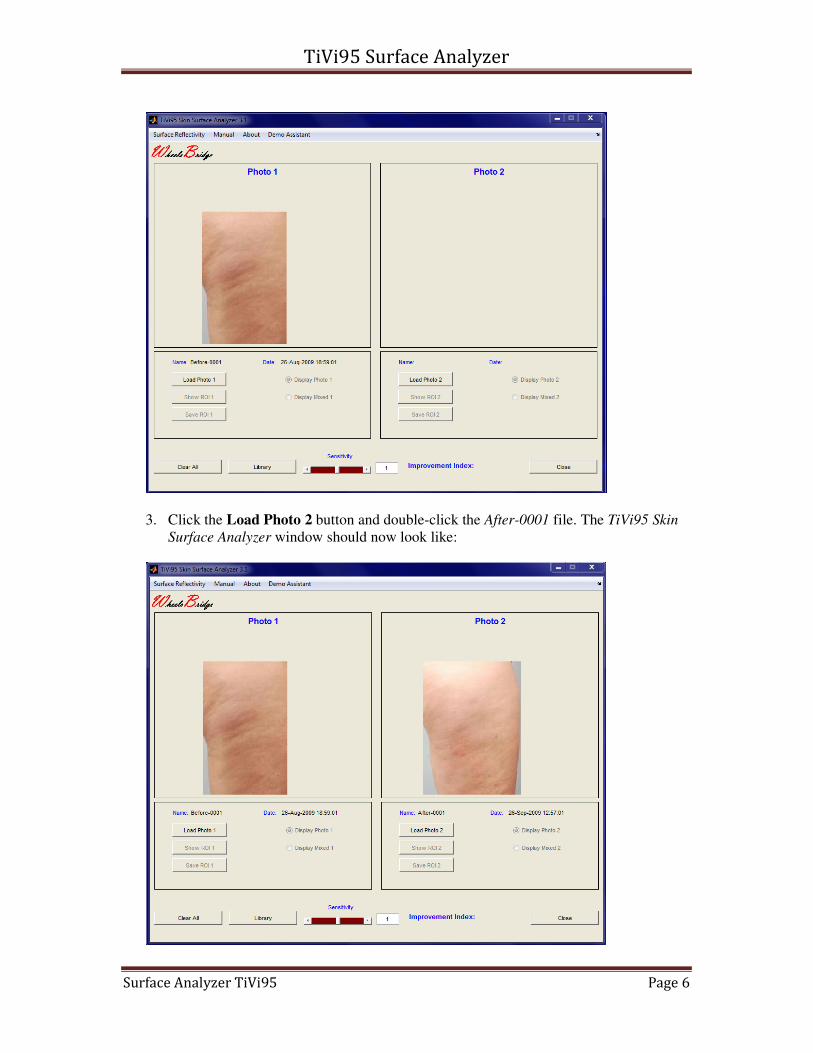
2. Click Load Photo1 and navigate to the TiVi95demonstration folder. Double-click the
Before-0001 file. The TiVi95 Surface Analyzer window should now look like.
TiVi95 Surface Analyzer
Surface Analyzer TiVi95 Page 6
3. Click the Load Photo 2 button and double-click the After-0001 file. The TiVi95 Skin
Surface Analyzer window should now look like:

TiVi95 Surface Analyzer
Surface Analyzer TiVi95 Page 7
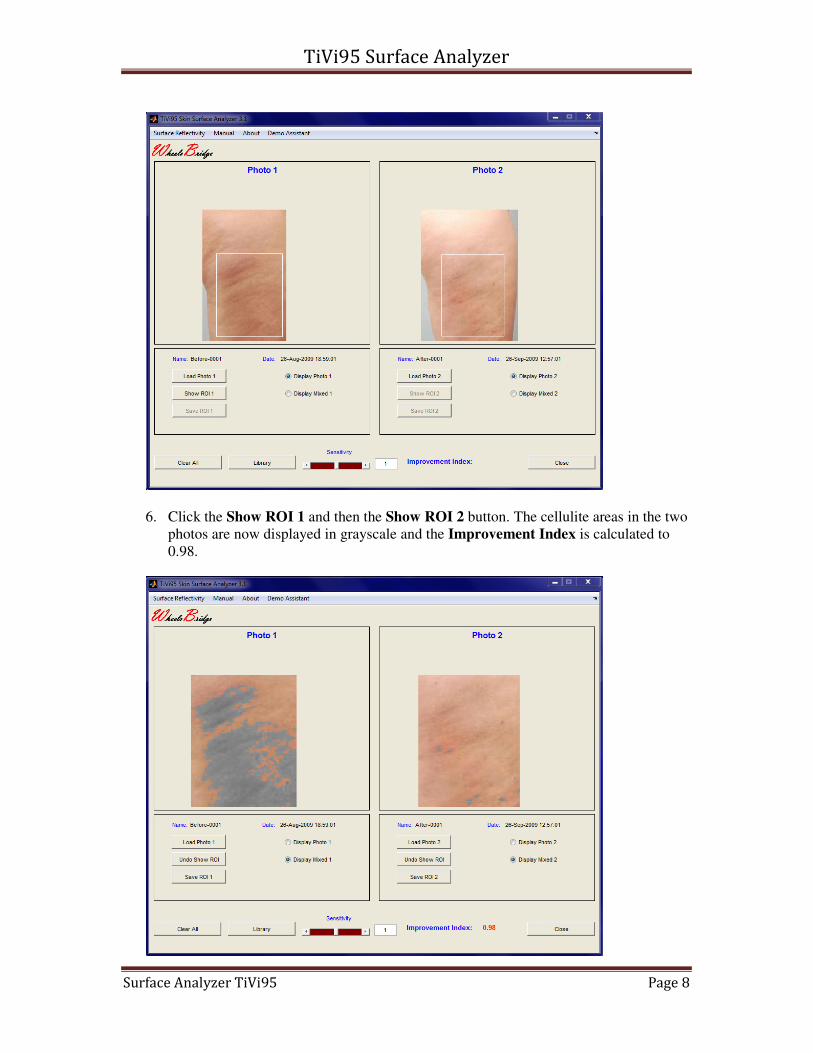
4. Draw a Region of Interest (ROI) by placing the mouse courser at the upper left corner
of the ROI, pressing the left mouse button and dragging the mouse to a point
representing the lower right corner of the ROI, where the left mouse button is
released. The TiVi95 Skin Surface Analyzer window should now look like:
5. Draw a similar ROI over approximately the same region in Photo 2.
TiVi95 Surface Analyzer
Surface Analyzer TiVi95 Page 8
6. Click the Show ROI 1 and then the Show ROI 2 button. The cellulite areas in the two
photos are now displayed in grayscale and the Improvement Index is calculated to
0.98.

TiVi95 Surface Analyzer
Surface Analyzer TiVi95 Page 9
7. Click the Display Photo 1 and Display Photo 2 button to display the original ROI
areas without the cellulite areas superimposed.
8. Click the Display Mixed 1 and Display Mixed 2 button to display the original ROI
areas with the cellulite areas superimposed.
9. Click the Save ROI 1 button to save the ROI 1 photo. Insert “A” in the Filename edit
box and click the Save button. The ROI 1 is now saved under the name
Cell_A_Before-0001. Files with prefix Cell can be read into the Library.
10. Click the Library button to open the empty Library window.
11. Click Load photos to open the Pick a file window. Navigate to the
TiVi95demonstration folder and select Cell_A_ce-0001 to Cell_A_ce-0005 by first
clicking on the Cell_A_ce-0001, then pressing the shift button on the computer
keyboard, while the Cell_A_ce-0005 file is selected. Alternatively individual files can
be selected while pressing the Ctr button on the computer key-board, while clicking
on the actual file name.
12. Click the Open button. The Library window should now look like:
TiVi95 Surface Analyzer
Surface Analyzer TiVi95 Page 10
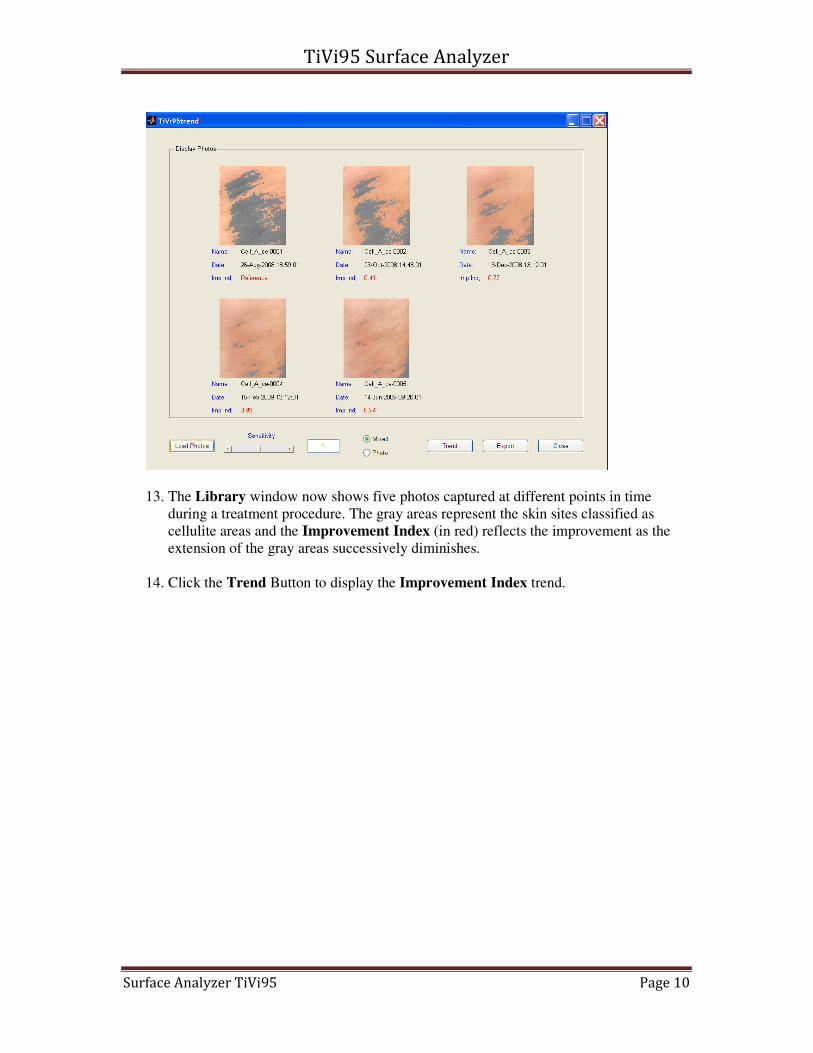
13. The Library window now shows five photos captured at different points in time
during a treatment procedure. The gray areas represent the skin sites classified as
cellulite areas and the Improvement Index (in red) reflects the improvement as the
extension of the gray areas successively diminishes.
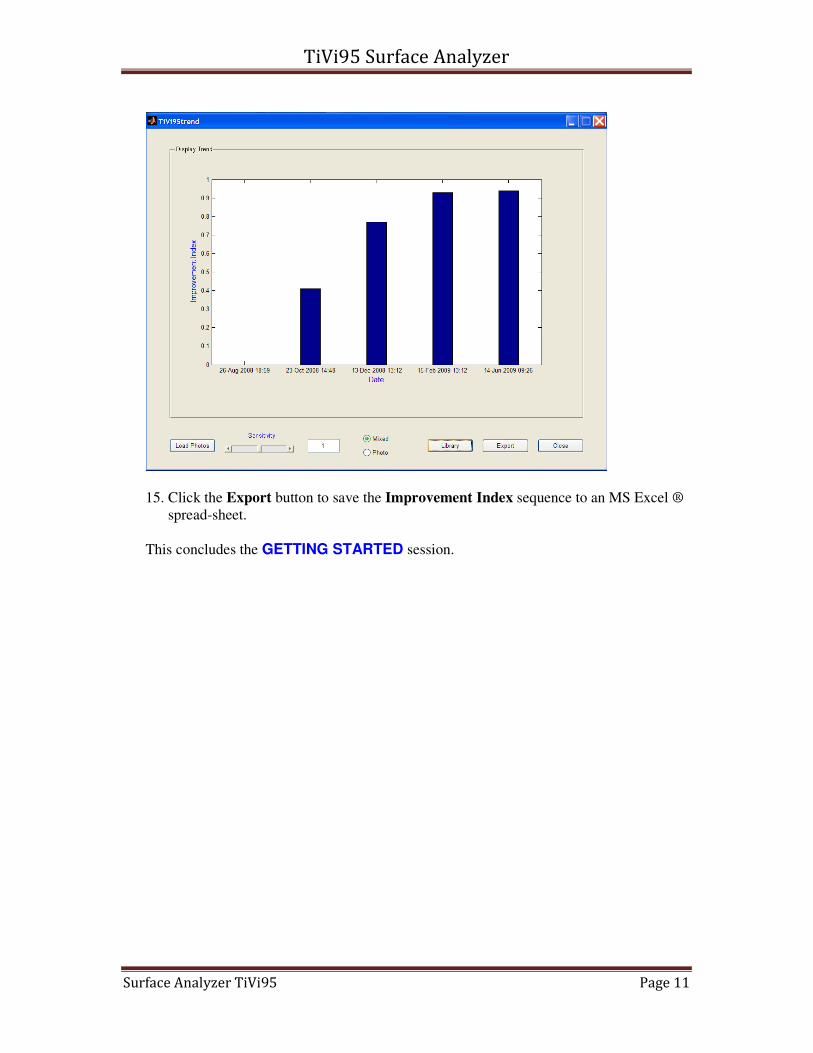
14. Click the Trend Button to display the Improvement Index trend.
TiVi95 Surface Analyzer
Surface Analyzer TiVi95 Page 11
15. Click the Export button to save the Improvement Index sequence to an MS Excel ®
spread-sheet.
This concludes the GETTING STARTED session.
TiVi95 Surface Analyzer
Surface Analyzer TiVi95 Page 12
4. DETAILED DESCRIPTION
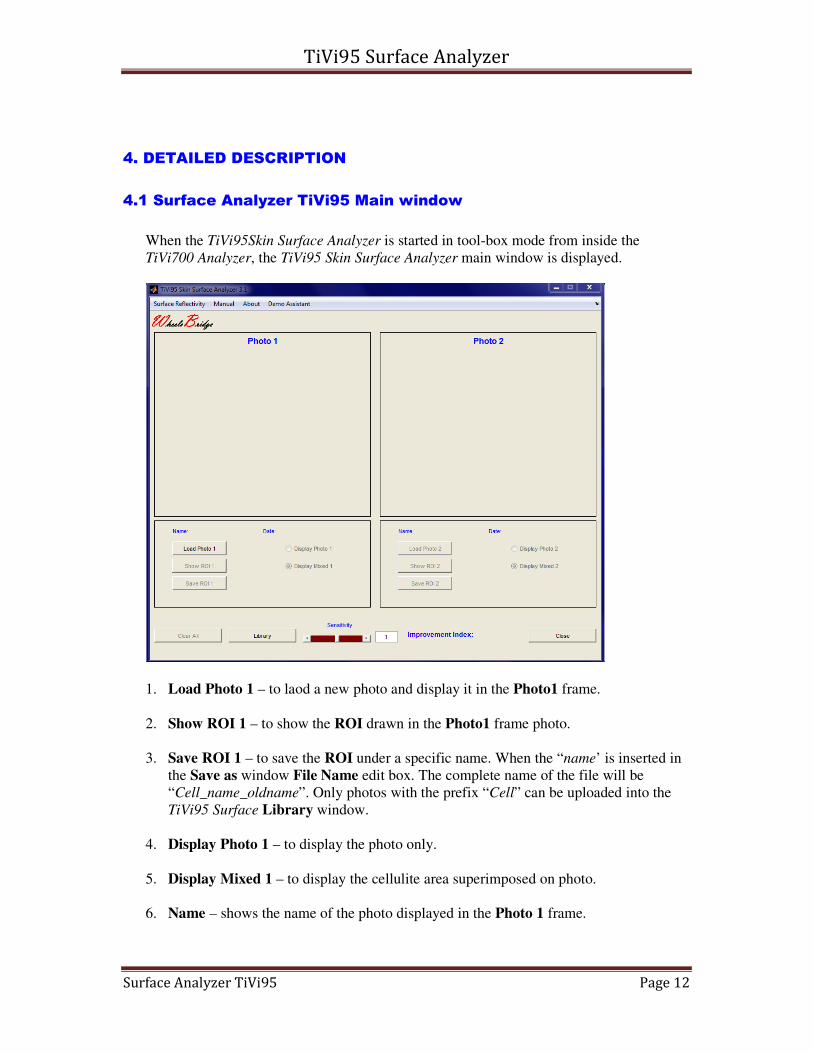
4.1 Surface Analyzer TiVi95 Main window
When the TiVi95Skin Surface Analyzer is started in tool-box mode from inside the
TiVi700 Analyzer, the TiVi95 Skin Surface Analyzer main window is displayed.
1. Load Photo 1 – to laod a new photo and display it in the Photo1 frame.
2. Show ROI 1 – to show the ROI drawn in the Photo1 frame photo.
3. Save ROI 1 – to save the ROI under a specific name. When the “name’ is inserted in
the Save as window File Name edit box. The complete name of the file will be
“Cell_name_oldname”. Only photos with the prefix “Cell” can be uploaded into the
TiVi95 Surface Library window.
4. Display Photo 1 – to display the photo only.
5. Display Mixed 1 – to display the cellulite area superimposed on photo.
6. Name – shows the name of the photo displayed in the Photo 1 frame.
TiVi95 Surface Analyzer
Surface Analyzer TiVi95 Page 13
7. Date – shows the date at which the photo displayed in the Photo 1 frame was
captured.
8. Load Photo 2 – to load a new photo and display it in the Photo 2 frame.
9. Show ROI 2 – to show the ROI drawn in the Photo 2 frame photo.
10. Save ROI 2 – to save the ROI under a specific name. When the “name’ is inserted in
the Save as window File Name edit box. The complete name of the file will be
“Cell_name_oldname”. Only photos with the prefix “Cell” can be uploaded into the
TiVi95 Surface Library window.
11. Display Photo 2 – to display the photo only.
12. Display Mixed 2 – to display the cellulite area superimposed on photo.
13. Name – shows the name of the photo displayed in the Photo 2 frame.
14. Date – shows the date at which the photo displayed in the Photo 2 frame was
captured.
15. Clear All – to clear both photos and reset the system.
16. Library – to open the Library window.
17. Sensitivity slider – to set the sensitivity of the cellulite threshold (default = 1).
18. Sensitivity Edit - to set the sensitivity of the cellulite threshold (default = 1).
19. Improvement Index – displays the improvement in cellulite appearance from photo1
to photo 2 (0 = no improvement, 1 = total improvement).
20. Close – to close the application.
21. Surface Reflectivity – to open the TiVi95 Surface Reflectivity window.
22. Manual – to display the on-line TiTi95 Skin Surface Analyzer manual.
23. About TiVi95 – TiVi95 about window.
24. Demo Assistant – to open the Demo Assistant.
TiVi95 Surface Analyzer
Surface Analyzer TiVi95 Page 14
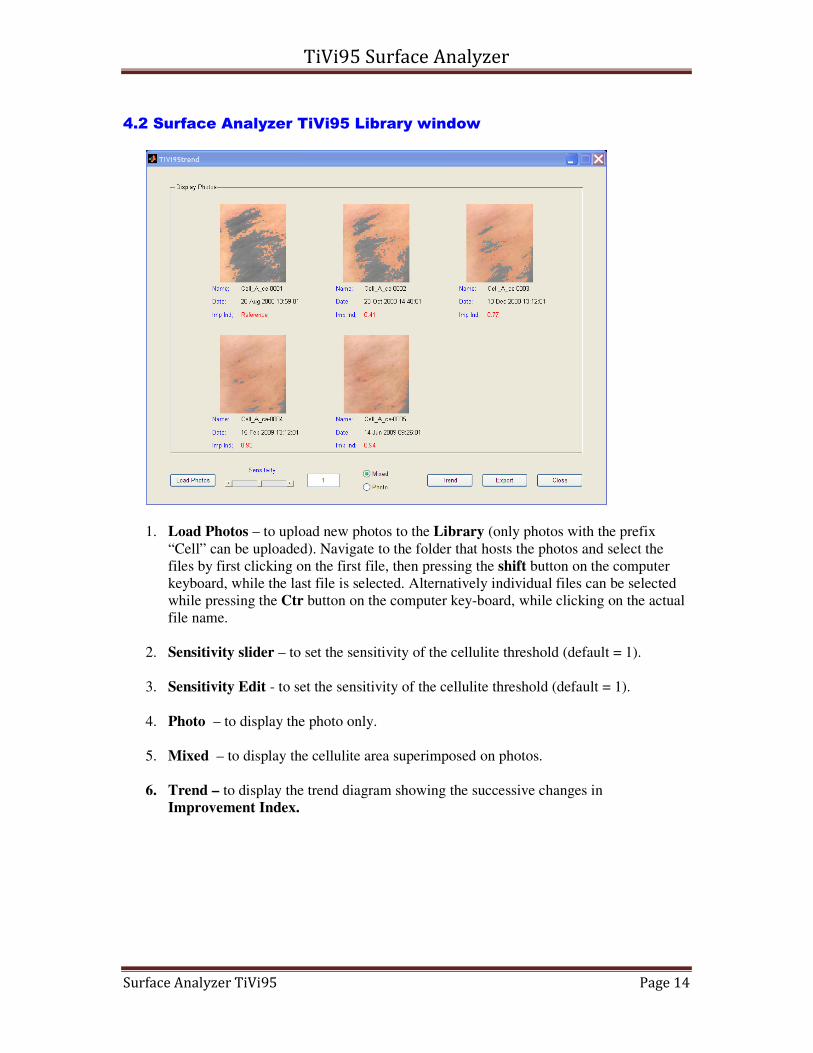
4.2 Surface Analyzer TiVi95 Library window
1. Load Photos – to upload new photos to the Library (only photos with the prefix
“Cell” can be uploaded). Navigate to the folder that hosts the photos and select the
files by first clicking on the first file, then pressing the shift button on the computer
keyboard, while the last file is selected. Alternatively individual files can be selected
while pressing the Ctr button on the computer key-board, while clicking on the actual
file name.
2. Sensitivity slider – to set the sensitivity of the cellulite threshold (default = 1).
3. Sensitivity Edit - to set the sensitivity of the cellulite threshold (default = 1).
4. Photo – to display the photo only.
5. Mixed – to display the cellulite area superimposed on photos.
6. Trend – to display the trend diagram showing the successive changes in
Improvement Index.

TiVi95 Surface Analyzer
Surface Analyzer TiVi95 Page 15
7. Library – to toggle back to the Library display.
8. Export – to export the Improvement Index data to an MS Excel ® spreadsheet.
9. Close – to close the Library window.
10. Below each photo the Name, Date and Improvement Index are displayed. The
Improvement Index is displayed in red and refers to the cellulite improvement in
relation to the first photo (also denoted Reference Photo).
TiVi95 Surface Analyzer
Surface Analyzer TiVi95 Page 16
4.3 Surface Reflectivity window
Using the Surface Reflections window the optical reflectance from a surface can be
investigated by analyzing photos captured in cross- and co-polarization mode. The process
starts with capturing two photos (one in cross- and one in co-polarization mode) of the same
object.
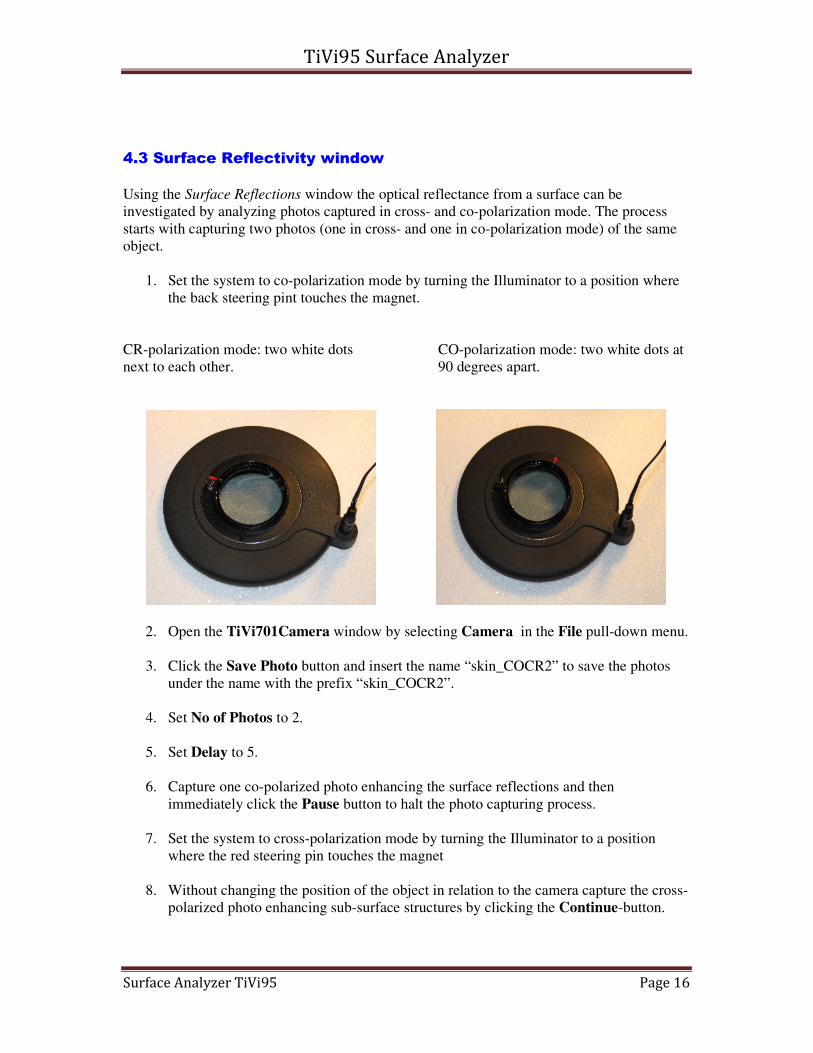
1. Set the system to co-polarization mode by turning the Illuminator to a position where
the back steering pint touches the magnet.
CR-polarization mode: two white dots CO-polarization mode: two white dots at
next to each other. 90 degrees apart.
2. Open the TiVi701Camera window by selecting Camera in the File pull-down menu.
3. Click the Save Photo button and insert the name “skin_COCR2” to save the photos
under the name with the prefix “skin_COCR2”.
4. Set No of Photos to 2.
5. Set Delay to 5.
6. Capture one co-polarized photo enhancing the surface reflections and then
immediately click the Pause button to halt the photo capturing process.
7. Set the system to cross-polarization mode by turning the Illuminator to a position
where the red steering pin touches the magnet
8. Without changing the position of the object in relation to the camera capture the cross-
polarized photo enhancing sub-surface structures by clicking the Continue-button.

TiVi95 Surface Analyzer
Surface Analyzer TiVi95 Page 17
9. Two photos captured in the cross- and co-polarization mode respectively are now
stored under the names skin_COCR2-0001 and skin_COCR2-0002 respectively.
10. In the following example these two files are pre-stored as examples in the folder
Skin_COCR in the TiVi95demonstration folder. In these two photos a cream has been
topically applied to the skin. The surface reflectivity of skin areas with and without
cream is to be compared.
11. Open the TiVi95 Skin Surface Analyzer window.
12. Open the Surface Reflections window by clicking Surface Reflectivity in the pull-
down menu.

TiVi95 Surface Analyzer
Surface Analyzer TiVi95 Page 18
13. Click the Load CO Photo button and navigate to the Skin_COCR folder located in the
TiVi95demostration folder. Double click the skin_COCR-0001.jpg file to upload this
photo.
14. Click the Load CR Photo button and navigate to the Skin_COCR folder located in the
TiVi95demostration folder. Double click the skin_COCR-0002.jpg file to upload this
photo.
TiVi95 Surface Analyzer
Surface Analyzer TiVi95 Page 19
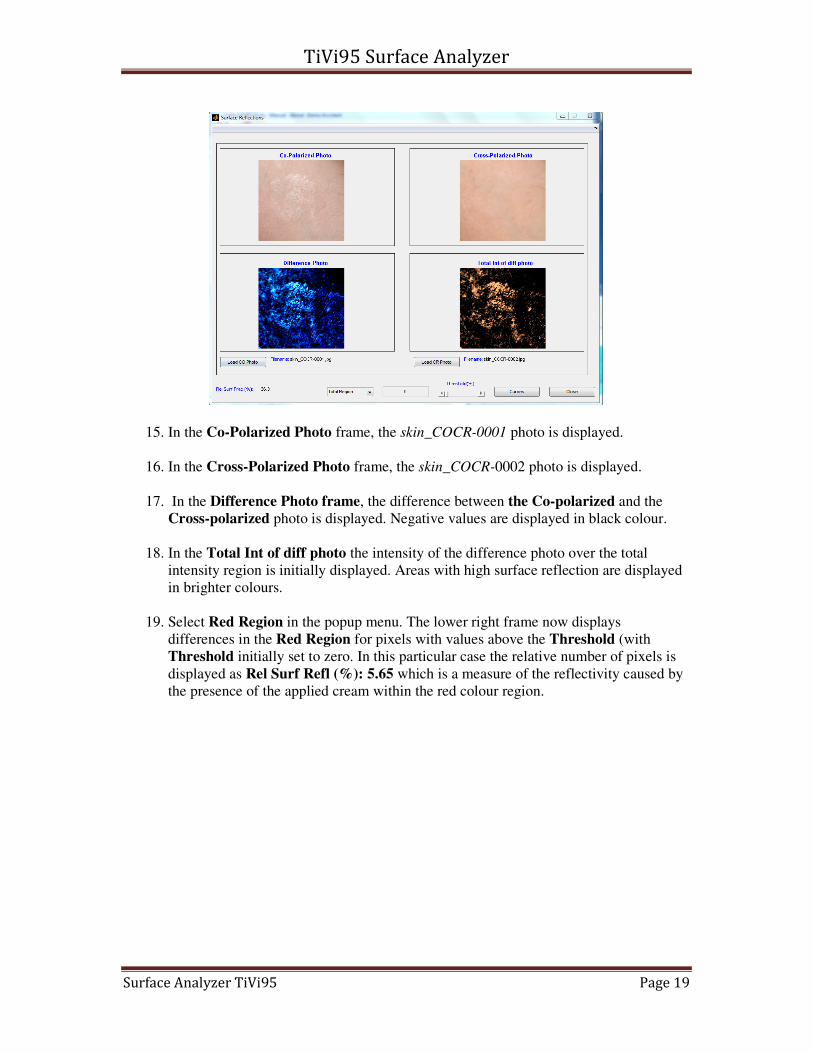
15. In the Co-Polarized Photo frame, the skin_COCR-0001 photo is displayed.
16. In the Cross-Polarized Photo frame, the skin_COCR-0002 photo is displayed.
17. In the Difference Photo frame, the difference between the Co-polarized and the
Cross-polarized photo is displayed. Negative values are displayed in black colour.
18. In the Total Int of diff photo the intensity of the difference photo over the total
intensity region is initially displayed. Areas with high surface reflection are displayed
in brighter colours.
19. Select Red Region in the popup menu. The lower right frame now displays
differences in the Red Region for pixels with values above the Threshold (with
Threshold initially set to zero. In this particular case the relative number of pixels is
displayed as Rel Surf Refl (%): 5.65 which is a measure of the reflectivity caused by
the presence of the applied cream within the red colour region.
TiVi95 Surface Analyzer
Surface Analyzer TiVi95 Page 20
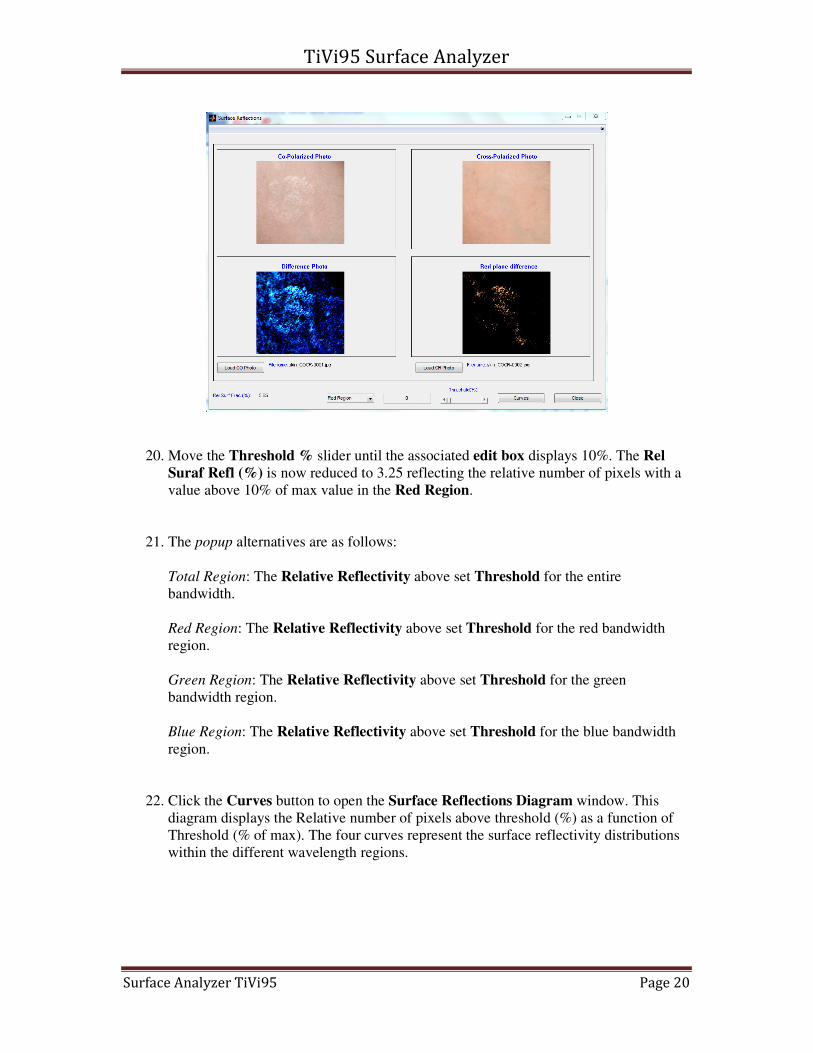
20. Move the Threshold % slider until the associated edit box displays 10%. The Rel
Suraf Refl (%) is now reduced to 3.25 reflecting the relative number of pixels with a
value above 10% of max value in the Red Region.
21. The popup alternatives are as follows:
Total Region: The Relative Reflectivity above set Threshold for the entire
bandwidth.
Red Region: The Relative Reflectivity above set Threshold for the red bandwidth
region.
Green Region: The Relative Reflectivity above set Threshold for the green
bandwidth region.
Blue Region: The Relative Reflectivity above set Threshold for the blue bandwidth
region.
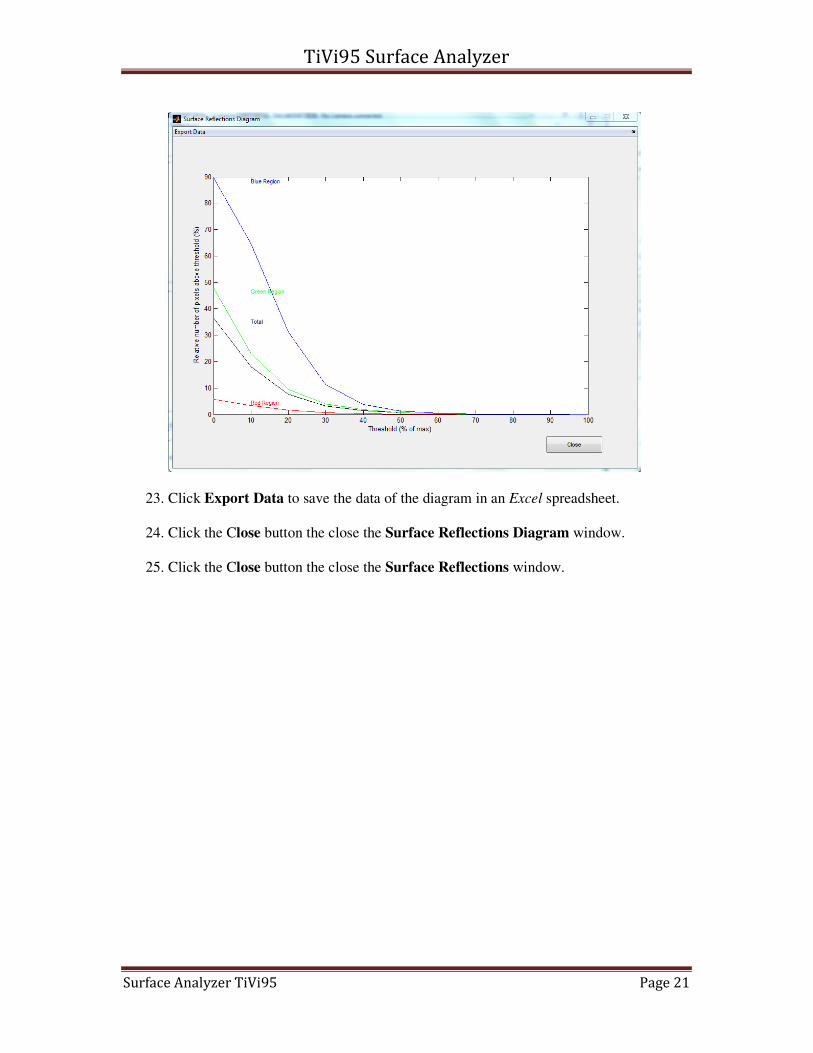
22. Click the Curves button to open the Surface Reflections Diagram window. This
diagram displays the Relative number of pixels above threshold (%) as a function of
Threshold (% of max). The four curves represent the surface reflectivity distributions
within the different wavelength regions.
TiVi95 Surface Analyzer
Surface Analyzer TiVi95 Page 21
23. Click Export Data to save the data of the diagram in an Excel spreadsheet.
24. Click the Close button the close the Surface Reflections Diagram window.
25. Click the Close button the close the Surface Reflections window.