surface water supply of hawaii - usgs · surface water supply of hawaii, july 1,1916, to june 30,...
TRANSCRIPT

DEPARTMENT OF THE INTERIORFRANKLIN K. LANE, Secretary
UNITED STATES GEOLOGICAL SURVEYGEORGE OTIS SMITH, Director
Water-Supply Paper 465
SURFACE WATER SUPPLY OF HAWAIIJULY 1, 1916, TO JUNE 30, 1917
NATHAN C. GROVER, Chief Hydraulic EngineerG. E. LARRISON, District Engineer
Prepared in cooperation with the TERRITORY OF HAWAII
WASHINGTONGOVERNMENT PRINTING OFFICE
1918

ADDITIONAL COPIES
OF THIS PUBLICATION MAY BE PROCURED FEOM
THE SUPERINTENDENT OF DOCUMENTS
GOVERNMENT PRINTING OFFICE
WASHINGTON, D. C.
AT
15 CENTS PER COPY

CONTENTS.
Authority for investigations .....j.......................................... 7Cooperation................................................................ 9Scope of work.............................................................. 10Field methods of measuring streaiji flow..................................... 10
Base data.............................................................. 10Weir measurements.................................................... 11Velocity-area method........ t .......................................... 11
Definition of terms......................................................... 15Convenient equivalents.................................................... 17Office methods of computing and Studying discharge and run-off.............. 18Explanation of tables...................................................... 21Accuracy of field data and computed results................................ 22Division of work.......................................................... 22Gaging stations maintained in Hawaii........................................ 22Gaging-station records............|.......................................... 28
Island of Kauai........................................................ 28Waimea River near Wainjiea....................................... 28Kawaikoi Stream near Waimea..................................... 30Waiahulu Stream near Wlaimea...................................... 31Koaie Stream near Waimea........................................ 32Waialae River at elevation 800 feet, near Waimea................... 34Kekaha ditch at flume No. 4, near Waimea.......................... 36Kekaha ditch below tunnel No. 12, near Waimea.................... 37Waimea ditch near Wainiea......................................... 39Kamenehune ditch near jWaimea.................................... 40Makaweli River near Waimea...................................... 42Olokele ditch at tunnel No. 12, near Makaweli....................... 43Olokele ditch at weir, nejar Makaweli................................ 45Hanapepe River at Koula|, near Eleele.............................. 46Hanapepe ditch at Koulsj,, near Eleele............................... 48Hanapepe ditch at weir, (near Hanapepe............................ 49South Fork of Wailua Rijrer near Lihue.............................. 50Hanamaulu ditch near Lihue....................................... 52Lihue ditch near Lihue. +......................................... 53North Fork of Wailua Ri^er at elevation 650 feet, near Lihue ......... 55Kanaha ditch near Lihue^......................................... 56East Branch of North Foik of Wailua River near Lihue............... 58Kapaa River near Kealia.......................................... 59Kapahi ditch near Kealia.......................................... 61Anahola River near KealJLa......................................... 63Anahola ditch above Kaneha reservoir, near Kealia................. 64Kalihiwai River near Hanalei....................................... 66Hanalei River at elevation 625 feet, near Hanalei ................... 67Hanalei River near Hanalei....................................... 69China ditch near Hanalei.......................................... 70
3

4 CONTENTS.
Gaging-station records Continued.Island of Kauai Continued. Page.
Kuna ditch near Hanalei.......................................... 72Lumahai River near Hanalei...................................... 73Waioli Stream near Hanalei........................................ 75Wainiha River, east and west channels, near Wainiha................ 76Miscellaneous measurements...................................... 79
Island of Oahu........................................................ 79Kalihi Stream near Honolulu....................................... 79Nuuanu Stream below reservoir No. 2 wasteway, near Honolulu...... 8]Manoa Stream at College of Hawaii, near Honolulu.................. 83West Branch of Manoa Stream near Honolulu........................ 85East Branch of Manoa Stream near Honolulu........................ 87Makawao Spring near Kailua...................................... 89Main spring near Kailua........................................... 89Haiku Stream near Heeia....................... 1.................. 90Kahana Stream near Kahana...................................... 91East Branch of Kahana Stream near Kahana......................... 93Punaluu Stream at elevation 539 feet, near Punaluu................. 94Punaluu Stream at elevation 250 feet, near Punaluu................ 96Waihoi Stream near Punaluu....................................... 97Kaluanui Stream near Hauula..................................... 98Koloa Stream near Laie............................................ 100Wailele Stream near Laie....................'...................... 101East Branch of Kahawainui Stream near Laie........................ 103East Branch of Malaekahana Stream near Kahuku................... 105Middle Branch of Malaekahana Stream near Kahuku. ................< 106Right Branch of North Fork of Kaukonahua Stream near Wahiawa... 108Left Branch of North Fork of Kaukonahua Stream near Wahiawa.... 109South Fork of Kaukonahua Stream above United States Army reser
voir, near Wahiawa............................................. IllSouth Fork of Kaukonahua Stream below United States Army reser
voir, near Wahiawa............................................. 113Miscellaneous measurements...................................... 115
Island of Maui......................................................... 115South Waiehu Stream near Wailuku...............'................ 115North Waiehu ditch near Wailuku.................................. 116Waihee Stream near Waihee........................................ 118Honokahau Stream near Honokahau................................ 120Honolua Stream near Honokahau................................... 122Honokawai Stream near Lahaina.................................... 123Honokawai ditch near Lahaina..................................... 125Kahoma Stream near Lahaina.-.................................... 126Kahoma development tunnel near Lahaina......................... 128Lahainaluna Stream above pipe-line intake, near Lahaina........... 129Kauaula Stream near Lahaina..................................... 131Kauaula ditch near Lahaina........................................ 132Launiupoko Stream near Lahaina................................... 134Olowalu ditch near Olowalu....................................... 135Ukumehame Stream near Olowalu.................................. 137Waikapu Stream near Waikapu.................................... 139Palolo ditch near Waikapu........................................ 140South Side Waikapu ditch near Waikapu........................... 142West Kopiliula Stream near Keanae................................ 143

CONTENTS. 5
Gaging-station records Continued.Island of Maui Continued. Page.
East Wailuaiki Stream near Keanae................................ 145West Wailuaiki Stream near Keanae................................ 147East Wailuanui Stream near Keanae-.............................. 148West Wailuanui Stream near Keanae. ............................... 150Honomanu Stream near Keanae. . ................................. 151Haipuaena Stream near Huelo...................................... 153Puohakamoa Stream near Huelo.................................... 155Alo Stream near Huelo............................................ 156Waikamoi Stream near Huelo....................................... 158Nailiilihaele Stream near Huelo. .................................. 159Kailua Stream near Huelo........................................ 161Hoolawaliilii Stream near Huelo................................... 162Hoolawanui Stream near Huelo..................................... 164Honopou Stream near Huelo....................................... 165New Hamakua ditch at Halehaku weir, near Huelo................. 167Kauhikoa ditch at Opana weir, near Huelo.......................... 168Lowrie ditch at Opana weir, near Huelo............................ 169Haiku ditch at Peahi weir, near Huelo............................. 170Miscellaneous measurements ...................................... 171
Island of Hawaii....................................................... 171Tipper Hamakua ditch at Puualala and reservoir No. 3 weirs, near
Kukuihaele.................................................... 171Lower Hamakua ditch at main weir, near Kukuihaele............... 172Kohala ditch at Awini weir, near Kohala............................ 173Kohala ditch at Niulii weir, near Kohala............................. 176
Rainfall ................................................................. 180General conditions ................................................... 180Rainfall stations...................................................... 181
Kauai ........................................................... 181Oahu... ...............^......................................... 182Maui ............................................................ 183Hawaii.......................................................... 183
Records of rainfall.................................................... 185Index ................................................................... 189

SURFACE WATER SUPPLY OF HAWAII, JULY 1,1916, TO JUNE 30, 1917.
AUTHORITY FOR INVESTIGATIONS.
This volume contains results of measurements of the flow of cer tain streams and ditches and records of rainfall in the Territory of Hawaii made during the year ending June 30, 1917. The investiga tions leading to the report were made by the United States Geological Survey in cooperation with the Territory of Hawaii, under the general sanction of the organic law of the Survey (Stat. L., vol. 20, p. 394), which contains the following paragraph:
Provided, That this officer [the Director] shall have the direction of the geological survey and the classification of public lands and examination of the geological struc ture, mineral resources, and products of the national domain.
As water is the most abundant and most valuable of the minerals, the investigation of water resources is authorized under the provision for examining mineral resources. The work has been supported since the fiscal year ending June 30, 1895, by appropriations in successive sundry civil bills passed by Congress under the following item:
For gaging the streams and determining the water supply of the United States, and for .the investigation of underground currents and artesian wells, and for the prepara tion of reports upon the best methods of utilizing the water resources.
The legislature of the Territory of Hawaii approved on March'22, 1909, "An act to promote the conservation and development of the natural resources of the Territory," which provided in substance as follows: A special tax of 2 per cent shall be levied, assessed, and col lected annually on all incomes in excess of $4,000; and all amounts so collected shall constitute a special fund to be expended only for the encouragement of immigration and the conservation of natural resources in the proportion of three-fourths for immigration and one- fourth for conservation. The conservation fund shall be used for the development, conservation, improvement, and utilization of the nat ural resources, and shall be available for expenditure at such times and in such manner as a board of three persons appointed in accord ance with section 80 of the organic act shall, with the approval of the governor, determine.
An act of April 26, 1911, amended the original act so as to extend it until December 31, 1913.
On April 4, 1913, the governor of the Territory of Hawaii approved the following acts providing (act 56) for the creation and maintenance
7

8 SURFACE WATER SUPPLY OP HAWAII, 1916-17.
of a division of hydrography under the board of agriculture and forestry, and (act 57) appropriating the revenues from water licenses for the use of the board of commissioners of agriculture and forestry toward forest protection and hydrographic surveying.
Section 1 of act 56 reads:The board of agriculture and forestry is hereby authorized to create and maintain
a division of hydrography for the investigation and determination of the water re sources of the Territory by the gaging of streams and rainfall and other means, in cooperation with the United States Geological Survey or otherwise, and in further ance thereof to take over and exercise the functions of the Territory in the conduct of the present hydrographic survey of the Territory.
Section 2 provides that this act shall take effect July 1, 1913. Section 1 of act 57 reads:
All revenues derived from water licenses issued by the Territory during the period beginning July 1, 1913, and ending June 30, 1915, whether by way of rentals or other wise, shall constitute and be held as a special fund in the treasury of the Territory to be disbursed on warrants of the auditor issued on approved vouchers of the presi dent of the board of commissioners of agriculture and forestry. Such moneys shall be apportioned and applied from time to time by the board of commissioners of agri culture and forestry, acting with the approval of the governor, equally between the division of forestry and the division of hydrography to the following general purposes, and not otherwise:
1. For the protection of forest reservations, established or set apart according to law, against damage by fire, animals, and otherwise by means of fences and any other means whatsoever, and for the expenditures of the division of forestry.
2. For the development and maintenance of the hydrographic survey throughout the Territory.
Each voucher against said fund shall designate the general purpose for which it is drawn.
Section 2 provides that this act also shall take effect July 1, 1913.Since June 30, 1915, the funds for the use of the division of hydrog
raphy have been supplied by successive appropriations from the general revenues of the Territory.
On March 23, 1917, the following act by the legislature of the Ter ritory of Hawaii was approved:
ACT 27.
SECTION 1. The division of hydrography, authorized by and created pursuant to section 483 of the Revised Laws of Hawaii, 1915, is hereby transferred, together with all the materials, equipment, and supplies now under the control of the division or of the board of commissioners of agriculture and forestry for the division, to the commissioner of public lands.
SEC. 2. The commissioner of public lands shall have and exercise the same powers, duties, and jurisdiction with respect to said division as are now exercised by the board of commissioners of agriculture and forestry.
SEC. 3. All unexpended balances of appropriations heretofore made for said division, the expenditure of which is now by law vested in the board of commissioners of agri culture and forestry, are hereby transferred to the commissioner of public lands and the expenditure thereof vested in said commissioner.
SEC. 4. This act shall take effect upon its approval.

SURFACE WATER SUPPLY OF HAWAII, 1916-17. 9
COOPERATION.
COOPERATION WITH THE TERRITORY OP HAWAII.
Under the authority conferred by the Federal and Territorial legislation, the Director of the United States Geological Survey and the governor of the Territory of Hawaii entered into a cooperative agreement, dating from July 1, 1910, for "the gaging of streams and the determination of the water supply of the Territory of Hawaii." 1
The principal features of this agreement are:1. The United States Geological Survey assumes the responsibility
of gathering, analyzing, and publishing the data.2. During the progress of the work all notes, maps, and data gath
ered as a result of field studies are at all times open to inspection by the representative of the Territory, and if they are not satisfactory the agreement can be terminated.
3. Accounts for payment of salaries, travel, and subsistence, sup plies, or other expenses necessary to the completion of the work shall be rendered in the manner required by the laws and regulations of the contracting parties, and vouchers shall be presented to either party for payment according as it may be convenient or according to the balance remaining in the respective allotments.
4. The cost of publication is borne entirely by the Geological Survey.
Unless otherwise stated, all data have been collected and are published under this cooperative agreement with the Territory of Hawaii, which has borne from 60 to 80 per cent of the cost thereof.
Until June 30, 1913, the Territory of Hawaii was represented in the cooperation by the Board of Conservation; from July 1, 1913, to March 23, 1917, by the Board of Commissioners of Agriculture and Forestry; and since this date by the Commissioner of PublicLands.
OTHER COOPERATION.
Special investigations have been made in cooperation with the Hawaiian department of the United States Army, the city and county of Honolulu, and private persons and corporations, under one of the plans indicated in the following paragraphs:
1. Expense of work, equipment, or installation paid entirely or in part by the cooperating party or by direct reimbursement to the field men.
2. Records collected by employees of a cooperating party but under supervision of and by methods of the Survey.
3. Assistance given in the collection of records, such as furnishing transportation, subsistence, or equipment.
i The United States Geological Survey also cooperated with the Territory of Hawaii in mapping several islands. The whole of the islands of Kauai and Oahu and a part of the island of Hawaii have been mapped.

10 SURFACE WATER SUPPLY OP HAWAII, 1916-17.
4. Records furnished by a cooperating party, collected by his methods and under his supervision.
Cooperation in the collection of records for whose accuracy respon sibility has not rested with the Survey has been acknowledged in the descriptions of the stations. Special acknowledgment is due to the following individuals and companies cooperating under plans 1, 2, and 3: Island of Kauai Hawaiian Sugar Co., Mr. Charles Rice, Makee Sugar Co., Kauai Electric Co., Waimea Sugar Co., and Lihue Planta tion Co.; Island of Oahu United States Army Constructing Quarter master Department, Wahiawa Water Co., Kahuku Plantation, Laie Plantation, Koolau Agricultural Co., Kaneohe Ranch Co., and Mauna- wili Ranch; Island of Maui Wailuku Sugar Co., Pioneer Mill Co., Olowalu Sugar Co., Honolua Ranch, and East Maui Irrigation Co.
SCOPE OF WORK.
The investigations of stream and ditch flow in the Territory are not complete nor do they include all the streams and ditches that might advantageously be studied. They include, however, as many of the streams and ditches on the four larger islands as the available appropriations would allow. It is essential that records of-stream flow should be kept during a period of years long enough to determine within reasonable limits the range of flow from the maximum to the minimum. The length of such a period manifestly varies for dif ferent streams. Experience has shown that the records should be kept from 20 to 30 years.
In the performance of this work an effort is made to reach the highest degree of precision possible with a rational expenditure of time and money. In all engineering work there is a point beyond which refinement is needless and wasteful, and this statement applies with especial force to stream-measurement work in Hawaii. It has been found, however, that it is possible to obtain data which are sufficiently accurate, although many of those presented in this report are for periods too short to warrant definite conclusions.
Special intensive investigations of the discharge of many streams which are of major importance for domestic water supply, power, and irrigation have been made.
Investigations of ditch seepage and other losses, in many localities, were made in cooperation with the United States Army and private corporations.
FIELD METHODS OF MEASURING STREAM FLOW.
BASE DATA.
In making plans for power, irrigation, municipal water supply, and other projects involving the use of water from surface streams it is necessary to have data from which both the total flow of the stream and its distribution from day to day throughout the year can be

FIELD METHODS. 11
obtained. The data necessary for obtaining such information are daily gage heights, which give the fluctuations of rise and fall of the stream, and measurements of discharge at various stages, from which a rating curve and table can be prepared giving the discharge for any stage. Such a rating is possible from the fact that so long as the con ditions at the controlling section in the stream remain the same the discharge will be approximately the same for any given gage height.
Points at which discharge measurements are made and records of daily fluctuations of stage are kept for determining the daily flow are termed gaging stations.
Gaging stations may be divided into two classes, known as weir stations and velocity-area stations. At weir stations the head .of water on the crest of the weir is measured and the discharge com puted by means of a formula. The discharge at velocity-area sta tions is obtained by measuring the velocity of the current and the area of cross section, the product of the two giving the discharge.
The data presented in this paper were collected at both weir and velocity-area stations.
WEEK, MEASUREMENTS.
Unquestionably a weir properly constructed and of a type for which accurate coefficients have been determined is one of the most convenient and reliable means of measuring small quantities of water. In practice, however, weirs rarely conform to the requirements imposed by the experimenter who derived the coefficients. If the crest of the weir is sharp and clean and sufficiently high above the bottom of the leading channel, if the end contractions are complete and the velocity of approach is wanting or negligibly small, and if the head on the crest is measured at a distance back of the overfall at least as great as the length of the weir crest, the Francis formula will give good results. On the other hand, if these essential conditions are not complied with if the weir is improperly constructed and there is leakage around and under it, and especially if the velocity of approach is considerable and the contractions are imperfect, the Francis for mula will not give accurate results.
Observations made on various types of weirs in Hawaii show that not all the weirs in use in the Territory are giving accurate results. If the error is known, so that corrections can be made, the trouble is largely mitigated, but faulty weir records are too often accepted without investigation as to their accuracy.
VELOCITY-AREA METHOD.
The velocity-area method of measurement consists in determining the mean or average velocity of the water passing a given cross-section area. The area of the cross section at right angles to the direction of flow is ascertained by soundings which are tajten at such distances
12 SURFACE WATER SUPPLY OF HAWAII, 19>16-lt.
apart as will show the contour of the stream bed. The depths are recorded and also their distances from some arbitrarily chosen initial point on one side of the stream.
The method of making the soundings depends on the size and stage of the stream. On ditches and small streams, where the depths and velocities are not large, a graduated rod may be used; on large streams, which must be measured from bridges or cables, a lead weight and sounding line must be used. The size of weights whether 10 or 15 pounds depends on the swiftness of the current; and the weights are torpedo shaped, so as to offer as little resistance as possible to the moving water.
Qn streams whose beds are permanent or nearly so a standard cross section is usually constructed from careful soundings and referred to the zero of the gage, so that the depths for any stage can be found by adding the gage height at that stage to the depths below the zero of the gage. This method is especially useful at high stages, when it is difficult to make accurate soundings.
After the cross-section area of the stream has been measured by soundings and horizontal distances, the velocity is determined at a number of points. These measurements of velocity should be made at frequent intervals across the stream and close enough to take account of any abrupt change in the velocity. For convenience, the velocities are usually observed in the same verticals at which sound ings are made. On some streams fairly good measurements of veloci ties may be made by means of subsurface floats. This method is applicable, however, only to channels of uniform cross-section area over a considerable distance, and is very unsatisfactory for use on natural streams like those of Hawaii.1
The velocity of flow is best determined by the current meter, which is a form of water wheel actuated by the current and of such size and shape that it can easily be placed at any point in the stream.
The penta-recording current meter consists of six cups attached to a vertical shaft which revolves on a conical hardened-steel point when immersed in moving water. The revolutions are indicated electrically or acoustically. The rating, or relation between the velocity of moving water and the revolutions of the wheel, is deter mined for each meter by drawing it through still water for a given distance at different speeds and noting the number of revolutions for each run. From these data a rating table is prepared which gives the velocity in feet per second of moving water for any number of revolutions in a given time. The ratio of revolutions per second to velocity of flow in feet per second is very nearly, a constant for all speeds and is approximately 0.45.
1 Further information regarding the float method is given in Water-Supply Paper 95 and in textbooks on stream flow.

FIELD METHODS. 13
Three classes of methods of measuring velocity with current meters are in general use multiple-point, single-point, and integration.
The two principal multiple-point methods in general use are the vertical velocity curve and 0.2 and 0.8 depth.
In the vertical velocity-curve method a series of velocity determi nations are made in each vertical at regular intervals, usually about 10 to 20 per cent of the depth apart. By plotting these velocities as abscissas and their depths as ordinates, and drawing a smooth curve among the resulting points, the vertical velocity curve is developed. This curve shows graphically the magnitude and changes in velocity from the surface to the bottom of the stream. The mean velocity in the vertical is then obtained by dividing the area bounded by this velocity curve and its axis by the depth. This method of obtaining the mean velocity in the vertical is probably the best known, but on account of the length of time required to make a complete meas urement its use is largely limited to the determination of coefficients for purposes of comparison.
In the second multiple-point method the meter is held successively at 0.2 and 0.8 depth, and the mean of the velocities at these two points is taken as the mean velocity for that vertical. On the assump tion that the vertical velocity curve is a common parabola with hori zontal axis, the mean of velocities at 0.22 and 0.79 depth will give closely the mean velocity in the vertical. Actual observations under a wide range of conditions show that this multiple-point method gives very closely the mean velocity of water flowing in open channels and that in a completed measurement it seldom varies as much as 1 per cent from the result obtained by the vertical velocity- curve method. It is very extensively used by the United States Geological Survey.
In the single-point method the meter is held either at the depth of the thread of mean velocity or at an arbitrary depth for which the coefficient for reducing to mean velocity has been determined or must be assumed.
Extensive experiments by means of vertical velocity curves show that the thread of mean velocity generally occurs between 0.5 and 0.7 total depth. In general practice the thread of mean velocity is considered to be at 0.6 depth, and at this point the meter is held in most of the measurements made by the single-point method. A large number of vertical velocity curve measurements, taken on many streams and under varying conditions, show that the average coefficient for reducing the velocity obtained at 0.6 depth to mean velocity is practically unity. The variation of the coefficient from unity in individual measurements is, however, greater than in the 0.2 and 0.8 method and the general results are not so satisfactory.

14 SURFACE WATER SUPPLY OF HAWAII, 1916-11.
In the other principal single-point method the meter is held near the surface, usually 1 foot below, or low enough to be out of the effect of the wind of other disturbing influences. This is known as the sub surface method. The coefficient for'reducing the velocity taken at the subsurface to the mean has been found to be in general from about 0.85 to 0.95, depending on the stage, velocity, and channel conditions. The higher the stage the larger the coefficient. This method is especially adapted for flood measurements, or for measure ments when the velocity is so great that the meter can not be kept in the correct position for the other methods.
The vertical integration method consists in moving the meter at a slow but uniform speed from the surface to the bottom and back again to the surface and noting the number of revolutions and the time taken in the operation. This method has the advantage that the velocity at each point of the vertical is measured twice. It is useful as a check on the point methods. In using the Price meter great care should be taken that the vertical movement of the meter is not rapid enough to vitiate the accuracy of the resulting velocity determination.
In practical work on rough streams, such as many of those in Hawaii, the meter should be held at 0.6 depth if the depth is 1 foot or less. If the depth is greater the meter should be held at two points in the vertical, 0.2 and 0.8 from the surface.
When the mean velocities in the different verticals have been found, the average of two adjacent means is taken as the mean velocity for that individual section. The area of the section is computed by mulitplying the width of the section by the mean depth. The discharge of each section is then the product of the area multi plied by the mean velocity, and the total discharge of the stream results from summing up the discharge of the individual sections. In practice the work is tabulated in such a way as to render the com putation very simple.1
Current-meter measurements are not practicable where there are eddies,- cross currents, swirls, or passages for the water underneath stones. It is usually possible, however, to improve the channel by removing boulders and rocks, so that a satisfactory measuring sec tion may be obtained, even on rough, steep streams such as exist in Hawaii.
Three kinds of velocity-area gaging stations are in general use in Hawaii, according to the means provided for making the observations of depth and velocity. They are wading, bridge, and cable stations.
A wading station is one at which measurements are made only by wading that is, no means exist for getting above the water at any stage except by wading. Such stations are usually on ditches or wide, shallow streams, which do not fluctuate greatly. On many streams
iFor a discussion of methods of computing the discharge of a stream s$e Engineering News, June25,1908.

DEFINITION OF TEEMS. 15
however, measurements are made at low stages by wading, even though other means exist for making measurements at higher stages.
A bridge station is one at which the meter is used from a bridge. In some places highway or other bridges are available from which to make measurements, but generally they are not at the right place on the stream. Special bridges are then built.
A cable station is one at which measurements are made from a cable spanning the stream. Cable stations are used on large streams, such as Hanapepe, Wailua, and Hanalei rivers on the island of Kauai, and Wailuku River on the island of Hawaii. The cable supports the car from which a man works above the water. Distances are marked off on the cable itself or on a small auxiliary cable stretched taut above it.
A suitable place for a gaging station having been selected, a staff gage is set in the edge of the stream, either vertical or inclined, but graduated into tenths, half-tenths, or hundredths of feet vertically. The gage is securely fastened to rocks or trees to prevent displace ment by floods and is so placed that the zero, or reference datum, is well below extreme low water. The datum is also referred to a per manent bench mark as an additional precaution. A water-stage recorder is then installed or an observer is engaged to record the heights of water morning and evening, and the mean of the two readings is used as the mean gage height for the day. Owing to the rapid rise and fall of most of the streams in Hawaii, two gage-height readings a day will not as a rule give a true mean for the 24 hours. For this reason, and also owing to the fact that many of the gaging stations are necessarily situated in the mountains at points remote from all habitations and difficult of access, it has generally been found necessary to use water-stage recorders. These instruments are of various types, some requiring weekly visits and others operating for a month without attention.
The essential features of water-stage recorders comprise a float free to rise and fall with fluctuations of the water surface, a device for transferring the motion of the float to the record sheet (either directly or through a reducing mechanism), the recording device, and the clock. The instruments may be designed for any range of stage.
DEFINITION OF TERMS.
The volume of water flowing in a stream the "run-off" or "dis charge" is expressed in various terms, each of which has become associated more or less definitely with a certain class of work. These terms may be divided into two groups: (1) Those which represent a rate of flow, as "second-feet," "gallons per minute," "gallons per day," "miner's niches," and "run-off in second-feet per square mile," and (2) those which represent the actual quantity of water, as "run-

16 SURFACE WATER SUPPLY OF HAWAII, 1916-17.
off in depth in inches," "million gallons," and "acre-feet." They may be defined as follows:
"Second-foot" is an abbreviation for cubic foot per second, and is the unit for the rate of discharge of water flowing in a stream 1 square foot in cross section at a rate of 1 foot per second. It is generally adopted as the fundamental unit in the measurement of flowing water and is the "natural" unit, as the foot and the second are the units used in making .the physical determinations. Other units may be computed from this by the use of factors given in the table of equiv alents.
" Gallons per minute" is generally used in connection with pumping and city water supply, the United States gallon of 231 cubic inches being the unit of quantity and 1 minute the unit of time.
The "miner's inch" is the unit for the rate of discharge of water that passes through an orifice 1 inch square under a head which varies locally. It is commonly used by miners and irrigators throughout the West, and is defined by statute in each State in which it is used.
"Second-feet per square mile" is the average number of cubic feet of water flowing per second from each square mile of area drained, on the assumption that the run-off is distributed uniformly, both, as regards time and area.
"Run-off in inches" is the depth to which the drainage area would be covered if all the water flowing from it is a given period were con served and uniformly distributed on the surface. It is used for com paring run-off with rainfall, which is usually expressed in depth in inches.
An "acre-foot" is equivalent to 43,560 cubic feet, and is the quan tity required to cover an acre to the depth of 1 foot. The term is commonly used in connection with storage for irrigation.
In the Territory of Hawaii the unit most commonly used in measuring water is the "million gallons." This is used with two meanings (1) to indicate a rate of flow and (2) to express an actual quantity of water. In the former sense "million gallons per day" is inferred, 1,000,000 gallons being taken as the unit of quantity and 24 hours as the unit of time. With this meaning the term is gen erally used in connection with pumping and irrigation. In the latter sense "million gallons" as an absolute quantity is used in the meas urement of storage capacities of reservoirs.
The following convenient approximate relations exist between second-feet, million gallons per day, and acre-feet: 1 second-foot flowing 24 hours equals about 2 acre-feet; 1,000,000 gallons equals about 3 acre-feet; and 1 second-foot equals approximately two-thirds million gallons per day.
"Man's water" is an irrigator's term also in common use in Hawaii. It signifies the amount of water that one irrigator can properly handle in the field. It varies greatly, being dependent upon the condition of

CONVENIENT EQUIVALENTS. 17
the furrows, the age of the crop, and the skill and individuality of theirrigator.
CONVENIENT EQUIVALENTS.
The following is a list of convenient equivalents for use in hydraulic computations:
Table for converting discharge 'in second-feet into run-off in acre-feet.
Discharge
feet).
123456789
Run-off (acr&-feet).
1 day.
1.9833.9675.9507.9349.917
11.9013.8815.8717.85
28 days.
55.54111.1166.6222.1277.7333.2388.8444.3499.8
29 days.
57.52115.0172.6230.1287.6345.1402.6460.2517.7
30 days.
59.50119.0178.5238.0297.5357.0416.5476.0535.5
31 days.
61.49123.0184.5246.0307.4368.9430.4491.9553.4
NOTE. For a part of a month multiply discharge for one day by the number of days.
1,000,000 United States gallons per day equals 1.55 secs^Tfeet.1,000,000 United States gallons equals 3.07 acre-feet. ,*f-, si'1 second-foot equals 7.48 United States gallons per second; equals 448.8 gallons per
minute; equals 646,317 gallons for one day.1 second-foot for one year (365 days) covers 1 square mile 1.131 feet, or 13.572 inches,
deep.1 second-foot for one year (365 days) equals 31,536,000 cubic feet.1 second-foot for one year (365 days) equals 724 acre-feet.1 second-foot equals about 1 acre-inch per hour.1 second-foot for one day covers 1 square mile 0.03719 inch deep.1 second-foot for one day equals 1.983 acre-feet.1,000,000 cubic feet equals 22.95 acre-feet.1 acre-foot equals 325,850 gallons.1 inch deep on 1 square mile equals 2,323,200 cubic feet.1 inch deep on 1 square mile equals 0.0737 second-foot per year.1 foot equals 0.3048 meter.1 mile equals 1.60935 kilometers.1 mile equals 5,280 feet.1 acre equals 0.4047 hectare.1 acre equals 43,560 square feet.1 acre equals 209 feet square, nearly.1 square mile equals 2.59 square kilometers.1 cubic foot equals 0.0283 cubic meter.1 cubic foot equals 7.48 gallons.1 cubic foot of water weighs 62.5 pounds.1 cubic meter per minute equals 0.5886 second-foot.1 horsepower equals 550 foot-pounds per second.1 horsepower equals 76.0 kilogram-meters per second.1 horsepower equals 746 watts.1 horsepower equals 1 second-foot falling 8.80 feet.1J horsepower equals about 1 kilowatt.m , , , . . ., Sec.-ft.Xfall in feet .To calculate water power quickly: jj =net horsepower on water
wheel realizing 80 per cent of theoretical power. 40532° 18 WSP 465 2

18 SURFACE WATER SUPPLY OF HAWAII, 1916-17.
OFFICE METHODS OF COMPUTING'AND STUDYING DISCHARGE AND RUN-OFF.
At the end of each year the field or base data for current-meter gaging stations, consisting of water-stage record sheets, daily gage heights, discharge measurements, and notes from observers' books, are assembled. The measurements are plotted on cross-section paper, and rating curves are drawn wherever feasible. The rating tables prepared from these curves are then applied to the tables of daily gage heights to obtain the daily discharge, and from these applications the tables of monthly discharge and run-off are computed.
Rating curves are drawn and studied with special reference to the class of channels which they represent. The discharge meas urements for all classes of stations, when plotted with gage heights in feet as ordinates and discharge in million gallons per day as abscissas, define rating curves which are generally more or less parabolic in form.
For every rating table the following assumptions are made for the period of applictat^ of the table: (a) That the discharge is a function of and inc^teases gradually with the stage; (6) that the dis charge is the same whenever the stream is at a given stage, and hence such changes in conditions of flow as may have occurred during the period of application are either compensating or negli gible, except that the rating, as stated in the footnote to each table, is not applicable for periods during which the^channel was obstructed; (c) that the increased and decreased discharge due to change of slope on rising and falling stages is either negligible or compensating.
As already stated, the gaging stations may be divided into several classes, as indicated in the following paragraphs:
The stations of class 1 represent the most favorable conditions for an accurate rating and are also the most economical to maintain. The bed of the stream is usually composed of rock and is not subject to the deposits of sediment and loose material. This class includes also many stations located in a pool below which is a permanent rocky riffle that controls the flow like a weir. Provided the control is sufficiently high and close to the gage to prevent cut and fill at the gaging point from materially affecting the slope of the water surface, the gage height will, for all practical purposes, be a true index of the discharge. Discharge measurements made at such stations usually plot within 2 or 3 per cent of the mean discharge curve, and the rating developed from that curve represents a very high degree of accuracy.
Class 2 comprises mainly stations on rough, mountainous streams with steep slopes. The beds of such streams are, as a rule, com paratively permanent during low and medium stages, and when the flow is sufficiently well defined by an adequate number of discharge

OFFICE METHODS. 19
measurements before and after each flood the stations of this class give nearly as good results as those of class 1. As it is seldom pos sible to make measurements covering the time of change at flood stage, the'assumption is often made that the curves before and after the flood converged to a common point at the highest gage height recorded during the flood. Hence the only uncertain period occurs during the period of actual change in conditions of flow.
Class 3 includes those stations where the stream bed is of a shifting character, or the controlling section below the gage frequently changes, owing to cutting out by the current and the filling in of sand, gravel, and drift. In some places in Hawaii changes are caused by the growth of vegetation in the stream bed. No absolute rule can be laid down for stations of this class. Each rating curve must be constructed mainly from the measurements made in the current year, the engineer being guided largely by the history of the station and the following general law: If all measurements ever made at a station of this class are plotted on cross-section paper they will define a mean curve which may be called a standard curve. It has been found in practice that if after a change caused by high stage a relatively constant condition of flow occurs at medium and low stages, all measurements made after the change will plot on a smooth curve which is practically parallel to the stand ard curve with respect to ordinates or gage heights. This law of the parallelism of rating curves is the fundamental basis of all ratings and estimates at stations with semipermanent and shifting channels. It is not absolutely correct, but, with few exceptions, answers all the practical requirements of estimates made at low and medium stages after a change at a high stage. This law appears to hold equally true whether the change occurs at the measuring section or at some controlling point below. The change is, of course, funda mentally due to change in the channel caused by cut, or fill, or both, at or near the measuring section. For all except small streams the changes in section usually occur at the bottom. The following simple but typical examples illustrate this law:
(a) If 0.5 foot of planking were to be nailed on the bottom of a well-rated wooden flume of rectangular section there would result, other conditions of flow being equal, new curves of discharge, area, and velocity, each plotting 0.5 foot above the original curves when referred to the original gage. In other words, this condition would be analogous to a uniform fill or cut in a river channel which either reduces or increases discharge, area, and velocity for any gage height. In practice, however, such ideal conditions rarely exist.
(6) If a cut or fill occurs at the measuring section, there is a marked tendency toward decrease or increase, respectively, of the velocity.

20 SURFACE WATER SUPPLY OF HAWAII, 1916-17.
In other words, the velocity has a compensating effect, and if the compensation is exact at all stages the discharge at a given stage will be the same under both the new and the old conditions.
(c) If change along the crest of a weir or rocky control is uniform, the area curve will remain the same as before the change, and it can be shown that here again the change in velocity curve is such that it will produce a new discharge curve essentially parallel to the original discharge curve with respect to their ordinates.
In actual practice, of course, such simple changes of section do not occur. The changes are complicated and lack uniformity, a cut at one place being largely offset by a fill at another, and vice versa. If these changes are very radical and involve large percentages of the total area as, for example, on small* streams there may result a wide departure from the law of parallelism of rating curves. In complicated changes of section the corresponding changes in velocity which tend to produce a new parallel discharge curve may interfere with each other materially, causing eddies, boils, backwater, and radical changes in slope. In such extreme conditions, however, the measuring section would more properly fall under class 4 and would require very frequent measurements of discharge. Special stress is laid on the fact that in the lack of other data to the contrary the utilization of this law will yield the most accurate results.
At low or medium stages slight changes of an oscillating character are usually averaged by a mean curve drawn among them parallel to the standard curve, and if the individual measurements do not vary more than 5 per cent from the rating curve the results are considered good for stations of this class.
Class 4 comprises stations on streams that have soft, muddy, or sandy beds. Good results can be obtained from such sections only by frequent discharge measurements, the frequency ranging from a measurement every two or three weeks to a measurement every day, according to the rate of diurnal change in conditions of flow. These measurements are plotted and a mean or standard curve drawn among them. It is assumed that there is a different rating curve for every day of the year and that the curves are parallel to the stand ard curve with respect to their ordinates. On the day of a measure ment the rating curve for that day passes through that measurement. For days between successive measurements it is assumed that the rate of change is uniform, and hence the ratings for the intervening days are equally spaced between the ratings passing through the two measurements. This method must be modified or abandoned altogether under special conditions. Personal judgment and a knowledge of the conditions involved can alone dictate the course then to be pursued.

EXPLANATION OP TABLES. 21
After the computations have been completed they are entered in tables and carefully studied and intercompared to eliminate or account for all gross errors so far as possible. Missing data are filled in, so far as feasible, by means of comparison with records for adjacent streams. The attempt is made to complete records for years or periods of discharge, thus eliminating fragmentary and disjointed records. Full notes accompanying such estimates follow the daily and monthly discharge tables.
EXPLANATION OF TABLES.
For each current-meter gaging station are given in general the following data: Description of station, list of discharge measure ments, table of daily discharge, table of monthly and yearly discharge, and run-off in acre-feet and million gallons.
All rates of flow are expressed as million gallons per day.In addition to statements regarding the location and installation
of current-meter stations, the descriptions give information in regard to any conditions which may affect the constancy of the relation of gage height to discharge, covering such points as shifting channels and backwater; also information regarding diversions which decrease the total flow at the measuring section. Statements are also made regarding the utilization of the water, the maximum and minimum stage and discharge, and the accuracy of the data.
The discharge-measurement table gives the results of the discharge measurements made during the year, including the date, name of hydrographer, gage height, and discharge in second-feet and million gallons per day.
The table of daily discharge gives the discharge in million gallons per day corresponding to the observed gage height as determined from the rating table, the number of significant figures used varying with the size of the discharge.
In the table of monthly discharge the column headed "Maximum" gives the mean flow, as determined from the rating table, for the day when the mean gage height was highest. As the gage height is the mean for the day, it does not indicate correctly the stage when the water surface was at crest height and the corresponding discharge was consequently larger than given hi the maximum column. Like wise in the column of "Minimum" the quantity given is the mean flow for the day when the mean gage height was lowest. The columns headed "Mean" give the average flow in million gallons per day and in cubic feet per second during the month. The "Total in million gallons" and "Total in acre-feet" given in the columns under these heads are computed from the mean discharge in million gallons per day.

22 SURFACE WATER SUPPLY OF HAWAII, 1916-17.
Owing to the volcanic formation of the Hawaiian Islands there is such wide diversity in the character and porosity of the rocks of the various drainage basins that the determination of a general relation between rainfall and run-off is of no value. For this reason informa tion concerning drainage areas has been omitted in the station descriptions.
ACCURACY OP FIELD DATA AND COMPUTED RESULTS.
The accuracy of stream-flow data depends (1) on permanence of the relation between discharge and stage and (2) on the accuracy of observations of stage, measurements of discharge, and interpre tation of data.
The accuracy recorded in the station description is based on the accuracy of the rating curve, the reliability of the gage-height record, the range of the fluctuation in stage, and knowledge of local condi tions. The use of "good," "fair," "poor," or "approximate" indi cates that the probable errors are within 5, 10, 15, and 20 per cent, respectively.
It should be borne in mind that the observations in each succeed ing year may be expected to throw new light on records already collected and published.
DIVISION OP WORK.
The data were collected and prepared for publication under the direction of G. K. Larrison, district engineer, Honolulu, Hawaii, by C. T. Bailey, office engineer, W. V. Hardy, R. C. Rice, R. D. Klise, H. A. R. Austin, D. E. Horner, E. E. Goo, and John Kaheaku.
GAGING STATIONS MAINTAINED IN HAWAII.
The following list comprises the gaging stations maintained in Hawaii by the United States Geological Survey and cooperative parties. The stations are arranged by stream basins and appear in systematic order for the several islands, tributaries of main streams being indicated by indention. The dates show the years or parts of years for which records are available. A dash following the date indicates that the station was being maintained June 30, 1917.
KAUAI ISLAND.
Waimea River near Waimea, 1910- Poomau River:
Kawaikoi Stream near Waimea, 1909-1917.Waiakoali Stream near Waimea, 1909-1912.
Mohihi Stream near Waimea, 1909-1912. Waiahulu Stream near Waimea, 1916- Koaie Stream near Waimea, 1916- Waialae River near Waimea, 1910-1916. Waialae River at elevation 800 feet, near Waimea, 1916-

GAGING STATIONS. 23
Waimea River tributaries Continued.Kekaha ditch at Camp No. 1, near Waimea, 1910-1915. Kekaha ditch at flume No. 3, near Waimea, 1910-1912. Kekaha ditch at flume No. 4, near Waimea, 1916- Kekaha ditch at siphon near Waimea, 1910-1912. Kekaha ditch at tunnel No. 12, near Waimea, 1910-1914. Kekaha ditch below tunnel No. 12, near Waimea, 1916- Waimea ditch near Waimea, 1911-1913,1916- Kamenehune ditch near Waimea, 1911- Makaweli River near Waimea, 1911-1917.
Halekua Stream near Waimea, 1912-13. Olokele River near Waimea, 1915-1917.
Olokele ditch at tunnel No. 12, near Makaweli, 1904-1917. Olokele ditch at weir, near Makaweli, 1912-1917.
Poowaiomahaihai ditch near Waimea, 1911-1913. Hanapepe River above Hanapepe Palls, near Eleele, 1911-12. Hanapepe River at Koula, near Eleele, 1910-1916.
Hiloa ditch near Eleele, 1911-1915.East Branch Hanapepe River below Hanapepe Falls, near Eleele, 1911-12. Hanapepe ditch at Hanapepe Falls, near Eleele, 1911-1915. Hanapepe ditch at Koula, near Eleele, 1910- Hanapepe ditch at weir near Hanapepe, 1910-
Huleia River near Lihue, 1912-1915. Hanamaulu River at Kapaia, near Lihue, 1911-1914. Wailua River:
South Fork of Wailua River at siphon near Lihue, 1910-11. South Fork of Wailua River near Lihue, 1911-
Hanamaulu ditch near Lihue, 1910- Lihue ditch near Lihue, 1910-
North Fork of Wailua River near Lihue, 1910-19.14. North Fork of Wailua River at elevation 650 feet near Lihue, 1914- .
Kanaha ditch near Lihue, 1910-East Branch of North Fork of Wailua River near Lihue, 1912- Uhau lole Stream at elevation 750 feet, near Lihue, 1912.
Keahua Stream at elevation 750 feet, near Lihue, 1912. Kawi Stream at elevation 750 feet, near Lihue, 1912.
Konobiki Stream at Makakualele weir (mauka) near Kapaa, 1911-1913. Kaehulua Stream at Kuhinoa (mule stable) weir, near Kapaa, 1911-1913.
South Fork of Kaehulua Stream at Wainamuamu weir, near Kapaa, 1911-12. North Fork of Kaehulua Stream at Wainamuamu weir, near Kapaa, 1911-1913.
Kapaa River near Kealia, 1910-Akulikuli Spring near Kealia, 1911-1913. Kapahi ditch near Kealia, 1909- Tunnel ditch at Kapahi, near Kapaa, 1909-1911. Kapaa ditch at Kapahi, near Kapaa, 1909-1911. Pipe ditch at Kapahi, near Kapaa, 1909-1911.
Kealia Stream:Kaneha ditch near Kealia, 1909-1913.
Anahola River at elevation 1,140 feet near Kealia, 1912. Anahola River near Kealia, 1910. 1912- Anahola River at Kiokala dam, near Kealia, 1910-1912.
Anahola ditch above Kaneha reservoir, near Kealia, 1914- Anahola ditch at Kiokala, near Kealia, 1909-1914. Anahola ditch at Makai weir, near Kealia, 1909-1911.

24 SURFACE WATER SUPPLY OF HAWAII, 1916-11.
Kalihiwai River near Hanalei, 1914-Kalihiwai River near Kilauea, 1912-1914.Hanalei River at elevation 625 feet, near Hanalei, 1914-Hanalei River near Hanalei, 1911-
China ditch near Hanalei, 1911-Kuna ditch near Hanalei, 1912-13. 1916-
Lumahai River near Hanalei, 1914-1917. Lumahai River near Wainiha, 1912.. Waioli Stream near Hanalei, 1914- Wainiha River near Hanalei, 1914-1917. Wainiha River, East Channel, near Wainiha, 1912-1916. Wainiha River, West Channel, near Wainiha, 1911-1916.
. Wainiha canal at intake, near Wainiha, 1910-1916.Wainiha canal at tunnel No. 18, near Wainiha, 1911.Wainiha canal at tailrace, near Wainiha, 1911.
OAHU ISLAND.
Kalihi Stream near Honolulu, 1913-Nuuanu Stream at Laukaha weir in upper Nuuanu Valley, near Honolulu, 1903,
1910-1913.Nuuanu Stream below Reservoir No. 2 wasteway, near Honolulu, 1913- Nuuanu Stream at Kuakini Street, near Honolulu, 1911-12.
Lulumaha ditch at upper Nuuanu reservoir, near Honolulu, 1911-1913. Pauoa Stream at upper Pauoa Valley, near Honolulu, 1911-1913.
Kahuawai Spring, near Honolulu, 1912-1914. Manoa Stream at upper Manoa Valley, near Honolulu, 1910-1913. Manoa Stream at College of Hawaii, near Honolulu, 1909-
West Branch of Manoa Stream near Honolulu, 1913-East Branch of Manoa Stream near Honolulu, 1913-
East Manoa ditch near^Honolulu, 1915-1916. Palolo Stream:
Pukele Stream at Mahoe springs, near Honolulu, 1912-13.Waiomao Stream at upper Palolo Valley, near Honolulu, 1911-1913.Waiomao Stream above Pukele, near Honolulu, 1911-12.
Waimanalo ditch below main reservoir, near Waimanalo, 1912-13. Pump ditch near Waimanalo, 1912. Makawao ditch near Kailua, 1912-1916. Kailua Stream near Kailua, 1912-1916.
Wong Leong's ditch near Kailua, 1912-1916.Makawao Stream near Kailua, 1912-1916.
Makawao Spring near Kailua, 1914-1916.Kaimi Stream near Kailua, 1912-1916.
Main spring near Kailua, 1914-1916.Kamakalepo Stream near Kailua, 1912-1916.Pohakea Stream near Kailua, 1912-1914.
Kahanaiki Stream in Kailua Valley, near Kailua, 1912. Kahanaiki Stream near Kailua, 1914-1916.
South Branch of Kahanaiki Stream near Kailua, 1913-14.North Brangh of Kahanaiki Stream near Kailua, 1913-14.Kahanaiki ditch in Kailua Valley, near Kailua, 1912-13.
Kaneohe Stream near Kaneohe, 1914-1916.Young Mau ditch near Kaneohe,-1914-1916.Ahlo ditch near Kaneohe, 1914-1916.Hooleinaiwa Stream near Kaneohe, 1914-1916.Piho Stream near Kaneohe, 1914-1916.

GAGING STATIONS. 25
Kaneohe Stream tributaries Continued. Kuou Stream near Kaneohe, 1914-1916.
Kuou ditch near Kaneohe, 1914-1916. Luluku Stream near Kaneohe, 1914-1916.
North Luluku ditch near Kaneohe, 1914-1916. Kawa Stream near Kaneohe, 1914-1916. Heeia Stream:
Wing Wo Tai ditch near Heeia, 1914-1916. Hop Tuck ditch near Heeia, 1914-1916. Lee ditch near Heeia, 1914-1916. Haiku Stream near Heeia, 1914-
Reservoir ditch near Heeia, 1914-1916. Waipio ditch near Heeia, 1914-1916.
lolekaa Stream near Heeia, 1914-1916. Waiahole Stream below power house, near Waiahole, 1915. Waiahole Stream near Waiahole, 1911-1916. Waiahole Stream at Waiahole, near Waikane, 1911-12.
Waihi Stream near Waikane, 1911. Halona Stream near Waikane, 1911. Waianu Stream near Waikane, 1911.
Waikane Stream near Waikane, 1911-1912. Kahana Stream near Kahana, 1914-1917.
East Branch of Kahana Stream near Kahana, 1914-1917. Punaluu Stream at elevation 539 feet, near Punaluu, 1915- Punaluu Stream at elevation 250 feet, near Punaluu, 1914- Punaluu Stream near Hauula, 1906-7. Waihoi Stream near Punaluu, 1915- Kaluanui Stream near Hauula, 1906-7, 1915-17. Kaipapau Stream near Hauula, 1906-7. Koloa Stream near Laie, 1914- Wailele Stream near Laie, 1914- East Branch of Kahawainui Stream near Laie, 1914- East Branch of Malaekahana Stream near Kahuku, 1914- Middle Branch of Malaekahana Stream near Kahuku, 1914- Kaukonahua Stream:
North Fork of Kaukonahua Stream near Wahiawa, 1911.Right Branch of North Fork of Kaukonahua Stream near Wahiawa, 1913- Left Branch of North Fork of Kaukonahua Stream near Wahiawa, 1913-
South Fork of Kaukonahua Stream above United States Army reservoir, near Wahiawa 1911, 1913-1917.
United States Army ditch at reservoir, near Wahiawa, 1914-15. South Fork of Kaukonahua Stream below United States Army reservoir near
Wahiawa, 1914- Wahiawa reservoir ditch near Wahiawa, 1910-11.
MAUI ISLAND.
West Maul.
lao Stream near Wailuku, 1910-1915.Maniania ditch near Wailuku, 1909-1913.
Waiehu Stream:South Waiehu Stream near Wailuku, 1910-19,17.
South Waiehu ditch near Wailuku, 1912-1915. North Waiehu Stream near Wailuku, 1912-1917.
North Waiehu ditch near Wailuku, 1910-11, 1916-

26 SURFACE WATER SUPPLY OF HAWAII, 1916-11.
Waihee Stream near Waihee, 1910-1912, 1913-1917.Waihee canal near Waihee, 1910-1912.Waihee canal at weir, near Wailuku, 1911-12.Spreckels ditch near Waihee, 1910-1913.Spreckels ditch at Waiale weir, near Wailuku, 1910-11.
Kahakuloa Stream at Kahakuloa, near Waihee, 1912-13. Kahakuloa Stream near Honokahau, 1913-14. Honokahau Stream near Honokahau, 1913-
Honokahau ditch at intake, near Honokahau, 1907-1913.Honokahau ditch above Honolua Stream, near Honokahau, 1910-11.Honokahau ditch at Honokawai weir, near Lahaina, 1910-1912.
Honolua Stream at Honolua ranch, 1911. Honolua Stream near Honokahau, 1913-
Honolua ditch near Honokahau, 1911-12. Honokawai Stream near Lahaina, 1911; 1912- Honokawai Stream at weir No. 1, near Lahaina, 1901.
Honokawai ditch near Lahaina, 1912- Kahoma Stream near Lahaina, 1911-12; 1913- Kahoma Stream at weir No. 1, near Lahaina, 1901. Kahoma Stream at weir No. 2, near Lahaina, 1901.
Kahoma development tunnel near Lahaina, 1911- Lahainaluna Stream above pipe line intake, near Lahaina, 1916- Lahainaluna Stream near Lahaina, 1911-1916.
Lahainaluna weir No. 1 near Lahaina, 1901.Lahainaluna weir No. 2 near Lahaina, 1901.Lahainaluna ditch near Lahaina, 1913-14.
Kauaula Stream near Lahaina, 1912; 1913- Kauaula Stream at weir No. 3, near Lahaina, 1901.
Kauaula ditch near Lahaina, 1911-Kauaula Stream, North Fork, at weir No. 1, near Lahaina, 1901.Kauaula Stream, South Fork, at weir No. 2, near Lahaina, 1901'.
Launiupoko Stream near Lahaina, 1911-1917. Olowalu Stream near Olowalu, 1913-1916. Olowalu ditch near Olowalu, 1911- Ukumehame Stream near Olowalu, 1911-12; 1913- Waikapu Stream near Waikapu, 1910-1917.
Palolo (Everett) ditch near Waikapu, 1910-1917.South Side Waikapu ditch near Waikapu, 1910-1917.
East Maul. Koolau ditch region:
Hanawi Stream near Nahiku, 1914-15. West Kopiliula Stream near Keanae, 1914-1917. East Wailuaiki Stream near Keanae, 1913-1917. West Wailuaiki Stream near Keanae, 1914-1917. East Wailuanui Stream near Keanae, 1914-1917. West Wailuanui Stream near Keanae, 1913-1917. Koolau ditch near Keanae, 1910-1912. Koolau ditch at Alo division weir, near Huelo, 1908-1911.
Spreckels ditch region:Honomanu Stream near Keanae, 1913- Haipuaena Stream near Huelo, 1910- Puohakamoa Stream near Huelo, 1910- Alo Stream near Huelo, 1910-
GAGING STATIONS. 27
Spreckels ditch region Continued.Waikamoi Stream near Huelo, 1910-Oopuola Stream near Huelo, 1910-1915.Spreckels ditch at station No. 1, near Huelo, 1910-1913.Spreckels ditch at station No. 2, near Huelo, 1911-1913.Spreckels ditch at station No. 3, near Huelo, 1910-1913.Spreckels ditch at station No. 4, near Huelo, 1910-1913.Spreckels ditch at station No. 5, near Huelo, 1911-1913.Spreckels ditch at station No. 6, near Huelo, 1911-1913.Spreckels ditch at station No. 7, near Huelo, 1911-1912.Spreckels ditch at station No. 8, near Huelo, 1911-1913.
Center ditch region:Center ditch near Huelo, 1910-1912.
Hamakua ditch region:Nailiilihaele Stream near Huelo, 1910-1912; 1913-Kailua Stream near Huelo, 1910-1912; 1913-Oanui Stream near Huelo, 1910-11; 1913-1916.Hoolawaliilii Stream near Huelo, 1911-Hoolawanui Stream near Huelo, 1911-Honopou Stream near Huelo, 1910-Halehaku Stream at dam, near Huelo, 1910-11.Halehaku Stream weir near Huelo, 1910-1912.Opana Stream near Huelo, 1910-1912.Opana ditch near Huelo, 1910-1912.New Hamakua ditch at Nailiilihaele weir, near Huelo, 1910-1912.New Hamakua ditch at Halehaku weir, near Huelo, 1910-New Hamakua ditch at station No. 1, near Huelo, 1912.New Hamakua ditch at station No. 2, near Huelo, 1912.New Hamakua ditch at station No. 3, near Huelo, 1912.New Hamakua ditch at station No. 4, near Huelo, 1912.New Hamakua ditch at station No. 5, near Huelo, 1912.Old Hamakua ditch at Opana weir, near Huelo, 1910-Kaluanui ditch at Puuomalei, near Hamakuapoko, 1910-1912.Lowrie ditch at Opana weir, near Huelo, 1910-Haiku ditch at Peahi weir, near Huelo, 1910-
HAWAII ISLAND. Hilo group:
81 stations at elevation 2,700 feet, in forest back of Hilo, 1911-1913.Wailuku Eiver near Hilo, 1911-1913.Honolii Eiver at Kaiwiki, near Hilo, 1911-1913.Honolii ditch at Kaiwiki, near Hilo, 1911.Kawainui Eiver at Kawainui, near Pepeekeo, 1911-12.4 stations at Piihonua, near Hilo, 1912.
Hamakua group:Waipio Eiver below Koiawe, near Waipio, 1911-12.Waipio Eiver below Waima, near Waipio, 1911-12.Waipio Eiver at elevation 360 feet, near Waipio, 1901-2.
New Hamakua ditch at Waima Stream, near Waipio* 1912. Lower Hamakua ditch at main weir, near Kukuihaele, 1910- Upper Hamakua ditch at main weir, at Puualala, Waimea, 1913- Kawainui Branch of Waipio Eiver, near Waipio, 1911-12. Kawainui Stream at elevation 2,120 feet, near Waipio, 1901-2. Kawainui Stream at elevation 1,435 feet, near Waipio, 1901-2.

28 SURFACE WATER SUPPLY OF HAWAII, 1916-11.
Hamakua group Continued.Waipio River tributaries Continued.
Kawainui Stream at elevation 775 feet, near Waipio, 1901-2.Branch No. 3 of Kawainui Stream at elevation 1,700 feet, near Waipio,
1901-2. Branch No. 2 of Kawainui Stream at elevation 1,405 feet, near Waipio,
1901-2. Branch No. 1 of Kawainui Stream at elevation 1,380 feet, near Waipio,
1901-2.Alakahi Stream at elevation 1,200 feet, near Waipio, 1901-2. Alakahi Stream at elevation 730 feet, near Waipio, 1901-2. Koiawe Stream at elevation 1,120 feet, near Waipio, 1901-2. Koiawe Stream at elevation 610 feet, near Waipio, 1901-2. Waima Stream at elevation 790 feet, near Waipio, 1901-2. Waima Stream at elevation 385 feet, near Waipio, 1901-2.
Kohala group:Honokane Stream:
East Branch of Honokane Stream at elevation 1,300 feet, near Honokane, 1901.East Branch of Honokane Stream elevation at 770 feet, near Honokane, 1901.West Branch of Honokane Stream at elevation 1,370 feet, near Honokane, 1901.West Branch of Honokane Stream at elevation 775 feet, near Honokane, 1901.Kohala ditch at Awini weir, near Kohala, 1907-Kohala ditch at Niulii weir, near Kohala, 1907-Kehena ditch at Honokane mauka, near North Kohala, 1912-13.
GAGING-STATION RECORDS.
ISLAND OF KAUAI.
WAIMEA RIVER NEAR WAIMEA, KATTAI.
LOCATION. 250 feet above ford, about 2 miles north of Waimea.RECORDS AVAILABLE. July 9, 1910, to June 30, 1917.GAGE. Vertical and inclined staff installed October 5, 1911. July 9, 1910, to Octo
ber 4, 1911, staff gage about 1 mile downstream.DISCHARGE MEASUREMENTS. Made by wading or from footbridge.CHANNEL AND CONTROL. One channel at all stages; straight for 500 feet above and
below gage; banks high; bed of stream sandy. Control composed of sand, gravel, and boulders; shifting.
EXTREMES OP DISCHARGE. Maximum stage recorded during year, 18.0 feet at 4 p. m., December 18 (discharge, approximately 10,000 million gallons per day, or 15,500 second-feet); minimum stage recorded, 4.4 feet September 3-7 and 9 (discharge, 1.0 million gallons per day, or 1.55 second-feet). Maximum stage recorded, 18.8 feet at 4.30 p. m., January 25, 1916 (discharge, computed from extension of the rating curve, approximately 10,700 million gallons per day, or 16,600 second-feet); channel practically dry at times, as all water is diverted above.
DIVERSIONS. Large number of diversions above station.REGULATION. By diversions.UTILIZATION. All water passing this station is wasted, as none is diverted below.ACCURACY. Gage read twice daily. Records fair for all stages "below 1,500 million
gallons per day.

ISLAND OF KAUAI. 29
Discharge measurements of Waimea River near Waimea, Kauai, during the year endingJune SO, 1917.
Date.
Aug. 30 Sept. 25 Oct. 25 Nov. 18 Dec. 2 Jan. 26 Feb. 12
27 Mar. 7
17 Apr. 23 May 24 June 13
Made by
"W. V. Hardy........."............................................. .do .........................................................D. E. Horner ..................................................W.V. Hardy..................................................D. E. Horner.......................................................do.........................................................
.....do.........................................................
.....do.........................................................
.....do................................:................-.......W. V. Hardy. ......................................................do.........................................................
Gage height (feet).
4.35 5.69 6.90 6.73 6.48 6.14 5.62 5.54 6.05 6.54 5.85 5.45 5.36
Discharge.
Second- feet.
0.95 104 470 411 315 205 85 77
184 357 134
77 63
Million gallons
per day.
0.6 67
304 265 204 133 55 50
119 231 86 50 41
Daily discharge, in million gallons, of Waimea River near Waimea, Kauai, for the yearending June 30, 1917.
Date.
1. .............2..............3..............4..............5..............
6..............7..............8..............9..............
10..............
11..............12..............13..............14..............15..............
16..............17..............18..............19..............20..............
21..............22..............23..............24..............25..............
26..............27..............28..............29..............30..............31..............
July.
8094
10219721
743.02.52.52.5
2.02.0
161224
102102110166.0
3.03.03.03.02.5
2.02.02.02.02.02.0
Aug.
1.51.5
742727
4.02.52.02.02.0
2.54.0
107.0
12
7.03.0
2114687
306.05.03.02.5
2.05.03.02.02.02.0
Sept.
1.51.51.01.01.0
1.01.01.51.06.0
2.02.52.02.02.0
2.02.02.0
1234
386.0
567.0
27
1230
7.06.02.5
Oct.
2.02.01.52.03.0
33662186.06.0
6.06.0
10128.5
8.512101027
12101042
336
5112
3056798746
Nov.
181414.
137702
15643653012868
3412834-2191
4221
3846824
679146623818
745162
2329on
Dec.
1,210186874662
34<)T\
186275336
7468
1028046
S4.
1763,000
775SS4
220401in4544.7S
401ooo
119208156110
Jan.
208260246232156
110625146
208
166137110
9446
401634208110
1,600
401OOO
166436176
14612816618611Q
87
Feb.
741,080
260220197
1861561199480
806256
436156
12894
800sns176
128128878068
565146
Mar.
513856
176186
156146186260
94
9480
186137290
-'511232336726
2,960
1,080656384305166
220186137948774
Apr.
11994746246
3838303834
9621198068ifi
51fi9
342724
211862
11968
7456463427
May.
336119463024
2418141414
12107.08.5
10
7.08.5
1,050570232
10274805146
** 4238
102119232232
June. '
186876851
146
166146110
7451
38^rt^fi3091
87110946834
2491
181412
1010101010
NOTE. Discharge determined from rating curves well defined below 500 million gallons per day and fairly well defined below 1,500 million gallons per day, applicable July 1 to May 18 and May 19 to June 30.

30 SURFACE WATER SUPPLY OF HAWAII,
Monthly discharge of Waimea River near Waimea, Kauai, for year ending June 30,1917.
Month.
July................................
Discharge.
Million gallons per day.
Maximum.
197 146
56 679 702
3.000 - 1.600
J,080 2.960
962 ' 1.050
186
3,000
Minimum.
2.0 1.51.0 1.5
14 34 46 46 38 18 7.0
10
1.0
Mean.
32.2 16.3 9.02
69.0 154*
345 237 193 332 86.0
118 59.2
138
Second- feet
(mean).
49.8 25.2 14.0
107 238 534 367 299 514 133 183
- 91.6
214
Total run-off.
Million gallons.
997 506 270
2,140 4.630
10.700 7,350 5,400
10,300 2,580 3,670 1,780
50,300
Acre- feet.
3,060 1,550
830 6,560
14,200 32,800 22,500 16,600 31,600 7,920
11,200 5,450
154,000
KAWAIKOI STREAM NEAR WAIMEA, KAUAI.
LOCATION. Eight miles northeast of Knudsen's mountain house and about 27 miles, by horse trail, north of Waimea.
RECORDS AVAILABLE. April 13, 1909, to June 30, 1917.GAGE. Barrett & Lawrence water-stage recorder.DISCHARGE MEASUREMENTS. Made by wading or from footbridge.CHANNEL AND CONTROL. One channel at all stages; straight for 100 feet above and
below station; banks high and wooded. Control composed of rock ledge and large boulders; shifting.
EXTREMES OP DISCHARGE. Maximum stage recorded during period of record, 15.2 feet December 18,1916 (discharge not determined); minimum stage recorded, 1.55 feet October 3 to 6, 1913 (discharge, 2.6 million gallons per day, or 4 second- feet).
DIVERSIONS. None above station.REGULATION. None.UTILIZATION. Irrigation of sugar cane, rice, and taro; power development and domes
tic supply.ACCURACY. Records fair below 40 million gallons per day. Records after December
17 too incomplete to warrant publication.
Discharge measurements of Kawaikoi Stream near Waimea, Kauai, during the year endingJune 30, 1917.
[Made by D. E. Horner.]
Date.
Sept.l.. ...........Oct. 2..............Dec. 8..............
height (feet).
1.95 1.89 2.36
Discharge.
Second- feet.
8.8 5.8
27
Million gallons
per day.
5.7 3.8
18
Date.
Feb. 1....... .......Apr. 2....... .......May 24.. ...........
Gage height (feet).
1.94 1.85 1.90
Discharge.
Second- feet.
17.5 15.6 18.6
Million gallons
per day.
11 10 12

ISLAND OF KATJAI. 31
Daily di e, in million gallons, of Kawaikoi Stream, near Waimea, Kauai, for the year ending June 30, 1917.
Date.
1....2....3....4....5....
6....7-. ...8....9. .
10. .
11. .12. .13. .14. ..15. ..
July.
9.512
1411112325
Aug.
112930
2719
1110
179.57.0
7.02327
Sept.
5.65.05.05.9
5.010117.05.0
23125.95.08.0
Oct.
5.05.05.05.0
32
4817
130144
48
11792342532
Nov.
9.59.5o *;9.59.5
1112149.5
27
148.0
48117.0
Dec.
60513O
3627
1910196027
32603fl6054
Date.
16....17....18....19....20....
21....22....23....24....25....
26....27....28....29....30....31....
July.
5132
129.5
9.57.07.05.95.9
5.05.07.05.05.07.0
Aug. Sept.
9.55.99.5
4834
9Q
17191617
9.512
Q A
7.05.9
Oct.
3219142932
34
60275448
10111748149.5
Nov.
5.95.95.9
1112
8.012172342
1QQ5100
2548
Dec,
5134
NOTE. Discharge determined from rating curve fairly well defined below 40 million gallons per day. Gage heights not recorded on days for which discharge is not given.
Monthly discharge of Kawaikoi Stream near Waimea, Kauai, for year ending June 30,1917.
Month.
Julv 9-31. ...........................
September 2-30.... . .................
Discharge.
Million gallons per day.
Maximum.
51 39 48
144 199 60
Minimum.
5.0 7.0 5.0 5.0 5.9
19
Mean.
13.3 18.9
"12.7 3.89
23.6 40.4
Second- feet
(mean).
20.6 29.2 19.7 6.02
36.5 62.5
Total run-off.
Million gallons.
306 246 369 121 707 687
Acre- feet.
939 754
1,130 370
2.170 2,110
WAIAHULU STREAM NEAR WAIMEA, KAUAI.
LOCATION. In Waimea Canyon, half a mile above confluence with Koaie Stream, 12 miles north of Waimea.
RECORDS AVAILABLE. October 27, 1915, to October 21, 1916.GAGE. Gurley printing water-stage recorder. Gage shelter destroyed by flood De
cember 18, 1916, and recorder lost.DISCHARGE MEASUREMENTS. Made from cable or by wading.CHANNEL AND CONTROL. One channel at all stages; straight for 200 feet above and
below gage; banks high. Control composed of large boulders; fairly permanent.EXTREMES OP DISCHARGE. Flood December 18, 1916, reached a stage of about 15
feet (discharge not estimated); minimum stage recorded, 1.8 feet October 3, and 4, 1916 (discharge, 13 million gallons per day, or 26 second-feet).
DIVERSIONS. None above station.REGULATION. None.UTILIZATION. For irrigation of sugar cane, rice, and taro, and for power and domestic
supply.ACCURACY. Records fair below 40 million gallons per day.

32 SURFACE WATER SUPPLY OF HAWAII, 1916-17.
Discharge measurements of Waiahulu Stream near Waimea, Kauai, during the year endingJune SO, 1917.
Date.
July 18 19
Aug. 9 11
Oct. 22 23
Mar. 27
Made by
.....do.........................................................
.....do.........................................................
.....do.........................................................
.....do.........................................................
.....do.........................................................W.V. Hardy..................................................
Gase height (feet).
2.30 2.14 1.96 1.91 2.02 2.25 3.12
Discharge.
Second- feet.
48 41 28 25 35 50 63
Million gallons
per day.
31 26 18 16 23 32 41
Daily discharge, in million gallons, of Waiahulu Stream near Waimea, Kauai, for the yearending June SO, 1917.
Date.
1. ..............2...............3...............4. ..............5...............
6. .............7. ..............8.. .............9...............10...............
11...............12...............13...............14...............15...............
July.
50597732
24
1Q1919
2422223232
Aug.
29543229
1919241816
1609
Sept.
16141414
1419101614
9922161416
Oct.
14141313'iQ
11236222924
IS18221816
Date.
16................17................18................19
21................9923................24................25................
26................27................00
29................3031................
July.
7754462622
2222181818
161616161616
Aug.
2622592668
5032221818
1816161818IS
Sept.
181614<VL
43
46249Q2424
1922is1614
Oct.
1414141818
18
NOTE. Discharge determined from rating curve fairly well defined below 40 million gallons per day. Gage-height records Oct. 22 to Dec. 18 lost with recorder.
Monthly discharge of Waiahulu Stream near Waimea, Kauai, for the year ending June 30,1917.
Month.
July...................................
Discharge.
Million gallons per day.
Maximum.
102 68 54
112
Minimum.
16 16 14 13
Mean.
31.4 26.9 20.8 25.0
Second- feet
(mean).
48.6 41.6 32.2 38.7
Total run-off.
Million gallons.
974 835 625 524
2,960
Acre-feet.
2.990 2,560 1,920 1,610
9,080
KOAIE RIVER NEAR WAIMEA, EATTAI.
LOCATION. About one-third mile above confluence with Waimea River, 12 milesnorth of Waimea.
RECORDS AVAILABLE. October 21, 1915, to June 30, 1917; record fragmentary. GAGE. Gurley printing water-stage recorder. DISCHARGE MEASUREMENTS. Made by wading or from cable. CHANNEL AND CONTROL. One channel at all stages; straight for 100 feet above and
below gage; banks steep and high. Control composed of large boulders; shifting.

ISLAND OF KATJAI. 33
EXTREMES OP DISCHARGE. Maximum stage recorded during year, 6.7 feet at 3 a. m.March 4 (discharge, approximately 650 million gallons per day, or 1,000 second-feet);minimum stage recorded 2.3 feet June 25-30 (discharge, 16 million gallons perday, or 25 second-feet).
DIVERSIONS. None above station. REGULATION. None. UTILIZATION. Irrigation of sugar cane, rice, and taro and for power development
and domestic supply. ACCURACY. Records fair for all stages.
Discharge measurements of Koaie River near Waimea, Kauai, during the year endingJune 30, 1917.
Date.
July 19 Aug. 9
10 Oct. 22
23 Mar. 29 May 22
Made by
W. V. Hardy .................................................
.....do.........................................................
.....do.........................................................
... ..do..... ....................................................W . V. Hardy ..................................................
Gage height
. (feet).
2.322.15 2.08 2.20 2.53 2.50 2.76
Discharge.
Second- feet.
42 36 28 33 56 42 74
Million gallons
per day.
27 24 18 22 36 27
' 48
Daily discharge, in million gallons, of Koaie River near Waimea, Kauai, for the yearending June SO, 1917.
Date.
1....................................2....................:....-.-........3....................................4.............5....................................
6............................... ....7............................... ....8............. ... .... . .9............. ......... . .10..............................
11......................... . .12............................... . ..13............. . . .14............. ... .....15......................... .
16............... ......17............... .......18....................... . .19....................... . . .20..................... .
21............. . ... .22.....................23......................... . .24............. ... .25....................................
26............. . ... .27....................... .28..............................29.............................. . ..30....................................31....................................
July.
2626
2622201918
181820191819
Aug.
2035603232
24
221919
1919242228
6432242019
1818171718
181817171717
Sept.
1717202028
2226201818
1917172438
2628413026
3538263020
1818171717
Oct.
5560262020
1919242420
2494
Mar.
,
282525252825
Apr.
10839253935
2822222219
1928393532
2825222272
4322222219
1916161616
May.
1616161619
28150144
3935322825
252551355555
June.
5135283243
3951432825
2522222222
3949393225
2219191916
1616161616
NOTE. Discharge determined from fairly well defined rating curves applicable as follows: July 19 to Oct. 12, Mar. 26 to May 8, and May 21 to June 30. Gage heights not recorded on days for which discharge is not given.
40532° 18 WSP 465 3

34 SURFACE WATER SUPPLY OF HAWAII, 1916 17.
Monthly discharge ofKoaie River near Waimea, Kauai,for the year ending June 30,1917.
Month.
July 19-31. ............................
October 1-12. .........................
Discharge.
Million gallons per day.
Maximum.
26 64 41 60 28
108 51
Minimum.
18 17 17 19 25 16 16
Mean.
20.7 24.1 23.6 27.9 26.0 29.7 28.2
Second- feet
(mean).
32.0 37.3 36.5 43.2 40.2 46.0 43.6
Total run-off.
Million gallons.
269 749 708 335 156 892 845
Acre- feet.
826 2,290 2,170 1,030
479 2,730 2,600
WAIALAE RIVER AT ELEVATION 800 FEET, NEAR WAIMEA, KATJAI.
LOCATION. Half a mile above confluence with Waimea River and 10 miles north of Waimea.
RECORDS AVAILABLE. December 31, 1915, to June 30, 1917.GAGE. Gurley printing water-gage recorder.DISCHARGE MEASUREMENTS. Made by wading or from cable.CHANNEL AND CONTROL. One channel at all stages; straight in vicinity of gage;
banks steep and high. Control composed of boulders; shifting.EXTREMES OF DISCHARGE. Maximum stage recorded, 6.55 feet at 10.30 p. m. Decem
ber 18, 1916 (discharge not determined); minimum stage recorded, 1.1 feet June 27-30 (discharge, 7.5 million gallons per day, or 11.6 second-feet).
DIVERSIONS. None above station.REGULATION . None.UTILIZATION. Irrigation of sugar cane, rice, and taro, and for power and domestic
supply.ACCURACY. Records July 1 to October 29 and March 27 to June 30, good for low and
medium stages; October 30 to February 20, poor because of insufficient current- « meter measurements.
Discharge measurements of Waialae River at elevation 800 feet, near Waimea, Kauai during the year ending June 30, 1917.
Date.
July 18 19
Aug. 9 Oct. 21
23 Mar. 28 May 19
26
Made by
D . E . Horner. .......................................................do...............................................................do...............................................................do...............................................................do........-..-.-...-.-...-............-.....-..--.-.-.-.-...W.V. Hardy.. .................................................
Gage height (feet).
2.20 2.06 1.94 2.12 2.23 1.32 2.05 1.58
Discharge.
Second- feet.
26 14 8.9
16 25 22 93 38
Million gallons
per day.
17 9.2 5.7
11 16 14 60 24

ISLAND OF KAUAI. 35
Daily discharge, in million gallons, of Waialae River at elevation 800 feet, near Waimea, Kauai, for the year ending June 30, 1917.
Date.
1.... ..........9
3..............4..............5..............
6..............7..............8..............9..............
10..............
11..............12..............13..............14..............15..............
16..............17..............18..............19..............20..............
21..............22............23..............24..............25..............
26..............27..............28..............29..............30..............31..............
July.
1 Q
169 0
3411
7.07.06.06.06.0
6.06\0
1 Q
2411
272421
9 0Q ft
Q ft7.07.06.06.0
6.05 A
5.06.05.05.0
Aug.
6.07.0
241111
7.06.06.06.05.0
5 A
5.06.06.06.0
6.06.0
16Q ft
21
11117.06.06.0
5 A
5.05.05.05.05.0
Sept.
5.05 A
5.05.05.0
4.24.26.0
9 A
7.06.06 A
5.05.0
5.05.05.0
9 A
6.0116.05.0
11
1414
9 07.06.0
Oct.
6.05.05.05.0
21
88t;ft16
9 A
7.0
7.021
16
14
141R16
9 0192473
IS1173
116S3
42
Nov.
167.06.0
QA
54
9 046KQ
21
CO
1601^8
on
54
271163OA
104no
835427
27212497
Dec.
DO
54
169 A
5.0116
0370CQ
5030302421
1 Q
21Q10
302121
101108164230142
1 fift1 fift
121108108
Jan.
190
Q41 AQ
65KE
1%
26OK
46
Q4
65991715OQ
I AQ
204400
1 3^
88172114
101949400
7646
Feb.
46
1018882
8888CO
8891
7682
1216535
5065
101Q4
Mar.
12 to
13
Apr.
114 26
172932
2621211917
12299fi
2924
1713121250
321513
10
May.
2621212117
15. 15
9Q
2135
June.
422117219Q
9Q
50381Q
17
15131 ^
1313
2129211Q
13
108.88.88.8
8.87.57.57.57.5
NOTE. Discharge determined from rating curves applicable as follows: July 1 to Oct. 29 and Oct. 30 to Dec. 17 well defined below 30 million gallons per day; Dec. 18,1916, to June 30,1917, fairly well defined. Gage heights Feb. 21 to Mar. 7 unreliable. No record Mar. 8-26. Gage heights Apr. 27 to May 20 were lost.
Monthly discharge of Waialae River at elevation 800 feet, near Waimea, Kauai, for yearending June 30, 1917.
Month.
July..................................
May 21-30. ............................
Discharge.
Million gallons per day.
Maximum.
34 24 14
116 160 312 400 284 114 35 50
Minimum.
5.0 5.0 4.2 5.0 6.0 5.0
15 35 10 15 7.5
Mean.
11.0 7.94 7.18
29.0 50.6 93.2 96.5 94.7 24.5 22.1 18.0
Second- feet
(mean).
17.0 12.3 11.1 44.9 78.3
144 149 146 37.9 34.2 27.8
Total run-off.
Million* gallons.
342 246 215 898
1,520 2,890 2,990 1,890
638 221 540
Acre- feet.
1,050 755 661
2,760 4,660 8,870 9,180 5.810 1)950
678 1,660

36 SURFACE WATER SUPPLY OF HAWAII, 1916-11.
KEKAHA DITCH AT FLUME NO. 4, NEAR WAIMEA, 'KATJAI.
LOCATION. About a mile below intake, 7 miles, by trail, north, of Waimea.RECORDS AVAILABLE. February 25, 1916, to June 30, 1917.GAGE. Vertical staff at lower end of flume.DISCHARGE MEASUREMENTS. Made from cross beam near lower end of flume.CHANNEL AND CONTROL. Straight wooden flume 8 feet wide and 4 feet deep.EXTREMES OP DISCHARGE. Maximum stage recorded, 3.1 feet frequently (discharge,
62 million gallons per day, or 96 second-feet); water occasionally shut off. DIVERSIONS. Ditch diverts from Waimea River. REGULATION. By head gates. UTILIZATION. Irrigation of sugar cane. ACCURACY. Gage read twice daily. Records good above 30 million gallons per day.
Discharge measurements of Kekaha ditch at flume No. 4, near Waimea, Kauai, during theyear ending June 30, 1917.
Date.
July 18 Oct. 21 Mar. 26
30 May 27
Made by
.....do..........................................................W.V. Hardy.... ..............................................
Gage height (feet).
2.97 2.91 2.82 2.85 2.85
Discharge.
Second- feet.
88 88 88 90 89
Million gallons
per day.
57 57 57 58 58
Daily discharge, in million gallons, of Kekaha ditch at flume No. 4, near Waimea, Kauai, for the year ending June SO, 1917.
Date.
1..............2..............3..............4..............5..............
6..............7..............8..............9..............10..............
11..............12..............13..............14..............15..............
16..............17..............18..............19..............20..............
21..............22..............23..............24..............25..............
26..............27..............28..............29..............30..............31..............
July.
5858585858
5853504445
4851586062
6262585858
5850454239
353539393535
Aug.
4251585858
4845554435
3546585553
5853585858'
5858534539
VI35Q1
QO
3735
Sept.
3131303030
in1Q555055
5051353231
3231325858
5858585856<;a<;a56da10
Oct.
3231309Q31
3434505150
4045584650
5153585858
5853585858<\a55KQ
554655
Nov.
3535353545
5658585858
4635605855
5860605858
35353546
58
5858EQ
5856
Dec.
5655555555
5555535353
5353535353
535330158.0
-1135352532
35353<i
353535
Jan.
3434454545
4648484842
3740401446
4848483219
2940394540
442546464646
Feb.
464411
39393939
3958^ 583939
5151455046
5050505053
535660
Mar.
5555565860
6060606262
6262626262
6224242414
1414141422
406262626062
Apr.
6060605858
5860605858
58' 56
585856
5660585858
5656565656
5555fin6060
May.
6058585858
5858535150
4646464646
5055605860
6060586060
585858585662
June.
5656325656
5656565658
5656565858
5860565656
5656565353
5050484646
NOTE. Discharge determined from rating curve well defined above 30 million gallons per day, applicable July 1 to Feb. 3 and Feb. 7 to June 30. Water turned out of ditch Feb. 4-6.

ISLAND OF KAUAI. 37
Monthly discharge of Kekaha ditch at flume -No. 4, near Waimea, Kauai, for year endingJune SO, 1917.
Month.
July.................................
Discharge.
Million gallons per day.
Maximum.
62 58 58 58 60 56 48 60 62 60 62 60
Minimum.
35 31- 30 29 35
8 14 11 14 55 46 -32
Mean.
50.6 47.9 44.6 48.4 50.6 42.5 40.4 46.2 47.5 57.9 55.6 54.1
Second- feet
(mean).
78.3 74.1 69.0 74.9 78.3 65.8 62.5 71.5 73.5 89.6 86.0 83.7
Total run-off.
Million gallons.
1,570 1,490 1,340 1,500 1,520 1,320 1,250 1,160 1,470 1,740 1,720 1,620
17,700
Acre- feet.
4,810 4,560 4,110 4,600 4,660 4,040 3,840 3,550 4,520 5,330 5,290 4,980
54,300
KEKAHA DITCH BELOW TUNNEL NO. 12, NEAR WAIMEA, KAUAI.
LOCATION. About 7J miles below intake, 2 miles by trail from Waimea, and half a mile below diversion for Waimea domestic supply.
RECORDS AVAILABLE. July 20, 1916, to June 30, 1917.GAGE. Vertical staff.DISCHARGE MEASUREMENTS. Made from plank at gage.CHANNEL AND CONTROL. Channel cut in lava rock; fairly straight in vicinity of
gage. Control is old wooden weir.EXTREMES OP DISCHARGE. Maximum stage recorded during year, 3.6 feet December
1 (discharge, 50 million gallons per day, or 77 second-feet); water shut off Decem ber 24, 25, and 31.
DIVERSIONS. Small amount is diverted above station for domestic supply and oc casionally for irrigation of rice and taro.
REGULATION. By head gates.UTILIZATION. For irrigation of sugar cane, rice, and taro and for domestic supply.ACCURACY. Rating curve is well denned for all stages, but records for the higher
stages may be somewhat in error, owing to unrecorded fluctuations in stage, as gage is read but once daily.
Discharge measurements of Kekaha ditch below tunnel No. 12, Waimea, Kauai, during the year ending June SO, 1917.
Date.
Aus. 30 Sept. 3 Oct. 23 Nov. 5 Dec. 2 Jan. 29 Feb. 12
17 17 27
Mar. 6 23
Apr. 23 May 28 June 1
Made by
W. V. Hardy...................................................... .do. .........................................................
W . V. Hardy ..................................................
.....do..........................................................
.....do..........................................................
.....do..........................................................
.....do..........................................................
.....do..........................................................
.....do..........................................................
.....do..........................................................W.V. Hardy.... ..............................................
.....do..........................................................
Gage height (feet).
2.27 2.12 3.48 2.97 3.54 3.18 2.99 2.59 2.80 3.12 8.34 1.18 3.03 2.96 2.88
Discharge.
Second- feet.
42 37 69 59 73 66 61 51 56 64 70 18 60 59 57
Million gallons
per day.
27 24 45 38 47 43 39 33 36 41 45 11 39 38 37

38 SURFACE WATER, SUPPLY OF HAWAII, 1916-11.
discharge, in million gallons, of Kekaha ditch below tunnel No. 12, near Waimea, Kauai, for the year ending June 30, 1912.
Date.
1... ...........2..............3.. . ......---.-4..............5..............
6..............7..............8..............9..............10..............
11. ........ -----12.. 13.. ... .........14... ........ -..15.... ......... -
16.......----...17.. .... ........18.......---.-..19.. ...... ......20.. .. ..........
21... .... -- -22.. ...... ......23... ...-. .24... ......... ..25. . ............
26.-...-....-.27... ...... .....28......----..29.... . --------30..............31..... .........
July.
28
2828383636
353334353232
Aug.
3841474646
44384439°.f;
3433454141
4641464545
464343OK
32
292929293132
Sept.
°.1292928oc
2827444446
3646453201
33019Q4546
4646424545
4344413232
Oct.
302827269";
3833323640
3532403838
3694
404142
4341401147
464°.
4338V740
Nov.
4032323439
4444464343
4331384140
4341114241
47472901AC\
424242Aft
47
Dec.
5048464543
4342464646
4443424141
414146186
97
2238
1430oo
3528
Jan.
3535344130
38353737
3028319 028
4243424236
1893°.1
4639
39onon
393939
Feb.
4646464646
4646322935
3535272929
282828299.1
383838qc
38
3835°.f;
Mar.
4343444344
454";434345
42434343
434126°.147
If14141414
434°.
43414343
Apr.
3840414141
41AO
414342
383638qo
40
^09ft
383840
4040404241
45434140so
May.
434043
41
404n3839on
38363638O7
3840384641
40414141TO
383838143736
June.
VI
3323OK
37
4341423840
403939TO38
4143383938
O7
3637qc
35
3435363838
NOTE. Discharge determined from well-defined rating curve. No flow Dec. 24, 25, and 31.
Monthly discharge of Kekaha ditch below tunnel No. 12, near Waimea, Kauai, for yearending June SO, 1917.
Month.
July 20-31... ........................
The period. ...................
Discharge.
Million gallons per day.
Maximum.
38 47 46 47 47 50 46 46 47 45 46 43
Minimum.
28 29 27 24 29 6 9
27 14 28 14 23
Mean.
32.9 39.3 37.6 36.9 40.6 37.3 35.0 36.2 37.7 39.9 38.6 37.6
Seeond- ieet
(mean).
50.9 60.8 58.2 57.1 62.8 57.7 54.2 56.0 58.3 61.7 59.7 58.2
Total run-off.
Million gallons.
395 1,220 1,130 1,140 1,220 1.040 1,090 1,020 1,170 1,200 1,200 1,130
13,000
Acre- feet.
1,210 3,740 3,460 3,510
' 3,740 3,210 3,330 3,110 3,590 3.670 3,670 3,460
39,700

ISLAND OF KAUAI. 39
WAIMEA DITCH NEAR WAIMEA, KAUAI.
LOCATION. Half a mile below intake, at lower portal of tunnel No. 22, 2| miles north of Waimea.
RECORDS AVAILABLE. February 28, 1916, to June 30, 1917.GAGE. Vertical staff.DISCHARGE MEASUREMENTS. Made from foot plank 10 feet below gage.CHANNEL AND CONTROL. Clean channel about 4 feet wide in solid rock. Control,
solid rock.EXTREMES OP DISCHARGE. Maximum stage recorded, 1.3 feet June 20, 1916 (dis
charge, 7 million gallons per day, or 11 eecond-feet); ditch occasionally dry.DIVERSIONS. Ditch diverts from Waimea River.UTILIZATION. Irrigation of sugar cane and domestic supply.ACCURACY. Gage read twice daily. Records good for all stages.
Discharge measurements of Waimea ditch near Waimea, Kauai, during the year endingJune 30, 1917.
Date.
Aug. 30 Sept. 3
26 27
Oct. 15 Nov. 3
26 Dec. 2 Jan. 28 Feb. 12 Mar. 10 Apr. 23 May 28 June 1
5
Made by
W.V. Hardy...... ............................................
.....do.........--..--..--...---.---......-....-...-............
.....do.........--..--..-....-...-........-...,--..--...........
.....do.........................................................
.....do.........................................................
.....do.........--...-...-.-.-....-...-...---..---..--..--......W. V. Hardy ..................................................D . E . Horner .......................................................do..............................................................do.........--...-...--...-...-...--..--...-....-...........
Gage height (feet).
0.88 .88
1.02 1.22
.42
.66 1.14 .98 .72 .34 .94 .91
1.17 .55
1.11
Discharge.
Second- feet.
4.6 5.3 7.2 8.6 1.1 3.3 6.8 6.4 3.6 .6
6.1 5.3 7.8 2.0 5.96
Million gallons
per day.
3.0 3.4 4.6 5.6 .7
2.1 4.4 4.1 2.3 .4
3.9 3.4 5.1 1.3 3.8
Daily discharge, in million gallons, of Waimea ditch near Waimea, Kauai, for the years ending June SO, 1916 and 1917.
Date.
1916. 1. ....... .......2...............3...............4...............5...............
6...............7...............8...............9...............
10...............
11...............12...............13...............14...............15...............
Mar. Apr.
3.93.54.34.83 Q
3.12.72 7
2 7
3 1
3.13.12 7
5.25 9
May.
4.34.35.64.3<\ 9
5.23.94.34.35.2
4.33.93 C
4.33 C
June.
4.85.25 9
5.2K 9
4.84.85 25 9
5.2
5.45 45.6
5.6
Date.
1916. 16...............17...............18...............19...............20...............
21...............22...............90
OC
26. ...... ........27...............28...............29.... ..........30...............31...............
Mar.
2.3
1 Q1 99 ^
2 7
2 7
2 0
1 Q1 Q
3 c
a e
3.5
Apr.
5.24.34 0
5.23 K
3 Q°. Q
3 1
2.73 1-
2.73.13 1
0 1
3 C
May.
3.15.24 Q
4.85.2K 9
5.24.85.2A Q
A 0
°. 0
4 35 9c o
5.0
June.
6.16.1A 0
5.27.0
6.1c 9C O
4 0
5 9
6.16.16.16.16.1

40 SURFACE WATER SUPPLY OF HAWAII, 1916-lT.
Daily discharge, in million gallons, of Waimea ditch near Waimea, Kauai, for the years ending June 30, 1916 and 1917 Continued.
Date.
1916-17. . 1..............2..............3..............4... ...........5..............6.............. 7..............8..............9..............
10..............11..............12..............13..............14..............15..............16.............. 17.............. 18..............19... .......... .20.............. 21..............22.............. 23.............. 24..............25.............. 26..............27.............. 28..............29..............30..............31..............
July.
6.26.25.56.25.54.8 4.84.24.24.24.25.26.24.54.24.8 4.8 4.84.84.2 4.84.8 4.2 4.24.2 3.53.23.8 4.23.53.5
Aug.
3.53.55.54.85.54.4 3.23.83.53.23.23.24.24.84.25.5 3.8 5.85.55.5 4.84.5 4.5 3.53.5 3.53.5 3.5 3.53.53.5
Sept.
3.53.53.53.23.23.22.94.54.25.84.24.83.83.53.53.5 3.5 3.25.86.2 5.55.2 5.5 4.84.2 4.84.8 3.2 3.83.5
Oct.
s f;3.53.23.23.54.5 3.83.53.54.82.21.61 ^l
.61.31.0 3.5 4.24.24.5 4.23.5 4.2 4.25.5 4.23.2 2.9
4.84.5
Nov.
4.23.81.92.63.54.2 4.23.83.5^ f;
3.53.52.93.53.84.2 3.5 4.23.83.24.23.5 3.5 3.54.5 4.83.8 4.2 4.24.2
Dec.
3.54.23.23.84.54.2 4.22.22.22.22.93.55.24.82.93.8 4.8 5.5
.......
......
.......
.......
Jan.
1.92.21.01.61.0
.6
.6
.61.3
.......
1.6.8.4
1.0 2.21.61.3
Feb.
1.3
1.62.9 2.92.62.21.61.0.6.6
2.9.5
.......
1.0.5 .4.4 .4.6
1.6
.......
Mar.
0.6.8
1.9
3.54.2 4.24.54.84.54.23.53.53.54.21.0 2.2 2.9.6
3.5
.......
""i'e"2.22.2
Apr.
3.83.8 4.22.92.62.9 2.92.92.93.54.22.92.93.24.84.8 4.2 3.23.23.52.92.9 3.5 3.53.21.61.9 1.6 1.6.6
May.
1.02.22.92.92.92.9 2.92.92.93.23.53.53.53.53.53.5 4.04.83.53.8 3.52.9 2.94.83.5 3.83.5 4.8 4.23.51.0
June.
1.01.02.23.84.24.2 2.93.22.6
2.94.24.84.84.85.5 5.24.84.84.8 4.54.5 4.2 4.24.2 4.24.2 4.2 4.24.8
NOTE. Discharge determined from a well-defined rating curve; interpolated July 12, Aug. 1, 6, and 27. No flow on days for which discharge is not given.
Monthly discharge of Waimea ditch near Waimea, Kauai, for the years ending June 30,1916 and 1917.
Month.
1916. March 20-31 .........................April................................
June. ...............................
1916-17. July................................
June (29 days) ......................The year. . ....................
Discharge.
Million gallons per day.
Maximum.
3.5 5.2 5.B 7.07.0
6.2 5.8 6.2 5.5 4.8 5.5 2.2 2.9 4.8 4.8 4.8 5.5
Minimum.
1.2 2.7 3.1 4.31.2
3.2 3.22.9 .6
1.9 2.2 .4 .4 .6 .6
1.0 1.0
Mean.
2.48 3.64 4.57 5.454.31
4.63 4.14 4.16 3.45 3.72 3.76 1.23 1.35 2.96 3.07 3.30 3.96
Second- feet
(mean).
3.84 5.63 7.07 8.436.67
7.166.41 6.44 5.34 5.76 5.82 1.90 2.09 4.58 4.75 5.11 6.13
Total run-off.
Million gallons.
30 109 142 164445
143128 125 107 112 68 20 26 65 92
102 115
1,100
Acre- feet.
91 335 435 502
1,360
440 394 383 328 342 208 60 79
200 283 314 352
3,380
KAMENEHUNE DITCH NEAR WAIMEA, KAUAI.
LOCATION. 200 feet below wire suspension bridge across Waimea River, about 3 milesabove Waimea; reached by wagon road up the right side of Waimea River.
RECORDS AVAILABLE. October 9, 1911, to June 30, 1917. GA.GE. Vertical staff on right bank. DISCHARGE MEASUREMENTS. Made from plank.

ISLAND OF KAUAI. 41
CHANNEL AND CONTROL. Straight for 50 feet above and below gage; mud bottom. Stage-discharge relation affected by growth of grass and weeds in channel; current
EXTREMES OF DISCHARGE. Maximum stage recorded during period of record, 1.8 feet at 7.30 a. m. July 4, 1916 (discharge, 5.5 million gallons per day, or 8.5 sec ond-feet); ditch occasionally dry.
DIVERSIONS. Diverts from Waimea River.REGULATION. By head gates.UTILIZATION. Irrigation of rice and taro.ACCURACY. Gage read twice daily. Record poor, owing to instability of stage-dis
charge relation due to vegetal growth in channel and frequent cleaning of ditch.
Discharge measurements of Kamenehune ditch near Waimea, Kauai, during the year endingJune SO, 1917.
Date.
Aug. 30 Sept. 26 Oct. 3
25 Nov. 29 Dec. 1
29 Jan. 27
29 Feb. 12 Mar. 6 Apr. 24
Made by
W.V. Hardy..................................................
.....do..........................................................
.....do..........................................................
.....do..........................................................W.V. Hardy..................................................
.....do..........................................................W.V. Hardy..................................................
W.V. Hardy..................................................
Gage height, (feet)
0.80 1.11 .98
1.44 1.16 .84 .90 ,86 .95 .66
1.27 1.10
Discharge.
Second- feet.
1.4 2.9 2.3 5.3 3.8 1.8 .7
1.5 1.4 .4
5.3 2.8
Million gallons
per day.
0.9 1.9 1.5 3.4 2.5 1.2 .45 .95 .85 .25
3.4 1.8
Daily discharge, in million gallons, of Kamenehune ditch near Waimea, Kauai, for theyear ending June SO, 1917.
Date.
1..............2..............3..............4..............5..............6..............7..............8..............9..............
10..............11..............12..............12..............14..............15..............16..............17..............18..............19.... ..........20..............91
22..............23..............24.............. 25..............26..............27. .............28..............29..............30..............31..............
July.
4.03.54.04.81.61.82.01.82.22.02.0
. 2.53.53.53.24.23.52.51.62.02.02.22.01.6 1.21.41.21.21.21.21.2
Aug.
1.61.82.22.22.21.81.61.41.61.41.41.83.01.63.01.81.83.03.22.22.01.61.21.2 1.01.01.81.6.8
1.0.8
Sept.
0.8.6
1.21.21.01.01.01.01.41.61.01.41.21.41.21.41.41.02.23.03.02.23.03.02.82.02.22.01.61.6
Oct.
2.01.61.41.82.22.01.82.22.22.22.02.02.01.81.81.61.81.81.82.59 n1.82.02.5 3.82.22.03.82.81.41.0
Nov.
1.21.01.01.63.02.22.52.82.01.21.81.61.21.21.61.61.22.51.61.43.02.01.61.2.8
1.81.61.82.52.8
Dec.
2.82.21.81.21.41.02.52.52.83.22.01.62.02.01.2.8
2.04.5
.8
.6
.3
.15
.1
.1
.1
.45
.0509
Jan.
0.6.45.1.3.02.3.1.02.45
2.51.81.61.21.2.3
1.21.81.4.8
2.0 1.4.6.45
1.01.21.2.8
Feb.
1.03.52.52.22.02.21.81.41.2.8
.8
.45
.83.83.02.52.23.22.82.82 9
2 9
1.61.2 1.21.21.21.4
Mar.
0.61.21.02.82.52.82.83.02.82.22.22.02.82.52.82.51.82.52.23.89 9
1.81.61.4 1.41.41.41.41.61.61.6
Apr.
1.81.81.61.41.41.21.01.01.81.62.82.52.81.82.22.01.81.21.21.02.03.03.03.0 2.52.52.52.22.22.0
May.
2.52.22.21.82.22.02.02.01.82.02.01.82.83.03.02.82.52.52.52.22.02.82.82.5 2.52.52.53.03.02.82.2
June.
2.01.81.81.62.02.02.02.02.22.22.22.02.22.02.02.82.82.82.51.82.01.81.61.6 2.22.82.82.82.52.5
NOTE. Discharge determined from rating curves applicable as follows: July 1 to Dec. 18 and Jan. 29 to June 30, fairly well denned; Dec. 19 to Jan. 28, poorly denned. No flow on days for which discharge is not given.

42 STIES'ACE WATER SUPPLY OF HAWAII, 1916-17.
Monthly discharge of Kamenehune ditch near Waimea, Kauai, for the year endingJune SO, 1917.
Month..
July.................................
Discharge.
Million gallons per day.
Maximum.
4.8 3.2 3.0 3.8 3.0 4.5 2.5 3.8 3.8 3.0 3.0 2.8
Minimum.
1.2.8 .6
1.0 .8 .02 .02 .45 .6
1.0 1.8 1.6
Mean.
2.34 1.76 1.65 2.06 1.78 1.43 .92
1.90 2.07 1.96 2.40 2.18
Second- feet
(mean).
3.62 2.72 2.55 3.19 2.75 2.21 1.42 2.94 3.20 3.03 3.71 3.37
Total run-off.
Million ' gallons.
73 55 49 64 53 40 25 53 64 59 74 65
674
Acre- feet.
223 167 152 196 164 123 76
163 197 180 228 201
2,070
MAKAWELI RIVER NEAR WAIMEA, KAUAI.
LOCATION. Half a mile above confluence with Waimea River and 2 miles northeastof Waimea. Reached by wagon road up Makaweli River.
RECORDS AVAILABLE. October 6, 1911, to June 30, 1917. GAGE. Vertical staff on right bank.DISCHARGE MEASUREMENTS. Made by wading or from footbridge. CHANNEL AND CONTROL. One channel at all stages; straight for 500 feet above and
below gage; banks low, with gentle slope; current swift. Control composed ofboulders; fairly permanent between extreme floods.
EXTREMES OF DISCHARGE. Maximum stage recorded during period of record, 13.5feet December 18,1916 (discharge, approximately 7,500 million gallons per day, or11,600 second-feet); minimum stage recorded, 3.0 feet December 16-19, 1912(discharge, 1.9 million gallons per day, or 3.0 second-feet).
DIVERSIONS. There are many small diversions above station for irrigation of sugarcane, rice, and taro.
REGULATION. None.UTILIZATION. Water passing station is wasted. ACCURACY. Rating curves fairly well defined for low and medium stages. Records
below 500 million gallons per day, fair; those for high and fluctuating stagesprobably considerably in error as gage is read only once daily.
Discharge measurements of Makaweli River near Waimea, Kauai, during the year endingJune SO, 1917.
Date.
Aug. 30 Sept. 25
28 Nov. 15 Dec. 2 Jan. 28 Mar. 7 Apr. 24 May 28 June 1
5 13
Made by
W.V. Hardy.......................... .......................
.....do............ .................................. .........
.....do.........................................................
.....do.........................................................
.....do.........................................................W. V. Hardy. .................................................D. E. Horner. ......................................................do..............................................................do.......................................... ...................do.......................................... ..............
Gage height (feet).
3.08 3.35 3.38 4.08 3.91 3.48 3.78 3.56 3.43 4.084.16 3.30
Discharge.
Second- feet.
1225 38
138 121 61
100 62 50
153 166 39
Million gallons
per day.
7.8 16 25 89 78 40 65 40 38 99
107 25

ISLAND OP KAUAI. 43
Daily discharge, in million gallons, of Makaweli River near Waimea, Kauai, for the yearending June SO, 1917.
Date.
1..............2..............3..............4..............5..............
6..............7..............8..............
10..............
11..............12..............13..............14..............15..............
16.............17..............18..............19..............20. .............
91
2324..............oc,
26..............97
28..............29..............qn
31..............
July.
9.21212
24419
1616161111
11168752216
1051 QQno
28
9^
121 0*
19
11119.2161419
11
Aug.
1190534440
1414121212
9.29.2901212
1112
11210528
161219
1212
19
111111119.2
Sept.
9 0
9.2321412
121211119.2
141581059811
9.29 9
q9
1211
11ISOQ9
1916
14812099
1412
Oct.
1412121219
19
1114899
16
161419
1210.
191919
1614
1416OQ
00
oqq
148i Q^n
i°.ncc
36
Nov.
oc
99
8501°.Q
i*>n200
1,380qoo
148
9098on
Ifi
148130OE*>
226139
Cft
00
OC
229999
Dec.
lift1091023636qO
qoft
1167661
52394766CO
QO
QO
4,5701, 575226
137123
1,370
1OQ
1571962°6
<K
Jan.
157139216186148
89
61ftt
CO
CO
eo
JQ
°.Q
CO
qoOCAQCn
139IQQQQ
47477166
Pet.
CO
17821610900
56elsfi71CO
CO
Cft
00
Plfi
CO
4799ftono
1661391481QQ
714736
Mar.
so36oe
66CO
52OQ
4719"?
66
434761
qi e
7]0
365ion
iqQ
66395
365oiftiqn
10271
W5
23616682CO
39
Apr.
iqA
QO
OQ
oeQO
SS
6147
511
IOQ
176
61
3900
OQfi
OQ
cc
36qo
43
May.
47
Cft
qn°.Q
qoqo
qoOQ
qo
290QO
CO
43qo32
130OQ
4300ft
236
June.
oo*7fl
4743
4771
O9R
CC
71
47
65
9571
01
Cfl
52
157QO
6155
NOTE. Discharge determined from rating curves applicable as follows: July 1 to Nov. 19, fairly woll denned; Nov. 20 to June 11, fairly well defined; and June 12-30, poorly denned.
Monthly discharge of Makaweli River near Waimea, Kauai, for year ending June SO, 1917.
Month.
July.................................
April................................May.................................
The V68T
Discharge.
Million gallons per day.
Maximum.
244 112 158
1,950 1,380 4,570
950 328 710 515 620 226
4,570
Minimum.
9.2 9.2 9.2
11 16 32 32 36 25 25 28 43
9.2
Mean.
38.8 26.8 37.5
113 177 363 150 111 151 82.9
102 81.5
120
Second- feet
(mean).
60.0 41.5 58
175 274 562 232 172 234 128 158. 126
186
Total run-off.
Million gallons.
1,200 832
1,120 3,500 5,310
11,200 4,660 3,100 4,670 2,490 3,150 2,450
43,700
Acre- feet.
3,690 2,550 3,450
10,800 16,300 34,500 14,300 9,510
14.400 7,630 9,700 7,500
134,000
OLOKELE DITCH AT TUNNEL NO. 12, NEAR MAKAWELI, KATTAI.
LOCATION. About 2 miles below intake, 10 miles northeast of Makaweli.RECORDS AVAILABLE. July 24, 1904, to June 30, 1917.GAGE. Vertical staff.DISCHARGE MEASUREMENTS. Made from plank across ditch.

44 SURFACE WATER SUPPLY OP HAWAII, 1916-17.
CHANNEL AND CONTROL. Concrete flume of rectangular section; ditch, mostly in rock tunnel; straight for 50 feet above and below gage. Control probably per manent.
EXTREMES OP DISCHARGE. Maximum stage recorded during period of record, 4.40 feet, June 25, 1916 (discharge, 82 million gallons per day, or 127 eecond-feet); water sometimes shut off.
DIVERSIONS. Ditch diverts all low-water flow of Olokele River.REGULATION. Flow regulated by head gates.UTILIZATION. For irrigation of sugar cane and for domestic supply.ACCURACY. Rating curve well denned. Records for low and medium stages good;
those of high and fluctuating stages may be considerably in error as gage is read only once daily.
COOPERATION. Gage-height records furnished by Hawaiian Sugar Co.
Discharge measurements of Olokele ditch at tunnel No. 12, near Makaweli, Kauai, during the year ending June SO, 1917.
Date.
July 20 Jan. 24 Feb. 20
20 21
Mar. 12 May 29
Made by
W.V. Hardy..................................................D. E. Horner..................................................
.....do..........................................................
.....do..........................................................
.....do..........................................................
.....do..........................................................W.V. Hardy..................................................
Gage height (feet).
4.00 1.90 1.51 1.43 1.31 2.69 3.08
Gage height.
Second- feet.
113 4128 26 22 B8 83
Million gallons
per day.
7326 18 17 14 44 54
Daily discharge, in million gallons, of Olokele ditch at tunnel No. 12, near Makaweli, Kauai, for the year ending June 30, 1917.
Date.
l..............2..............3..............4..............5..............
6..............7..............8..............9..............10..............
11..............
13..............14..............15..............
16..............17..............18..............19..............20..............
21..............22..............oo
24..............25..............
26..............27..............28..............9Q30Q1
July.
7268507254
4846434343
5054727272
7272725972
5952ttfi4643
437259465954
Aug.
5472725254
5054526848
5063545472
5052725272
6654464643
464646524343
Sept.
4166434343
4172507250
5746434141
4141486152
5750467272
617279
63Kfl
Oct.
4841434343
72544646*3
4343505263
7257637272
6852636872
665272727261
Nov.
4154547272
7272727272
7254465048
5072684152
7272545050
7263727272
Dec.
7272727272
5959725770
5419173939
3939393939
2828
28
286161616161
Jan.
6161687070
5450685461
6154525059
5061282824
2424282424
242446464617
Feb.
1717171717
1717171717
1743431717
1717171717
1717174343
434343
Mar.
4343434343
4343434343
4343434343
1717171717
1717171717
171717171717
Apr.
1746464646
4646464646
4646464646
6868686152
5050525954
2828282848
May.
4646464646
4646464666
4848464850
6672724646
6654575248
485059505050
June.
28Oft00
6672
7272726857
5454525468
5028285950
4646464343
414141
- 4343
NOTE. Discharge determined from a well-defined rating curve. Ditch dry Dec. 23 and 24.

ISLAND OP KAUAI. 45
Monthly discharge ofOlokele ditch at tunnel No. 12, near Mdkaweli, Kauai,for year endingJune 30, 1917.
Month.
July.... .............................
May.................................
Discharge.
Million gallons per day.
Maximum.
72 72 72 72 72 72 70 43 43 68 72 72
Minimum
43 43 41 41 41 17 17 17 17 17 46 28
Mean.
57.7 54.8 53.6 57.5 61.8 50.2 45.5 23.5 29.6 46.8 51.8 49.8
Second- feet
(mean).
89.3 84.8 82.9 89.0 95.6 77.7 70.4 36.4 45.8 72.4 80.1 77.1
Total run-off.
Million gallons.
1,790 1,700 1,610 1,780 1,860 1,460 1,410
658 917
1,400 1,610 1,490
17,700
Acre- feet.
5,490 5,210 4,930 5,470 5,690 4,470 4,330 2,020 2,820 4,310 4,930 4,580
54,200
OLOKELE DITCH AT WEIR, NEAR MAKAWELI, KAUAI.
LOCATION. About 5 miles below intake and 7 miles northeast of Makaweli.RECORDS AVAILABLE. January 1, 1912, to June 30, 1917.GAGE. Vertical staff showing head on weir.DISCHARGE MEASUREMENTS. Made by 12-foot sharp-crested weir, with end contrac
tions; computations checked by current-meter measurements.CHANNEL AND CONTROL. Pool at weir.EXTREMES OP DISCHARGE. Maximum stage recorded during period of record, 26J
inches May 27, 1916 (discharge, 84 million gallons per day, or 130 second-feet); ditch occasionally dry.
DIVERSIONS. Diverts all low-water flow of Olokele River.REGULATION. By head gates.UTILIZATION. For irrigation of sugar cane and for domestic supply.ACCURACY. Conditions for measurement by weir good. Records for low and medium
stages good, but those for high stages may be in error as gage is read only once daily.
COOPERATION. Gage-height records copied from records of Hawaiian Sugar Co.

46 SURFACE WATER SUPPLY OF HAWAII, 1916-17.
Daily discharge, in million gallons, of Olokele ditch at weir, near Makaweli, Kauai, for the year ending June 30, 1917.
Date.
1.... ..........2..............3..............4..............5..............
6..............7. .............8..............9..............10..............
11..............12..............13..............14..............15..............
16..............17..............18..............19..............20..............
21..............22..............23..............24..............25..............
26..............27..............28..............29..............30..............31..............
July.
6062495158
4538383838
4141606262
6264646154
6156484340
394557475049
Aug.
4957645658
4945565448
4554545255
5545595658
6256454139
454051434340
Sept.
3840513838
3740564760
49454038
' 38
3643455858
485059
. 5958
6060645947
Oct.
<«42403837
5854454240
3939454258
50591062fi4
6252566454
645160645858
Nov.
4546485166
6665636263
6060444545
44455963CJ.
5666525549
6463606464
Dee.
6465646466
5950645854
5244432833
36394045^Q
26
Jan.
4549AQ
6156
5145424551
5550474644
44483324
212420
9724103841
Feb.
2224241823
23201Q16
2314362614
171618
10
15161515
2338
Mar.
38383838
3835383742
4040404440
3614161318
1417141620
201918161517
Apr.
1825383838
3939434339
3846444144
5260565449
4444495348
4228247.516
May.
4341403837
4041403944
4642414448
4653585542
5148485046
424550484750
June.
3632263259
5760626057
5351494646
5151354350
4441413939
3837353839
NOTE. No flow on days for which discharge is not given.
Monthly discharge of Olokele ditch at weir, near Makaweli, Kauai, for year endingJune 30, 1917.
Month.
July.................................
Discharge.
Million gallons per day.
Maximum.
64 64 64 64 66 66 61 38 44 60 58 62
Minimum.
38 39 36 37 44 26 20 13 13 7.5
37 26
Mean.
51.1 50.8 48.6 51.6 56.2 49.1 41.4 20.3 27.6 40.0 45.3 44.9
Second- feet
(mean).
79.1 78.6 75.2 79.8 87.0 76.0 64.1 31.4 42.7 61.9 70.1 69.5
Total run-off.
Million gallons.
1,580 1.570 1,460 1,600 1,690 1.080 1,120
488 829
1.200 1,400 1,350
15,400
Acr&.feet.
4,860 4,830 4,470 4,910 5,170 3,310 3,430 1,500 2,540 3,680 4,310 4,130
47,100
HANAPEPE RIVER AT KOULA, NEAR ELEELE, KAUAI.
LOCATION. 200 feet above ford, half a mile above the siphon at Koula, and 5 milesnorth of Eleele.
RECORDS AVAILABLE. August 18,1910, to December 15, 1916. GAGE. Friez water-stage recorder. DISCHARGE MEASUREMENTS. Made by wading or from cable.

ISLAND OF KAUAI. 47
CHANNEL AND CONTROL. One channel at all stages; straight for 200 feet above and 400 feet below gage; banks high and wooded. Control composed of boulders; fairly permanent.
EXTREMES OF DISCHARGE. Maximum stage during period of record, December 18, 1916; water-stage recorder and shelter carried away by flood and stage not recorded; minimum stage recorded, 0.95 foot December 30 and 31, 1913 (discharge, 7.1 mil lion gallons per day, or 11 second-feet).
DIVERSIONS. Hanapepe ditch diverts part of flow above station.REGULATION. By diversions.UTILIZATION. Flow at low stages is diverted for irrigation of sugar cane, rice, and
taro.ACCURACY. Records good for all stages.
Discharge measurements of Hanapepe River at Koula, near Eleele, Kauai, during theyear ending June SO, 1917.
Date.
July 9 Oct. 20
Made by
W. V.Hardy.... ............... t..............................
Gage height (feet).
1.10 2.22
Discharge.
Second- feet.
26 201
Million gallons
per day.
17 130
Daily discharge, in million gallons, of Hanapepe River at Koula, near Eleele, Kauai, for the year ending June 30, 1917.
Date.
1. .2. .3. .4. .5. .
6.7. .8. .9. .10. .
11. .12. .is14. .15. .
July
144505012836
24181414ID
13368010756
Aug.
24114808040
2140323218
1821la24100
Sept.
1214121111
1232134518
2113
12
Oct.
211413
40
7424141413
2432182121
Nov.
564036200171
10033230824293
14486564036
Dec.
15311474
oafi86
O£162745040
2836OO
94
21
Date.
16.17.18.19.20.21.22.23.24.25.26.27.28.9Q
30. ..31. ..
July
12815310045747440241816165021243228
Aug.
284074508045
18281616161314is12
Sept.
1224323216241005032621441281366232
Oct.
2836561441075662621712867480600OOA
162100
Nov.
3256
231625014456364093114629393308
Dec.
NOTE. -.Discharge determined from well-defined rating curve.
Monthly discharge of Hanapepe River at Koula, near Eleele, Kauai, for the year endingJune 30, 1917.
Month.
July...................................
The period. .....................
Discharge.
Million gallons per day.
Maximum.
153114 144 600 332 286
Minimum.
13 12 1112 32 21
Mean.
52.5 37.1 37.987.1
114 82.8
Second- feet
(mean).
81.257.4 58.6
135 176 128
Total run-off.
Million gallons.
1,630 1,150 1,140 2,700 3,410 1,240
11,300
Acre- feet.
4,990 3,530 3,490 8,290
10,500 3,810
34,600

48 SURFACE WATER SUPPLY OF HAWAII, 1916-17.
HANAPEPE DITCH AT KOTTLA, NEAR ELEELE, KAUAI.
LOCATION. At the first flume below siphon at Koula, 4 miles below intake and 4miles north of Eleele.
RECORDS AVAILABLE. January 1,1910, to June 30, 1917. GAGE. Vertical staff.DISCHARGE MEASUREIAENTS. Made in flume. CHANNEL AND CONTROL. Wooden flume; straight for 20 feet above and below gage;
some vegetal growth on bottom and sides of flume. Control fairly permanent. EXTREMES OF DISCHARGE. Maximum stage recorded during year, 3.14 feet August
and November (discharge, 34 million gallons per day, or 53 second-feet); ditchoccasionally dry.
Maximum stage recorded during period of record, 4.97 feet November 30, 1913(discharge, 67 million gallons per day, or 104 second-feet).
DIVERSIONS. Diverts part of flow of Hanapepe River. REGULATION. By head gates.UTILIZATION. For domestic supply and irrigation of sugar cane. ACCURACY. Discharge ascertained from fairly well defined rating curve. Records
fair for low and medium stages; those for high stages probably somewhat in errorowing to fluctuation of stage not shown by the one daily gage reading.
Daily discharge, in million gallons, of Hanapepe ditch at Koula near Eleele, Kauai,for the year ending June SO, 1917.
Date.
1. .............
3..............4..............5..............
6..............7..............8..............9..............10..............
11..............12..............13..............14..............15..............
16..............17..............18..............19..............20..............
21..............22..............23..............24..............CK
26..............27..............28..............9Q30..............31..............
July.
3434333434
3333343234 3A
34343434
3434343434
3334333434
343434343434
Aug.
3434343434
3434343434
3434343434
3434343434
3433OO
3334
333332OO
3231
Sept.
30333030OQ
2834323432
OO
31OQ
0*2
97
2733OO
3333
3333333233
33
9.61133
Oct.
333332Q9
32
3300
3300
30
qi00
33OO
32
00
3300
3333
333300
3333
333333OO
3333
Nov.
3333333333
3333333333
33333300
33
00
33333334
3434333434
3434343434
Dec.
3434333333
3333333333
00
33333333
333333
.5
.7
.7
.73.06.0
2216161Q
1616
Jan.
17173491OP;
9999
229999
22997 37 q
99
2299
1413
.7-
.710101010
101010101010
Feb.
101614121 e:
1211121212
19
3.0
3 n3.0
4.63.4
3.42.62.312
212628
Mar.
2828309Q
21
2121211818
18
222394
2.32.32.32.3
1.0
1.22.32.32.32.32.3
Apr,
2222222222
2222222222
22
2299
22
3333333333
33333333'
17
4.24.28.222
May.
22222299.
22
2231323233
3232323233
3333333333
3333333333
333333333318
June.
181616Q1
*.°,
OO
33333333
9.9.
3333OO
OO
3333OO
3333
3333OO
3300
333333OO
32
NOTE. Discharge determined from fairly well-defined rating curve. No flow on days for which dis charge is not given.

ISLAND OF KAUAI. 49
Monthly discharge of Hanapepe ditch at Koula, near Eleele, Kauai, for the year endingJune SO, 1917.
Month.
July..................................
December (30 days) ...................
March (26 days). ......................April (29 days). .......................
The year. .......................
Discharge.
Million gallons per day.
Maximum.
34 34 34 33 34 34 34 28 30 33 33 33
Minimum,
32 319.6
30 33
.5
.7 2.3 1.0 4.2
18 16
Mean.
33.8 33.6 30.7 32.7 33.3 23.8 15.4 11.8 14.1 23.5 30.1 31.3
Second- feet
(mean).
52.3 52.0 47.5 60.6 51.5 36.8 23.8 18.3 21.8 36.4 46.6 48.4
Total run-off.
Million gallons.
1,050 1,040
892 1,010 1,000
713 477 294 367 683 934 938
9,400
Acre- feet.
3,220 3,200 2,730 3,110 3,070 2,190 1,470
905 1,130 2,090 2,860 2,880
28,900
HANAPEPE DITCH AT WEIR, NEAR HANAPEPE, KAUAI.
LOCATION. About 2J miles northeast of Hanapepe, below the last siphon across Hanapepe River.
RECORDS AVAILABLE. January, 1910, to June 30, 1917.GAGE. Vertical staff.DISCHARGE MEASUREMENTS. Made by 12-foot sharp-crested weir with end con
tractions.CHANNEL AND CONTROL. Weir conditions good.EXTREMES OF DISCHARGE. Maximum stage recorded during year, 19 inches De
cember 29-31 (discharge, 50 million gallons per .day, or 77 second-feet); ditch frequently dry.
DIVERSIONS. Ditch diverts from Hanapepe River.UTILIZATION. For irrigation of sugar cane and for domestic use.ACCURACY. Records fair.COOPERATION. Gage-height records copied from records kept by Hawaiian Sugar Co.
40532° IS wsP 465 4

50 SURFACE WATER SUPPLY OF HAWAII, 1916-17.
Daily discharge, in million gallons, of Hanapepe ditch at weir near Hanapepe, Kauai, for the year ending June 30, 1917.
Date.
1..............2..............3..............
5..............
6..............7..............8..............9..............10..............
11..............19
13..............14..............1 ^
16..............17..............18..............19..............20...............
21 ..............22..............23..............2t..............25. .............
26..............27..............28..............29..............30..............O1
July.
2797
2797
27
9790
272797
279798
299Q
29OQ
272727
29279898
27
07
27OQ
272727
Aug.
27979797OQ
2797
272727
279797
2797
27979797
27
279797
2726
272797
2797
Sept.
30
23249Q
9Q
232326
26269Q
239Q
219Q
272827
2626
2727
Oct.
2727279797
272727
272727
97
2797
2727
27232728
2827OQ
202797
Nov.
299ft
2997
29
28on
2727
27OQ
299O
29OQ
OQ
2929
2926272727
2727272727
Dec.
27272707
27
9Q
27272707
2727272797
27g
275426
2.1
5.542515252CO
Jan.
1818242725
2221212221
2121
Feb.
18
181823
Mar.
20202020
1818201818
1818181818
Apr.
182020
2020202020
2020202020
202424
2494.
24QA
May.
1818181820
2323232323
23232323OQ
23OQ
2930
3030303028
June.
15
27
2727272727
27302929OQ
29on
292929
29292828
2727979797
NOTE. No flow on days for which discharge is not given.
Monthly discharge of Hanapepe ditch at weir near Hanapepe, Kauai, for year endingJune 30, 1917.
Month.
July.................................
April (21 days).. . ...................
Discharge.
Million gallons per day.
Maximum.
29 28 30 29 30 54 27 20 34 30 30
Minimum.
23 26 21 20 26 2.1
18 18 18 18 15
Mean.
27.4 27.0 24.8 26.7 27.9 29.9 21.8 18.7 21.7 24.0 27.5
Second- feet
(mean).
42.4 41.8 38.4 41.3 43.2 46.3 33.7 28.9 33.6 37.1 42.5
Total run-off.
Million gallons.
848 810 596 695 782 807 261 262 456 575 715
6,810
Acre- feet.
2.610 2,490 1,830 2,130 2.400 2,480
803 803
1,400 1,770 2,190
20,900
SOUTH FORK OF WAILUA RIVER NEAR LXHtXE, KAUAI.
LOCATION. One mile above Waiehu Falls and about 7 miles northeast of Lihue.RECORDS AVAILABLE. December 10, 1911, to June 30, 1917.GAGE. Friez water-stage recorder.DISCHARGE MEASUREMENTS. Made from cable.CHANNEL AND CONTROL. One channel at all stages; straight for 600 feet above and
below station; right bank steep and high; left bank slopes gently. Controlcomposed of gravel and small boulders; somewhat shifting.

ISLAND OF KAUAI. 51
EXTREMES OP DISCHARGE. Maximum stage recorded during period of record, 15.1feet at 6 p. m. December 18,1916 (discharge, computed from extension of ratingcurve, approximately 11,000 million gallons per day, or 17,000 second-feet);minimum stage recorded, 3.09 feet February 14 and 15,1912 (discharge, 2.9 milliongallons per day, or 4.5 second-feet).
Minimum stage recorded during year, 2.85 feet September, May, and June(discharge, 26 million gallons per day, or 40 ssecond-feet).
DIVERSIONS. Several diversions above station for irrigation and power development. REGULATION. By diversions above station. UTILIZATION. Water going to waste, except a small amount used for irrigation of rice
and taro. ACCURACY. Discharge ascertained from well-deined rating curve and a continuous
gage-height record. Records good for all stages except extreme floods, for whichthey are fair.
Discharge measurements of South Fork of Wailua River near Lihue, Kauai, during theyear ending June SO, 1917.
Date.
July Oct. Nov
Dec.
Jan. Feb. Mar
Apr June
22......24...... 3......5......
22......91
20......9......8......
29......5. .....
29......
Made by
W. V. Hardy. ...........................................
.....do......--..-.----......-.-..........-............-...D. E. Horner. ................................................do.........................................................do.. ........................................ ̂ .......-.....do.........................................................do...................................................... ...do.. ...... -..-.-....-.-.....-.-.............-.-......-W. V. Hardy ............................................
Gage height (feet).
3.42 4.46 3.75 4.11 4.02 6.25 5.25 3.30 2.99 3.64 3.32 2.90
Discharge.
Second- feet.
108 419 192 304 268
1,300 687 104 54
161 118
47
Million gallons
per day.
70 271 124 197 173 840 444 67 35
104 76 30
Daily discharge, in million gallons, of South Fork of Wailua River near Lihue, Kauai, for the year ending June SO, 1917.
Date.
2..............3. ............ .4..............5..............
6..............7..............8..............9..............
10..............11..............12..............13..............14..............15..............16..............17..............18..............19..............20. .............21..............22. .............2J.. ............24..............25. .............
26..............27..............28..............29..............30..............31..............
July.
242136110222102
82766565656588
163212118154242202
95127118
76605045
5088ftfl
556560
Aug.
50110110145
8865nc
888860KK
55KA
55OAO
767095
102110
8865557060EC
55KA
504137
Sept.
3741332926264133
5537
3733
2626Ofi
2641554537
AK
136QQ
70197
^962859491 09
118
Oct.
88766560
1 no
767676*7fi
8270767fi
7695
182oneOAO
136145296516182
KKf\
601OAO
Nov.
136127320oco
1634fiO
43 Q999
344999
1 00
1 70
1 AK
1 79
636oeo
999
9*191 QO
1 S9
274OOA
91 9OQfi
cc7
726
Dec.
396320263584308285788296
232192OAO
91 9
182163OAO
OAO
1,540QCft
904904618Kqq
192136
9ft9
454252192
Jan.
1821923442632961721361271101101 ft9
8800
767fi
01 O
4541 no
424339
15412714591 9
1(19QC
1(191 AO
8876
Feb.
764541361271821188876656560558276605550
1 no
656560606060
6060KK
Mar.
50505050%n41fin45
3207676
136oeo
3961,620
469344232OKO
1,380726 3AA
252
95
Apr.
136102102
7670aft
5555655560
136182
70
1366555KA
4137
8811065
136
88766555
202
May.
>7
3737333726262629264160
212
June.
136154136110202584296344
192154197
10282
118182454
102824l >7
414137
00
qq3390
26
NOTE. Discharge determined from, well-defined rating curve. Gage-height record unreliable on days for which discharge is not given.

52 SURFACE WATER SUPPLY OP HAWAII, 1916-17.
Monthly discharge of South Fork of Wailua River near Lihue, Kauai, for the year endingJune 30, 1917.
Month.
July.................................
November
May 6-18. ...........................
Discharge.
Million gallons per day.
Maximum.
242 202 396 601 726
1,850 454 454 202 212 584
Minimum.
45 37 26 60
127 136
76 50 37 26 26
Mean.
108 77.3 80.3
174 298 450 171 95.1 87.6 48.2
139
Second- feet
(mean).
167 120 134 269 461 696 265 147 136 74.6
215
Total run-off.
Million gallons.
3,360 2,400 2,410 5,380 8,940
14,000 5,300 2,660 2,630
627 4,040
Acre- feet.
10,300 ' 7,350
7,390 16,600 27,400 42,800 16,300 8,170 8,070 1,920
12,400
HANAMAULU DITCH NEAR LIHUE, KAUAI.
LOCATION. In flume 180 feet below point where Kauai Electric Co.'s power linecrosses the South Fork of Wailua River, about 6 miles northwest of Lihue.
RECORDS AVAILABLE. July 1, 1910, to June 30, 1917. GAGE. Vertical staff. New datum September 30, 1911. DISCHARGE MEASUREMENTS. Made in flume. CHANNEL AND CONTROL. Wooden flume; straight for 20 feet above and below gage.
Control is rock section at end of flume; probably permanent. EXTREMES OP DISCHARGE. Maximum stage recorded during year, 2.56 feet at 1.15
p. m. July 17 (discharge, 27 million gallons per day, or 42 second-feet). 1910-1917: Maximum stage recorded, 2.80 feet August 6, 1913 (discharge, 36
million gallons per day, or 56 second-feet); ditch occasionally dry. DIVERSIONS. Ditch diverts part of flow of South Fork of Wailua River. REGULATION. By head gates.UTILIZATION. For irrigation of sugar cane and for domestic supply. ACCURACY. Gage read once daily. Records fair for all stages.
Discharge measurements of Hanamaulu ditch near Lihue, Kauai, during the year endingJune 30, 1917.
Date.
July 21........
Nov. 19.......22.......
21.......
6........8........0
Mar. 27.......Apr. 3........
Made by
.....do...................................................W. V. Hardy. ............................................... .do ........................................................do...................................................
.....do...................................................
.....do...................................................
.....do...................................................
.....do...................................................
.....do...................................................
.....do...................................................
.....do...................................................W.V. Hardy............................................
Gage height (feet).
2.40 2.39 1.29 1.02 .78 .55 .62
2.00 .86
1.24 .92
.48 2.04
Discharge.
Second- feet.
36 30 14 8.5 6.3 3.4 4.6
28 5.5
10.3 7.4
19 2.7
27
Million gallons
per day.
24 19 8.8 5.5 4.0 2.2 3.0
18 3.6 6.7 4.8
12 1.8
17
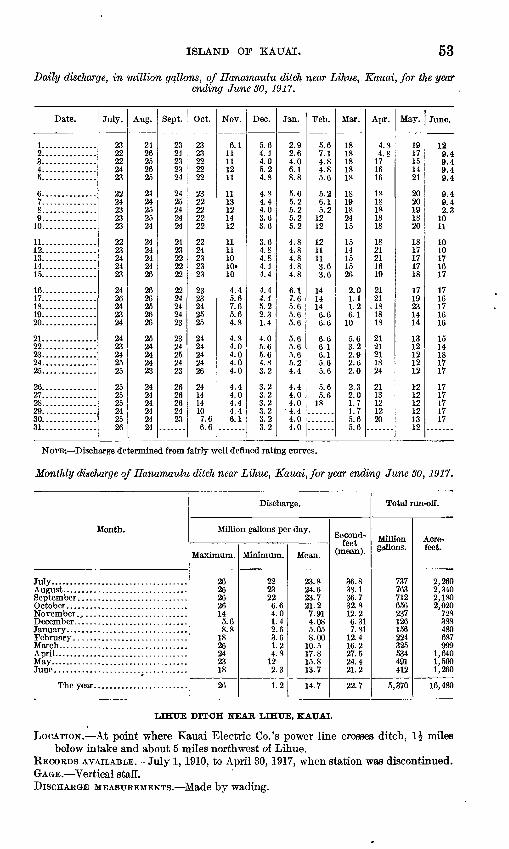
ISLAND OF KAUAI. 53
Daily discharge, in million gallons, of Hanamaulu ditch near Lihue, Kauai, for the yearending June SO, 1917.
Date.
1..............2..............3..............
5..............
6..............7..............8..............
10..............
11..............12..............13..............14..............15..............
16..............17..............18..............19..............20..............
21..............22..............23..............24..............25..............
26..............27..............28..............29..............30..............31..............
July.
2322222423
22242390
23
2223242423
2426242324
2423242525
252525242526
Aug.
2426252625
2424252524
2424242426
2626252626
2524242423
242424242494
Sept.
2324232324
2425242424
2423222222
22" 24
242423
9124252423
2626262490
Oct.
2323222222
2322222222
2224232323
23OQ
242525
2424242426
241414107.66.6
Nov.
6.111
1211
1113121412
11111010»10
4.45.67.65.64.8
4.84.04.04.04.0
4.44.04.44.46.1
Dec.
5.64.44.05.24.8
4.84.44.03.63.6
3.64.84.84.44.4
4.44.45.22.31.4
4.05.65.64.83.2
3.23.23.23.23.23.2
Jan.
2.92.64.06.18.8
5.65.25.25.25.2
4.84.84.84.84.8
6.17.65.65.65.6
5.65.65.65.24.4
4.44.04.0
' 4.44.04.0
Feb.
5.67.14.84.85.6
5.26.15.2
1919
1211113 63.6
1414146.66.6
6.66.16.15.65.6
5.65.618
Mar.
1818181818
18191894.
15
1514151526
2.01.41.26.110
5.63.29 Q2.62.0
9 32.01.71.75.65.6
Apr.
4.84.8171616
1818181818
1821211619
2121
-181818
2121211824
2113121220
May.
1917151421
2020191820
1817171718
1710231414
1312121212
121212121 Q
12
June.
129 AQ 49.49.4
9 A
9 A
2.31011
1010171617
1716171616
1514181717
1717171717
NOTE: Discharge determined from fairly well defined rating curves.
Monthly discharge of Hanamaulu ditch near Lihue, Kauai, for year ending June SO, 1917.
Month.
July...................................
April..................................May...................................
Discharge.
Million gallons per day.
Maximum.
26 26 26 26 14 5.6 8.8
18 26 24 23 18
26
Minimum.
22 23 22 6.6 4.0 1.4 2.6 3.6 1.2 4.8
12 2.3
1.2
Mean.
23.8 24.6 23.7 21.2
7.91 4.08 5.05 8.00
10.5 17.8 15.8 13.7
14.7
Second- feet
(mean).
36.8 38.1 36.7 32.8 12.2 6.31 7.81
12.4 16.2 27.5 24.4 21.2
22.7
Total run-off.
Million gallons.
737 763 712 656 237 126 156 224 325 534 491 412
5,370
Acre- feet.
2,260 2,340 2,180 2,020
728 388 480 687 999
1,640 1,500 1,260
16,480
LIHT7E DITCH NEAR LIHUE, KATTAI.
milesLOCATION. At point where Kauai Electric Co.'s power line crosses ditch,below intake and about 5 miles northwest of Lihue.
RECORDS AVAILABLE. July 1, 1910, to April 30, 1917, when station was discontinued. GAGE. Vertical staff. DISCHARGE MEASUREMENTS. Made by wading.

54 SURFACE WATER SUPPLY OF HAWAII, 1916-17.
CHANNEL AND CONTROL. Channel cut in clay and gravel; ditch clean with low grade. Stage-discharge relation sometimes affected by backwater caused by inflow of Kanaha ditch 260 feet below gage.
EXTREMES OP DISCHARGE. Maximum stage recorded during period of record, 1.6 feet April, May, and June, 1916 (discharge, 14 million gallons per day, or 22 second- feet); ditch occasionally dry.
DIVERSIONS. Part of flow diverted above station into ditch at lower level.REGULATION. By head gates.UTILIZATION. Irrigation of sugar cane and for domestic supply.ACCURACY. Gage read once daily. Eating curve well defined. Records fair for all
stages.
Discharge measurements of Lihue ditch near Lihue, Kauai, during the year ending June 30,1917.
Date.
July 21 Aug. 4
23 Oct. 13 Nov. 19
19 Dec. 21 Jan. 17
Made by
W. V. Hardy ..................................................D. E. Horner. . ................................................W. V. Hardy. ......................................................do...............................................................do..........................................................D. E. Horner .......................................................do..........................................................
Gage height (feet).
1.38 1.51 1.50 1.40 .80 .86 .59 .45
Discharge.
Second feet.
11.1 12.5 11.7 12.0 3.4 3.8 1.1 .6
Million gallons per day.
7.2 8.1 7.6 7.8 2.2 2.5 .7 .4
Daily discharge, in million gallons, of Lihue ditch near Lihue, Kauai, for the year endingJune 30, 1917.
. Date.
2...........................3...........................4...........................5...........................
6...........................7...........................8...........................9...........................
10...........................
11...........................12...........................13...........................14...........................15...........................
16...........................17...........................18...........................19...........................20...........................
21...........................22...........................23...........................24...........................25...........................
26...........................27...........................28...........................29...........................30...........................31...........................
July.
& 08.48.49.48 Q
8.48.48.48.48.4
8.48.48.98.48.4
8.99.48 97.27.2
7 9
6.78 A
8.48.4
8 A
7 Q8.47 87 fi7 8
Aug.
7.27.87 S
8.48 A
8 A
8.48.48.48.4
8 A
8.47.87.88.9
8.47.88.47.87.8
7 9
7.28.48.47.8
8.48.48.48 A
8 A
8 A
Sept.
8.48.48.48.48.4
8.48.98.48.48.9
8.48.47.87.87.8
7.28.48.48.47.8
8 A
8.48 Q
8.47.8
8.48 Q
6.76.26.2
Oct.
8.48.48.47.87.8
7.87.26.26.27.8
8.48.47.87.87.8
7.87.87.87.87.8
7 9
7.27.27.28.4
8.48.48.47 8
Nov.
7.87.87.86.73.6
4.04.44.03.63.2
3.22.82.82.82.8
2.82.42 0
2 42.4
2 A
2.04.04.03.6
4.03.64.04.0
Dec.
4.04.03.64.04.0
4.03.6
3.63.6
3.23.2
3.23.23.22.4.8
1.01.0
1.41.0
.8
.8
Jan.
0.4.6.6.6
.2
.2
Mar.
1.21.01.2
5.76.77.28.47.2
7.87.88.48.4
11.6
Apr.
1.06.25 fT
5.75.2S O
5.27.2
1 97 87.87.28.4
8.47.87 S7 S
7.2
8.48.48.48.48.4
7.77.77.77 9
8.4
NOTE. Discharge determined from well-defined rating curve. not given.
No flow on days for which discharge is

ISLAND OP KATJAI. 55
Monthly discharge of Lihue ditch near Lihue, Kauai, for the year ending June 30, 1917.
Month.
July.................................
November
April (28 days). .....................The period. ...................
Discharge.
Million gallons per day.
Maximum.
9.4 8.9 8.9 8.4 7.8 4.0
.6 11.6 8.4
Minimum.
6.7 7.2 6.2 6.2 2.0 .8 .2
1.0 1.0
Mean.
8.30 8.15 8.12 7.77 3.87 2.57
.43 6.35 7.12
Second- feet
(mean).
12.8 12.6 12.6 12.0 5.99 3.98
.67 9.82
11.0
Total run-off.
Million gallons.
257 252 244 225 116 77 3
83 200
1,460
Acre- feet.
790 775 748 692 356 237
9 253 612
4,470
NOTE. See footnote to daily-discharge table.
NORTH FORK OF WAILTTA RIVER AT ELEVATION 650 FEET, NEAR LIHTTE, KATTAI.
LOCATION. One mile above intake of Kanaha ditch and 10 miles northwest of Lihue.RECORDS AVAILABLE. September 21, 1914, to June 30, 1917. For old station at
elevation 500 feet, December 28, 1910, to September 25, 1914.GAGE. Stevens water-stage recorder.DISCHARGE MEASUREMENTS. Made by wading or from cable.CHANNEL AND CONTROL. One channel at all stages; straight for 80 feet above and 50
feet below gage; right bank steep and high; left bank slopes gently. Control composed of boulders; fairly permanent.
EXTREMES OF DISCHARGE. Maximum stage recorded during year, 7.45 feet at 11.45 p. m. December 18 (discharge, approximately 1,600 million gallons per day, or 2,480 second-feet); minimum stage recorded, 1.35 feet September 14-16 (discharge, 19 million gallons per day, or 29 second-feet).
Maximum stage recorded during period of record, 9.5 feet at 6.30 p. m. Septem ber 26, 1914 (discharge, computed from extension of rating curve, approximately 2,200 million gallons per day, or 3,400 second-feet); minimum stage recorded, 1.3 feet April, 1916 (discharge, 13 million gallons per day, or 20 second-feet).
DIVERSIONS. None above station.REGULATION. None.UTILIZATION. Part of flow is diverted for irrigation of sugar cane but most of it is
wasted.ACCURACY. Determinations based on well-defined rating curves and a continuous
record of gage height. Records good for all stages.
Discharge measurements of North Fork of Wailua River at elevation 650 feet, near Lihue, Kauai, during the year ending June 30, 1917.
Date.
Aug. 19 20 21 24
Sept. 24 Oct. 13 Nov. 6
7 Dec. 19
19 20
Tan. 19 Mar. 27 Apr. 4 June 27
Made by
.....do..........................................................
.....do..........................................................
.....do..........................................................W.V. Hardy... ......................................................do...............................................................do...............................................................do..........................................................
.....do..........................................................
.....do..........................................................
.....do..........................................................
.....do..........................................................W.V. Hardy..................................................
Gage height (feet).
2.05 1.90 1.80 1.58 2.00 1.62 1.48 2.04 2.55 2.49 2.13 4.10 2.22 1.52 1.47
Discharge.
Second- feet.
96 73 62 40 94 57 45
103 198 182 115 707 135
42 46
Million gallons
per day.
62 47 40 26 61 37 29 67
128 118
74 457
- 87 27 30

56
Daily di
SUBFACE WATEK SUPPLY OP HAWAII, 1916-17.
'e, in million gallons, of North Fork of Wailua River at elevation of 650 feet near Lihue, Kauai, for the year ending June 80, 1917.
Date.
1..............2..............3..............4..............5..............
6..............7..............8..............9..............10..............
11..............12..............13..............14..............15..............
16..............17..............18..............19..............20..............
21..............22..............23..............24..............25..............
26..............27..............28..............29..............30..............31..............
July.
045660884Q
4238383535
354960R449
561061005682
68463835sf;
35563842
38
Aug.
35686488
' nfi
4260404635
3232303568
354fi464649
38323030OO
303028OK
OK
OO
Sept.
9Q282321O1
2130213825
2321211Q1Q
19OK
323225
28604O4fi52
113106100QQ
60
Oct.
4Q
3838354Q
5238323235
3035383535
42
Nov.
77044938
Dec.
72166776877
5264645249
5264
31915877
646417419179
6052681498264
Jan.
8279
11382
6049464242
3835323030
9419168
282120
64529410056
494246383532
Feb.
38106423838
3532323232
3030463530
3028773832
3028282828
252525
Mar.
2525253230
32493210052
5688150248436
22812877100358
1821007282100
20010064524946
Apr.
RA
4fi564238
3532323832
4668
1136488
6446423532
3052fift3546
32303028
113
May.
10640
3860qo
3028282835
2828252825
3246135182
June.
30302828
NOTE. Discharge determined from well-defined rating curves applicable July 1 to Sept. 28 and Sept. 29 to June 30. No record on days for which discharge isnot given.
Monthly discharge of North Fork of Wailua River at elevation 650 feet near Lihue, Kauai, for the year ending June SO, 1917.
Month.
July.................................
October 1-16............. ...........December 6-31 ............... ̂ .....
April................................May 1-19. ...........................
Discharge.
Milhon gallons per day.
Maximum.
106 88
113 52
319 282 106 436 113 182
Minimum.
35 23 # 30 49 30 25 25 28 25
Mean.
53.7 41.3 39.6 38.3 94.0 71.9 36.4
107 49.0 50.7
Second- feet
(mean).
83.1 63.9 61.3 59.3
145 111 56.3
166 75.8 78.4
Total run-off.
Milhon gallons.
1,660 1,280 1,190
613 2,440 2,230 1,020 3,320 1,470
963
Acre- feet.
5,110 3,930 3,650 1,880 7,500 6,840 3,130
10,200 4,510 2,960
KANAKA DITCH NEAR LIHUE, KAUAI.
LOCATION. 500 feet above point where Kauai Electric Co.'s power line crosses ditch,and about 9 miles north of Lihue.
RECORDS AVAILABLE. August 6, 1910, to June 30, 1917. GAGE. Vertical staff. New datum May 28, 1913. DISCHARGE MEASUREMENTS. Made in flume 100 feet above gage.

ISLAND OF KATJAI. 57
CHANNEL AND CONTROL. Cut in soft lava rock; straight for 30 feet above and 10 feetbelow gage. Control composed of soft lava rock; fairly permanent betweentimes of cleaning ditch.
EXTREMES OP DISCHARGE. Maximum stage recorded during year, 2.45 feet at 11a. m., September 27 (discharge, 18 million gallons per day, or 28 second-feet);no flow March 17-25.
Maximum stage recorded during period of record, 2.6 feet July 24-26, 1913(discharge, 22 million gallons per day, or 34 second-feet).
DIVERSIONS. Ditch diverts part of flow of North Fork of Wailua River. REGULATION. By head gates.UTILIZATION. For irrigation of sugar cane and for domestic supply. ACCURACY. Records based on well-defined rating curves; good for low and medium
stages; those for high and fluctuating stages may be somewhat in error as gage isread only once daily.
Discharge measurements of Kanaka ditch near Lihue, Kauai, during the year endingJune 30, 1917.
Date. '
Nov. 7 Dec. 20 Feb. 7
7 7
Mar. 28 June 27
Made by
W.V. Hardy.... ..............................................
.....do..........................................................
.....do..........................................................
.....do..........................................................
.....do..........................................................
.....do..........................................................
Gage height (feet).
0.71 .80 .47 .66 .98 .50
1.78
Discharge.
Second- feet.
8.1 8.2 3.8 7.0
10 4.2
23
Million gallons, per day.
5.2 5.3 2.4 4.5 6.5 2.7
15
Daily discharge, in million gallons, of Kanaka ditch near Lihue, Kauai, for the yearending June 30, 1917.
Date.
2..............3..............
5..............6..............
8..............9..............10..............11..............12..............1314..............15..............16..............17..............18.-..-.-.......1020..............21..............22. .............9324..............25..............26..............27..............28..............29..............30..............31..............
July.
151514161415141414141315161615161614141515131313141516151514
Aug.
141615161515141414
131514131616151515161514
1414
1413141310
Sept.
131614141413161416161515141414141716171615lg1716151518171615
Oct.
13. 13
1616161515151515151515141616161616161616151617141517141310
Nov.
109.89.8108.88.89.28.47.47.47.07.47.4-7.47.47.47.48.87.47.06.76.06.05.66.06.05.66.05.66.7
Dec.
6.76.46.46.76.46.48.86.76.46.46.06.07.06.06.06.05.66.75.35.35.35.35.38.15.64.64.64.64.65.04.6
Jan.
4.24.24.23.96.05.35.05.04.64.64.64.64.64.66.78.47.46.06.46.06.05.66.76.05.65.65.65.35.35.35.0
Feb.
4 66.75.65.63.93.26.76.46.05.65.35.04.64.64.23.96.06.76.76.45.65.04.23.93.97.47.46.7
Mar.
7.0111111111315131414141414157.83.6
1.83.96.04.64.27.4
Apr.
7.07.88.87.47.06.76.76.76.4121315161416
151413131214161615161514141414
May.
1713121614131313121513121212
- 14
13161616141515151414141515141615
June.
151415141414151615161515131616171615161615141616151514141414
NOTE. Daily discharge determined from well-defined rating curves applicable July 1 to June 7 and June 8-30. No flow Mar. 17-25.

58 SURFACE WATER SUPPLY OF HAWAII, 1916-17.
Monthly discharge of Kanaka ditch near Lihue, Kauai,for year ending June 30, 1917.
Month.
July... .............................
November. ............. ....
February. ..........................March (22 days).. . ..................
May.................................
The period. ...................
Discharge.
Million gallons per day.
Maximum.
16 16 18 17 10 8.8 8.4 7.4
15 16 17 17
Minimum.'
13 13 13 10 5.6 4.6 3.9 3.2 1.8 6.4
12 13
Mean.
14.6 14.4 15.3 15.1 7.48 5.96
5.43 5.42 9.83
12.2 11.1 15.0
Second- feet
(mean).
22.6 22.3 23.7 23.4 11.6 9.22 8.40 8.39
15.2 18.9 21.8 23.2
Total run-off.
Million gallons.
454 447 458 467 224 185 168 152 216 366 438 450
4,030
Acre- feet.
1,390 1,370 1,410 1,440
689 567
. 517 466 664
1,120 1,340 1,380
12,400
NOTE. See footnote to daily-discharge table.
EAST BRANCH OF NORTH FORK OF WAILUA RIVER NEAR LIHUE, KAUAI.
LOCATION. 400 feet above confluence with North Fork, 600 feet above gaging station on North Fork, and about 8 miles north of Lihue.
RECORDS AVAILABLE. July 27, 1912, to June 30, 1917.GAGE. Stevens water-stage recorder December 31, 1914, to June 30, 1917; staff 250
foet below present site July 27,1912, to September 30, 1914.DISCHARGE MEASUREMENTS. Made by wading or from cable.CHANNEL AND CONTROL. One channel at all stages; straight for 30 feet above and 120
ft jet below gage; banks low and wooded. Control composed of boulders; shifting.EXTREMES OP DISCHARGE. Maximum stage recorded during period of record, 8.9
feet at 8 a. m. March 3, 1916 (discharge, approximately 3,000 million gallons per day, or 4,640 second-feet); minimum stage recorded, 1.6 feet March, 1915 (dis charge, 7 million gallons per day, or 11 second-feet).
Maximum stage recorded during year, 6.85 feet, December 18 (discharge, approximately 1,700 million gallons per day, or 2,630 second-feet); minimi]m stage recorded, 1.75 feet October 4 (discharge, 8.5 million gallons per day, or 13 second-feet).
DIVERSIONS. None.REGULATION. None.UTILIZATION. After joining North Fork of Wailua River part of the water is diverted
for irrigation of sugar cane, but most of it is wasted.ACCURACY. Records based on well-defined rating curve; good for all stages.
Discharge measurements of East Branch of North Fork of Wailua River near Lihue, Kauai, during the year ending June 30, 1917.
Date.
Aug. 16 18 24
Sept. 4 24
Oct. 13 Nov. 7
8 Dec. 20
21 22
Jan. 18 June 27
Made by
D. E. Horner. .... ........... . . ..........................do...............................................................do..........................................................W. V. Hardv. ......................................................do...............................................................do...............................................................do...............................................................do..........................................................D. E. Horner. ......................................................do...............................................................do...............................................................do...............................................................do..........................................................
Gage height (feet.)
2.00 2.10 1.96 1.87 2.82 2.00 2.55 2.39 2.44 2.32 2.24 2.28 2.02
Discharge.
Second- feet.
30 40 26 20
187 31
108 82 97 62 59 69 36
Million gallons
per day.
20 26 17 13
121 20 70 53 62 40 38 45 23

ISLAND OF KATJAI. 59
Daily discharge, in million gallons, of East Branch of North Fork of Wailua River near Lihue, Kauai, for the year ending June 30,1917.
Date.
1... .......2..........3..........4..........5..........6..........7..........8..........9..........
10..........11..........
13..........14..........15..........16..........17..........18..........19..........20..........91
22..........23..........9d
25..........26..........26..........28.........'.29..........30..........01
July.
KA
1(\
384°.
^.ft
2323on2020209A
3443Oft
26665134384830269ft
20
182020
Aug.
239**
30sn
3023201820
202020201818
Sept.
1012121 o
121212151518151919
1219
182020431815262326203020202012
Oct.
19
10108.5
10151219
121010101 9
Dec.
M
82
fifi
48603834383830
300KA
481516048/JO
38140151826054
Jan.
48fin907454
4338QJ
11
3434262323TO
fifi
129KA
129
54/JO
349043
3838
Feb.
2020202020181823181815
Mar.
38
383434
Apr.
4343543830
26262623262323262630232023302026202023343023232020
May.
20202023232323232323
262623232330346034
2623202020
181818182326
June.
2626262623
6643302626232320182026262623TO
2323232623
2393
2020
NOTE. Discharge determined from rating curve well denned below 150 million gallons per day. No record on days for which discharge is not given.
Monthly discharge of East Branch of North Fork of Wailua River near Lihue, Kauai, for the year ending June 30, 1917.
Month.
July 1-28......... ...................
October 1-13 ........................
April...............................May................................
Discharge.
Million gallons per day.
Maximum.
66 30 43 15
129 23 54 60
Minimum.
18 18 10 8.5
23 15 20 18
Mean.
31.1 22.2 17.5 11.0 54.6 19.1 27.3 24.4
Second- feet
(mean).
48.1 34.3 27.1 17.0 84.5 29.6 42.2 37.7
Total run-off.
Million gallons.
870 333 524 144
1,470 210 818 756
Acre- feet.
2,670 1,020 1.610
439 4.520
645 2,510 2,320
KAFAA RIVER NEAR KEALIA, KATTAI.
LOCATION. A quarter of a mile below confluence of two main branches, 1J miles aboveintake of Kapabi ditch and 6 miles northwest of Kealia.
RECORDS AVAILABLE. June 23,1915, to June 30,1917. July 23,1910, to May 16,1915,at old station about a mile downstream.
GAGE. Priez water-stage recorder; July 23,1910, to May 16,1915, vertical staff abouta mile below present site.
DISCHARGE MEASUREMENTS. Made by wading or from cable. CHANNEL AND CONTROL. One channel at all stages; straight for 100 feet above and
below gage; right bank vertical; left bank high with gentle slopes. Controlfairly permanent between extreme floods.

60 SURFACE WATER SUPPLY OF HAWAII, 1916-17.
EXTREMES OP DISCHARGE. Maximum stage recorded at present site, 9.2 feet at 1 a. m. March 4, 1916 (discharge, approximately 850 million gallons per day, or 1,320 second-feet); minimum stage recorded, 1.65 feet August 28 and 29,1915 (discharge, 11 million gallons per day, or 17 second-feet).
Maximum stage recorded during year, 8.75 feet at 12.15 a. m. March 20 (discharge approximately 800 million gallons per day, or 1,240 second-feet); minimum stage recorded, 1.7 feet September and March (discharge, 12 million gallons per day, or 18.6 second-feet).
Maximum stage recorded during period of record at old staff gage site, 13 feet, ascertained from flood marks, December 3,1914 (discharge, roughly estimated by extension of previous rating curve, 1,200 million gallons per day, or 1,860 second- feet); minimum stage recorded, 1.35 feet February, March, and April, 1914 (dis charge, 6.2 million gallons per day, or 9.6 second-feet).
DIVERSIONS. Very small irrigation ditch diverts water above station.REGULATION. Practically none.UTILIZATION. For irrigation of sugar cane and for domestic supply.ACCURACY. Records fair for entire year.
Discharge measurements »of Kapaa River near Kealia, Kauai, during the year ending June SO, 1917.
Date.
Aug. 3 Nov. 25 Dec. 28
Made by
W.V. Hardy.... ..............................................
Gage height (feet).
2.07 2.85 3.13
Discharge.
Second- feet'.
31110 149
Million gallons per day.
2071 96
Daily discharge, in million gallons, of Kapaa River near Kealia, Kauai, for the yearending June 30, 1917.
Date.
1.. ............2.. .......... ..3..............4..............
6..-.....-.---.7----....---...8..............g10....--......-.11..............191^?
14..............IE;
16.. ...... ......17..............18..............19..:...........20..............21..............22. .............23..............24..............25..............26. .............27..............28. .............9Q
30qi
July.
78243728171614141414162431341818484020264020171716162618181818
Aug.
17312237201726201816141414183417202026221816141413131313
13iq
Sept.
121612121212141313141414131814171420201617342018182640342218
Oct.
17161414181714161816161414141616224048242024266548222840242020
Nov.
161818402622486534285628222031223197568316448282448442640
10774
Dec.
4837314852561123740402644563126343414278373128487431262652883422
Jan.
18204024342017161417181414131378782683442218242420261818171614
Feb.
20311716141413131313131314131313131814141713131313131313
Mar.
13121220172228177428284010711216483483456
22413256342840342424222299
Apr.
443152262422222026242424242626312220202018342020262020202056
May.
28222018181717171717171717182024263148832624242224284074V7
6540
June.
042831OO
374878444R
3728262624486511237312424222020202020202018
NOTE. Discharge determined from fairly well defined rating curves applicable July 1 to Nov. 21 and Nov. 22 to June 30. Discharge Oct. 29 to Nov. 4 determined from records of flow of Kapahi ditch.

ISLAND OF KAUAI. 61
Monthly discharge of Kapaa River near Kealia, Kauai, for year ending June 30, 1917.
Month.
July................................
May................................
Discharge.
Million gallons per day.
Maximum.
78 37 40 65
164 142 83 31
224 56 83
112 224
Minimum.
14 13 12 14 16 22 13 13 12 18 17 18
12
Mean.
24.4 18.6 17.9 23.3 45.5 47.4 26.4 14.7 50.9 26.1 28.9 34.6
30.0
Second- feet
(mean).
37.8 28.8 27.7 36.1 70.4 73.3 40.8 22.7 78.8 40.4 44.7 53.5
46.4
Total run-off.
Million gallons.
755 577 537 721
1,360 1,470
818 411
1,580 782 896
1,040
10,900
Acre- feet.
2,320 1,770 1,650 2,220 4,190 4,510 2,510 1,260 4,840 2,400 2,750 3,190
33,600
KAPAHI DITCH NEAR KEALIA, KAUAI.
LOCATION. 500 feet below intake and about 4 miles west of Kealia.RECORDS AVAILABLE. April 15, 1909, to May 2, 1914; May 10, 1915, to June 30,
1917.GAGE. Stevens 8-day water-stage recorder, installed May 10, 1915, to replace orig
inal Watson recorder.DISCHARGE MEASUREMENTS. Made by 20-foot sharp-crested weir immediately be
low gage.CHANNEL AND CONTROL. Channel straight for 50 feet above weir.EXTREMES OF DISCHARGE. Maximum stage recorded during period of record, 1.98*
feet at 2 a. m., September 16, 1915 (discharge, 120 million gallons per day, or 186 second-feet); water shut off November 23 and 24, 1916.
DIVERSIONS. Ditch diverts part of flow of Kapaa River.REGULATION. Flow regulated by head gates.UTILIZATION. For irrigation of sugar cane and for domestic supply.ACCURACY. Conditions at weir fairly good. Records fair for all stages.
1 Determinations of maximum discharge supersede those published in Water-Supply Paper 430, which were based on extension of rating curve.

62 SURFACE WATER SUPPLY OF HAWAII, 1916-11.
Daily discharge, in million gallons, of Kapahi ditch near Kealia, Kauai, for the yearending June 30, 1917.
Date.
1..........2. .........3..........4..........
6..........7... .......8..........9..........10..........
11..........12..........13..........14..........15..........
16..........17..........ISA........19"........20..........
21..........22..........23..........24..........25..........
26..........27..........28..........29..........30..........31..........
July.
25.220.017 *,
16.5ICO
13.7
11.7n o
U o
12.117 K
OK 0
25.217.5
15.217.5n c
16.517.0
15.21°. 7
13.312.5n o
n o
13.312.913.313.313.3
Aug.
19 t\
18.520.020.0
1 K 0
21.018.518.01 C 0
10 0
1Q 0
12.9ICO
30.8
17.018.01Q ft99 *,
18.0 ICO
13.719 Q19 K
19 *19 Q
12.519 Q
12.512.1
Sept.
11.712.99 7
9 7
9 0
9 0
10.11ft Q10 910.9
10 910.19 7
1 c o
10.9
10.9 ICO
15.210 9
12.9OC 0
15.219 Q19 Q
20.0
27.8n c
13.7
Oct.
12.1n o
10.5O 7
10 7
12.1.10 510.514 910 9
10 9
10.110.110.9
10 9n c
27.833.8n c
15.217.518.539.833.8
n c
22.520.016.015.2
Nov.
19 O
14.2 go w
99 ^
17.5
10 0
11.711.711.7 ICO
19 Q1 c o
10 9ft Q
ft Q
8.59.38 a8 a
9 0
O K
10 9
7.85.34.44.74.1
Tec.
5.37.06.46.76.7
15.28.9
19 O9 3g g
8 Q
8.97.06.46.4
6.46.05.35.36.4
6.76.76.46.76.4
7.08 n
7.05.35.05.0
Jan.
5.05.08 a
10.58 n
8.911.711.711.7
8 9
7.47.47.47.47.4
7.86.4
5 0
5.35.66.76.76.7
6.710.912.1
8 97.47.4
Feb.
7.47.87.47.08 a
10.110.112.912.919 Q
12.111.710 911.711.7
8.98.9
12.912.910.9
10.919 Q
12.111.711.7
11.712.112.5
Mar.
11.711.711.716.0
15.215.214.714.216.0
16.015.210.98.58.1
6.76.46.4
10.99 0
10.98.17.05.35..3
12.916.016.015.215.2
Apr.
10.98.18 9
10.915.2
13.713.75.34.47.0
16.015.215.212.910.9
11.311.712.512.912.1
10.917.514.212.511.7
11.711.711.7
June.
16.016.0
15.615.6
15.2
11.7n o
W Q
10.511.311.310.5
NOTE. Fischarge determined by weir formula, Q=3.33 LHf. No record on days for which discharge is not given, except Nov. 23 and 24, when water was shut off.
Monthly discharge of Kapahi ditch near Kealia, Kauai,for the year ending June 30,1917.
Month.
July................................
April 1-28. ..........................
Discharge.
Million gallons per day.
Maximum.
25.2 30.8 27.8 39.8 22.5 15.2 12.9 16.0 17.5
Minimum.
11.3 12.1 9.3 9.7 4.1 5.0 7.0 5.3 4.4
Mean.
15.5 16.4 13.8 16.5 11.2 7.27
10.9 11.5 11.8
Second- feet
(mean).
24.0 25.4 21.4 25.5 17.3 11.2 16.9 17.8ias
Total run-off.
Million gallons.
480 509 413 510 314 225 306 356 331
Acre- feet.
1,470 1.560 1.270 1.570
962 692 937
1,090 1,010
NOTE. See footnote to daily-discharge table.

ISLAND OF KAUAI. 63
ANAHOLA RIVER NEAR KEALIA, KATJAI.
LOCATION. About a quarter of a mile above dam at Kiokala and 6 miles northwest of Kealia.
RECORDS AVAILABLE. August 22 to November 2, 1910; December 28, 1912, to June 30, 1917. Fragmentary record December 15, 1910, to December 28, 1912, at dam a quarter of a mile below present site.
GAGE. Friez water-stage recorder August 22 to November 2, 1910, and December 28, 1912, to June 30, 1917. From December 15, 1910, to December 28, 1912, an in clined staff.
DISCHARGE MEASUREMENTS. Made by wading or from footbridge.CHANNEL AND CONTROL. One channel at all stages; straight for 75 feet above and
below gage; right bank steep and high and covered with underbrush; left bank low for about 40 feet from low-water channel then rises abruptly. Control composed of boulders; shifting.
EXTREMES OF DISCHARGE. Maximum stage recorded during year, 8.35 feet at 1 a. m. March 20 (discharge, approximately 850 million gallons per day, or 1,320 second- feet); minimum stage recorded, 1.6 feet, September and October (discharge, 3.6 million gallons per day, or 5.6 second-feet).
Maximum stage recorded during period of record, 12.9 feet at 7.30 p. m. Septem ber 26, 1914 (discharge, estimated from extension of rating curve, approximately, 1,450 million gallons per day, or 2,240 second-feet); minimum stage recorded, 1.3 feet February 27 and 28, 1915 (discharge, 2 million gallons per day, or 3.1 second- feet).
DIVERSIONS. Part of flow diverted 3 miles above station.REGULATION. None except by diversions.UTILIZATION. Irrigation of sugar cane.ACCURACY. Determinations based on fairly Well defined rating curves and continu
ous gage-height record. Records fair below 120 million gallons per day.
Discharge measurements of .
Date.
Aug. 3 Oct. 18 Nov. 21 Dec. 6
27 June 7
9
W.V. Hardy...............do......................do......................do.................D. E. Horner...............do......................do.................
inahola River near Eealia, Kauai, during the year ending June 30, 1917.
Made by
Gage height.
Feet.
1.79 2.05 3.06 2.02 1.92 2.33 1.99
Discharge.
Second- feet.
10 29
139 16 21 47 19
Million gallons per day.
6.5 19 90 10 13 30 12

64 SURFACE WATER, SUPPLY OF HAWAII, 1916-17.
Daily discharge, in million gallons, of Anakola River near Kealia, Kauai, for the yearending June SO, 1917.
Date.
I..............2..............3..............4..............5..............
6..............7... ...........8..............9..............10..............
11..............12..............13..............14..............15..............
16..............17..............18..............19..............20..............
21..............22..............23..............24..............25..............
26..............27..............28..............29..............30..............31..............
July.
148.09.5
117.0
6.06.05.45.45.4
5.46.06.0
168.0
8.09.5
168.08.0
117.06.06.05.4
5.45.45.46.06.05.4
Aug.
4.86.06.09.57.0
5.48.06.07.05.4
4.84.85.45.49.5
6.06.06.06.06.0
6.05.44.84.84.8
4.84.84.84.84.84.8
Sept.
4.24.23.64.24.2
3.6
3.63.63.6
3.6
3.64.23.6
3.63.64.24.24,2
4.26.06.04.84.8
4.26.0
115.44.8
Oct.
4.84.84.24.24.2
4.2
4.24.84.2
3.6
3.65.44.2
4.86.0
148.05 4
7.06.06.0
1812
7.06.06.06.05.45.4
Nov.
5.45.45.46.06.0
5.45-47.06.07.0
8.07.06.0c 48.0
6.0K* A.
461416
11433141114
19
9 c
204618
*
Dec.
1414111416
1860372320
1212231411
1212755523
1816204618
162326O7
3726
Jan.
2020463342
2016161620
1812121111
8011442
11465
V*
29262629
181818291816
Feb.
1418141212
1212119.59.5
9.59.5
11169.5
9 E
Q f.
121116
16119 C
9 C
9.5
Q 5
129.5
Mar.
9.58.08.09.59.5
112637
114
6560
239
14880503742
42231616
14
Apr.
2614161212
1111111111
119.59.5
169.5
9.58.08.07.07.0
7.0169.58.0
11
9.5119.58.0
20
May.
169.59.58.07.0
7.07.07.07.07.0
7.07.07.07.07.0
9 K
Q A
18*>7
55
1 a
12119.59.5
9.51226142018
June.
10
1111119.5
5016129 C
9.59 C
9 cQ A
9.5
qo
46119.59.5
ft n8.0Q A
ft n46
14461419
NOTE. Discharge determined from rating curves fairly well defined below 120 million gallons per day applicable July 1 to Dec. 18, Dec. 19 to Mar. 9, Mar. 18 to June 30. Gage height not recorded Mar. 10-17.
Monthly discharge of Anahola River near Kealia, Kauai, for the year ending June 30,1917.
Month.
July................................
April...............................
Discharge.
Million gallons per day.
Maximum.
16 9.5
11 18
114 97
114 18 26 55 50
Minimum.
5.4 4.8 3.6 3.6 5.4
11 11 9.5 7.0 7.0 8.0
Mean.
7.66 5.79 4.47 6.02
15.7 26.4 31.9 11.6 11.3 13.1 16.3
Second- feet
(mean).
11.98.96 6.92 9.31
24.3 40.8 49.4 17.9 17.5 20.3 25.2
Total run-off.
Million gallons.
238 180 134 187 472 819 '988 326 340 405 488
Acre- feet.
729 551 412 573
1,450 2,510 3,030
997 1,040 1,250 1,500
ANAHOLA DITCH ABOVE KANEHA RESERVOIR, NEAR KEALIA, KATTAI.
LOCATION. At lower end of third tunnel above Kaneha reservoir, 7 miles from Kealia.RECORDS AVAILABLE. May 30, 1915, to June 30, 1917.GAGE. Stevens 8-day water-stage recorder.DISCHARGE MEASUREMENTS. Made from wooden footbridge at gage.CHANNEL AND CONTROL. Channel at gage is short straight stretch of open ditch cut
in firm earth between two tunnels. Control rock section of ditch; probablypermanent.

ISLAND OF KAUAI. 65
EXTREMES OF DISCHARGE. Maximum stage recorded, 3.72 feet at 4.30 a. m. January 26, 1916 (discharge, 53 million gallons per day, or 82 Second-feet); minimum stage recorded, 1.0 foot January 1, 1916 (discharge, 0.9 million gallons per day, or 1.4 second-feet).
DIVERSIONS. Ditch diverts from Anahola River.REGULATION. By head gates. When Kaneha reservoir is full water is turned out of
ditch at spillway just below gage.UTILIZATION. Water is stored in Kaneha reservoir for irrigation of sugar cane and
for domestic supply.ACCURACY. Discharge ascertained from well-defined rating curve and a continuous
gage-height record. Records good except for days when water was turned out at spillway.
Discharge measurements of Anahola ditch above Kaneha reservoir, near Kealia, Kauai, during the year ending June1 30, 1917.
Date.
Oct. 9 Nov. 19 Dec. 26
29 Mar. 8 Apr. 1 May 30
Made by
W.V. Hardy..................................................
.....do.........................................................W.V. Hardy..................................................
.....do.........................................................
Gage height (feet).
1.70 1.84 1.36 .99
' 1.49 1.76 1.53
Discharge.
Second- feet.
11 14 5.9 2.6 7.0
13 7.9
Million gallons
per day.
7.2 9.4 3.8 1.7 4.5 8.5 5.1
Daily discharge, in million gallons, of Anahola ditch above Kaneha reservoir, near Kealia, Kauai, for the year ending June 30, 1917.
Date.
1.. .................2...................3...................4...................5...................6...................7...................8...... .............9...................10...................11...................12...................13...................14...................15...................16...................17...................18...................19. ..................20...................21...................22...................23. ..................24...................25...................26....:..............27...................28....................29...................30...................31...................
July
237.0
14
3.93.43.94.4
- 6.4^ Q
124.44.4
10144.95.48.2
Oct.
3.02.62.62.23.02.21.92.24.92.22.21.92.23.92.22.27.0
15127.09.67.08.2
28166.45.97.08.27.05.4
Nov.
4.97.64.9S Q
7.64 Q
8.2119.65.99.65.94 Q3 Q
8.94.94.4
248.2
107.66.47.68.25.97.69 R
8.2
Dec.
8.28.27.68 Q
7.68 Q
12 10
8.98.26.47.6-9.67.65.97.67.0
. 119.68 Q
7.67.68.28.97.66.43.93.0
3 Q
5.4
Jan.
5.44.44.94 Q5. 96 45.95.44.95.95.94 Q^ Q
3.93.45.93.42.63.94.44 Q
5.44.94.9<\ 4
4.95.46.47.64.93.9
Feb.
3.97.03.93 Qq A
3.43.02.62.62.62.62.63.04.92.62.62.23.93.03.04.42.62.21.91 Q
1.93.43.0
Mar.
1.91.91.94 Q
6.4147.0
183.93.43.48.93.95.93.44.43.49.6
124.44.94.94.44.95.47.06.45.95.45.4
Apr.
9.6129.65.9443.93.94.97.05.45.97.09.6
22139.6
. 4.43.93.43.03.0
104.43.95.43.94.94.43.9
15
May
114.93.93.43.03.02.62.62.62.62.22.22.22.63.04.44.4
1420145.94.43.93.43.03.05.99.67.65.44.4
June
5.44.95.95.94 Q
6.48.27.07.06.45.45.45.44.95.9&28.27.05.9494.43.93.43.03.02.62.63.02.62.2
NOTE. Discharge determined from rating curve well defined below 20 million gallons per day. No record July 4-7 and Nov. 20 and 21. Record sheets July 22 to Sept. 30 lost by observer. Water spilling below gage Nov. 22, 29 and 30, Dec. 1-3, 7-10, 18-31, Jan. 1, 2,16-22. 30 arid 31, Feb. 1-7, 20,21, Mar. 9.13-27, Apr. 2,3, 7-18, and May 19-21.
40532° 18 WSP 465 5

66 SURFACE WATER SUPPLY OF HAWAII, 1916-17.
Monthly discharge of Anahola ditch above Kaneha reservoir near Kealia, Kauai, foryear ending June SO, 1917.
Month.
Discharge.
Million gallons per day.
Maximum.
28 12 7.6 7.0
18 22 20
* 8.2
Minimum.
1.9 3.0 2.6 1.9 1.9 3.0 2.2 2.2
Mean.
6.16 7.63 4.99 3.14 5.86 6.91 5.33 5.13
Second- feet
(mean).
9.53 11.8 7.72 4.86 9.07
10.7 8.25 7.94
Total run-off.
Million gallons.
191 237 155 88
182 207 165 154
Acre- feet.
586 726 475 270 557 636 507 472
NOTE. See footnote to daily-discharge table.
KALIHIWAI RIVER NEAR HANALEI, KAUAI.
LOCATION. At elevation 700 feet, 1 mile east of Kauai Electric Co.'s power line, about 9 miles southeast of Hanalei.
RECORDS AVAILABLE. March 13, 1914, to June 30, 1917.GAGE. Stevens water-stage recorder.DISCHARGE MEASUREMENTS. Made by wading or from footbridge.CHANNEL AND CONTROL. One channel at all stages; straight for 100 feet above and
50 feet below gage; current sluggish at low stages; right bank low and wooded; left bank a high and nearly vertical cliff. Control composed of large boulders; fairly permanent.
EXTREMES OF DISCHARGE. Maximum stage recorded during year, 8.4 feet at 3 a. m. March 20 (discharge, approximately 2,000 million gallons per day, or 3,090 second- feet); minimum stage recorded, 0.75 foot September 4 and 6 (discharge, 7 million gallons per day, or 11 second-feet).
Maximum stage recorded during period of record, 14.4 feet at 6.30 a. m. Sep tember 25, 1914 (discharge, computed from extension of rating curve, approxi mately 4,000 million gallons per day, or 6,200 second-feet); minimum stage recorded, 0.95 foot March 13, 1914 (discharge, 6.5 million gallons per day, or 10 second-feet).
DIVERSIONS. None above station. 'REGULATION . N one.UTILIZATION. Part of flow is diverted below station for irrigation, of rice and taro.ACCURACY. Discharge ascertained from well-defined rating curve and a continuous
gage-height record. Records good below 600 million gallons per day.
Discharge measurements of Kalihiwai River near Hanalei, Kauai, during the year endingJune SO, 1917.
Date.
July 25 Sept. 22 Jan. 14 June 19
Made by
D. E. Horner ..................................................W.V. Hardy............. .....................................D . E . H orner ......................................................do.........................................................
Gage height (feet).
1.00 1.12 .98
1.32
Discharge.
Second- feet.
22 26 19 44
Million gallons
per day.
14 17 1228

ISLAND OF KAUAI. 67
Daily di; ', in million gallons, of Kalihiwai River near Hanalei, Kauai, for the year ending June 30, 1917.
Date.
1.. ............2..............3..............4..............5..............6..............7..............8..............9..............10..............11..............12..............13..............14..............15..............16..............17..............18..............19..............20..............21..............22..............23..............24..............25..............26..............27..............28..............29..............30..............31..............
July.
58244343222017151517152430342024'68
4824273020151313122215131215
Aug.
1<i272753531734222015151115173417202030271517131210
9
88
Sept.
8
8787
12
9910
899
10131^12123017151543485322,15
Oct.
is19
101012109
12
8'
8
1210199948KQ
272422977Q
73303068735334
Nov.
2424203427204868683443242017302022959748151533024433422588378
Dec.
CO
3843101535863 3A
QA
272024382217273016673342724486324202027833424
Jan.
99QA
6334532722202022201715131378
38138633424304324272222221717
Feb.
1527171513131212121212101013121212151210139
9991015
Mar.
1 ̂
2017171520302011934303095
13114415173534823413168681713241715131312
Apr.
99203413
2422201717301715171517151543
May.
JQ
99
June.
222220171717i7171715
- 15
NOTE. Discharge determined from rating curve well defined below 600 million gallons per day. Gage heights not recorded on days for which discharge is not given.
Monthly discharge ofKalihiwai River near Hanalei, Kauai, for year ending June 30,1917.
Month.
July................................
Discharge.
Million gallons per day.
Maximum.
68 53 53 73
151 166 138 27
234 22
Minimum.
12 8 7 8
17 17 13 9
12 15
Mean.
24.8 19.7 15.3 26.5 43.0 43.4 35.8 12.5 54.4 17.8
Second- feet
(mean).
38.4 30.5 23.7 41.0 66.5 67.1 55.4 19.3 84.2 27.5
Total run-off.
Million gallons.
768 610 458 822
1,290 1,340 1,110
349 1,690
196
Acre- feet.
2,360 1,870 1,410 2,520 3,960 4,130 3,410 1,070 5,180
602
HANALEI RIVER AT ELEVATION 625 FEET.i NEAR HANALEI, KATTAI.
LOCATION. Two miles west of Kauai Electric Co.'s power line and 10 miles south of Hanalei. Trail to station leaves power line at pole No. 485.
RECORDS AVAILABLE. January 26, 1914, to June 30, 1917.GAGE. Stevens water-stage recorder; datum raised 6.0 feet January 15, 1915.DISCHARGE MEASUREMENTS. Made by wading or from footbridge.CHANNEL AND CONTROL. One channel at all stages; straight for 100 feet above and
below gage. Stream bed rough; right bank steep and high; left bank slopes gently. Control composed of boulders; shifting.
i Corrected elevation; formerly published as 750 feet.

68 SURFACE WATER SUPPLY OP HAWAII, 1916 17.
EXTREMES OF DISCHAEGE. Maximum stage recorded during year, 6.05 feet at 11 a. m. March 14 (discharge, approximately 2,260 million gallons per day, or 3,500 second-feet); minimum stage recorded, 0.6 foot September 4, 5, and 19 (discharge, 29 million gallons per day, or 45 second-feet).
Maximum stage recorded during period of record, 9.7 feet (new datum) Sep tember 26, 1914 (discharge, computed from extensions of rating curve, approxi mately 3,800 million gallons per day, or 5,880 second-feet); minimum stage recorded, 0.4 foot (new datum) March, 1914 (discharge, 24 million gallons per day, or 37 second-feet).
DIVERSIONS. None above station.REGULATION . None.UTILIZATION. Irrigation, power, and domestic supply.ACCURACY. Records good.
Discharge 'measurements of Hanalei River at elevation 625 feet, near Hanalei, Kauai, during the year ending June SO, 1917.
Date.
Sept. 29 Nov. 15 Jan. 15 June 19
Made by
D . E . Horner .......................................................do...............................................................do..........................................................
height (feet).
1.27 1.43 .76
1.02
Discharge.
Second- feet.
124158
- 65 109
Million gallons
per day.
80 102 42 70
Daily discharge, in million gallons, of Hanalei River at elevation 625 feet, near Hanalei, Kauai, for the year ending June SO, 1912.
Date.
1..............2..............3..............4. .............5..............
6..............7..............8..............9..............10..............
11..............1913..............14..............15..............
16..............17..............18..............19..............20..............
21..............22..............23..............24..............25..............
26..............27..............28..............29..............30..............31..............
July.
595411011064
504*3
40.3737
374664102fid
642281437682
887054464*3
435041434343
Aug.
407610210282
64fi4.
767054
4643434070
70
767688
102
544340
373434343219
Sept.
qo04
32^990
9Q0707
4340
O7
07
07
04
^9
3904
322904
37705954Cfi
1521431 4O
8859
Oct.
v\4040^740
4307
07
4037
O7
40434040
40
6411088
70597088
OQfi
13482
318410172126
Nov.
82705970126
88143255194102
110QQ
64Cfi
fid
K4
501838888
335118766470
956488152228
Dec.
15211882
183102
821108870102
59
647659
5476
118835201
128110148445224
1109486236224128
Jan.
102148128190148
168102796559
5953484339
249505168935372
148119128290128
1028679726553
Feb.
4815879
9486
8686867979
657279
Mar.
6565728686
79110102390605
249OOfi
625935465
2621487979128
11979947959
2121389479
Apr.
72655348
4348654848
4343433979
May.
224119729465
4843393539
2727241131
3943
224505249
12879655959
487911094148158
June.
23612810286102
102224390190110
79
655365
11Q
1107259
43393531q-i
2727272727
NOTE. Discharge determined from fairly well defined rating curves applicable as follows: July 1 to Dec. 18 and Dec. 19 to June 30. Gage heights not recorded Feb. 4-18 and Mar. 30 to Apr. 16.
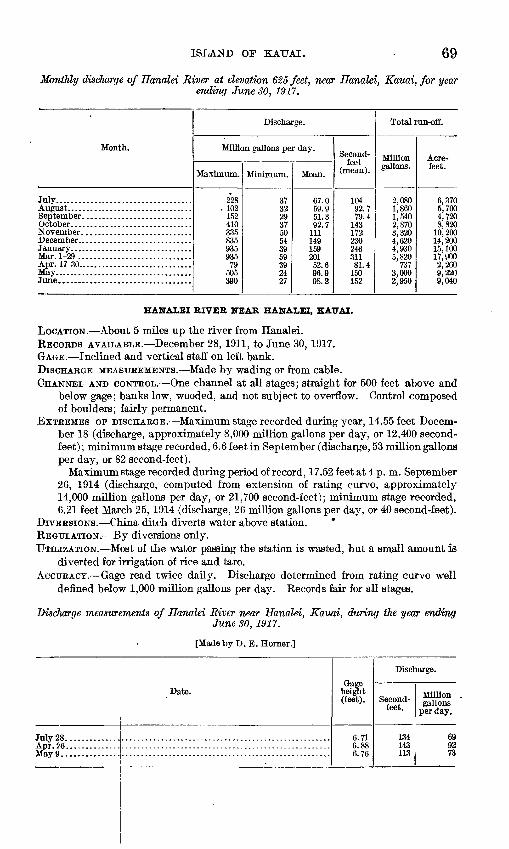
ISLAND OF KAUAI. 69
Monthly discharge of Hanalei River at elevation 625 feet, near Hanalei, Kauai,for yearending June SO, 1917.
Mom
July.................
November ..........
Mar. 1-29............Apr. 17-30...........May.................
h.
....................................
Discharge.
Million gallons per day.
Maximum.
228 . 102
152 410 335 835 935 935
79 505 390
Minimum.
37 32 29 37 50 54 39 59 39 24 27
Mean.
67.0 59.9 51.3 92.7
111 149 159 201 52.6 96.9 98.2
Second- feet
(mean).
104 92.7 79.4
143 172 230 246 311 81.4
150 152
Total run-off.
Million gallons.
2,080 1,860 1,540 2,870 3,320 4,620 4,930 5,820
737 3,000 2,950
Acre- feet.
6,370 5,700 4,720 8,820
10,200 14,200 15,100 17,900 2,260 9,220 9,040
HANALEI RIVER NEAR HANALEI, KAUAI.
LOCATION. About 5 miles up the river from Hanalei.RECORDS AVAILABLE. December 28, 1911, to June 30, 1917.GAGE. Inclined^ and vertical staff on left bank.DISCHARGE MEASUREMENTS. Made by wading or from cable.CHANNEL AND CONTROL. One channel at all stages; straight for 500 feet above and
below gage; banks low, wooded, and not subject to overflow. Control composed of boulders; fairly permanent.
EXTREMES OP DI SCHARGE. Maximum stage recorded during year, 14.55 feet Decem ber 18 (discharge, approximately 8,000 million gallons per day, or 12,400 second- feet) ; minimum stage recorded, 6.6 feet in September (discharge, 53 million gallons per day, or 8^ second-feet).
Maximum stage recorded during period of record, 17.52 feet at 4 p. m. September 26, 1914 (discharge, computed from extension of rating curve, approximately 14,000 million gallons per day, or 21,700 second-feet); minimum stage recorded, 6.21 feet March 25, 1914 (discharge, 26 million gallons per day, or 40 second-feet).
DIVERSIONS. China ditch diverts water above station. *REGULATION. ^y diversions only.UTILIZATION. Mbst of the water passing the station is wasted, but a small amount is
diverted for irrigation of rice and taro.ACCURACY. Gagp read twice daily. Discharge determined from rating curve well
defined below 1,000 million gallons per day. Records fair for all stages.
Discharge measurements of Hanalei River near Hanalei, Kauai, during the year endingJune 30, 1917.
[Made by D. E. Horner.]
July 28. .............
May9. ..............
Date.Gage
height (feet).
6.71 6.88 6.76
Discharge.
Second- feet.
134 143 113
Million gallons
per day.
69 92 73

70 SURFACE WATER, SUPPLY OF HAWAII, 1916-17.
Daily discharge, in million gallons, of Hanalei River near Hanalei, Kauai, for the yearending June 30, 1917.
Date.
1. .............2..............3..............4..............5..............
6..............7..............8..............9..............10..............
11..............12..............13..............14............15..............
16..............17..............18..............19..............20..............
21..............22..............23..............24..........25..............
26..............27..............28..........29..............30..............31..............
July.
320120164164120
958473737Q
8473164270148
164610270134148
180108958470
148370737363Q1
Aug.
73164148200120
952001489595
95848484
200
Q1148164148200
13413484
180847070637Q6363
Sept.
5363536353
5395639573
7353735353
5373737Q63
6368024595on
QRO94. Z220134108
Oct.
9584737373
7363639573
636373957*>
95120164q7ft164
120148164370QAA
9fifi
99ft70 K
68032094. <!
Nov.
164370520320295
270345
1,140610220
180164134120200
148120460164148
1 030OQK
18014899fi
99fi
14899ftOOrt
KKrt
Dec.
400320180580460
400645430164164
148180200148120
180148
2,450785270
200220q7fl7KA
OJK
180OJK
2701,4002959fifi
Jan.
180200320295680
180. 164
148134180
164134120108108
1,2401,170295
2,350ifin
245220148295245
1f\A
148164164164
Feb.
108320134120120
10895848484
8473848484
737373847Q
8473.73180148
148120108
Mar.
73636310895
148295120715148
148550890
3,5003,670
2,600370320180
1,360
785370220180245
1,030245220164148
Apr.
134120200120108
10810895120148
134320270164164
180134120108Q1
on10816495Q1
9501onon180
May.
1,060148120180108
9584737395
9584849563
73120820
1,600750
925490148134120
13410895164295400
June.
320148148148180
2701,240460430200
164148108108108
6451,400220164148
148120959584
8484848484
NOTE. Discharge determined from rating curve well denned below 1,000 million gallons per day.
Monthly discharge of Hanalei River near Hanalei, Kauai, for year ending June 30, 1917.
Month.
July.................................
October. ............................
March...............................April................................
Discharge.
Million gallons per day.
Maximum.
610 200 960 960
1,140 2,450 2,350
320 3,670
320 1,600 1,400
3,670
Minimum.
63 63 53 63
120 120 108
73 63 95 63 84
53
Mean.
152 118 138 202 314 411 346 106 618 136 285 257
259
Second- feet
(mean).
235 183 214 313 486 636 535 164 956 210 441 398
401
Total run-off.
Million gallons.
4,710 3,660 4,150 6,260 9,420
12,700 10,700 2,980
19,200 4,070 8,830 7,720
94,400
Acre- feet.
14,500 11,200 12,700 19,200 28,900 39,100 32,900 9,110
58,800 12,500 27,100 23,700
290,000
CHINA DITCH NEAR HANALEI, EATJAI.
LOCATION. Just below intake, about 5 miles south of Hanalei.RECORDS AVAILABLE. March 17, 1914, to June 30, 1917. December 28, 1911, to
September 30, 1913, at old station a quarter of a mile below present station. GAGE. Vertical staff on left bank. DISCHARGE MEASUREMENTS. Made from plank.

ISLAND OF KAUAI. 71
CHANNEL AND CONTROL. Cut in clay and gravel; subject to growth of grass andweeds which affects stage-discharge relation.
EXTREMES OF DISCHARGE. Maximum stage recorded during year, 2.55 feet June 7(discharge, 32 million gallons per day, or 50 second-feet); minimum stage recorded,0.45 foot January 15 (discharge, 8.8 million gallons per day, or 13.6 second-feet).
DIVERSIONS. Ditch diverts part of flow of Hanalei River. REGULATION. By head gates. UTILIZATION. Irrigation of rice and taro. ACCURACY. Gage read twice daily. Stage-discharge relation rather unstable owing to
growth of aquatic plants. Records July 1 to October 31 poor; those for November1 to June 30 fair for all stages.
Discharge measurements of China ditch near Hanalei, Kauai, during the year endingJune SO, 1917.
[Hade by D. E. Horner.]
Date.
July 28......... ..........................................................Nov. 26...................................................................Apr. 26...................................................................May 10........... ........................................................
Gage height (feet).
1.80 1.55 1.48 1.18
Discharge.
Second- feet.
39 32 3024
Million gallons
per day.
25 20 19 16
Daily discharge, in million gallons, of China ditch near Hanalei, Kauai, for the yearending June 30, 1917.
Date.
1.. ............2..............3..............4..............5..............
6..............7..............8..............9..............10..............
11..............12..............13..............14..............15..............
16..............17..............18..............19..............20..............
21..............22..............23..............24..............25..............
26..............27..............28..............29..............30..............31..............
July.
2825262524
2323232223
2426272828
\ 2828272526
2625242324
252625252625
Aug.
2627272826
2624222625
2424252423
2526272627
2626242424
242323222222
Sept.
2222212220
2123222322
2220191919
1921222221
2120262323
2620212222
Oct.
2018181818
1816161716
1616181818
1921222422
2221222426
222226262624
Nov.
2222202423
2224252422
2221191822
1918
- 242220
2523212022
2219222324
Dec.
2222212422
2024212020
1818201818
1918241812
1212141911
101112181211
Jan.
1011121214
10109.69.612
109.69.19.18.8
2121112514
11109.61210
101112121110
Feb.
2214111010
1010161616
1616161818
1716181817
1816161616
161816
Mar.
1616161818
1821182218
1821222827
2417161423
1816141414
201514' 14
1416
Apr.
1818211818
1818171818,
1822221821
1918181817
1717161617
1918181716
May.
2418171916
1616161616
1616161617
1820262722
2219191818
181819182022
June.
212019191Q
2027222219
1818182124
262822201Q
1919181818
1818181818
NOTE. Discharge July 1 to Oct. 31 determined by shifting-control method; Nov. 1 to June 30 from well- defined rating curve.

72 SURFACE WATER SUPPLY OP HAWAII,
Monthly discharge of China ditch near Hanalei, Kauai, for year ending June 30, 1917.
Month.
July................................
March..............................April...............................May................................
Discharge.
Million gallons per day.
Maximum.
28 28 26 26 25 24 25 22 28 22 27 28
28
Minimum.
22 22 19
. 16 18 10 8.8
10 14 16 16 18
8.8
Mean.
25.3 24.8 21.5 20.3 21.8 17.5 11.9 15.6 18.1 18.1 18.7 20.1
19.5
Second- feet
(mean).
39.1 38.4 33.3 31.4 33.7 27.1 18.4 24.1 28.0 28.0 28.9 31.1
30.2
Total run-off.
Million gallons.
783 768 646 630 654 541 367 437
' 560 544 579 604
7,110
Acre- feet.
2,410 2.360 1,980 1,930 2,010 1,660 1,130 1 340 1,720 1,670 1,780 1,850
21,800
KtTNA DITCH NEAR HANALEI, KATTAI.
LOCATION. A quarter of a mile below intake and about 3 miles southeast of Hanalei.RECORDS AVAILABLE. July 1, 1916, to June 30, 1917. January 17, 1912, to Sep
tember 30, 1913, at old site 500 feet below intake.GAGE. Vertical staff.DISCHARGE MEASUREMENTS. Made from plank at gage.CHANNEL AND CONTROL. Channel about 5 feet wide and 3 feet deep, cut in firm
earth. Stage-discharge relation sometimes affected by growth of grass in channel.EXTREMES OP DISCHARGE. Maximum stage recorded during year, 3.3 feet April 3
(discharge, 36 million gallons per day, or 56 second-feet); minimum stage re corded, 0.9 foot January 25 (discharge, 3.2 million gallons per day, or 5 second-
- feet).DIVERSIONS. None above station.REGULATION. By head gates.UTILIZATION. Irrigation of rice and taro.ACCURACY. Gage read twice daily. Determinations based on rating curves well
defined between 10 and 25 million gallons per day. Records fair for ordinary stages.
Discharge measurements of Kuna ditch near Hanalei, Kauai, during the year endingJune 30, 1917.
[Made by D. E. Horner.]
Date.
July 28...... .......Nov. 20............
26............
Gage height (feet).
2.19 1.87 1.91
Discharge.
Second- feet.
28 20 22
Million gallons
per day.
18 13 14
Date.
Apr. 12. ...........May 10...... .......
Gage height (feet).
1.82 2.26 2.- 67
Discharge.
Second- feet.
20 16 30
Million gallons
per day.
1317 19

ISLAND OF KAUAI. 73
Daily discharge, in million gallons, of Kuna ditch near Hanalei, KauaH, for the yearending June 30, 1917.
Date.
1..............2..............3..............4..............-5...............
6..............7..............8..............9..............10..............
11..............12..............13..............14..............15..............
16..............17..............18..............19..............20..............
21..............22..............23..............24..............25..............
26..............27..............28..............29..............30..............31..............
July.
2018182020
1615141215
1820232521
21
231920
2018151715
151818171719
Aug.
1824242520
1926232020
1918191825
20. 22201826
2321181818
171716171515
Sept.
14156.19.814
1420162317
1714141414
8.616181817
15
192020
18172013
Oct.
1212101011
10109.81110
.109.8111110
1112121613
12121316
1414
1714
Nov.
1313121414
1515
1814
1414121214
1212161514
17141416
1714
18
Dec.
181614
is14
141414
1314141312
1414
14
141415
15
131412
7.67.1
Jan.
6.6106.65.6
5.65.65.25.26.1
5.64.85.24.84.8
5.6
4.8
4.44.03.64 n3.2
11101212109.8
Feb.
9.812109.89.8
1724222221
2121202421
2020222120
2119191818
182018
Mar.
1818182321
242421
is20
201817
19171 f\
21
2018171615
Apr.
3024332627
2524241424
2422262627
2424222120
1921182121
2321242321
May.
1618
16
1514141419
1918181819
2324
1817121112
121217172121
June.
1518111111
28
11
1111111011
1215
1518181823
2322232221
NOTE. Discharge determined from rating curves well defined between 10 and 25 million gallons per day, applicable July 1 to April 3 and April 4 to June 30. On days for which discharge is not given the gage was inaccessible on account of high water in Hanalei River.
LTTMAHAI RIVER NEAR HANALEI, KATTAI.
LOCATION. About 6 miles above mouth and 10 miles by road and trail from Hanalei.RECORDS AVAILABLE. May 23, 1914, to June 30, 1917.GAGE. Stevens water-stage recorder.DISCHARGE MEASUREMENTS. Made from cable or by wading.CHANNEL AND CONTROL. One channel at all stages; straight for 50 feet above and 100
feet below gage; stream bed very rough; right bank vertical; left bank slopesgently. Control composed of boulders; shifting.
EXTREMES OF DISCHARGE. Maximum stage recorded during period of record, 9.0feet at 3 a. m. December 19, 1916 (discharge, computed from extension of ratingcurve, approximately 4,600 million per day, or 7,120 second-feet); minimumstage recorded, 0.6 foot April, 1915 (discharge, 20 million gallons per day, or 31second-feet).
Minimum stage recorded during year, 0.55 foot September 13-17 (discharge,30 million gallons per day, or 46 second-feet).
DIVERSIONS. None above station. REGULATIONS . None.UTILIZATION. Small part of flow is diverted for irrigation of rice and taro. ACCURACY. Determination of discharge based on a continuous record of gage heights
and well-defined rating curves. Records good for all stages.

SURFACE WATER SUPPLY OF HAWAII, 1916-11.
Discharge measurements of Lumahai River near Hanalei, Kauai, during the year endingJune 30,1917.
Date.
July 27 Sept. 27 Apr. 18
26 27 30
May 1
June 15
Made by
W. V. Hardy... .............................................. .
-....do.........................................................
.....do....... -..............-....--...--.-...-..--.....-......-
.....do........--....--...-.................-..--..--.....-...-.
.....do.........................................................-....do.......---...--.-..-..--..--.-..--....-...-...--..............do..........--..--...-...--...--...--.--.--.-.-.--...-.....
height (feet).
0.67 1.18 .40 .22 .30 .68
2.11 1.65 .40
Discharge.
Second- feet.
68 178
84 53 57
117 606 357
75
Million gallons
per day.
44 115
54 34 37 75
392 231 48
Daily discharge, in million gallons, of Lumahai River near Hanalei, Kauai, for the yearending June 30, 1917.
Date.
1..............2..............3..............
5..............
6..............7..............8..............9..............10..............11..............19
13..............14..............15..............
!§.......*......17..............is19..............20..............
21..............99t)O
24..............25..............
26..............27..............28..............29..............30..............31..............
July.
705063
158158
86705656*
56
56508686148
86120178138754
787Q
635650
503939393Q
39
Aug.
39781027078
5063785044
3944503978
564478637fi
7863443Q
34
343439393Q
39
Sept.
3939343434
3456444430
3434303030
30
303Q
50OQ
44Kfi
706356
50102148138168
Oct.
178178178178178
178178178189189
178
OO£
O1 9
200
17S
178OOK
295345OCR
13878
11117863QA
Nov.
102120120189102
7086784456
Sfi
120168
OKA
265OA9
2001 tCS
19Q70
6378
8686
OQF;
JQO
Dec.
178148102200168
15820011194200
148148
148
225790790264
264264A&Q
4689ft4
218
9Q7
369
Jan.
297218369280248
156140896661Kft
56474743
218428107280165
83fifi
6114072
61565656
47
Feb.
43101565247
4747474747
4743526647
4747615647
5647AO
4343
434752
Mar.
433943
10795
1139572
10161
524766
248148
113101959577
6152565247
1075247474343
Apr.
4747434743
47474752
47474743
4343473939
3643394356
May.
11366474743
4343393943
43
3943d343
5677
314101
6652524747
435256475656
June.
7752475689
126891077761
CO
4743
52
1401488966Kft
4747434339
3939433930
NOTE. Discharge determined from rating curves applicable as follows: July 1 to Dec. 19, well denned below 300 million gallons per day; Dec. 20 to June 30, well defined below 600 million gallons per day. Gage heights not recorded Apr. 10-16.

ISLAND OF KAXTAI. 5
Monthly discharge of Lumahai River near Hanalei, Kauai,for year ending June 30 , 1917.
Month.
-ily........... ......................
December. ..........................
"'ay........ .........................
Discharge.
Million gallons per day.
Maximum.
178 102 168 345 450 790 428 101 248 428 148
Minimum.
39 34 30 63 44 94 43 43 39 39 39
Mean.
78.0 54.9 54.6
185 171 249 133 50.8 78.0 73.7 64.6
Second- feet
(mean).
12184.9 84.5
286 265 385 206 78.6
121 114 100
Total run-off.
Million gallons.
2.420 1,700 1,640 5,740 5,130 7,710 4,120 1,420 2,420 2,280 1,940
Acre- feet.
7,420 5,220 5,030
17,600 15,700 23,700 12,700 4,370 7,420 7,010 5,950
WAIOLI STREAM NEAR HANALEI, KATJAI.
'VOCATION. 3 miles above mouth of stream and 4 miles from Hanalei.RECORDS AVAILABLE. June 30, 1914, to June 30, 1917.IAGE. Stevens water-stage recorder.DISCHARGE MEASUREMENTS. Made by wading or from cable at gage.CHANNEL AND CONTROL. One channel at all stages; straight for 50 feet above and 20
feet below gage; right bank steep; left bank slopes gently. Control composed ofboulders; shifting.
EXTREMES OP DISCHARGE. Maxim urn stage recorded during period of record, 6.15feet at 6.30 a. m. December 19, 1916 (discharge, computed from extension ofrating curve, approximately 1,200 million gallons per day, or 1,860 second-feet);minimum stage recorded, 0.6 foot July 22, 1914 (discharge, 2.0 million gallons perday, or 3.1 second-feet).
Minimum stage recorded during year, 1.0 foot November 13 (discharge, 6.0million gallons per day, or 9.3 second-feet).
DIVERSIONS. None above station. REGULATION. None.TTILIZATION. Small part of flow is diverted for irrigation of rice and taro. ACCURACY. Determinations of discharge based on well-defined rating curve and a
continuous record of gage heights. Records good for all stages.
Discharge measurements of Waioli Stream near Hanalei, Kauai, during the year endingJune 30, 1917.
Date.
'" ?pt. 30 "Tov. 21 Apr. 19
20 "one 14
Made by
W. V. Hardy. .................................................D . E . Horner .......................................................do...............................................................do...............................................................do..........................................................
Gage height (feet).
1.26 2.80 1.28 1.20 1.20
Discharge.
Second- feet.
22 402 18 17 16
Million gallons
cter day.
14 260
12 11 10.5

76 SURFACE WATER SUPPLY OF HAWAII, 1916-17.
Daily discharge, in million gallons, of Waioli Stream near Hanald, Kauai, for the yearending June 30, 1917.
Date.
1.. ............2..............
4... ...........5..............
6..............7. .............8..............9..............10..............
11..............12..............13..............14..............15..............
16..............17..............18..............19..............20..............
21..............22..............23..............24..............25..............
26..............27..............28..............29..............30..............31..............
July.
1814141432
1925251411
1122321928
3243252535
104348CO
35
102216161116
Aug.
1414161414
1414142222
3219143222
1414141416
1653191025
222822161411
Sept.
9.59 E
9.51114
11119.5119.5
9.59.59 E
11
16
111114118.0
8.08.08.08.09.5
1114169.5
14
Oct.
141411
11
119.59 E
1111
111114119.5
1616162822
103925 a59
4843<M
782522
Nov.
1614192848
3525so3516
119.56.0
2511
336336
28141116
19114<?48
. 86
Dec.
3228167219
1125141625
1116192211
163259
31035
28326516859
161122783522
Jan.
16. 48538632
321611117.0
2216119.5
. 8.0
942263510253
2216145319
161628329914
Feb.
1122119.58.0
8.08.08.08.08.0
8.08.08.0
2811
9.58.08.0
169.5
19149.58.08.0
8.09.532
Mar.
118.08.0
2832
3539282816
1416597835
2522141922
3522221416
863528221414
Apr.
1619191614
119.59.59.59.5
1111111116
2219161611
1111162219
1625252543
May.
9443282522
1916161414
1414142216
353517913853
3222222225
22
June.
86
19
16
NOTE. Discharge determined from rating curve well defined below 350 million gallons per day. Gage height not recorded on days for which discharge is not given.
Monthly discharge of Waioli stream near Hanalei, Kauai, for year ending June 30, 1917.
Month.
July................................August .............................
January .............................February. ..........................March. .............................
May 1-26............................
Discharge.
Million gallons per day.
Maximum.
53 53 16 78
310 226 32 86 43
179
Minimum.
11 11 8.0 9.5
11 7.0 8.0 8.0 9.5
14
Mean.
25.0 19.2 10.7 23.8 42.7 36.8 11.6 27.3 16.3 36.8
Second- feet
(mean).
38.7 29.7 16.6 36.8 66.1 56.9 17.9 42.2 25.2 56.9
Total run-off. .
Million gallons.
776 594 322 738
1,320 1,140
324 845 490 956
Acre- feet.
2,380 1,830
985 2,260 4,060 3,500
997 2.600 1,500 2,930
WAINIHA RIVER (EAST AND WEST CHANNELS), NEAR WAINIHA, KATJAI.
LOCATION. Just northeast of Kauai Electric Co.'s power house, 2 miles south ofWainiha.
RECORDS AVAILABLE. East Channel, February 25,1912, to December 18,1916; WestChannel, December 30, 1911, to December 18, 1916.
GAGE. Inclined staff in each channel. DISCHARGE MEASUREMENTS. Made by wading or from footbridge over each channel.

ISLAND OF KAUAI. 77
CHANNEL AND CONTROL. The river divides a short distance above power house and a station is maintained on each channel to obtain total flow. Fish dams built by the natives at the point where the river divides shift the water from one channel to the other. Control for east channel composed of boulders; fairly permanent; control for west channel composed of boulders; shifting.
EXTREMES OF DISCHARGE. East channel: Maximum stage recorded during period of record, 15.0 feet December 18, 1916 (discharge, computed from extension of rating curve, approximately 3,000 million gallons per day, or 4,640 second-feet); minimum stage recorded, 6.5 feet August 3-6, 1913 (discharge, 3 million gallons per day, or 4.6 second-feet).
West channel: Maximum stage recorded during period of record, 9.0 feet at 5 p. m. September 26, 1914, and December 18, 1916 (discharge, 1,500 million gal lons per day, or 2,320 second-feet); minimum stage recorded, 5.4 feet, frequently (discharge, 53 million gallons per day, or 82 second-feet).
DIVERSIONS. Water diverted for power development above stations is returned to river again just above station on west channel. «
REGULATION. None except by diversions.UTILIZATION. Part of water passing stations is used for irrigation of rice and taro.ACCURACY. East channel: Records fair below 500 million gallons per day.
West channel: Records fair below 400 million gallons per day. Gages read twice daily.
Discharge measurements of east channel of Wainiha River near Wainiha, Kauai, during the year ending June 30, 1917.
Date.
July 26 Nov. 24
Made by
W.V. Hardy......................... .........................D. E.Horner. .................................................
Gage height (feet).
7.55 8.09
Discharge.
Second- feet.
59 104
Million gallons
per day.
3867
Daily discharge, in million gallons, of east channel of Wainiha River near Wainiha, Kauai, for the year ending June SO, 1917.
Date.
1. .. 2. .. 3. ..4. ;.5. ..
6. ..7. ..8....9....10....
11....12. ...13. ...14....15....
July.
236 73 92
16448
4840373737
4242
17415568
Aug.
37 92 10699 48
48155525245
373745128113
Sept.
42 55 424242
4292429255
5542424242
Oct.
42 37 323259
4842
5548
3732374242
Nov.
42 37 382450214
39551028224773
358484242146
Dec.
137 120 797373
551847318473
5573635555
Date.
16... 17... 18...19...20...
21...22...23...24...25...
26...27...28...29...30...01
July.
270 345
1744885
5948403737
375548374237
Aug.
48 73 16492
113
7348424242
424242424242
Sept.
37 42 55
11352
52155634885
155731845542
.-Pet.
48 48 4215555
555548137358
7355
42012018473
Nov.
42 42
4205555
740146737379
11373214258792
Dec.
164 55
NOTE. Discharge determined from rating curve fairly well defined below 500 million gallons per day. Gage height not recorded Oct. 8.

78 SURFACE WATER SUPPLY OF HAWAII, 1916-17.
Monthly discharge of east channel of Wainiha River near Wainiha, Kauai, for year endingJune 30, 1917.
Month.
July................................
December 1 17
Discharge.
Million gallons per day. '
Maximum.
345 164 184 792 184
Minimum.
37 37 37 37 55
Mean.
86.8 67.2 66.0
215 92.4
Second- feet
(mean).
134 104 102 333 143
Total run-off.
Million gallons.
2,690 2,080 1,980 6,440 1,570
Acre- feet.
8,26T 6,390 6,080
19,801 4,821
The following discharge measurement was made of the west channel of Wainiha River by W. V. Hardy:
July 26, 1916: Gage height, 5.48 feet; discharge, 65 million gallons per day, or 101 second-feet.
Daily discharge, in million gallons, of west channel of Wainiha River near Wainiha, Kauai, for the year ending June SO, 1917.
Date.
1....2.... 3....4....5....
6....7....8....9....10....
11....12....13....14....15....
July.
180 105 116 152QC
QC
67676767
767615214095
Aug.
67 116 12819QQC
QC
140858576
676776152152
Sept.
67 85 67 6767
671166711685
8567676767
Oct.
67 60 53FO
95
QC
67
9576
6053Art
6767
Nov.
85 76
245 2791 £9
Ofto
IQfi
105
40585QC
OK
Dec.
166 116 105 105105
86140105140105
85105958585
Date.
16.... 17.... 18.... 19....20....
21....22....23....24....25....
26....27....28....29....30....31....
July.
180 262 152QC
116
ifliQJ;676767
679585677667
Aug.
85 116 180IOQ
140
105QC
676767
676767676767
Sept.
60 67 1051 TO
85
851669585128
1661051668567
Oct.
76 76 67 14095
959585
128279
10585
350128212105
Nov.
85 85
279
105
482152105105105
128105152196462
Dec.
123 85
801)
NOTE. Discharge determined from a rating curve well denned below 400 million gallons per day. Gage height not recorded Oct. 8.
Monthly discharge of west channel of Wainiha River near Wainiha, Kauai, for year endingJune 30, 1917.
Month.
July.................................
December 1-18 ......................
^Discharge.
Million gallons per day.
Maximum.
262 180 166 482 806
Minimum.
67 67 60 76 85
Mean.
103 95.2 92.5
182 147
Second- feet
(mean).
159 147 143 282 227
Total run-off.
Million gallons.
3,180 2,950 2,770 5,470 2,650
Acre- feet.
9,80C 9,06C 8,52C
16,800 8,12C

ISLAND OP OAHU. 79
Miscellaneous measurements on Kauaifor the year4, ending June SO, 1917.
Date.
July 26
Aug. 3
3
3 3 3
Apr. 24 Sept. 3 Dec. 9 Feb. 1 Apr. 3 Sept. 2 Dec. 9 July 25 Sept. 5 Oct. 22
23 28
- 29 Aug. 31 Dec. 5
8 Nov. 6 Dec. 22
23 Jan. 19
Stream.
Wainiha River ....
.....do.............
Anahola ditch ..... .....do..................do............. Opaikaa. ..........
.....do.............
.....do.............
.....do.............
.....do.............Wainiha Canal... . .
.....do.............
.....do.............
.....do.............
.....do.............
.....do.............
.....do.............
.....do.............Kaholalele ditch. . . .....do..................do..................do.............
Locality.
50 feet below diversion dam at intake Kauai Electric Co.'s ditch.
Discharges into Anahola ditch 1.6 m below intake.
Discharges into Anahola ditch 2.0 n below intake.
One-fourth mileabove falls, near Kapa<
.....do.................................
.....do................................
.....do......... ................ ......j
.....do................................
.....do................................
.....do................................
.....do.................................
.....do................................
.....do.................................
.....do................................
.....do................................About 1.500 feet belowintake. near Lib .....do......................................do.....................................do................................
of
iles
iles
ue..
Gage height (feet).
3.69 4.14 4.08 4.12 1.26 1.70 4.10 3.77 4.72 4.70 4.83 4.85 .34 .82
1.12 1.29 .96 .60
1.15
Discharge.
Second- feet.
9.4
3.0
1.1
10.2 10.2 11.6 13.9 1.9
13.4 9.3
11.3 1.3 9.3
79 75 89 91 90 90
.9 3.6 6.8 4.5 1.8 .75
3.8
Million gallons
per day.
6.1
1.9
.7
6.6 6.6 7.5 9.0 1.2 8.6 6.0 7.3 8.5 6.0
51 49 57 59 58 58
.6 2.3 4.4 2.9 1.2 .5
2.5
ISLAND OF OAHU.
KALIHI STREAM NEAR HONOLULU, OAHU.
LOCATION. At Kioi pool, about three-eighths mile above Catholic Orphanage, 3 miles up Kalihi road from King Street car line, and 5 miles north of Honolulu post office.
RECORDS AVAILABLE. September 8, 1913, to June 30, 1(1)17.GAGE. Gurley weight-driven water-stage recorder installed December 4, 1913.
Friez recorder in use September 8 to November 22, DISCHARGE MEASUREMENTS. Made by wading or from £ CHANNEL AND CONTROL. Water drops over a 10-foot fal
1913.'Otbridge 500 feet above gage, into pool at gage. Channel
in solid rock, with steep, high banks; two channels at stage of 6.0 feet andover. The high-water control is solid rock, but gravelsometimes collects inthe low-water control and affects the stage-discharge] relation.
EXTREMES OF DISCHARGE. Maximum stage recorded uring period of record, 12.5feet at 1 a. m. March 19, 1917 (discharge, approximately 400 million gallons perday, or 619 second-feet); minimum stage recorded, 2.50 feet November 1, 1913(discharge, 0.5 million gallons per day, or 0.8 secondj-feet).
Minimum stage recorded during year, 2.2 feet Odtober, February, and March(discharge, 1.0 million gallons per day, or 1.55 seconji-feet).
DIVERSIONS. None above station. REGULATION. None. ' UTILIZATION. Part of water diverted 400 feet below staion for power development;
remaining low-water flow is diverted farther downstream for irrigation of taro. ACCURACY. Records good for all stages, as sufficient current-meter measurements
were made to give well-defined curves covering the periods between changes incontrol. I

80 SURFACE WATER SUPPLY OP HAWAII, 1916-17.
Discharge measurements of Kalihi Stream near Honolulu, Oahu, during the year endingJune 30, 1917.
Date.
Sept. 22. ......Nov. 29. ......Jan. 31.......Mar. 13.......Apr. 4.......
26.......May 17.......
27.......
Made by
.....do...................................................
.....do...................................................
.....do...................................................R. D.Klise.............................................. .....do...................................................H. A. R.Austin...............................................do........................................................do...................................................
Gage height (feet).
2.48 2.74 2.43 3.06 3.06 2.57 2.58 3.03 2.91
Discharge.
Second- feet.
4.24 8.74 4.24
11 6.22 3.64 4.0 3.3 2.56
Million gallons
per day.
2.7 5.6 2.7 7.1 4.0 2.4 2.6 2.1 1.7
Daily discharge, in million gallons, of Kalihi Stream near Honolulu, Oahu, for the yearending June 30, 1917.
Date.
1. .............2..............q4..............5..............
6..............7..............8..............9..............
10..............
11..............12..............13..............14..............15..............
16..............17..............18..............19..............20..............
21..............22..............23..............24..............25..............
26..............27..............28..............29..............30.............. 31..............
July.
1.91.94.64.02.6
1.91.91.61.61.6
1.91.91.91.61.6
5.8184.03.02.6
2.62.21.91.91.9
1.92.22.21.91.9 q n
Aug.
3.07.64.06.4s n
3.55.84.64.03.5
2.62.62.25.85.2
4.04.0s n3.53.0
3.52.62.23.52.2
2.22.22.21 Q1.99 9
Sept.
9 9
3.0i a1.91.6
1.62.21.61.61.6
1.32 91 Q
1.31.3
1.61.61 'i1.61.3
1.61.91.32.22.2
5.85.23.02.21.6
Oct.
1.61.61.61 ^1 ^
5.21 Q
1.64.01 Q
1.31 1
1 ^
1.01.6
1 q1.32 9
2.61.9
1.6i 'l3.51.92.2
1.95.8
24109.0 4.0
Nov.
3.02.62 9Q 7
8 0
7.67.64.0q <;7.6
5.2q n3.02.65.aq n
16385.84.0
3.5q A
3.03.03.0
9.0q A
106.45.2
Dec.
3.5397.6
217.6
1091
8.36.46.4
4.64.66.44.64.0
3.51116176.4
5.24.6
12104.6
4.01626165.8 4.6
Jan.
4.64.05.84.68.3
4.03.53.04.0
54
6.44.03.53.02.6
7.06.4s n
1414
5.24.03.59.03.5
194.63.53.02.6 2.6
Feb.
2.22.29 9
1.91 Q
2.61 Q1.61.61.6
1.31.34.63.51.9
1.61.62.61.61.6
1.31.31.31.01.0
1.01.01.0
Mar.
1.01.01 ^
2.61.6
1.9i s1.0
233.5
1058113222
9 79.08.3
6868
138.37.08.3
15
106.45.83.55.24.6
Apr.
4.64.64.03.55.8
3.5q n3.05.8s n
115.23.53.03.0
4.63.53.02.62.6
3.5,3.57.63.52.2
2.21.9
183810
May.
7.04.68 0
Q A1 ^
3.02.62.22 99 9
2.21 Q1 Q
4.62.2
1 Q
1.917215.8
3.53.03.02.62.2
2.62.24.62.6
10Q 7
June.
4.63.03.02.62.6
2.62.22.25.22.6
2.62.21.91.97.0
133.04.02.62.2
2.22.21.91.91.9
1.61.61.61.61.6
NOTE. Discharge determined from well-defined rating curves applicable; July 1 to Mar. 12, Mar. 13- 20, Mar. 21 to Apr. 26, Apr. 27 to May 19, and May 20 to June 30.

ISLAND OF OAHTJ. 81
Monthly discharge of Kalihi Stream near Honolulu, Oahu,for year ending June 30, 1917.
Month.
July................................
January.. ...........................February. ..........................
April.. . .............................May.................................
Discharge.
Million gallons per day.
Maximum.
18 7.6 5.8
24 38 39 54 4.6
68 38 21 13
68
Minimum.
1.6 1.9 1.3 1.0 2.2 3.5 2.6 1.0 1.0 1.9 1.9 1.6
1.0
Mean.
2.89 3.48 2.05 3.32 6.39
10.2 7.10 1.79
13.6 5.77 4.87 2.97
5.41
Second- feet
(mean).
4.47 5.38 3.17 5.14 9.89
15.8 11.0 2.77
21.0 8.93 7.54 4.60
8.37
Total run-off.
Million, gallons.
90 108
62 103 192 318 220 50
421 173 151 89
1,980
Acre- feet.
275 331 189 316 588 970 675 154
1.290 531 463 273
6,060
NTJTJANTJ STREAM BELOW RESERVOIR NO. 2 WASTEWAY, NEAR HONOLULU, OAHTJ.
LOCATION. On Pali road in upper Nuuanu Valley, 1 mile above end of car line and 5 miles from Honolulu post office.
RECORDS AVAILABLE. October 21, 1913, to June 30, 1917.GAGE. Inclined staff on right bank.DISCHARGE MEASUREMENTS. Low-water discharge measured by 2-foot sharp-crested
weir with end contractions; flood discharge measured by 12-foot sharp-crested weir with end contractions, which, with small weir, gives total flood discharge. Both weirs set in concrete. Crest of small weir is 1 foot lower than that of large weir. The weirs were reconstructed April 10-27, 1914, but original dimensions were maintained.
CHANNEL AND CONTROL. Channel in solid rock; straight for about 75 feet above and . below weir; banks high and covered with vegetation.
EXTREMES OP DISCHARGE. Maximum stage recorded during period of record, 6.0 feet at 4 p. m. April 5, 1914 (no estimate of discharge posaible, as entire weir was overflowed); minimum stage recorded, 0.10 foot in November. 1913, Sep tember, 1915, July and August, 1916 (discharge, 0.15 million gallon per day, or 0.25 second-foot).
DIVERSIONS. Most of the flow at low and medium stages is diverted above station for domestic supply and for power development. An irrigation ditch diverts low-water discharge at point 300 feet below station.
REGULATION. Amount diverted above station varies.UTILIZATION. Station measures the waste water and seepage from reservoirs Nos. 2,
3, and 4, and the Luakaha weir. This waste water is used for irrigation of taro and rice.
ACCURACY. Records good below 4 million gallons per day, but only fair for larger flow owing to varying velocity of approach and uncertainties resulting from use of compound weir.
40532° 18 WSP 465 6

82 SURFACE WATER SUPPLY OF HAWAII, 1916-17.
Daily discharge, in million gallons, of Nuuanu Stream below reservoir No. 2 wasteway, near Honolulu, Oahu, for the year ending June 30, 1917.
Date.
1..............2..............3..............4..............5..............
7..............8..............9..............10..............
11..............12..............13..............14..............15..............
16..............17..............18..............19..............20..............
21..............22..............23..............24..............25..............
26...............27..............28..............29..............30..............31..............
July.
1.11.12.33.73.4
1 G
1.31.11.1.9
.55
.15
.4
.4
.4
4.04.82.81.11.5
1.31 0
1.11.31.3
1.32.01.11.32.53.4
Aug.
^ 4114.06.53.4
3 73.43.44.0
3.41.3.15
1.54.0
3.13.73.12.52.3
2.07K
.75
1.11.11.31.31.5
Sept.
1 ^1.11.11.11.1
2.0.4.4.4
.4
.4
.4
.4
.4
.4
.4
.4
.4
.4
.55
.55
.55
.55
7.64.3
g9
.75
Oct.
ft Q
.75
.757K
.55
g.75.75.75
.55
.55
.55ttg
g1.81.3
.75
.751.11.11.1
.43.7
24166.54.0
Nov.
4.01.81.54 Q
tn
3 7
4.03.45.6
3.71.81.51.51.5
6.5324.03.1
3.12 0
2.52.52.3
3.43.1
20995.6
Dec.
3 A
284.3
342.5
9 n185.64.82.0
1.82.32 ft4.03.7
3.74.3
26265.6
4.85.67.6
105.6
4.82232138.96.5
Jan.
5.65.64.06.55.6
4.83.73.7
62
6.56.56.56.55.6
4.84.84.84.8
32
7.65.64.84.85.6
285.66.54.84.8
Feb.
4.34.34.34.34.3
A Q4.34.34.34.3
4.36.57.64.34.3
4.04.04.03.12.8
2.82.82.52.52.0
2.02.02.0
Mar.
2.01.84.34.33.7
3 42.52.05.63.7
3.1187.6
3213
8.96.5
10
26
8.915182437
281811108.97.6
Apr.
7.67.67.67.6
10
8 Q
7.66.57.66.5
28107.67.6
15
16105.65.65.6
4.8156.56.54.8
4.84.8
3410422
May.
2018117.68.9
108.97.66.56.5
5.65.65.6
167.6
5.65.6
16
13
8.97.65,65.65.6
5.64.84.34.8
4830
June.
105.65.66.57.6
7 /s
5.6241511
8.97.66.58.96.5
1610156.55.6
4.84.34.3.4.34.3
4.34.34.34.04.0
NOTE. Weir undergoing repairs Nov. 16; gage height not recorded Mar. 19 and May 19.
Monthly discharge of Nuuanu Stream below reservoir No. 2 wasteway, near Honolulu, Oahu, for year ending June 30, 1917.
Month.
July................................
September
April...............................
Discharge.
Million gallons per day.
Maximum.
4.8 11
7.6 24 34 62 7.6
104 24
MrnimTiTn .
0.15 .15 .4 .4
1.8 3.7 2.0 4.8 4.0
Mean.
1.67 2.70 1.05 2.46 9.83
. 8.93 3.80
13.2 7.76
Second- feet
(mean).
2.58 4.18 1.62 3.81
15.2 13.8 5.88
20.4 12.0
Total run-off.
Million gallons.
52 84 32 76
805 268 106 396 233
Acre- feet.
159 257
97 234 935 822 327
1.220 714

ISLAND OF OAHTJ. 83
MANOA STREAM AT COLLEGE OF HAWAII, NEAR HONOLULU, OAHU.
LOCATION. In gorge about half a mile southeast of College of Hawaii and 3 miles eastof Honolulu post office.
RECORDS AVAILABLE. March 23, 1909, to November 24, 1910; November 1, 1912, toApril 26, 1913; September 10, 1913, to June 30, 1917.
GAGE. Vertical staff on left bank. The weir used during 1909 and 1910 was destroyedby flood of November 24, 1910. Several changes in gage datum previous to 1912.
DISCHARGE MEASUREMENTS. Made by wading. CHANNEL AND CONTROL. Channel straight and confined in the vicinity of station;
stream bed composed of rock; clean and fairly permanent; left bank composedof rock nearly vertical; right bank slopes gently and is covered with vegetation.
EXTREMES OF DISCHARGE. Maximum stage recorded, 6.1 feet from high-water markof flood March 19, 1917 (discharge, from extension of rating curve, 260 milliongallons per day, or 402 second-feet); minimum daily discharge, March, 1914(0.2 million gallons per day, or 0.3 second-foot).
Minimum stage recorded during year, 0.7 foot June 28-30 (discharge, 0.8 milliongallons per day, or 1.2 second-feet).
DIVERSIONS. Nearly all the low water flow is diverted above and below the stationfor irrigation.
REGULATION . None. UTILIZATION. Records show water available for storage at this reservoir site; the
low-water flow of the stream is extensively, used for irrigation of rice and taro inupper and lower Manoa Valley.
ACCURACY. Gage read twice daily. Records good for low and medium stages, butmay be considerably in error for high and fluctuating stages.
COOPERATION. Gage-height record furnished by College of Hawaii.
Discharge measurements of Manoa Stream at College of Hawaii, near Honolulu, Oahu, during the year ending June 30, 1917.
Date.
Jan. 11.......Mar. 8
23.......Apr. 30.......May 14.......
14.......June 30.......
Made by
H. A. R. Austin...............................................do....................................................
H. A. R.Austin................................................do.........................................................do.........................................................do....................................................
Gage height (feet).
1.281.78 .96
1.70 1.74 1.85 1.72 .71
Discharge.
Second- feet.
5.35 15.3 2.10
21.9 18.5 22.1 17.4 1.2
Million gallons
per day.
3.5 9.9 1.4
14 12 14 11
.8

84 SURFACE WATER SUPPLY OF HAWAII, 191&-1T.
Daily discharge, in million gallons, of Manoa Stream at College of Hawaii, near Honolulu, Oahu, for the year ending June 30, 1917.
Date.
1..............2..............3..............4..............5..............
6..............T.... ..........8..............9..............
10..............
11..............12..............13..............14..............15..............
16..............17..............18..............19..............20..............
21..............22..............23..............24..............25..............
26..............27..............28..............29..............30..............31..............
July.
7.45.88.3
177.4
7.45.85.2
4.1
4.64.6
106.65.8
502023368.3
5.85.85.24.6A. PL
5.24.64.14.64.6
32
Aug.
1520205626
17138.37.4
11
115.25.8
3220
1312131716
23107.46.6K Q
5.85.25.25.27.44.6
Sept.
5.8135.24.12.6
3.6133.6
3.6
2.62.6
3.12.6
2.62.63.16.65.2
4.67.44.65.27.4
24117.45.23.6
Oct.
4.64.69 fi
1.83.6
3 13.62.6
2,62 9
1.81.51.5
1.52.63.66.65.2
4.14 13.63.19 0
4.64.6
208.3
236.6
Nov.
4.14.64.6
1817
2312111311
108.36.65.86.6
9.25.27.4
2610
118.35.84.6 5.8
5.84.6
13
5:8
Dec.
2436235818
2023171517
138.3
10117.4
7.432422822
1632231611
8.34082 .13119.2
Jan.
8.38.39.27.47.4
6.64.63.12.6
78
157.45.84.13.1
3223131334.
17118.35.22.6
2322128.36.65.8
Feb.
5.24.13.63.12.6
1.81.52.62.21.8
1.82.62.63.13.1
1.82.62.6
158.3
4.63.12.62.62.2
1.81.81.8
Mar.
2.62.22.63.12.6
2.62.66.62.21.8
1.816112023
161538
10157
3315131211
20151822107.6
Apr.
6.06.05.35.35.3
4.64.64.64.64.0
262115107.6
4.03.42.93.43.4
4.06.87.6
109.2
7.67.66.86.06.0
May.
1010129.27.6
7.66.84.61.61.6
1.62.44.02.92.0
1.64.67.66.08.4
7.65.34.64.63.4
3.43.43.43.4
1315
June.
8.43.43.44.03.4
4.64.03.44.03.4
4.64.64.64.64.0
3.43.43.42.92.9
2.41.41.41.11.0
1.0.9.8.8.8
NOTE. Discharge determined from rating curves well denned below 20 million gallons per day, appli cable: July 1 to Mar. 19 and Mar. 20 to June 30.
Monthly discharge of Manoa Stream at College of Hawaii, near Honolulu, Oahu, for theyear ending June 30, 1917.
Month.
July ..............................
Discharge.
Million gallons per day.
Maximum.
50 56 24 23 26 82 78 15
101 26 15 8.4
101
Minimum.
4.1 4.6 2.6 1.5 4.1 7.4 2.6 1.5 1.8 2.9 1.6 .8
.8
Mean.
10.4 13.7 5.80 4.90 9.49
22.4 13.2 3.30
16.3 7.29 5.78 3.07
9.72
Second- feet
(mean).
16.1 21.2 8.97 7.58
14.7 347 20.4 5.11
25.2 11.3 8.94 4.75
15.0
Total run-off.
Million gallons.
323 425 174 152 285 694 408 92
504 219 179 92
3,550
Acre- feet.
989 1,300
534 466 874
2,130 1,260
284 1,550
671 550 283
10,900

ISLAND OF OAHU. 85
WEST BRANCH OF MANOA STREAM NEAR HONOLULU, OAHU.
LOCATION. At diversion dam at R. W. Shingle's bungalow, 300 feet above highway bridge, about one-eighth mile above confluence with East Branch of Manoa stream, 4 miles northeast of Honolulu post office.
RECORDS AVAILABLE. May 29, 1913, to June 30, 1917.GAGE. Watson water-stage recorder in use June 17 to October 20, 1914; replaced
October 20, 1914, by a Friez water-stage recorder, which was replaced May 9, 1915, by a Stevens 8-day water-stage recorder; all at same site and datum. Ver tical staff gage (at different datum) 150 feet upstream from highway bridge, about 25 feet above a small irrigation ditch diverting from right bank, read from May 29, 1913, to June 16, 1914.
DISCHARGE MEASUREMENTS. Made by wading.CHANNEL AND CONTROL. Small masonry diversion dam with wide, rounded crest
acts as control and forms a large, quiet pool in the vicinity of the gage for low and medium stages. Leaves and small de'bris lodge on control and growth of grass on sides at times affects the stage-discharge relation slightly. Channel clean and stream confined in the vicinity of the gage. A short distance upstream the natural slope is steep and the channel is filled with boulders.
EXTREMES OF DISCHARGE. Maximum stage recorded, 4.65 feet 12.15 a. m. March 20, 1917 (discharge, 200 million gallons per day, or 309 second-feet); minimum stage recorded, December, 1913 (discharge, 0.05 million gallons per day, or 0.08 second-foot).
Minimum stage recorded during year, 1.0 foot August 12 and 25-27 (discharge, 0.3 million gallons per day, or 0.46 second-foot).
DIVERSIONS. None above station.REGULATION. At low water pool at gage is lowered slightly for short periods by the
operation of a small hydraulic ram used for pumping water for domestic use and also for filling a swimming p.pol.
UTILIZATION. Records on West and East Branches of Manoa stream together show amount of surface water available in upper Manoa Valley above nearly all diver sions. Practically the entire low water flow of Manoa stream is utilized at lower elevations in Manoa Valley for rice and taro irrigation.
ACCURACY. Records good except for extreme low-water periods, when regulation at control and lack of sensitiveness of control section prevented refined accuracy of low-water estimates.
Discharge measurements of West Branch of Manoa Stream near Honolulu, Oahu, during the year ending June 30, 1917.
Date.
Aug. 29 . Jan. 10..Mar. 14 . Apr. 30,.
Made by
.....do.........................................................
H. A. R. Austin. ..............................................
height (feet).
1.09 1.51 1.28 1.19
Discharge.
Second- feet.
1.75 17.8 7.99 5.23
Million gallons
per day.
1.1 11 5.2 3.4

86 SURFACE WATER SUPPLY OP HAWAII, 1916-17.
Daily discharge, in million gallons, of West Branch of Manoa Stream near Honolulu, Oahu, for the year ending June 30, 1917.
Date.
1. .............2..............3..............4..............6..............
6..............7. .............8..............9..............10..............
11..............12..............13..............14..............15..............
16..............17..............18..............19.. .............20..............
21........'......22..............23..............24..............25..............
26..............27..............28..............29..............30..............31..............
July.
2.31.45.62.31.4
1.4.6.6.6.6
.61.42.31.41.4
6.98.23.22.31.4
1.41.4.6.6
1.4
.61.41.4.6
2.34.4
Aug.
3.26.92.34.4.6
1.41.4.6.6
1.4
.6
.3,
.65.65.6
1.43.21.42.32.3
2.3.6.6.6.3
.3
.3
.61.41.42.3
Sept.
1.43.21.4.6.6
.63.21.41.4.6
.62.31.4.6.6
.6
.6
.63.2.6
1.41.41.41.42.3,
6.94.42.32.31.4
Oct.
1.41.41.41.41.4
3.29 3
1.42.31.4
1.41.41.41.41.4
1 41.41.41.41.4
. 1.41.42.33.22.3
3.26.96 95.64.42.3
Nov.
1.41.41.46.96.9
6.94.45.64.44.4
5.63.23.23.24.4
3.211114.43.2
3.23.23.23.2
17
8.24.49 a
6.94.4
Dec.
5.61914125.6
4.46 94.43.23.2
2.32.33.22.32.3
2.35.69.6
145.6
3.2444.48.23.2
<? 9
11118.24.44 4
Jan.
3.23.23.24.45.6
2.31.41.41.4
11
3.22.32.31.41.4
2.32.31.44.36.9
2.32.32.32.32.3
123.21.41.41.41.4
Feb.
1.4.6.6.6.6
1.41.41.4.6.6
.6
.62.31.4.6
.6
.61.41.41.4
.6
.6
.6
.6
.6
.6
.6
.6
Mar.
1.41.42.33.22.3
2.39 3
1.41.41.4
4.48.24.49.66.9
4 43.22.3
1421
5.63.23.23.26.9
^ fi3.2i i6.93.23.2
Apr.
3.23.23.22.33.2
2.31.41.42.31.4
8.23.22.32.31.4
2.32.31.41.41.4
1.45.66.93.22.3
1.41.45.69.63.2
May.
5.64.42.32.32.3
1.42.31.41.41.4
1.41.41.44.42.3
1.42.35.6
115.6
3.22.33.22.32.3
2.32.32.32.36.95.6
June.
3.21.41.41.41.4
3.22.34.4
123.2
5.62.31.42.32.3
1.41.42.31.4.6
.6
.6
.6
.6
.6
.6
.61.41.41.4
NOTE. Discharge determined from rating curve well denned below 20 million gallons. Discharge Sept. 9-10 and Oct. 15-21 determined by comparison with records of flow of East Branch.
Monthly discharge of West Branch of Manoa Stream near Honolulu, Oahu, for year endingJune 30, 1917.
Month.
July.................................
April...............................May................................
Discharge.
Million gallons per day.
Maximum.
8.2 6.9 6.9 6.9
17 19 12 2.3
21 9.6
11 12
21
Minimum.
0.6 .3 .6
1.4 1.4 2.3 1.4 .6
1.4 1.4 1.4 .6
.3
Mean.
2.00 1.83 1.69 2.31 5.31 6.24 3.14 .89
4.72 3.02 3.12 2.11
3.05
Second- feet
(mean).
3.09 2.83 2.61 3.57 8.22 9.65 4.86 1.38 7.30 4.67 4.83 3.26
4.72
Total run-off.
Million gallons.
62 57 51 72
159 193 97 25
146 91 97 63
1,110
Acre- feet.
190 174 156 220489 594 299
76 449 278 297 194
3,420

ISLAND OP OAHU. 87
EAST BRANCH OF MANOA STREAM NEAR HONOLULU, OAHTT.
LOCATION. At highway bridge 400 feet above confluence with West Branch of Manoa stream, in upper Manoa Valley, and 4 miles northeast of Honolulu post office From May 29,1913, to May 19, 1914, station was 200 feet upstream from bridge.
RECORDS AVAILABLE. May 29, 1913, to June 30, 1917.GAGE. Stevens 8-day water-stage recorder. Watson water-stage recorder from May
29, 1913, to September 28, 1914. Vertical staff gage 200 feet upstream on right bank at different datum was read from May 29, 1913, to May 19, 1914.
DISCHARGE MEASUREMENTS. Made by wading for low and ordinary high-water stages; flood measurements may be made from highway bridge.
CHANNEL AND CONTROL. Channel steep just above gage, but slope is reduced for 30 feet past gage to control, which is a riffle of small boulders and gravel, and control shifts considerably. At low and medium stages stream past gage is fairly wide and deep and velocity is well distributed. Banks are fairly steep and covered with vegetation.
EXTREMES OF DISCHARGE. Maximum stage recorded during period of record, 5.2 feet at 4 p. m. March 19, 1917 (discharge, from extension of rating curve, 400 million gallons per day, or 619 second-feet); minimum daily discharge, March, 1914, 0.9 million gallons per day, or 1.4 second-feet.
Minimum stage recorded during year, 1.3 feet March 5-9 (discharge, 1 million gallons per day, or 1.55 second-feet).
DIVERSIONS. East Manoa ditch diverts a quarter of a mile above station for irrigation.RE GULATION . None.UTILIZATION. Records on East and West branches of Manoa stream together show
amount of surface water available in upper Manoa Valley above nearly all diver sions. Practically the entire low-water flow of Manoa stream is utilized at lower elevations in Manoa Valley for irrigation of rice and taro.
ACCURACY. Rating curves well denned. Gage-height record continuous. Records good for all stages.
Discharge measurements of East Branch of Manoa Stream near Honolulu, Oahu, during the year ending June 30, 1917.
Date.
July 13 Aug. 29 Sept. 29 Dec. 4 Jan. 10 Feb. 23 Mar. 14
19 May 14 June 13
21
Made by
H. A. R. Austin. . ..................................................do..............................................................do..............................................................do..............................................................do...............................................................do.........................................................R.C. Rice.... ............. .........................................do.........................................................H.A..R. Austin......................................... :...........do..............................................................do.........................................................
Gage height (feet).
1.54 1.43 1.50 1.75 2.32 1.38 1.54 1.99 1.71 1.53 1.47
Discharge.
Second- feet.
5.22 3.16 4.50
10.1 41 2.45 5.29
17.2 8.0 3.96 2.67
Million gallons per day.
3.4 2.0 2.9 6.5
26 1.6 3.4
11 5.2 2.6 1.7

88 SURFACE WATER SUPPLY OF HAWAII, 1916-11.
Daily discharge, in million gallons, of East Branch of Manoa Stream near Honolulu, Oahu, for the year ending June SO, 1917.
Date.
1..............2..............3..............4..............5..............
6..............7..............8..............9..............10..............
11..............12..............13..............14..............15..............
16..............17..............18..............19..............20..............
21..............22..............23..............24..............25..............
26..............27..............28..............29..............30..............31..............
July.
2.42.49.45.43.8
3.03.03 n2.42.4
3.02.43.02.42.4
7.28.24.54.53.8
3.83 (\2.42.43.0
3.03.03.83.03.06.2
Aug.
4.56.24.58.24.5
7.24.53.83.83.8
3.83.03.0
' 8.2q 4.
4.55.43.85.44.5
6.23 0
3 0
3.83.0
3.03.03.02.42 43.0
Sept.
2.43.81.81.81.8
1.83.01.81.81.4
1.42.41.41.41.4
1.41 41.42.41.4
1.82 A
1.41.41.8
5.43.83.83.03.0
Oct.
3.02.42.41.81.8
2.41.81.82.41.8
1.81.81.81 Q
1 Q
1 0
2.42 A
2.42.4
2.42.42.43.02.4
2 A
4 fi
5.43 A
2.42.4
Nov.
2.42.42.45.43.8
3.83.03 r\2.42.4
3.02.42.42 A
3.0
2.46.20 9
3.02.4
2.41 a1.81.81.8
4 H2.46.23.03.0
Dec.
3.0151414
H 4
4.56.23.83 n
^ ni n4.53 f\
3 f\
2.44.56.28.23.8
3.03 0
3 Q
5.43.0
9 A
5.49.45 A
3.03.0
Jan.
2.42.42.42.43.0
2.41.81.81.8
17
3 03.02.42.42.4
3.02 A
1.83.06.2
3.01.81.82.41.8
144.53.03.02.42.4
Feb.
2.41.81.81.41.4
1.41.41.41.41.4
1.41.4^ ft
1.81.4
1.41.41.81.81.8
1.81.41.41.41.4
1.41.41.4
Mar.
1.41.41.41.41.0
1.01.01.01.01.4
3.03.03.0fi 9
5.4
3 0
3.03.0
1514
5.03.53.53.55.0
4 9
3.54.25.03.54.2
Apr.
3.53.53.52.82.8
2.82.2
2.22.82.2
6.83.52.82.21.7
1.71.71.71.71.2
1.73 K
3 C
2.21.7
1.71.75.9
113.5
May.
5.05.94.23.53.5
3.53.52.82.82.2
2.22.22.23.52.2*> 9
2.23.55.02.8
2.22 9
2 9
2.22.2
2 9
1.72.22.25.03.5
June.
2.82.22.22.22.2
2.82.84 25.92.8
4.22.82.82.22.2
2.22.22.22.21.7
1.71.71.71.71.7
1.71.71.71.71.7
NOTE. Discharge determined from well-defined rating curves applicable July 1 to Mar. 19 and Mar. 20 to June 30. Discharge Jan. 7-13 determined by comparison with records of flow of West Branch.
Monthly discharge of East Branch of Manoa Stream near Honolulu, Oahu, for the yearending June 30,1917.
Month.
July................................
September ..........................
April...............................May................................
Discharge.
' Million gallons per day.
Maximum.
9.4 9.4 5.4 5.4 8.2
15 17 3.0
15 11 5.9 5.9
17
Minimum.
2.4 2.4 1.4 1.8 1.8 2.4 1.8 1.4 1.0 1.2 1.7 1.7
1.0
Mean.
3.72 4.50 2.17 2.41 3.17 5.20 3.48 1.59 3.76 2.99 2.99 2.39
3.22
Second- feet
(mean).
5.76 6.96 3.36 3.73 4.90 8.05 5.38 2.46 5.82 4.63 4.63 3.70
Total run-off.
Million gallons.
115 139 65 75 95
161 108 45
116 90 93 72
4.98 I 1,170
Acre- feet.
354 428 200 229 292 495 331 137 358 275 284 220
3.600

ISLAND OP OAHTJ. 89
MAKAWAO SPRING NEAR KAILtTA, OAHU.
LOCATION. Fifteen feet above flume joining Makawao ditch, three-fourths of a mile south of Maunawili ranch, and about 3 miles south of Kailua.
RECORDS AVAILABLE. February 12, 1914, to November 30, 1916.GAGE. Vertical staff.DISCHARGE MEASUREMENTS. Made by a 1-foot sharp-crested wier with end con
tractions.CHANNEL AND CONTROL. Water emerges from ground directly into pool back of
weir.EXTREMES OP DISCHARGE. Maximum stage recorded during period of record,
January 1-31, 1916 (discharge, 0.5 million gallons per day, or 0.77 second-foot); minimum stage recorded, 0.29 foot frequently (discharge, 0.32 million gallons per day, or 0.50 second-foot).
DIVE RSIONS . None.RE GULATION . None.UTILIZATION. Irrigation of sugar cane by Waimanalo Sugar Co.ACCURACY. Gage read once daily. Flow steady and conditions at weir good. Rec
ords good.
Monthly discharge of Makawao Spring near Kailua, Oahu,for year ending June SO, 1917.
Month.
July................................
The period.. ..................
Discharge.
Million gallons per day.
Maximum.
0.35 .34 .34 .32 .32
Minimum.
0.32 .34 .34 .32 .32
Mean.
0.33 .34 .34 .32 .32
Second- feet
(mean).
0.51 .53 .53 .50.50
Total run-off.
Million gallons.
10 11 10
" 10 10
51
Acre- feet..
31 32 31 3029
153
MAIN SPRING NEAR KAILUA, OAHTT.
LOCATION. At head of Makawao ditch, 1 mile south of Maunawili ranch, and about 3 miles south of Kailua.
RECORDS AVAILABLE. February 12, 1914, to November 30, 1916.GAGE. Vertical staff.DISCHARGE MEASUREMENTS. Made by a 1-foot sharp-crested wier with end con
tractions.CHANNEL AND CONTROL. Water emerges from ground directly into pool back of
weir.EXTREMES OP DISCHARGE. Maximum stage recorded during period of record.
0.60 foot January 1-31, 1916 (discharge, 0.88 million gallons per day, or 1.36 second-feet); minimum stage recorded, 0.39 foot March 17-28, 1914 (discharge, 0.48 million gallons per day, or 0.74 second-foot).
DIVERSIONS. None.REGULATION. None.UTILIZATION. Irrigation of sugar cane by Waimanalo Sugar Co.ACCURACY. Gage read once daily. Records fair. There is a small amount of seep
age around weir and a velocity of approach of about 0.4 foot per second.

90 SURFACE WATER SUPPLY OP HAWAII, 1916-1*1.
Monthly discharge of main spring near Kailua, Oahu,for year ending June 30,1917.
Month.
July................................
October ...............'..............
Discharge.
Million gallons per day.
Maximum.
0.78 .72 .67 .63 .63
Minimum.
0.70 .67 .67 .63 .63
Mean.
0.74 .69 .67 .63 .63
Second- feet
(mean).
1.14 1.07 1.04 .97 .97
Total run-off.
Million gallons.
23 21 20 20 19
103
Acre- feet.
70 66 62 6058
316
HAIKtT STREAM NEAR HEEIA, OAHtT.
LOCATION. Sixty feet above intake of reservoir ditch, \\. miles west of Heeia.RECORDS AVAILABLE. January 29, 1914, to June 30, 1917.GAGE. Stevens water-stage recorder installed April 28, 1914, at same location and
datum as staff gage; original staff-gage datum was raised-0.88 foot March 29, 1914.DISCHARGE MEASUREMENTS. Made by wading or from footbridge.CHANNEL AND CONTROL. One channel at all stages; straight for 20 feet above and
40 feet below station; banks steep and high; stream bed of solid rock. Control is smooth, solid-rock ledge; permanent.
EXTREMES OP DISCHARGE. Maximum stage recorded during period of record, 6.5 feet at 1 a. m: March 20, 1917 (estimated discharge, 250 million gallons per day, or 390 second-feet); minimum stage recorded, 0.6 foot July 16,1916, and February 9-12, 1917 (discharge, 1.4 million gallons per day, or 2.2 second-feet).
DIVERSIONS. None above station.REGULATION. None.UTILIZATION. Low flow diverted below station for domestic supply and for irrigation
of taro and rice.ACCURACY. Rating curves are well denned for low and medium stages; records
good. High-water extension of rating curve not based on measurements, and determinations above 16 million gallons per day may be considerably in error.
Discharge measurements of Haiku Stream near Heeia, Oahu, during the year ending JuneSO, 1917.
Date.
Mar. 2 Apr. 30
Made by
H. A.R. Austin... .................................................do..........................................................
Gage height (feet).
0.69 .81
Discharge.
Second- feet.
2.80 5.14
Million gallons
per day.
18 3.3

ISLAND OF OAHU. 91
Daily discharge, in million gallons, of Haiku Stream near Heeia, Odhu, for the year endingJune 30, 1917.
Date.
1... ...........2..............3..............
5..............
6..............7..............8:.............9..............10..............
11..............12..............13..............14..............15..............
16..............17..............18..............19..............20..............
21..............22..............23..............24..............25..............
26..............27..............28..............29..............30..............31..............
July
3.03.03.03.03.0
2.42.42.43.02.4
3.02.42.41.91.9
1.44.33.03.03.0
3.03.02.43.03.0
3.02 42.42 42.4"> A.
Aug.
2.43.03.03.02.4
3.03.03.02.42.4
2.42.42.43.03.0
3.03.03.03.03.0
3.03.03.04.3
3.6
3.63.63.63 A
Sept.
3.03.03.03.03.0
2.42.42.42.42.4
2.42.42.42 43.0
3.03.03.02.43.0
3.02.42 42 42.4
3.63.02.42.42.4
Oct.
2.42.42 42 42 4
2.42.42.42.42.4
2.41.91.91 O1.9
1 O1.92 4
2 A
2.4
2 41 Q"> 4
2.42.4
2 A
2.43.63 n2.42.4
Nov.
2.42.42.43.63.0
2.43.02.42.42.4
2 42.42.4"> 4
3.0
2.43.07.83 A
3 ft
2.40 A.9 4
2.42.4
3.02.43.03.02.4
Dec.
2.45.05.75.73.0
3.06.43.03.02.4
2.42.42.42.42.4
2 43.03.63.03.0
2.42.42.43.63.0
2 A
3.07.13.63.03 n
Jan.
2 42.42.42.42.4
2.42.42.43.0
14
3.62.42.42.42.4
3.63.02.46.45.7
3.03.02 42.42 4
5.73.03.03.03.02 4
Feb.
2.42.4
. 2.42.41.9
3.01.91.91.41.4
1.41.43.02.41.9
1.91.9
2.42.4
2.42.42.43.03.0
3.03.02.4
Mar.
2.12.12.12.12.1
. 2.12.12.1
115.3
2.1223.97.63.2
4.63.23.2
2616
3.93.22.62.63.2
2.62.12.12.12.12.1
Apr.
2.12.12.12.12.1
2.12.12.12.12.1
3.22.12.12.12.1
2.12.12.12.12.1
2.12.12.12.62.1
2.12.16.07.63.2
May.
2.63.92.62.62.6
2.12.12.12.12.6
2.62.62.63.23.2
3.23.24.6
113.9
3.23.23.23.22.6
2.62.62.1
, 2.1275.3
June.
2.12.12.12.12.6
2.12 12.12.12.1
2.12.12.12.63.2
2.62.62.62.62.6
2.62.62.62.62.6
2.62.62.62.62.6
NOTE. Discharge determined from rating curves well defined below 16 million gallons per day, appli cable July 1 to Feb. 28 and Mar. 1 to June 30.
Monthly discharge of Haiku Stream near Heeia, Oahu, for year ending June SO, 1917.
Month.
July.................................
September .................:........October.............................
December. ..........................
April................................May.................................
Discharge.
Million gallons per day.
Maximum.
4.3 4.3 3.6 3.6 7.8 7.1
14 3.6
26 7.6
27 3.2
21
Minimum.
1.4 2.4 2.4 1.9 2.4 2.4 2.4 1.4 2.1 2.1 2.1 2.1
1.4
Mean.
2.69 3.02 2.68 2.35 2.80 3.31 3.35 2.32 4.95 2.50 3.95 2.42
3.04
Second- feet
(mean).
4.16 4.67 4.15 3.64 4.33 5.12 5.18 3.59 7.66 3.87 6.11 3.74
4.70
Total run-off.
Million gallons.
83 94 80 73 84
102 104 65
154 75
122 73
1,110
Acre- feet.
256287 247 224 258 315 319 199 471 230 376 223
3,400
KAHANA STREAM NEAR KAHANA, OAHU.
LOCATION. Half a mile above confluence with East Branch of Kahana stream,miles above mouth of stream, and south of Kahana.
RECORDS AVAILABLE. June 19, 1914, to June 30, 1917. GAGE. Stevena water-stage recorder. DISCHARGE MEASUREMENTS. Made by wading or from cable.

92 SURFACE WATER SUPPLY OF HAWAII, 1916-11.
CHANNEL AND CONTROL. One channel at all stages; straight for 50 feet above and 150 feet below gage; stream bed of gravel and boulders; right bank steep and high; left bank slopes gently. Control composed of large and small boulders; shifts during floods.
EXTREMES OP DISCHARGE. Maximum stage recorded during period of record, 7.5 feet at 3 a. m. March 9, 1917 (discharge, approximately 1,400 million gallons per day, or 2,170 second-feet); minimum stage recorded, 0.8 foot September 4-11, 1916 (discharge, 11 million gallons per day, or 17 second-feet).
DIVERSIONS. None above station.REGULATION . None.UTILIZATION. Irrigation of sugar cane, taro, and rice.ACCURACY. Owing to instability of control, good rating curves were not developed.
Records fair for low and medium stages.
Discharge measurements of Kahana Stream near Kahana, Oahu, during the year endingJune 30, 1917.
Date.
Sept. 26 Nov. 8 Dec. 7 Mar. 6 Apr. 10 May 9
Made by
H. A. R.Austin....................................................do...............................................................do...............................................................do............................................................. ..do....... .................. .................................R. D. Klise....................................................
Gage height (feet).
1.15 1.04 3.40 .78 .86 .95
Discharge.
Second- feet.
33.8 25.0
347 18.8 24 24
MiUion gallons
per day.
22 16
224 121616
Daily discharge, in million gallons, of Kahana Stream near Kahana, Oahu, for the yearending June 30, 1917.
Date.
1..............2..............3..............4.. ............5..............6..............7..............8..............9..............10..............11..............12..............13..............14..............15..............16..............17..............18..............19..............20..............21..............22..............23..............24..............25..............26..............27..............28..............29..............30..............31..............
July.
13131614141313131313141414141426692620201818161618182018161818
Aug.
1820222018
22181816151514695822242018161616141312121212121213
Sept.
1613121111111111111111201212131314111313i<*282013133036242216
Oct.
16141414141413131312121413131212162220
1816162422182226242220
Nov.
16141424 18
20202224302018161616142233161413131212121614262218
Dec.
185371623981623328242020241616131353282020161826K141418201818
Jan.
20161818261814131458201616141422241618221614202626532620181616
Feb.
15182015151413131313131316161413131514141313131313131413
Mar.
1313131313131212
104323511060603532282570855641353570653532322523
Apr.
212825211919171921162317,306524242018161516562822242018375631
May.
242220181616181515152816162216161651110432422282220182218184356
June.
2?26222C2C242 34642f-222C20If26241616161515151414141414141313
NOTE. Discharge determined from rating curves applicable «s follows: July to Aug. 14, Jan. 27 to Mar. 9, and Apr. 15 to June 30, well defined below 200 million gallons per day; Aug. 15 to Jan. 26,poorly defined: Mar. 10 to Apr. 14, poorly defined. Discharge July 31 to Aug. 6, Sept. 23-25, Oct. 4-8. 29-31, Nov. 7,14-18 Dec. 2, 4-21, 28-31, Jan. 1 and 2, and Feb. 7-11 determined by comparison with records of flow of Kaluanu stream.

ISLAND OF OAHU. 93
Monthly discharge of Kahana Stream near Kahana, Oahu, for year ending June 30,1917.
Month.
July.................................
October .............................
Discharge.
Million gallons per day.
Maximum.
69 69 36 26 33 81 58 20
110 65
110 64
110
"Minimum,
13 12 11 12 12 13 13 13 12 15 15 13
11
Mean.
18.1 19.6 15.6 16.7 18.2 28.7 20.9 14.1 39.6 25.5 25.9 20.8
22.1
Second- feet
(mean).
28.0 30.3 24.1 25.8 28.2 44.4 32.3 21.8 61.3 39.5 40.1 32.2
34.2
Total run-off.
Million gallons.
560 607 467 519 545 890 648 395
1,230 766 804 623
8,050
Acre- feet.
1,720 1,860 1,440 1,590 1,680 2,730 1,990 1,210 3,770 2,350 2,460 1,920
24,700
EAST BRANCH OF KAHANA STREAM NEAR KAHANA, OAHU.
LOCATION. Just above headquarters of Kahana Agricultural Co., 500 feet above confluence with main Kahana Stream, and 1 mile south of Kahana.
RECORDS AVAILABLE. April 30, 1914, to March 8, 1917, when station Was discon tinued.
GAGE. Vertical staff.DISCHARGE MEASUREMENTS. Made by wading or from cable.CHANNEL AND CONTROL. Two channels at high stages; straight for 50 feet above
and below gage; left bank steep and high; right bank low and is overflowed at high stages. Control is a riffle of small boulders; not well defined; shifting.
EXTREMES OP DISCHARGE. Maximum stage recorded during period of record, 4.62 feet at 6 p. m. November 10, 1915 (discharge, approximately 200 million gallons per day, or 309 second-feet); minimum stage recorded, 1.14 feet June, 1915 (dis charge, 0.8 million gallons per day, or 1.2 second feet).
Minimum stage recorded during year, 1.0 foot September, October, and Feb ruary (discharge, 1.2 million gallons per day, or 1.9 second-feet).
DIVERSIONS. None above station.REGULATION. None.UTILIZATION. Irrigation of taro.ACCURACY. Gage read twice daily. Records are poor owing to instability of control
and infrequency of discharge measurements.
Discharge measurements of East Branch of Kahana Stream near Kahana, Oahu, during the year ending June 30, 1917.
[Made by H. A. R. Austin.]
Date.
Sept. 26............Nov.8. ............
Gage height (feet).
1.12 1.20
Discharge.
Second- feet.
2.69 4.00
Milliongallons
per day.
1.7 2.6
iDate.
Dec. 21.. ...........
Gage height (feet).
1.14
Discharge.
Second- feet.
5.09
Million gallons
per day.
3.3

94 SURFACE WATER SUPPLY OF HAWAII, 1916^17.
discharge, in million gallons, of East Branch of Kahana. Stream near Kahana, Oahu, for the year ending June 30, 1917.
Date.
1. ..........................2...........................3...........................4...........................5...........................6...........................7...........................8...........................
10...........................11...........................12...........................13...........................14...........................15...........................16...........................17...........................18...........................19...........................20...........................21...........................
23...........................24...........................25...........................26...........................27...........................2829...........................30...........................31...........................
July.
1.71.72.21.71.71.71.71.71.71.71.71.71.71.71.71.79 05 Q
3 0
2 9
9 9
2 9
1.71.72 9
2.22 9
2 9
1.71.72 9
Aug.
9 92 97.44.42 9
2.22.22.22 9
2 9
2 9
1.71.79 0
H5.95.94.43 0
3 0
2 9
2 9
2 O
2 0
3 0
2.21.71.71.71.71.7
Sept. '
1.71 71.71.71.71.71.71 91 91 9
1 9
1 9
1 91 91 9
1 9
1 9
1.71 9
1 9
1 9
5 Q
3 0
1 9
1.71.71.71.72 9
1.7
Oct.
1.71.71.71 91.21.71.71.71.71.21 91 9
1 91 9
1 9
1 91 9
1.72 9
3 Q
2.22 9
2 9
2 9
1.72.22 9
3 0
3 0
3 0
3 0
Nov.
2.22.21.74.43.33.33.33 0
3 0
3.3
3 O
3 O
2 9
2 9
2 9
4.45 Q
7.45.93 0
2 92 9
2 9
2 9
2 9
2.22 9
16
3 0
Dec.
2.2161620129.0
242019
7.44.44.44.44.44.43.33.3
11113.33.33 O
3 0
5 Q
5 Q
4.43 0
14167.45.9
Jan.
4.44.44.44.45.94.43.33.33.3
165.94.43.33.35.9
4.47.45.9
165 Q
Q n2619
7.47.45.94.4
Feb.
4.43.3
.5.94.43.32.22.21.71.71.71.71.71.72.21.71.21.21.21.71.21.21.21.21.21.21.21.21.2
Mar.
1.21.21.21.21.21.21.23.3
NOTE. Discharge determined from poorly defined rating curves applicable as follows: July 1 to Aug. 15 and Dec. 9 to Mar. 8, and Aug. 16 to Dec. 8.
Monthly discharge of East Branch of Kahana Stream near Kahana, Oahu, for year endingJune 30, 1917.
Month.
July:................................
March 1-8. ..........................
Discharge.
Million gallons per day.
Maximum.
9.0 11 5.9 3.3
16 24 5.9 3.3
Minimum.
1.7 1.7 1.2 1.2 1.7 2.2 1.2 1.2
Mean.
2.27 3.25 1.68 1.91 3.65 8.55 2.00 1.46
Second- feet
(mean).
3.51 5.03 2 60 2.95 5.65
13.2 3.09
, 2.26
Total run-off.
Million gallons.
70 101 50 59
110 265
56 12
Adre- feet.
216 309 155 182 336 813 172 36
PUNALUU STREAM AT ELEVATION 539 FEET.a NEAR PUNALTTU, OAHU.
LOCATION. About a quarter of a mile below confluence of 'Kalena and Pio branches of the stream, and 5 miles by road and foot trail south of Punaluu railroad station.
RECORDS AVAILABLE. April 27, 1915, to June 30, 1917.GAGE. Friez water-stage recorder substituted for 8-day Stevens recorder February
16, 1916.DISCHARGE MEASUREMENTS. Made by wading or from cable 150 feet above gage.CHANNEL AND CONTROL. One channel at all stages, straight for several hundred feet
above and below station; composed of boulders and gravel; right bank slopes sharply; left bank vertical; both banks fairly clean up to extreme flood stages. Control composed of large boulders; fairly permanent.
a Elevation given in Water-Supply Paper 430 as 600 feet.

ISLAND OF OAHU.- 95
EXTREMES OF DISCHARGE. Maximum stage recorded during period of record, 5.04 feet at 8 p. m. November 10, 1915 (discharge, approximately 300 million gallons per day, or 464 second-feet); minimum stage recorded, 0.7 foot September, 1916 (discharge, 2.0 million gallons per day, or 3.1 second-feet).
DIVERSIONS. None above station.REGUIATION. None.UTILIZATION. Part of low-water flow is diverted at low elevation for irrigation of sugar
cane, rice, and taro. Station was established to determine the feasibility of a project to divert the water of the upper Punaluu Valley to augment the water diverted from the Kahana Valley by the Waiahole Water Co.
ACCURACY. Determinations based on rating curve well defined below 6 million gallons per day. Records good for low and medium stages.
Discharge measurements of Punaluu Stream at elevation 539 feet, near Punaluu, Oahu, during the year ending June 30, 1917.
Date.
July 11 Sept. 27 Nov. 9 Feb. 12
13 14 15
Apr. 11
Made by
H. A. B.Austin....................................................do...............................................................do..........................................................R.D.Klise... ......................................................do...............................................................do...............................................................do..........................................................H. A. R. Austin.... ...........................................
Gage height (feet).
0.73.87 .88 .80 .80 .88 .82 .91
Discharge.
Second- feet.
3.39 6.22 6.21 4.86 4.80 6.82 5.30 7.28
Million gallons per day.
2.2 4.0 4.0 3.1 3.1 4.4 3.4 4.7
Daily discharge, in million gallons, of Punaluu Stream at elevation 539 feet, near Punaluu Oahu, for the year ending June 30, 1917.
Date.
1..... .........2..............3..............4..............5..............
6., .............7..............8..............9..............10..............
11..............12..............13..............14..............15..............
16..............17..............18..............19..............20..............
21..............22...............23..............24..............25..............
26..............27..............28..............29.............. 30.............. 31..............
July.
2.52.5s n3.0<? n
2.52.52.52.52.5
2.5<? n3.03.8<? n
4.69.85.53.83.8
3.83.03.03.02.5
2.52.52.52.5 2.53,8
Aug.
2.53.84.64.6<? a
6.45.53.83.8<? n
3.0s n<? n9.8
11
6.45.55 E
4.64.6
3.83.83.83.83.0
3.0<? n3.03.0 3.0 3.0
Sept.
3.03.03 fl
2 e
2.5
2.52.52.52.52.0
2.5<? a2.52.52 C
3.02.02.02.02.0
2.0,4.63.02.53.0
8.57.45.55.5 3.8
Oct.
3.0<? no n3 n<? n
3.03 n3 n2.52 C
2.5Q n3.02.52 E
2.52.53 0
3.83 a
3 n3.03.03.84.6
3.04.6
127.4 7.4 5.5
Nov.
4.64.63 0
4.64.6
4.6Q ft
4.67.49 0
5.54.64.63.85.5
4.67.4
176.45.5
4.64.64.6<? a3.8
3.83 0
6.45.5 5.5
Dec.
4.6129 0
14o a
17148.57.46 4
5.55.56.44.64.6
3 O
3 ft
19
7.45 K
5 C
5.54.66.44.6
' 3.84.66.48.5 5.5 5.5
Jan.
5.53.84.64.65.5
4.64.64.64.6
11
6.45.54.64.64.6
8.56.44.64.66.4
4.63 0
6.48.58.5
167.46.45.5 4.6 4.6
Feb.
4.65.55 e
4.63 O
3.83 0
3 O
3.8Q' Q
3.83 A
4.64.63 0
3 fl
3.03 0
3 fl
3 fl
3 fl
3 fl
3 n3.0<? n
3.03 A
3.0
Mar.
2.52.52 E
2 e
2 e
2.52 C
2.5194.6
7.440141719
19
9.88.5
2491
1912
Q a1234
169 O
8.58.5 7.4 7.4
Apr.
6.49.87.46.46.4
5.55.55.55.55.5
7.45.5
17179 O
7.47.47.46.46.4
7.4167.47.48.5
7.46.4
1219 11
May.
8.58.57.47.46.4
8.59 0
6.46.46.4
116.46.47.46 A
6 46.4
141712
9 0
8 C
9 87.47.4
6.46.47.47.4 7.4 7.4
June.
7.47.47.47.46.4
7.48.59.8
168.5
6.45.55.55.56.4
6.45.55.55.55.5
4.64.64.64.64.6
4.63.83.83.8
, 3.8
NOTE. Discharge determined from rating curve well defined below 6 million gallons per day. Discharge Jan. 9-16 and 24-26 computed by comparison with records obtained at lower Punaluu station.

96 SURFACE WATER SUPPLY OF HAWAII, 1916-17.
Monthly discharge of Punaluu Stream at elevation 539 feet, near Punaluu, Oahu,for yearending June 30, 1917.
Month.
July.................................
Discharge.
Million gallons per day.
Maximum.
9.8 11 8.5
12 17 17 16 5.5
40 19 17 16
40
Minimum.
2.5 2.5 2.0 2.5 3.8 3.8 3.8 3.0 2.5 5.5 6.4 3.8
2.0
Mean.
3.25 4.34 3.22 3.75 5.46 7.21 6.00 3.66
11.4 8.60 8.21 6.22
5.96
Second- feet
(mean).
5.03 6.72 4.98 5.80 8.45
11.2 9.28 5.66
17.6 13.3
' 12.7 9.62
9.22
Total run-off.
Million gallons.
101 13497
116 164 224 186 103 354 258 254 187
2,180
Acre- feet.
309 413 296 357 503 686 571 314
1,080 792 781 573
6,680
PUNALUU STREAM AT ELEVATION 250 FEET, NEAR PUNALUU, OAHU.
LOCATION. About 1J miles by road and horse trail south of Punaluu railroad station.RECORDS AVAILABLE. May 14, 1914, to June 30, 1917.GAGE. Stevens water-stage recorder.DISCHARGE MEASUREMENTS. Made by wading or from cable about 150 feet below
CHANNEL AND CONTROL. One channel at all stages; straight for 200 feet above and below gage; bed composed of large boulders; right bank slopes gradually and is covered with small trees and vegetation; Jeft bank slopes sharply and is covered with vegetation. Control composed of large boulders; apparently permanent.
EXTREMES OF DISCHARGE. Maximum stage recorded during period of record, 5.85 feet at 5 a. m. September 23, 1914 (discharge, approximately 700 million gallons per day, or 1,080 second-feet); minimum stage recorded, 1 foot March, August, and September, 1915 (discharge, 10 million gallons per day, or 15 second-feet).
Minimum stage recorded during year, 1.05 feet July, August, September, Octo ber, and March (discharge, 12 million gallons per day, or 18.6 second-feet).
DIVERSIONS. None above station.REGULATION. None.UTILIZATION. Part of low-water flow is diverted for irrigation of sugar cane, rice,
and! taro.ACCURACY. Stage-discharge relation constant; rating curve goodi Records good for
all stages except for several short periods when discharge was estimated because there was no gage-height record.
Discharge measurements of Punaluu Stream at elevation 250 feet, near Punaluu,"Oahu, during the year ending June 30, 1917.
Date.
July 11........
May 13........
Made by
.....do...................................................
.....do....................................................R. D. Klise.... ..........................................
Gage height (feet).
1.07 1.13 1.19 1.27
Discharge.
Second- feet.
20 24.8 28.3 32.8
Milliongallons per day.
1316 18 21

ISLAND OF OAHTJ. 97
Daily discharge, in million gallons, ofPunaluu Stream at elevation 250 feet, near Punaluu, Oahu,for the year ending June 30, 1917.
Date.
1. .............2..............3..............
5..............
6..............7..............8..............9..............10..............
11..............12..............13..............14..............15..............
16..............17..............18..............19..............20..............
21..............22..............23..............24..............25..............
26. .............27..............28..............29..............30..............31..............
July.
1414141414
1212121212
1214141412
1631191614
1414141212
121212121214
Aug.
1416191614
1619
1414
1414122838
2219191916
1616161414
141414141414
Sept.
1414141212
1219
121212
1214121212
1412121219
1216141212
2525191914
Oct.
141414
14
14191 9
1212
1916101414
1414141616
1614
1616
141638282219
Nov.
1616141616
1614161928
191614
14
14225022in
1616141414
141499
1919
Dec.
1942344634
5546312825
99
22OK
191Q
1616422810
1919192510
1619OK
281919
Jan.
99
16191919
1919191934
OK
221Q
1919
°.i319999OQ
2219313131
503128252522
Feb.
9999OK
19
1Q
16161616
161699
1916
1616191616
141414
141614
Mar.
191919
1219
19
12146010
28100384234
3828256469
5034283155
383128282525
Apr.
oeoeOQ
9Hoo
2299999910
2519384228
99
2299
1910
2242OK
99
31
2222425038
May.
Q1
28259*1oo
9fio-i
oo
22lo
281999
2522
9999
556434
2825
. 28OK
22
222299
223142
June.
OQ
2599
2299
280-1
34289*1
9999oo1Q
9*1
259999101O
10
19101019
1616161616
NOTE. Discharge determined from rating curve well defined below 100 million gallons per day. Dis charge Dec. 1-7,11-19, Jan. 1-3, 6-10, Mar. 9-12, and June 6-8 determined by comparison with records of flow of Punaluu Stream at elevation 539 feet.
Monthly discharge of Punaluu Stream at elevation 250 feet, near Punaluu, Oahu, foryear ending June SO, 1917.
Month.
July.................................
April................................
Discharge.
Million gallons per day.
Maximum.
31 38 25 38
50 55 50 25
100 50 64 34
100
Minimum.
12 12 12 12 14 16 16 14 12 19 19 16
12
Mean.
13.9 16.7 13.9 16.2 17.9 26.3 24.5 17.0 32.8 26.8 27.5 21.9
21.3
Second- feet
(mean).
21.5 25.8 21.5 25.1 27.7 40.7 37.9 26.3 50.7 41.5 42.5 33.9
33.0
Total run-off.
Million gallons.
432 517 418 501 537 815 758 476
1,020 804 852 657
7,780
Acre- feet.
1.320 1,590 1,280 1,540 1,650 2,500 2,330 1,460 3,120 2,470 2,620 2,020
23, 900
WAIHOI STREAM NEAR PUNALUU, OAHU.
LOCATION. Half a mile above confluence with Punaluu Stream, 3 miles by road and trail from Government highway, and 6 miles by road and trail south of Hauula.
RECORDS AVAILABLE. April 27, 1915, to June 30, 1917.40532° IS WSP 465 7

98 SURFACE WATER SUPPLY OF HAWAII, 1916-17.
GAGE. Vertical staff. New datum January 19, 1916. Stevens 8-day water-stagerecorder in use April 27 to November 9, 1915.
DISCHARGE MEASUREMENTS. Made by wading. CHANNEL CONTROL. One channel at all stages; very steep and rough.; both banks
high and wooded. Control composed of large boulders; shifts somewhat owingto growth of grass and roots at the banks.
EXTREMES OF DISCHARGE. Maximum stage recorded, 1.46 feet at 2 p. m. November3, 1915 (discharge, approximately 9.0 million gallons per day, or 14 second-feet);minimum daily discharge, November 13-24, 1916 (2.5 million gallons per day,or 3.9 second-feet).
DIVERSIONS. None above station. REGULATION . None.UTILIZATION. Station established in connection with contemplated plan for devel
opment of Punaluu waters.ACCURACY. Flow so steady that water-stage recorder was removed November 9,1915,
and only weekly readings of staff gage were made after that; for this reason some of the higher stages were doubtless not recorded. Records fair.
Discharge measurements of Waihoi Stream near Punaluu, Oahu, during the year endingJune 30, 1917.
[Made by H. A. R. Austin.]
Date.
July 11.............
Gage height (feet).
0.82.78
Discharge.
Second- feet.
5.0 4.8
Million gallons
per day.
3.2 3.1
Date.
Mar. 7... ...........
Gage height (feet).
0.81
Discharge.
Second- feet.
5.1
Million gallons
per day.
3.3
Monthly discharge of Waihoi Stream near Punaluu, Oahu, for year ending June SO, 1917.
Month.
July.................................
The year. .....................
Discharge.
Million gallons per day.
Maximum.
4.1 3.6 3.5 3.1 3.6 3.5 4.3 3.3 4.5 4.1 4.3 4.3
4.5
Minimum.
3.2 3.2 3.1 2.9 2.5 3.0 3.2 3.2 3.2 4.1 4.1 3.9
2.5
Mean.
3.58 3.42 3.27 3.08 2.76 3.18 3.38 3.28 4.08 4.10 4.25 1.10
3.54
Second- feet
(mean).
5.54 5.29 5.06 4.77 4.27 4.92 5.23 5.07 6.31 6.34 6.58 6.34
5.48
Total run-off.
Million gallons.
Ill 106 98 96 83 98
105 92
126 123 132 123
1,290
Acre- feet.
341325 301 293 254 303 322 282 388 377 404 377
3,970
NOTE. Determinations based on rating curves fairly well defined for ordinary stage, applicable as fol lows: July 1 to Aug. 15 and Dec. 8 to Mar. 9, Aug. 16 to Dec. 7, Mar. 10 to June 30. Discharge interpolated between weekly observations of gage height.
KALUAKTJI STREAM NEAR HATJULA, OAHU.
LOCATION. At Castle's rest house, 5 miles from Government road and 7\ miles byroad and trail south of Hauula. s
RECORDS AVAILABLE. April 28, 1915, to June 30, 1917. GAGE. Stevens continuous water-stage recorder installed February 17, 1916, in
place of 8-day Stevens recorder.

ISLAND OF OAHU. 99
DISCHARGE MEASUREMENTS. Made by wading.CHANNEL AND CONTROL. One channel at all stages; straight for 25 feet above and
below gage; bed composed of boulders and gravel; right bank slopes gently; left bank steep and high. Control composed of large boulders; probably permanent.
EXTREMES OF DISCHARGE. Maximum stage recorder, 4.8 feet at 2 a. m. March 9,1917 (discharge, approximately 200 gallons per day, or 309 second-feet); minimum stage recorded, 0.75 foot February 25 and 26, 1917 (discharge, 0.25 million gallons per day, or 0.39 second-foot).
DIVERSIONS. None above station.REGULATION. None.UTILIZATION. Irrigation of sugar cane and rice.ACCURACY. Records based on well-defined rating curve and a continuous record
of gage height; good for all stages.
Discharge measurements of Kaluanui Stream near Hauula, Oahu, during the year endingJune 30, 1917.
Date.
Sept. 27 Jan. 5 May 12
Made by
H. A. R.Austin....................................................do..:......................................................R. D. Klise....................................................
Gage height (feet).
1.28 1.42 1.04
Discharge.
Second- feet.
3.575.67 .6
Million gallons
per day.
2.33.7 .35
Daily discharge, in million gallons, of Kaluanui Stream near Hauula, Oahu, for theyear ending June 30, 1917.
Date.
1..............2..............3..............4..............5..............
6..............7... ...........8..............9..............
10..............
11..............12..............13..............14..............15..............
16..............17..............18..............19..............20....:.........21..............22..............23..............24..............25..............
26..............27..............28..............29..............30..............11
July.
1.0.8
4.72.11.7
1.0.8.8.65.65
1.02.61.01.3.65
2.6122.61.71.7
1.31.0.8.65.8
.82.11.7.8
1.32.1
Aug.
2.64.72.14.71.3
2.12.61.31.0.8
1.71.71.08.0
11
2.14.03.23.22.6
2 62.11.71.31.3
.8
.8
.8
.8
.81.3
Sept.
1.72.1.8.8.65
.5
.5
.52.1.65
.51.0.65.5.45
1.7.5.45.65.65
.653.22.11.01.3
5.74.72.12.11.0
Oct.
1.01.0.65.65.5
.65
.5
.651.3.65
.453.21.31.0.8
.65
.82.12.62 6
2 11.72.14.72.6
2.64.0
144.04.02.6
Nov.
2.61.71.74.03.2
2.64.74.04.03.2
2.11.71.31.34.0
1.78.0
122.62.6
1.71.31.31.32 1
2.61.75.73.23.2
Dec.
2.1169.29.23.2
5.76.72.62.62.6
1.71.73.22.11.7
2.63.2
114.02.1
1.72.14.05.72.1
1.73.26.74.72.11.7
Jan.
4.03.23.22.62.1
2.11.31.01.09.2
2.11.31.0.8.8
4.73.21.01.08.0
1.31.04.72.61.7
113.21.71.31.7.8
Feb.
0.81.01.0.8.65
.5
.5
.5
.5
.45
.45
.451.33.2.65
.5
.45
.65
.8
.45
.35
.3
.3
.25
.25
.31.7
Mar.
0.4.35.4
3.2.8
.6
.61.0
142.6
2.1204.78.06.7
8.04.04.0
1215
5.73.22.12.1
14
4.72.12.62.61.32.1
Apr.
1.31.01.3.8.8
.6
.6
.52.1.6
3.22.12.63.23.2
2.61.71.31.01.0
1.78.02.62.16.7
2.62.1
24248.0
May.
3.22.63.22.11.3
1.01.31.0.8.8
1.3:6
1.73.21.7
1.72.1
115.72.6
1.71.04.01.71.0
.8. 1.0
1.7.8
4.04.0
June.
2.11.31.3.8.8
1.01.31.75.71.7
1.71.01.0.8
3.2
4.01.31.71.0.8
.8
.6
.6
.6
.5
.5
.5
.6
.5
.5
NOTE. Discharge determined from well-defined rating curve. Discharge Jan. 3-5 determined by comparison with records of flow of Punaluu Stream.

100 SURFACE WATER SUPPLY OF HAWAII, 1916-17.
Monthly discharge of Kaluanui Stream, near Hauula, Oahu,for year ending June 30,1917.
Month.
July................................
Discharge.
Million gallons per day.
Maximum.
12 11 5.7
14 12 16 11 3.2
20 24 11 5.7
24
Minimum.
0.65 .8 .45 .45
1.3 1.7 .8 .25 .35 .5 .6 .5
.25
Mean.
1.76 2.45 1.37 2.18 3.10 4.16 2.73 .69
4.87 3.78 2.28 1.33
2.58
Second- feet
(mean).
2.72 3.79 2.12 3.37 4.80 6.44 4.22 1.07 7.54 5.85 3.53 2.06
3.99
Total run-off.
Million gallons.
55 76 41 67 93
129 85 19
151 113
71 40
940
Acre- feet.
167 233 126 207 285 396 260 59
463 348 217 122
2,880
KOLOA STREAM NEAR LAIE, OAHTJ.
LOCATION. At elevation about 500 feet, 3 miles by horse trail southwest of Laie.RECORDS AVAILABLE. July 30, 1914, to June 30, 1917.GAGE. Stevens water-stage recorder on left bank.DISCHARGE MEASUREMENTS. Made by wading or from cable about 20 feet below
gage.CHANNEL AND CONTROL. Channel straight for a hundred feet above station; right
bank clean and perpendicular; left bank clean with gradual slope to above high- water stage. On October 23, 1915, a reinforced concrete control 33 feet long having a low-water notch 16 feet in length was completed.
EXTREMES OF DISCHARGE. Maximum stage recorded during year, 3.2 feet at 11 a. m. November 11 (discharge, computed by extension of rating curve, approxi mately 300 million gallons per day, or 464 second-feet); minimum stage recorded, 0.1 foot October 1-8 (discharge, 0.3 million gallons per day, or 0.46 second-foot).
Maximum stage recorded during period of record, 5.3 feet at 9 a. m. September 25, 1914 (discharge, approximately 755 million gallons per day, or 1,170 second- feet); minimum discharge, less than 0.1 million gallons per day, or 0.15 second- foot.
DIVERSIONS. None above station.REGULATION. None.UTILIZATION. Stream is not perennial in its lower course. A small part of the flood
discharge is diverted at low elevation for irrigation of sugar cane. Station was established to determine whether the total discharge of the streams would justify the construction of a large flood-water storage project in the vicinity.
ACCURACY. Records based on rating curve well denned below 40 million gallons per day; good below that limit. Discharge for days of decided fluctuation in stage computed hourly.
Discharge measurements of Koloa Stream near Laie, Oahu, during the year ending June30, 1917.
Date. "
Nov. 11.......
Mar. 9.........Apr. 12........
Made by
H. A. R.Austin. .............................................do........................................................do..........................................'..............do....................................................
Gage height (feet).
0.13 .22 .28 .38 .22
Discharge.
Second- feet.
0.5 2.49 3.43 5.97 1.73
Million gallons
per day.
0.3 1.6 2.2 3.9 1.1

ISLAND OF OAHU. 101
Daily discharge, in million gallons, of Koloa Stream near Laie, Oahu,for the year endingJune 30, 1917.
Date.
1... ...........
3..............4.... ..........5..............6..............7..............8..............9..............
10..............11..............12..............13..............14..............15..............16..............17..............18..............1920..............21..............22..............23..............24..............25..............26. .............27..............28..............29..............30..............31..............
July.
0.6.6.6.6.6.6.6.6.6.6.6.6.6.6.6.6
8,11.0.6.6.6.6.6.6.6.6.6.6.6.6
1.0
Aug.
2.22.21.03.11.01.01.0.6.6.6.6.6.6.6
8.11.0.6
1.01.01.0.6.6.6.6.6.6.6.6.6
' .6.6
Sept.
1.0.6.6.6.6.6.6.6
1.61.0.6
1.61.01.0.6
1.0.6.6.6.6.6
1.01.01.01.01.01.01.6.6.6
Oct.
0.3
.3
.3
.3
.3
.31.01.0.6
7 Q
1.61.01.01.01.63.14.01.61.61.01.62.22.21.65 0
9.62.21.61.6
Nov.
1.61.61.02.23.12 9
4.02.21.69 9
1.01.01..01.03 1
1.61431
2 9
1.61.61.61.01.69 9
2.21.65.31.62.2
Dec.
2.21Q
4.05.38.1
15113.14.04.02.21.65.32.21.61.61.69.64.02 9
1.61.01.69 01.61.66.14.5
122.21.6
Jan.
1.69 9
4.03.16.62 9
1.61.61.6
19
4.02 9
1.61.61.67 9
142.21.69 6
2 9
1.614
2 9
1.69 62 9
1.61.61.61.6
Feb.
1.01.01.61.01.01.0.6.6.6.6.6.6
1.03.1.6.6.6
1.61.6.6.6.6.6.6.6.6
1.61.6
Mar.
0.6.6.6
2.21.0.6.6
14193.11.6
OA
3.14.04.0
113.13.1
191Q
4.02.21.61.05.32.21.01.61.01.01.0
Apr.
1.01.01.01.01.01.01.01.01.01.01.06.02.22.22 9
3.11.01.01.01.01.06.62.22.29.63.15.3
19248.1
May.
4.03.13.13.12.29 9
2.22.22.22.22.29 9
1.62.21.61.61.6
138 Q
2.21.61.03.11.61.01.01.03.11.61.63.1
June.
1.61.61.01.01.01.01.01.03.11.61.61.0.6.6
5.08.81.61.61.01.01.01.01.01.0.6.6.6.6.6.6
NOTE. Discharge determined from rating curve well denned below 40 million gallons per day. Dis charge July 1-27, Aug. 8 to Sept. 5, Sept. 18 to Oct. 5, Oct. 15 to Nov. 10, Dec. 3-6, and Apr. 23 to May 14 determined by comparison with records of flow of Wailele Stream.
Monthly discharge of Koloa Stream near Laie, Oahu, for the year ending June SO, 1917.
Month.
July.................................
December. ..........................
April................................
Discharge.
Milhon gallons per day. .
Maximum.
8.1 8.1 1.6 9.6
31 15 14 3.1
24 24 13 8.8
31
Minimum.
0.6 .6 .6 .3
1.0 1.0 1.6 .6 .6
1.0 1.0 .6
.3
Mean.
0.87 1.13 .85
1.88 3.34 4.66 3.95
.95 4.81 3.73 2.69 1.48
2.54
Second- feet
(mean).
1.35 1.75 1.32 2.91 5.17 7.21 6.11 1.47 7.44 5.77 4.16 2.29
3.93
Total run-off.
Milhon gallons.
27 35 25 58
100 144 123
27 149 112 83 44
927
Acre- feet.
83 108 78
179 308 443 376
82 458 343 256 136
2,850
WAILELE STREAM NEAR LAIE, OAHU.
LOCATION. About 3 miles by horse trail southwest of Laie and about 525 feet abovesea level.
RECORDS AVAILABLE. July 30, 1914, to June 30, 1917. GAGE. Stevens water-stage recorder on right bank.DISCHARGE MEASUREMENTS. Made by wading or from cable 20 feet above gage. CHANNEL AND CONTROL. Channel straight for about 50 feet above gage; right bank
sloping and clean; left bank nearly vertical. Control consists of concrete slab32 feet long with low-water notch 14 feet long.

102 SURFACE WATER SUPPLY OF HAWAII, 1916-17.
EXTREMES OF DISCHARGE. Maximum stage recorded during period of record, 4.85 feet at 9 a. m. September 23, 1914 (discharge, approximately 295 million gallons per day, or 456 second-feet); stream occasionally dry.
Maximum stage recorded during year, 3.25 feet at 3 a. m. November 18 (dis charge, approximately 140 million gallons per day, or 217 second-feet); mini mum stage recorded, 0.2 foot October 6-8 (discharge 0.1 million gallons per day, or 0.15 second-foot).
DIVERSIONS. None above station.REGULATION. None.UTILIZATION. Stream not perennial. A small part of the flood discharge is diverted
at low elevations for sugar-cane irrigation. Station was established to determine whether the total flood discharge of streams at 500 feet above sea level will justify the construction of a large flood-water storage project in the vicinity.
ACCURACY. Records based on rating curve well defined below 6 million gallons per day and continuous record of gage height; good for medium stages; determina tions of daily discharge for periods of extreme low water may be somewhat in error because of the small amount of water involved and lack of sensitiveness of control; discharge for days of decided fluctuation in stage computed hourly.
Discharge measurements of Wailele Stream near Laie, Oahu, during the year endingJune 30, 1911.
[Made by H. A. R. Austin.]
Date.
Nov.ll. ...........Dec. 6... ...........
Gage height (feet).
0.28 .55 .36
Discharge.
Second- feet.
1.07 6.83 2.09
Million gallons
per day.
0.7 4.4 1.4
Date.
Mar.9.... ..........Apr. 12.............
Gage height (feet).
.48
.30
Discharge.
Second- feet.
3.57 1.20
Million gallons *
per day.
2.3 .8
Daily discharge, in million gallons, of Wailele Stream near Laie, Oahu, for the yearending June 30, 1917.
Date.
1...........................2...........................3...........................4...........................5...........................6...........................7.. .........................8...........................9...........................10...........................11...........................12...........................13...........................14...........................15...........................16...........................17...........................18...........................19...........................20...........................21...........................22...........................23...........................24...........................25...........................26...........................27...........................28...........................29...........................30...........................31...........................
Oct.
0.1
.1
.4
.4
.42.01.3.4.4.4.8
2.02.7.8.8
.81.31.3.8
7.86.51 ^
.8
.8
Nov.
0.8.8.4
1.32.01.32.71.3.8
1.3.8.4.4.4
1.3.8
4.4162 n1.3
.8
.8
.81.31.3.8
3.5
1.3
Dec.
1.37.62.73.54.47.65 42.72.72.72.01.33.52.01.31.31.35.42.7*) (\
1.31.31.34.41.31.32.72.74.41.31.3
Jan.
0.81.32.02.02.71.31.3.8.8
5.42.71.31.3.8.8
4.43.51.31.35.41.31.37.92.01.34.41.3.8
1.31.3.8
Feb.
0.4.4.4.4.4.4.4.4.4.4.4.4.4
2.0.4.4.4.8.8.4.4.4.4.4.4.4.8.8
Mar.
0.4.4.4
1.3.4.4.4
2.77.62.01.3
112.02.02.04.42.02.05.97.72.71.3.8.8
2.71.3.8.8.8.8.8
Apr.
0.8.8.8.8.4.4.4.4.8.8.8.8
1.31.31.31.3.8.8.8.8.8
2.71.31.39.12.03.59.8
124.4
May.
2.72.02.02.01.31.31.31.31.31.31.31.3.8
1.3.8.8
1.36.54.01.3.8.4
1.3.8.4.4.4
1.3.8.4
1.3
June.
0.8.4.4.4
.4
.4
.8
.4
.4
.4
.4
.42 05.2.8.8.8
.4
.4
.4
.4
.4
.4
.4
.4
.4
NOTE. Discharge determined from rating curve well defined below 6 million gallons per day. Gage height record July 1 to Oct. 5 unreliable. Discharge Nov. 17, 26-30, Dec. 1-6, and Feb. 13 to Mar. 9 deter mined by comparison with records of flow of Koloa Stream.

ISLAND OF OAHTJ. 103
Monthly discharge of Wailele Stream near Laie, Odhu, for the year ending June SO, 1917.
Month.
March...............................April................................May.................. ...............
The period. ...................
Discharge.
Million gallons per day.
Maximum.
7.8 16 7.6 7.9 2.0
11 12 6.5 5.2
Minimum
0.1 .4
1.3 .8 .4 .4 .4 .4 .4
Mean.
1.34 1.76 2.80 2.09 .51
2.25 2.11 1.43 .68
Second- feet
(mean).
2.07 2.72 4.33 3.23 .79
3.48 3.26 2.21 1.05
Total run-off.
Million gallons.
35 53 87 65 14 70 63 44 20
451
Acre- feet.
107 162 266 199 44
214 194 136 63
1,380
EAST BRANCH OF KAHAWAINUI STREAM NEAR LAIE, OAHU.
LOCATION. Half a mile above junction with West Branch of Kahawainui Stream, 3 miles by horse trail southwest of Laie, about 500 feet above sea level.
RECORDS AVAILABLE. July 29, 1914, to June 30, 1917.GAGE. Stevens water-stage recorder. Datum raised 0.6 foot November 1, 1915.DISCHARGE MEASUREMENTS. Made by wading or from cable 10 feet below gage.CHANNEL AND CONTROL. One channel at all stages; straight for several feet above
station; bed composed of large boulders; free from vegetation; right bank clean and nearly perpendicular; left bank sloping and fairly clean. Control prior to October 26, 1915, consisted of a natural dam of large boulders. On November 1, 1915, a reinforced concrete control, 32 feet long with a low-water notch 15 feet long was completed.
EXTREME OP DISCHARGE. Maximum stage recorded during year, 2.5 feet at 4 a. m. November 18 (discharge, approximately 150 million gallons per day, or 232 second-feet).
Maximum stage recorded during period of record, 5.1 feet at 7 a. m. Sep tember 25, 1914 (discharge, approximately 340 million gallons per day, or 526 second-feet); channel frequently dry.
DIVERSIONS. None above station.REGULATION. None.UTILIZATION. Part of the flood discharge is diverted at low elevations to irrigate
sugar cane. Station was established to determine whether total flood discharge at this elevation is sufficient to justify a large flood water stored from project near Kahuku.
ACCURACY. Determinations based on a fairly well defined rating curve. Records good except for very low stages for which they may be in error because of small amount of water involved. Discharge for days of decided fluctuation in stage computed hourly.
Discharge measurements of East Branch of Kahawainui Stream near Laie, Oahu, during the year ending June 30,1917.
[Made by H. A. R. Austin]
Date.
Nov. 10............Dec. 6............
Gage height (feet).
0.32 .49 .33
Discharge.
Second- feet.
0.93 3.16 .53
Million gallons
per day.
0.6 .0 .35
Date.
Mar. 8............A r\r 19
Gage height (feet).
.36
.32
Discharge.
Second- feet.
1.29 1.11
Million gallons
per day.
.85
.7

104 SURFACE WATER SUPPLY OF HAWAII, 1916-11
Daily discharge, in million gallons, of East BranchvfKahawainuiStreamnear Laie. Oahut for the year ending June, 1917.
Date.
1. ............. 2..............3..............4..............5..............
6..............7..............8..............9..............
10..............
11..............12..............13..............14..............15..............
16..............17..............18..............19.............20..............
21.............22.............23..............24.............25..............
26..............27.............28..............29..............30.............31..............
July.
.......
i.i
5.0282.1.2.1
.1
Aug.
0.1
.2
.7
.73.5
.2
.1
.1
.1
Sept. Oct.
2 0
.6
.1
1.1
.4
2.2
.71.1
3 08.4
.1
.1
Nov.
0.1
.7
.4
.1
.2
.24.6
161.1.7
.7
.7
.4
.7
1.1.4
1.6.7
1.1
Dec.
0.7 3.92.82.14.8
.6.42.11.11.11.1
1.6.7.4
.4
.42.1.7
.42.1.4
.2
.71.13.2.4.4
Jan.
0.4.7
1.61.11.6
.7
.4
.4
.44.2
1.1.7.4.4.4
3.73.8.4.4
5.0
.7
.75.1.4.4
2.8.7.7
1.11.1.4
Feb.
0.4 .4.4.4.2
.2
.1
.1
.11.1.2
.1
.9
.4
.1
.3
.4
Mar.
0.4.2
.1
.17.24.3.7
.29.61.11.11.1
4.51.11.64.96.6
2.81.1.4.2
1.1
.4
.2
.7
.4
.4
.2
Apr.
0.2.2.2.2.2
.2
.2
.2
.4
.4
.2
.4
.4
.7
.4
.2
.1
1.1.2.4
6.2
.71.64.54.2.4
May.
0.1
.7
.2
.4
.4
.74.31.1.7
.2
.1
.2
.1
June.
0.7
4.2.4.4.2
NOTE. Discharge determined from rating curve fairly well defined below 80 million gallons per day. No flow on days for which discharge is not given.
Monthly discharge of East Branch of Kahawainui Stream near Laie, Oahu,for year endingJune SO, 1917.
Month.
July.................................
October. . ...........................
April................................May.................................
The year ......................
Discharge.
Million gallons per day.
Maximum.
28 3.5 8.4
16 6.4 5.1 1.1 9.6 6 2 4.3 4.2
28
Minimum.
0 0 0 0 .2 .4
0 0 0 0 .2
0'
at Mean.
1.18 .22 .71
1.08 1.38 1.35 .21
1.70 .80 .30 .20
.77
Second- feet
(mean).
1.83 .34
1.10 1.67 2.14 2.09 .32
2.63 1.24 .46 .31
1.19
Total run-off.
Million gallons.
37 7
22 32 43 42
6 53 24 9 6
281
Acre- feet.
112 21 68 99
131 128
18 162
74 29 18
860

ISLAND OF OAHTT.
EAST BRANCH OF MALAEKAHANA STREAM NEAR KAHUKtJ, OAHTT.
105
LOCATION. About three-quarters of a mile above junction with. Middle Branch, of Malaekahana stream and 3^ miles by horse trail south of Kahuku, about 375 feet above sea level.
RECORDS AVAILABLE. July 31, 1914, to June 30, 1917.GAGE. Stevens water-stage recorder. Original staff gage, established on July 31,
1914. was washed out by flood September 24, 1914. From September 25, 1914, to May 28, a reference point consisting of 20-penny nail in kukui tree on left bank 50 feet upstream, at same datum as staff gage, was used" to check gage heights. On May 28,1915, a new staff gage was established at the original datum.
DISCHARGE MEASUREMENTS. Made by wading or from cable about 5 feet upstream from staff gage.
CHANNEL AND CONTROL. One channel at all stages; straight for several hundred feet above gage; bed composed of loose boulders and gravel; right bank at gage clean and nearly vertical; left bank has gradual slope and above ordinary flood stages is covered with small trees and vegetation; cross section same for several hundred feet upstream. Reinforced concrete control completed November 9,1915. is 33 feet long with a 14-foot notch for low water. Original control consisted of a concrete slab 2 feet wide, with a small notch for low flow, between large boulders, about 6 feet below gage; this control was destroyed by the flood Sep tember 24, 1914.
EXTREMES OF DISCHARGE. Maximum stage recorded during year, 2.15 feet at 6 p. m. March 8, 1916 (discharge, computed by extension of the rating curve, approximately 90 million gallons per day, or 139 second-feet).
Maximum stage recorded during period of record, 5.05 feet at 5 a. m. Septem ber 25,1914 (discharge, approximately 378 million gallons per day, or 585 second- feet) ; channel frequently dry.
DIVERSIONS. None above station.REGULATION. None.UTILIZATION. Stream not perennial. A small part of the flood discharge is diverted
at low elevations for irrigation of sugar cane. Station was established to deter mine whether the total flood discharge at an elevation of about 350 feet above sea level will justify the construction of a large flood-water storage project near Kahuku.
ACCURACY. Records based on rating curve well defined below 12 million gallons per day; good below that limit except for very low stages for which they may be in error because of small amount of water involved. Discharge for days of de cided fluctuation in stage computed hourly.
Discharge measurements of East Branch of Malaekahana Stream near Kahuku, Oahu, during the year ending June SO, 1917.
[Made by H. A. R. Austin.]
Date.
Nov. 10..................................................................
Gage height (feet).
0.13.16
Discharge.
Second-
0.781.00
Million gallons
per day.
0.50.64

106 SURFACE WATER SUPPLY OF HAWAII, 1916-11.
Daily discharge, in million gallons, of East Branch of Malaekahana Stream near Kahuku, Oahu,for the year ending June SO, 1917.
Date.
1. .............2..............3..............4..............5..............
6..............7..............8..............9..............
10..............
11...............12..............13..............14..............15..............
16..............17..............18..............19..............20..............
21..............22..............23..............24..............25..............
26..............27..............28..............29..............30..............31..............
July.
5.5.3
Aug.
0.3.3
1.0
.3
5.3
.3
.3
.3
Sept.
0.3
.3
.3
.3
.3
.3
.3
.31.0
Oct.
3.01.0.3
1.0.3
.3
1.0
.32.36.91.0.3.3
Nov.
0.3
.31.8
.31.81.0.3
1.0
.3
.3
.3
.31.0
1.04.0
111.0.3
.3
.3
.3
.3
.3
1.0.3
1.0.3
Pec.
0.33.52.63.56.6
8.94.51.81.81.8
1.01.01.81.01.0
.3
.33.51.81.0
.3
.3
.33.51.0
.31.03.52.61.0.3
Jan.
1.01.82.61.82.6
1.01.01.01.06.5
2.61.01.0.3.3
5.75.21.01.05.5
1.01.05.71.01.0
4.51.81.01.81.01.0
Feb.
1.01.0.3.3.3
.3
.3
.3
.3
.3
.3
.3
.31.8.3
.3
.31.01.0.3
.3
.3
.3
.3
.3
.31.01.0
Mar.
0.3.3.3
1.01.0
.3
.39.94.51.0
.38.81.81.81.0
5.51.81.8'4.57.5
2.61.01.0.3
3.5
1.01.01.01.01.0.3
Apr.
0.3.3.3.3.3
.3
.3
.3
.3
.3
.3
.3
.3
.3
.3
1.8.3.3.3.3
.31.8.3.3
4.6
1.01.87.58.63.5
May.
1.01.01.04.21.0
.3
.3
.3
.3
.3
1.0.3.-3.3.3
.31.03.51.81.0
1.01.01.01.01.0
1.01.01.01.0.3»3
June.
0.3.3.3.3.3
.3
.3
.3
.3
.3
.3
.3
.3
.31.8
9.11.0.3.3.3
.3
.3
.3
.3
.3
.3
.3
.3
.3
.3
NOTE. Discharge determined from rating curve well denned below 12 million gallons per day. Dis charge interpolated Jan. 31 to Feb. 6. No flow on days for which discharge is not given.
Monthly discharge of East Branch of MalaeJmhana Stream near Kahuku, Oahu,for yearending June 30, 1917.
Month.
July................................
April...............................May................................
The year. .....................
Discharge.
Million gallons per day.
Maximum.
5.5 5.3 1.0 6.9
11 8.9 6.5 1.8 9.9 8.6 4.2 9.1
11
Minimum.
0 0 0 0 0 .3 .3 .3 .3 .3 .3 .3
0
Mean.
0.19 .27 .11 .58
1.02 2.00 2.09 .50
2.17 1.24 .94 .67
.99
Second- feet
(mean).
0.29 .42 .17 .90
1.58 3.09 3.23 .77
3.36 1.92 1.45 1.04
1.53
Total run-off.
Million gallons.
68 3
18 31 62 65 14 67 37 29 20
360
Acre- feet.
18 26 10 55 94
190 199 43
206 Hi 89 62
1,110
MIDDLE BRANCH OF MALAEKAHANA STREAM NEAR KAHUKU, OAHU.
LOCATION. About a mile above junction with East Branch of Malaekahana Stream;3^ miles by horse trail south of Kahuku, about 440 feet above sea level.
RECORDS AVAILABLE. July 31, 1914, to June 30, 1917. GAGE. Stevens water-stage recorder. Gage datum lowered 1 foot September 25,
1914, to avoid minus readings.

ISLAND OP OAHU. 107
DISCHARGE MEASUREMENTS. Made by wading or from cable 15 feet downstream from staff gage.
CHANNEL AND CONTROL. One channel at all stages; straight for several hundred feet above gage; bed composed of loose boulders and gravel; free from .vegetation; at the gage right bank clean and nearly vertical; left bank slopes gradually and above ordinary flood stages is covered with trees and vegetation. Reinforced concrete control completed November 20,1915, replacing concrete control washed out September 24, 1914.
EXTREMES OP DISCHARGE. Maximum stage recorded during period of record, 3.40 feet at 9.30 p. m. January 7, 1916 (discharge, approximately 200 million gallons per day, or 309 second-feet); channel dry greater part of the time.
Maximum stage recorded during year, 0.96 foot at 3 a. m. December 6 (dis charge, approximately 40 million gallons per day, or 62 second-feet).
DIVERSIONS. None above station.REGULATION . N one.UTILIZATION. Stream not perennial. A small part of the flood discharge is diverted
at low elevations for irrigation of sugar cane. Station was established to deter mine whether the total flood discharge at an elevation of about 400 feet above sea level will justify the construction of a large flood-water storage project near Ka- huku.
ACCURACY. Determinations are based on rating curve well defined for low and medium stages. Records only fair on account of the small amount of water involved. Discharge for days «f decided fluctuation in stage computed hourly.
The following discharge measurement was made by H. A. R. Austin: January 6, 1917: Gage height, 0.26 foot; discharge, 0.9 second-foot, or 0.6 million
gallons per day.
Daily discharge, in million gallons, of Middle Branch of Malaekahana Stream near "Ka- huku, Oahu, for the year ending June SO, 1917.
Date.
1. ...........................2............................3............................4............................5............................6............................7..........................8...........................9............................10...........................11...........................12...........................13...........................14...........................15..........................16...........................17...........................18...........................19...........................20...........................21...........................22...........................23...........................24...........................25...........................26...........................27...........................28.........................29...........................30...........................31...........................
Oct.
.91 q
Nov.
1.3
Dec.
0.05.5
4.0
Jan.
0.5.5.5.5
2.5.5.5.5.5.5
2.52.5.5.5
2.5.5.5.5.05.05.5.05.05.05.05.05
Feb.
0.05.05.05.05.05.05.05
n>;.05.05
r\%.05
.6
Mar.
0 0
.3
.2
.6
.4
Apr.
1.2
.11.22.5.5
May.
0.05.05
.4
.2
.05
.05
.05
.05
June.
2.2
NOTE. Discharge determined from rating curve well denned below 8 million gallons per day. No flow during August and September, or on days for which discharge is not given, except July 10-25, and Dec. 7 to Jan. 5, for which gage neights were not recorded.

108 SURFACE WATER SUPPLY OP HAWAII, 1916-11.
Monthly discharge of Middle Branch of Malaekahana Stream near Kahuku, Oahu, for theyear ending June 30, 1917.
Month.
October. .............................
January 6-31 ........................
March. ..............................April................................
Discharge.
Million gallons per day.
Maximum.
1.3 1.3 4.0 2.5.6 .6
2.5 .4
2.2
Minimum,
0 0 0 0.05 0 0 0 0 0
Mean.
0.07 .04 .76 .69 .04 .06 .18 .03 .07
Second- feet
(mean).
0.11 .06
1.18 1.07 .06 .09 .28 .05 .11
Total run-off.
Million gallons.
2 15
18 1 2 6 1 2
Acre- feet.
7 4
14 55 3 6
17 3 6
RIGHT BRANCH OF NORTH FORK OF KATTKONAHUA STREAM NEAR WAHIAWA, OAHU.
LOCATION. About 200 feet upstream from intake of Wahiawa Water Co.'s tunnel which is at the confluence of the right and left branches, or two main branches, of North Fork, about 8 miles northeast of Wahiawa.
RECORDS AVAILABLE. May 29, 1913, to June 30, 1917.GAGE. Stevens water-stage recorder on left bank.DISCHARGE MEASUREMENTS. Made by wading or, from footbridge 20 feet upstream
from gage.CHANNEL AND CONTROL. Channel is a straight stretch 200 feet long that has been
cleared of boulders. Banks steep and flow well distributed and confined. Natural control of large boulders has been improved somewhat for low-water stages.
EXTREMES OP DISCHARGE. Maximum stage recorded during year, 5.75 feet at 5 p. m. April 14 (discharge, approximately 400 million gallons per day, or 619 second-feet); minimum stage recorded, 1.4 feet February 28 to March 2 (discharge, 0.7 million gallons per day, or 1.1 second-feet).
Maximum stage recorded during period of record, 6.9 feet 10 p. m. November 8, 1914 (discharge, estimated by extension of rating curve, 560 million gallons per day, or 866 second-feet); minimum daily discharge, March, 1914 (0.2 million gallons per day, or 0.3 second-feet).
DIVERSIONS. None above station; entire low-water flow below station diverted.REGULATION. None.UTILIZATION. Wahiawa Water Co.'s ditch diverts entire low-water flow of both right
and left branches of North Fork at their confluence below gaging station on each branch for domestic water supply and irrigation in vicinity of Wahiawa. Dis charge from North Fork is impounded in Wahiawa reservoir for irrigation of sugar cane on Waialua plantation.
ACCURACY. Records based on well-defined rating curve and continuous record of gage height; good for all stages.
Discharge measurements of right branch of North Fork of Kaukonahua Stream nearWahiawa, Oahu, during the year ending June 30, 1917.
[Made by H. A. R. Austin.]
Date.
Sept.l.. ...........
Gage height (feet).
2.03 1.99
Discharge.
Second- feet.
12.2 12
Million gallons
per day.
7.97.7
Date.
Mar.l..............
Gage height (feet).
1.39 2.02
Discharge.
Second- feet.
0.79 12.7
Million gallons
per day.
0.58.2

ISLAND OF OAHU. 109
Daily discharge, in million gallons, of right branch of North Fork ofKaukondhua Stream near Wahiawa, Oahu, for the year ending June SO, 1917.
Date.
1..... .........2.. ............3..............4. .............5..............
6..............7... ...........8..............
10..............
11..............12..............13..............14..............15..............16..............17..............18..............19..............20..............21..............22..............23..............24..............25..............26..............27..............28..............29..............30..............31..............
July.
3.83.08.07.04.53.02.52.52 C
2.02.57.05.23.82.0
1439188.07.0
104.53.83.83.83.05.24.53.03.8
12
Aug.
8.0109 0
127.0
12209.07.05.25.26.05.2
36188.0
129.08.08.07.06.04.54.53.83.83.83.83.03.04.5
Sept.
5.26.03.02.52.52.52.52.03.82.52.58.02.52.02.02.54.53.84.52.53.8
165.23.8
1318127.06.04.5
Oct.
4.53.83.03.02.52.52.52.02.02.01.65.24.53.84.54.54.59.09.07.04.53.85.2
12144.5
2047325316
Nov.
109.07.0
1613101420203412o n8.06.09 06.0
2936108.07.06.05.24.58.0
129.0
141312
Dec.
7.02619
228.08.0
208.07.07.05.25.2o n6.0
.4.54.55.2
42329 0'8.0
1013126.05.27.09.0
146.04.5
Jan.
121219
9 0169 06.05.24.5
9fi
8.06.04.54.53.89.07.03.84.59 03.83.03 0
99
7.0206.04.54.53.83.0
Feb.
^ ft5.27.03.8
. 2.52.52.52.52.02.02.02.03.05.22.02.01.62.52.51.61.61.21.21.01.01.01.0.7
Mar.
0.7.7
1.03 n1.21.01.01.28.01.6
14en
18293216108.0
3226188.06.0
1866361210o n6.06.0
Apr.
7.08.0
to
5.25.23.83.83.86.03.0
14o n
26101322418129.07.07.0
18109 07.05.25.29.0
26o n
May.
6.06.05.27.05 9
3.8123.85 9
6.0327.07.0
108.08.07.0
444418108.0
209 07.06.06.07.06.0
1244
June.
26189 05.26.0
1410203610108.07.06.0o n9.05.27.04.54.53.83.83.03.02.52.52.52.52.02.0
NOTE. Discharge determined from well-defined rating curve. Discharge Sept. 11-21, 26-30, Oct. 1-10, and June 2-7 determined by comparison with record of flow of left branch.
Monthly discharge of right branch of North Fork of Kaukonahua Stream near Wahiawa, Oahu, for the year ending June 30, 1917.
Month.
July.................................
Discharge.
Million gallons per day.
Maximum.
39 36 18 53 36 42 26
7.0 66
101 44 36
101
Minimum.
2.0 3.0 2.0 1.6 4.5 4.5 3.0 .7 .7
3.0 3.8 2.0
.7
Mean.
6.54 8.46 5.22 9.46
12.6 11.0 8.17 2.' 36
14.8 13.9 12.3 8.40
9.48
Second- feet
(mean).
10.1 13.1 8.08
14.6 19.5 17.0 12.6 3.65
22.9 21.5 19.0 13.0
14.7
Total run-off.
Million gallons.
203 262 157 293 377 342 253
66 458 416 380 252
3,460
Acre- feet.
622 805 481 900
1,160 1,050
777 203
1,410 1,280 1,170
773
10,600
LEFT BRANCH OF NORTH FORK OF KAUKONAHUA STREAM NEAR WAHIAWA, OAHU.
LOCATION. 100 feet above the intake of the Wahiawa Water CO.'B tunnel, which is at the confluence of the right and left branches, or the two main branches, of the North Fork about 8 miles northeast of Wahiawa.
RECORDS AVAILABLE. May 25, 1913, to June 30,1917.GAGE. Stevens water-stage recorder on left bank.DISCHAEGE MEASUREMENTS. Made by wading or from cable at gage.

110 SURFACE WATER SUPPLY OP HAWAII, 1916-17.
CHANNEL AND CONTROL. Channel straight for 100 feet above and below gage; fairly uniform in cross section with high, wooded banks; only one channel at all stages. Stream bed composed of bowlders and gravel. Control composed of large bowlders; fairly permanent.
EXTREMES OP DISCHARGE. Maximum stage recorded during period of record, 7.3 feet at 10 p. m. March 19,1917 (discharge, approximately 850 million gallons per day, or 1,320 second-feet); minimum stage recorded, 0.85 foot February 9 and 10, 1915 (discharge, 0.25 million gallons per day, or 0.37 second-foot).
Minimum stage recorded during year 1.05 feet February 26 to March 2 (discharge, 0.8 million gallons per day, or 1.2 second-feet).
DIVERSIONS. None above station.REGULATION. None.UTILIZATION. The entire low flow of the North Fork is diverted immediately below
confluence of the right and left branches, and is impounded in Wahiawa reservoir for sugar-cane irrigation on Waialua Agricultural Co.'s plantation.
ACCURACY. Records July 1 to March 11 good; March 12 to June 30, fair.
Discharge measurements of left branch of North Fork of Kaukonahua Stream near Wahiawa, Oahu, during the year ending June SO, 1917.
[Made by H. A. R. Austin.]
Date.
Aug. 2.. ...........
TJoP 1
height (feet).
2.25 1.46 1.52
Discharge.
Second- feet.
58 8.68
11.8
Million gallons
per day.
37 5.67.6
Date.
Feb. 1... ...........
height (feet).
1.26 1.391.87
Discharge.
Second- feet.
4.72 9.93
39.0
Million gallons
per day.
3.16.4
25
Daily discharge, in million gallons, of left branch of North Fork of Kaukonahua Stream near Wahiawa, Oahu, for the year ending June 30,1917.
Date.
1... ...........
3..............4..............5..............6..............7..............8..............
10..............11..............12..............13..............14..............15..............16..............17..............18..............1920..............21..............22..............23..............24..............25..............26...............27..............28..............29..............30..............31..............
July.
9.07.9
15159.06.84.84.04.04.04.0
1014
9 n4.0
268638141510
9 n6.86.8
107 Q
2119
6.89 n
19
Aug.
2834152115152615149 0
1010197C
341428151715129 n7 Q
6.86.86.86.85 0
4.85.87 Q
Sept.
12125.84.84.84.04.84.07.94.84.8
154.84.04.04.87 Q
6.89 n4 Q
6.8'
231510OA
Id
00
1419
7 9
Oct.
9.06.85.85.84.84.84.84.04.04.03.29.05.85.86.89.0
2126191719
101491
2819
28KQ
^1
4219
Nov.
14109.0
3823193428233417121010159.0
504614109 n7.97 97 9
102612281414
Dec.
10582134121228129.0
107.97.9
147.96.86.89.0
678114101493
219 n
7 Q6.8
1091
9 n6.8
Jan.
12102315199.07.95.85.8
429.06.85.84-. 84.8
109 04.85.8
19
4.84.04.0
19
4.891
6.-84.04.03 0
2 a
Feb.
2.64.84.83.22.62.02.02.02.02.01.51.54.82.61.51.51.53.22.01.51.51.51.01.01.0.8.8.8
Mar.
0.8.8
1.55.82.69 n1.51.5
19
2.034709d4010
1519
8.8CO
40241*419
24QO
52i*no1*8 0
7.5
Apr.
8.810176.56.55.54.65.5
134.6
211017
1483036241512108.8
21171Q
8.87.56.5
1Q
4019
May.
8.86 K
6.5128.86.5
126.55.56.5
307.5
1017131312747027111094
108.87.57.57.57.5
1740
June.
10
271O
7.58 Q
91
15404810
91
1010
17 to
7.510
5.55.54.6A A
O Q
3 0
3 Q
3 0
5.53 O
3 0
NOTE. Discharge determined from rating curves applicable as follows: July 1 to Mar. 11, well defined; Mar. 12 to May 19 and May 20 to June 30, fairly well denned. Discharge Mar. 24-28 and Apr. 2-4 determined by comparison with records obtained on right branch.

ISLAND OP OAHU. Ill
Monthly discharge of left branch of North Fork of Kaukonahua Stream near Wahiawa, Oahu,for year ending June 30, 1917.
Month.
July.................................
March- . ....... . .April .....................-.....-.
Discharge.
Million gallons per day.
Maximum.
86 76 34 58 50 81 42 4.8
99 148
74 48
148
Minimum.
4.04.8 4.0 3.2 7.9 6.8 2.6 .8 .8
' 4.6 5.5 3.2
.8
Mean.
13.8 16.2 10.4 14.7 18.7 18.3 9.47 2.07
20.3 18.4 16.3 12.0
14.3
Second- feet
(mean).
21.4 25.1 16.1 22.7 28.9 28.3 14.7 3.20
31.4 28.5 25.2 18.6
22.1
Total run-off.
Million gallons.
427 503 310 454 562 567 294
58 629 553 506 362
5,220
Acre- feet.
1,310 1,540
958 1,400 1,720 1,740
901 178
1,930 1,690 1,550 1,100
16,000
SOUTH FORE OF KAUKONAHUA STREAM ABOVE UNITED STATES ARMY RESER VOIR, NEAR WAHIAWA, OAHU.i
LOCATION. About one-eighth mile above United States Army ditch intake, 5 miles by trail above United States Army reservoir, and 10 miles east of Wahiawa by road to reservoir and trail along ditch.
RECORDS AVAILABLE. June 18, 1913, to April 5, 1917. Station discontinued on account of backwater from new dam.
GAGE. Stevens water-stage recorder.DISCHARGE MEASUREMENTS. Made by wading or from cable at gage.CHANNEL AND CONTROL. Channel in vicinity of gage is straight and has been cleared
of boulders; banks steep; flow is confined past the gage. Natural control at head of long riffle has been improved for low-water stages by construction of a low rock-fill dam.
EXTREMES OP DISCHARGE. Maximum stage recorded during year, 5.5 feet at 3 a. m. March 9 (discharge, approximately 600 million gallons per day, or 928 second- feet); minimum stage recorded, 1.25 feet February and March (discharge, 0.8 million gallons per day, or 1.2 second-feet).
Maximum stage recorded during period of record, 7.05 feet 11 p. m. November 20, 1913 (estimated discharge, 900 million gallons per day, or 1,390 second-feet by extension of rating curve); minimum daily discharge, March, 1915 (0.15 mil lion gallons per day, or 0.25 second-foot).
DIVERSIONS. None above gage. United States Army diverts all the low-water flow one-eighth of a mile below station.
KEGULATION . None.UTILIZATION. Low-water flow past this station is diverted one-eighth of a mile down
stream into United States Army ditch, and impounded in United States Army storage reservoir of 21 million gallons capacity (64 acre-feet), 5 miles down stream, and carried thence by pipe line for water supply for cantonment at Castner. Records show amount of water available for additional water-supply for Castner. Discharge from South Fork is impounded in Wahiawa reservoir for sugar-cane irrigation on Waialua Plantation.
ACCURACY. Rating curve well defined for low and medium stages. Gage height of record continuous. Records good below 50 million gallons per day and fair above that limit.
i Called South Fork of Kaukonahua stream near Wahiawa, Oahu, in Water-Supply Paper 373.

112 SUB.FACE WATER SUPPLY OF HAWAII, 1916-17.
Discharge measurements of South Fork ofKaukonahua Stream, above United States Army reservoir, near Wahiawa, Oahu, during the year ending June 30, 1917.
[Made by H. A. R. Austin.]
Date.
Nov. J3.. .................................................................
Gage height (feet).
1.62 1.59
Discharge.
Second- (feet).
9.4 9.37
Million gallons per day.
6.1 6.1
Daily discharge, in million gallons, of South Fork of Kaukonahua Stream above United States Army reservoir, near Wahiawa, Oahu, for the year ending June 30, 1917.
Date.
1... ................
3...................4...................5...................6...................7...................8...................9...................10...................11...................12...................13...................14...................15...................16...................17...................18...................19...................20...................21...................22. ..................23...................24...................25...................26...................27...................28...................29...................30...................31...................
July.
9.07 19.09.07.54.83.53.53.53.53.57.5136.03.52244157.57.59.06.04.83.54.86.0
119.03.51334
Aug.
6444283817341717139 n9.0151128319.02520152017119.07 K
6.06.09.07.56.06.020
Sept.
13156.06.03.53.56.03.53.53.53.5113.53.53.53.52.86.07 13.54.8
13131117OO
139.07.56.0
Oct.
6.06.04.83.52.82.83.52.82.02.02.09.03.52.02.02.81520116.06.04.87.57 1209.0
114115119.0
Nov.
9.07.57.5
383417201111179.07.56.06.0116.0
4844119.07.56.06.06.04.8
137.5
281711
Dec.
11842231111131119.09.06.04.8
176.04.84.8
135260151517282511111334159.06.0
Jan.
7.513209.09.09.06.04.86.052117.56.06.04.8
13114.86.0134.83.53.59.03.5226.03.53.52.82.8
Feb.
2.84.83.52.82.82.02.02.02.02.02.02.02.84.82.02.02.03.53.52.02.01.51.01.01.0
.8
.8
Mar.
0.8.8
1.06.02.01.01.01.0
172.09 n
84oo >4
1513117 e;
5644179 A6.04.81715i fii &
174.83.5
Apr.
4.83.57.56.07.5
NOTE. Discharge determined from rating curve well defined below 50 million gallons per day.
Monthly discharge of South Fork of Kaukonahua Stream, near Wahiawa, Oahu, above United States Army reservoir, for the year ending June 30, 1917.
Month.
July.................................
April 1-5... .........................
Discharge.
Million gallons per day.
Maximum.
44 64 22 41 48 84 52 4.8
84 7.5
Minimum.
3.5 6.0 2.8 2.04.8 4.8 2.8 .8 .8
3.5
Mean.
9.5118.4 7.60 8.11
14.5 19.3 9.17 2.22
13.9 5.86
Second- feet
(mean).
14.7 28.5 11.8 12.5 22.4 29.9 14.2 3.43
21.5 9.07
Total run-off.
Million gallons.
295 569 228 251 436 597 284
62 430
29
3,180
Acre- feet.
905 1,750
700 772
1,340 1,840
872 191
1,320 90
9,780

ISLAND OP OAHU. 113
SOTJTH FORK OF KATTKONAHTTA STREAM BELOW TTNITED STATES ARMY RESER VOIR, NEAR WAHIAWA, OAHTT.
LOCATION. About 600 feet upstream from highway bridge on road from Castner to United States Army reservoir, about one-fourth mile above gulch entering from northeast, 2J miles east of Castner, and 2 miles southeast of Wahiawa.
RECORDS AVAILABLE. July 23,1914, to June 30,1917.GAGE. Stevens water-stage recorder.DISCHARGE MEASUREMENTS. Made by wading or from cable directly over concrete
control 50 feet downstream from gage.CHANNEL AND CONTROL. Reinforced concrete slab 26 feet long, extending from bank
to bank; 4 feet wide, with rectangular low-water section 7.5 feet wide near left bank, to confine extreme low flow. Downstream side of concrete slab protected from undermining by apron of discarded fence posts. Banks high. Bed com posed of gravel; channel straight and fairly smooth in vicinity of gaging station.
EXTREMES OP DISCHARGE. Maximum stage recorded during period of record, 10.35 feet at 7 a. m., August 5,1914 (discharge, about 1,400 million gallons per day, or 2,170 second-feet, estimated by extension of rating curve); minimum daily discharge, March and June, 1915, and March and June, 1916 (1.0 million gallons per day, or 1.5 second-feet).
DIVERSIONS. United States Army ditch diverts water from stream near headwaters.REGULATION. Practically none.UTILIZATION. Water diverted at about 1,130 feet above sea level by the United
States Army ditch is impounded in United States Army reservoir and carried by pipe line to the cantonment of Castner for water supply. An additional supply is pumped into this pipe line during periods of extreme low water from the stream just below the highway bridge below the gaging station. Wahiawa reservoir, into which the stream empties, supplies water for sugar-cane irrigation on Waialua plantation.
ACCURACY. Discharge ascertained from well-defined rating curve and a continuous record of gage height. Below 120 million gallons per day records good.
Discharge measurements of South Fork of Kaukonahua Stream below United States Army reservoir, near Wahiawa, Oahu, during the year ending June 30, 1917.
Date.
Aug. 7.......
Feb. 27.......
Apr. 14.......May 18.. ....
Made by-
Hi. A. R. Austin ..............................................do.........................................................do.........................................................do.........................................................do....................................................R. D. Klise...... ........................................
Gage height (feet).
1.38 1.17 .50
1.96 2.21 1.66
Discharge.
Second- feet.
36.2 24 3.1
134144 57
Million gallons
per day.
23 16 2.0
86 93 37
40532° 18 WSP 465 8

114 SURFACE WATER SUPPLY OF HAWAII, 1916-11.
Daily discharge, in million gallons, of South Fork of Kaukonahua Stream below United States Army reservoir, near Wahiawa, Oahu,for the year ending June 30, 1917.
Date.
2..............3..............4..............5..............
6..............7........ .......8..............9..............
10..............
11..............12..............1114..............15..............
16..............17..............18..............19..............20..............
21..............9993
24..............25..............
26..............27..............
29..............30..............31..............
July.
1412141412
7.86.85.87.86.8
5.88.9
17118 O
34
7591
1419
19
106.86.88 O
7 ft
1619
7.84646
Aug.
Qfi
70383419
232819
16
172319283ft
163400
2646
93
171419
111419
111026
Sept.
171910107.8
7.8168 9
1111
8.914
8 96.8K O
5 0
4.97 0
178.9Q A
19171419
28141410
7 0
Oct.
7.88.95.85.84.9
4 95.82 ft
3.34 9
3.38 0
105.85.8
5 0
91no
1911
111019
1128
19
12703819ift
Nov.
14121055on
3138191793
14121110
19J.9
1081719
111110n19
19113ft
1649
Dec.
14114384216
14114261414
101919
107 0
7.81975ce
93
93Ofl
00
3416
161950OO
1410
Jan.
1219281414
14101111
147
231419
1211
31191919
42
1211101610
OG
14108.97 0
6.8
Feb.
6.8108.95.85.8
4.04.04.04.04.0
4.04.05.88.94.0
4.04.06.86.84.0«
4.02 ft
1.61.61.6
1.61.61.6
Mar.
1.61.61.64 94.9
2.62.12.1
217 a
8.9133315000
171716
1201G9
281719
n19
2611129119
10
Apr.
1411107.87.8
6.85.S
1023
8 O
16167.8
4216
21141O
8.97 0
8 Q
19
10104 9
4.04.05.8
2811
May.
107.8
191214
5.84.94.03.33.3
5.84.96.8
2319
121660
42
1411108 08 0
7.86.86.85.87 a
19
June.
1012147.88.9
231110148.9
19108.96.8
11
16 6.86.85.84 9
4.94.04.03.33 0
2.62.64.03.32.6
NOTE. "Discharge determined from rating curve well defined below 120 million gallons per day. Dis charge July 1-7, Dec. 4 and 5, 9 and 10, 14-31, Jan. 1-6, and Feb. 8-26 determined by comparison with records obtained at station above United States Army reservoir.
Monthly discharge of South Fork of Kaukonahua Stream below United States Army reservoir, near Wahiawa, Oahu,for the year ending June 30, 1917.
Month.
July.................................
May.................................
Discharge.
Million gallons per day.
Maximum.
*5 96 28 70
108 114 147
10 182 42 96 23
182
Minimum.
5.8 10 4.9 2.6
10 7.8 6.8 1.6 1.6 4.0 3.3 2.6
1.6
Mean.
15.8 26.0 12.0 13.3 24.6 30.4 19.4 4.49
26.7 12.1 15.1 8.34
17.5
Second- feet
(mean).
24.4 40.2 18.6 20.6 38.1 47.0 30.0 6.95
41.3 18.7 23.4 12.9
27.1
Total run-off.
Million gallons.
489 806 359 412 739 944 602 126 829 363 469 250
6,390
Acre- feet.
1,500 2,470 1,100 1,270 2,260 2,890 1,850
386 2,540 1,110 1,440
768
19,600

ISLAND OF MATJI. 115
MISCELLANEOUS MEASUREMENTS.
Measurements of streams and ditches on the island of Oahu at points other than regular gaging stations are listed below:
Miscellaneous measurements on Oahu for the year ending June 30, 1917.
Date.
Feb. 12 13 14 15
June 11 11
July 13 Aug. 29 Sept. 29
Stream.
.....do.................
.....do.................
.....do.................Waihoi (north fork)....
.....do.................
.....do.................
Locality.
.....do.................................
.. ..do.................................
.....do.................................
.....do.................................100 feet below intake, Manoa Valley. . .
.....do.................................
Gage height (feet).
0.93 1.25 1.32
Discharge.
Second- feet.
4.00 3.65 4.89 4.12 3.5 1.4 2.1 1.9 1.2
Million gallons
per day.
a2.59 o2.36 o3.16 o2.66
2.3 0.9 1.4 1.2 .8
a Total of 4 branches.
ISLAND OP MATTI.
SOTJTH WAIEHTT STREAM NEAR WAILTJKTJ, MATJL
LOCATION. Previous to January 18, 1916, 300 feet above intake of South Waiehu ditch, about 3 miles west of Wailuku. On January 18, 1916, the gage was washed out and station was reestablished April 25, 1916, 500 feet downstream.
RECORDS AVAILABLE. March 19, 1913, to March 31, 1917, when station was discon tinued.
GAGE. Vertical staff.DISCHARGE MEASUREMENT. Made by wading.CHANNEL AND CONTROL. One channel at all stages; straight for 45 feet above gage;
bed of stream very rough and steep; banks high and covered with vegetation. Control composed of boulders and gravel; shifting.
EXTREMES OF DISCHARGE. Maximum stage recorded during period of record, 6 feet at 5 p. m. January 9, 1916 (discharge, computed from extension of rating curve, approximately 150 million gallons per day, or 232 second-feet); minimum stage recorded, 0.5 foot July, 1913 (discharge, 1.5 million gallons per day, or 2.3 second- feet).
DIVERSIONS. A small taro ditch diverts about 0.1 second-foot above station.REGULATION . None.UTILIZATION. Irrigation of sugar cane and taro.ACCURACY. Gage read twice daily. Records poor, as gage-height record is believed
to be unreliable.
Discharge measurements of South Waiehu Stream near Wailuku, Maui, during the yearending June 30, 1917.
[Made by H. A. R. Austin.]
Date.
July 24. ............Aug. 19............Sept. 15............Oct. 16.. ...........
Gage height (feet).
0.89 .89 .87 .79
Discharge.
Second- feet.
6.6 6.1 6.95 5.41
Million gallons
per day.
4.3 4.0 4.5 3.5
Date.
Dec. 13.. ...........
Mar. 17... ..........18.............
Gage height (feet).
0.83.87 .70 .83
Discharge.
Second- feet.
6.225.18 4.34 9.24
Million gallons, per day.
4.0 3.3 2.8 6.0

116 SURFACE WATER SUPPLY OF HAWAII, 1916-17.
Monthly discharge of South Waiehu Stream near Wailuku, Maui, for year endingJune 30, 1917.
Month.
July.................................
Discharge.
Million gallons per day.
Maximum.
7.7 6.3 7.0 9.1 7.7 9.1 4.5 5.0
17
Minimum.
5.0 5.0 4.5 4.0 4.0 4.0 4.0 4.0 4.0
Mean.
5.28 5.45 5.48 5.13 4.95 4.88 4.06 4.25 4.61
Second- feet
(mean).
8.17 8.43 8.48 7.94 7.66 7.55 6.28 6.58 7.13
Total run-off.
Million gallons.
164 169 164 159 149 151 126 119 143
Acre- feet.
50£ 51f 505 488 45f 464 386 365 43f
NOTE. Discharge determined from poorly defined rating curve.
NORTH WAIEHU DITCH NEAR WAILUKU, MAUI.
LOCATION. About 4 miles by road and trail northwest of Wailuku; one-quarter of amile below intake.
RECORDS AVAILABLE. April 25,1916, to June 30,1917. Also from December 1,1910, toJuly 8,1912, at old location a short distance below present site.
GAGE. Vertical staff.DISCHARGE MEASUREMENTS. Made by wading. CHANNEL AND CONTROL. Channel about 3.5 feet wide cut in earth and gravel;
control not well defined. EXTREMES OF DISCHARGE. Maximum stage recorded, 1.55 feet December 23-25,
1916 (discharge, approximately 11 million gallons per day, or 17 second-feet);water occasionally shut off.
DIVERSIONS. None above station; ditch diverts water from North Waiehu Stream. REGULATION. By headgates. UTILIZATION. Irrigation of sugar cane. ACCURACY. Gage read twice daily. Record good for discharge below 6 million
gallons per day.
Discharge measurements of North Waiehu ditch near Wailuku, Maui, during the yearending June SO, 1917.
[Made by H. A. R. Austin.]
Date.
July 24............
Dec. 13............
Gage height (feet).
0.80 .82 .73 .71
Discharge.
Second- feet.
7.5 6.7 5.6 5.24
Million gallons
per day.
4.9 4.3 3.6 3.4
Date.
Feb. 16. ...........TWor 94
height (feet).
0.68 .72 .65
Discharge.
Second- feet.
5.09 5.30 4.57
MilKon gallons
per day.
3.S 3.* 3.C

ISLAND OF MATJI. 117
Daily discharge, in million gallons, of North Waiehu ditch near Wailuku, Maui, for theyear ending June 30, 1916.
Date.
1.....2.....3.....4.....5.....
6.....7.....8.....9.....
10.....
Apr. May.
4.04.04.04.04.0
4.04.04.04.04.0
June.
4.94.94.94.94.9
4.9
5.4i d5.4
Date.
11......12......13......14......11
16......17......18......1Q
20......
Apr. May.
4.04.04.04.04.0
4.04.04.04.04.0
June.
5.45.44.94 g4 9
C A
5.45.45 45.4
Date.
0199
23......24
.25......
26....27....28....29....30....
Apr.
1.04.04.04.04.0
May.
4.44.44.4.4.44.4
4.44.44.44.44.9
June.
4 Q4 94 95.44 9
4.94.94.94.94.9
Daily discharge, in million gallons, of North Waiehu ditch near Wailuku, Maui, for theyear ending June 30, 1917.
Date.
1.............
3.............4.............5.............
G... ..........7.............8.............9.. ....... ....
10.............
11.............12.............13.............14.............15.............
16.............17.............18.............19.............20.............
21.............22.............23.............24.............25.............26.............27.............28.............90
30.............31.............
July.
4.94 94.95.45.45.44.94.94.95.44.94.94.94.94.94.95.44.95.45.4
4.94.94.94.94.9
4.93.54.94 Q
4.94.9
Aug.
4.9
3.04.24 9
4 94.24.2
4.24.24.24.24.64.6
4.24.24.24.2
3.83.83.83.83.8Q a3.83.8Q Q3 Q
3 0 . o
Sept.
3.83 0
4.24.24.23.43.4Q 4
4.23.43.43.43 A
3.4
3.4Q 4
3.43.83.43.43.43.43.43.4
3.43.43.4Q 4Q \
Oct.
3.43.43.43.43.43.43.43.43.43.43.43.43.43.43.43.43.43.43.43.43.43.43.43.43.43.43.43.43.43.43.4
Nov.
3.43 A
3.43.43.43.43.4i nQ ds n
3.03.03.03.03.03.83.83.43.43.43.03.43.43.43.43.43.43.8Q d3.4
Dec.
3.03 ft
0 ft
3.43.43 A
3.43.43.43.43.03.44.24 23.82.29 91 91.91.93.03.4
1111113.43.03.03.03.03.0
Jan.
2.23 ft
3 4
3.43.43.43.09 nQ nQ 4.
3.43.43.43.43.0
3.03.03.03.03.03.03.03.03.03.03.03.03.03.43.43.4
Feb.
3.43.43.43.43.43.43.43.43.83.43.83.83.43.43.43.43.41.31.32.23.43.03.03.03.43.03.43.4
Mar.
3.43.43.43.43.43.43.43.43.43.43.43.43.44.23.4
3.43.43.83.03.83.83.43.43.43.43.43.43.83.83.83.8
Apr.
3.43.43.43.43.43.43.43.43.43.4
3.43.43.43.43.43.43.43.43.43.43.43.43.43.43.42.61.63.43.43.4
May.
4 9
3.43.4.3.43.43.43.4Q 4
3.43.43.43.43.43.43.4
3.43.43.83.43.43.43.43.83.43.43.43.43.43.43.43.4
June.
3.4Q A
3.4S 4
3.0Q n3.03 A
3 4
3.43.43.43.43.43.43.43.43.43.43.43.43.43.03.03.03.03.43.43.43.0
NOTE. Discharge determined from rating curves well defined below 5 million gallons per day, applicable Apr. 26 to Aug. 2,1916, and Aug. 3,1916, to June 30,1917.
Monthly discharge of North Waiehu ditch near Wailuku, Maui, for year endingJune 30, 1916.
Month.
April 26-31.... ................ ....
Discharge.
Million gallons per day.
Maximum.
4.0 4.9 5.4
5.4
Minimum.
4.0 4.0 4.9
4.0
Mean.
4.00 4.17 5.10
4.58
Second- feet
(mean).
6.19 6.45 7.89
7.09
Total run-off.
Million gallons.
20 129 153
302
Acre- feet.
61397 470
928

118 SURFACE WATEE SUPPLY OF HAWAII, 1916-17.
Monthly discharge of North Waiehu ditch near Wailuku, Mam, for year endingJune SO, 19*17.
Month.
July.................................
May.. ..............................
Discharge.
Million gallons per day.
Maximum.
5.4 6.0 4.2 34 3.8
11.0 3.4 3.8 4.2 3.4 4.2 3.4
11.0
Minimum.
3.5 3.0 3.4 3.4 3.0 1.9 2.2 1.3 3.0 1.6 3.4 3.0
1.3
Mean.
4.97 4.13 3.57 3.40 3.33 3.85 3.13 3.19 3.50 3.31 3.45 3.29
3.60
Second- feet
(mean).
7.69 6.39 5.52 5.26 5.15 5.96 4.84 4.94 5.42 5.12 5.34 5.09
5.57
Total run-off.
Million gallons.
154 128 107 105 100 119 97 89
109 99
107 99
1,310
Acre- feet.
473 393 32S 323 307see29S 274 333 305 32S 303
4,030
WAIHEE STREAM NEAR WAIHEE, MAUI.
LOCATION. About 300 feet above intake of Waihee canal, 3 miles west of Waihee,and 7 miles northwest of Wailuku.
RECORDS AVAILABLE. April 1, 1913, to June 30, 1917. GAGE. Stevens water-stage recorder installed January 15, 1916, replacing Barrett
& Lawrence water-stage recorder. Datum raised 2.0 feet August 18, 1915. DISCHARGE MEASUREMENTS. Made by wading or from footbridge 250 feet below
CHANNEL AND CONTROL. Channel at gage is a pool at foot of low waterfall; banks mostly of solid rock, steep and high. Control composed of boulders; fairly per manent.
EXTREMES OP DISCHARGE. Maximum stage recorded during period of record, 9 feet (new datum), estimated gage height of flood of January 18, 1916; no estimate of discharge possible; minimum stage recorded, 2.59 feet August 5, 1913 (discharge, 21 million gallons per day, or 32 second-feet).
Minimum stage recorded during year, 2.25 feet March 21 (discharge, 23 mil lion gallons per day, or 36 second-feet).
DIVERSIONS. None above station.REGULATION. Natural flow of stream is increased by development tunnels near
headwaters.UTILIZATION. Irrigation of sugar cane and taro.ACCURACY. Records fair for low and medium stages. There were several changes
in control during year and good rating curves were not developed, but frequent discharge measurements give fair rating curves for ordinary stages.

ISLAND OF MAUI. 119
Discharge measurements of Waihee 'Stream near Waihee, Maui, during the year endingJune 30, 1917.
Date.
July 18.......Aug. 19.......Sept. 16.......Oct. 14.......Dec. 13.......Jan. 14.......Feb. 17.......Mar. 17.......
18.......Apr. 21.......May 19.......June 19.......
Made by-
EC. A. R. Austin...............................................do.........................................................do.... ..................................................do......'...................................................do.........................................................do.........................................................do.........................................................do.........................................................do.........................................................do.........................................................do....................................................C. T. Bailey..............................................
Gage height (feet).
2.42 2.40 2.32 2.24 2.47 2.26 2.16 2.38 3.03 2.37 2.32 2.28
Discharge.
Second- feet.
84' 94 62 57 90 59 47 48
164 52.3 51.1 48.9
Million gallons
per day.
54 61 40 37 58 38 30 31
106 34 33 32
Daily discharge, in million gallons, cf Waihee Stream near Waihee, Maui, for the yearending June 30, 1917.
Date.
1..............2..............3..............4..............5..............
6..............7..............8..............9... ...........10..............
11..............12..............13..............14..............15..............
16..............17..............18..............19..............20..............
21..............22..............23..............24..............25..............
26..............27..............28..............29..............30..............31..............
July.
5852585875
5252474758
6352585258
6395588852
5247424247
828863474295
Aug.
75102955852
4242524247
586369224102
6369586363
6363585852
635858525275
Sept.
7563474238
4763473847
4242424263
4238386942
47586963fio
TO69474742
Oct.
6952424238
3838383838
3852423838
3858423838
3852584238
1027563525838
Nov.
58524242110
8247424742
4238383858
3895423838
3842424742
47471266347
Dec.
421022048242
42384263177
47528210258
6982.528858
1101182849563
526388524242
Jan.
4242476947
4242383852
5842383838
3838383842
3833333333
423838423838
Feb.
3833333333
3333333333
3333335833
3330384233
3330303030
303352
Mar.
3333524233
33305211038
8258474441
37331344233
2330262663
472626303038
Apr.
4752303833
2626252626
3830425238
3038303845
5233333026
262688244186
May.
5842423833
3333333333
4238333838
3342635252
52521107547
383838384238
June.
3858333833
5242889552
6938333330
3030423030
3058333030
2638384233
NOTE. Discharge determined from poorly-defined rating curves applicable as follows: July 1 to Aug. 14,1916, and Sept. 1,1916. to Mar. 9,1917; Aug. 15-31,1916; Mar. 10 to Apr. 30,1917; May 1 to June 30,1917. Discharge interpolated Mar. 14-16 and estimated by comparison with records of neighboring streams June 21-30.

120 SURFACE WATER SUPPLY OF HAWAII, 1916-17.
Monthly discharge of Waihee Stream near Waihee, Maui,for the year ending June 30,1917.
Month.
July........*........................
Discharge.
Million gallons per day.
Maximum.
95224 75
102 126 284
69 58
134 244 110 95
284
Minimum.
42 42 38 38 38 38 33 30 23 26 33 26
23
Mean.
59.5 67.5 51.0 47.5 52.3 81.7 41.1 34.6 44.3 48.5 44.4 41.7
51.3
Second- feet
(mean).
92.1 104 78.9
73.5 80.9
126 63.6 53.5 68.5 75 68.7 64.5
79.4
Total run-off.
Million gallons.
1.840 2,090 1,530 1,470 1,570 2,530 1,270
969 1,370 1,460 1,380 1,250
18,700
Acre- feet.
5,660 6,420 4,700 4,520 4,820 7,770 3,910 2,970 4,210 4,470 4,220 3,840
57,500
HONOKAHAU STREAM NEAR HONOKAHAU, MAUL
LOCATION. 1,000 feet above intake of Honokahau ditch, about 6 miles southeast of Honokahau.
RECORDS AVAILABLE. March 6, 1913, to June 30, 1917.GAGE. Stevens water-stage recorder.DISCHARGE MEASUREMENTS. Made by wading or from cable 400 feet below gage.CHANNEL AND CONTROL. One channel at all stages; straight for 100 feet below gage,
but makes sharp bend 50 feet above gage; right bank slopes gently; left bank is vertical wall of rock. Control composed of large boulders; seldom shifts.
EXTREMES OP DISCHARGE. Maximum stage recorded during period of record, 8.25 feet at 7.30 a. m., January 18, 1916 (discharge computed from extension of rating curve, approximately 1,900 million gallons per day, or 2,940 second-feet); mini mum stage recorded, 1.00 foot October 31, 1913, and October 6, 1915 (discharge, 10 million gallons per day, or 15.5 second-feet).
Maximum stage recorded during year, 6.35 feet at 11.45 p. m. March 8 (discharge approximately 1,000 million gallons per day, or 1,550 second-feet); minimum stage recorded, 1.6 feet June 26 (discharge, 11 million gallons per day, or 17 second-feet).
DIVERSIONS. None above station.REGULATION. None.UTILIZATION. Low flow of stream all diverted by Honokahau ditch for irrigation of
sugar cane and for power development.ACCURACY. Records based on rating curves well defined for ordinary stages and
continuous gage-height record; good for all stages below 60 million gallons per day; fair for higher stages.

ISLAND OF MAUI. 121
Discharge measurements of Hondkahau Stream near Honokahau, Maui, during the yearending June 30, 1917.
Date.
July 26.......Oct. 24.......Dec. 15.......Jan. 13.......Mar. 26.......May 24.......June 26.......
Made by
.....do...................................................
.....do...................................................R. C. Rice ...............................................
.....do...................................................C. T. Bailey... ...........................................
Gage height (feet).
2.52 1.80 1.93 1.86 1.91 2.20 1.62
Discharge.
Second- feet.
95 27.6 35.5 29 33 55 18.8
Million gallons
per day.
61 18 23 19 21 36 12
Daily discharge, in million gallons, of Honokahau Stream near Honokahau, Maui, for theyear ending June 30, 1917.
Date.
1..............2..............3..............4..............5..............
6..............7..............8..............9..............10..............
11..............12..............13..............14..............15..............
16..............17..............18..............19..............20..............
21..............22..............23..............24..............25..............
26..............27...............28..............29..............30..............31..............
July.
2727302438
2424222030
3527323032
4182355224
2420181820
446841242482
Aug.
5277683527
2220242224
383538
24077
3538323535
3535323227
353232272744
Sept.
5252222020
2452382027
3024201832
2016204820
2232323844
2732272724
Oct.
3827181816
1616161816
1620221818
2032242222
1624412222
686835384899
Nov.
4138322495
6430242220
2720201830
4495272016
1616162422
35321004124
Dec.
2082
1496420
18181835163
3024356830
4164306444
82903606233
253358252121
Jan.
2121233623
2121211925
3025191919
1921191923
2121211921
252121232319
Feb.
1717171717
1717171717
1717173017
1716173016
1616161614
141436
Mar.
1616302817
1716213316
4633252321
1916582116
1414161943
301617252130
Apr.
2536172319
1414141414
3019234323
1725171423
2517161414
14123612898
May.
3019171616
1614141614
2117141619
1419302323
2321584619
161616211619
June.
1940161614
2323434325
3616141414
1212191412
' 1225141212
1116161714
NOTE. Discharge determined from rating curves well defined below 60 million gallons per day, appli cable July 1 to Dec. 23 and Dec. 24 to June 30. Discharge Aug. 12 to Sept. 1, Dec. 21 to Jan. 7, Jan. 10 and 11, Feb. 11-16, Mar. 14-16, and May 16-21 determined by comparison with records of flow of Waihee Stream.

122 SURFACE WATER SUPPLY OF HAWAII, 1916-17.
Monthly discharge of Honokahau Stream near Honokahau, Maui,for the year endingJune 30, 1917.
Month.
July................................
April...............................May................................
Discharge.
Million gallons per day.
Maximum.
82 240 52 68
100 360
36 36 58
128 58 43
360
Minimum,
18 20 16 16 16 18 19 14 14 12 14 11
11
Mean.
33.5 43.0 29.3 26.4 34.4 58.9 21.9 18.1 23.6 26.6 20.6 19.1
29.7
Second- feet
(mean).
51.8 66.5 45.3 40.8 53.2 91.1 33.9 28.0 36.5 41.2 31.9 29.6
46.0
Total run-oft.
Million gallons.
1,040 1,330
880 817
1,030 1.830
679 506 733 798 639 574
10,900
Acre- feet.
3,190 4,090 2,700 2,500 3,170 5,600 2,080 1,560 2,250 2,450 1,960 1,760
33,300
HONOLTTA STREAM NEAR HONOKAHATT, MAUL
LOCATION. 300 feet above Honokahau ditch crossing, about 2 miles south of Hono kahau.
RECORDS AVAILABLE. March 12, 1913, to June 30, 1917.GAGE. Vertical staff on right bank.DISCHARGE MEASUREMENTS. Made by wading or from footbridge at gage.CHANNEL AND CONTROL. One channel at all stages; straight for 100 feet above and
below gage. Stream bed very rough and on steep grade; right bank high and nearly vertical; left bank high with gentle slope. Control composed of large boulders; shifts during floods.
EXTREMES OF DISCHARGE. Maximum stage recorded during period of record, 4.2 feet at 6 p. m. January 9, 1916 (discharge, computed from extension of rating curve, approximately 200 million gallons per day, or 309 second-feet); minimum stage recorded, 0.25 foot October 23 and 24, 1913 (discharge, 0.15 million gallons per day, or 0.25 second-feet).
Minimum stage recorded during year, 0.45 foot frequently (discharge, 0.3 million gallons per day, or 0.46 second-foot).
DIVERSIONS. None above station.REGULATION. None.UTILIZATION . Ordfnary flow is diverted by Honokahau ditch for irrigation of sugar cane.ACCURACY. Discharge determined from rating curves fairly well defined between 1
and 10 million gallons per day, and a reliable gage-height record of two readings daily. Records fair except for very low stages for which they may be consider ably in error because of the small amount of water involved.
Discharge measurements of Honolua Stream near Honokahau, Maui, during the yearending June 30, 1917.[Made by H. A. R. Austin.]
Date.
July 26............Sept. 10. ...........
Gage height (feet).
1.00 1.04 1.30
Discharge.
Second- feet.
1.4 2.15 5.8
Million gallons
per day.
0.91.4 3.7
Date.
Mar. 26............
Gage height (feet).
1.07 1.42
Discharge.
Second- feet.
3.7 13.4
Million gallons
per day.
2.48.7

ISLAND OF MAUL 123
Daily discharge, in million gallons, of Honolua Stream near Honokdhau, Mfiui, for the year ending June 30, 1917.
Date.
1. .............2..............3..............4..............5..............6..............7..............8..............9..............
10. .............11..............12..............13..............14. .............15..............16..............17..............18. .............19..............20..............21..............22..............23..............24..............25..............26. .............27..............28..............29..............30. .............31..............
July.
2.02.02.02.02.41.61.41.11.01.42.02.01.42.02.02.43.02.42.42.0
1.61.11.11.01.01.42.42.42.42.44.4
Aug.
5.15.16.86.02.01.6
1.11.01.0
2.42.03.06.86.02.02.01.03.03.0
2.43 A
1.11.01.61.61.11.0.8.7
1.6
Sept.
3.67.91.4.8.7
.86.03.0.8
1.1
.81.01.0.7.5
1.6.8.7
4.42.0
1.11.64.43.03.02.43 n1.4.8.8
Oct.
2.01.4.8.8.6.6.5.5.5.4.4.4.8.5.5.5.8.6.6.8
.5
.82.41.1.7
1.43.62.41.43.01.0
Nov.
2.42.02.01.63.64.43.61.61.11.01.1.8.7.5.5
3.04.41.6.8.7.5.4.4.5
1.01.01.64.43.01.1
Dec.
0.82.04.45.12.41.61.41.42.06.83.62.01.69.03.0
2.44.43. a2.42.43.03.6
7.15.14.26.08.25.14.24.2
Jan.
3.52.83.57.16.04.22.31.81.21.57.14.21.21.21.0.8.8.7.7.8
.8
.7
.6
.5
.41.2.8.7.7
2.81.2
Feb.
0.7.5.4.4.4.4.3.3.3.3.3.3.3
1.51.0.3.3.3
2.8.5
.4
.3
.3
.3
.3
.32.3
Mar.
0.6.4
1.84.2.7.4.3.3
3.5.8
1.82.81.82.8.8.6.5
1.81.51.2
.6
.4
.3
.73.5.8.6.5.5.8
Apr.
0.72.3.6.4.8.4.4.3.3.4.6.6.6
1.0.8.4.5.4.3.5.6
1.5.4.6.3.3.3.4
3632
May.
6.03.52.31.5.8.8.5.4.4.4.4.5.4.4.5.4.5
2.31.01.01.8.5
7.18.21.2
' .4.4.4.4.3.4
June.
0.4.7.4.4.3.7
1.24.25.14.25.1.6.4.4.4.3.3.4.3.3.3
1.0.4.3.3.3.3.3.4.4
NOTE. Discharge determined from rating curves fairly well denned between 1 and 10 million gallons per day, applicable July 1 to Dec. 23 and Dec. 24 to June 30.
Monthly discharge of Honolua Stream near Honokahau, Maui, for the year endingJune 30, 1917.
Month.
July................................
March. ... .
May.................................
Discharge.
Million gallons per day.
Maximum.
4.4 6.8 7.9 3.6 4.4 9.0 7.1 2.8 4.2
36 8.2 5.1
36
Minimum.
1.0 .7 .5 .4 .4 .8 .4 .3. .3 .3 .3 .3
.3
Mean.
1.93 2.51 2.04 1.04 1.71 3.85 2.03 .58
1.21 2.82 1.45 1.00
1.00
Second- feet
(mean).
2.99 3.88 3.16 1.61 2.65 5.96 3.14
.90 1.87 4.36 2.24 1.55
2.88
Total run-off.
Million gallons.
60 78 61 32 51
119 63 16 38 85 45 30
678
Acre- feet.
184 239 188 99
157 366 193 50
115 260 138 92
2,080
HONOKAWAI STREAM NEAR I.ATTAINA, MAUL
LOCATION. 500 feet below confluence with Amalu Stream, about 8 miles northeastof Lahaina.
RECOEDS AVAILABLE. May 13, 1913, to March 15, 1917, when gage was washed out. GAGE. Vertical staff on right bank. * DISCHAEGE MEASUEEMENTS. Made by wading or from footbridge 150 feet below gage. CHANNEL AND CONTROL. One channel at all stages; filled with large boulders and very
rough; very narrow at gage. Control 3 rock ledge; probably permanent.

124 SUEFACE WATEE SUPPLY OF HAWAII, 1916-17.
EXTREMES OF DISCHARGE. Maximum stage recorded during period of record, 5.9 feet at 3 p. m. January 8,1916 (discharge computed from extension of rating curve, approximately 150 million gallons per day, or 232 second-feet); stream occa sionally dry.
Minimum stage recorded during year, 1.0 foot frequently (discharge, 0.2 million gallons per day, or 0.3 second-foot).
DIVERSIONS. Most of the natural flow is diverted into Honokawai ditch half a mile
REGULATION. Natural flow of stream is increased by a development tunnel a shortdistance above intake of Honokawai ditch.
UTILIZATION. Irrigation of sugar cane and taro. ACCURACY. Discharge ascertained from rating curve well defined below 40 million
gallons per day and a gage-height record of two readings daily. Records fair.
Daily discharge, in million gallons, of Honokawai Stream near Lahaina, Maui, for theyear ending June 30, 1917.
Date.
1. ..........................2...........................3...........................4...........................5...........................6...........................7...........................8...........................9...........................10...........................11...........................12...........................13...........................14...........................15...........................16...........................17...........................18...........................19...........................20...........................21...........................22...........................23 ...........................24...........................on26........................ ..27...........................28...........................29...........................30...........................31...........................
July.
1.2.4
1.4.7
9 ft
.6
.4q
.21.7^ ft1.41.41.41.23.4
102 A
2 0
.71 9
.4
.21.0
118.41.7.7
24
Aug.
9.017122.61 4
.7
.7
.7
.72.06.45.32.6t; <?1.0.4
^ ft.7
8 4
4.81.49 R
.7
.61 21.09 ^
.6
.4<? ft
Sept.
2.35.82.6.6.4.7
16" 10
.71.41 9
.7
.4
.4
.39 ft
.4
211.7.7.7
5.89 7o q
1 0
.71.0.6.6
Oct.
1.0.7.4.4.3.3.6.6.6.6.6.6,4.4.4
1.7^ Q
.7
.7
.62.6.4
1.77 a7.8O A
1.0^ ft.7
Nov.
1.22.31.4.7
41192.62.0.7.3
5.3.7.3.3
3.0on
S 4
1.0q
.3
.2
.22
1.0241.04.8.7.7
Dec.
0.43.98.4
121.2.3.2.3.3
242.3.6.4
2.0.6
1.74.8O A
9 73.9
9^
283019
4.4
1.7.6
112.6.6
Jan.
0.6.6
1.43.43.01.7.7.7.4.4
2.31.7.6.4.3.2.2
.2
.3
.2
.2
.2
.26.4.4.4.4
1.0.2
Feb.
0.3.3.3.3.3.3.3.3.3.2.2.2.2
4.4.4.3.3q
2.0.6.4.3.3q
.3
.3
.3^ Q
Mar.
0.3.3
1.22.6.6.6.3.3
1.4.4.3
1.01.27.1
11
NOTE. Discharge determined from a rating curve well defined below 40 million gallons per day.
Monthly discharge of Honokawai Stream near Lahaina, Maui, for year ending June SO,1917.
Month.
July.................................
October. .......................
February. ..........................March 1-15..... .....................
The period.. ..................
Discharge.
Million gallons per day.
Maximum.
24 17 217.8
41 30 6.4 4.4
11
Minimum.
0.2.4 .2 .3 .2 .2 .2 .2 .3
Mean.
2.73 3.20 3.07 1.39 5.19 6.32 .94 .64
1.91
Second- feet
(mean).
4.22 4.95 4.75 2.15 8.03 9.78 1.45 .99
2.95
Total run-off.
Million gallons.
85 99 92 43
156 196 29 18 29
747
Acre- feet.
260 304 283 132478 601 89 55 88
2,290

ISLAND OP MAUL 125
HONOKAWAI DITCH NEAR LAHAINA, HAUL
LOCATION. 250 feet below junction with Amalu wooden flume, 1,000 feet below in take, 2 miles above Pioneer Mill Co.'s power house, and about 7 miles northeast of Lahaina.
RECORDS AVAILABLE. July 1, 1912, to June 30, 1917.GAGE. A graduated rod which the observer places in center of flume at each reading.DISCHARGE MEASUREMENTS. Made in flume near gage.CHANNEL AND CONTROL. Semicircular galvanized iron flume 3 feet in diameter;
straight for 100 feet above and below gage; flume clean and uniform in section and grade. Stage-discharge relation stable.
EXTREMES OF DISCHARGE. Maximum stage recorded during period of record, 1.67 feet August 12, 193 (discharge, 15 million gallons per day, or 23 second-feet); minimum stage recorded, 0.80 foot May 15, 1913 (discharge, 2.4 million gallons per day, or 3.8 second-feet).
Maximum stage recorded during year, 1.45 feet July 11, 17, 31, and September 19 and 24 (discharge, 9.0 million gallons per day, or 14 second-feet); minimum stage recorded, 0.95 foot June 27 (discharge, 3.6 million gallons per day, or 5.6 second-feet).
DIVERSIONS. Ditch diverts all low-water flow from Honokawai and Amalu streams.REGULATION. Flow controlled by head gates.UTILIZATION. Power development and-irrigation of sugar cane.ACCURACY. Gage read twice daily. Records are fair for all stages. Great care has
to be taken in making measurements on account of slope of flume, but a fairly good rating curve has been developed. On account of the uniform conditions the extension of the rating curve probably good.
Daily discharge, in million gallons, of Honokawai ditch near Lahaina, Maui, for the yearending June 30, 1917.
Date.
1. .............
3..............4..............5..............
6..............7..............8..............9..............
10..............
11..............12..............13..............14..............15..............
16..............17..............18.............. 19..............20..............
21.............. 22..............23..............24..............25..............
26..............27..............28..............29.............. 30..............31..............
July.
6.66.66.66.07.2
6.05.55.55.06.6
7.27.26.67.87.2
8.48.47.2 8.46.6
7.2 5.05.05.05.0
6.08 A
8.47.2 6.68.4
Aug.
8.48.48.47.27.2
6.06.06.06.07.2
7.27.87.27.26.6
6.07.26.07.87.2
6.0 ' 7.2
6.06.06.0
5.56.07.26.0 6.07.2
Sept.
7.27.27.26.06.0
6.08.47.86.66.6
6.66.66.06.06.0
7.26.05.5 8.47.2
6.6 6.68.48.47 9
6.66.06.66.0 6.0
Oct.
7.27.26.06.05.5
5.55.55.55.55.5
5.55.56.06.06.0
5.57.27.8 7.27.2
5.5 6.07.86.67.2
8.47 a7.26.07.86.0
Nov.
7.27.27.26.68.4
7.86.66.66.05.5
7.26.05.55.57.2
7.87.87.2 6.05.0
5.0 5.05.05.06-0
8.46.07.86.0 6.0
Dec.
6.07.87.27.25.5
5.55.05.55.57.8
7.26.06.07.26.0
6.67 9
7.2 7.87.2
7.87.87 9
7.27.2
6.66.07.26.0 6.05.5
Jan.
5.55.56.07.26.0
6.05.55.55.05.0
6.06.05.05.04.5
4.54.54.5 4.54.5
4.5 4.54.54.54.5
7.25.04.54.5 6.04.5
Feb.
4.54.54.04.04.0
4.04.04.04.04.0
4.04.04.06.64.5
4.04.04.0 6.05.0
4.5 4.04 04.04.0
404 07.2
.......
Mar.
5.04.56.07.25.0
5.04.54.56.05.0
4.56.06.07.27.2
.......
.......
5.55.5
5.55.05.57.2 6.67.2
Apr.
6.66.06.05.06.0
5.05.05.05.05.0
7.86.07.27.27.2
6.06.06.6 5.56.0
6.0 5.06.06.06.0
7.25.55.05.05.0
May.
6.05.05.04.55.0
4.05.04.54045
5.06.06.05.05.5
5.05.06.0 5.05.0
6.05.06.06.05.0
404.04.05.0 5.05.0
June.
6.07 9
5.55-04.5
4.56.07.26.06.0
6.05.04.54.040
4.04.05.5 5.04.5
4.0 6.04.04.040
3.63.64.04.0 4.0
NOTE. Discharge determined from fairly well defined rating curve. No record Mar. 16-23.

126 SURFACE WATER SUPPLY OF HAWAII, 1916-17.
Monthly discharge of Honokawai ditch near Lahaina, Maui, for year ending June 30,1917.
Month.
July.................................
December. ..........................
April................................
Discharge.
Million gallons per day.
Maximum.
8.4 8.4 8.4 8.4 8.4 7.8 7.2 7.2 7.8 6.0 7.2
Minimum.
5.0 5.5 5.5 5.5 5.0 5.0 4.5 4.0 5.0 4.0 3.6
Mean.
6.74 6.78 6.76 6.44 6.48 6.64 5.17 4.39 5.89 5.03 4.85
Second- feet
(mean).
10.4 10.5 10.5 9.96
10.0 10.3 8.00 6.79 9.11 7.78 7.50
Total run-off.
Million gallons.
209 210 203 200 194 206 160 123 177 156 146
Acre- feet.
641 645 622 613 597 632 492 377 542 479 447
EAHOMA STREAM NEAR LAHAINA, MAUI.
LOCATION. About 125 Jeet above intake of Pioneer Mill Co.'s upper ditch, 3J miles east of Lahaina.
RECORDS AVAILABLE. August 3, 1911, to June 30, 1917.GAGE. Vertical staff on left bank.DISCHARGE MEASUREMENTS. Made by wading or from footbridge at gage.CHANNEL AND CONTROL. Channel at gage is a pool at foot of rapids; right bank
high and wooded; left bank a vertical wall of rock. Control composed of large and small boulders; fairly permanent.
EXTREMES OP DISCHARGE. Maximum stage recorded during period of record, 8.5 feet at 7 a. m. January 18, 1916 (discharge, estimated from extension of rating curve, 700 million gallons per day, or 1,080 second-feet); maximum stage recorded during year, 4.4 feet at 7 a. m. March 18 (discharge, approximately 250 million gallons per day, or 387 second-feet); minimum stage recorded, 1.2 feet frequently (discharge, 3.5 million gallons per day, or 5.4 second-feet).
DIVERSIONS. None above station at present. Before November 24, 1914, the mini mum flow of the stream and water from Kahoma development tunnel was diverted above station; since that date all water passes the gage.
REGULATION. Natural flow of the stream is largely increased by a development tunnel about 300 feet above station.
UTILIZATION. Irrigation of sugar cane.ACCURACY. Gage read twice daily. Records fair for ordinary stages. Extension of
rating curve not confirmed by measurements; estimates above 20 million gallons per day roughly approximate only.
Discharge measurements of Kahoma Stream near Lahaina, Maui, during the year endingJune 30, 1917.
[Made by H. A. R. Austin.]
Date.
Oct. 25.. ...........25.............
Gage height (feet).
1.331.42
Discharge.
Second- feet.
8.8 13.2
Million gallons
per day.
5.7 8.5
Date.
Jan. 23.............
Gage height (feet).
1.20
Discharge.
Second- feet.
5.0
Million gallons per day.
3.3

ISLAND OF MAUL 127
Daily discharge, 'in million gallons, of Kdhoma Stream near Lahaina, Maui, for the yearending June 30,1917.
Date.
1..............2..............q4..............5..............
6..............7..............8..............9........ .......10..............
11..............12..............13..............14..............15..............
16..............17..............18..............19..............20..............
21..............22..............23....-..-.....-24..............25..............
26..............27..............28..............29..............30..............31..............
July.
6.46.45.34.45.3
4.43.53.53.57.6
6.45.38.86.415
13217.6195.3
6.44.44.44.44.4
6.46.4106.47.6
17
Aug.
4913157.67.6
6.44.44.45.36.4
153417177.6
4.46.410158.8
6.46.45.35.34.4
5.36.46.45.35.35.3
Sept.
6.4175.35.35.3
26175.37.6
5.36.45.34.44.4
4.44.45.3127.6
5.35.37.6
156.4
5.35.34.44.44.4
Oct.
4.44.44.44.44.4
4.44.44.44.44.4
4.44.44.44.45.3
196.4105.35.3
4.45.36.44.45.3
13285.34.4106.4
Nov.
6.46.4249028
108.83.53.510
4.43.58.83.53.5
40266.44.43.5
3.53.53.53.55.3
2821496.45.3
Dec.
4.42112154.4
3.53.53.53.537
6.4153.55.34.4
2611210128.8
607470126.4
5.33.5137.64.43.5
Jan.
3.54.47.61917
195.33.53.53.5
6.45.33.53.53.5
3.53.53.53.54.4
4.44.43.53.53.5
3.54.45.35.35.33.5
Feb.
4.43.53.53.53.5
3.53.53,53.53.5
3.53.53.58.84.4
4.44.44.46.44.4
4.44.44.44.44.4
4.44.44.4
Mar.
4.44.4106.44.4
4.44.44.44.44.4
155.34.41219
6.44.4
1276.45.3
4.44.48.86.417
6.44.46.4195.37.6
Apr.
5.317135.35.3
4.44.44.44.44.4
565.34.44.46.4
7.631134.46.4
5.34.44.44.44.4
4.43.53.51743
May.
135.34.44.44.4
3.54.44.44.44.4
156.44.45.36.4
4.4246.44.44.4
6.46.4217.64.4
3.54.44.4
174.44.4
June.
5.3314.44.43.5
4.44.43.54.43.5
4.43.53.53.53.5
3.53.55.33.53.5
3.53.53.5123.5
3.53.5
. 3.53.54.4
NOTE. Discharge determined from a rating curve well defined between 2 and 10 million gallons per day.
Monthly discharge of Kahoma Stream near Lahaina, Maui, for year ending June 30, 1917.
Month.
July.................................
March. ..............................April................................May......................;..........
Discharge.
Million gallons per day.
Maximum.
2149 26 28 90
112 19 8.8
127 56 24 31
127
Minimum.
3.5 4.4 4.4 4.4 3.5 3.5 3.5 3.5 4.4 3.5 3.5 3.5
3.5
Mean.
7.61 10.2 7.45 6.64
14.1 18.4 5.60 4.24
11.2 10.0 7.02 5.03
9.00
Second- feet
(mean).
11.8 15.8 11.5 10.3 21.8 28.5 8.66 6.56
17.3 15.5 10.9 7.78
13.9
Total run-off.
Million gallons.
236 316 223 206 424 571 174 119 347 301 218 151
3,290
Acre- feet.
724 970 686 632
1,300 1,760
533 364
1,070 921 668 463
10,100

128 SURFACE WATER SUPPLY OF HAWAII, 1916-17.
KAHOMA DEVELOPMENT TUNNEL NEAR LAHAINA, MATTI.
LOCATION. At portal of the lower of two development tunnels of Pioneer Mill Co.,3J miles east of Lahaina. ,
RECORDS AVAILABLE. August 1, 1911, to June 30, 1917. GAGE. Vertical staff. DISCHARGE MEASUREMENTS. A 4-foot sharp-crested weir with end contractions
measures discharge from development tunnel and amount diverted from streamby small pipe; measurements checked by current meter.
CHANNEL AND CONTROL. Deep pool at weir confined by rock and concrete walls. EXTREMES OF DISCHARGE. Maximum discharge during period of record, 6.5 million
gallons per day, or 10 second-feet, August, 1911; minimum discharge, 1.7 milliongallons per day, or 2.6 second-feet.
DIVERSIONS. Small amount diverted from Kahoma Stream also passes over weir. REGULATION. None. UTILIZATION. Irrigation of sugar cane. ACCURACY. Records good. No velocity of approach; good weir. Gage read twice
daily.
Daily discharge, in million gallons, of Kahoma development tunnel near Lahaina, Maui, for the year ending June 30, 1917.
Date.
1... ...........2..............3..............
6..............7..............
g10..............
11..............12..............
14..............15..............
16..............17..............18..............19..............20..............
21..............22..............2324..............25..............
26..............27..............28..............29.............. 30.............. 31..............
July
3.43.43.43.43.4
3.53.53.53.63.7
3.73.83.8
" 3.93.9
3.9S Q
4 04.04.0
4.14.14.14.24.2
4.24.34.34.3 4.3 4.3
Aug.
4.34.34.34.34.4
4.44.44.44.44.4
4.44.44.44.44.4
4.44.44.44.44.4
4.44.44.44.44.4
4.44.44.44.4 4.4 4.4
Sept.
4.44.44.44.44.4
4.44.44.44.4
4.4
4.44.4
4.44.3
4.34.34.34.34.3
4.24.24.24.24.2
4.24.14.14.1 4.1
Oct.
4.14.14.14.14.1
4.14.1
4.14.1
4.04.04.04.04.0
4.04.04.03.93.9
3.83.83.83.83 7
3 7
3 7^ 7
3.7 3.7 3.7
Nov.
3.63.63.63.63.6
3 K
3.53.53.53 C
3.53 K
3 C
3 K
3.5
3 K
3 C
3 C
3 K
3 C
3.43.43 0
3 0
3 9
3 9
3 9^ 9
3.1 3.1
Dec.
3.13.13.13.13.1
3.13.13 1
^ 1
°. 1
^ 1
3.03 A
3.03.0
3.03 A
3 n2.99 Q
9 Q
2.92 Q
9 Q
2 Q
2 Q
9 Q9 Q
2.9 2.9 2.9
Jan.
2.92.82.82.82.8
2 0
2.82.82.82.8
2.82.82.82.82 0
2 0
2 0
2.82.82.8
2.82.82 0
2 0
2 0
2.82.82.82.8 2.9 2.9
Feb.
2.92.93.03.03.0
3.03.03.03.03.1
3.13.13.23.23.2
3.23.23.23.33.3
3.33.43.43.43.4
3.43 K
3 K
Mar.
3.53.53.53.53.5
3.53.53.53.6
3.63.63.63.63.6
3.63.63.63.6
3.63.63.63.63.6
3.63.63.63.6 3.6 3.6
Apr.
3.63.63.63.63.6
3.63.6
3.5
3.53.53.43.43.4
3.43 0
3.33.33.3
3.23.23.23.23 1
^ 1
3 1
3.13.1 3.0
May
3.03.03.02.92.9
2.92.92.82.82.8
2.82.82 0
2.82.8
2.82.82.82.82.8
2.82.82.72.72.7
2.72.72.72.7 2.7 2.7
June
2.62.62.62.62.6
2.62.62.62.62.6
2.62.62.52.52.5
2.52.52.52.52.5
2.42.42.42.42.4
2.42.32.32.32.3

ISLAND OP MAUI. . 129
Monthly discharge of Kahoma development tunnel near Lahaina, Maui for the yearending June 30, 1917.
Month.
July................................
May.................................
Discharge.
Million gallons per day.
Maximum.
4.3 4.4 4.4 4.1 3.6 3.1 2.9 3.5 3.6 3.6 3.0 2.6
4.4
Minimum.
3.4 4.3 4.1 3.7 3.1 2.9 2.8 2.9 3.5 3.0 2.7 2.3
2.3
Mean.
3.87 4.39 4.30 3.93 3.43 2.99 2.81 3.19 3.57 3.37 2.80 2.49
3.43
Second- feet
(mean).
5.99 6.79 6.65 6.08 5.31 4.63 4.35 4.94 5.52 5.21 4.33 3.S5
5.31
Total run-off.
Million gallons.
120 136 129 122 103 93 87 89
111 101 87 75
1,250
Acre- feet.
368 418 396 374 316 284 267 274 340 320 266 237
3,860
LAHAINALTTNA S-^REAM ABOVE PIPE-LINE INTAKE, NEAR LAHAINA, MAUL
LOCATION. 200 feet above intake of pipe line supplying Lahaina and Lahainaluna school, about 2J miles northeast of Lahaina.
RECORDS AVAILABLE. February 29, 1916, to June 30, 1917.GAGE. Gurley printing water-stage recorder.DISCHARGE MEASUREMENTS. Made by wading.CHANNEL AND CONTROL. One channel at all stages; fairly straight in vicinity of gage;
filled with large boulders; banks steep and high. Control composed of large boulders; fairly permanent.
EXTREMES OF DISCHARGE. Maximum stage recorded, 3.3 feet at 11.30 p. m. Decem ber 21, 1916 (discharge, approximately 300 million gallons per day, or 464 second- feet); minimum stage recorded, 0.95 foot March 22, 1917 (discharge, 3.4 million gallons per day, or 5.3 second-feet).
DIVERSIONS. None above station.REGULATION . None.UTILIZATION. Domestic supply, power development, and irrigation of sugar cane.ACCURACY. Records based on continuous record of gage height and fairly well-
defined rating curve; fair for low and medium stages. Extension of rating curve above 15 million gallons per day not based on discharge measurements. Dis charge record prior to July 1, 1916, not reliable owing to faulty working of water- stage recorder.
Discharge measurements of Lahainaluna Stream above pipe-line intake, near Lahaina, Maui, during the year ending June 30, 1917.
Date.
July 25.......Aug. 17.......
Oct. 23.......Dec. 14.......
Feb. 10.......Mar. 27.......Apr. 20.......June 20.......
Made by
.....do........................... . ....
.....do............................. ... .................
.....do...................................................
.....do...................................................
.....do............................. .... . . .......
.....do..........................
.....do........................... . . .......
.....do..........................C.T. Bailey...... .......................................
Gage height (feet).
1.30 1.39 1.25 1.49 1.31 1.26 1.23 1.13 1.27 1.10
Discharge.
Second- feet.
9.2 138.75
20.4 8.2 8.5 8.1 7.1 8.85 5.82
Million gallons per day.
6.0 8.3 5.7
13 5.3 5.5 5.2 4.6 5.7 3.8
40532° 18 wsp4Gt

130 SURFACE WATER SUPPLY OF HAWAII, 1916-17.
Daily discharge, in million gallons, of Lahainaluna Stream above pipe-line intake, near Lahaina, Maui,for the year ending June 80, 1917.
Date.
1..............2..............3..............4..............5. .............
6..............7..............8..............9..............
10..............
11..............12..............13..............14..............15..............
16..............17..............18..............19..............20..............
21..............22............ .23..............24..............25..............
26..............27..............28..............29..............30..............31..............
July.
1711118.6
11
7.37.36.06.06.0
6.06.06.05.45.4
6.07.36.05.46.0
5.45 A
5.45.45.4
7.321117.38.6
43
Aug.
1317176.06.0
5.45.45.45.48.6
131717116.0
5.47.38.6
1311
5.46.05.45.45.4
5 A
5.47.35.45.46.0
Sept.
8.6175.45.45.4
5.4117.35.46.0
7.36.06.06.06.0
6.06.06.0
317.3
6.07 Q
8.68.66.0
5 A
* d
5.44 Q
4 Q
Oct.
5.45.44 04 04 q
4 04.94 04 04 O
4 0
6.06.04 Q
4 Q
6.08.66.06.06.0
4 O
6.08.65.45.4
137.35.44 Q
135.4
Nov.
7.38.67.36.0
37
215.45.44.94 Q
6.04 O4 94.94 Q
1717
4 O
4.64.6
4.64.64.65.44.6
4.64.67.3
- 7.35.4
Dec.
4.95.4
21217.3
5.45.45.45.4
21
116.06.06.05.4
2621112111
1008450218.6
1111177.36.06.0
Jan.
6.06.06.06.0
13
117.36.06.06.0
136.06.05.45.4
5.45.45.45.46.0
5.45.45.45.45.4
5.47.36.07.37.35.4
Feb.
5.45.45.45.45.4
5.45.45.45.45.4
5.45.45.48.65.4
4.94 Q
6.0115.4
4.94 Q
4.94.94.9
4 94.94.9
Mar.
4.94.9
137.35.4
5.44.94.94.94.9
175.44.94.95.4
4.94.9
264.93.6
*3.6
3.43.93.64.2
4.94.64.67.34.94.6
Apr.
4.65.45.44.64.9
4.64.64.64.64.9
214.94.64.66.0
5.48.65.44.65.4
4.94.64.64.64.6
4.64.97.3
1711
May.
6.04.94.64.64.6
4.64.64.64.64.6
5.44.64.94.94.9
4.6114.94.64.6
4.94 Q
6.06.04.6
4.64.64.94.94.64.6
June.
4.6114.64.64.6
4.64.64.64.64.6
4.64.24.24.24.2
4.24.24.64.24.2
4.24 Q
4.24.24.2
4.24.64.64.64.2
NOTE. Discharge determined from rating curve fairly well defined below 15 million gallons per day. Discharge July 1-25, Oct. 11-23, Nov. 26-30, Dec. 1-14, and Dec. 26 to Jan. 4 determined by comparison with records of flow of Ukumehame stream.
Monthly discharge of Lahainaluna Stream above pipe-line intake, near Lahaina, Maui, for year ending June 30, 1917.
Month.
July................................
May................................
Discharge.
Million gallons per day.
Maximum.
43 17 31 13 37
100 13 11 26 21 11 11
100
Minimum.
5.4 5.4 4.9 4.9 4.6 4.9 5.4 4.9 3.4 4.6 4.6 4.2
3.4
Mean.
8.90 8.42 7.57 6.08 7.82
17.7 6.53 5.56 6.19 6.23 5.05 4.64
7.58
Second- feet
(mean).
13.8 13.0 11.7 9.41
12.1 26.4 10.1 8.60 9.58 9.64 7.81 7.18
11.7
Total run-off.
Million gallons.
276 261 227 189 234 648 202 156 192 187 157 139
2,770
Acre- feet.
847 801 697 578 720
1,680 621 478 589 574 480 427
8,490

ISLAND OF MAUL 131
KATTATJLA STREAM NEAR LAHAOTA, MATJI.
LOCATION. 350 feet above Kauaula ditch intake, about 3 miles east of Lahaina.RECORDS AVAILABLE. March 7, 1912, to June 30, 1917.GAGE. Vertical staff installed April 20, 1916, to replace vertical staff installed April
29, 1913, and washed out January 18,1916. Old gage was 250 feet above present location.
DISCHARGE MEASUREMENTS. Made by wading or from foot bridge.CHANNEL AND CONTROL. One channel at all stages; straight for 100 feet above and
below station; stream bed composed of boulders and coarse gravel; right bank slopes gently; left bank is of rock and nearly vertical. Control shifting.
EXTREMES OF DISCHARGE. Maximum stage recorded during period of record, 5.0 feet at 6 a. m. January 9, 1916 (discharge, computed from extension of rating curve, approximately 600 million gallons per day or 928 second-feet); minimum stage recorded, 0.89 foot April, 1914 (discharge, 4.2 million gallons per day, or 6.5 second-feet).
Minimum stage recorded during year, 1.4 feet April, May, and June (dig- charge, 5.4 million gallons per day, or 8.4 second-feet).
DIVERSIONS. None above station.REGULATION. Natural flow of stream is increased by a development tunnel in moun
tains above station.UTILIZATION. Power development and irrigation of sugar cane.ACCURACY . Gage read twice daily. Records poor on account of instability of control.
Discharge measurements of Kauaula Stream near Lahaina, Maui, during the year endingJune SO, 1917.
[Made by H. A. R. Austin.]
Date.
July 27.... .........Aug. 18............Oct. 23. ............
height (feet).
1.501.48 1.49
Discharge.
Second- feet.
14 12 12.7
Million gallons
per day.
9.27.6 8.2
Date.
Jan. 23... ..........
May 25. ............
Gage height (feet).
1.44 1.43 1.47
Discharge.
Second- feet.
8.9 8.4 9.0
Million gallons
per day.
5.8 5.4 5.8

132 SURFACE WATEK SUPPLY OF HAWAII, 1916-17.
Daily discharge, in million gallons, of Kauaula Stream near Lahaina, Maui, for theyear ending June SO, 1917.
Date.
1. .............
3..............4..............5..............
6..............7..............8..............
10..............
12..............13..............14..............15..............
16..............17..............18..............19..............20..............
21..............22..............23..............24..............25..............
26..............27..............28..............29.............. 30..............31..............
July.
9.79.29.29.29.2
8.88.88.88.88.8
8.88.88.8
9.2
9 9
139.7
109 9
9.28.88.8
8.8
9.2109 79.28.8
12
Aug.
109.7
119.79.2
8.88.88.89.29.2
Q 9
1111
8.8
8.38.38.38 0
8.8
8.38.37.87.87.8
7.87.87.88.37.87.8
Sept.
7.89.78.37.87.8
7.89.28.47.87.8
7.87.87.87.87.4
7.47.47.48.38.3
7.87.88.88.38.3
7.87.87.47.4 7.4
Oct.
7.87.87.47.47.4
7.47.47.47.47.4
7.47.47.47.47.4
7.47.88.37.47.4
7.47.88.47.47.4
8.88.87.87.47.87.4
Nov.
7.88.38.37.8
11
8.88.88.37.87.4
7.87.47.47.47.4
8.89.27.87.47.4
7.47.47.47.47.4
Q 7
7.8118.38 0
Dec.
7.89.2
10108.3
7.87.88.37.8
11
8.88.37.87.88.3
119.28.39 7
9.2
152016128.8
8.88.38.88.3 8.37.8
Jan.
7.47.47.48.47.4
7.47.47.07.07.0
8.37.47.46.66.6
6.66.66.66.67.0
6.26.26.26.26.2
6.2 6.6
7.06.6 6.66.2
Feb.
6.26.25.85.85.8
5.85.85.85.85.8
5..85.85.86 65.8
5.85.86.27.05.8
5.86.85.85.85.8
5.85.85.8
Mar.
5.85.86.26.26.2
5.85.85.85.85.8
7.46.65.85.85.8
5.85.89.77.47.4
5.85.56.26.66.6
5.85.85.87.4 6.26.2
Apr.
5.8'5.85.85.'45.5
5.45.45.45.45.4
7.87.45.85.45.8
5.46.66.25.45.4
5.85.45.45.45.4
5.45.45.89.5 Q n
May.
8.06.26.25.86.2
5.85.85.85.45.4
5.85.85.46.25.8
5.47.06.25.85.8
6.26.26.68.56.6
5.85.86.66.2fi 9
5.4
June.
5.48.55.85.45.4
5.45.45.85.85.4
6.65.85.45.45.4
5.45.45.85.45.4
5.45.45.45.45.4
5.45.45.45.4 5.4
NOTE. Discharge determined from poorly defined rating curves applicable as follows: July 1 to Aug. 4.1916. Aug. 15 to Dec. 23,1916, Jan. 21 to Mar. 18,1917, Apr. 1 to June 30,1917. Method for shifting channels Dec. 24, 1916, to Jan. 20, 1917, and Mar. 19-31, 1917. Discharge Sept. 8, Oct. 23, Jan. 28 and 30, Feb. 19, Mar. 12, Apr. 5,12.17,18,29, and 30, May 1,14,21,23,25,28-30, and June 2 and 11 was taken from Kauaula ditch record as being more accurate than stream record; all water being diverted.
Monthly discharge of Kauaula Stream near Lahaina, Maui, for the year ending JuneSO, 1917.
Month.
July.................................
December. ................... ...
February. ...........................
May.................................
The year. .....................
Discharge.
Million gallons per day.
Maximum.
13 11 9.7 8.8
11 20 8.4 7.0 9.7 9.5 8.5 8.5
20
Minimum.
8.8 7.8 7.4 7.4 7.4 7.8 6.2 5.8 5.5 5.4 5.4 5.4
5.4
Mean.
9.33 8.86 7.95 7.63 8.15 9.63 6.89 5.91 6.28 5.97 6.13 5.61
7.38
Second- feet
(mean).
14.4 13.7 12.3 11.8 12.6 14.9 10.7 9.14 9.72 9.24 9.48 8.68
11.4
Total run-off.
Million gallons.
289 275 239 236 244 298 214 166 195 179 190 168
2,690
Acre- feet.
888 843 732 726 750 916 655 508 597 550 583 516
8,260
KAUAULA DITCH NEAR LAHAINA, MAUI.
LOCATION. About 100 feet below intake, which is uppermost on the stream, about3 miles east of Lahaina.
RECORDS AVAILABLE. October 16, 1911, to June 30. 1917.

ISLAND OF MAUI. 133
GAGE. Vertical staff.DISCHARGE MEASUREMENTS. Made in flume at gage.CHANNEL AND CONTROL. Straight wooden flume 3 feet wide.EXTREMES OP DISCHARGE. Maximum stage recorded during year, 1.58 feet at 6
a. m. Aug. 12 (discharge, 10 million gallons per day, or 15.5 second-feet); maxi mum stage recorded during period of record, 1.70 feet April 7, 1912 (discharge, 16 million gallons per day, or 24 second-feet); water occasionally turned off.
DIVEKSIONS. Ditch diverts all low flow from Kauaula stream.REGULATION. Flow regulated by head gates.UTILIZATION. Power development and irrigation of sugar cane.ACCURACY. Gage read twice daily. Records fair for all stages.
Discharge measurements of Kauaula dit-ch near Lahaina, Maui, during the year endingJune 30, 1917.
[Made by H. A. R. Austin.]
Date.
July 27.............Aug. 18............Oct. 23.............
Gage height (feet).
1.41 1.30 1.38
Discharge.
Second- feet.
14 12 12.7
Million gallons
per day.
9.1 7.6 8.2
Date.
Jan. 23.............Mar.28. ...........May25.............
Gage height (feet).
1.03 .99 .90
Discharge.
Second- feet.
8.9 8.4 9.0
Million gallons
per day.
5.8 5.4 5.8
Daily discharge, in million gallons, of Kauaula ditch near Lahaina, Maui, for the yearending June 30, 1917.
Date.
1.... ..........2..............3..............4..............5..............
6..............7..............8..............910..............
11..............12..............13..............14..............15..............
16..............17..............18..............1Q
20..............
91
22..............23..............24..............25..............
26..............27..............28..............29.............. 30.............. 31..............
July.
8.28.67.87.87.8
8.27.87.47.07.0
7.87.87.47.88.2
7.89 A
8.68.68.6
8.67.47.47.07.0
7.09 na n8.2 8.2 8.6
Aug.
8.68.29 49.09 n
8.27.88.28.28.6
8.29.88.88.48.8
7.67.68.08.08.4
8.07.67.27 9
7 9
6 Q
R O
7.27.6 6.96 A
Sept.
7.69.18.06.96 0
6 09 18.47.66 a
6.96 a6 96 96 9
6.66 26.27.66 0
6 96 98.07.68.0
6 96 96.66.6 6.6
Oct.
7.26.96.66.26.2
fi 9
6.26.26.26.2
6.25.85.85.85 0
6.67 98.06.66.2
6 06 98.46.26.2
8.08.47.26.2 6.9 6.6
Nov.
7.67.68.06.68.4
7.67.67.66.26.2
6.66.25.85.85.8
7.68.46 96.65.8
5.55.5>; %5 0
5.8
8.06.68.47.6 7.6
Dec.
6.28.08.08.47.6
6.66.67.26.96.6
7.6R O
6.66.6R O
8.07 07 0
8 ft
8.4
8.47.67.67.67.6
8.48.07.68.0 7.6 7.6
Jan.
6.96.96.68.48.0
7 9R O6.96.66.6
8.07.26.66.26.2
6.26.26.25.86 9
5.8n «5.85 K
5.5
6.26.66 96.6 6.6 5.8
Feb.
5.85.85.55.55.5f; \5.55.5<i f;5.2
5.25.25.26.65 9
5.25.25.86 A
5 K
% ^
5.25.2f; 95.2
5.25.25.2
Mar.
5.24.86.25.26.2f; 95.25.25.24.8
6.66.6>; f;5.25 O
5.25.28.47 9
7 9
5.8>; f;6.26.66.6
5.85.5>; f;7.2 5.8 5.8
Apr.
5.55.55.55.25.5
5 9
5.25.24 0
4.8
6.67.25 9
5.25.5
5.26.66.25.25 O
5.55 O
5.25.25.2
4.83.64.49.5 9.0
May.
8.05.85.35.35.8
4.44.04.44.04.0
4.85.34.46.25.8
4.46.65.84.84.4
6.26.26.68.56.6
4.84.86.66.2 6.2 4.8
June.
4.88.55.84.84.8
4.84.45.85.84.8
6.65.34.44 44.0
4.04.04.84.04.0
4.04.04.04.04.0
3.64.04.04.0 4.0
NOTE. Discharge determined from fairly well defined rating curves applicable as follows: July 1 to Aug. 12, 1916, Aug. 13, 1916, to Apr. 26, 1917, Apr. 27 to June 30, 1917.

134 SURFACE WATER SUPPLY OF HAWAII, 1916-17.
Monthly discharge of Kauaula ditch near Lahaina, Maui,for year ending June 30, 1917.
Month.
July................................
September ..........................
December.. . ........................
Discharge.
Million gallons per day.
Maximum.
9.0 9.8 9.1 8.4 8.4 8.4 8.4 6.9 8.4 9.5 8.5 8.5
9.8
Minimum.
7.0 6.9 6.2 5.8 5.5 6.2 5.5 5.2 4.8 3.6 4.0 3.6
3.6
Mean.
7.95 8.01 7.21 6.62 6.84 7.47 6.57 5.47 5.86 5.54 5.52 4.65
6.49
Second- feet
(mean).
12.3 12.4 11.2 10.2 10.6 11.6 10.2 8.46 9.07 8.57 8.54 7.19
10.0
Total run-off.
Million gallons.
247 248
. 216 205 205 232 204 153 182 166 171 139
2,370
Acre- feet.
75C 762 664 63C 63C 711 62? 47C 55T 51C 525 42?
7,27C
LAUNITJPOKO STREAM NEAR LAHAINA, MAUL
LOCATION. About 175 feet above Pioneer Mill Co. 's ditch intake, 1 mile above storage reservoir, and about 5J miles southeast of Lahaina.
RECORDS AVAILABLE. July 25, 1911, to June 30, 1917.GAGE. Vertical staff on right bank. New datum April 21, 1916. DISCHARGE MEASUREMENTS. Made by wading.CHANNEL AND CONTROL. One channel at all stages; straight for 50 feet above and
below gage; stream bed rough and steep. Control composed of small boulders; shifts during floods.
EXTREMES OF DISCHARGE. Maximum stage recorded during period of record, 4.0 feet estimated gage height of flood of January 18,1916 (determination of discharge not possible); minimum stage recorded, 0.4 foot frequently during 1913-14 (dis charge, 0.5 million gallons per day, or 0.75 second-feet).
Minimum stage recorded during year, 0.5 foot frequently (discharge, 0.9 million gallons per day, or 1.4 second-feet).
DIVERSIONS. None above station.REGULATION. Nearly all low-water flow of stream is derived from a development
tunnel above station.UTILIZATION. Irrigation of sugar cane.ACCURACY. Gage read once daily. Records fair for ordinary stages.
Discharge measurements of Launiuppko Stream near Lahaina, Maui, during the yearending June 30, 1917.
[Made by H. A. R. Austin.]
Date.
July 27.. ...........
Sept. 11............
height (feet).
1.05 .89 .85
Discharge.
Second- feet.
5.4 2.32.0
Million gallons
per day.
3.5 1.5 1.3
Date.
Oct. 23.. ...........
Gage height (feet).
0.82 .82 .49
Discharge.
Second- feet.
1.71 1.5 1.37
Million gallons
per day.
1.1 l.C.r

ISLAND OF MAUL 135
Daily discharge, in million gallons, of Launiupoko Stream near Lahaina, Maui, for theyear ending June 30, 1917.
Date.
1.. ............2. ............. 3..............4..............5..............
6..............7..............8..............9..............
10..............
11..............12..............13..............14..............15..............
16.............. 17..............18.............. 19..............20..............
21..............22..............23..............24..............25..............
26..............27..............28..............29.............. 30..............31..............
July.
2.21.6 1.61.61.6
1.61.61.61.61.6
1.61.61.61.61.6
1.6 3.42.8 2.82.2
2.2
2.22.22.2
2.22.82.22.2 2.25.6
Aug.
2.22.2 3.4
2.82.8
2 0
2.22 9
2.2
2 9
3.43.42.8
2.2 2.21.6 -1.61.6
1.61.61.61.61.6
1.61.61.61.6 1.61.6
Sept.
1.62.21.61.61.2
1.21.61.61.21.2
1.21.21.21.21.2
1.2 1.21.2 1.21.6
1.21.21.21.21.2
1.21.21.21.2 1.2
Oct.
1 9
1.2 1.21 9
.9
.9
.99
.9
9.9
1.21.2.9
1.2 1.2.9
.9
.91 9
.91.2
.91 9
.9
.9
.91.2
Nov.
O n
1.2
5.6
1.61.2.9
.9
.99
.9
.91.6.9 .9.9
.9
.9
.9
.9
.9
Dec.
0.91.21 9
2.81.2
2.82.8
1.2
.9
.91.2
1.6 1.21.2 .9
1.2
5.65.68.16.43.4
2.22 9
2.22.2 1.61.6
Jan.
1.21.2 1 23.41.2
1 9
.99
.9
1.61.21.21 9
9
.9
.9
.9
.91.2
1.2
1.65.63.42.8
1.6
Feb.
1.61.2 1.21.21.2
.9.9-
.9
.9
:9.9
2.2.9
.9
.9
.9 4.01.2
.9
.9
.9
.9
.9
.9
.9
Mar.
0 Q.9 .9
.9
.9
.9
.9
2.81.2.9
.9
.9
.911.0 6.41.2
1.21.21.21.21.2
1.2
.9
.9
.9
Apr.
0.9.9 .9
.9
.9
.9
.9
1.21.2
.9
.9
.9
4.0 2.2
May.
0.9
.......
.9
.......
.9
.......
.9
.9
.9
.9.
.9
June.
0.9.9
.9
9
9 99
.9
.9
.9
.9
NOTE. Discharge determined from rating curves applicable as follows: July 1 to Mar. 18, well defined between 1 and 4 million gallons per day; Mar. 19 to June 30, poorly denned. Gage heights recorded inter mittently ̂ fter Apr. 12.
Monthly discharge of Launiupoko Stream near Lahaina, Maui, for the year ending June30, 1917.
Month.
July................................
Discharge.
Million gallons per day.
Maximum.
5.6 3.4 2.2 1.2 5.6 5.6 4.0
11.0
Minimum.
1.6 1.6 1.2 .9 .9 .9 .9 .9
Mean.
2.12 2.12 1.31 1.02 1.12 1.48 1.14 1.54
Second- feet
(mean).
3.28 3.28 2.03 1.58 1.73 2.29 1.76 2.38
Total run-off.
Million gallons.
66 66 39 32 34 46 32 48
Acre- feet.
202 202 121 97
103 141 98
147
OLOWALTT DITCH NEAR OLOWALTT, HAITI.
LOCATION. 425 feet above intake to penstock of hydro electric power station, 1 mileabove Olowalu and 7 miles east of Lahaina.
RECORDS AVAILABLE. July 28, 1916, to June 30, 1917. Replaces old station intailrace from, power house, for which records are available August 12, 1911, toJune 30,1916.
GAGE. Vertical staff. DISCHARGE MEASUREMENTS. Made by wading.

136 SURFACE WATER SUPPLY OF HAWAII, 1916-17.
CHANNEL AND CONTROL. Channel about 3.5 feet wide cut in earth and rock; straight for 50 feet above and below gage. Control not well defined.
EXTREMES OF DISCHARGE. Maximum stage recorded during year, 0.98 foot at 5.30 a. m. July 31 (discharge, 8.1 million gallons per day, or 12.5 second-feet); mini mum stage recorded, 0.3 foot August and April (discharge, 2.8 million gallons per day, or 4.3 second-feet).
DIVERSIONS. None above station.REGULATION . None.UTILIZATION. After passing through power house water is used for irrigation of sugar
cane. A small amount is sometimes diverted for irrigation at higher levels and does not pass through power house.
ACCURACY. Gage read twice daily. Records good for all stages.
Discharge measurements of Olowalu ditch near Olowalu, Maui, during the year endingJune SO, 1917.
[Made by H. A. B. Austin.]
Date.
July 28.. ...........
Gage height (feet).
0.72 .53.68
Discharge.
Second- feet.
9.3 6.9 8.55
Million gallons
per day.
6.0 4.5 5.5
Date.
May 23...... .......
Gage height (feet).
0.48 .67 .57
Discharge.
Second- feet.
6.15 8.6 6.4
Million gallons
per day.
4.0 5.6 4.1
Daily discharge, in million gallons, of Olowalu ditch near Olowalu, Maui, for the yearending June SO, 1917.
Date.
1. ...... .......
4..............
6..............
8..............
10..............11..............
10
14..............15..............
16..............17..............18..............19.............. 20..............
22..............23..............24..............25..............
26..............27..............28..............29.............. 30.............. 31..............
July.
....:..
5.85.0 4.67.8
Aug.
7.06.66.26.25.8
5.45.45.04.63.8
4.65.46.67.47.4
7.05.85.04.2 3.8
3.53.53.24 9
4.2
3.53.22.83.23.8 5.0
Sept.
5.46.25.45.45.0
5.05.85.45.45.4
5.05.05 A
5.05.0
4.64.64.65.8 5.8
5.45.05.05.45.4
5.45.05.04.6 4.6
Oct.
4.64.64.24 9
4.2
4.24.24.24.24.2
3.84.24.65.04.6
5 A
5.45.45.0 5.0
4.64.24 9
4.64.2
5.05.44.64.6 4.64.6
Nov.
4.64.64.64.25.0
4.64.64.24.23.8
3.83.83.83.53 0
3.85.85.85.0 4.6
4.64.24.24.24.2
4.24.64.64.64.6
Dec.
4.65.05.45.85.8
5.45.05.85.86.2
6.25.05.85.45.4
5.45.05.0
"'5.8
6.67.07.41 a7.4
7.07.07.05.8 5.4 5.4
Jan.
5.05.05.04.64.6
4.24.24.24.24.2
5.05.04.64.64.6
4.24.24.24.2 4.6
4.64.64.24.24.2
4.64.65.05.0 4.2
. 4.2
Feb.
3.83.83.53.53.5
3.53.83.53.53.5
3.84,64.64.64.2
4.24.24.65.4 5.4
5.45.04.64.24 9
4.24.23 0
Mar.
3.53.53.83.84.6
4.64.64.24.24.2
4.65.04.64.64.6
4.24.67.04.2
3.83.83.53 K
3 K
3 9
3 9
3 K
3.2 3.2 3.2
Apr.
3.23.23.23.53.5
3.53.53.53.23.2
3.23.23 9
3.22.8
2.83.23.23.2 3.2
3 9
3.22 0
2 0
2 0
2.83.84 9
5.4 5.4
May.
j 5.86.25.85.85.8
5.85.45.45.04.6
4.64.64.64.24.2
4.24.24.24.2 3.5
3 9
3.23.54.23 0
3.83.84.65.4 5.4 5.0
June.
4.64.64.2
' ^ Q
3.8
3 0
3.54.24 9
4.2
4.24.23 0
3.83.5
3.84.23.83.8 3.5
3 9
3.23.23 9
3.5
3.53.83 K
3.8 3.5
NOTE. Discharge determined from rating curves applicable as follows: July 28, 1916, to Mar. 19,1917, well denned between 3 and 7 million gallons per day; Mar. 21 to June 30.1917, fairly well defined. Ditch broken Dee. 19 and Mar. 20.

ISLAND OF MATJI. 137
Monthly discharge of Olowalu ditch near Olowalu, Maui, for year ending June 30, 1917.
Month.
April................................
Discharge.
Million gallons per day.
Maximum.
7.4 6.2 5.4 5.8 5.0 5.4 5.4 6.2 4.6
Minimum.
2.8 4.6 3.8 3.5 4.2 3.5 2.8 3.2 3.2
Mean.
4.95 5.19 4.56 4.40 4.51 4.18 3.37 4.65 3.80
Second- feet
(mean).
7.66 8.03 7.06 6.81 6.98 6.47 5.21 7.19 5.88
Total run-off.
Million gallons.
153 156 141 132 140 117 101 144 114
Acre- feet.
471 478 434 405 429 359 310 442 350
TTKTJMEHAME STREAM NEAR OLOWALTT, MATTI.
LOCATION. Half a mile above upper ditch intake, 2 miles above Government road at the 14-mile post, and 4 miles by road and trail east of Olowalu.
RECORDS AVAILABLE. August 14, 1911, to June 30, 1917.GAGE. Gurley printing water-stage recorder installed February 20, 1916; replaced
vertical staff installed April 23, 1913, 200 feet below-present gage and washed out January 18, 1916.
DISCHARGE MEASUREMENTS. Made by wading or from footbridge 900 feet below gage.CHANNEL AND CONTROL. One channel at all stages; straight for 50 feet above and
below gage; right bank is steep and high; left bank slopes gradually; very rough stream bed composed of boulders and gravel. Control somewhat shifting.
EXTREMES OF DISCHARGE. Maximum stage recorded during period of record, 9.0 feet estimated gage height of flood of January 18, 1916; no estimate of discharge pos sible; minimum stage recorded, 0.60 foot October 4 and 5, 1913 (discharge, 2.3 million gallons per day, or 3.6 second-feet).
Maximum stage recorded during year, 4.55 feet at 9 a. m. March 18 (discharge approximately 150 million gallons per day, or 232 second-feet); minimum stage recorded, 0.5 foot April and June (discharge, 4.1 million gallons per day, or 6.3 second-feet).
DIVERSIONS. None above station.REGULATION . None.UTILIZATION. Irrigation of sugar cane.ACCURACY. Records, July 1, 1916, to January 11, 1917, good; those for remainder of
year, fair. Several shifts in control occurred, but frequent discharge measure ments gave fair results for ordinary stages.

138 SUEFACE WATER SUPPLY OF HAWAII, 1916-17.
Discharge measurements of Ukumehame Stream near Olowalu, Maui, during the yearending June 30, 1917.
Date.
July 28.. ......Aug. 17.......Sept. 9........Oct. 21. .......Dec. 16.. ......Jan. 25........Feb. 10........
12........Mar. 27........Apr. 20........May 23........
Made by
.....do....................................................
.....do....................................................
.....do....................................................
.....do...................................................
.....do....................................................
.....do....................................................
.....do....................................................
.....do....................................................
.....do....................................................
.....do....................................................C. T. Bailey. .. ...........................................
Gage height (feet).
0.98 .90 .80 .72
1.01 .84 .96 .62 .57 .58 .57 .50
Discharge.
Second- feet,
19 15 11.6 8.23
20.8 8.3 8.6 8.0 7.9 8.38 7.84 6.33
Million gallons
per day.
12 10 7.5 5.3
13 5.4 5.6 5.2 5.1 5.4 5.1 4.1
Daily discharge, in million gallons, of Ukumehame Stream near Olowalu, Maui, for theyear ending June 30, 1917.
Date.
1. .............2..............3..............4..............5..............
6..............7..............8..............9..............10..............
11..............12..............13..............14..............15..............
16..............17..............18..............19..............20..............
21..............22. .............23..............24..............25..............
26..............27..............28..............29..............30.............. 31..............
July.
1413131213
10108.78.78.7
8.78.78.77.47.4
8.7108.77.48.7
7.47.47.47.47.4
8.71313108.7
16
Aug.
1414181310
8.78.77.47.47.4
7.410121513
108.77.47.47.4
8.71215128.7
8.78.7108.77.4 8.7
Sept.
1015108.78.7
101513107.4
7.47.47.46.26.2
6.26.26.28.77.4
7.46.28.78.78.7
7.47.47.46.26.2
Oct.
6.26.26.26.26.2
6.26.26.26.26.2
5.07.46.26.25.0
5.06.26.25.05.0
5.05.06.25.05.0
8.78.77.46.26.2 6.2
Nov.
6.26.26.26.213
128.77.46.26.2
6.26.26.25.06.2
7.4127.46.26.2
6.26.26.26.26.2
5.05.010107.4
Dec.
6.27.4
161610
7.47.47.47.4
16
138.78.78.77.4
12128.78.78.7
2022282220
131312108.7 8.7
Jan.
7.47.47.47.47.4
6.26.26.26.28.7
208.78.77.47.4
7.47.47.47.48.7
7.47.47.47.47.4
6.21514168.7 6.2
Feb.
5.05.05.05.05.0
5.05.05.05.05.0
5.05.05.0138.7
8.77.4101310
8.78.78.78.78.7
7.47.47.4
.......
Mar.
7.47.48.78.78.7
8.77.47.47.47.4
10108.78.77.4
7.47.4271410
8.77.47.46.26.2
6.26.25.05.06.2 5.0
Apr.
6.26.25.05.05.0
5.05.05.05.05.0
6.25.05.05.05.0
5.05.05.05.05.0
5.05.05.05.05.0
5.04.17.41813
May.
8.78.77.46.28.7
7.46.26.26.26.2
6.25.05.05.05.0
5.06.25.05.05.0
5.05.06.25.05.0
5.07.47.46.25.0 5.0
June.
5.05.05.05.05.0
5.04.15.05.05.0
6.25.05.04.14.1
4.14.14.14.14.1
4.15.04.14.14.1
4.15.05.04.14.1
NOTE. Discharge determined from rating curves applicable as follows: July 1. 1916, to Jan. 11, 1917, well defined between 4 and 16 million gallons per day; Feb. 12 to Mar. 18,1917, and Mar. 19 to June 30,1917, poorly denned. Shifting-control method used Jan. 12 to Feb. 11. Discharge determined by comparison with record of Lahainaluna Stream Sept. 1-10.

ISLAND OF MAUI. 139
Monthly discharge of Ukumehame Stream near Olowalu, Maui, for year ending June 30,1917.
Month.
July.................................
November. .........................December. ..........................
March. ..............................April................................May.................................June. . ..............................
Discharge.
Million gallons per day.
Maximum.
16 18 15 8.7
13 28 20 13 27 18 8.7
% 6.228
Minimum
7.4 7.4 6.2 5.0 5.0 6.2 6.2 5.0 5.0 4.1 5.0 4.14.1
Mean.
9.74 10.2 8.38 6.09 7.19
12.1 8.52 7.20 8.36 5.87 6.02 4.597.87
Second- feet
(mean).
15.1 15.8 13.0 9.42
11.1 18.6 13.2 11.1 12.9 9.08 9.31 7.10
12.2
Total run-off.
Million gallons.
302 316 251 189 216 375 264 202 259 176 186 138
2,870
Acre- feet.
927 970 772 579 662
1,150 811 619 795 540 573 423
8,820
WAIKAPTJ STREAM NEAR WAIKAPTJ, MATJI.
LOCATION. 300 feet below intake of Palolo ditch, 1J miles west of Waikapu, and 4miles by road southwest of Wailuku.
RECORDS AVAILABLE. December 1, 1910, to June 30, 1917. GAGE. Vertical staff on left bank installed April 26, 1916, to replace staff gage at
old location 200 feet downstream. Old gage washed out January 7, 1916. DISCHARGE MEASUREMENTS. Made by wading. CHANNEL AND CONTROL. One channel at all stages; straight for 100 feet above and
25 feet below gage; left bank high and nearly vertical; right bank slopes gently.Control composed of large boulders; fairly permanent between extreme floods.
EXTREMES OP DISCHARGE. Highest flood on record occurred morning of January 18,1916, when water reached a height of about 10 feet, datum of old gage; dischargenot estimated. Minimum stage recorded, 0.25 foot (old datum) February 26 toMarch 4, 1914 (discharge, 0.1 million gallons per day, or 0.15 second-foot).
Minimum stage for the year, 1.0 foot May and June (discharge, 0.4 milliongallons per day, or 0.6 second-foot).
DIVERSIONS. Nearly all low-water flow is diverted above station by South SideWaikapu ditch and Palolo ditch.
REGULATION. Natural flow has been increased by development tunnels near theheadwaters.
UTILIZATION. Flow at low and medium stages is diverted for irrigation of sugar cane. ACCURACY. Record fair for low and medium stages; those for high and fluctuating
stages roughly approximate only, as gage is read but twice daily.
Discharge measurements of Waikapu Stream near Waikapu, Maui, during the year endingJune 30, 1917.
Date.
July 24........ Aug. 17.......Sept. 16.......Oct. 14. .......Jan. 20........Mar.24. ......May 26........June 27.......
Made by-
Hi. A. R. Austin.......................................... ....do........................................................do........................................................do........................................................do........................................................do........................................................do...................................................C.T. Bailey.......... ...................................
Gage
(feet).
0.91 .95 .78 .85 .83
1.33 1.02 1.02
Discharge.
Second- feet.
2.9 3.7 1.65 1.28 2.86 4.07 .59 .77
Million gallons, per day.
1.9 2.4 1.1 .74
1.8 2.6 .38 .5

140 SURFACE WATER SUPPLY OF HAWAII, 1916-17.
Daily discharge, in million gallons, of Waikapu Stream near Waikapu, Maul, for theyear ending June SO, 1917.
Date.
1..............2..............3..............4..............5..............
6..............7..............8..............9..............
10..............
11..............12..............13..............14..............15..............
16..............17..............18..............19..............20..............
21..............22..............23..............24..............25..............
26..............27..............28..............29..............30..............01
July.
3.63.63.65.16.0
3.63 C
3.03.03.0
3.63.03.02.5
.2.0
2.03.62.52.52.0
2.02.02.02.02.0
2.58.04.22 K
2.0
Aug.
5.18.0
103.63.0
2.52.52.52.02.0
2.03.07.0
257.0
3.02.52.52.52.0
2.02.02.02.02.0
2.52.02.09 n2.02 f\
Sept.
2.09.04.23.03.0
2.57.03.03.02.0
2.02.01.61.61.6
1.6.9.9
2.53.0
1.21.22.52.02.0
1.2
1.2Q
1.2
Oct.
1.21.61.2.9.9
.9
.9
.9
.9
.9
.91.2.9.9
.91.2.9.9.9
.91.21.2.9.9
3.01.61.2.9.9
g
Nov.
0.9.9.9.9
8.0
1.6.9.9.6.6
.6
.6
.6
.6
.6
.97.01.6.9.6
.6
.6
.6
.6
.6
.6
.64.22.0.9
Dec.
0.61.6
138.01.2
.9Q
1.2.9
42
3.02.51.23.02.5
143.63.01.61.2
1316551922
3.61.62.02.02.0 1.6
Jan.
2.01.61.62.01.6
1.61.61.61.21.2
4.21.61.21.21.2
1.2.9.9
1.21.2
.9
.9
.9
.9
.9
1.62.03.01.21.2 1.2
Feb.
1.21.21.2.9.9
.9
.9
.6
.6
.9
.6
.6
.96.01.2
1.21.21.62.01.6
1.61.21.21.21.2
1.2.9
1.2
Mar.
0.9.9.9
1.21.2
.9
.9
.9
.9
.9
1.61.2.9.9.9
.9
.9220
9.05.1
3.63.63.68.01.2
1.21.21.21.21.2 1.2
Apr.
1.21.2.9.9
1.2
.9
.9
.9
.9
.g1.21.2.9
6.0.9
.91.2.9.9
1.2
1.2.9.g.g.9
.g
.g
.g4427
May.
g.o5.1.g.g.g.9.6.6.6.6
.6
.6
.6
.6
.6
.6
.6
.9
.9
.g1.21.21.2.4.4
.4
.6
.4
.4
.4
.4
June.
0.4.4.4.4.4
.4
.42.02.0.9
2.5.6.6.4.4
.4
.4
.4
.4
.4
.42.5.6.4.4
.41.2.9.6.4
NOTE. Discharge determined from rating curves fairly well defined below 4 million gallons per day, applicable July 1 to Mar. 18 and Mar. 19 to June 30.
Monthly discharge of Waikapu Stream near Waikapu, Maui,for year ending June 30, 1917.
Month.
July................................
March. .............................
M^y.. ..............................
Discharge.
Million gallons per day.
Maximum.
16 25 9.0 3.0 8.0
55 4.2 6.0
220 44 9.0 2.5
220
Minimum.
2 0 2 0
9 9 6 6 9 6g g4 4
.4
Mean.
3.55 3.88 2.37 1.08 1.38 7.86 1.47 1.28 8.97 3.46 1.10 .73
3.12
Second- feet
(mean).
5.49 6.00 3.67 1.67 2.14
12.2 2.27i.gs
is. g5.35 1.70 1.13
4.83
Total run-off.
Million gallons.
110 120 71 34 42
244 46 36
278 104 34 22
1,140
Acre- feet.
338 369 218 103 127 748 140 110 853 319 105 67
3,500
PALOLQ DITCH NEAR WAIKAPTT, MAUL
LOCATION. 200 feet below intake, 1J miles west of Waikapu, and 5J miles by roadsouthwest of Wailuku.
RECORDS AVAILABLE. November 21, 1910, to June 30, 1917. GAGE. Vertical staff on left bank. DISCHARGE MEASUREMENTS. Made by wading.

ISLAND OP MATJI. 141
CHANNEL AND CONTROL. Channel is cut in earth and soft rock; fairly straight for 50 feet above and below gage; clean and usually free from vegetation. Control a small wooden culvert 1 foot below gage; fairly permanent.
EXTREMES OP DISCHARGE. Maximum stage recorded during yea'r, 1.18 feet at 9 a. m. December 26 (discharge, 3.7 million gallons per day, or 5.7 second-feet); maximum stage recorded during period of record, 1.33 feet at 2 p. m. December 7, 1913 (discharge, 4.7 million gallons per day, or 7.3 second-feet); ditch occasionally dry.
DIVERSIONS. None above station.REGULATION. Water may be turned out of ditch by gates.UTILIZATION. Irrigation of sugar cane and taro.ACCURACY. Gage read twice daily. Discharge determined from well-defined rating
curve and reliable gage heights. Records good for all stages.
Discharge measurements of Palolo ditch near Waikapu, Maui, during the year endingJune 30, 1917.
[Made by H. A. R. Austin.]
Date.
July 24. ............Oct. 14.............
Gage height (feet).
0.98 1.04 .76
Discharge.
Second- feet.
4.0 4.15 2.44
Million gallons
per day.
2.6 2.7 1.6
Date.
Mar.24... .........
Gage height (feet).
.64
.90
Discharge.
Second- feet.
1.75 3.46
Million gallons
per day.
1.1 2.2
Daily discharge, in million gallons, of Palolo ditch near Waikapu, Maui, for the yearending June 30, 1917.
Date.
1..............2..............3..............4..............5..............
6..............7..... .........8..............9..............
10. .............
11..............12..............13..............14..............15. .............
16..............17..............18..............1920..............
21..............22..............23... ...... .....24..............25..............
26..............27..............28. .............OQ
on
31..............
July.
3.33.33.33 O
3.3
3.33.33.33.33.3
3.33.33.33.33.0
3.03.33.0 3.03.0
3.02.72.72.72.7
2.73.02.72.72.73.0
Aug.
2.72.72.72.72.7
2.72.72.42.42.4
2.42.72.73.02.7
2.73.33.3 3.33.0
3.03.03.03.03.0
3.03.02.72.72.72.7
Sept.
2.73.02.01.21.2
1.21.31.21.23.0
3.03.03.03.03.0
3.03.03.0 3.03.0
2.72.72.72.72.7
2.72.72.72.72.7
Oct.
3.33.33.33.33.0
3.03.03.03,03.0
3.03.03.03.03.0
3.03.0
,3.0 3.03.0
3.03.03.03.03.0
3.33.33.33.03.03.0
Nov.
3.03.03.03.03.3
3.33.03.03.03.0
2.72.72.72.72.7
3.03.33.02.72.7
2.72.72.72.72.7
2.42.43.03.02.7
Dec.
2.73.03.33.32.7
2.72.72.72.73.6
2.71.22.41.81,6
3.33.33.3 3.03.3
3.33.33.3
3.3
3.83.63.63 O
3.33.3
Jan.
1.61.61.61.81.8
1.61.61.61.62.2
2.22.01.81.81.8
1.61.61.6 1.61.8
1.82.22.22.22.2
2.22.22.22.22.22.2
Feb.
2.22.01.81.81.8
2.02.02.02.02.0
2.01.82.01.21.2
1.21.31.6 1.21.2
1.21.21.21.21.2
1.22.02.0
Mar.
2.02.02.02.02.0
2.02.02.02.02.0
2.02.02.02.02.0
2.02.0
.3
1.22.02.02.02.02.-02.62.02.02.02.0
Apr.
2.02.02.02.02.2
2.22.22.22.22.2
2.22.22.22.22.2
2.22.22.29 0
2.2
2.22.22.22.22.2
2.22.22.23.31.6
May.
1.82.02.01 S
2.2
2.20 )
2.22.22.2
2.22.22.22.22.2
2.22.22.22.22.2
2.22.22.22.42.4
2.29 0
2.22.22.22.2
June.
2.22.22.22 O
2 0
2.22 O
2.22 A
2.2
2 A
2.22.22.22.2
2.22.22.0 2.02.0
2.02.22.22.22.0
2.02.22.22.22.2
NOTE. Discharge determined from well-defined rating curve, by flood.
No flow Mar. 18 and 19; intake damaged

142 SURFACE WATER SUPPLY OF HAWAII, 1916-17.
Monthly discharge of Palolo ditch near Waikapu, Maui, for year ending June 30, 1917.
Month.
July.................................
March (29 days) .....................
Discharge.
Million gallons per day.
Maximum.
3.3 3.3 3.0 3.3 3.3 3.8 2.2 2.2 2.0 3.3 2.4 2.4
Minimum.
2.7 2.4 1.2 3.0 2.4 1.2 1.6 1.2 .3
1.6 1.8 2.0
Mean.
3.07 " 2.81
2.50 3.07 2.86 3.00 1.89 1.62 1.91 2.19 2.17 2.17
Second- feet' (mean).
4.75 4.35 3.87 4.75 4.43 4.64 2.92 2.51 2.95 3.39 3.36 3.36
Total run-off.
Million gallons.
95 87 75 95 86 93 59 46 56 66 67 65
890
Acre- feet.
292 267 230 292 263 285 180 139 170 202 206 200
2,730
SOUTH SIDE WAIKAPTT DITCH NEAR WAIKAPTT, MATTI.
LOCATION. One mile below intake, 1£ miles west of Waikapu, and about 5£ milesby road southwest of Wailuku.
RECORDS AVAILABLE. November 21, 1910, to June 30, 1917. GAGE. Vertical staff on right bank.DISCHARGE MEASUREMENTS. Made from plank over ditch at gage. CHANNEL AND CONTROL. Channel is cut in earth and soft rock; section fairly uni
form; banks vertical. Control not well defined but fairly permanent betweentimes of cleaning ditch.
EXTREMES OF DISCHARGE. Maximum stage recorded during year, 0.98 foot August14 (discharge, 12 million gallons per day, or 19 second-feet); ditch dry April 14.
Maximum stage recorded during period of record, 1.25 feet at 9 a. m. May 8,1914 (discharge, 16 million gallons per day, or 25 second-feet); ditch occasionallydry.
DIVERSIONS. None above station. REGULATION. Practically none. UTILIZATION. Irrigation of sugar cane. ACCURACY. Gage read twice daily. Discharge determined from well-defined rating
curve and reliable gage-height record. Records good for all stages.
Discharge measurements of South Side Waikapu ditch near Waikapu, Maui, during theyear ending June SO, 1917.
Date.
July 24 Sept. 16 Oct. 14 Jan. 20 Mar. 24 May 26 June 27
Made by
H. A.R.Austin....................................................do...............................................................do...............................................................do...............................................................do...............................................................do..........................................................C.T. Bailey.. ..................................................
Gage height (feet).
0.51 .43 .36 .39 .09 .46 .40
Discharge.
Second- feet.
7.2 5.8 5.27 5.46 1.46 4.58 6.26
Million gallons
per day.
4.7 3.8 3.4 3.5 .95
3.0 4.0

ISLAND OP MAUI. 143
Daily discharge, in million gallons, of South Side Waikapu ditch near Waikopu, Maui, for the year ending June 30, 1917.
Date.
1..............2..............3..............4..............5..............6............ .7..............8..............9..............
10..............11..........12..........12...........14.............15..............
16..............17..........18...........19............. 20........
21.........22..........23..........24...........25.............26............27..............28..............29.............. 30..............31..............
July.
6 O
5.56.22.57.06 0
5.54.84.85.56.25.54.85.5s i
5.56.26 0
6.2 5.55.55.55.54.84.85.57.07.05.5 4.89 0
Aug.
7.78.49 9
7.0fi 9
5.55.55.5i s5.5A. 8
7.07.7
19 f\
6 0
5.55.54.84.8 4.84.84.24.24.24.2
4.84.24.24.2 4.24.8
Sept.
4.87.76.24.84.24.27.04.84.24.24.24.24.23.64.24.23.63.65.5 4.24.23.65.55.54.84.24.23.63.6A. 9
Oct.
4.24.83.63.63.63.63.63.63 A
3.63 n3.03.63 A
3 A
3.04.23 A
3.0 3.03.03.64.83.63 A
7.05.55.54.2 3.6
Nov.
3.63.63.63.67.7i *4.23.63.63 A
3.03.03.02 e
2 e
7.74.83.6 3.63.03.03.03.00 K
2.59 1
7.05.5 3.6
Dec.
3 A
5.58.47.04.84.2
4.23 /»
9 0
6 9
5.55.56 9
5.55.53.03 /»4.8 4.27.07.77.03.04.86.24.84.84.8 4.24.2
Jan.
4.23.63.63.63.6
3 *3.63 A
3 A
3 A
5.54.2
3.63.63.63.63.64.2 3.03.03.02.52.50 K
3.63.64.84.2 5.5
Feb.
3 A
3 A
2 K
2 C
2 C
0 It
9 ^
2.52 C
2 K
0 R
0 It
2.5C O
3.63.63.04.25.5 4.23.63.03.03.03 A
2.52.52.5
Mar.
2 K
2.53 A
4.23.63.63 n3 n3.03.04.83.63.03.02 C
2 C
2.5
.......
3.03.03.0 3.63.6
Apr.
3 n3 n3 n3 A
3.63 A
3 A
2.52.5<? n
3.63.63.0
3 A
3.03.63 A
3.04.83.63.03.03.03 A
3.03.0
8.4 5.5
May.
3.69 1
4.8A. 9A. 9
3.63.63.6
3.63.63.6
3.03.64.24.2 4.26.24.25.55.54.84.24.24.23.6 3.63.0
June.
3 nO R
3 A
3.03.03 n
3 A
fl 0fl 0A. 0
7.7
3.03 n
3.02.52.52.52.5 2.52.57.03.03.02.52.54.84.83.6 3.0
NOTE. Discharge determined from well-defined rating curve. Ditch dry on days for which discharge is not given.
Monthly discharge of South Side Waikapu ditch near Waikapu, Maui, for the yearending June 80, 1917.
Month.
July.................................
April (29 days).. ....................
Discharge.
Million gallons per day.
Maximum.
9.2 12.07.7 7.0 7.7 9.2 5.5 6.2 4.8 8.4 6.2 7.7
Minimum.
2.5 4.2 3.6 3.0 2.5 3.0 2.5 2.5 2.5 2.5 2.5 2.5
Mean.
5.69 5.71 4.57 3.75 3.83 5.23 3.62 3.10 3.18 3.42 3.98 3.59
Second- feet
(mean).
8.80 8.83 7.07 5.80 5.93 8.09 5.60 4.80 4.92 5.29 6.16 5.55
Total run-off.
Million gallons.
176 177 137 116 115 162 112 87 73 99
124 108
1,490
Acre- feet.
541 543 421 357 353 498 344 266 224 304 379 331
4,560
WEST KOPILITJLA STREAM NEAR KEANAE, MAUI.
LOCATION. 600 feet above Koolau ditch crossing and highway bridge, 4J miles by trail east of Upper Keanae, and 6 miles east of Keanae post office.
RBCOKDS AVAILABLE. January 3,1914, to June 30,1917.GAGE. Friez water-stage recorder.DISCHAKGE MEASUKEMENTS. Made by wading or from footbridge 300 feet below gage.CHANNEL AND CONTKOL. Channel at gage is a large pool at foot of falls; banks rock and
nearly vertical. Control at outlet of pool composed of large boulders; seldom shifts.

144 SUEFACE WATER SUPPLY OF HAWAII, 1916-17.
EXTREMES OF DISCHARGE. Maximum stage recorded during period of record, 9.25 feet at 5.30 a. m. January 18, 1916 (discharge, computed from extension of rating curve, approximately 2,000 million gallons per day, or 3,090 second-feet); mini mum stage recorded, 0.55 foot March 21, 1914 (discharge, 1.8 million gallons per day, or 2.8 second-feet).
Maximum stage recorded during year, 7.0 feet at 5 a. m. March 9 (discharge, approximately 1,400 million gallons per day, or 2,166 second-feet); minimum stage recorded during year, 0.8 foot February 23-26 (discharge, 2.0 million gallons per day, or 3.1 second-feet).
DIVERSIONS. None above station.REGULATION. None.UTILIZATION. Normal flow is diverted into Koolau ditch for irrigation of sugar cane.ACCURACY. Records good for all stages except extreme floods.
Discharge measurements of West Kopiliula Stream near Keanae, Maui, during the yearending June 30, 1917.
Date.
Mar. 20........
Made by
.....do...................................................
.....do...................................................R. C. Rice.............. . . ............................H. A. R. Austin.........................................
Gage height (feet).
1.59 1.22 4.72 1.14 1.41
Discharge.
Second- feet.
26 11
780 7.8
17.7
Million gallons
per day.
17 7.2
504 5.0
11
Daily discharge, in million gallons, of West Kopiliula Stream near Keanae, Maui, for theyear ending June 30, 1917.
Day.
1. .............2..............
4..............5..............
6..............7..............8..............9..............10..............
11..............12..............13..............14..............15..............
16..............17..............18..............19..............20..............
21..............22..............23..............24..............25..............
26..............27..............28..............29..............30..............31..............
July.
1711121011
8.08.08.08.08.0
149.0161720
3143181410
8.08.07.05.05.0
7.010109.01680
Aug.
4033351611
1411101011
2027353318
1112142225
2520171711
9.010118.07.016
Sept.
1822119.014
1438221412
9.08.08.07.07.0
6.06.07.0
239 A
8.0171719
8.0
109.07.06.07.0
Oct.
22Q 0
5 A4.44.4
4.43.84.44.43.3
3 0
8.03.83 0
3.8
3.88 A5.05.05.0
3 0
3 0
3 0
3 0
4.4
97OQ
161700
17
Nov.
25755333174
7522171211
109.08.08.020
Qfi
8517118 A
0 A
7.07.0107.0
1493Qi
2557
Dec.
2735532514
119.09.038250
4622223331
401021168057
2104AA
4904099
17OA
9Q1 fi
1619
Jan.
1212165029
3833161211
10109.08.07.0
6.05.04.44.4
3.83.83.86.0
709 06.05.05.03.8
Feb.
3.83.83.33.32.8
2.82.82.82.82.8
2.82.82.8102.8
2.8
2.42.82.8
3 0
2.42.02 A2 A
2.03 0
93
Mar.
4.43.3112910
5.04.4238580
2517141222
7.05.0
312919
7.05.05.05.012
12n n5.09 A108.0
Apr.
5.04.44.45.0
11
5.05.04.43.85.0
145.0
108.0
7.00 A
6.05.07.0
6.04.45.03 0
3 0
3.83 016
21040
May.
119.07.05.04.4
4.43.83.83.83.8
3.85.03.89.09.0
1243
801710
109 A100 A
5.0
4.44.44.4
, 3.833
3.3
June.
3.3146.06.010
9.05.07.05.04.4
7.03.83.33.33.3
2.82 0
3.32.82 0
2 A
4.42.82 0
2.4
2.44.45.03 O
2.8
NOTE. Discharge determined from well-defined rating curve. Discharge July 13-14, 22-28, Aug. 2-5, 29-31, Sept. 9-12, Dec. 22-23, 25-26, Jan. 25-26, and Mar. 16 determined by comparison with records of East Wailuaiki stream.

ISLAND OF MATJI. 145
Monthly discharge of West Kopiliula Stream near Keanae, Maui, for year ending June30, 1917.
Month.
July.................................
October. ............................
April................................M&y.... ............................
Discharge.
Million gallons per day.
Maximum.
80 40 38 29
174 490
70 23 85
210 80 14
490
Minimum.
5.0 7.0 6.0 3.3 7.0 9.0 3.8 2.0 3.3 3.8 3.3 2.4
2.0
Mean.
14.8 18.0 12.2 8.47
31.9 74.0 13.5 3.78
16.5 14.1 10.1 4.59
18.7
Second- feet
(mean).
22.9 27.8 18.9 13.1 49.4
114 20.9 5.85
25.5 21.8 15.6 7.10
28.9
Total run-off.
Million gallons.
458 559 365 263 958
2,294 418 10ft 512 424 314 138
6,810
Acre- feet.
1,410 1,710 1,120
806 2,940 7,040 1,280
325 1,570 1,300
961 423
20,900
EAST WAILTJAIKI STREAM NEAR KEANAE, MATH.
LOCATION. 1,000 feet above Koolau ditch, crossing and trail, 3| miles east of UpperKeanae, and about 6J miles east of Keanae post office.
RECORDS AVAILABLE. December 21, 1913, to June 30, 1917. GAGE. Stevens water-stage recorder, installed April 17, 1914, to replace original
Friez recorder. DISCHARGE* MEASUREMENTS. Made by wading or from footbridge 800 feet below
CHANNEL AND CONTROL. Channel at gage is a large pool at foot of falls; banks are nearly vertical walls of rock. Control composed of large boulders and rock ledge; fairly permanent.
EXTREMES OP DISCHARGE. Maximum stage recorded during period of record, 8.35 feet at 8 a. m. January 18, 1916 (discharge, computed from extension of rating curve, approximately 1,900 million gallons per day, or 2,940 second-feet); mini mum stage recorded, 0.60 foot March 5-8, 1914, and August 14 and 15, 1195 (dis charge, 2.5 million gallons per day or 3.9 second-feet).
Maximum stage recorded during year, 6.2 feet at 7 a. m. December 23 (dis charge, approximately 1,300 million gallons per day, or 2,010 second-feet); mini mum stage recorded, 0.75 foot, February 18 and 24-27 (discharge, 3.3 million gallons per day, or 5.1 second-feet).
DIVERSIONS. None above station.REGULATION. None.UTILIZATION. Normal flow is diverted into Koolau ditch for irrigation of sugar cane.ACCURACY. Determinations based on continuous record of gage height and rating
curves well denned for low and medium stages; good for all except flood stages, for which they are fair.
40532° 18 WSP 465 10

146 SURFACE WATER SUPPLY OF HAWAII, 1916-17.
Discharge measurements of East Wailuaiki Stream near Keanae, Maui, during the yearending June 30, 1917.
[Made by H. A. R. Austin]
Date.
Sept. 14.. ...........
Gage height (feet).
1.06 4.45
Discharge.
Second- feet.
15 957
Million gallons
per day.
9.8 618
. Date.
Mar. 20............Apr. 18............
Gage
(feet).
1.12 1.05
Discharge.
Second- feet.
14.9 12.7
Million gallons
per day.
9.68.2
Daily discharge, in million gallons, of East Wailuaiki Stream near Keanae, Maui, for theyear ending June 30, 1917.
Date.
1..............2..............3..............4..............5..............
6..............7..............8... ...........9..............10..............
11..............
13..............14..............15..............
16..............17..............48..............19..............20..............
21..............22..............23..............24..............25..............
26..............27..............
29..............3011
July.
1917171415
1212119.411
1514192217
2451221714
11119.4&2&2
9.414141119QO
Aug.
4448522218
1412121112
2030363622
1616162227
2422221812
121211111122
Sept.
2027141218
1844242018
1412119.69.6
9.69.69.6
3316
1118222218
11119.68.28.2
Oct.
18128.28.27.2
7.27.27.27.26.1
6.1208.27.27.2
7.2129.68.28.2
7.27.28.27.27.2
364814112799
Nov.
20484827155
8822181412
11119.68.216
9595181211
9.69.68.2119.6
1824332248
Dec.
3040623016
12119.644
296
4822203333
361021028152
2103664187327
222230191514
Jan.
1414155630
3333171412
12119.49.48.2
7.07.07.06.06.0
6.06.0 6.06.09.4
8612&27.07.06.0
Feb.
6.05.05.05.05.0
4.44.43.83.84.4
3.83.83.89.44.4
3.83.83.33.84.4
5.04.43.83.33.3
3.33.3
36
Mar.
8.24.45.03012
7.05.0
148636
1515141222
126.0303012
7.05.05.05.011
126.05.09.49.47.0
Apr.
5.04.44.46.08.2
5.04.44.44.43.8
146.05.0&28.2
7.08.28.27.08.2
7.06.06.05.05.0
5.04.415
25047
May.
149.49.47.06.0
5.05.05.05.05.0
5.07.0
' 5.09.411
1140931511
9.41112118.2
6.06.05.05.05.04.4
June.
4.4157.07.09.4
127.08.27.06.0
116.05.05.04.4
4.43.85.04.43.8
3.87.04.44.43.8
3.88.29.46.05.0
NOTE. Discharge determined from rating curves applicable as follows: July 1-31 and Dec. 23, 1916, to June 30, 1917, well defined below 20 million gallons per day; Aug. 1 to Dec. 23, 1916, well defined. Dis charge Mar. 12-20 determined by comparison with records of flow of West Kopiliula Stream.

ISLAND OF MAUI. 147
Monthly discharge of East Wailuaiki Stream near Keanae, Maui, for the year ending June30, 1917.
'Month.
July................................
October. ............................
December. ..........................
February ...........................
May.. ..............................
The year. .....................
Discharge.
Million gallons per day.
Maximum.
93 52 44 48
155 418
86 36 86
250 93 15
418
Minimum.
8.2 11 8.2 6.1 8.2 9.6 6.0 3.3 4.4 3.8 4.4 3.8
3.3
Mean.
18.1 21.4 16.3 12.2 31.1 74.1 15.5 5.48
14.8 16.0 11.7 6.39
20.4
Second- feet
(mean).
28.0 33.1 25.2 18.948.1
115 24.0 8.48
21.8 24.8 18.1 9.89
31.6
Total run-off.
Million gallons.
561 663 488 377 93~2
2,300 481 154 457 480 361 192
7,450
Acre- feet.
1,720 2,040 1,500 1,160 2,860 7,050 1,470
471 1,410 1,470 1,110
588
22,800
WEST WAILUAIKI STREAM NEAR KEANAE, MAUL
LOCATION. 500 feet above Koolau ditch crossing and trail bridge, 3 miles east of Upper Keanae, and 5J miles east of Keanae post office.
RECORDS AVAILABLE. January 1, 1914, to June 30, 1917.GAGE. Stevens water-stage recorder.DISCHARGE MEASUREMENTS. Made by wading or from footbridge 100 feet below gage.CHANNEL AND CONTROL. Channel at gage is a large deep pool at foot of low waterfall;
banks are nearly vertical walls of rock to above high water. Control at outlet of pool composed of rock ledge and large boulders; probably permanent.
EXTREMES OF DISCHARGE. Flood of January 18, 1916, carried away gage shelter and must have reached a stage of about 13 feet (discharge, possibly 4,000 million gallons per day, or 6,190 second-feet); minimum stage recorded, 0.8 foot March 7-12, 1914 (discharge, 1.6 million gallons per day, or 2.5 second-feet).
Maximum stage recorded during year, 7.9 feet at 3 a. m. March 9 (discharge, approximately 1,500 million gallons per day, or 2,320 second-feet); minimum stage recorded, 0.9 foot February 11-13, 17 and 18, 24-26 (discharge, 2.5 million gallons per day, or 3.7 second-feet).
DIVERSIONS. None above station.REGULATION . None.UTILIZATION. Normal flow is diverted into KJoolau ditch for irrigation of sugar cane.ACCURACY. Determinations based on well-defined rating curves and continuous
gage-height record. Records good for allj stages.!
Discharge measurements of West Wailuaiki Stream near Keanae, Maui, during the yearending June 3(\, 1917.
Date.
Aug. 15....... Oct. 19........
Jan. 17........
Made by
H. A. R. Austin. ...................... t . ................ .....do.... .................. .............. ....................do....................................................
Gage height (feet).
1.81 1.31 6.30 1.15
Discharge.
Second- feet.
32 11
1,040 9.3
Million gallons
per day.
21 7.1
673 6.0

148 SUEFACE WATER SUPPLY OF HAWAII, 1916-17.
Daily discharge, in million gallons, of West Wailuaiki Stream, near Keanae, Maui, for the year ending June 30, 1917.
Date.
i!. ............2..............3..............4..............5..............
6..............7..............8..............9..............
10..............
11..............12..............13..............14..............15..............
16..............17..............18..............19..............20..............
21..............22..............23..............24..............25..............
26..............27..............28..............9Q
30..............31..............
July.
2115161215
Q X9 89 89 89 8
1811202125
4158231812
8.57.56.55.85.8
7.512141129
129
Aug.
5544462015
1815121215
2536464421
1414152734
2723232012
119.89.89 0
7.521
Sept.
2129
1220
62292521
16129.88.57.5
6.55.86.5
4116
1118252720
119.88.57 P»7.5'
Oct.
16117 t\
6.55.8
5.05.05.85.85.0
5.09.85.85.05.8
5.89.87.57.55.8
5.05.06.55.05.0
494414
2523
Nov.
oo68fiO
36228
8425181211
9 0
8.56.5fi i
27
1OO
80is
8.5
7.56.55.88.57.5
182738OA
76
Dec.
3646723418
14111152
392
622521413«
551231129768
3445457285836
252334201512
Jan.
12111 16531
44361814Itt
9.88.57.56.55.8
5.85.85.04.24.2
4.24.23.53.57.5
92148.55.85.84.2
Feb.
4.23.53.53.53.0
i n3.03.03.03.0
2.52.52.5
113.5
3.02.52.53.04.2
8.53.53.02.52.5
2.53.5
52
Mar.
8.55.0
213415
7.55.0
218436
169.87.55.8
11
6.56.5
362714
7.55.86.55.8
11
125.85.8
12128.5
Apr.
5.85.05.08.5
11
6.57.55.85.08.5
346.57.57.57.5
6.57.57.55.88.5
6.55.85.85.04.2
4.24.2
25sin
62
May.
18119.86.5
. 5.8
5.04.24.24.23.5
3.56.54.2
1412
1558971811
121214129.8
6.56.56.55.85.04.2
June.
4.2219.8
1118
158.59.87.56.5
126.55.05.04.2
3.53.55.03.53.5
3.06.53.53.03.0
3.08.58.55.03.5
NOTE. Discharge determined from well defined rating curves applicable as follows: July 1 to Dec. 23, 1916, and Dec. 24,1916, to June 30,1917. Discharge July 6-20, Aug. 1-14 Oct. 11-18, Nov. 29 to Dec. 10, Dec. 23 and 24, and Apr. 14-17 determined by comparison with records of flow of West Kopiliula Stream.
Monthly discharge of West Wailuaiki Stream near Keanae, Maui, for year ending June 301917.
Month.
July................................
May................................
Discharge.
Million gallons per day.
Maximum.
129 56 62 49
228 728 92 52 84
310 97 21
728
Minimum.
5.8 7.5 5.8 5.0 5.8
11 3.5 2.5 5.0 4.2 3.5 3.0
2.5
Mean.
19.7 22.6 17.5 10.9 36.5
102 15.3 5.28
15.2 20.0 13.1 7.02
24.0
Second- feet
(mean).
30.5 35.0 27.1 16.9 56.5
158 23.7 8.17
23.5 30.9 20.3 10.9
37.1
Total run-off.
Million gallons.
612702 526 337
1,090 3,170
473 148 470 600 406 210
8,750
Acre- feet.
1,870 2,150 1,610 1,040 3,360 9,700 1,460
454 1,450 1,840 1,250
646
26,800
EAST WAILTTANTTI STREAM NEAR KEANAE, MAUI.
LOCATION. 1,000 feet above Koolau ditch crossing, 2J miles east of Upper Keanaeand 5 miles east of Keanae post office.
RECORDS AVAILABLE. January 1, 1914, to June 30, 1917. GAGE. Stevens water-stage recorder. DISCHARGE MEASUREMENTS. Made by wading or from footbridge at gage.

ISLAND OF MAUI. 149
CHANNEL AND CONTROL. Channel at gage a small deep pool at foot of rapids; right bank vertical wall of rock; left bank steep and high. Control at outlet is ledge of rock; probably permanent.
EXTREMES OP DISCHARGE. Maximum stage recorded, 5.1 feet at 5.45 a. m. Decem ber 23, 1916 (discharge, computed from extension of rating curve, approximately 430 million gallons per day or 665 second-feet); minimum stage recorded, 0.75 foot April 7, 1915 (discharge, 0.25 million gallons per day, or 0.4 second-foot).
Minimum stage recorded during year, 0.9 foot February 12-19 and May 6-11 (discharge, 0.7 million gallons per day, or 1.1 second feet).
DIVERSIONS. None above station.REGULATION . None.UTILIZATION. Normal flow is diverted into Koolau ditch for irrigation of sugar cane.ACCURACY. Determinations based on a well-defined rating curve and a continuous
record of gage height. Records good for all stages.
Discharge measurements of East Wailuanui Stream near Keanae, Maui, during the yearending June 30, 1917.
[Made by H. A. R. Austin.]
Date.
Sept. 14... .........
Gage height (feet).
1.15 1.95
Discharge.
Second- feet.
3.0 56
Million gallons per day.
1.95 36
Date.
Jan.17.... .........
Gage height.
1.03
Discharge.
Second- feet.
2.4
Million gallons
per day.
1.6
Daily discharge, in million gallons, of East Wailuanui Stream near Keanae, Maui, for theyear ending June SO,'1917.
Date.
1... ...........2... ..........3..............
5..............
6..............7..............8..............9..............
10..............
11..............12..............13..............14..............15..............
16...............17..............18..............19..............20..............
21..............22..............23..............24..............25..............
26..............27..............28..............29..............Ofl
01
July.
5.24.44.4q 73.7
3.02.52.52.02.5
6.03.09.03.75.2
19127.05.23.7
3.03 n2.52.52.0
3.06.06.04.47.0
97
Aug.
1217157.07.0
5.24.43.73.73.7
7.09.0
14217.0
5.25.27.08.09.0
9.0107.05.23.7
3.73 7q 7
3.03 (\
8 (\
Sept.
8.0105.23.76.0
7.0128.06.06.0
4.43.72.52.52.5
2.52.02.09.03.0
2.54.46.04.43.7
1.61.31.01.01.0
Oct.
4.42.51.61.31.3
1.31.31.01.31.3
1.32.51.31.31.3
1.63 73.02.02.0
1.61.62.51.61.6
12144.44.4Q f\
e o
Nov.
3.7109.05.2
27
156.04.43.03.0
2.52.01.61.63.7
10143.73.02.0
2.01.61.63.02.0
4.48.0
106.0
12
Dec.
7.01236104.4
3 nq 7
3.01063
12109.0
129.0
9.017252312
293860197.0
5.26.0s n5.24.4q 7
Jan.
3.03.03.7
127.0
6.07.03.73.02.5
2.52.02.01.61.6
1.61.31.61.61.6
1.61.31.31.33.0
233.72.52.01.61.6
Feb.
1.61.31.31.31.3
1.01.01.01.01.0
1.0.7.7.7.7
.7
.7
.7
.71.0
1.01.01.01.01.0
1.01.0
17
Mar.
2.01.62.04.42.0
1.61.63.7
154.4
3.03.02.01.64.4
2.51.62.52.01.6
1.61.31.31.33.0
6.02.02.03.03.02.5
Apr.
2.01.61.31.64.4
2.01.61.31.31.3
6.02.01.62.53.0
2.53.03.02.53.0
2.02.02.01.61.3
1.31.33.0
5610
May.
3.02.01.61.01.0
.7
.7
.7
.7
.7
.71.61.02.01.6
2.59.0
234.43.0
3.74.45.23.73.0
2.0, 2.0
2.01.61.61.6
June.
1.65.22.02.03.0
4.42.53.73.02.0
6.02.52.01.61.3
1.31.31.61.31.3
1.03.01.61.31.3
1.33.03.72.01.6
NOTE. Discharge determined from a well-defined rating curve.

150 SURFACE WATER SUPPLY OP HAWAII, 1916-17.
Monthly discharge of East Wailuanui Stream near Keanae, Maui, for the year endingJune 30, 1917.
Month.
July................................
May................................
Discharge.
Million gallons per day.
Maximum.
27 21 12 14 27 60 23 17 15 56 23 6.0
60
Minimum.
2.0 3.0 1.0 1.0 1.6 3.0 1.-3 .7
1.3 1.3 .7
1.0
.7
Mean.
5.62 7.45 4.43 3.04 6.03
15.3 3.59 1.55 2.89 4.27 2.96 2.31
4.99
Second- feet
(mean).
8.70 11.5 6.85 4.70 9.33
23.7 5.55 2.40 4.47 6.61 4.58 3.57
7.72
Total run-off.
Million gallons.
174 231 133
94 181 475 111
43 90
128 92 69
1,820
Acre- feet,
535 709 408 289 555
1,460 342 133 275 393 282 213
5,590
WEST WAILTTANTTI STREAM NEAR KEANAE, HAITI.
LOCATION. Fifty feet above Koolau ditch crossing and intake, 2 miles east of Upper Keanae and 4J miles east of Keanae post office.
RECORDS AVAILABLE. December 19, 1913, to June 30, 1917.GAGE. Stevens water-stage recorder.DISCHARGE MEASUREMENTS. Made by wading or from footbridge at gage.CHANNEL AND CONTROL. One channel at all stages; straight for 100 feet above gage;
waterfall 50 feet below gage; banks steep and high. Control low concrete dam 30 feet long.
EXTREMES OF DISCHARGE. Maximum stage recorded during period of record, 7.03 feet at 6.30 a. m., January 18, 1916 (discharge, computed from extension of rating curve, approximately 760 million gallons per day, or 1,180 second-feet); mini mum discharge recorded, 0.7 million gallons per day, or 1.1 second-feet, Feb ruary, 1914, July and August, 1915, October, 1916, April and May, 1917.
DIVERSIONS. None above station.REGULATION. None.UTILIZATION. Irrigation of sugar cane, rice, and taro.ACCURACY. Record July 1 to April 29 based on a well-defined rating curve and a
continuous gage-height record; good for all stages; record April 30 to May 22, fair.
Discharge measurements of West Wailuanui Stream near Keanae, Maui, during the yearending June 30, 1917.
[Made by H. A. R. Austin.]
Date.
July 21. .._.__,..___ftprd- 1 A.
Jan. 17.............
Gage height (feet).
1.13 1.12 1.08
Discharge.
Second- feet.
6.8 5.85 2.75
Million gallons
per day.
4.4 3.8 1.8
Date.
Feb. 14............Mar. 21 ............May 21.... .........
Gage height (feet).
1.36 1.06 1.00
Discharge.
Second- feet.
24 3.8
13.3
Million gallons-
per day."
15 2.48.6

ISLAND OF MAUI. 151
Daily discharge, in million gallons, of West Wailuanui Stream near Keanae, Maui, for the year ending June 30, 1917.
Date.
1. .........2..........3..........4..........5..........6..........7..........8..........9..........
10..........
U. .........12..........13..........14..........15..........16..........17..........18..........1420..........21..........22..........23..........24..........25..........26..........27..........28..........29..........30..........31..........
July.
9.37.07.0484.83.23.23.23.23.24.83.29.34.843
18189.37.048483.23.23 91.81.8483.21.8
1821
Aug.
1225157.07.04.8484848489.3
1215219.3
7.09.39.3
12121215
Q ^
7.03.23.23.23-23.23.2
12
Sept.
12157.03.23.21.81.81.81.81.81.8487.03.23.23.23.23.2
12483.27.09.37.07.0483.23.23.23.2
Oct.
7.0483.23.21.81.81.81.81.81.81.8483.21.8
. 1.8
1.84.83.23.21.81.8.7.7
1.81.8
12123.23.24.84.8
Nov.
48252112
120
45127.048483.23.23.23.2
1245459.34.83.23.21.83.23.27.0
12159.3
1818
Dec.
15213Q127.0484848
2114018129 0
2512
3969453469
186276140oc
15
9.3189.37.07.04.8
Jan.
484.8
15189.3
159.37.04.84.84.83.23.23.21.83.23.23.23.23.23.23.23.23.248
457.07.0484.83.2
Feb.
3.23.23.23.23.23.23.23.23.23.2
3.23.23.27.03.23.21.81.81.83.23.23.23.23.23.23.23.2
29
Mar.
4.83.24.89.34.83.23.27.0
259.37.07.04.83.29.34.83.24.84.83.21.81.81.83.27.03.21.83.23.23.23.2
Apr.
q o
3 0
q 9
7.0q 9
3.23.23 O
3 O
4 0
7.01.81.83.23.23.23.21.81.83.21.81.81.81.8.7.7.7
4.8120
51
May.
19
4.83.21.81.81.81.81.81.81.8.7
1.8.7
3.23.23.2
21579.34.8484.8
^RoTE. Discharge determined from rating curves, applicable as follows: July 1 to Apr. 29, well defined; Apr. 30 to May 22, fairly well denned. Discharge Aug. 19 to Sept. 13, and Feb. 14 to Mar. 19 determined by comparison with records of flow of East Wailuanui Stream. Control washed out Apr. 29. No record May 23 to June 30.
Monthly discharge of West Wailuanui Stream near Keanae, Maui, for year ending JuneSO, 1917.
Month.
July................................
May 1-22.. ..........................
Discharge.
Million gallons per day.
Maximum.
21 25 15 12
120 276 45 29 25
120 57
Minimum.
1.8 3.21.8 .7
1.8 48 1.8 1.8 1.8 .7 .7
Mean.
6.44 9.05 490 3.35
16.0 41.9 6.92 4.11 5.16 8.42 6.69
Second- feet
(mean).
9.96 14.0 7.58 5.18
24.8 64.8 10.7 6.36 7.98
13.0 10.4
' Total run-off.
Million gallons.
200 281 147 104 479
1.300 214 115 160 253 147
3,400
Acre- feet.
613 861 451 319
1,470 3,990
658 353 491 775
,452
10,400
HONOHANTT STREAM NEAR KEANAE, HAITI.
LOCATION .- Five hundred feet above Spreckels ditch intake and trail bridge, about6 miles south of Keanae post office.
RECORDS AVAILABLE. November 15, 1913, to June 30, 1917. GAGE. Stevens water-stage recorder.DISCHARGE MEASUREMENTS. Made by wading or from footbridge at gage. CHANNEL AND CONTROL. One Channel at all stages; straight for 200 feet above
and below gage; stream bed filled with large boulders and very rough; rightbank vertical wall of rock; left bank steep and high. Control composed oflarge boulders; fairly permanent.

152 SURFACE WATER SUPPLY OP HAW AH, 1916-17.
EXTREMES OP DISCHARGE. Maximum stage recorded during period of record, 9.9 feet at 9 p. m., May 1,1916 (discharge, computed from extension of rating curve, approximately 1,200 million gallons per day, or 1,860 second-feet); minimum stage recorded, 2.20 feet April 7 and 8, 1915 (discharge, 0.25 million gallons per day, or 0.4 second-feet),
Maximum stage recorded during year, 8.85 feet at 5.30 a. m. December 23 (discharge, approximately 1,000 million gallons per day, or 1,550 second-feet); minimum stage recorded, 2.05 feet February 10-13 (discharge, 0.9 million gal lons per day, or 1.4 second-feet).
DIVERSIONS. None above station.RE GULATION . N one.UTILIZATION. Natural flow is diverted by Spreckels ditch for irrigation of sugar cane.ACCURACY. Records below 10 million gallons per day based on a well-defined rating
curve and a continuous gage-height record; good; records for higher stages fair.
Discharge measurements of Honomanu Stream near Keanae, Maui, during the year endingJune 30, 1917.
[Made by H. A. R. Austin.l
Date.
July 20.... .........Sept. 13............
Gage height (feet).
2.65 2.60 2.38 5.01
Discharge.
Second- feet.
10.4 9.35 4.38
300
Million gallons
per day.
6.7 6.0 2.8
194
Date.
Feb. 13. ............Mar. 19.............May 20. .............
Gage height (feet).
2.05 2.30 2.50
Discharge.
Second- feet.
1.43.8 6.3
Million gallons
per day.
0.9 2.5 4.1
Daily discharge, in million gallons, of Honomanu Stream near Keanae, Maui, for the yearending June 30, 1917.
Date.
1.. ............2..............3..............4..............5.. .......... ...6..............7..............8..............9..............
10..............11..............12..............13..............14..............15..............16..............17..............18.........:....19..............20..............21..............22..............23..............24..............25..............26..............27..............28..............29..............30..............31..............
July.
118.7
117.99.77.97.16.45.77.1
189.7
1314152330117.97.16.45.05.04.34.34.37.97.97.1
1695
Aug.
353841139.78.77.16.46.46.49.7
212125137.97 A
7.9151613
0 (7
11
8.76.46.46.46 47.15.7
13
Sept.
11218.77.1
12114113118.77.97.16.4e 7
9.75.03 0
4 0
00
7 Q
R 7Q 7
10
10
9 7
7.17 96.45.05.0
Oct.
8.79.77.15.75.75.05.05.04.34.33.85.06.4R ft
5.75.79 7
7.15 73
0'
2.92.53.84 0
3 0
23165 7
4 0
13
Nov.
8.7.303514
13473138.75.75.05.74.33.83.35.7
95107
10
Pi 7
4.33.8S O
2 95 7e 7
1315251823
Dec.
133041217.96.45.75.7
23262
35 '11132115206835119ft
1QC
345395
5514
7 Q
9 7
167 QPi ft
3.8
Jan.
3.32.93.8
441825187.15.04.35.76.43.80 0
2.92.52.52.52 C
2.19 12 11.71.72.5
01
3 0
2 12.11.71.7
Feb.
1.41.11.11.11.11.11.11.11.1.9.9.9.9
8.72.51.7
1.12 0
5.77 Q
2 1
1.71.41.41.42.1
qe
Mar.
4.32.5
15258.73.82.92.95.02.92.52.13.32 95.02.99 1
2.52 C
2.12 1
1.71.72 1
2 1
5.02 e
2 e
7 A
5.73:8
Apr.
6.45.72.57.19.74.34.33.32.92.98.73.82.9434.33.85 7
3 0
9 Q
5.03.84 0
3 0
2 Q
2 e
2.52 1
9 7
271SQ
May.
259.79.75.03.33.83.32.52.52.12.55.74.3
126.4
1135386.44.36.47.1
12117 A
3 0
3 0
5.03 0
2 Q
2 e
June.
2.5307.98.7
189.7a?
117.15.08.74.30 Q
2.52.52 51.73 0
2 e
1.71.77.12 A
9 1
1-71.7Q fj
7.13 0
2 e
NOTE. Discharge determined from a rating curve well defined below 10 million gallons per day; fairly well defined for higher stages.

ISLAND OF MAUL 153
Monthly discharge of Honomanu Stream near Keanae, Maui,for year ending June SO,1917.
Month.
July................................
April...............................May................................
Discharge.
Million gallons per day. .
Maximum.
95 41 41 23
134 395
44 35 25
271 38 30
395
Minimum.
4.3 5.7 3.8 2.5 2.9 3.8 1.7 .9
1.7 2.1 2.1 1.7
.9
Mean.
12.7 13.2 10.5 6.99
23.0 56.8 6.71 3.24 4.45
16.2 8.31 6.05
14.1
Second- feet
(mean).
19.6 20.4 16.2 10.8
35.6 87.9 10.4 5.01 6.88
25.1 12.9 9.36
21.8
Total run-off.
Million gallons.
394409 315 217 690
1,760 208
91 138 485 258 181
5,150
Acre- feet.
1.210 1,260
967 665
2,120 5,400
638 278 423
1,490 791 557
15,800
HAIPTTAENA STREAM HEAR HTTELO, MATH.
LOCATION. 200 feet above inflow of Spreckels ditch, about 7 miles by trail east of Huelo.
RECORDS AVAILABLE. October 19, 1913, to June 30, 1917; also records of combined flow of stream and Spreckels ditch at staff-gage station 600 feet below present site December 18, 1910, to September 30, 1913.
GAGE. Stevens water-stage recorder .installed June 16, 1914, to repllce original Friez recorder.
DISCHARGE MEASUREMENTS. Made by wading of from footbridge.CHANNEL AND CONTROL. rOne channel at all stages; straight for 200 feet above and
below gage; right bank high with steep slope; left bank nearly vertical. Control composed of large boulders; fairly permanent.
EXTREMES OP DISCHARGE. Maximum stage recorded during period of record, 5.1 feet at 4.30 a. m. March 1, 1916 (discharge, computed from extension of rating curve, 350 million gallons per day, or 542 second-feet); minimum stage recorded, 0.2 foot March 8, 1914 (discharge 1.0 million gallons per day, or 1.5 second-feet).
Maximum stage recorded during year, 4.85 feet at 6 a. m. December 23 (dis charge, approximately 320 million gallons per day, or 495 second-feet); minimum stage recorded, 0.35 foot February 13 (discharge, 1.6 million gallons per day, or 2.5 second-feet).
DIVERSIONS. None above station.REGULATION. None.UTILIZATION. Ordinary flow diverted by ditches of East Maui Irrigation Co. for irri
gation of sugar cane.ACCURACY. Rating curve well defined. Records good for all stages.
Discharge measurements of Haipuaena Stream near Huelo, Maui, during the year endingJune 30, 1917.
[Made by H. A. R. Austin.]
Date.
Aug. 14...................................................................Sept. 13..................................................................
Gage height (feet).
1.76 .76
Discharge.
Second- feet.
58 7.55
Million gallons
per day.
37 4.9

154 SURFACE WATER SUPPLY OF HAWAII, 1916-17.
Daily discharge, in million gallons, of Haipuaena Stream near Huelo, Maui,for the yearending June SO, 1917.
Date.
1. .............2..............3..............4..............5..............
6..............7..............8..............9..............10..............
11..............12..............13..............14..............15..............
16..............17..............18..............19..............20..............
21..............22..............23..............24..............25..............
26..............27..............28..............29... ..........730..............31...'...........
July.
117.68.66.8-7.6
5.95.24.54.55.2
157.6
111212
203213116.8
5.95 9
5.24.54.0
4.59.58.66.8
1356
Aug.
303035139.5
7.66.85.95.25.2
111899
2813
8.68.69.5
1618
15119.58.65.9
5.95.95.95.95.2
12
Sept.
12268.67.6
12
9 C '
18161111
7.66.8<! 0
5.27.6
5.94.55 9
309.5
6.811131512
6.86.8<! 0
5.24.5
Oct.
9.59 C
5.24.54.5
4.04.04.04.03 A
3.4' 4.0
4.03.03.4
3.48.66.85.24.0
3.43 A
5.24.53.4
24187.67.6
2213
Nov.
9.524281366
4310
117.66.8
6.85 0
5.2A K
7.6
40
52116.85.2
4 <;4.54.06.85 Q
19
15241822
Dec.
15284020
9 C
7.66.86.8
2493
99
11121815
1840°.n3524
811181323513
9 C
11158.66!8<! 0
Jan.
5.25.25.9-
2813
16157.6<! 0
5.2
5.25.94.04.03.4
3.43.03 fk
3.03.0
2.52 C
2.52.54.0
184.53 A
3.43.03.0
Feb.
2.52.52.52.52.2
2.22.21.81.81.8
1.81.81.61 0
2.5
2.22.21.83.04.5
5.9°. n2.22.29 9
9 9
2.239
Mar.
5.94.08.6
187.6
5.24.55.27.65.2
4.54.04.04.06.8
5.24.03.43.03.0
2.52.52.53.03.4
5.23.43.46.85.95.2
Apr.
5.25.23.45.99.5
4 <;4.54.04.03 A
9.54.54.0A K
5.2
4.55.94.54.05,2
4.55 9
4.03.03 ft
3 fk
2.5<! 0
10138
May.
15' 6.8
5.24.53.4
3 n3.02.52 C
2.5
3.04.54.05.95.2
5.222286.85.9
6.86.8
128.66.8
4.54.5A K
4.03.43.4
June.
3.4185.95.98.6
8.65.99.57.65.9
115.9A 5
4.54.0
3.43.44.53.43.0
3.06.84.03.43.0
3.08.67.65.24.0
NOTE. Discharge determined from a well-defined rating curve.
Monthly discharge of Haipuaena Stream near Huelo, Maui,for year ending June 30,1917.
Month.
July.................................
April................................May.................................June................................
Discharge.
Million gallons per day.
Maximum.
56 '35 30 24 66
132 28 32 18
101 28 18
132
Minimum.
4.0 5.2 4.5 3.0 4.0 5.9 2.5 1.6 2.5 2.5 2.5 3.0
1.6
Mean.
10.7 12.6 10.2 6.79
16.4 29.4 6.26 3.61 5.08 9.05 6.59 5.85
10.3
Second- feet
(mean).
16.6 19.5 15.8 10.5 25.4"
45.5 9.69 5.58 7.86
14.0 10.2 9.05
15.9
Total run-off.
Million gallons.
330 392 307 210 493 912 194 101 158 272 204 176
3,750
Acre- feet.
1,020 1,200
939 646
1,510 2,800
596 310 483 833 627 539
11,500

ISLAND OF MATJI. 155
PUOHAKAMOA STREAM NEAR HUELO, HAITI.
LOCATION. 150 feet above Spreckels ditch inflow and trail crossing, about 7 miles east of Huelo.
RECORDS AVAILABLE. June 13, 1913, to June 30, 1917 (new station); December 18, 1910, to June 18, 1913 (old station).
GAGE. Barrett & Lawrence water-stage recorder installed June 13, 1913. Old staff gage station was 150 feet downstream at trail bridge below inflow from Spreckels ditch.
DISCHARGE MEASUREMENTS. Made by wading or from footbridge 200 feet below gage. Inflow of Spreckels ditch must be deducted from measurements made at footbridge.
CHANNEL AND CONTROL. One channel at all stages; curves 100 feet above and below gage; banks steep and high; stream bed very rough and steep. Control com posed of large boulders; seldom shifts.
EXTREMES OP DISCHARGE. Maximum stage recorded during period of record, 7.55 feet at 10 a. m. May 1, 1916 (discharge, computed from extension of rating curve, approximately 800 million gallons per day, or 1,240 second-feet); minimum stage recorded, 0.9 foot February 23-26, 1917 (discharge, 1.8 million gallons per day, or 2.8 second-feet).
Maximum stage recorded during year, 7.2 feet at 11 a. m. December 23 (dis charge, approximately 750 million gallons per day, or 1,160 second-feet).
DIVERSIONS. Kula pipe line diverts small amount of water above station at eleva tion 4,300 feet.
REGULATION. None.UTILIZATION. Ordinary flow of stream is diverted by East Maui Irrigation Co.'s
ditches for irrigation of sugar cane.ACCURACY. Determinations based on a fairly well defined rating curve and contin
uous gage-height record. Records fair for all stages.
Discharge measurements of Puohdkamoa Stream near Huelo, Maui, during the yearending June SO, 1917.
[Made by H. A. R. Austin.]
Date.
July 20............Oct. 18............Dec. 11............Feb. 13............
Gage height (feet).
2.08 1.87 2.74 .92
Discharge.
Second- feet.
22 19.9 53 3.0
Million gallons
per day.
14 13 34 1.9
Date.
Apr. 17............May 20............
Gage
(feet).
1.01 1.94 1.80
Discharge.
Second- feet.
4.122.3 16.6
Million gallons per day.
2.7 14 11
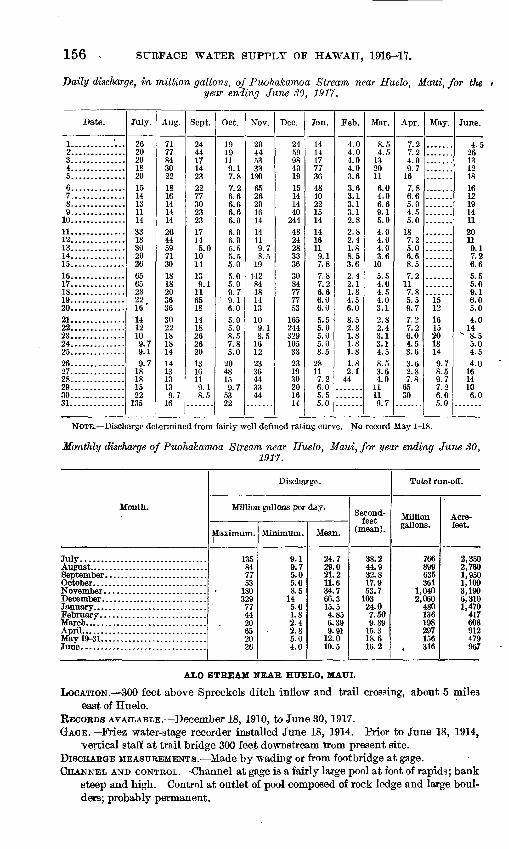
156 SUE.FACE WATER SUPPLY OF HAWAII, 1916-17.
Daily discharge, in million gallons, of PuoJiakamoa Stream near Huelo, Maui, for tJte year ending June 30, 1917.
Date.
1...........'...2..............3..............4..............5..............6..............7........ ......8..............9..............10..............11..............12..............13..............14..............15..............16..............17..............18..............19..............20..............21..............22..............23..............24..............25..............26..............27..............28..............29..............30..............31..............
July.
2620201820151413111433183020266565282216'
1412109.79 1
9.718181522135
Aug.
71778430
1816141414264459713018182036363022181814141313139.716
Sept.
2444171423
773000
OO
17145.01014139 111651814182626201316119 18.5
Oct.
191Q119.17 0
7.26.66.66.66.06.06.05.55.55.05.05.09.7
' 9.16.05.05.08.57.85.02048159.75322
Nov.
2044CO
OO
ISA
652620161414119.78 C
1Q
1428418
13109 18.5161 9
233644OO
Dec.
24en
98401915141440
4824283336308477775316524432910533231930201614
Jan.
141417773648402215141416119 17.87.87.26.66.06.05.55.05.05.08.528117.26.05.55.0
Feb.
4.04.04.04.03.63.63.13.1^ 12.82.82.41.88.5
2.42.11.84.56.08.52.81.81.81.81.82.144
Mar.
8.54.5
1^20116.04.06.69 15.04.04.04.03.6105.54.0A C
4.03.12.8
3.13.1A C
8.53.64.011119.7
Apr.
7.27 9
4.09 7167,86.65.04.55.0187.25.06.68.57.2117.85.59.77.27 96.04.53.63.62.87.86530
May.
151216152018149.78.59.77.26.05.0
June.
4.59ft10
1218161219141120119.17 96.65.55.09 16.05.04.014"8.55.04 t;
4.01614106.0
NOTE. Discharge determined from fairly well defined rating curve. No record May 1-18.
Monthly discharge of Puohakamoa Stream near Huelo, Maui, for year ending June SO,1917.
Month.
July................................
October. ............................
March...
May 19-31.. .........................
Discharge.
Million gallons per day.
Maximum.
13584 77 53
180 329 77 44 20 65 20 26
Minimum.
9.1 9.7 5.0 5.08.5
14 5.0 1.8 2.4 2.8 5.0 4.0
Mean.
24.7 29.0 21.2 11.6 34.7 66.3 15.5 4.85 6.39 9.91
12.0 10.5
Second- feet
(mean).
38.2 44.9 32.8 17.9 53.7
103 24.0 7.50 9.89
15.3 18.6 16.2
Total run-off.
Million gallons.
766 899 635 361
1,040 2,060
480 136 198 297 156
t 316
Acre- feet.
2,350 2,760 1,950 1,100 3,190 6,310 1,470
417 608 912 479 967
ALO STREAM NEAR HUELO, MAUI.
LOCATION. 300 feet above Spreckela ditch inflow and trail crossing, about 5 milea east of Huelo.
RECORDS AVAILABLE. December 18, 1910, to June 30, 1917.GAGE. Friez water-stage recorder installed June 18, 1914. Prior to June 18, 1914,
vertical staff at trail bridge 300 feet downstream ttom present site.DISCHARGE MEASUREMENTS. Made by wading or from footbridge at gage.CHANNEL AND CONTROL. Channel at gage is a fairly large pool at foot of rapids; bank
steep and high. Control at outlet of pool composed of rock ledge and large boul ders; probably permanent.

ISLAND OF MAUL 157
EXTREMES OF DISCHARGE. Maximum stage recorded during period of record, 4.35 feet at 7 p. m. December 9, 1916 (discharge, computed from extension of rating curve, approximately 550 million gallons per day, or 850 second-feet); minimum stage recorded, 1.34 feet (old datum) November 4, 1911 (discharge, 0.06 million gallons per day, or 0.1 second-foot).
Minimum stage recorded during year, 0.45 foot February 7-13, 15-18, and 22- 26 (discharge, 0.8 million gallons per day, or 1.2 second-feet).
DIVERSIONS. None above station.REGULATION. None.UTILIZATION. Ordinary flow upstream diverted by ditches of East Maui Irrigation
Co. for irrigation of sugar cane.ACCURACY. Determinations based on well-defined rating curve and continuous
gage-height record. Records good for all stages except extreme floods.
Discharge measurements of Alo Stream near Huelo, Maui, during the year ending June SO,1917.
[Made by H. A. R. Austin.]
Date.
Dec. 11..................................................................Mar. 22.........................:........................................
Gage height (feet).
0.93.54
Discharge.
Second- feet.
8.3 1.57
Million gallons
per day.
5.4 1.0
Daily discharge, in million gallons, of Alo Stream near Huelo, Maui, for the year endingJune SO, 1917.
Date.
1. ...... .......2..............3..............4..............5..............
6..............7..............8..............9..............10 .............
11..............12..............13..............14..............15..............
16..............17..............18..............19..............20..............
21..............22..............23..............24..............25..............
26..............27..............28..............29..............30..............31..............
July.
5.44.03.32.64.0
2.62.12.11.62.1
6.22.66.23.35.4
12126.25.44.0
3.32.62.12.11.6
2.15.44.73.34.716
Aug.
1114146:25.4
4.04.02.62.62.6
6.28.216308.2
4.75.45.47.08.2
7.05.44.03.32.6
3.32.62.62.1 1.66.2
Sept.
6.27.02.62.12.1
4.09.36.24.05.4
3.33.32.62.12.6
2.11.62.1113.3
2.66.27.07.05.4
3.33.32.62.1 2.1
Oct.
7.04.72.62.12.1
1.61.61.61.61.3
1.31.61.31.31.0
1.66.23.32.1
2.1
1.62.14.72.12.1
12114.05.4 115.4
Nov.
4.77.08.26.2
34
167.05.44.03.3
3.32.62.12.14.7
9.3124.73.32.6
2.12.11.84.72.1
4.78.2128.2
11
Dec.
6.212479.35.4
4.03.32.61634
7.04.76.28.24.7
8.21418169.3
1838429.34.7
3.34.74.73.32.63.3
Jan.
3.32.64.09.37.0
6.25.43.32.62.6
2.12.11.61.61.6
1.31.01.31.31.0
1.01.01.01.04,0
9.32.11.61.3 1.31.3
Feb.
1.31.01.01.01.0
1.0.8.8.8.8
.8
.8
.81.3.8
.8
.8
.81.61.6
1.3.8.8.8.8
.81.69.3
Mar.
1.61.32.13.32.1
1.31.33.3-4.71.6
1.62.61.61.65.4
2.11.62.11.61.3
1.31.31.31.34.0
2.61.61.62.6 2.64.7
Apr.
2.11.61.62.12.6
1.61.61.61.31.3
6.22.11.62.63.3
2.64.02.62.12.6
2.12.12.11.61.6
1.61.65.4
74 11
May.
' 5.43.32.62.12.1
2.11.61.61.31.3
1.62.11.62.11.3
2.16.2164.02.6
4.73.37.04.73.3
2.62.12.11.6 1.61.3
June.
1.34.01.61.61.6
3.31.66.25.42.6
6.22.62.11.61.6
1.31.32.11.31.3
1.02.61.31.01.0
1.02.62.62.6 1.3
NOTE. Discharge determined from rating curve well defined below 50 million gallons per day.

158 SURFACE WATER SUPPLY OF HAWAII, 1916-17.
Monthly discharge of Alo Stream near Huelo, Maui, for year ending June 30, 1917.
Month.
July.................................
December.. . ........................
April................................
Discharge.
Million gallons per day.
Maximum.
16 30 11 12 34 47 9.3 9.3 5.4
74 16 6.2
74
Minimum.
1.6 1.6 1.6 1.0 1.6 2.6 1.0 .8
1.3 1.3 1.3 1.0
.8
Mean.
4.55 6.66 4.15 3.53 6.64
11.9 2.78 1.28 2.23 5.01 3.14 2.25
4.54
Second- feet
(mean).
7.04 10.3 6.42 5.46
10.3 18.4 4.30 1.98 3.45 7.75 4.86 3.48
7.02
Total run-off.
Million gallons.
141 206 124 109 199 370
86 36 69
150 97 68
1,660
Acre- feet.
433 634 382 336 611
1,130 264 110 212 461 299 207
5,080
WAIKAMOI STREAM NEAR HUELO, HAUL
LOCATION. 500 feet above Spreckels ditch, intake and 5 miles by trail east of Huelo post office.
RECORDS AVAILABLE. December 18, 1910, to June 30, 1917.GAGE. Friez water-stage recorder installed October 14, 1913, at new datum, to
replace original staff.DISCHARGE MEASUREMENTS. Made by wading or from footbridge at gage.CHANNEL AND CONTROL. One channel at all stages; straight for 100 feet above and
below gage; banks high and covered with vegetation. Water drops over a fall at control, which is rock ledge and boulders and fairly permanent.
EXTREMES OP DISCHARGE. Maximum stage recorded during period of record, 7.57 feet at 5 a. m. January 18, 1916 (discharge, computed from extension of rating curve, approximately 1,800 million gallons per day, or 2,780 second-feet); mini mum stage recorded, 1.08 feet September 28, 1912 (discharge, 0.3 million gallons per day, or 0.5 second-foot).
Maximum stage recorded during year, 4.95 feet at 4 a. m. December 23 (dis charge, approximately 830 million gallons per day, or 1,280 second-feet); mini mum stage recorded, 0.05 foot February 11-13 and 26 (discharge, 0.8 million gallons per day, or 1.2 second-feet).
DIVERSIONS. A small amount of water is diverted by Kula pipe line above station at elevation 4,300 feet.
REGULATION. None.UTILIZATION. Low water is all diverted by ditches of East Maui Irrigation Co. for
irrigation of sugar cane.ACCURACY. Records based on a fairly well defined rating curve and continuous
gage-height record; fair below 100 million gallons per day.
Discharge measurements of Waikamoi Stream near Huelo, Maui, during the year endingJune 30, 1917.
[Made by H. A. R. Austin.]
Date.
Ann- 14
Oct. 20..... ........
Gage height (feet).
1.72 .68 .39
Discharge.
Second- feet.
11415 5.77
Million gallons
per day.
73 9.7 3.7
Date.
Mar. 19........... :Mar. 22............
Gage height (feet).
.42
.29
.76
Discharge.
Second- feet.
4.21 3.05
16.6
Million gallons
per day.
2.7 2.0
11

ISLAND OF MAUI. 159
Daily discharge, in million gallons, of Waikamoi Stream near Huelo, Maui, for the yearending June 30, 1917.
Date.
1........ ......2.... ..........3..............4..............5..............
6..............7..............8..............9..............10..............
U.. ............12..............13..............14..............15..............
16..............17..............18..............19..............20..............
21..............22..............23..............24..............25..............
26..............27... ...........2S.. ............29. .............30..............31..............
July.
2016161314
106.45.44.76.4
2814222028
3853221610
7.46.45.44.74.0
5.41414102893
Aug.
5862622518
14128.78.710
2245425322
1318203134
2518161612
121010106.420
Sept.
2538161220
2262282220
1619
107.410
126.46.4
5318
1216252522
13108.76.45.4
Oct.
14167.45.44.7
4.03.53.53.53.0
2.64.02.62.23.0
3.514107.44.0
2.62.64.74.73.0
7.42514133422
Nov.
16JO
4522126
7220161210
106.44.74.74.7
885316108.7
6.45 A
4.07.410
1822583853
Dec.
28*
58492519
8.77.47.4
25148
3418283818
3872495345
180
1A.767OK
16
2816108.7
Jan.
7.46.47.44534
4228138.77.4
10167.45.44.0
3.53.02.62.21 Q
1.91.61.61.63.5
256.43.52.62.21 9
Feb.
1.61.41.41.61.4
1.41 91 9
1.01.0
.8
.8124.7
1.91.41 9
3.55.4
7.43 n
1.01.0
.81 9
42
Mar.
7-43.0122813
6.44.04.76.44.0
2.63.54.74.77.4
5.42.62.62.62.6
1.91.92.22.29 fi
4.03.03.06.46.44.7
Apr.
6.47.44.06.412
5.44.74.03.53.0
134.73.54.04.7
4.06.45.43.55.4
4.05.44.73.53.0
3.02.66.4
17277
May.
452018138.7
8.77.46.45.45 A
5.47.48.71413
1242451312
1210161612
8.77.4107.46.45.4
June.
5.42810'10
16
141016138.7
138.76.45.44.7
4.74.74.74.74.7
4.06.45.44.74.0
3.512107.44.7
NOTE. Discharge determined Jfrom a rating curve fairly well defined below 100 million gallons per day. Discharge Nov. 28 to Dec. 2 and Dee. 12-16 determined by comparison with records of flow of Alo Stream.
Monthly discharge of Waikamoi Stream near Huelo, Maui, for the year ending June 30,1917.
Month.
July................................
April...............................May.. ..............................
Fischarge.
Million gallons per day.
Maximum.
93 62 62 34
126 347 45 42 28
172 45 28
347
Minimum.
4.0 6.4 5.4 2.2 4.0 7.4 1.6 .8
1.9 2.6 5.4 3.5
.8
Mean.
17.9 23.7 18.7 8.11
27.0 55.3 9.91 3.70 5.35
13.1 13.6 8.50
17.2
Second- feet
(mean).
27.7 36.7 28.9 12.5 41.8 85.6 15.3 5.72 8.28
20.3 21.0 13.2
26.6
Total run-off.
Million gallons.
555 734 560 251 809
1,710 307 104 166 393 422 255
6,270
Acre- feet.
1,700 2,250 1,720
772 2,490 5,260
943 318 509
1,210 1,290
783
19,200
NAILHLIHAELE STREAM NEAR HTTELO, MATTI.
LOCATION. 300 feet above New Hamakua ditch, about 3 miles south of Huelo.RECORDS AVAILABLE. October 8, 1913, to June 30, 1917. Also at old staff-gage sta
tion below New Hamakua ditch from December 9, 1910, to December 31, 1912.GAGE. Barrett & Lawrence water-stage recorder installed October 8, 1913.DISCHARGE MEASUREMENTS. Made by wading or from footbridge 150 feet below gage.CHANNEL AND CONTROL. One channel at all stages; straight for 100 feet above and
below gage; stream bed very rough and steep; banks steep and high and covered with dense vegetation. Control composed of large boulders; fairly permanent.

160 SURFACE WATER SUPPLY OP HAWAII, 1916-17.
EXTREMES OF DISCHARGE. Maximum stage recorded during period of record, 6.3 feet at 6.30 p. m. May 1, 1916 (discharge, computed from extension of rating curve, approximately 1,800 million gallons per day, or 2,780 second-feet); minimum stage recorded, 0.73 foot October 29 to November 1, 1913 (discharge, 2.3 million gallons per day, or 3.6 second-feett).
Maximum stage recorded during year, 3.95 feet at 8 p. m. December 9 (dis charge, approximately 450>million gallons per day, or 696 second-feet); minimum stage recorded, 0.3 foot February 21 (discharge, 3.0 million gallons per day, or 4.6 second-feet).
DIVERSION. None above station.REGULATION. None.UTILIZATION. Ordinary flow diverted by ditches of East Maui Irrigation Co. for
irrigation of sugar cane.ACCURACY. Determinations based on well-defined rating curve and a continuous
gage-height record. Records fair for all stages.
Discharge measurements of Nailiilihaele Stream near Huelo, Maui, during the year endingJune 30, 1917.
[Made by H. A. E. Austin.]
Date.
July 19.............Aug. 14............Sept. 12............Oct. 17.. ...........
Gage height (feet).
1.01 2.15
.86 1.12
Discharge.
Second- feet.
45 223 28 54.5
Million gallons
per day.
29 144
18 35
Date.
Dec. 11.. ...........Jan. 19.............Feb. 15.............Mar. 22.............
height (feet).
1.12 .52 .37.48
Discharge.
Second- feet.
50 10.1 6.3 9.3
Million gallons, for day.
32 6.5 4.1 6.0
Daily discharge, in million gabions, of Nailiilihaele Stream near Huelo, Maui, for theyear ending June SO, 1917.
Date.
1. .............2..............3..............4........'......
6..............7..............8..............9..............10..............11..............12..............13..............14..............15..............16..............17..............18..............19..............20..............21..............22..............23..............24..............25..............26..............27..............28..............29..............30..............31..............
July.
3226
26202018161412123218322626388442262320201410121214201618
Aug. .
72358410962453842625832845378422923294529292920182626181818
Sept.
457838353838626238452318181623161412452020143229262016141412
Oct.
2035 .20161616121212107 86 66 66 66 6
6.6201612109.09.012107.8
3853181472
Nov.
32587845183109534538353232262642848426181614141014162938673253
Dec.
386213749292320167216745293538323272727849123
, 16023111642322645262318
Jan.
121216533532382016161414107.86.66.66.66.66.65.65.65.65.65.614389.06.66.65.65.6
Feb.
5.65.65.65.65.65.65.64.63.8
N..64.64.64.64.6
. 4.64.64.64.63.83.83.03.83.83.84.63.83.849
Mar.
7.85.610169.06.64.612269.06.65.65.65.6169.06.66.65.64.64.65.66.66.66.64.64.64.64.67.816
Apr.
121010162916109.09.09.032161210161414161216161616147.87.87.8
8417596
May.
4529202016201412129.09.09.09.09.09.09.0328423182023322620201616141212
June.
9.0491816142616322920382012109.09.07.87.87.87.87.82016109.07.8
20262312
NOTE. Discharge determined from well-defined rating curve. Discharge July 23-31, Aug. 12-19, 22-24 27-31, and Apr. 25-30 determined by comparison with record of flow of Kailua Stream.

ISLAND OF MAUI. 161
Monthly discharge of Nailiilihaele Stream near Huelo, Maui, for year ending June 30,1917.
Month.
July.................................
September ..........................
January .February ...........................
April................................my.. ...............................
Discharge.
Million gallons per day.
Maximum.
144 109
78 72
183 231
53 49 26
175 84 49
231
Minimum.
10 14 12 6.6
10 16 5.6 3.0 4.6 7.8 9.0 7.8
3.0
Mean.
27.2 41.3 29.4 17.3 45.0 62.5 14.3 6.15 8.08
24.3 20.0 17.0
26.2
Second- feet
(mean).
42.1 63.9 45.5 26.8 69.6 96.7 22.1 9.52
12.5 37.6 30.9 26.3
40.5
Total run-off.
Million gallons.
843 1.280
881 537
1,350 1.940
442 172 251 728 619 510
9,550
Acre- feet.
2,590 3,930 2,710 1,650 4,140 5,950 1,360
528 769
2,240 1,900 1,560
29,300
KAILTJA STREAM NEAR HUELO, MAUI.
LOCATION. About 800 feet above New Hamakua ditch, crossing, 1 mile south of Huelo.RECORDS AVAILABLE. June 17, 1913, to June 30, 1917.GAGE. Barrett & Lawrence water-stage recorder installed October 1, 1913, at same
location and datum as original staff gage.DISCHARGE MEASUREMENTS. Made by wading or from footbridge at gage.CHANNEL AND CONTROL. Channel at gage is a large, deep pool with high., sloping
banks, at foot of low waterfall. Control at outlet of pool is solid rock ledge and large bouldera; will seldom shift.
EXTREMES OP DISCHARGE. Maximum stage recorded during period of record, 9.5 feet May 1,1916 (discharge, computed from extension of the rating curve, approxi mately 1,000 million gallons per day, or 1,550 second-feet); minimum stage recorded, 1 foot March 5 and 6, 1914 (discharge, 0.6 million gallons per day, or 0.9 second-feet.
Maximum stage recorded during year, 6.1 feet at 5.30 a. m. April 20 (discharge, approximately 450 million gallons per day, or 696 second-feet); minimum stage recorded, 1.2 feet December and February (discharge, 1.1 million gallons per day, or 1.7 second-feet).
DIVERSIONS. A small amount of water is diverted by Old Hamakua ditch above station.
REGULATION. None. 'UTILIZATION. Ordinary flow of stream is diverted by ditches of East Maui Irrigation Co
for irrigation of sugar cane.ACCUBACY. Rating curve is well defined below 20 million gallons per day, but.
determinations are only fair for all stages because of lack of sensitiveness of water- stage recorder.
Discharge measurements of Kailua Stream near Huelo, Maui, during the year ending JuneSO, 1917.
[Made by H. A. R. Austin.]
Date.
Sept. 12..... .......Dec. 12... ..........
Gage height (feet).
1.67 1.91
Discharge.
Second- feet.
13.8 26.7
Million gallons
per day.
8.9 17
Date.
Mar 23. ............
Gage height (feet).
1.32
Discharge.
Second- feet.
3.54
Million gallons, per day.
2.3
40532° 18 WSP 465 11

162 SURFACE WATER SUPPLY OP HAWAII, 1916-17.
Daily discharge, in million gallons, of Kailua Stream near Huelo, Maui, for the yearending June 30, 1917.
Date.
1. .............2..............3..............4..............5..............6..............7... ..........8..............9..............10..............11..............12..............13..............14..............15..............16....... ... .17..............18..............19....20.............21....... ... ..22..............23..............24..............25..............26..............27..............28..............29..............30..............31..............
July.
2014141212108.77.46.46.420102014142462161312108.77.45.36.46.47.4128.710
116
Aug.
55556624161324264237206237552616131630322218121010101010107.47.4
Sept.
1834138.7141462261416138.77.47.48.78.75.35.3
48is
8.78.7161 °.
14107.47.46.47.4
Oct.
1222128.78.78.76.46.46.45.33.62.92.92.92.92.9121212121212121213141413131313
Nov.
13375226150902620141310107.47.4
30IVt6620127.46.45.35.312132637
489(10,4
Dec.
16486637181313103421616220162020205252553294130223865.31.61.12.24.46.33.6
Jan.
5.35.37.44226263413107.47.4127.47.45.35.35.34.43.63.63.63.63.63.610246.44.45.35.34.4
Feb.
2.92.22.22.22.22.22.22.22.22.21.61.61.13.63.62.22.21.61.11.11.11.11.11.11.11.11.1
32
Mar.
6.45.35.38.74.42.91.66.4144.42.92.22.22.28.74.42.92.92.21.61.62.22.22.22.23.62.92.25.36.46.4
Apr.
8.7136.41616108.77.47.46.418107.47.46.46.46.45.34.47.45.35.35.35.33.63.63.66214570
May.
422420127.47.45.34.43.63.63.63.63.63.65.34.4
24458.78.78.78.710107.46.45.36.45.35.34.4
June.
3.637107.47.4
106.47.47.45.3125.34.44.43.63.63.64.43.62.92.2106.43.63.62.97.48.76.44.4
NOTE. Discharge determined from rating curve well denned below 20 million gallons per day and fairly well denned between 20 and 200 million gallons per day. Discharge July 1-17, Aug. 7-13, Oct. 1-17, Nov. 28-30, Dec. 15-24, Jan. 16-26, Feb. 19-23, 27 and 28, and Mar. 3-22 determined by comparison with records of flow of Nailiilihaele Stream.-
Monthly discharge of Kailua Stream near Huelo, Maui, for the year ending June SO,1917.
Month.
July.................................
Discharge.
Million gallons per day.
Maximum.
116 66 62 22
150 223
42 32 14
145 45 37
223
Minimum.
5.3 7.4 5.3 2.9 5.3 1.1 3.6 1.1 1.6 3.6 3.6 2.2
1.1
Mean.
16.6 25.5 14.8 9.80
32.3 47.6 10.1 2.93 4.15
16.3 10.3 6.84
16.5
Second- feet
(mean).
25.7 39.5 22.9 15.2 50.0 73.6 15.6 4.5a 6.42
25.2 15.9 10.6
25.5
Total run-off.
Million gallons.
514 792 444 304 968
1,480 312
82 129 488 318 205
6,030
Acre- feet.
1,580 2,430 1,360
932 2,970 4,530
961 252 395
1,500 980 630
18,500
HOOLAWALIILII STREAM NEAR HUELO, MATTI.
LOCATION. 400 feet above New Hamakua ditch crossing, about 4 miles by trail westof Huelo.
RECORDS AVAILABLE. April 5, 1911, to June 30, 1917. GAGE. Stevens water-stage recorder installed June 19, 1914, at same location and
datum as original staff gage. DISCHARGE MEASUREMENTS. Made by wading or from footbridge at gage,

ISLAND OP MAUI. 163
CHANNEL AND CONTROL. Channel at gage is a pool about 100 feet long and 10 feet wide formed by concrete control 12 feet long over which water makes a drop of about 50 feet; banks slope gently and are covered with dense growth of vegetation.
EXTREMES OP DISCHARGE. Maximum stage recorded during period of record, 2.9 feet at 5 p. m., January 8, 1916 (discharge, computed from extension of rating curve, approximately 520 million gallons per day, or 805 second-feet); minimum stage recorded, 0.07 foot June 2 and 3, 1913 (discharge, 0.85 million gallons per day, or 1.3 second-feet).
Maximum stage recorded during year, 1.8 feet at 8 p. m., December 9 (discharge, approximately 250 million gallons per day, or 387 second-feet); minimum stage recorded, 0.05 foot August, September, February, and March (discharge, 1.3 million gallons per day, or 2.0 second-feet).
DIVERSIONS. None above station.REGULATION . None.ACCURACY. Record good below and fair above 20 million gallons per day.
Discharge measurements of Hoolawaliilii Stream near Huelo, Maui, during the yearending June 30, 1917.
[Made by H. A. R. Austin.]
Date.
Sept. 12. ...........
Gage height (feet).
0.15 .11.24
Discharge.
Second- feet.
5.95 4.40 8.15
Million gallons
per day.
3.9 2.8 5.3
Date.
Feb. 15.............May 22.... .........
Gage height (feet).
0.06 .16
Discharge.
Second- feet.
2.22 5.48
Million gallons
per day.
1.4 3.5
Daily discharge, in million gallons, of Hoolawaliilii Stream near Huelo, Maui, for theyear ending June 30, 1917.
Date.
1..... .........2..............3..............
5..............6..............7..............
9..............10..............11..............12..............13..............14..............15..............16..............17..............18..............19..............20..............21..............22..............23..............24..............25..............26..............27..............
29.............. 30..............31..............
July.
129.09.06.56.56.54.84.8
4.83.26.54.84.86.59.06.54.8
3.23.23 9
3.23 9
3.23 9
3.23.23 9
19
Aug.
9.012159.06.56.56.5
4.83.24.86.5
1228126.56.56.56.5fi ^
4.84.83 9
3.23.22.22 9
2 9
2.2 1.32 0
Sept.
2.23.22.22.21.32.23.23.23.23.23.23.23.23.24.83.23.23.29.04.84.84.84.86.54.84.84.84.84.8 4.8
Oct.
4.83.23.23.23.23.23.23.23.23.23.22.22.22.22.22.22.22.22.22.22.22.22.22.22.24.84.83 9
6.5 126.5
Nov.
6.56.59.06.5
4023129 06.5fi ^
6 K
4.84.84.84.86.59.04.84.84.83.22.22.23.23.23-26-59 06.5 fi ^
Dec.
6.59.0
40109 n6.54.84.89 n
239 06.56.5fi ^4.86.59.0
T?
1519
34014019
6.56.56.54.83 9
3 0
Jan.
2.22.24.84.82.24.83 0
2 9
2 9
2 9
2.2
2.22.22.2
2.22 9
2.22.22 9
2 9
3.2fi ^3 9
3 9
3.2 3.23 9
Feb.
3.2
2.22 9
2 0
2.22 9
2 0
2 0
9 91 3
1.3i s1.31.31.3i <?2.21 Q
1 3
1.3i si <?i <?
1.31 >
4.8
Mar.
1.31.31.3i s1 o
1 <?1 <?S 9
4.82 0
2 0
2 9
2.22 9
3.22.22.23 9
2.22 9
2.22.22 0
9 9
2 9
3.22 9
2 9
2.2 2.23 0
Apr.
3 9
3.23.23.23.23.23.23 93 9
3.24.83.23.23.23.23.23.23.22.23.23.23.23 9
3.23.23.2S 9
6.566 34
May.
23129.06.54.8
4.8S 9
3 9
3.23.23.23.23.23.23.24.8
154.83.23.23.2
3.23.23.2S 9
3.23.2 3.2
June.
o *>3.22 9
2 9
2.2Q 9
2.23 0
3 93 9
3.23.23.23 0
2.22.22.23.22.22 0
2.22.22.22.22.22.22.29 9
3.2 2.2
NOTE. Discharge determined from a rating curve well defined below 20 million gallons per day.

164 SURFACE WATER SUPPLY OF HAWAII/1916-1*7.
Monthly discharge of Hoolawaliilii Stream near Huelo, Maui,for the year ending June 30,1917.
Month.
July.................................
The year. .....................
Discharge.
Million gallons per day.
Maximum.
1228 9.0
12 40 91 6.5 4.8 4.8
66 23 3.2
91
Minimum.
3.2 1.3 1.32.2 2.2 3.2 2.2 1.3 1.3 2.2 2.2 2.2
1.3
Mean.
5.43 6.60 3.89 3.40 7.56
14.8 2.82 1.85 2.24 6.45 5.07 2.57
5.25
Second- feet
(mean).
8.40 10.2 6.02 5.26
11.7 22.9 4.36 2.86 3.47 9.98 7.84 3.98
8.12
Total run-off.
Million gallons.
168 205 117 105 227 458
87 52 70
194 157 77
1,920
Acre- feet.
517 628 358 323 6%
1,410 268 159 213 594 482 237
5,880
HOOLAWANUI STREAM NEAR HUELO, MAUL
LOCATION. 500 feet above crossing of New Hamakua ditch, about 5 miles by trail west of Huelo.
RECORDS AVAILABLE. December 12, 1910, to June 30, 1917.GAGE. Stevens water-stage recorder installed June 20, 1914, 200 feet upstream from
original staff which it replaced.DISCHARGE MEASUREMENTS. Made by wading or from footbridge at gage.CHANNEL AND CONTROL. Stream drops over a low waterfall into a large circular pool
with gently sloping banks. Control at outlet of pool composed of boulders; probably permanent.
EXTREMES OP DISCHARGE. Maximum stage recorded during period of record, 5.4 feet at 11.30 p. m. May 1, 1916 (discharge, computed from extension of rating curve, approximately 440 million gallons per day, or 680 second-feet); minimum stage recorded, 0.04 foot September and October, 1912 (discharge, 1.0 million gallons per day, or 1.6 second-feet).
Maximum stage recorded during year, 4.2 feet at 7 a. m. December 23 (discharge, approximately 300 million gallons per day, or 464 second-feet); minimum stage recorded, 0.05 foot October and February (discharge, 1.1 million gallons per day,' or 1.7 second-feet).
DIVERSIONS. None above station.REGULATION. None.ACCURACY. Determinations based on well-defined rating curve and continuous gage-
height record. Records good for all stages below 60 million gallons per day.
Discharge measurements of Hoolawanui Stream near Huelo, Maui, during the year endingJune 30, 1917.
Date.
July 19.......Jan. 19.......
Made by
R.C. Rice...............................................
height (feet).
0.54.24
Discharge.
Second-feet.
124.4
Million
per day.
7.82.8

ISLAJSTD OP MAUL 165
Daily discharge, in million gallons, of Hoolawanui Stream near Huelo, Maui, for theyear ending June SO, 1917.
Date.
1..............2..............3..............
5..............
6..............7..............8..............9..............
10..............
11..............12..............13..............14..............15..............
16..............17..............18..............19..............20..............
21..............22..............23..............24..............25..............
26..............27..............28..............29..............30..............31..............
July.
13129.09.0
7.96.85.95.9i? Q
7.9i? Q9.06.87 Q
1618109 06.8
5.95.04.24.23.4
3 A
4.23.4K fl
30
Aug.
1919261612
9.07.96.86.85.9
7.9121623is
Q n9.09.0
10
13
9.07.96.8i? Q5.0
5.04.24.23.45.0
Sept.
6.8135.95.05.0
5.018126.87 Q
5.95.05.04.2
4.23 A
3.4165.0
4.2^ n5.95 Q
5.0
4.23 A
3 A
2.82.8
Oct.
3.43.42.22.22.2
2.21.81.81.81.8
1.81.81.81.81.8
1.81.82.21.81.4
1.4
1.81.41.1
5.05.92.24.2
5.9
Nov.
4.26.8
106.8
42
3218129.06.8
5.95.05.04.25.0
1628127 Qc Q
5.0
4.25.05.0
7 913181214
Dec.
1018322413
107.97.9
1864
3014121210
10
OQ
OQ
18
5274
1365824
i a14139 n7 Q
Jan.
5.95.05.9
1410
10139.06.85.9
5.95.95.04.23.4
3 A
S 4.2.82.82.8
2.22.22.22.23.4
5 Q
2.82.22.22.8
Feb.
2.21.81.81.81.8
1.81.81.81.81.8
1.81.41.41.81.1
1.11.11.12.21.4
1.41.11.11.11.1
1.11.1
14
Mar.
2.82.22.25.02.8
2.81.82.29.02 Q
2 0
2.82.22.23.4
2.82.22.82.21.8
1.81.81.81.81.8
1.81.41.42.22.23.4
Apr.
2.21.81.82.24.2
2.22.21.81.81.8
4.22.82.22.22.8
1.82.21.81.82.8
2.22.22.22.21.8
1.81.83.4
5232
May.
3218129.06.8
2.85.04.23.43.4
3.42 0
2.82.82.8
3.45.0
164.23.4
4.24.24.23.43.4
2.82.82.82.22.22.2
June.
2.22.82.22.22.2
2.82.22.82 0
. O
2 0
2 0 . O
2 0
2.82.82.2
2.22.22.82.22.2
2.24.22.21.81.8
1.83.42:83.42.2
NOTE. Discharge determined from rating curve well defined below 60 million gallons per day. Dis charge Oct. 12-17 and June 1-21 estimated by comparison with records of flow of Hoolawaliilii Stream.
Monthly discharge of Hoolawanui Stream near Huelo, Maui, for year ending June 30,1917.
Month.
July.................................
September ..........................
December. .........................
February ......................... .
April................................
The year. .....................
Discharge.
Million gallons per day.
Maximum.
30 26 18 14 42
136 14 14 9
52 32 4.2
136
Minimum.
3.4 3.4 2.8 1.1 4.2 6.8 2.2 1.1 1.4 1.8 2.2 1.8
1.1
Mean.
8.44 10.2 6.17 2.75
11.0 25.7 5.01 1.96 2.59 4.94 5.73 2.53
7.30
Second- feet
(mean).
13.115.8 9.55 4.25
17.0 39.8 7.75 3.03 4.01 7.64 8.87 3.91
11.3
Total run-off.
Million gallons.
262 315185 85
331 796 155 55 80
148 178
76
2,670
Acre- feet.
803 970 568 262
1,010 2,440
477 168 246 455 545 233
8,180
HONOPOTT STREAM NEAR HTTELO, HAITI.
LOCATION. 200 feet above New Hatmakua ditch crossing, about 6 miles west ofHuelo.
RECORDS AVAILABLE. December 10, 1910, to June 30, 1917. GAGE. Stevens water-stage recorder, installed June 19, 1914, at same location and
datum as original staff. DISCHARGE MEASUREMENTS. Made by wading or from footbridge at gage.

166 SUBFACE WATER SUPPLY OF HAWAII, 1916-17.
CHANNEL AND CONTROL. One channel at all stages; straight for 50 feet above and below gage; right bank is overflowed during floods; left bank steep and high. Control an old iron weir set in concrete; probably permanent.
EXTREMES OF DISCHARGE. Maximum stage recorded during period of record, 3.7 feet at 10 p. m., May 1, 1916 (discharge, computed from extension of rating curve, approximately 160 million gallons per day, or 248 second-feet); minimum stage recorded, 0.4 foot September and October, 1912 (discharge, 0.4 million gallons per day, or 0.6 second-foot).
Maximum stage recorded during year, 3.15 feet at 7 p. m., April 30 (discharge, approximately 120 million gallons per day, or 186 second-feet); minimum stage recorded, 0.1 foot October and February (discharge, 0.5 million gallons per day, or 0.77 second-foot).
DIVERSIONS. None above station.RE GULATION . None.UTILIZATION. Ordinary flow is diverted by ditches of East Maui Irrigation Co. for
irrigation of sugar cane.ACCURACY. Discharge determined from rating curve well denned for low stages.
Records for medium and flood stages fair.
Discharge measurements of Honopou Stream near Huelo, Maui, during the year endingJune 30, 1917.
[Made by H. A. R. Austin.]
Date
Aw. 19..... ........
Gage height (feet).
0.19 .18
Discharge.
Second- feet,
1.96 1.55
Million gallons
per day.
1.31.0
Date.
May 22.. ...........
Gage height (feet).
0.26
Discharge.
Second- feet.
2.53
Million gallons
per day.
1.6
Daily discharge, in million gallons, of Honopou Stream near Huelo, Maui, for the yearending June 30, 1917.
Date.
3..............4..............5..............6..............7..............
9..............10..............11..............12..............is............:.14. .............
16..............17..............18..............19..............20..... ....... ..21..............22..............23..............24.... ..........25..............26..............27..............28..............29.............. 30.............. 31..............
July.
5.54.63.83.02.41.81.81.31.31.3
2.4.8
2.41.31.33.03.82.42.42.41.81.81 S
1.31.31.31 S
1.31.31.8 7.5
Aug.
4.6
6.54.63.83.03.02.42.41.83.03.86.5
114.63.83.83.04.63.83.03 ft
2.42.41.81.81 8
1.81.31.31.8
Sept.
1.8
1.31.31.31.83.03 ft
1.82.4
1.81.31.31 o
2.41.31.31 <?6.5
1.82.42 A
3 ft
2.42.42 A
1 C
1.8 1.8
Oct.
1 S
1 0.8.8.8.8
.5
.5
.5
.5
.5
.5
.5
.8
.5
.5
.5
.5
.52.41 O
3.05.5 1.8
Nov.
1.82 A
3.0
22126.55 C
3 0
3.83.83.0
2 4a n
3.84.62 41 S1 S
1 S1 *i1 *i1 S
1 3
1.83 c6.53.8 4.6
Dec.
3.05.5
179.56.54.63.83.86.5
138.55.5
4.63.84.66.58 C
7.56.5
1599oo
19128.56.55.53.8 3.0 3.0
Jan.
2.4
2.43.02.43.03.03.03.03.03.03.02 A
2.42 A
1 ft
1.81 °.
1 *?
1.3i ^i °.i °.i ^2.43.81 Q1 Q
1.3 1.3 1.3
Feb.
1 3888888888888
85
i »
5
55
5 5
Mar.
1.3
1.31.81.31.31.3<? ft3.81.81.81.81 ft1 0
3 ft
1.81.32.41 ft
1.81.31 °»
1 O
1 °.
1 O
1.31 0
1 °.
1.3 1.3 1.3
Apr.
1.31 q1 °.
1.31.31.31.31 °.
1 3
1 °»
1 ft
1.31 0
1 Q1 °.
1 °.1 o
1 31 0
1.81 °.
1 0
1 Q
1 0.
1 0
1 °.1 0
3 ft
24 19
May.
17Q ^
6.55.5
3.83.03 ft
3 ft
2 A
2.41 S1 S
1.82.44.66.52.41.82.41 S
2 A
2.41 0
1 0
1 0
1 C
1.8 1.8 1.3
June.
1.82 A
1 ft
1.31.31.81.31.82.41.81.81.31.31 °>
1 °>
1.31.3i s1.31.31.31 °.
.8
.8
.81 Q
1.32.4.8
NOTE. Discharge determined from rating curve well defined below 5 million gallons per day. Dis charge Dec. 25 to Jan. 1 and Mar. 30 to Apr. 19 determined by comparison with records of flow of HoolaWanui stream.

ISLAND OF MAUL 167
Monthly discharge of Honopou Stream near Huelo, Maui, for year ending June 30,1917.
Month.
July.................................
April................................
Discharge.
Million gallons per day.
Maximum.
7.5 11 6.5 5.5
22 38 3.8 5.5 3.8
24 17 2.4
38
Minimum.
0.8 1.3 i.3 .5
1.3 3.0 1.3 .5 .8
1.3 1.3 .8
.5
Mean.
2.32 3.51 2.11 1.08 4.01 8.71 2.12
.96 1.65 2.74 3.46 1.43
2.86
Second- feet
(mean).
3.59 5.43 3.26 1.67 6.20 13.5 3.28 1.49 2.55 4.24 5.35 2.21
4.43
Total run-off.
Million gallons.
72 109 63 34
120 270
66 27 51 82
107 43
1,040
Acre- feet.
221 334 194 103 369 829 202 82
157 252 329 132
3,200
NEW HAMAKTTA DITCH AT HALEHAKTT WEIK, NEAR HTTELO, MATJI.
LOCATION. Just above crossing of Halehaku Stream, about 7 miles by trail west ofHuelo post office.
RECORDS AVAILABLE. January 1, 1910, to June 30, 1917. GAGE. Friez water-stage recorder.DISCHARGE MEASUREMENTS. Made by 25-foot Cipppletti weir. CHANNEL AND CONTROL. Large pool at weir. EXTREMES OF DISCHARGE. See monthly-discharge table. DIVERSIONS. None above station. REGULATION. By gates at frequent intervals. UTILIZATION. Irrigation of sugar cane. ACCURACY. Records good. COOPERATION. Daily-discharge record copied from records of East Maui Irrigation Co.
Daily discharge, in million gallons, of New Hamalcua ditch at Halehaku weir, near Huelo, Maui, for the year ending June 30, 1917.
Date.
1. .............2..............3.............. 4..............5..............6..............7..............8..............9..............
10..............11..............12..............13..............14..............15..............16..............17..............18..............19..............20..............21..............22..............23..............24..............25..............26..............27..............28..............29.............. 30..............31..............
July.
69.669.668.7 69.071.169.369.570.366.071.070.566.767.668.469.771.268.368.9 69.169.369.267.065.766.564.866.570.269.567.9 69.573.8
Aug.
70.172.172.4 70.469.769.769.168.665.671.573.071.170.269.070.873.071.772.371.571.570.071.469.770 169.871.470.268.763.3 64.970.3
Sept.
74.961.053.4 53.754.354.563.055.153.754.353.953.853.853.854.452.853.654.756.453.853.854.854.453.353.753.653.953.653.7 53.5
Oct.
54.553.653.8 53.754.053.146.045.548.244.237.736.250.039.338.439.250.053.853.653.450.248.953.252.947.653.254.453.853.7 62.2
53.4
Nov.
53.856.959.8 57.670.670.165.853.653.653.954.254.252.341.739.853.770.158.353.753.753.548.041.441.851.251.560.058.754.2 58.5
Dec.
56.859.864.3 67.457.153.553.555.856.769.765.556.454.354.154.356.558.659.359.358.4
60.962.529.4
5.2
33.933.8
28.9 40.539.8
Jan.
40.140.341.6 44.254.3
54.555.053.353.853.753.954.053.553.150.047.445.341.839.637.836.334.633.133 442.7
52.448.642.237.2 39.633.4
Feb.
31.429.728.5 27.526.225.124.223.523.022.321.434.733.326.928.727.527.326.538.036.839.023.618.820.822.1
25.025.050.8
Mar.
44.128.428.5 35.640.433.027.340.355.348.138.844.137.835.741.643.936.141.836.529.028.426.630.531.737.646.831.025.630.8 39.450.0
Apr.
36.739.132.1 30.550.756.846.142.438.835.855.556.148.051.458.956.955.859.852.050.955.753.258.956.345.0
39.937.243.069.5 67.6
May.
68.254.948.5 54.555.452.050.450.448.245.346.453.559.857.165.862.568.871.465.060.066.965.163.268.768.064.055.955.051.9 49.949.2
June.
48.654.066.2 65.463.066.765.866.970.165.367.664.961.752.444.744.339.740.642.334.430.943.051.039.537.732.443.662.557.7 57.4
NOTE. No flow Dec. 24.

168 SURFACE WATER SUPPLY OF HAWAII, 1916-17.
Monthly discharge of New Hamakua ditch at Halehaku weir, near Huelo, Maui, foryear ending June SO, 1917.
Month.
July................................
September ..........................
December (30 days) .................
February ...........................
April ............. ..... .....May... .............................
The year. .....................
Discharge.
Million gallons per day.
Maximum.
73.8 73.0 74.9 62.2 70.6 69.7 55.0 50.8 55.3 69.5 71.4 70.1
Minimum.
64.8 63.3 52.8 36.2 39.8 5.2
33.1 18.8 25.6 30.5 45.3 30.9
Mean.
68.9 70.1 55.2 49.7 54.9 51.4 45.2 28.1 36.9 49.4 57.9 52.7
Second- feet
(mean).
106 108 85.4 76.9 84.9 79.5 69.9 43.5 57.1 76.4 89.6 81.5
Total run-off.
Million gallons.
2,130 2, 170 1,660 1,540 1,650 1,540 1,400
788 1,140 1,480 1,800 1,580
18,900
Acre- feet.
6,550 6,670 5,080 4,730 5,050 4,730 4.300 2,410 3,510 4,550 5, 510 4,850
57,900
KATTHIKOA1 DITCH AT OPANA WEIR, NEAR HTTELO, MATTI.
LOCATION. A short distance below crossing of Opana Stream, about 8 miles by roadwest of Huelo post office.
RECORDS AVAILABLE. January 1, 1910, to June 30, 1917. GAGE. Priez water-stage recorder.DISCHARGE MEASUREMENTS. By 25-foot sharp-crested weir. CHANNEL AND CONTROL. Large pool at weir. EXTREMES OF DISCHARGE. See monthly-discharge table. DIVERSIONS. None above station. REGULATION. By gates at frequent intervals. UTILIZATION. Irrigation of sugar cane. ACCURACY. Records good. COOPERATION. Daily-discharge record copied from records of East Maui Irrigation Co.
Daily discharge, in million gallons, of Kauhikoa ditch at Opana weir, near Huelo, Maui, for the year ending June 30, 1917.
Date.
1...................
4...................5...................6...................7...................
9...................10...................11...................12...................ID
15...................16...................17...................18
1920...................91
9S
24...................OK
26...................27...................28...................29...................<in31...................
July.
41.8<n i90 n20.617 <l
12.4
3 9
.9q Q
12.65.1
19 10 D
9 1
24.4Aft 9
20.715 09 47 H
4.2.5
»; ^c q
4.27 f\
60.3
Aug.
47.654.363.337.324.916.319 e\
9.98.57.0
37.943.856.037.522.621.01Q t\qq qqo A
91 ft
17.011.7
8 C
7.16.86.55.85.04 e
7.2
Sept.
13.440.4
23.324.9cn o
48.331.7qc «
28.526.090 9
99 H
28.823.519.818.458.7v z
26.1
31.7qo non c
94. ^*>9 Z
18.717.6
Oct.
19.921.618.216.714.33.0
.36 9
9.614.7
11.8
2 9
8.56.8
14.39Q *Q
16.822.346.528.3
Nov.
22.524.142.027.566.862.841.538.628.222.520.315.13.6
30.862.223.719.012.78 A
.8
is. 311.713.8q7 n
58.843.749.6
Dec.
40.255.068.261.649.741.131.822 927.1
68.349.238.946.543.6
48.465.873.369.460.887.3
Feb.
1
9.7
Mar.
4.2
8.38.22.0
5.71.2
1.71.7
5.0
Apr.
4.21.3
1.93.8
1.56.1.4
7.974.175.4
June.
13.64.12.5.7
5.22 16.39.61.68.05.51.2
1.71.2
.62.4.3
NOTE. No flow on days for which discharge is not given.
1 New alinement of Old Hamakua ditch west of Halehaku Gulch,

ISLAND OF MAUL 169
Monthly discharge of Kauhikoa ditch at Opana weir, near Huelo, Maui,for year endingJune SO, 1917.
Month. (
July (28 days).......... .............
September........................ .October (21 days) ...................November (27 days).... . ............December (22 days) ... ..............February (1 day).. ..................March (9 days)............. . .April (10 days).. ....................June (17 days) ......................
The year. .....................
Discharge.
Million gallons per day.
Maximum.
60.3 63-358.7 46.5 66.8 87.3
8.3 75.4 13.6
Minimum.
0.5 4.5
13.4 .3.8
22.9
1.2 .4 .3
Mean.
15.5 22.7 28.4 15.5 29.7 55.2
4.2217.7 39.2
Second- feet
(mean).
24.0 35. 43.9 24.0 46.*) 85.4
6.53 27.4 60.7
Total run-off.
Million gallons.
434 704 852 325 802
1,210 10 38
177 67
4,620
Acre- feet.
1,330 2,160 2,610
999 2,460 3,730
30 117 543
2,05016,000
LOWRIE DITCH AT OPANA WEIR, NEAR HTTELO, MATTI.
LOCATION. A short distance west of Halehaku Gulch, about 7 miles by road north west of Huelo post office.
RECORDS AVAILABLE. January 1, 1910, to June 30, 1917.GAGE. Friez water-stage recorder.DISCHARGE MEASUREMENTS. Made by sharp-crested weir 16J feet long, with bot
tom and end contractions.CHANNEL AND CONTROL. Large pool back of weir.EXTREMES OP DISCHARGE. See monthly-discharge table.DIVERSIONS. None above station.REGULATION. By gates at frequent intervals.UTILIZATION. Irrigation of sugar cane.ACCURACY. Records good.COOPERATION. Daily-discharge record copied from records of EastMaui Irrigation Co.
Daily discharge, in million gallons, of Lowrie ditch at Opana weir, near Huelo, Maui, for the year ending June 30, 1917.
Date.
1. .............2..............3..............4..............5..............6..............7..............8..............9..............
10..............11..............12..............13..............14..............15..............16..............17..............18..............19..............20..............21..............22. .............23..............24..............25..............26..............27..............28..............29.............. 30..............31..............
July.
58.158.258.158.058.058.057.758.358.158.057.354.058.958.958.859.059.258.658.558.458.355.858.658.356.456.754 950.457.8 58 958.8
Aug.
58.858.859.058.959.058.858.658.7
, 58.158.458.858.859.259.858.958.959.158.759.158.858.858.858.858.858.758.157.958.158.1 55.858.0
Sept.
57.756.655.454.958.358.457.858.558.559.158.858.15».l56.754.256.951.340.06.7
11.657.556.758.258.258.158.057.756.454.5 51.0
Oct.
57.657.555.253.251.352.548.351.950.745.241.043.544.341.351.049.656.355.8
^55.553.247.554.153.350.046.756.156.656.156.2 57.456.5
Nov.
52.657.155.856.459.258.858.458.157.9K7 O
57.852.249.845.842.557.654.450.953.951.546.046.240.048.849.650.847.156.854.8 58.8
Dec.
54 457.356.458.659.055.453.252.653.8CO A
59.055.758.746.452.758.959.359.556.820.818.918.323.94.61.61.67.1
14.86.9
24.739.3
Jan.
48.143.446.858.158.658.058.854.554.348.457.458.948.853.739.135.727.021.019.719.318.718.217.018.043.056.142.025.221.1 30,932.4
Feb.
27.717.016.715.714.713.913.612.913.012.411.711.811.645.735.427.325.222.939.436.535.820.716.311.310.316.514.852.9
Mar.
41.227.036.655.849.027.630.443.455.740.430.751.539.139.054.343.434.139.638.033.228.835.033.633.339.047.927.031.146.3 49.849.0
Apr.
37.346.631.934.757.053.654.247.544.441.357.450.648.756.750.951.554.551.644.053.643.851.049.433.835.538.886.744.961.0 60.1
May.
52.852.258.157.657.755.455.445.346.042.748.257.650.157.054.755.857.754.757.455.155.950.253.857.457.653.252.355.544.8 37.035.4
June.
41.552.251.146.453.955.853.154.956.754.756.754.748.146.939.533.731.650.234.732.231.343.238.233.129.427.147.153.746.9 25.6
.......

170 SURFACE WATER SUPPLY OF HAWAII, 1016-17.
Monthly discharge of Lowrie ditch at Opana weir, near Huelo, Maui, for year endingJune 30, 1917.
Month.
July................................
October.......... .......... . . .November ........................ .
February. ........................ .
April............. ........... . ...
June ................................
Discharge.
Million gallons per day.
Maximum.
59.2 59.8 59.1 57.6 59.2 59.5 58.9 52.9 55.8 61.0 58.1 56.7
61.0
Minimum.
50.4 55.8 6.7
41.0 40.0 1.6
17.0 10.3 27.0 31.9 35.4 25.61.6
Mean.
57.6 58.6 53.1 51.8 52.9 40.3 39.7 21.6 39.7 47.4 52.4 44.1
46.8
Second- feet
(mean).
89.1 90.7 82.2 80.1 81.8 62.4 61.4 33.4 61.4 73.3 81.1 68.272.4
Total run-off.
Million gallons.
1,790 1,820 1,590 1,610 1,590 1,250 1,230
604 1,230 1,420 1,620 1,320
17, 100
Acre- feet.
5.48C 5,570 4,890 4,930 4,870 3,830 3,780 1,860 3,780 4,360 4,99(1 4,060
52,40C
HAIKU DITCH AT PEAHI WEIR, NEAR HUELO, MAUI.
LOCATION. In Peahi about 8 miles by road northwest of Huelo post office.RECORDS AVAILABLE. January 1, 1910, to June 30, 1917.GAGE. Friez water-stage recorder.DISCHARGE MEASUREMENTS. Made by sharp-crested weir, 16J feet long, with bottom
and end contractions.CHANNEL AND CONTROL. Large pool at weir. EXTREMES OP DISCHARGE. See monthly-discharge table. DIVERSIONS. None above station. REGULATION. By gates at frequent intervals. UTILIZATION. Irrigation of sugar cane. ACCURACY. Records good. COOPERATION. Daily-discharge record copied from records of East Maui Irrigation Co.
Daily discharge, in million gallons, of Haiku ditch at Peahi weir near Huelo, Maui, for the year ending June 30,1917.
Date.
1. .............2..............3..............4..............5..............6..............7..............8..............9..............
10..............11..............12..............13..............14..............15..............16..............17..............18..............19..............20..............21..............99
23..............24..............25..............26..............27..............28..............29.............. 30..............31..............
July.
60.162.270.469.979.169.147.830.623.139.668.459.780.174.174.778.385.276.773.861.251.832.026.823.126.934.461.668.449.6 66.385.5
Aug.
73.977.784.675.373.571.258.953.944.142.265.266.268.187.774.:68.969.768.471.471.469.368.062.865.356.755.753.058.951.9
60.3
Sept.
63.963.360.648.549.562.470.077.369.469.861.454.046.237.444.543.934.139.662.674.153.751.067.867.065.862.948.338.631.7
Oct.
59.2
29.928.322.15.44.65.16.64.7
3.710.217.13.44.34.7
54.745.124.515.16.4
14.3
13.04.4
54.968.7
53.8 77 S69.3
Nov.
54.250.368.669.784.376.358.761.137.436.434.524.88.06.18.5
81.778.347.228.630.026.87.25.8
19.726.639.645.968.557.5 75.7
Dec.
55.564.676.372.858.446.946.842.932.276.872.953.265. g59.655.354.574.981.571.367.968.970.275.145.130.028.430.229.928.9 29.637.6
Jan.
26.818.320.670.971.062.269.427.96.32.84.82.72.62.42.42.32.32.12.32.22.22.01.71.61.61.51.31.11.11.51.6
Feb.
2.02.02.01.91.71.21.01.01.01.01.01.01.01.31.21.11.11.11.11.11.21.31.31.31.31.31.21.3
Mar.
1.41.2.9.9.9.9.9
2.3.9.9.9.9.9.9
1.0.9.9.9.9.9.9.9.9.919.9.9.9.9 .9.9
Apr.
0.9.9
3.34.4
34.16.53.53.12.62.6
52.120.58.2
25.338.223.936.630.514.237.920.422.944.431.318.59.58.3
27.584.4 81.1
May.
82.680.371.453.025.336.829.933.622.311.212.632.420.832.435.135.167.477.154.921.037.029.155.966.542.317.313.615.913.1 23.517.1
June.
13.746.436. 331.332.258.220.254.959.520.955.255.116.414.416.025.710.612.59.48.27.5
26.113.111.410.79.1
24.937.623.4 26.1

ISLAND OF HAWAII. 171
Monthly discharge of Haiku ditch, at Peihi weir near Huelo, Maui, for year endingJune 30, 1917.
Month.
July................................
Discharge.
Million gallons per day.
Maximum.
85.5 87.7 77.3 77.3 84.3 81.5 71.0 2.0 2.3
84.4 82.6 59.5
87.7
Minimum.
23.1 42.2 31.6 3.4 5.8
28.4 1.1 1.0 .9 .9
11.2 7.5
.9
Mean.
58.4 65.0 55.0 28.0 43.9 55.0 13.5 1.29 .97
23.3 37.6 26.2
34.3
Second- feet
(mean).
90.4 101 85.1 43.3 67.9 85.1 20.9 2.00 1.50
36.1 58.2 40.5
53.1
Total run-off.
Million gallons.
1.810 2,010 1,650
867 1.320 1.700
420 36 30
698 1,170
787
12,500
Acre- feet.
5,560 6,180 5,060 2,660 4,040 5,230 1,280
111 92
2,150 3,580 2,410
38,400
MISCELLANEOUS MEASUREMENTS.
Measurements of streams and ditches on the island of Maui at points other than regular gaging stations are listed below:
Miscellaneous measurements on Maui for the year ending June 30, 1917.
Date.
July 28July 24
Aug. 12Sept. 15Oct. 16Dec. 13Jan. 26Feb. 16May 24Dec. 11
Stream,
North Waiehu.........
.....do.................
.....do.................
.....do.................
.....do.................
.....do.................
.....do.................
.....do.................
Locality.
ditch. .....do.....................................do.....................................do.....................................do.....................................do.....................................do.....................................do................................
height (feet).
0.70.85
.54
.53
.48
.94
.59
.33
.71
Discli
Second- feet.
7.6.3
.35
.21
.12
.98
.34
.05
.3733.3
arge.
Million gallons
per day.
4.9.2
.25
.15
.08
.65
.22
.03
.2421.5
ISLAND OP HAWAII.
UPPER HAMAKTTA DITCH AT PUUALALA AND RESERVOIR NO. 3 WEIRS, NEARKTTKUIHAELE, HAWAII.
LOCATION. Puualala weir is in Lalakea tract, adjacent to forest reserve and close to Kaala Mountain and Pacific sugar mill fence. Reservoir No. 3 weir is on a branch from main ditch just before it enters reservoir No. 3, about 1 mile south of Puual ala or main weir.
RECORDS AVAILABLE. January 1, 1913, to June 30, 1917. Records given herewith show the combined flow of the & uin ditch and its diversion to reservoir No. 3 which occurs above the main wei*.
GAGE. Watson water-stage recorder at each weir.DISCHARGE MEASUREMENTS. Made by sharp-crested weirs with good stilling basins
above.EXTREMES OF DISCHARGE. See monthly-discharge table.DIVERSIONS. This ditch diverts all natural run-off from upper headwaters of Waipio
Gulch.UTILIZATION. Irrigation of sugar cane and domestic supply.ACCURACY. Records good.COOPERATION. Records furnished by the Hawaiian Irrigation Co.
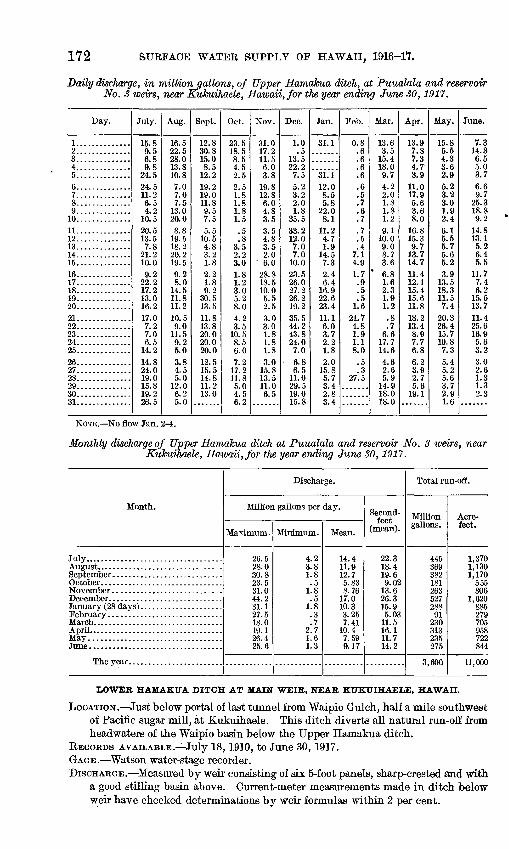
172 SURFACE WATER SUPPLY OF HAWAII, 1916-17.
Daily discharge, in million gallons, of Upper Hamakua ditch, at Puualala and reservoir No. 3 weirs, near Kukuihaele, Hawaii, for the year ending June 30,1917.
Day.
1... ...........2..............3..............4..............5..............6..............7..............8..............9..............
10..............11..............12..............13..............14..............15..............16..............17..............18..............19..............20..............21..............22..............23..............24..............25..............26..............27..............28..............29.............. 3031..............
July.
15.89.56.89.8
*)A ^
24.511.26.54.2
10.520.513.57.8
21.210.09.2
17.213.0
17.07.27.06.5
14.214.824.019.015.8 19.226.5
Aug.
16.522.528.013.8 10.87.07.07.5
13.020.08.8
19.518.220.219.59.28.0
14.511.811.210.59.0
11.59.25.03.84.55.0
12.0 6.25.0
Sept.
12.830.815.08.5
12.219.219.011.89.57.55.5
10.54.83.21.82.21.89.2
30.5IS E:
11.813.820.020.020.012.515.514.811.2 13.0
Oct.
OQ C
18.58.54.52 e
2.51.81 0
1.81.5.5.8
3.52.2o n
1.81 9
3 n
5.28 n
4 93 ^
10.58 C
6.07 9
17.211.85.04 C
6.2
Nov.
Qi n
17.2n c
6.0 3.8
19.812.86.04.83.5
3 e
4.83.52.06.0
28.818.510.05.52 C
^ n3.01.81.81.83.0
15.813.511.0 6.5
Dec.
1.0.5
13.522.2 7.55.23.22.01.8
35.5oq o
12.07.07.0
10.023.526.027.226.219.235.544.243.824.07.0
6.86.5
11.029.5 19.015.8
Jan.
31.1
"si'.'i
12.08.55.8
22.08.1
11.24.71.9
14.57.32.46.4
16.922.623.411.16.03.7
1.82.0
15.85.73.42.83.4
Feb.
0.8.6.6.6 .6.6.5.7.6.7.7.5.4
7.14.91.7.9.5.5
1.621.74.81.91.18.0.5.3
27.5
Mar.
13.63.5
15.418.0 9.74.22.01.81.81.29 1
10.09.08.73.6
' 6.81.62.31.91.2.8.7
6.617.714.64.62.65.9
14.9 18.018.0
Apr.
13.97.87.34.7- 3.9
11.017.95.63.68.0
16.815.39.7
13.714.711.412.115.415.611.818.213.48.97.76.86.23.92.75.6
19.1
May.
15.85.54.33.6 2.95.23.23.01.92.46.15.55.75.65.23.9
13.518.311.57.4
20.326.415.710.87.35.45.25.63.7 2.91.6
June.
7.314.86.55.0 3.76.69.7
25.318.89.2
14.813.15.26.45.5
11.77.46.2
15.513.711.425.616.95.63.23.02.61.31.3 2.3
NOTE. No flow Jan. 2-4.
Monthly discharge of Upper Hamakua ditch at Puualala and reservoir No. 3 weirs, near Kukuihaele, Hawaii, for the year ending June 30,1917.
Month.
July...................................
May..................................
Discharge.
Million gallons per day.
Maximum.
26.5 28.0 30.8 23.5 31.0 44.2 31.1 27.5 18.0 19.1 26.4 25.6
Minimum.
4.2 3.8 1.8 .5
1.8 .5
1.8 .3 .7
2.7 1.6 1.3
Mean.
14.4 11.9 12.7 5.83 8.76
17.0 10.3 3.25 7.41
10.4 7.59 9.17
Second- feet
(mean).
22.3 18.4 19.6 9.02
13.6 26.3 15.9 5.03
11.5 16.1 11.7 14.2
Total run-off.
Million gallons.
445 369 382 181 263 527 288
91 230 313 235 275
3,600
Acre- feet.
1,370 1,130 1,170
555 806
1,620 885 279 705 958 722 844
11,000
LOWER HAMAKUA DITCH AT MAIN WEIR, NEAR KUKUIHAELE, HAWAII.
LOCATION. Just below portal of last tunnel from Waipio Gulch, half a mile southwest of Pacific sugar mill, at Kukuihaele. This ditch diverts all natural run-off from headwaters of the Waipio basin below the Upper Hamakua ditch.
RECORDS AVAILABLE. July 18,1910, to June 30, 1917.GAGE. Watson water-stage recorder.DISCHARGE. Measured by weir consisting of six 5-foot panels, sharp-crested and with
a good stilling basin above. Current-meter measurements made in ditch below weir have checked determinations by weir formulas within 2 per cent.

ISLAND OF HAWAII. 173
EXTREMES OF DISCHARGE. See monthly-discharge table. UTILIZATION. Irrigation of sugar cane and domestic supply. ACCURACY. Records good. COOPERATION. Records furnished by the Hawaiian Irrigation Co.
Daily discharge, inmillion gallons, of Lower Hamakua ditch at main weir, near Kukuihaele, Hawaii, for the year ending June 30, 1917.
Date.
1.. ............2. .............3..............4..............5..............6..............7..............8..............9..............
10. .............11..............12..............13..............14..............15..............16..............17..............18..............19..............20..............21..............22..............23..............24..............25..............26..'............27..............28. .............29..............30. .............31..............
July.
53.249.046.847.5KJ. ft
52.848.846.542.54o.253.252.545.053.043.545.5KA r:
53.249.250.552.044.845.2
40 n
49.053.243.536.850.251.0
Aug.
53.055.555.553.843.549.542.249.250.554.057.258.560.552.560.556.2ci n
55.555.050.051.849.850.54Q fi46.841.241.044.550.246.246.2
Sept.
47.060.254.547.849.552.555.550.046.845.542.550.041.539.038.038.036.842.256.049.044.248.053.252.254.250.552.552.550.246.2
Oct.
40.255.246.0
38.537.536.836.235.835.534.-S35.035.034.837.037.0
34.838.840.043.836.041.0
36.235.533.820.037.536.244.5
Nov.
M n
53.248.238.8Aft K
59.549.5Aft r:
42.036.838.041.236.234.534.260.857.047.541.238.836.034.534.2qq Q33.534.538.011 939.234.8
Dec.
34.233.849.553.540.536.034.035.232.850.540.038.239.237.542.041.241.535.534.535.534.834 834.236.535.036.236.034.535.034.535.0
Jan.
34.934.937.435.635.739.239.2
38.438.238.738.938.538.036.035.4
34.734.540.236.636.234.434.033.833.533.433.033.333.833.5
Feb.
32.331.831.331.331.131.131.130.530.630.630.530.129.935.833.831.9SI 930.930.131.340.838.230.230.930.529.629.743.3
Mar.
41.434.639.941.538.934.432.532.132.031.335.734.934.536.432.835.1V* 7SI 731.831.530.629.935.1AA O
40 6-
33.231.334.638.740.740.7
Apr.
40.541.436.634.937.940.143.234.138.237.639.143.537.342.247.142.543.241.847.440.447.750.343.235.833.832.832.231.633.336.0
May.
39.237.134.133.133.032.731.531.431.434.236.535.635.934.235.432.637.135.436.634.243.951.747.038.737.434.234.635.931.731.130.9
June.
38.142.736.135.333.039.746.354.249.641.945.146.737.133.031.936.335.533.239.039.633.242.939.336.834.232.931.631.832.933.6
Monthly discharge of Lower Hamakua ditch at main weir, near Kukuihaele, Hawaii, for year ending June 30, 1917.
Month.
July.................................
April................................jJay.. ...............................
Discharge.
Million gallons per day.
Maximum.
54.5 60.5 60.2 55.2 60.8 53.5 40.2 43.3 44.2 50.3 51.7 54.2
60.8
Minimum.
36.8 41.0 36.8 20.0 33.5 32.8 33.0 29.6 29.9 31.6 30.9 31.6
20.0
Mean.
48.7 51.0 48.2 37.8 42.3 37.8 36.1 32.2 35.4 39.5 35.8 38.1
40.3
Second- feet
(mean).
75.4 78.9 74.6 58.5 65.4 58.5 55.9 49.8 54.8 61.1 55.4 58.9
62.4
Total run-off.
Million gallons.
1,510 1,580 1,450 1,170 1,270 1,170 1,120
900 1,100 1,190 1,110 1,140
14,700
Acre- feet.
4,630*
4,850 4,440 3,600 3,890 3,600 3,430 2,770 3,370 3,640 3,410 3,510
45,100
KOHALA DITCH AT AWINI WEIR, NEAR KOTTALA, HAWAII.
LOCATION. At elevation 1,880 feet in east branch of Honokanenui Gulch, Kohaladistrict.
RECORDS AVAILABLE. July 1,1907, to June 30,1917. GAGE. Vertical staff showing head on weir. DISCHARGE MEASUREMENTS. Measured by a sharp-crested weir consisting of three
5-foot panels.

174 SUE.FACE WATER SUPPLY OF HAWAII, 1916-17.
EXTREMES OF DISCHARGE. See monthly-discharge tables. UTILIZATION. For irrigation of sugar cane and for domestic supply. ACCURACY. Records good. COOPERATION. Records furnished by the Kohala Ditch Co.
Daily discharge^ in million gallons, of Kohala ditch at Awini weir, near Kohala, Hawaii, for the years ending June 30, 1914-1917.
Date.
1914. 1... ........... 2.............. 3..............4........ .....5..............
6.............. 7..............8..............9..............10..............
11..............12..............13..............14..............15..............
16..............17..............18..............19..............20..............
21..............22..............
24..............25..............
26..............27..............23..............29..............30..............31..............
1915. 1..............2..............3..............4..............5..............
'6..............7..............8..............9..............10..............
11..............12..............13..............14..............15..............
16..............17..............18..............19..............20..............
21..............22..............23..............24..............25..............
26..............27..............28..............29..............30..............31..............
July.
16.9 19.5 16.914.612.5
20.7
in t\
16 9
14.6
12.5in ^8.48.47.5
6.67 97 ^
6.65.8
6.25.35.85.24.44.4
1821182121
O1
21012121
O1
91
212121
1918171615
1518182121
912121212121
Aug.
3.34.4 8.46.25.8
5.2
4.03 0
4.0
4.0
20.7
16 9
19 f\7 K,5.84.8
4.84.03 0
2.74.0
2 12 12 12.15.85.8
1818212191
91
2191
2191
2121212121
21212191
91
2191
21
2191
91
2121
Sept.
5.2 3.7 4.84.83.7
3.0 6.26.2>; 96 9
7 97.07 96.24.8
4.03 77 9
11.57.0
S ty
4.43 0
2 71.8
i a1.81 9
1.21.2
212191
2121
91911Q10
18
1716171716
16172191
1Q18171616
1621211Q
18
Oct.
0.9 .9 .9.9
.5
.51.51 22 1
1.5g
.7
.5FJ
1 ^1.2
g.7
.5
.5
.55
.5
.5g
.2
21
91
1818
91
2191
2191
18171514IS
17171 ft
1716
16151410
13
111818171518
Nov.
"i'l.5'
18.313.6
10.5 7.05.2
20.120.1
20.115.212.0
12.0
9n i
16.3
20 114.613.613.612.5
19 ^
9 88.47.5
18161413
109 0
9 0
8.88.4
8.48.47 97 9
21
21171491
21
1918182121
91
21
91
21
Dec.
6.6 9.8 9.8
10.520.7
20.7 20.720.720.119.5
16 914.112.511.520.7
20.720.79n 716.914.1
12.5
15.714.112.5
in ^9 0
7 96.66.26.2
1918161518
16151310
1ft
2118
16i ^131021
2118161521
21
1817
Jan.
5.2 4.4 4.0
1021
17109.3
9191
182191
1817
101410
11
8.821211714
108.8
11212117
1515162121
17151 1\1313
91
17151Q
11
10Q °!
8 A
7 *7.0
6.612121111
108.88.47.97.07.6
Feb.
15 13 10119.8
9.38.48.47.57.0
6.66.26.26.25.2
5.24.84.03.33.0
3 fi
3.09 7
2.42.4
2.02.01.8
1616139 0
16
161 ^
151419
2191
212117
1717212121
1716151514
1010
Q 8
Mar.
1.5 1.2.9.9.9
.9
.9
.9
.917
127.0
16149.3
6.611106.24.8
4.44.03 0
2.718
17118.4
101710
7 *>6.6
101010
141414
11
8.49 Q
9 0
91
21
171410
9 0
8.8
7.56.66.66.66.6
5.85.84.84.84.84.4
Apr.
7.0 11 7.97.07.0
5.2 16141111
16117.95.24.4
3.73.33.3
2121
2121212121
1613119.88.4
17151°,
108.4
7 <i8.48.4
2121
2118163310
10
181821
1821211818
21181818
May.
7.0 6.65.89.8
21
2121211721
2121212121
2121212121
2117171515
151421171515
1716151313
109 89.89.3
16
1818161010
10109 0
9.39.3
9.39.39.39.39.1
7.07.07.67.65.85.8
June.
17 17 161621
18 17162121
2118171616
1521212121
1821212121
2121182118
5.210
Q R7 Q5.2
5.24.84.84.84.8
4.84.84.86 O
5.8
9.3129 29 2
13
128.4
212118
182117119.8

ISLAND OP HAWAII. 175
Daily discharge, in million gallons, of Kohala ditch at Awini weir, near Kohala, Hawaii, for the years ending June 30, 1914-1917 Continued.
Day.
1916. 1. .............2..............3..............4..............5..............
6..............7..............8..............9..............10..............
11..............12..............13..............14..............15..............
16..............17..............18..............19..............20..............
21..............22..............23..............24..............25..............
26..............27..............28..............29..............30..............31..............
1917. 1. .............2..............3..............4..............5..............
6..............7..............8..............9..............10..............
11..............12..............13..............14..............15..............
16..............17..............18..............19..............20..............
21..............22..............23..............24..............25..............
26..............27..............28..............29..............30..............31..............
July.
1716131013
it;16
16
1413111114
2121161110
8.47.09 39.36.6
6.61116
1316
20.716 911.0
12.5
19 <\
11.0in «,9.89.3
14.612.511.020.7
18.920.720.718.916.9
14.614.612.511.09 3
9.320.720.716.920.720.7
Aug.
1414161615
14118.47 96.6
6.65.85.85 9
5.2
5.24.84.44.44.0
4.04.44.84.44.0
4.04.04.04.04.04.0
20.720.720.720.716.9
14.614.618.316.916.9
20.720.720.720.720.7
16.915.720.716.914.1
12.510.58.87.97 t;
7.57.57.57 97.97.9
Sept.
3.33.33.33.33.3
3.32.72 7
2 n
2.0
2.04.85 0
3.33.7
5.23.33.03.07.0
5.85.2C O
2.79 7
2 A5.8
14it;21
7.520.714.619 5
10.5
9.314.6
10.511.0
9.89.88.87.96.6
5.84.85.816 914.6
10.59.39.39.310.5
9.39.39.39.38.8
Oct.
212115107.9C O
5.24.44.46.6
9 38.86.24.43.7
3.73.02.73.73.7
1414
2117
131321
2121
9.38.47.56.65.8
5.24.84.84.83.7
3.33.33.33.33.3
3.32.72.42.72.7
2.72.73.35.84.8
6.66.66.65.26.610.5
Nov.
1717172117
1513101717
17151 1;it;17
1511132121
2117141210
108.810108.8
16.914.111.07 97.9
14.612.58.86.64.0
3.73.73.33.33.3
16.914.110.59.37.0
6.26.26.25.24.4
5.88.414.69.36.6
Dec.
8.45.7
211714
1221171412
12108.47 97.0
7.99.39.39.3
21
2121171410
2117121014
5.85.216.912.58.8
6.65.24.43.720.7
16.912.511.08.48.8
10.516.920.720.720.7
20.720.720.720.716.9
14 611 0n.o20.720.715.7
Jan.
11121421
171521
21
2117it;1817
1517212121
1715121010
181012109.88.8
12.510.58.820.720.7
18.916.914.111.09.8
10.59.810.58.47.4
7.07.07.06.66.6
6.26.25.85.85.8
5.85.85.85.810.58.4
Feb.
7.57.57.55.24.4
3.73.73.03.03.0
2.42.19 1
2.11.8
1.51.51.51.51.5
1.51.51.51.2
9107.94.8
7.96.26.24.84.8
4.04.04.03.33.3
3.33.03.03.33.3
3.33.02.72.72.5
10.57.95.84.04.0
3.33.316.9
-------
Mar.
4.44.43.33.012
129 35.23.0
3.03.0181721
1510108.48.4
7.09.3128.88.8
8.88.88.86.28.8
" 8.8
14.611.516.914.611.5
9.37.55.24.84.4
4.87.06.27.96.6
9.87.56.66.64.4
4.44.03.715.711.0
7.47.47.48.820.716.9
Apr.
6.26.26.25.84.8
4.44.44.01714
107.54.03.717
1614142121'
2117121615
1412212121
20.711.511.011.011.5
11.513.612.08.49.3
11.011.58.87.511.0
11.513.611.513.612.0
12.012.512. "511.08.4
5.85.87.55.811.0
May.
21219191
2101
91
1817161514
1216141212
109.812109 g
9 37.97.5161717
13.69.86.64.44.4
2.72.72.12.12.1
2.12.12.12.72.7
2.14.810.512.59.3
9.314.110.59.88.4
6.26.24.84.84.84.4
June.
2121212118
1612109.38.8
7 Q18162118
1718211818
2121211817
2121212121
4.07.05.86.25.2
3.75.210.510.59.8
9.89.87.96.25.2
3.73.31.55.25.2
5.27.98.411.09.3
5.23.73.73.73.3
NOTE, No flow Oct. 29 to Nov. 2, 1913.

176 SURFACE WATER SUPPLY OF HAWAII, 1916-11.
Monthly discharge of Kohala ditch at Awini weir, near Kohala, Hawaii, for years ending June 30, 1914-1917.
' Month.
1914. July.................................
December. ........................
May.................................
The year. . ....................
1915. July.................................
The year. .....................
1916. July.................................
October. . ...........................
February. ..........................
May.................................
The year. .....................
1917. July................................
April... .............................May................................
Discharge.
Million gallons per day.
Maximum.
20.7 20.7 11.5 2.1
20.1 20.7 21 15 18 21 21 21
21 21 21 21 21 21 21 21 21 21 18 21
21
21 16 21 21 21 21 21 10 21 21 21 21
21
20.7 20.7 20.7 10.5 16.9 20.7 20.7 16.9 20.7 20.7 14.1 11.0
20.7
Minimum.
4.4 2.1 1.2 .2
5.2 6.2 4.0 1.8 .9
3.3 5.8
15
1518 16 11 7.9
10 6.6 9.3 4.4 7.5 5.8 4.8
4.4
3.6 4.0 2.0 2.7 8.8 5.7 8.8 .9
3.0 3.7 7.5 7.9
.9
9.37.5 4.8 2.4 3.3 3.7 5.8 2.5 3.7 5.8 2.1 1.5
1.5
Mean.
11.36.85 4.72 .80
14.2 14.2 14.4 6.05 7.38 12.0 17.5 18.9
19.8 20.8 18.7 17.4 15.9 17.0 12.3 16.2 9.89
16.3 10.8 9.96
15.4
13.4 7.09 4.97
10.9 14.8 13.6 15.5 3.33 8.98
12.4 15.6 17.8
11.6
15.114.9 10.3 4.92 8.41
13.9 9.57 4.80 8.87
10.8 5.96 6.24
9.53
Second- feet
(mean).
17.5 10.6 7.30 1.24
22.0 22.0 22.3 9.36
11.4 18,6 27.1 29.2
30.6 32.2 28.9 26.9 24.6 26.3 19.0 25.1 15.3 25.2 16.7 15.4
23.8
20.7 11.0 7.69
16.9 22.9 21.0 24.0 5.15
13.9 19.2 24.1 27.5
17.9
23.4 23.1 15.9 7.61
13.0 21.5 14.8 7.43
13.7 16.7 9.22 9.65
14.7
Total run-off.
Million gallons.
350212 142 22
396 440 448 169 229 359 543 568
3,880
613 645 562 539477 527 382 454 306 488 336 299
5,630
414 220 149 337 443 422 481 97
278 371 482 534
4,230
470 462 309 153 252 430 297 134 275 325 185 187
3,480
Acre- feet.
1,080 652 435 69
1,220 1,350 1,370
520 702
1,100 1,660 1,740
11,900
1,880 1,980 1,720 1,660 1,460 1,620 1,170 1,390
941 1,500 1,030
917
17,300
1,270 675 458
1,040 1,360 1,290 1,470
297 854
1,140 1,480 1,640
13,000
1,440 1,420
948 468 774
1,320 910 412 844 994 567 574
10,700
KOHALA DITCH AT NTOLII WEIR, NEAR KOHALA, HAW AH.
LOCATION. At elevation 1,000 feet, 3J miles south of Niulii, Kohala district.RECORDS AVAILABLE. July 1, 1907, to June 30, 1917.GAGE. Vertical staff showing head on weir.DISCHARGE MEASUREMENTS. Measured by sharp-crested weir consisting of three
5-foot panels. EXTREMES OP DISCHARGE. See monthly-discharge table.

ISLAND OF HAW AH. 177
UTILIZATION. For irrigation of sugar cane and for domestic supply.ACCURACY. Records good.COOPERATION. Records furnished by Kohala Ditch Go.
Daily discharge, in million gallons, of Kohala ditch at Niulii weir, near Kohala, Hawaii, for the years ending June 30, 1914-1917.
Date.
1914. 1....... .......2..............3..............4..............5..............
ti. ...... .......7..............8.... ..........9..............10..............
11..............12..............13..............14..............15..............
16..............17..............18..............19..............20..............
21..............22..............23..............24..............25..............
26..............27..............28..............29..............30..............31..............
1915. 1. .............2..............3..............4..............5..............
6..............7..............8..............9..............10..............
11..............12..............13..............14..............15..............
16..............17..............18..............id20..............
21..............22..............23..............24..............25..............
26..............27..............28..............29..............30..............31..............
July.
10.68.010.612.8M Q
6.86.810.612.812.4
11.512.810.612.812.8
10.311.513.612.812.1
12.214.014.513.010.7
12.611.511.512.111.311.3
2727272727
2727272727
2727272727
2727272727
2727272727
2797
27272727
Aug.
9.910.212.011. «11.5
10.69.29.29.29.2
9.210.66.86.810.6
12.312.812.110.79.9
9.99.29.29.29.2
9.18.58.59.110.010.0
2727272727
2727272727
2727272797
2727272727
2727272797
2797
2797
2727
Sept.
9.58.28.58.58.2
8.2W O
11.110.611.1
14.011.711.69.68.5
7.87.514.016.010.2
8.88.17.27.26.9
7.56.96.57.47.4
2727272727
2727272727
272797
2727
272727 2797
2727279797
9797
2797
27
Oct.
6.86.36.36.87.3
7.36.77.17.414.4
8.49.08.07.37.3
6.26.56.87.17.3
7.37.37.38.28.2
6.76.87.06.66.66.6
2727272727
2727272727
272797
2797
2727279797
9797
279494
24O7
2797
2727
Nov.
6.06.014.79.113.9
10.69.58.16.17.4
7.47.412.313.311.5
11.67.47.47.4
11.1
7.412.813.913.914.9
14.916.513.812.8U q
2727272727
2727272623
23232222O7
2727279797
9797
279797
272797
2797
Dec.
9.913.012.213.16.8
6.86.86.87.48.0
10.613.314.916.06.8
6.86.86.810.613.3
14.915.611.713.312.8
13.112.211.611.411.111.1
2727272727
2727272727
27279797 *
27
2797979797
9797
2797
2797
97
272797
27
Jan.
1616142427
2724232727
2727272727
2427272527
2427272727
242425272727
2727272727
2727272727
272797
2797
272727oe
94
2425269fi97
oe
249499
2019
Feb.
2725242724
2221211916
1616161615
1614131312
1212111111
111111
2727242027
2727272727
2727272797
27272797
279797
279797
OK
2726
Mar.
9.99.38.68.68.6
8.68.68.68.6
27
2316272720
1624211513
1312119.9
27
272320242724
2423242424
2727272724
222594
2797
2727272524Oo
22229999
«V|
91
19191918
Apr.
1827221818
1627272625
27252016 15
1413132727
2727272727
27262423id
2727
242120
1920202427
2727979499
2297
279797
97
279797
27
979797
2707
May.
IS18162027
2727272727
2727272727
2727272727
2727272727
272727279797
27272797
27
2500
262427
2797
2600
25
2525259999
9999999*>
20
1919is1Q
1717
June.
2727272797
2797
272797
2797
272727
272797
2727
272797
2797
27272797
27
162494
2016
1616161616
1616161917
239fi99oo97
2620979797
2797O7
2424
40532° 18 WSP 46

178
Daily di,
SURFACE WATER SUPPLY OF HAWAII, 1916-11.
, in million gallons, of Kohala ditch at Niulii weir, mear Kohala, Hawaii, for the years ending June 30, 1914-1917 Continued.
Day.
1916. 1..... .........2..............3..............4.............5..............
6..............7..............8..............9..............10..............
11..............12..............13..............14..............15..............
16..............17..............18..............19..............20..............
21..............22..............90.
24..............25..............
26..............27..............28..............29..............
01
1917. 1. .............2..............3..............4..............5..............
6..............7..............8..............9..............10..............
11..............12..............13..............14..............15..............
16..............17..............18..............19..............20..............
21..............22..............23..............24..............25..............
26..............27..............28..............29..............on
31........?.....
July.
2797252326
9727279797
2726249497
972797
00.
20189n
179497942697
97 497 497 497 497 4
97 497 4
90 ft
22.0
97 497 423.697 497 4
97 497 427.427.497 4
27.497 4
24.422.8
22.897 427.427.4 27.427.4
Aug.
2797272727
272722
19
1917171616
1616151514
1415161514
141414141414
27.427.497 427.497 4
27.427.497 427.4
27.497 427.497 497 4
97 497 427.427.497 4
27.497 4
27.421.1
20.3
20.321.1 21.121.1
Sept.
131 3
131313
10
12121111
1116171415
161410
139n
1616161212
1116242697
19.527.497 422.897 4
99 027.494 422.823.6
22.099 n
to n
15.714.615.727.497 4
22.8
99 n22.023.6
22.0
22.022.090 3
Oct.
2797272418
1515131°.
19
91
90
161514
14
iq
1414
2797or
97
27
9497
97
97
9797
90 «
22.09O ^1C C
iff 9
16.515.715.715.714.6
10 Q
13 9
14.6
14.610 9
12.5to 9109
10 91Q Q
in c
15.7
17.218.018.016.5 ic n24.4
Nov.
2727272727
2727252727
9727279727
2726972797
9797272727
252497269K
27.497 490 A
91 191 1
27 497 490 oIQ C
15.7
14.6109
10 910 Q
27.427.426.190 3ic fl
15.715.715.7
13.9
10 0
97 423.6179
Dec.
2422272727
2727272725
2524222120
2124942497
9797279723
279797242497
16.515.727.427.494 4
1C C
17.215.714.697 4
97 497 49K 0.
1Q C
22.8
9K q
27.497 497 427.4
97 427.497 497 427.4
97 49K q9K q
27.497 427.4
Jan.
2625272727;
2727272727
2727272727
2727272797
9727972727
279727272694
97 494 422.897 497 4
97 497 497 49q «99 H
9K q9q fi
94 4
21.19O 3
1O £.
IQ £.
19.518.81C C
18.0ic n 17.217 917.2
17.217.217927.491 1
Feb.
2222222019
1818161616
1615141413
1212121212
1212191211
1197
. 2216
16.516.513.913.9
iq 913.2iq 919 £.12.5
11 911.916.51 c 7
15.7iq niq 913.219 £.
27.4
15.7
13.2
11.911 997 4
-------
Mar.
1616141326
2624
201613
1313272727
2724241919
1720262323
239°.
23169q9q
27.424.497 497 d25.3
99 718.815.714.6iq A
14.691 1
16.599 nic n
24.499 n18.019.516.5
14.6
10 f>
97 424.4
18.891 1
22.097 d27.4
Apr.
1817171615
141413
. 2727
2317141327
2727272727
97979K
27
269K972797
97 4
94 49q «
23 694 4
24.497 4
9O 399 H
9q «94 4.91 1in c9q c
94 497 494 497 4oc q
9K q
27.497 490 ft90 3
18.0ic nIQ f»18.0 90 «
May.
2727272727
2727 272727
2727272727
27.27272727
9727262727
26OK
242797
97
97 4
10 n
15.715.7
iq Qiq Q
iq 9
iq 9lo 9
10 9
iq 9
10 91^ Q10 Q
13910 ft
94 497 424.4
99 fl27.4
9q ft
91 1
16.516.5
14.6
13.9
June.
2727272727
2727262594
o/l97272797
2797272797
9727272797
9797979797
14.619.517 910 A
16.5
13 916.094 d24.4OO. ft
9°, fi23 690 Q17.216.5
13 9iq i)Q a15.716.5
15.79n ^99 n97 422.8
15.7IQ n10 Q
13.9 13.2

ISLAND OF HAWAII. 179
Monthly discharge of Kohala ditch at Niulii weir, near Kohala, Hawaii, for years endingJune 30, 1914-17.
Month.
Discharge.
Million gallons per day.
Maximum. Minimum. Mean
Second- feet
(mean).
Total run-off.
Million gallons.
Acre- feet.
1914. July.................August..............September...........October..............November...........December............January..............February............March...............April................May.................June.................
The year.......
1915.July.................August..............September...........October..............November...........December............January..............February............March...............April................May.................June.................
The year.......
1916.July.................August..............September...........October..............November...........December............January..............February............March...............April................May.................June.................
The year.......
1917.July.................August..............September...........October..............November...........December............January..............February............March...............April................May.................June.................
The year.......
14.912.816.014.416.515.627.027.027.027.027.027.0
27.0
27
27.427.427.424.427.427.427.427.427.427.427.427.4
27.4
6.56.26.06.8
14118.6
131627
11.79.899.307.38
10.710.825.016.517.022.525.827.0
18.115.314.411.416.616.738.725.526.334.839.941.8
16.1
27.027.027.026.726.227.025.726.523.725.223.321.3
41.841.841.841.340.541.839.841.036.739.036.133.0
16
22.020.314.612.513.214.617.211.913.218.013.2
24.518.415.020.826.625.126.815.720.822.426.826.7
22.5
26.425.922.216.320.024.521.815.120.623.517.717.9
21.0
37.928.523.232.241.238.841.524.332.234.741.541.3
40.840.134.325.230.937.933.723.431.936.427.427.7
32.5
362306279229320336776463526675801810
837837810828787837797743734756722640
9,330
759570449644799779830456644672830801
8,230
819803665506601760677422639705550537
1.110941856702985
1,0302.3801,4201,6202,0702,4502,490
18,100
2,5702.5702,4902,5402.4102,5702,4402,2802,2502,3202,2201,960
2,3301,7501,3801,9802,4502,3902,5501,4001,9802,0602.5502,460
25,300
2,5102,4602,0401,5501,8402.3302,0701,3001,9602,1601,6801,650
23,600

180 SURFACE WATER SUPPLY OF HAWAII, 1916-17.
KAINFALL.
GENERAL CONDITIONS.
The rainfall of the Hawaiian Islands is extremely variable, ranging from a few inches at several low-level, leeward localities to nearly 600 inches per annum, at elevations exceeding 2,000 feet on the windward sides of the islands. Valleys on the same sides of the islands and within a few miles of each other may have a variation in mean annual precipitation of several hundred per cent. The rainfall may also vary greatly in the same valley at different eleva tions. As a rule the zones of heaviest precipitation are on the windward sides of the islands, 2,000 to 3,000 feet above sea level.
Most of the daily rain gages maintained by the United States Weather Bureau are at low levels. Lack of funds and the absence of residents have prevented the bureau from maintaining stations at high levels, but it obtains a number of daily records from occu pants and caretakers of mountain houses and ranches. The data furnished by the Weather Bureau are therefore generally of little value in determining stream run-off.
When high levels have been accessible and funds available high- level rain gages, which are read at monthly, bimonthly, or longer intervals, have been established by this office and some valuable rec ords obtained. To determine the precipitation throughout the Territory accurately would require the installation of thousands of gages and the construction of hundreds of miles of trails. For this reason and because of the extreme and variable porosity of the soil, it is impossible to determine any consistent relation between rainfall and stream run-off.
Acknowledgment for cooperation in furnishing rainfall data is due the following companies and individuals:
Kauai: Kekaha Sugar Co.; Hawaiian Sugar Co.; Grove Farm Plantation; W. F. Sanborn, of Princeville Ranch; Kauai Electric Co.; J.McClellan.
Oahu: F. Meyer; United States Army; Koolau Agricultural Co.; Hawaii Preserving Co.
Maui: Wailuku Sugar Co.; Honolua Ranch; Hawaiian Commer cial & Sugar Co.; Maui Board of Supervisors; Pioneer Mill Co.; Olowalu Sugar Co.
Hawaii: Hawaii Mill Co.; W. S. May; C. F. Clark; C. R. Willard; Honokaa Sugar Co.; Pacific Sugar Mill; Hawaiian Irrigation Co.; Kukaiau Ranch Co.; Waiakea Sugar Co.
The tables on pages 185-188 show the precipitation at stations main tained by the Geological Survey and precipitation data furnished from private sources which are not included in United States Weather Bureau records, to which those interested in further data are referred.

RAINFALL. 181
RAINFALL STATIONS IN HAWAII.
KATTAI.
1. Waialeale, on summit of ridge at headwaters of Hanapepe, Wainiha, Hanalei ) and Olokele streams, and North and South forks of Wailua River; about 25 miles by road and trail northeast of Waimea; 5,075 feet above sea level.
2. Intake of Kauai Electric Co.'s canal, 6 miles back of Hanalei; 700 feet above sea level; records furnished by Kauai Electric Co.
3. About 50 feet below Kauai Electric Co.'s power house, at tailrace, 7 miles west of Hanalei; 125 feet above sea level; records furnished by Kauai Electric Co.
4. Summit Camp (Wainiha Ridge), Hanalei; about 30 feet southwest of house at Summit camp on power line; 6 miles from Kapaka; 1,900 feet above sea level; gage read by employee of Kauai Electric Co.
5. Kapaka, at lineman's camp, about 50 feet north of house, and 5 miles south of Hanalei; 635 feet above sea level; gage read by employee of Kauai Electric Co.
6. About 40 feet north of Sanborn's residence, 2 miles from Hanalei; 105 feet above sea level; records furnished by Princeville ranch.
7. Pilaa, about 200 feet north of Government road and 200 feet west of assistant over- Beer's house; about 2 miles south of Kilauea; 300 feet above sea level. Gage read by Mr. Buch, an employee of Kilauea Sugar Plantation Co.
8. Kaloko, on embankment of Kaloko reservoir about 3 miles southeast of Kilauea; 740 feet above sea level. Gage read by Mr. Buch, an employee of Kilauea Sugar Plantation Co.
9. Residence of W. S. Newhin, about 4^ miles west of Kapaa; 375 feet above sea level.
10. Mount Nonou, near house of Elmer M. Cheatham on west slope of Mount Nonou, about 4 miles west of Kapaa; 350 feet above sea level.
11. North Wailua, at stream-gaging station on North Wailua River, about 1 mile upstream from Kanaha ditch intake, and about 10 miles northwest of Lihue; 650 feet above sea level.
12. Waiahi, on South Wailua River, near Lihue Electric Co.'s power plant, 7 miles from Lihue; 600 feet above sea level.
13. Aakukui, near plantation camp, about 5 miles southwest of Lihue; 350 feet above sea level; records furnished by Grove Farm.
14. Reservoir No. 6, on Grove Farm Plantation, about 5 miles west of Lihue; 400 feet above sea level.
15. At ditchman's house, 500 feet west of Papuaa Reservoir, 6 miles west of Lihue; 500 feet above sea level.
16. Hiloa-Manawaiopuna divide, on ridge between east and west branches of Hanapepe Stream, about 10 miles northeast of Eleele; 2,080 feet above sea level.
17. Hanapepe Valley, on the .left bank of Hanapepe ditch, 3 miles above Koula, and about 8 miles north of Eleele; 530 feet above sea level; records furnished by Hawaiian Sugar Co.
18. Camp No. 2, about 2 miles northwest of Hanapepe and 7 miles southeast of Waimea; 250 feet above sea level; records furnished by Hawaiian Sugar Co.
19. Olokele mauka, on ridge on left side of Olokele Stream above intake of Olokele ditch, and about 18 miles by road and trail from Waimea; 2,100 feet above sea level; records furnished by Hawaiian Sugar Co.
20. Keanakua, near Halekua camp, on ridge about 16 miles by road and trail north east of Waimea; 4,450 feet above sea level.
21. Kahana, near Halekua camp, on ridge about 16 miles by road and trail via Kaholuamanu from Waimea; 3,750 feet above sea level.
22. Kaholuamanu, about 12 miles by road and trail northeast of Waimea; 3,650 feet above sea level.
23. Waimea, in Mr. J. McClellan's yard; 10 feet above sea level; Mr. McClellan aids in obtaining record.

182 SURFACE WATER SUPPLY OF HAWAII, 1916-17.
24. Camp No. 7, about 2 miles northeast of Waimea; 150 feet above sea level; records furnished by Hawaiian Sugar Co.
25. Pali trail, half a mile mauka of Kekaha ditch where trail crosses and about 2 miles mauka from Waimea; 850 feet above sea level; records furnished by Kekaha Sugar Co.
26. Hukipo, 3 miles northwest of Waimea; 400 feet above sea level; records fur nished by Kekaha Sugar Co.
27. Waialae, near Kaholuamanu; 14 miles by road and trail north of Waimea, near Waialae gaging station; 3,600 feet above sea level.
28. Mohiki-Koaie divide, on ridge about 24 miles by road and trail north of Waimea; 3,950 feet above sea level.
29. Mohihi, on ridge at head of Mohihi Valley and about 23 miles by road and trail northeast of Waimea; 3,500 feet above sea level.
30. Kilohana, near Alakai swamp, about 23 miles by road and trail northeast of Waimea; 4,023 feet above sea level.
31. Waiakoali, about 22 miles by road via Halemanu north of Waimea; 3,450 feet above sea level.
32. Paukahana, about 21 miles north of Waimea by road and trail; 3,723 feet above sea level.
33. Lehuamakanoi, about 22 miles by road and trail north of Waimea; 3,932 feet above sea level.
34. Puu Lua, near wagon road from Kekaha to Halemanu, about 12 miles north of Waimea; 3,500 feet above sea level.
35. Kokee, on mesa half a mile above Knudsen's camp, near head of Kokee Stream and about 19 miles north of Waimea; 3,550 feet above sea level.
36. At residence of C. E. French, 3 miles northwest of Kapaa; 350 feet above sea level.
37. At office of Koloa Sugar Co.; 240 feet above sea level.38. At the stream, gaging station on Kalihiwai River, 10 miles from Hanalei via
Kauai Electric Co.'s power line trail; 700 feet above sea level.
OAHU.
1. Nuuanu Pali, on the water reservation, near the Pali road, about 200 yards toward Honolulu, from top of Pali; 1,136 feet above sea level.
2. Manoa, at residence of E. H. Hippie, in upper Manoa Valley, about 500 feet west of highway bridge over the East Branch of Manoa Stream; 300 feet above sea level.
3. Residence of J. K. Maui in upper Kalihi Valley; 550 feet above sea level.4. At elevation 970 feet in upper Kalihi Valley, about 2 miles above Catholic
orphanage.5. Ditch tenders' house at U. S. Army reservoir in upper valley of the South Kaukon-
ahua Stream; 1,200 feet above sea level.6. Wahiawa Water Co.'s intake, about 150 yards downstream on left bank of North
Fork of Kaukonahua Stream from Wahiawa Water Co.'s ditch intake, on trail 8 miles north of Wahiawa; 1,200 feet above sea level. (Described in Water-Supply Paper 430 as at Waialua Agricultural Co.'s ditch intake.)
7. Hawaiian Preserving Co.'s office, Wahiawa; 950 feet above sea level; records are furnished by Hawaiian Preserving Co.
8. Makaha, near Waianae, on property of Waianae plantation; 1,300 feet above sea level; records furnished by F. Meyer, manager Waianae plantation.
9. About 250 feet from Koloa Stream gaging station, 3 miles by trail southwest of Laie; 550 feet above sea level.
10. Ditch and trail tender's house in upper Punaluu Valley, about 2 miles from Punaluu Railroad station; 300 feet above sea level.
11. On left bank of Maole Stream, at head of first falls in Hillebrand Glen, about 2£ miles from end of Nuuanu Valley street car line; 1,200 feet above sea level.

RAINFALL. 183
MAUL
1. In H. B. Penhallow's yard, Wailuku; 300 feet above sea level.2. Yard at Wailuku Sugar Co.'s office, Wailuku; 175 feet above sea level.3. Waikamoi Gulch, on Kula pipe line at reservoir; 3 miles from Olinda and 7 miles
from Makawao; 4,200 feet above sea level.4. Puohakamoa, on Kula pipe line, about 1,000 feet below intake at Puohakamoa
Gulch; 4 miles east of Olinda and 8 miles from Makawao; 4,300 feet above sea level.5. Olinda, on Kula pipe line, 4 miles east of Makawao; 4,000 feet above sea level.6. Olowalu Sugar Co.'s mill in Olowalu; 10 feet above sea level.7. West slope of Puu Kukui at top of left bank of Honokawai Gulch; about 6 miles
east of Kaanapali and 10 miles from Lahaina; 4,300 feet above sea level.8. West slope of Puu Kukui, about one-half of a mile south of Honokawai Gulch;
about 4£ miles east of Kaanapali and 8J miles from Lahaina; 2,500 feet above sea level.9. Honokawai Gulch at junction with Amalu Stream; on trestle supporting Hono
kawai flume about 1,000 feet below intake; about 3J miles from Kaanapali and 7J miles from Lahaina; 1,500 feet above sea level.
10. On ridge between Honokahau and Kahakuloa gulches, beside trail leading to top of Mount Eke; about 12 miles from Honokahau; 2,300 feet above sea level.
11. Honokahau Gulch, at ditchman's house on left bank of stream, 150 feet below ditch intake; about 8 miles from Honokahau; 800 feet above sea level.
12. Rim of extinct crater of Mount Eke; 14 miles by trail from Honokahau; 4,500 feet above sea level.
13. In Waihee Gulch, on bank of Spreckel's ditch; about 5 miles from Wailuku; 275 feet above sea level.
14. Waihee, on roof of building formerly used as plantation office; 3£ miles from Wailuku; 125 feet above sea level.
15. lao Valley, on small plateau or tableland between north and south branches of lao Stream, about 1 mile above the junction; about 4 miles west of Wailuku; 1,500 feet above sea level.
HAWAII.
1. Kemole House, 12 miles southeast of Waimea; 5,500 feet above sea level; records furnished by Parker ranch.
2. Pohakuloa, 20 miles southeast of Waimea; 5,700 feet above sea level; records furnished by Parker ranch.
3. Puuhinei Paddock, 14 miles south of Waimea; 1,500 feet above sea level; records furnished by Parker ranch.
4. Puuanuanu Paddock, 14 miles south-southeast of Waimea; 7,500 feet above sea level; records furnished by Parker ranch.
5. Punohu Paddock, 10 miles east of Waimea; 4,200 feet above sea level; records furnished by Parker ranch.
6. Kaauhuhu, on property of W. S. May, about 3 miles northwest of Hawi; 1,400 feet above sea level; records furnished by W. S. May.
7. Kohala Mountain pipe line, 3 miles north of Waimea; 3,700 feet above sea level; records furnished by Parker ranch.
8. Upper Kawainui, in the Kohala Mountains, near the line of the upper Hamakua ditch, near Kukuihaele; 4,080 feet above sea level; records furnished by Hawaiian Irrigation Co.
9. Lower Kawainui, in Waipio Valley, near the line of the lower Hamakua ditch, near Kukuihaele; 1,040 feet above sea level; records furnished by Hawaiian Irriga tion Co.
10. Upper Alakahi, in Waipio Valley, Kohala Mountains, near the line of the upper Hamakua ditch; 3,870 feet above sea level; records furnished by Hawaiian Irrigation Co.

184 SURFACE WATER SUPPLY OF HAWAII, 1916-17.
11. Lower Alakahi, in Waipio Valley, Kohala Mountains, on the lina of the lower Hamakua ditch, near Kukuihaele; 1,030 feet above sea level; records furnished by Hawaiian Irrigation Co.
12. Upper Koiawe, on the line of the upper Hamakua ditch, Waipio Valley, near Kukuihaele; 3,350 feet above sea level; records furnished by Hawaiian Irrigation Co.
13. Lower Koiawe, near the line of the lower Hamakua ditch in Waipio Valley near Kukuihaele; 1,000 feet above sea level:; records furnished by Hawaiian Irrigation Co.
14. Waimea, in Waipio Valley, along the line of the lower Hamakua ditch, near Kukuihaele; 980 feet above sea level; records furnished by Hawaiian Irrigation Co.
15. Puu Alala; on Upper Hamakua ditch, at eas't boundary of Government land, about 5 miles northeast of Waimea village; 2,800 feet above sea level.
16. Ahuloa homesteads, at ditch tender's house, near the Parker ranch, Honokaa; 2,551 feet above sea level; records furnished by civil engineer's officer of Honokaa Sugar Co. and Pacific Mill.
17. Upper Hope A, on lands of Kukaiau Ranch Co.; 5,000 feet above sea level. Referred to in previous reports as "Upper Hapea."
18. Lower Hope A, on lands of Kukaiau Ranch. Co.; 4,000 feet above sea level. Referred to in previous reports as "Lower Hapea."
19. Kaala, on lands of Kukaiau Ranch Co.; 5,500 feet above sea level.20. Puu Kea, on lands of Kukaiau Ranch Co.; 8,565 feet above sea level.21. Halepuila, on lands of Kukaiau Ranch Co; 6,000 feet above sea level.22. Puu Kihe, on top of Kihe Hill, on the side of Mauna Kea, about 10 miles south
of Kukaiau; 7,822 feet above sea level; records furnished by Kukaiau Ranch Co.23. Umikoa, on property of Kukaiau Ranch Co., near ranch house; 3,400 feet above
sea level; records furnished by Kukaiau Ranch Co.

Rec
ords
of r
ainf
all.
Isla
nd o
f K
auai
.
No. 1 2 3 4 5 6 7 8 9 10 11
12
13 14
15
16 17 18
19
20
21
22
23
Sta
tion
.
Inta
ke
Wai
nih
a po
wer
can
al.
Pow
er h
ouse
, Wai
ni
ha.
Sum
mit
c
a m
]> ,.
H
anal
ei.
San
born
's
hous
e,
Han
alei
. P
ilaa
.... ..........
Kal
ok
o..
... .
......
Mou
nt N
onou
. ....
Nor
th W
ailu
a. ....
Wai
ahi.
.. ...
....
..
Res
ervo
ir N
o. 6
...
Hil
oa-M
anaw
aio-
puna
divi
de.
Han
apep
e V
alle
y. .
Olo
kel
emau
ka.
...
o B
roke
Rec
ords
ava
ilab
le.
Sep
t. 9
, 191
0-Ju
ne 3
0, 1
917
o.
Feb
. 1,
190
7- Ju
ne 3
0, 1
917.
..
.....d
o..
....
....
....
....
....
Sep
t. 1
8, 1
910-
June
30,
191
7.
.....d
o..
....
....
....
....
....
Mar
. 11,
191
0-Ju
ne 3
0, 1
917.
.
June
1, 1
914-
June
30,
191
7...
....
.do
....
....
....
....
....
....
...d
o..
....
....
....
....
....
Feb
. 1,
191
5-Ju
ne 3
0, 1
917.
..
Sep
t. 2
5, 1
914-
June
30,
191
7.
Aug
. 8,
191
0-Ju
ne 3
0, 1
917.
.Ju
ne 1
, 190
9- Ju
ne 3
0, 1
917.
..
Jan
. 1,
191
4-Ju
ne 3
0, 1
917.
. .
July
1, 1
915-
June
30,
191
7.. .
A
ug.
24,
1910
-Jun
e 30
, 191
7.
Jan.
1,
1905
-Jun
e 30
, 191
7...
.....d
o..
....
....
....
....
....
Apr
. 1,
191
1-Ju
ne 3
0, 1
917.
..S
ept.
6, 1
910-
June
30,
191
7. .
Aug
. 1,
191
0-Ju
ne 3
0. 1
917
. .
Jan
. 1,
191
3-Ju
ne 3
0, 1
917.
. .
n re
cord
.
Gag
e.
10:1
................
Rec
ords
fu
rnis
hed
by K
auai
Ele
ctri
c C
o...
...d
o..
....
....
....
.
.....d
o...............
.....d
o...............
Rec
ords
fu
rnis
hed
by W
. F.
San
born
. R
ecor
ds
furn
ishe
d by T
. B
. B
uch.
....
.do
....
....
....
...
Rec
ords
fu
rnis
hed
by E
. M
. Che
atha
m.
2:1
....
....
....
.....
2:1
........ .........
Rec
ords
fu
rnis
hed
by G
rove
Far
m.
....
.do
....
....
......
...
...d
o..
....
....
....
. 2:1
..............
...
Rec
ords
fu
rnis
hed
by H
awai
ian
Sug
ar
Co.
..
...d
o..
....
....
....
...
...d
o..
....
....
.....
2:1
..............
...
2:1
....
....
....
.....
2:1
....
....
....
.....
Rec
ords
fu
rnis
hed
by J
as.
McC
lella
n.
6 Ju
ly 1
4, 1
916-
Aug
.
Rea
ding
s.
Dail
y.....
...d
o.......
...d
o.......
...d
o.......
...d
o.......
...d
o.......
...d
o.......
...d
o.......
Mon
thly
. .
Mon
thly
. .
Dail
y.....
...d
o.......
...d
o.......
Mon
thly
. .
Dail
y.....
...d
o.......
Mon
thly
. .
...d
o.......
Dail
y.....
13, 1
917.
Yea
r en
d
ing
June
30
.
1917
1917
1917
1917
1917
19
17
1917
1917
19
1719
17
1917
1917
19
17
1917
/1
916
\191
7 19
17
1917
1917
19
171Q
17
1917
1917
1917
Pre
cipi
tati
on.
July
.
15.0
0
7.17
14.7
2
9.77
6.
19
3.73
6.00
4.7
10.2
0 3.
50
4.48
2.
50
7.54
21
.80
10.5
6
1.39
11
.20
.15
Aug
.
13.5
1
9.10
12.6
6
8.82
4.
98
3.70
2.25
3.4
9.20
2.
70
3.50
7.
50
6.91
18
.0
9.15
1.28
8.
80 .10
Sep
t.
10.8
2
4.95
11.8
4
6.19
4.
69
8.40
2.30
4.4
11.2
0 3.
50
3.72
11
.55
7.22
18
.2
8.73
1.48
9.
95 .37
cRec
c
Oct
.
12.7
3
9.97
15.8
0
12.4
2 7.
72
5.40
2.42
5.2
11.1
0 6.
42
8.61
10
.56
11.2
5 29
.4
13 9
^
2.53
23
.50
1.90
rd D
e
Nov
.
39.6
8
26.4
3
22.5
4
16.9
0 14
.77
10.4
0
6.62
10.5
15.4
0 9.
38
9.50
14
.61
13.3
3 33
.4
20.3
4
1.94
23
.50
.71
3.1-
20
Dec
.
"37.
00
44.6
6
26.7
2
25.7
5 19
.20
11.4
0
8.71
11.
4
20.8
0 10
.86
11.9
1 11
.61
17.0
1 51
.6
25.8
3
5.15
24
.30
4.50
Jan.
(d)
20.7
3
18.3
9
19.8
3 12
.11
12.1
1
15.8
0
7.4
13.0
0 6.
58
6.76
17
.88
8.88
22
.6
13.8
6
7.04
19
.20
5.77
Feb
.
(d)
6.57
4.32
5.47
3.
93
2.47
2.80
3.6
2.20
4.
86
4.67
3.
04
7.89
9.
6
7.51
4.07
14
.80
3.47
Mar
.
42.9
0
21.1
6
32.9
7
29.4
7 20
.25
19.9
5
24.0
0
19.5
19.5
0 14
.28
14.8
0 16
.10
22.6
3 27
.8
20.0
1
8.30
23
.50
9.24 <J
]
Apr
.
18.7
0
9.80
11.0
0
7.58
4.
61
2.27
5.20
2.7
7.66
5.
52
8.04
3.
92
10.4
3 17
.2 7.88
2.13
12
.30
3.85
Vo
recc
May
.
i2.io 7.86
16.1
6
11.3
5 7.
13
7.23
11.0
0
6.5
12.4
0 6.
63
8.18
9.
82
10.7
8 20
.2
13.9
7
0 18.2
5
3.03
>rd.
June
.
15.4
1
6.63
17.4
5
9.38
7.
38
3.62
5.40
5.5
9.20
4.74
5.63
6.
89
8.40
15
.6 8.51
1.08
9.
50 .23
Yea
r.
6574
.0
175.
0
204.
6
162.
9 11
3.0
90.7
92.5
82
.284
.8
113.
1 14
1.2
79.0
89.8
12
0.5
112.
4 28
7.4
160.
3
36.4
19
8.8
147.
0 14
7.4
89.4
33
.3
00

Rec
ords
of
rain
fall
Con
tinu
ed.
Isla
nd o
f Kau
ai C
ontin
ued.
00
No. 24
25 26 27 28 29
30
31
32
33
34
35
36 37 38
Sta
tion
.
Pali
trai
l.. .
....
...
Moh
iM-K
oaie
di
vi
de.
Mo
hih
i...
....
....
.
Leh
uam
akan
oi. .
. .
Rec
ords
ava
ilabl
e.
Jan.
1, 1
91 4
- Jun
e 30
, 191
7. .
.
Jan.
1, 1
911-
June
30,
191
7. .
.
....
.do
....
....
....
....
....
..Ju
ly 3
1, 1
910-
June
30,
191
7. .
.....d
o......................
June
6, 1
910-
June
30,
191
7. .
June
1, 1
916-
June
30,
191
7. .
July
1, 1
916-
June
30,
191
7. .
.
Gag
e.
Rec
ords
fu
rnis
hed
by H
awai
ian
Su
gar
Co.
R
ecor
ds
furn
ishe
d by
Kek
aha
Suga
r C
o.
....
.do..
....
.........
2*1
2. i
2. i
5:1
.................
2.
I
5:1
.................
2. i
2*1
Rec
ords
fu
rnis
hed
by C
. E
. F
renc
h.
Rec
ords
fu
rnis
hed
by M
. J.
Tev
es.
2.
i
Rea
ding
s.
Dai
ly.-
.--
...d
o.......
...d
o.......
...d
o.......
...d
o.......
...d
o.......
...d
o.......
...d
o.......
...d
o.......
...d
o.......
Mon
thly
. .
Dail
y.....
Yea
r en
d
ing
June
30
.
1917
1917
1917
19
1719
17
1917
1Q17
1 Q
1 7
1917
1917
1917
1917
1917
1917
1917
Pre
cipi
tati
on.
July
.
11.0
0
T.
T.
4.75
4.69
Aug
.
0 T.
T.
3.36
5.08
Sep
t.
0.41
T.
T.
3.75
3.93
Oct
.
1.66
1.40
1.90
4.20
6.03
Nov
.
1.84
.50
1.00
8.80
9.85
Dec
.
5.72
1.85
1.65
10.4
0
10.7
2
Jan. 5.41
5.75
5.95
7.80
6.68
Feb
.
3.02
3.90
3.90
2.80
4.98
Mar
.
8.44
1.40
7.90
20.2
0
14.1
4
Apr
.
2.76
1.55
2.25
3.40
3.69
May
.
3.10
1.50
1.2
5
6.90
6.49
June
.
0.10
0 0 4.00
2.31
Yea
r.
43.5
17.8
25.8
12
2.6
138.
2
127.
9 24
4.0
109.
2 11
5.6
170.
0 55
.6
73.9
80
.4
78.6
a230
. 0
Isla
nd
of
Oah
u.
1 5! 3 4 5 6 7
Kal
ihi.
..... ..
....
.
Arm
y re
serv
oir.
. . .
Co.
's i
ntak
e.
Haw
aii P
rese
rvin
g C
o.
Sep
t. 23
, 191
0-Ju
ne 3
0, 1
917.
May
17,
191
5- Ju
ne 3
0, 1
917.
.S
ept.
8, 1
91 4
- Jun
e 30
, 191
7. .
Feb
. 7,
191
7- J
une
30, 1
917.
. .A
ug. 1
, 191
4-Ju
ne 3
0. 1
917.
.. M
ay 3
0, 1
913-
June
30,
191
7..
May
1,
1913
-Jun
e 30
, 191
7...
21
1 1
0............
....
1 1
0............
....
2 1.
. ...
....
....
....
1 1
0............
....
2
1.. ...............
Rec
ords
fu
rnis
hed
by
Haw
aii
Pre
se
rvin
g C
o.
Dail
y.....
Dail
y.....
Dail
y.....
1917
1917
1917
1917
1917
19
17
1917
5.6
12 9
99
62
10.2
7o
q
i
2.74
17 o
18.8
510
.56
15.3
6 21
9 2.87
6 9
9.15
7.75
9.95
18
.8
1.63
7 3
9 28
11.7
8
12.8
0q
o
7
4.66
8 9
16.5
615
.47
14.8
5 30
4 5.29
16.0
00
Q
A
23.1
4
24.2
3O
K
q
12.4
2
14.0
13.5
612
.65
15.9
0 17
.6
11. 9
2
5.0
344
3O
3.35
6.
0
2.88
30.0
91
on
36.6
17.0
2 36
.1
12.5
8
19 n
15.4
310
.71
14.2 7.03
28
.6
1.68
13 9
1 9
7
S
1 n
O
14.7
8on
o
5.45
3 7
6 90
7.0
5.89
Hq
1.48
131.
116
3.8
150.
3
isi.'
s29
1.0
65.6

8 10
11
Upp
er
Punalu
u
Val
ley.
No.
2.
Aug
. 1, 1
912-
June
30,
191
7...
Oct
. 30,
191
5-Ju
ne 3
0, 1
917.
.A
p*. 2
8, 1
915-
June
30,
191
7..
May
6, 1
916-
June
30,
191
7.. .
by F
. M
eyer
.
1 : 1
0..... ...........
2:1
6...............
...d
o.......
Dail
y.....
1917
1917
1917
1917
3.67
7.36
10.5
5
2.70
10.5
4
14.0
2
2.42
5.45
7.40
9.44
6.24
3.25
10.3
4
15.3
5
6.52
8.85
10.3
1
15.7
8
10.9
3
9.45
16.9
2
25.8
6
14.5
2
8.85
15.0
5
14.0
7
4.36
10.6
56.
07
3.80
13.5
4
14.2
526
.65
34.2
0
9.01
13.7
512
.65
14.4
0
5.89
11.6
59.
57
18.8
0
2.10
3.65
4.55
7.00
81.9
137.
4
iss.
a
Isla
nd,
of M
aul.
1 2 3 4 5 6 7 8 9 10
11 12
13 14
15
Pen
hall
ow's
re
si
denc
e, W
ailu
ku.
Wai
kam
oi G
ulch
..
Puukukui
(upp
er
slop
e).
Puukukui
(low
er
slop
e).
Hon
okaw
ai G
ulch
. H
onok
ahau
Rid
ge.
Hon
okah
au G
ulch
Wai
hee
(upp
er)
. . .
Wai
hee
(low
er) .
. .
lao
Val
ley
Tab
le
land
.
Nov
. 1,
189
6-Ju
ne 3
0, 1
917.
.
May
1. 1
887-
June
30,
191
7.. .
Oct
. 12
, 191
0-Ju
ne 3
0, 1
917.
.
May
1, 1
911-
June
30,
191
7...
Sep
t. 26
, 19
10-J
une
30,
1917
. Ja
n. 1
, 190
7-Ju
ne 3
0, 1
917.
. .
Oct
. 11
, 191
3-Ju
ne 3
0, 1
917.
.
Oct
. 13
, 191
3-Ju
ne 3
0, 1
917.
.
Oct
. 17
, 191
1-M
ar.
14, 1
917.
. M
ar.
10, 1
913-
June
30,
191
7 .
Feb
. 1,
190
7-Ju
ne 3
0, 1
917.
..
Mar
. 10
, 19
13-J
une
30,
1917
. Ju
ly 1
, 19
15-J
une
30, 1
917.
..
Jan.
1. 1
899-
Oct
. 31
, 190
7- .
. Ja
n. 1
, 191
0-Ju
ne 3
0, 1
917.
. .
Apr
. 12
, 19
11-J
une
30,
1917
.
Rec
ords
fu
rnis
hed
by W
ailu
ku S
ugar
C
o.
....
.do
....
....
......
Rec
ords
fu
rnis
hed
by M
aui
Cou
nty
Eng
inee
r.
.....d
o..............
....
.do
....
....
....
..
Rec
ords
fu
rnis
hed
by O
low
alu
Co.
R
ecor
ds
furn
ishe
d by
Pio
neer
Mill
Co.
.....d
o..............
.....d
o..............
9*1
Rec
ords
fu
rnis
hed
by H
onol
ua ra
nch.
5
:1 *
...............
Rec
ords
fu
rnis
hed
by H
. C
. &
S.
Co.
Rec
ords
fu
rnis
hed
by W
ailu
ku S
ugar
Co
. 2
:1..............
...
Dai
ly..
...
...d
o......
...d
o......
...d
o......
...d
o......
...d
o..
....
Mon
thly
. .
...d
o......
...d
o..
....
...d
o......
Dai
ly.....
Mon
thly
. .
Dai
ly.....
...d
o......
1917
1917
19
17
1917
19
17
1917
1917
1917
1917
19
17
1917
1917
19
17
1917
1917
0.54
.68
""."
15
23.0 7.8
9.23
11
.0
11.6
7
25.6
1.
44
1.69
0.24 .06
19.7
3
29.4
3 2.
06
0 33.0
11.4
13.4
17
.77
24.8
.3
9
.80
0 .12
23.2
8
21.6
8 4.
18
.14
20.4
3.2
6.46
9.
6 11
.61
25.4
.3
0
.82
.59
.27
10.9
8
8.79
2.
42
0 21.2
9.9
7.06
9.
4 11
.61
20.0 .4
8
1.10
1.24 .92
43.3
8
37.7
9 7.
50
0 30.6
14.6
14.4
4 11
.6
16.3
4
24.2
1.
74
0
8.75
7.31
«7
5.32
c71.
69
30.1
0 4.
82
c50 29
.6
28. 6
1 27
.0
40.0
8
cSO
.O
7.30
8.43
2.44
2.42
13
.00
12.4
0 4.
43
10.7
2
14.5
8.0
7.30
6.
0 5.
93
11.4
2.
14
2.82
4.22
3.89
6.
49
6.06
5.
15
4.23
8.0
8.0
4.41
6.
8 6.
67
7.2
4.53
4.47
4.14
3.65
10
.12
8.81
6.
00
16.6
3
30.0
6.0
#2.9
6 10
.6
13.-
69
23.4 4.72
6.14
5.32
3.97
20
.44
19.3
6 6.
97
1.05
27.0
9.8
4.6
18.4
2
14.2
4.
17
3.65
0.46 .91
12.3
7
17.4
27.
70 .87
24.0
6.6
21.6
11
.30
32.5
.3
2
.45
0.31 .08
11.4
8
9.68
1.
90
.11
16.0
1.2
4.6
6.23
10.0
.1
6
.79
28.2
24.3
"§3.
" 7
116.
1
136.
2 17
1.3
27.7
31.2
'ill
. 7
a A
ppro
xim
ate.
6 A
dai
ly r
ain g
age
was
mai
ntai
ned
by th
e W
ater
Com
mis
sion
of
Ter
rito
ry o
f Haw
aii a
t th
is s
tati
on
unti
l Ja
n.
1,19
17.
c G
age
over
flow
ed.
d G
age
carr
ied
away
by fr
eshe
t M
ar.
15,1
917.
e M
onth
ly g
age
2 :1
rep
lace
d by "
150
^inc
h" g
age
5:1
Apr
. 28
,191
7.
OO

Rec
ords
of r
ain
fall
Con
tinu
ed
Isla
nd,
of H
awai
i.
No. 1 2 3 4 5 6 7 8 9 10
11
12
13
14
15
16 17 18
19
20
21
22
23
Sta
tion
.
Kem
ole
Hou
se ...
.
Puu
hine
i pad
dock
P
uuan
uan
u
pad
do
ck.
Pun
ohu
padd
ock.
.
Roh
ala
Mou
ntai
n pi
pe li
ne.
Upp
er K
awai
nui.
.
Upp
er A
laka
hi. .
. .
Low
er A
laka
hi. .
. .
Low
er K
oiaw
e ....
Wai
ma.
...........
Ahu
aloa
H
ome
st
eads
. U
pper
Hop
e A
....
Low
er H
ope
A ....
Rec
ords
ava
ilab
le.
Sep
t. 1,
191
4-Ju
ne 3
0, 1
917.
.
....
.do
.....................
....
.do
.....................
....
.do
.....................
Nov
. 1,
191
4-Ju
ne 3
0, 1
917.
.M
ar.
18,
1913
-Jun
e 30
, 19
17 .
Sep
t. 1,
191
4-Ju
ne 3
0, 1
917.
.
Sep
t. 1,
191
0-Ju
ne 3
0, 1
917.
.
....
.do
.....................
Jan.
1, 1
913-
June
30,
191
7.. .
Sep
t. 1,
191
0-Ju
ne 3
0, 1
917.
.Ja
n.
1, 1
912-
June
30,
191
7. .
.S
ept.
1, 1
910-
June
30,
191
7..
Apr
. 1,
191
3-Ju
ne 3
0, 1
917
. .
July
1,
1915
-Jun
e 30
, 191
7...
Jan.
1, 1
912-
June
30,
191
7. .
.
Mar
. 1,
190
2-Ju
ne 3
0, 1
917.
.
Apr
. 1,
190
9-Ju
ne 3
0, 1
917.
.Ja
n.
14, 1
913-
June
30,
191
7. .
June
1, 1
914-
June
30,
191
7. .
Dec
. 1,
191
4- Ju
ne 3
0, 1
917.
.. M
ar.
1 , 1
903-
June
30,
191
7 . .
Ja
n. 1
, 189
5- Ju
ne 3
0, 1
917.
. .
Gag
e.
Rec
ords
fu
rnis
hed
by P
arke
r ra
nch.
.....d
o.. .........
...
.....d
o............
....
...d
o..
....
....
....
.....d
o............
..R
ecor
ds
furn
ishe
d by
W.
S.
May
, H
awi.
R
ecor
ds
furn
ishe
d by P
arke
r ra
nch.
R
ecor
ds
furn
ishe
d by
Haw
aiia
n Ir
ri
gati
on C
o.
.....d
o.. ............
.....d
o..............
....
.do..
....
....
....
....
.do..
....
....
....
....
.do..
....
....
....
....
.do..
....
....
....
.....d
o............
....
...d
o..
....
....
....
Rec
ords
fu
rnis
hed
by K
ukai
au ra
nch.
..
...d
o..
....
....
....
.....d
o............
....
...d
o..
....
....
....
....
.do..
....
........
....
.do..
....
....
....
.....d
o............
..
Rea
ding
s.
Mon
thly
. .
...d
o......
...d
o......
...d
o......
...d
o......
Dail
y.....
Mon
thly
. .
Dail
y.....
...d
o......
...d
o......
...d
o......
...d
o......
...d
o......
...d
o.......
...d
o......
...d
o......
Irre
gu
lar.
.
...d
o......
...d
o......
Mon
thly
. .
...d
o..
....
...d
o......
Dail
y.....
Yea
r en
d
ing
June
30
.
1917
1917
19
17
1917
1917
19
17
1917
1917
1917
1917
19
17
1917
19
17
1917
19
17
1917
1917
1917
19
17
1917
19
17
1917
19
17
Pre
cipi
tati
on.
July
.
4.0
0 0 .8 4.0
4.75
10.0
18.8
0
14.3
218
.68
8.48
13
.91
7.74
2.
14
4.71
7.
00
0 .75
.84
""."
69
Aug
.
0.8 .4
2.4
4.0
1.6
4.47
10.0
19.5
5
10.3
4 15
.27
7.63
10
.85
6.71
3.
95
3.95
5.
61 .82
0 2.59
"i.'5
3
.50
2.73
Sep
t.
0.8
0 .6 1.2
3.40
7.0
13.4
8
7.89
11
.61
5.36
7.
79
5.31
2.
14
2.98
3.
59 .25
1.18
1.
24
.05
.30
.20
.25
Oct
.
1.8
2.2
2.8
2.0
2.4
1.90
5.0
8.06
4.85
6.
66
3.30
4.
67
2.51
.7
8 2.
18
.25
.60
.25
1.07
"Too
""."
57
Nov
.
2.8
0 1.2
2.0
3.5
2.01
8.8
10.2
8
8.59
7.
58
6.66
5.
89
4.00
2.
64
6.69
6.
55
4.30
5.30
6.
96
3.00
4.
41
6.40
7.
84
Dec
.
3.2
34.2
3.
4 3.
8
15.0
8.
50
21.5
27.4
9
28.9
3 25
.22
22.6
4 20
.03
18.4
4 16
.80
29.4
8 39
.00
16.6
5
2400
16
.62
9.80
18
.12
17.1
0 34
.55
Jan. 2.4
1.6
2.0
1.6
2.6
5.97
16.0
5.46
3.61
3.76
2.
77
3.26
2.
32
.42
2.97
2.
78
0 0 2.40
"2."
65
.30
1.80
Feb
.
1.0 .8
2.1
1.5
3.4
5.14
4.0
5.86
8.21
5.
56
6.01
4.
64
5.00
3.
47
6.41
7.
65
3.10
2.20
4.
00""
."io
5.24
Mar
.
6.5 .8
2.8
7.0
14.5
10.8
10.4
8
3.92
10
.03
3.35
6.
62
2.19
.8
0 6.
42
2.10
4.11
3.80
3.
45
3.40
5.
15
9.70
3.
51
Apr
.
3.5
10.2
.1
9.
1
2.5
4.19
5.5
11.9
9
15.0
0 13
.72
10.2
8 12
.49
7.69
4.
50
12.3
1 3.
41
3.81
4.20
2.
30
4.20
2.
40
2.00
1.
36
May
.
6.0
6.2
6.1
9.4
2.4
5.95
8.0
8.00
4.54
8.
12
4.24
6.
34
3.15
.0
5 4.
57
.87
6.42 .8
0 4.
26
3.90
6.
00
4.90
3.
99
June
.
2.4 .2
.7
3.2
1.8
3.50
10.0
12.1
8
7.72
11
.55
5.66
7.
87
4.13
4.
81
4.47
1.
06
0 0 .47
0 .14
0 .46
Yea
r.
' 35
.2
56.6
24
.2
54.9
116.
6
151.
6
117.
9 13
7.8
88.4
10
4.4
69.2
43
.1
87.1
79
.9
46.8
......
63.0
00 oo

INDEX.
A.
Accuracy of data and results, degrees of...... 22Acre-foot, definition of....................... 16
equivalent of............................ 17Alo Stream near Huelo, Maui.............. 156-158Anahola ditch near Kealia, Kauai........ 64-66,79
River near Kealia, Kauai................ 63-64Authority for investigations.................. 7-8
B.
Bridge gaging station, description of......... 15
C.
Cable gaging station, description of.......... 15China ditch near Hanalei, Kauai............ 70-72Clark, C. F., cooperation by................. 180College of Hawaii, Oahu, Manoa Stream at.. 83-84 Computing discharge and run-off, methods of 18-21 Cooperation by Hawaii...................... 9
by various parties....................... 9-10Current mpter, pentar-recording, description of 11
D. Definition of terms.......................... 15-17Discharge, table for converting, into run-off.. 17 Discharge and run-off, computing and study
ing of............................ 18-21
E.
East Manoa ditch, Oahu, discharge of....... llgEast Maui Irrigation Co., cooperation by.... 10East Wailuaiki Stream near Keanae, Maui. 145-147 East Wailuanui Stream near Keariae, Maui. 148-150 Eleele, Kauai, Hanapepe ditch near......... 48-49
Hanapepe River near................... 46-47Equivalents, convenient..................... 17
G.
Gaging stations, classes of................ 11,14-15list of.................................... 22-28
Gaging streams, process of................... 15Grove Farm Plantation, cooperation by..... 180
H.
Haiku ditch near Huelo, Maui............. 170-171Haiku Stream near Heeia, Oahu............. 90-91Haipuaena Stream near Huelo, Maui...... 153-154Hamakua ditches, Upper and Lower, near
Kukuihaele, Hawaii........... 171-173Hanalei, Kauai, China ditch near............ 70-72
Lumahai River near..................... 73-75Kalihiwai River near.................... 66-67Kuna ditch near......................... 72-73Waioli Stream near...................... 75-76
Hanalei River near Hanalei, Kauai.......... 67-70Hanamanlu ditch near Lihue, Kauai........ 52-53
Hanapepe ditch near Eleele, Kauai.......... 48-49near Hanapepe, Kauai.................. 49-50
Hanapepe River near Eleele, Kauai......... 46-47Hauula, Oahu, Kaluanui Stream near...... 98-100Hawaii Island, gaging-station records on... 171-179
gaging stations on....................... 27-28rainfall records on....................... 188rainfall stations on..................... 183-184
Hawaii Mill Co., cooperation by............. 180Hawaii Preserving Co., cooperation by...... 180Hawaiian Commercial & Sugar Co., coopera
tion by.......................... 180Hawaiian Irrigation Co., cooperation by..... 180Hawaiian Sugar Co., cooperation by........ 10,180Heeia, Oahu, Haiku Stream near....... .... 90-91Honokaa Sugar Co., cooperation by.......... 180Honokahau, Maui, Honolua Stream near.. 122-123 Honokahau Stream near Honokahau, Maui 120-122 Honokawai ditch near Lahaina, Maui..... 125-126Honokawai Stream near Lahaina, Maui... 123-124 Honolua Ranch, cooperation by............ 10,180Honolua Stream near Honokahau, Maui.. 122-123 Honolulu, Oahu, cooperation by............. 9
East Branch of Manoa Stream near...... 87-88Kalihi Stream near...................... 79-81Manoa Stream near...................... 83-84Nuuanu Stream near.................... 81-82West Branch of Manoa Stream near..... 85-86
Honomanu Stream near Keanae, Maui.... 151-153Honopu Stream near Huelo, Maui.......... 165-167HoolawalMlii Stream near Huelo, Maui..... 162-164Hoolawanui Stream near Huelo, Maui.... 164-165Horsepower, equivalents of.................. 17Huelo, Maui, Alo Stream near............. 156-158
Haiku ditch near...................... 170-171Haipuaena Stream near................ 153-154Honopu Stream near.................. 165-167Hoolawanui Stream near.............. 164-165Hoolawaliilii Stream near.............. 162-164Kailua Stream near.................... 161-162Kauhikoa ditch near................... 168-169Lowrie ditch near..................... 169-170Nailiilihaele Stream near.............. 159-161New Hamakua ditch near............. 167-168Puohakamoa Stream near............. 155-156Waikamoi Stream near................ 158-159
K.
Kahana Stream near Kahana, Oahu........ 91-93East Branch of, near Kahana, Oahu..... 93-94
Kahawainui Stream, East Branch of, nearLaie, Oahu.................... 103-104
Kaholalele ditch, discharge of................ 79Kahoma development tunnel near Lahaina,
Maui.......................... 128-129Kahoma Stream near Lahaina, Maui...... 126-127
189

190 INDEX.
Page. Kahuku, Oahu, East Branch of Malaekahana
Stream near................... 105-106Middle Branch of Malaekahana Stream
near........................... 106-108Kahuku Plantation, cooperation by......... 10Kailua, Oahu, main spring near............. 89-90
Makawao spring near.................... 89Kailua Stream near Huelo, Maui.......... 161-162Kalihi Stream near Honolulu, Oahu........ 79-81Kalihiwai River near Hanalei, Kauai....... 66-67Kaluanui Stream near Hauula, Oahu....... 98-100Kamenehune ditch near Waimea, Kauai.... 40-42Kanaha ditch near Lihue, Kauai............ 56-58Kaneohe Ranch Co., cooperation by........ 10Kapaa River near Kealia, Kauai............. 59-61Kapahi ditch near Kealia, Kauai........... 61-62Kauai Electric Co., cooperation by......... 10: 180Kauai Island, gaging stations on............ 22-24
gaging-station records on................. 28-79miscellaneous measurements on.......... 79rainfall records on..................... 185-186rainfall stations on..................... 181-182
Kauaikanana Stream, discharge of........... 79Kauaula ditch near Lahaina, Maui........ 132-134Kanaula Stream near Lahaina, Maui....... 131-132Kauhikoa ditch near Huelo, Maui.......... 168-169Kaukonahua Stream, right and left branches
of North Fork of, near Waihaiwa, Oahu.................. 108-109,109-111
South Fork of, near Wahaiwa, Oahu.. HI- 112, 113-114
Kawaikoi Stream near Waimea, Kauai...... 30-31Kealia, Kanai, Anahola ditch near.......... 64-66
Anahola River near...................... 63-64Kapaa River near....................... 59-61Kapahi ditch near....................... 61-62
Keanae, Maui, East WailuaiM Stream near. 145-147 East Wailuanui Stream near........... 148-150Honomanu Stream near............... 151-153West Kopiliula Stream near........... 143-145West WailuaiM Stream near........... 147-148West Wailuanui Stream near.......... 150-151
Kekaha ditch near Waimea, Kauai.......... 36-38Kehaka Sugar Co., cooperation by............. 180Koaie River near Waimea, Kauai........... 32-34Kohala ditch near Kohala, Hawaii. 173-176,176-179 Koloa Stream near Laie, Oahu............ 100-101Koolau Agricultural Co., cooperation by.... 10,180Kopiliula Stream, West, near Keanae, Maui.. 143-
145 Koula, Kauai, Hanapepe ditch at........... 48-49
Hanapepe River at...................... 46-47Kukaiau Ranch Co., cooperation by........... 180Kukuihaele, Hawaii, Upper Hamakua ditch
near........................... 171-172Kuna ditch near Hanalei, Kauai............. 72-73
L.
Lahaina, Maui, Honokawai ditch near..... 125-126Honokawai Stream near............... 123-124Kahoma development tunnel near..... 128-129Kahoma Stream near.................. 126-127Kauaula ditch near.................. v 132-134Kauaula Stream near.................. 131-132Lahainaluna Stream near.............. 129-130Launiupoko Stream near.............. 134-135
Laie, Oahu, East Branch of KahawainuiStream near................... 103-104
Koloa Stream near.................... 100-101Wailele Stream near................... 101-103
Laie Plantation, cooperation by............... 10Larrison, G. K., and assistants, work of....... 22Lahainaluna Stream near Lahaina, Maui.. 129-130 Launiupoko Stream near Lahaina, Maui... 134-135 Lihue, Kauai, East Branch of North Fork of
Wailua River near............... 58-59Hanamaulu ditch near.................. 52-53Kanaha ditch near...................... 56-58North Fork of Wailua River near........ 55-56South Fork of Wailua River near........ 50-52
Lihue ditch near Lihue, Kauai.............. 53-55Lihue Plantation Co., cooperation by.......... 10Lower Hamakua ditch near Kukuihaele,
Hawaii........................ 172-173Lowrie ditch near Huelo, Maui............ 169-170Lumahai River near Haualei, Kauai........ 73-75
M.
McClellan, J., cooperation by.................. 180Makawao Spring near Kailua, Oahu........... 89Makaweli, Kauai, Olokele ditch near........ 43-46Makaweli River near Waimea, Kauai........ 42-43Makee Sugar Co., cooperation by.............. 10Malaekahana Stream, East Branch of, near
Kahuku, Oahu................ 105-106Middle Branch of, near Kahuku, Oahu. 106-108
Manoa Stream near Honolulu................ 83-84East Branch of, near Honolulu.......... 87-88West Branch of, near Honolulu.......... 85-86
Man's water, definition of.................... 16-17Maui Board of Supervisors, cooperation by.... 180Maui Island, gaging-station records on.... 115-171
gaging stations on....................... 25-27miscellaneous measurements on............ 171rainfall records on......................... 187rainfall stations on......................... 183
Maunawili Ranch, cooperation by............. 10May, W. S., cooperation by.................... 180Measurement of stream flow, methods of.... 10-15Measures, English, metric equivalents of...... 17Meyer, F., cooperation by................... 180Miner's inch, definition of................... 16Mohihi Stream, discharge of................. 79
N. Nailiilihaele Stream near Huelo, Maui..... 159-161New Hamakua ditch near Huelo, Maui.... 167-168North Waiehu ditch near Wailuku, Maui.. 116-118 North Waiehu Stream, discharge of......... 171Nuuanu Stream near Honolulu, Oahu....... 81-82
O.
Oahu Island, gaging-station records on...... 79-115gaging stations on....................... 24-25miscellaneous measurements on......... 115rainfall records on..................... 186-187rainfall stations on...................... 182
Olokele ditch near Makaweli, Kauai......... 43-46Olowalu, Maui, Ukumehame Stream near. 137-139 Olowalu ditch near Olowalu, Maui.... 135-137,171Olowalu Sugar Co., cooperation by......... 10,180Opaikaa Stream, discharge of................ 79

INDEX. 191
P. Page.
Pacific Sugar Mill, cooperation by ........... 180Palolo ditch near Waikapu, Maui. ......... 140-142Pioneer Mill Co., cooperation by. ........... 10, 180Punaluu, Oahu, Waihoi Stream near. . ...... 97-98Punaluu Stream near Punaluu, Oahu. . . 94-97, 115 Puohakamoa Stream near Huelo, Maui. . . . 155-156
R.
Rainfall of the islands..................... 180-188Results, accuracy of......................... 22Rice, Charles, cooperation by................ 10Run-off, definition of........................ 16
table for converting discharge into....... 17Run-off and discharge, computing and study
ing of............................ 18-21
S.
Sanborn, W. F., cooperation by............. 180Scope of work............................... 10Second-foot, definition of.................... 19
equivalents of........................... 17South Side Waikapu ditch near Waikapu,
Maui.......................... 142-143South Waiehu Stream hear Wailuku, Maui. 115-116 Spreckels ditch, Maui, discharge of.......... 171Stream flow, methods of measuring.......... 10-15
T.
Tables, explanation of....................... 21-22Terms, definitions of ......................... 15-17
IT.
Ukumehame Stream near Olowalu, Maui.. 137-136U. S. Army Constructing Quartermaster
Department, cooperation by.... 10,180U. S. Army reservoir near Wahaiwa, Oahu,
south fork of Kaukona Stream near................... 111-112,113-114
Upper Hamakua ditch near Kakuihaele, Ha waii........................... 171-172
V.
Velocity, mean, position of thread of......... 13Velocity-area method of measuring streams,
description of.................... 11-15
W.
Wading gaging station, description of........ 14-15Wahiawa Water Co., cooperation by......... 10Waiahulu Stream near Waimea, Kauai...... 31-32Waiakea Sugar Co., cooperation by.......... 180Waiakoali Stream, Kauai, discharge of....... 79Waialae River near Waimea, Kauai......... 34-35Waihaiwa, Oahu, right and left branches
of North Fork of Kaukonahua Stream near........... 108-109,109-111
Waihee Stream near Waihee, Maui........ 118-120Waihoi Stream near Punaluu, Oahu........ 97-98Waihoi Stream, north and south forks of,
Oahu, discharge of............... 115Waikamoi Stream near Huelo, Maui....... 158-159Waikapu, Maui, Palolo ditch near......... 140-142
South Side Waikapu ditch near....... 142-143Waikapu Stream near Waikapu, Maui..... 139-140Wailele Stream near Laie, Oahu.. -........ 101-103Wailua River, East Branch of North Fork of,
near Lihue, Kauai............... 58-59North Fork of, near Lihue, Kauai....... 55-56South Fork of, near Lihue, Kauai....... 50-52
Wailuaiki streams, East and West, nearKeanae, Maui................. 145-148
Wailuanui streams, East and West, nearKeanae, Maui................. 148-151
Wailuku, Maui, North Waiehu ditch near. 116-118 South Waiehu Stream near............ 115-116
Wailuku Sugar Co., cooperation-by......... 10,180Waimea, Kauai, Kamenehune ditch near.... 40-42
Kawaikoi Stream near................... 30-31Kekaha ditch near....................... 36-38Koaie River near........................ 32-34Makaweli River near.................... 42-43Waiahulu Stream near.................. 31-32Waialae River near...................... 34-35
Waimea ditch near Waimea, Kauai.......... 39-40Waimea River near Waimea, Kauai......... 28-30Waimea Sugar Co., cooperation by.......... 10Wainiha Canal, discharge of................. 79Wainiha River near Wainiha, Kauai..... 76-78,79Waioli Stream near Hanalei, Kauai......... 75-76Water power, quick method of calculating... 17 Water-stage recorder, description of.......... 15Weir measurements, accuracy of............. 11West Kopiliula Stream near Keanae, Maui. 143-145 West WailuaiM Stream near Keanae, Maui. 147-148 West Wailuanui Stream near Keanae,
Maui.......................... 150-151Willard, C. R., cooperation by............... 180
o