suriname drug management report final - overheid - sr€¦ · bgvs financial management ......
TRANSCRIPT

1
Suriname Study on Public Sector Drug Procurement
Final Report
David Lee Robert Verhage
Miriam Naarendorp
Submitted to the Inter-American Development Bank Contract No. EMD.2.260.00-J
by Management Sciences for Health, Inc.165
Allandale Road Boston, MA 02130-3400 USA
12 August, 2003

2
Contents
Executive Summary............................................................................................................ 9 1. Background ................................................................................................................. 9 2. Findings....................................................................................................................... 9 3. Options for Improving Effectiveness and Efficiency of Pharmaceutical Procurement and Spending................................................................................................................. 10 4. Pharmaceutical Legislation and Regulatory Framework Support ............................ 15 5. Next Steps ................................................................................................................. 15
I. Introduction.................................................................................................................... 17 1. Background ............................................................................................................... 17 2. Health and Pharmaceutical Care Provision in Suriname .......................................... 18
II. Pharmaceutical Policy, Legislation, and Regulation.................................................... 21 1. National Medicines Policy and Implementation....................................................... 21 2. Pharmaceutical Legislation, Regulation, and Product Registration.......................... 22 3. Pharmaceutical Product Registration Enforcement .................................................. 23
III. Pharmaceutical Financing and Spending .................................................................... 27 1. Expenditure Amounts and Sources ........................................................................... 27 2. Supplier Share of Pharmaceutical Market ................................................................ 29 3. Public Sector Spending on Pharmaceuticals Relative to BGVS Gross Margins and Mark ups ....................................................................................................................... 30 4. Potential Savings from Improved BGVS Procurement ............................................ 33 5. Pharmaceutical Consumption Based on BGVS Sales Data ...................................... 34
IV. Availability, Cost and Quality of Medicines .............................................................. 39 1. Availability of Essential Medicines .......................................................................... 39 2. BGVS vs. Private Suppliers’ Sales Prices to Pharmacies ......................................... 43 3. Product Quality Concerns ......................................................................................... 45
V. The Drug Supply Company Suriname (BGVS)........................................................... 46 1. Legal Status, Management and Organization........................................................... 46 2. Financial Management .............................................................................................. 49 3. Legal framework and BGVS procurement policy .................................................... 56 4. BGVS Procurement Performance ............................................................................. 57 5. Warehousing ............................................................................................................. 63 6. Sales and Distribution............................................................................................... 64 7. BGVS Pharmaceutical Production............................................................................ 65 8. Quality Assurance ..................................................................................................... 68 9. Management Information Systems ........................................................................... 71
VI. Options for Improving Public Sector Pharmaceutical Procurement ........................... 72 1. Introduction............................................................................................................... 72

3
2. Options for Improving Effectiveness and Efficiency of Pharmaceutical Procurement and Spending................................................................................................................. 72 3. Maintaining the Current Supply System and Strengthening the BGVS ................... 74
3.1. Interventions to strengthen BGVS management and operations ....................... 74 3.1.1. BGVS Management .................................................................................... 74 3.1.3. Procurement practices................................................................................. 75 3.1.4. BGVS financial management ..................................................................... 76 3.1.5. Product pricing............................................................................................ 76 3.1.6. Warehousing and distribution operations ................................................... 76 3.1.7. Quality assurance ........................................................................................ 77 3.1.8. Management information system................................................................ 77
3.2. Option pre-requisites.......................................................................................... 77 3.3. Costs................................................................................................................... 78 3.4. Likelihood of Impact on Improved Effectiveness and Efficiency of Public Sector Pharmaceutical Spending............................................................................... 78 3.5. Further studies to assist decision-making .......................................................... 78
4. Reforming the Pharmaceutical System and Creating a Pharmacy Benefits Management Program................................................................................................... 78
4.1. Creating and implementing a Pharmacy Benefits Management Program......... 79 4.2. Option pre-requisites.......................................................................................... 80 4.3. Costs................................................................................................................... 80 4.4. Likelihood of Impact on Improved Effectiveness and Efficiency of Public Sector Pharmaceutical Spending............................................................................... 81 4.5. Further studies to assist decision-making .......................................................... 81
5. Legislation and Regulatory Framework.................................................................... 85
VII. Next Steps.................................................................................................................. 86
Annex 2. Suriname Demographic, Social, Economic and Health Indicators ................... 89
Annex 3: Summary of Pharmaceutical System Indicators ............................................... 92
Annex 4. BGVS Assessment Questionnaire ..................................................................... 95
Annex 5. Documents Reviewed...................................................................................... 106
Annex 6. List of Key Informants Interviewed ................................................................ 110
Annex 7. Availability of Tracer Medicines Supplied by BGVS .................................... 113
Annex 8. Availability of Tracer Medicines Supplied by Private Suppliers.................... 114

4
Tables and Figures
Tables
Table 1. Pharmaceutical Care Providers and their Payment Sources ............................... 19
Table 2. Number of Available Registered Products for Tracer Medicines, as found in MOH Registration Office Registry and BGVS database, January 2003. ......................... 24
Table 3. Number of Pharmaceutical Products Available in Pharmacies that were Registered, January 2003 .................................................................................................. 25
Table 4. Funding Sources and Estimated Pharmaceutical Expenditures, Year 2000 ....... 29
Table 5. Estimated Costs for BGVS Products 2000 – 2002 ............................................. 30
Table 6. BGVS Pharmaceutical Sales and Real Gross Margins vs. 10% Gross margins 2000-2002 ......................................................................................................................... 31
Table 7. BGVS and Private Supplier Price Calculations With and Without Duty........... 31
Table 8. Estimated Savings from Improved FOB Prices and Consistent Mark ups for 61 Essential Medicines in 2002 ............................................................................................. 34
Table 9. Number of Products and Value of Sales that Comprise 75%, 15%, and 10% of BGVS Sales 2000-2002 .................................................................................................... 35
Table 10. Relative Importance of Therapeutic Groups that Account for 75% of BGVS Sales, 2000-2002............................................................................................................... 36
Table 11. Top Causes of Morbidity and Mortality in Suriname ....................................... 37
Table 12. Tracer Medicines and their Main Indications ................................................... 40
Table 13. Availability of Tracer Medicines and Source of Supply .................................. 41
Table 14. Comparison of BGVS Product Availability and Prices with Those of Private Suppliers January 2003 ..................................................................................................... 44
Table 15. Major BGVS Clients’ Accumulated Debts to BGVS from Credit Purchases in Relation to Purchases Effected ......................................................................................... 51
Table 16. Major BGVS Clients’ Accumulated Debts to BGVS from Credit Purchases for the Years 1999 to 2002 ..................................................................................................... 52
Table 18. BGVS Operating Costs as a Percentage of Sales Year 2000............................ 53
Table 19. BGVS Turnover by Type of Products, Year 2000........................................... 53

5
Table 20. BGVS Inventory Holding Costs Year 2000 .................................................... 54
Table 21. Year 2000 Gross Sales, Costs, and Net Profit .................................................. 55
Table 22. Availability of Tracer Medicines at the BGVS Warehouse, February 2003 .... 58
Table 23. Comparison between BGVS purchasing prices and median and lowest international prices reported in the MSH International Price Indicator Guide 2001 ...... 59
Table 24. Losses due to Expiry, 2000 - 2002 ................................................................... 60
Table 25. Number of weeks that Tracer Items were Out of Stock, 2002 ......................... 61
Table 26. Top 10 Suppliers and share of BGVS Purchases in US Dollars 2001-2002 .... 61
Table 27. Top 10 Purchase Orders by Value and Number of Items, 2001 and 2002 ....... 62
Table 28. Distribution and value of BGVS Purchase Orders, according to Means of Transport 2001 and 2002 .................................................................................................. 62
Table 29. Value of BGVS Inventory and Financial Opportunity Costs 2000-2002......... 63
Table 30. Annual inventory results 2000 – 2002 .............................................................. 64
Table 31. BGVS Production: Revenues, Gross Margin, Percentage of Items Sold Below 1,000 and 100 Units, 2000-2002....................................................................................... 66
Table 32. BGVS Production Item Cost vs. Median International Unit Cost, from 2002 Sales .................................................................................................................................. 67
Table 33. Proportion of BGVS Products Tested vs. BGVS Products’ Share of Total BGVS Sales....................................................................................................................... 68
Table 34. BGVS Quality Control Laboratory Rejection Rated 2000-2002...................... 69
Table 35. Recommendations for Improving BGVS Management and Operations .......... 84
Figures Figure 1. Per Capita Spending on Pharmaceuticals in Selected Countries 1999 -2001 ... 28 Figure 2. Number of Medicines Prescribed per Curative Encounter in Selected Countries
................................................................................................................................... 38 Figure 3. Tracer Medicines Availability in Public Facilities in Selected Countries......... 42 Figure 4. Availability of Tracer Medicines in Private Pharmacies of Selected Countries 43 Figure 5. BGVS Organizational Structure ........................................................................ 48 Figure 6. BGVS Outstanding Debts from Clients’ Purchases on Credit 1998 – 2002 ..... 50

6
Acknowledgements
The MSH Team would like to express sincere appreciation for the invaluable leadership and assistance provided by Manodj Hindori and Sharita Gangaram Panday of the Project Executing Unit. They spent considerable energy in compiling available health and pharmaceutical indicators. We also wish to express our gratitude to Etienne Moniz for the hard work in compiling much of the data for our analyses. Without his contribution, this study would not have been possible. Appreciation goes to Ingrid May and her administrative and financial staff for sharing information with us frankly and providing us with needed data and information. They shared the desire to critically assess the shortcomings of the system and an honest effort to identify possible solutions. Thanks to Ms. Amanda Glassman of the Inter-American Development Bank for insisting on and obtaining funding for this follow on to the group of health sector reform studies that aim to contribute to ensuring that the Surinamese people have access to quality services provided within the constraints of available resources.

7
Acronyms ABS Algemeen Bureau voor de Statistiek (General Statistics
Bureau) ARI acute respiratory infection AZP Academisch Ziekenhuis Paramaribo (Academic Hospital
Paramaribo) AZPAS BGVS Bedrijf Geneesmiddelen Voorziening Suriname (Drug Supply
Company Suriname) BOG Bureau voor Openbare Gezondheidszorg (Bureau of Public
Health) CBD Centrale Betaal Dienst (Central Paying Office) CARICOM Caribbean Community CLAD Centrale ‘s Lands Accountants Dienst (Central for National
Audit Services) COVAB Stichting Centrale Opleidingen voor Verpleegkundigen en
Aanverwante Beroepen (national nursing school) DC direct contracting DRG diagnosis-related group ECDS Eastern Caribbean Drug Service EDL Essential Medicines List GDP Gross Domestic Product GMTD Gemeenchappelijke Medisch Technische Dienst (Joint
Medical Technical Service) GOS Government of Suriname GP general practitioner HIV/AIDS human immunodeficiency virus/acquired immune deficiency
syndrome ICB international competitive bidding ICD International Statistical Classification of Diseases and Related
Health Problems IDA International Dispensary Association IDB Inter-American Development Bank IDPIG International Drug Price Indicator Guide IPPF International Planned Parenthood Federation IS international shopping KIT Koninklijk Instituut voor de Tropen (Royal Tropical Institute) LH ‘s Lands Hospitaal (National Hospital) LIB limited international bidding MOF Ministerie van Financien (Ministry of Finance) MOH Ministerie van Volksgezondheid (Ministry of Health) MSA Ministerie van Socia le Zaken en Volkshuisvesting (Ministry of
Social Affairs) MSH Management Sciences for Health MZ Medische Zending (Medical Mission)

8
NDP National Drug Policy NGB Nationaal Geneesmiddelenbeleid (National Medicines Policy) NGO Non Governmental Organization NGK Nationale Geneesmiddelen Klapper (National Essential
Medicines List) NHA National Health Accounts OECS Organization of Eastern Caribbean States OOP Out of Pocket Patients PAHO Pan-American Health Organization PEU Project Execution Unit PIC Pharmaceutical Inspection Convention REG Raad voor het Essentieel Geneesmiddelenprogramma (Board for
the Essential Medicines Program) RGD Regionale Gezondheidsdienst (Regional Health Service) RKZ Rooms Katholiek Ziekenhuis St. Vincentius (Roman Catholic
Hospital) RNE Royal Netherlands Embassy SD standard deviation SOZA(VO) Ministerie van Sociale Zaken en Volkshuisvesting (Ministry of
Social Affairs) SRG Surinamese Guilder SZF Staatsziekenfonds (State Health Insurance Fund) TB tuberculosis VAT Value Added Tax VIG Vereniging van Importeurs van Geneesmiddelen (Drug
Importers Association) VMS Vereniging van Medici in Suriname (Medical Association
Suriname) VVA Vereniging van Apothekers (Pharmacist Association)
WHO World Health Organization

9
Executive Summary 1. Background This study forms part of a technical cooperation program between the Ministry of Hralth of Suriname (MOH) and the Inter-American Development Bank (IDB), designed to set the basis for health sector reform in Suriname by generating information and implementing changes in key components of the health system. The Analysis of Payment Systems for Primary, Specialty Outpatient, and Inpatient Care, one of seven studies that were conducted under the MOH Health Sector Reform Project, performed a cursory analysis of pharmaceutical procurement practices and performance in Suriname. It revealed procurement inefficiencies in the Drug Supply Company Suriname (BGVS) and suggested options that would lead to substantial savings. Moreover, in recent years there have been frequent complaints about pharmaceutical product shortages. Product availability and BGVS performance were regularly featured in the local press. Management Sciences for Health was contracted to analyze the public pharmaceutical management system, focusing on the role of BGVS, as it is the organization responsible for importation of pharmaceutical products and the local manufacture of some of the products. The study assessed the situation regarding pharmaceutical policy, legislation, and regulation; pharmaceutical spending, prices and markups; availability of essential medicines and sources of supply; pharmaceutical product costs and product quality concerns, and BGVS management, operations, and costs. 2. Findings Key findings on the effectiveness and efficiency of public sector pharmaceutical spending and the role of BGVS can be summarized as follows:
• BGVS accounts for less than 50% of the pharmaceutical market. • BGVS-associa ted stock outs at pharmacy level appear to be offset by supply
through private suppliers. • BGVS operations, particularly its manufacturing operations, are inefficient. • Despite the inefficiency, BGVS has registered profits up to December, 2000. • BGVS inefficiency is passed on to its clients through high mark ups on many of
its products. • Large client debts from sales on credit and “negative markups” resulting in
below-cost sales prices are due to poor practices rather than the conscious application of “informal” subsidies.
• It should be possible for SZF, MSA, and the MOH to pay less for essential medicines.
• There are no obvious (strong) incentives for suppliers to offer more favorable prices to public sector programs.
Another important finding is that the requirement for pharmaceutical product registration does not appear to affect the actual availability of products in the pharmacies. However,

10
product availability in retail pharmacies does not necessarily ensure accessibility for SZF beneficiaries, as they have to pay out of pocket for products for which SZF may only provide partial reimbursement. The keys to developing an effective strategy to improve public sector pharmaceutical procurement and spending include:
• leveraging or consolidating the purchasing power of the three major players (Ministry of Social Affairs, State Health Fund, and Ministry of Health), and
• providing appropriate incentives for change. 3. Options for Improving Effectiveness and Efficiency of Pharmaceutical Procurement and Spending There are two main options for improved effectiveness and efficiency of public sector spending through achieving lower prices charged to public sector programs. One option is to maintain the current system of pharmaceutical supply and focus on strengthening BGVS management and operations. The other option is to reform the system by creating a pharmacy benefits management program for the public programs. A pharmacy benefits management (PBM) program can be designed to determine which manufacturers or importers supply the products and their prices, which pharmacies provide dispensing services, and who are eligible for prescription benefits. Such a program could be developed and implemented by: (a) a unit within one of the payers (SZF, MSA, MOH), (b) an autonomous (not- for-profit) structure funded/contracted by the payers, or (c) a for-profit company contracted by the payers. In North America PBM companies design, implement, and administer outpatient pharmaceutical benefit programs for employers, managed care organizations, and other third-party payers. PBM companies manage prescription drug benefits, independently of other health care services, such as physician and hospital services. PBM companies act as intermediaries between pharmaceutical suppliers and third-party payers, such as the SZF, MSA. Third-party payers should commission or carry out a study to determine the feasibility of the above-mentioned ways for establishing a PBM program in Suriname and what technical assistance may be needed. The first table provides a synopsis of the two major options. Over the past few years, stakeholders have recognized the need to reform BGVS management and operations. However, political will and external and internal incentives to improve effectiveness and efficiency have been lacking. Reliance on changes in management and operational procedures alone, without a strong external incentive, will not assure sustainability of reforms. It is up to the third-party payers to become better “buyers” of products and services through a well-designed and properly implemented pharmacy benefits program. The key is to create a situation where BGVS has to compete with other suppliers to supply public programs, so that it will have to eliminate its problems with stock outs, reduce current markup percentages, and improve its service to clients. This is consistent with current health reforms to strengthen the public payers (SZF, MSA, MOH) in their role as active purchasers.

11
Over the past few years, stakeholders have recognized the need to reform BGVS management and operations. However, political will and external and internal incentives to improve effectiveness and efficiency have been lacking. Reliance on changes in management and operational procedures alone, without a strong external incentive, will not assure sustainability of reforms. It is up to the third-party payers to become better “buyers” of products and services through a well-designed and properly implemented pharmacy benefits program. The key is to create a situation where BGVS has to compete with other suppliers to supply public programs, so that it will have to eliminate its problems with stock outs, reduce current markup percentages, and improve its service to clients. This is consistent with current health reforms to strengthen the public payers (SZF, MSA, and MOH) in their role as active purchasers. The second table summarizes recommendations to improve BGVS management and operations. There are other important interventions that may improve effectiveness and efficiency of public pharmaceutical spending. One strategy is to develop and implement standard treatment guidelines with appropriate monitoring and supervision. This may be done as a component of the pharmacy benefits management intervention (medicines use review program). Other potential strategies addressing the safe, effective and cost-effective prescribing (rational use) may be suggested by another study currently being planned.

12
Table. Comparative Summary of Options for Improving Effectiveness and Efficiency of Pharmaceutical Spending Strategy Maintain current pharmaceutical
supply system for public sector programs
Reform the pharmaceutical supply system for public sector programs
Specific Intervention
Strengthen BGVS Establish a pharmacy benefits management program to serve the MSA and SZF
Relationship to on-going health financing initiatives
Is NOT a component of public health financing programs (MSA, SZF, central government)
Is developed as a component of public health financing programs (MSA, SZF, central government)
Implications for BGVS
BGVS continues to be the primary supplier to public sector programs Degree of true competition with private suppliers is unclear.
Has to compete with private suppliers for public sector program business
Implications for Private-for-profit Suppliers
Generally used as alternative supplier when BGVS is out of stock
Have opportunity to compete with BGVS for public sector program business
Responsible for Product and Supplier Selection
Selected by pharmacy service provider (hospital, dispensary, retail pharmacy), by purchasing from either BGVS or an alternative private supplier
Selected by pharmacy benefits management program, based on procurement through competitive tendering
Sales Prices (ex-supplier price plus the pharmacy markup)
Set by BGVS and private suppliers; BGVS would need to implement competitive tendering
Set by pharmacy benefits management program, based on procurement by competitive tendering
Development Focus/ Emphasis
Strengthening BGVS operations and management Areas to be covered: - Management - Financial management - Pricing practices - Pharmaceutical manufacturing operations - Procurement practices - Warehousing and distribution practices - Quality assurance - Management information system (see Recommendations for Improving BGVS Management
Creating and implementing a pharmacy benefits management program Areas to be covered: - Program coverage - Program management support - Financial/reimbursement mechanisms - Procurement method and operating procedures - Contractor performance monitoring and indicators - Medicine use review program - Audit plan - Cost control mechanisms (co-

13
and Operations) pays and others) - Management Information System (information, reporting requirements)
Pre-requisites MOH commitment to improve BGVS management and operations. Resolve the BGVS management leadership situation. Vacant BGVS positions are filled.
Equal/equitable access to hard currency (uniform exchange rates for both BGVS and private suppliers) Harmonize BGVS and private sector price markup formulas
Costs (More study needed)
Operating costs -Personnel costs (filling current vacancies) -Equipment costs (computers, vehicles) Technical assistance costs
Program design and implementation costs Recurrent program costs (in-house staffing vs. outsourcing) Technical assistance costs
Likelihood of Impact on Improved Effectiveness and Efficiency of Pharmaceutical Spending
Dependent on i) MOH commitment to improve BGVS management and operations, and ii) BGVS management performance. In the absence of strong incentives for change, it is unlikely that the impact will be significant.
Dependent on i)economic pressures on funding sources and payers (MOH, MSA, SZF) to become more efficient, and ii) the pharmacy benefits program design, implementation, and performance. Because the system provides a strong financial incentive (access to increased volume of business) and an even playing field to (all) suppliers, if it can be properly managed, it is likely that the impact may be significant.
Further Studies
An analysis of the suitability of BGVS pharmaceutical manufacturing versus importation of BGVS production items. Determine technical assistance needs Costs of BGVS strengthening program
An analysis of the feasibility and costs of implementing a pharmacy benefits management program. Determine technical assistance needs and costs

14
Table. Summary of Recommendations for Improving BGVS Management and Operations Management
Resolve definition of BGVS leadership (Board vs. General Manager) Fill vacant positions Improve internal communications
Financial Management
Optimize use of funds for payment *Tender for large quantities, but divide delivery over time (reduces need to pay up front) *Smaller inventories reduce financial opportunity costs and losses due to expiry Define and implement a consistent policy on credit sales
Product pricing practices
Review and harmonize markup formula with private sector Apply adopted markup in a consistent manner Establish preferential/reduced prices for public sector facilities (RGD, hospitals)
Pharmaceutical Manufacturing Operations
Options: 1. Reduce pharmaceutical manufacturing to items that are
truly efficient 2. Discontinue pharmaceutical manufacturing
Procurement Practices
Follow Good Procurement Practices *Conduct tenders from pre-qualified suppliers *Establish transparent, formal written procedures and use explicit criteria to award contracts *Procurement should be planned *Monitor procurement performance
Warehousing and Distribution Practices
Good Warehousing Practices *Review current procedures and update as needed, for implementation
Quality Assurance Program
Develop and implement a quality assurance program that includes monitoring for good storage practices Identify the determinants of incomplete pharmacopeial monograph testing, in order to design and implement a priority and risk-based testing program
Management Information System
Evaluate the software packages currently used and how they can be linked or used effectively, versus purchase/development of an integrated package Complete the entry of financial data as a priority activity
15
4. Pharmaceutical Legislation and Regulatory Framework Support The MOH needs to assess options to improve the effectiveness of pharmaceutical regulation and to strengthen MOH regulatory capacity. Importation and retail sale of non-registered products appears to be a common practice, which cannot be justified unless there has been prior approval by the Registration Office. The options analysis should include:
• A review of existing laws to determine what may need to be modified to strengthen MOH regulatory capacity in the pharmaceutical sector
• An analysis of approaches to pharmaceutical product evaluation and approval (criteria and procedures), and product registration requirements and procedures, and what can be done with or without changes in legislation
• An analysis of how to effectively enforce regulations, taking into account resource limitations
• An analysis of ways to re-organize the Registration Office and the Inspection Directorate under one department or coordinate their activities
• An analysis of costs associated with pharmaceutical product regulatory activities and potential mechanisms of sustainable financial support, such as central government funding and registration fees.
The MOH does not have the capacity to conduct post-marketing surveillance of pharmaceutical produc t quality, safety (side effects) and effectiveness (or lack thereof). The only product quality control laboratory in Suriname is located within the BGVS. An appropriate national quality assurance program should be designed, that builds on this resource, rather than establish another laboratory. However, careful consideration is needed regarding how the national program can be reliable and transparent, since the BGVS would be providing analytical services while it is also one of the competing suppliers. An option would be to have the BGVS laboratory become independent or part of the national medicines regulatory authority or the pharmaceutical inspectorate 5. Next Steps The findings and major options were presented and discussed with stakeholders in a meeting held in June. Participants, including BGVS representatives who attended the meeting, acknowledged the need to reform BGVS management and operations. As indicated previously, the key is to create a situation where BGVS has to compete with other suppliers to supply public programs, providing the needed incentive to eliminate its problems with stock outs, reduce current markup percentages, and improve its service to clients. This can be done if the third/party payers become better “buyers” of products and services through a well-designed and properly implemented pharmacy benefits program. Because stakeholders were unfamiliar with the pharmacy benefits management concept, there were concerns regarding its feasibility in Suriname. The way forward is to commission or carry out a study to assess the feasibility of one or more models for a PBM program and determine what and how much technical assistance will be needed.
16
This will facilitate decision-making on whether and how to create the strong external incentive for BGVS to improve management and operations through the development and implementation of a pharmacy benefits management program. The MOH, MSA, SZF and the relevant ministries (Finance and Commerce) need to review the findings of this study and follow up with reforms regarding (1) the inequitable access to hard currency and (2) the standardization of markup formulas for parastatal and commercial firms. This may facilitate more competitive pricing by private suppliers under the current system. The MOH must resolve the lack of definition regarding BGVS leadership. The Minister of Health must appoint either a new board of directors or a new general manager. This will facilitate the introduction and effective implementation of management and operational reforms.

17
I. Introduction 1. Background Suriname is a former Dutch colony on the northeast coast of South America, bordered by French Guyana to the east, Guyana to the west, and Brazil to the south. Most of the population lives along a 30 km-wide coastal band (10% of the country’s 163,820 km of territory). Fifty percent of the population of 441,356 people resides in the capital city, Paramaribo. The climate in Suriname is hot and humid. The official language is Dutch, but many other languages are spoken, due to its multi-cultural nature. The GDP per capita was USD 1,452 in 2001; it was estimated that, in 1999, between 50% and 75% of the population lived below the poverty line. The Surinamese economy has not recovered from its periodic crises. The Surinamese Guilder (SRG) has devaluated from a rate of 1.8 SRG per US dollar (USD) in 1983 to SRG 1,339 in 2000, and SRG 2,450 in 2002. Inflation was almost 60% in 2000. The health care system has not been spared by these crises. However, it seems that problems are not all due to shortage of funds available (per capita expenditure on health was USD 180 in 2000), but may also be due to how available funds are used and managed1. The Analysis of Payment Systems for Primary, Specialty Outpatient, and Inpatient Care (Study 6), one of seven studies that were conducted under the MOH Health Reforms Project, performed a cursory analysis of pharmaceutical procurement practices and performance in Suriname.2 It revealed procurement inefficiencies in the Drug Supply Company Suriname (BGVS) and suggested options that would lead to substantial savings. As a result, Management Sciences for Health was contracted to analyze the public drug management system in Suriname, focusing on the role of the Bedrijf Geneesmiddelenvoorziening Suriname (BGVS), as it is the organization responsible for importation of pharmaceutical products and the local manufacture of some of the products. This study will assess the efficiency of public sector pharmaceutical management, with an emphasis on BGVS operations. It is expected that the study will discuss key actions that could be taken in order to improve pharmaceutical management in Suriname. Overall, it is expected that this study will serve as an important input in the development of health sector reform strategies for Suriname.
1Fishstein P, Rosenthal G, Brohim R. National Health Accounts. Study #1 for Health Sector Reform submitted to MOH-PEU, MSH and HECORA. Boston, MA: 15 June 2002 2Eichler R, Beith A, Jabbar S, Lewis E, Quigley K, Seltzer J, Antonius R, Chong HMTJ. Analysis of payment systems for primary, specialty outpatient, and inpatient care. Boston, MA: Management Sciences for Health, December 17, 2001.

18
2. Health and Pharmaceutical Care Provision in Suriname Health services are provided by the Regional Health Services, the Medical Mission for Primary Health Care Foundation, large employer firms, general practitioners in private practice, and public and private hospitals. Financing of health care is separate from the provision of healthcare (as described in detail in Study 6). The Regional Health Services (Regionale Gezondheidsdienst, RGD) runs 41 clinics to provide primary health care for the poor and the near-poor in the coastal area. The RGD, which also has a pharmacy in Paramaribo, distributes medicines to 22 coastal facilities, which function as small pharmacies. Dispensed pharmaceuticals are paid out-of-pocket by clients or are charged to the clients’ social or private insurance plans. The Medical Mission for Primary Health Care (Medische Zending, Medical Mission) is a nongovernmental organization (NGO) based in Paramaribo. It operates 36 clinics in the country’s interior. Based on the distance to major health facilities and the population that they serve, Medical Mission facilities are classified as big, medium and small posts. All the facilities dispense medicines. The Medical Mission does not operate a pharmacy in Paramaribo. The Ministry of Health (MOH) subsidizes Medical Mission costs. Pharmaceuticals are provided free of charge to Medical Mission patients. Medical Mission patients who need hospital care are treated at the private Diakonessen Hospital (through an agreement between these two institutions), and their costs are covered by the Ministry of Social Affairs (MSA). There are 146 general practitioners (GPs) working in private practice. Most of the GPs are located in the coastal area and they serve people who are covered by the State Health Insurance Fund (Staatsziekenfonds, SZF), some private employers’ health coverage plans, private insurance plans, or those who pay out-of-pocket. Their prescriptions are filled at private pharmacies. Dispensed medications are charged to clients’ social or private insurance plans, or clients pay out of pocket. Large corporate employers, such as the bauxite company, also operate primary care clinics that provide service to employees and their families. Other companies employ general practitioners on a need basis. Costs of services are covered by the respective companies. There are seven hospitals, all of which are located in the coastal area. There are four public hospitals, three in Paramaribo (‘Lands Hospital, Academic Hospital, and Psychiatric Hospital) and one in rural Nickerie District, the Military Hospital (Ministry of Defense), and two private not-for-profit hospitals (Diakonessen Hospital and St. Vincentius Hospital) in Paramaribo. All hospitals have in-patient and out-patient pharmacies. The Military Hospital provides services to the military and their dependents. In the other six hospitals, administered or dispensed pharmaceuticals are charged to the patients’ social or private insurance plans or patients pay out-of-pocket. Table 1 identifies the payers of pharmaceutical services and products for each of group of providers.

19
Table 1. Pharmaceutical Care Providers and their Payment Sources State
Health Fund
Ministry of Social Affairs
Medical Mission
Private Employers’ Plans
Private Insurance Plans
Clients Out of Pocket
Regional Health Service
Members Card holders
Not Applicable
Not applicable
Not applicable Members
Non-insured
Medical Mission
Not applicable?
Hospital care
Clients Not applicable
Not applicable
Free of charge
Private Employers (Large firms)
Not applicable
Not applicable
Not applicable
Members Not applicable
Not applicable
Public Hospitals
Members Card holders
Not applicable
Members Members Non-insured
Private Not-for-profit Hospitals
Members Medical Mission-Diakonessen Hospital agreement
Not applicable
Members Members Non-insured
Private Pharmacies
Members Card holders
Not applicable
Members Members Non-insured
Suriname has 22 pharmacies, of which five are hospital pharmacies; the Military Hospital is not included in this study. There are 14 private pharmacies; for this study, the SZF-owned pharmacy is included as a private pharmacy, which only provides services to polyclinic patients. Twenty pharmacies are located in Paramaribo, while two are located in Nickerie (one private pharmacy and one government hospital pharmacy). The RGD facilities and Medical Mission health posts provide services to the rest of Suriname. The total number of facilities that dispense medicines for the public sector is 63. The population per functional public facility that dispenses medicines is 7,006. However, the total number of facilities that dispense medicines, including the private pharmacies is 77, resulting in a coverage of 5,771 inhabitants per facility. The parastatal Drug Supply Company Suriname (Bedrijf Geneesmiddelen Voorziening Suriname, BGVS) and 10 registered private importers and wholesalers supply pharmaceuticals to the public and private hospitals, RGD and Medical Mission re-distribution sites, and private pharmacies. BGVS manufactures 71 pharmaceutical preparations and imports the rest.

20
Pharmaceutical production, importation and distribution are regulated by two unrelated offices within the Ministry of Health. The Registration Office is responsible for pharmaceutical product registration and the Pharmaceutical Inspectorate for inspection and enforcement. The country’s only pharmaceutical product quality testing laboratory is located at the BGVS. In terms of human resources, there are 22 pharmacists in Suriname (1 per 20,000 people), most of whom work in the private sector. It is estimated by the Registration Office that, of 10 pharmacist positions that are needed in the MOH, RGD, government hospitals and BGVS only three positions are filled. Low public sector salaries are a significant factor to the lack of interest in applying for these positions. There are 214 licensed pharmacy assistants; of these, 121 (56.5%) work in both the public and private sectors. The number of pharmacy assistants per pharmacist is 10 to one; there is one pharmacy assistant per 2,200 persons. There is a course for pharmacy assistants, which is organized by the Pharmaceutical Inspectorate with input from private pharmacists. Since 2000 the output has been nine pharmacy assistants per year. Many pharmacy assistants have left Suriname for better paid jobs elsewhere, particularly to The Netherlands and The Netherlands Antilles. Annex 2 provides a summary of Suriname health and pharmaceutical sector indicators. Over the past two decades, providers and clients have complained of medicine shortages. The following sections will review issues related to the National Medicines Policy implementation, pharmaceutical product registration, pharmaceutical expenditures and price mark ups, availability of essential medicines, and BGVS management and operating costs.

21
II. Pharmaceutical Policy, Legislation, and Regulation 1. National Medicines Policy and Implementation The Government of Suriname (GOS) has committed itself to an essential medicines policy, as recommended by the World Health Organization3, for more than 20 years. The first National Essential Medicines List, the Nationale Geneesmiddelen Klapper (NGK), was published in 1985 and included 350 pharmacological substances in 600 dosage forms and strengths. Currently, the National Medicines Committee is working on an update of the 3rd edition of the NGK (MOH 1997), which includes 458 items. In 1983 the government reorganized pharmaceutical procurement, distribution and dispensing by establishing the Bedrijf Geneesmiddelen Voorziening Suriname (BGVS, Drug Supply Company Suriname). The main objective of the BGVS was to ensure the supply of essential medicines and supplies of assured quality and affordable price (see Section on BGVS). For 13 years the Dutch Government provided support to Suriname, by (1) supplying essential medicines (from 1986 to 1998 ), and (2) supporting two Essential Medicines Projects (from 1991 to 1998). The last project established the Board for the National Essential Medicines Program (Raad voor het Nationale Essentiële Geneesmiddelen-programma) in 1996, formulated a National Medicines Policy, and worked on the reorganization of public sector pharmaceutical procurement. By ministerial decree, the REG is charged with advising the Minister of Health, developing guidelines for the National Essential Medicines Program, and implementing the program. The REG is chaired by the Director of the Ministry of Health (MOH) and its members include representatives of the MOH, hospitals, and the physician and pharmacist associations. The BGVS is not represented in the REG, nor is the REG represented in the BGVS Board of Directors. Several sub-committees have been established. The National Medicines Committee maintains and updates the NGK, the Bijzondere Geneesmiddelen Commissie (Special Medicines Committee) evaluates requests for the purchase of medicines that are not in the NGK, and the Treatment Guidelines Committee is currently piloting implementation of treatment guidelines. The REG is also working on necessary pharmaceutical legislation and on organizational and financial structures for Essential Medicines Program implementation. Its activities are limited by the lack of a budget, or a budget line under MOH. In 2001 the REG submitted a draft National Medicines Policy (NMP) to the Minister of Health (MOH 2001). Subsequently, the Minister of Health asked the REG to develop a new National Essential Medicines Program. The development of this new program is in its final stage. The draft National Medicines Policy and the new National Essential Medicines Program are based on WHO-recommended essential medicines policy and
3 World Health Organization. Guidelines for developing national drug policies. Geneva: World Health Organization, 1988.

22
strategies4 (WHO 2000). The proposed program will need donor support as it is unlikely that GOS will have the financial resources to support implementation. Priorities are on the procurement and supply of essential medicines, as well as on pharmaceutical financing and update of existing pharmaceutical legislation and regulations. However, rational use of medicines is also being addressed. The draft National Medicines Policy (MOH 2001) identifies two strategies on prices, the implementation of measures to improve the transparency of price calculations, and the installation of a Price Committee. At the request of the MOH, the Pharmacist Association submitted a paper that provided some broad recommendations on strengthening the pharmaceutical sector (Vereniging van Apothekers 2000). Recommendations included establishing a pharmaceutical product pricing committee, improving BGVS performance, and making foreign currency available for procurement of essential medicines. A similar pricing committee had been mentioned in the 1973 Registration Law, but it was never installed. 2. Pharmaceutical Legislation, Regulation, and Product Registration Pharmaceutical legislation in Suriname is outdated. Over the years the basic pharmaceutical law of 1896 (Gouverneur van Suriname 1896) has been revised and supplemented. The most important supplement is the Packed Medicines Law or Registration Law (Gouverneur van Suriname 1973), which was enforced in 1981. When the Registration Law was enforced, the number of different medicines on the market decreased from about 8,000 to 2,000 pharmaceutical products. To date, 33 Surinamese companies have submitted 4,168 pharmaceutical products for registration, but only about 3,527 products have actually been approved and registered (2,049 prior to 1981 and 1,478 as of February 2003). Product registration is not limited to medicines on the National Medicines List (NGK). From 2000 to 2002 the Registration Board registered approximately 350 pharmaceutical products. On average, the process took 99 days per pharmaceutical product. While this is not unreasonable, pharmaceutical importers’ complaints that the registration process is too slow may have been justified in some cases. The shortest time it took to register a product in that time period was one day, while the longest was 649 days (almost two years); delays in registration involved products for which more information were repeatedly requested. Initially full documentation5 was required to register all pharmaceutical products, except the ones already registered in The Netherlands; the Registration Law was based on the Dutch Registration Law. In 1986 the Registration Law was amended so that 4 World Health Organization. Medicines Strategy 2000-2003 . Geneva: World Health Organization, 2000. 5 The product dossier required documentation on ingredients, production method, analysis, storage conditions, clinical tests and packaging and labeling information.
23
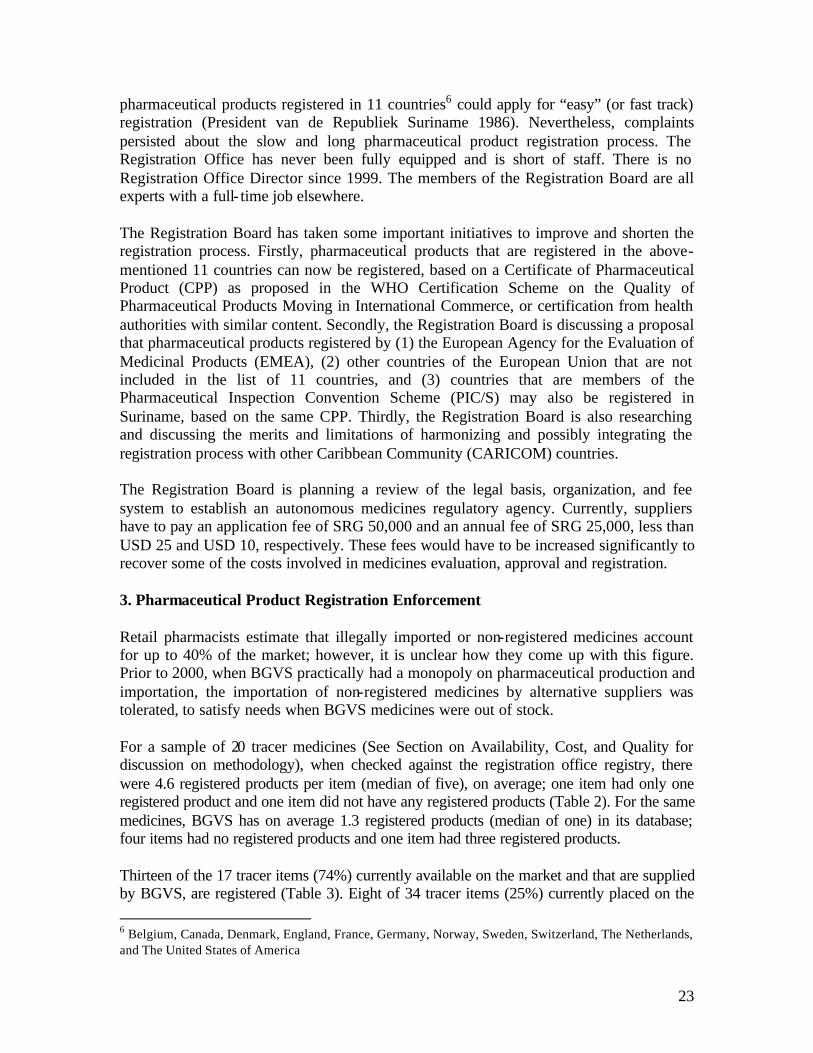
pharmaceutical products registered in 11 countries6 could apply for “easy” (or fast track) registration (President van de Republiek Suriname 1986). Nevertheless, complaints persisted about the slow and long pharmaceutical product registration process. The Registration Office has never been fully equipped and is short of staff. There is no Registration Office Director since 1999. The members of the Registration Board are all experts with a full- time job elsewhere. The Registration Board has taken some important initiatives to improve and shorten the registration process. Firstly, pharmaceutical products that are registered in the above-mentioned 11 countries can now be registered, based on a Certificate of Pharmaceutical Product (CPP) as proposed in the WHO Certification Scheme on the Quality of Pharmaceutical Products Moving in International Commerce, or certification from health authorities with similar content. Secondly, the Registration Board is discussing a proposal that pharmaceutical products registered by (1) the European Agency for the Evaluation of Medicinal Products (EMEA), (2) other countries of the European Union that are not included in the list of 11 countries, and (3) countries that are members of the Pharmaceutical Inspection Convention Scheme (PIC/S) may also be registered in Suriname, based on the same CPP. Thirdly, the Registration Board is also researching and discussing the merits and limitations of harmonizing and possibly integrating the registration process with other Caribbean Community (CARICOM) countries. The Registration Board is planning a review of the legal basis, organization, and fee system to establish an autonomous medicines regulatory agency. Currently, suppliers have to pay an application fee of SRG 50,000 and an annual fee of SRG 25,000, less than USD 25 and USD 10, respectively. These fees would have to be increased significantly to recover some of the costs involved in medicines evaluation, approval and registration. 3. Pharmaceutical Product Registration Enforcement Retail pharmacists estimate that illegally imported or non-registered medicines account for up to 40% of the market; however, it is unclear how they come up with this figure. Prior to 2000, when BGVS practically had a monopoly on pharmaceutical production and importation, the importation of non-registered medicines by alternative suppliers was tolerated, to satisfy needs when BGVS medicines were out of stock. For a sample of 20 tracer medicines (See Section on Availability, Cost, and Quality for discussion on methodology), when checked against the registration office registry, there were 4.6 registered products per item (median of five), on average; one item had only one registered product and one item did not have any registered products (Table 2). For the same medicines, BGVS has on average 1.3 registered products (median of one) in its database; four items had no registered products and one item had three registered products. Thirteen of the 17 tracer items (74%) currently available on the market and that are supplied by BGVS, are registered (Table 3). Eight of 34 tracer items (25%) currently placed on the 6 Belgium, Canada, Denmark, England, France, Germany, Norway, Sweden, Switzerland, The Netherlands, and The United States of America

24
market by private suppliers are actually registered. The Pharmaceutical Inspectorate authorizes the importation and distribution of non-registered products only for special reasons, such as BGVS shortages. However, it is unlikely that this authorization has been given for so many products that are currently marketed by private suppliers. The non-registered 75% is not related to the share of the market, but shows that, for this sample of essential medicines, a significant number of products available in pharmacies at the time of this survey were not registered. The data also suggest that, at least for 17 of the 20 tracer medicines (which have a minimum of three products), the argument that there are shortages of pharmaceutical products because of the registration process, may not be valid. Suppliers may choose to market any of the registered products, since the product registration is not exclusively awarded to the company that original submits the application (registers the product). Once a product is registered, any company is at liberty to import and sell the product in Sur iname. The non-registered products could also have been supplied by the so-called “suitcase” suppliers, who introduce them illegally, often on request of the retail pharmacists. The finding that products available on the market are not registered suggests that, either the Pharmaceutical Inspectorate is authorizing products to be imported without registration or that it is not conducting inspections and enforcing the requirement that pharmaceuticals should be registered. The Pharmaceutical Inspector is a retired pharmacist. She is being assisted by two pharmacy assistants. Given the number of pharmacies and dispensaries, each of the two pharmacy assistants should be able to cover about three outlets per month. Table 2. Number of Available Registered Products for Tracer Medicines, as found in MOH Registration Office Registry and BGVS database, January 2003. MOH
Registration Office Registry BGVS
Product Database Average Number of
Registered Products per Tracer Medicine
4.6
1.3
Median Number of Registered Products per
Tracer Medicine
5
1
Number of Tracer Medicines with No Registered Products
1
4
Range
0 – 10
0 – 3
Source: MOH Registration Office, BGVS and private suppliers, MSH survey of dispensing outlets.

25
Table 3. Number of Pharmaceutical Products Available in Pharmacies that were Registered, January 2003
Item description No. of Products Supplied by BGVS at Time of Survey
No. of Products Supplied by BGVS
that were Registered
No. Products Supplied by
Private Suppliers at Time of Survey
No. of Products Supplied by
Private Suppliers that were
Registered
Amoxicilline trihydraat 125mg/5ml drank 100ml 1 1 2 0
Amoxicilline trihydraat 500mg capsule(or tablets) 1 1 2 1
Atenolol 100mg tablet 1 0 2 1 Captopril 25mg tablet 1 1 4 3 Cimetidine 400mg tablet 1 1 2 0 Co-Trimoxazol 480mg tablet 1 0 2 1 Ferrofumaraat 200mg tablet 0 1 3 0 Foliumzuur 5mg tablet 0 1 1 0 Furosemide 40mg tablet 1 0 2 1 Glibenclamide 5mg tablet 1 1 2 0 Mebendazol 100mg tablet 1 1 1 0 Metronidazol 250mg tablet 1 1 3 0 Nifedipine 20 mg tablet retard 1 1 2 1 Oraal rehydratiemengsel samengesteld 27.9 gram 1 0 1 0
Salbutamol aerosol 0.1 mg/dose, 200 doses 1 1 2 0
Salbutamolsulfaat 4mg tablet 1 0 1 0 Ampicillinenatrium 1g injektie poeder 1 1 1 0
Kinine-Dihydrochloride 300mg/ml injektie 2ml 1 0 0 0
Natriumchloride 0.9% infuus 500ml 1 1 0 0
Thiopentalnatrium 500mg injektie poeder 0 0 1 0
Total 17 13 34 8
Percent 100% 76.5% 100% 23.5%
Source: MOH Registration Office, BGVS and private suppliers, MSH survey of dispensing outlets.

26
Dispensing Prescribers Anecdotal information, obtained through client focus groups in Study 6 and in interviews with key informants, indicates that some General Practitioners (GPs) dispense medicines to patients. This is illegal, as GPs are not legally allowed to dispense medicines, but neither the Pharmaceutical Inspectorate nor the medical association has effectively addressed this situation.

27
III. Pharmaceutical Financing and Spending There are three main sources of financing for pharmaceuticals:
1. The GOS/Ministry of Finance, through the Ministry of Social Affairs (MSA), the Ministry of Defense, the State Health Insurance (SZF), and the MOH *thorugh subsidies to the Medical Mission;
2. Private employers and parastatal firms; and 3. Consumers, through private insurance and out-of-pocket expenditures.
Currently, Suriname does not receive financial support from donor agencies for pharmaceuticals. However, the Belgian Government did give the GOS a grant of Francs 120 million (USD 3 million) for BGVS to procure essential medicines, in 1999 and 2000. 1. Expenditure Amounts and Sources Two recent studies included data on pharmaceutical expenditures. The actuarial study (MOH, 2001) reported expenditures at pharmacy level of SRG 4,205,400,000 for the SZF in 2000. The National Health Accounts study (NHA, Fishstein et al, 2002) estimated SZF expenditures for pharmacy medicines, of SRG 2, 800,000,000 for the same year. Our estimates of spending by source (Table 4) were derived from these two studies.7 Depending on the expenditure figures used for the SZF, total expenditures range between SRG16,229,400,000 and SRG17,831,200,000 (USD12,269,910 and USD13,316,804, respectively). These figures suggest that pub lic sector agencies (SZF, MSA, Medical Mission, and Ministry of Defense) accounted for 42.0% to 49.0% of expenditures; private employers and parastatal firms, 27.6% to 29.9%; and consumers, primarily from out-of-pocket, 24.0% to 26.1%. These figures suggest a national per capita spending on pharmaceuticals between USD 28 and USD 30. The figure compares Suriname per capita pharmaceutical spending with five other countries. Per capita pharmaceutical spending in El Salvador was USD32. Other countries spent much less, ranging from less than USD 2 in Tanzania to USD 19 in Peru.
7 Hospital expenditures on pharmaceuticals were estimated as 8% of total hospital costs (personal communication, RKZ hospital economist) for each funding source. Total expenditure on health by households is SRG 21,116.9 million in 2002 (NHA Study). Twenty per cent of this amount was estimated as out-of-pocket expenditure on medicines, of which 8% was estimated asout-of-pocket expenditure on hospital medicines.

28
Figure 1. Per Capita Spending on Pharmaceuticals in Selected Countries 1999 -2001
$0.00
$5.00
$10.00
$15.00
$20.00
$25.00
$30.00
$35.00
Suriname Peru El Salvador Nicaragua Tanzania Cambodia
Per
Cap
ita E
xpin
ditu
re o
n P
harm
aceu
tical
s
Source: Calculations from data in selected MSH studies8, 2001-2002. Among advanced industrialized countries, public spending on pharmaceuticals accounts for two-thirds of total pharmaceutical spending, which is paid through public budgets and social insurance; private spending on pharmaceuticals averages only one-third of total pharmaceutical expenditures. In Middle East and North Africa countries, the private sector, specifically households, accounts for 70% of spending on pharmaceuticals 9. Pharmaceuticals account for 46% of the out-of-pocket expenditures in these countries.
8 Country pharmaceutical sector assessments conducted in Cambodia, El Salvador and Tanzania for the Strategies for Enhancing Access to Medicines, presented at the SEAM Conference 2001: Targeting Improved Access, Washington, D.C., November 27-29, 2001; Barillas E, Guevara J, Paredes P. Rational Pharmaceutical Management Plus Program: Situación de los medicamentos en tres departamentos del Perú. Publicado para la Agencia de los Estados Unidos para el Desarrollo Internacional por el Progra ma Racional Pharmaceutical Management Plus. Arlington, VA: Management Sciences for Health, mayo 2002; Chaves A, Quesada C, Paredes P, Aristeguieta C. Sistema de suministro de medicamentos en El Salvador. Arlington, VA: Management Sciences for Health, febre ro 2002. 9 De S, Shehata I. Comparative report of national health accounts findings from eight countries in the Middle East and North Africa. Partners for Health Reform Technical Report No. 64. Bethesda, MD: Abt Associates, Inc, March 2001.

29
Table 4. Funding Sources and Estimated Pharmaceutical Expenditures, Year 2000 Funding Source Actuarial Study:
Amount (in million SRG)
Actuarial Study:
Percentage of Total (%)
NHA Study: Amount (in
million SRG)
NHA Study: Percentage of
Total (%)
SZF (Hospital medicines)
275.1 1.5 275.1 1.7
SZF (pharmacies) 4,205.4
23.6 2,800.0
17.0
MSA (hospital medicines)
304.0 1.7 304.0 1.9
MSA (pharmacies) 3,496.0 19.6 3,496.0 21.3 Medical Mission 200.0 1.1 200.0 1.2 Ministry of Defense (hospital medicines)
174.2 1.0 174.2 1.1
Ministry of Defense (pharmacies)
85.2 0.5 85.2 0.5
Private employers & Parastatal firms (hospital medicines)
574.7 3.2 574.7 3.5
Private employers & Parastatal firms (pharmacies)
4,275.9 24.0 4,275.9 26.0
Private insurance (hospital medicines)
1.9 0.0 1.9 0.0
Private insurance (pharmacies)
15.4 0.1 15.4 0.1
Out-of-pocket (hospital medicines)
337.9 1.9 337.9 2.1
Out-of-pocket (pharmacies)
3,885.5 21.8 3,885.5 23.7
Total 17,631.2 100.0 16,425.8 100.0 Source: Authors’ calculations from data reported in the NHA, SZF actuarial study, and MSA study. 2. Supplier Share of Pharmaceutical Market BGVS sales data for the year suggest that BGVS products accounted for SRG 7,077,608,812 of the total pharmaceutical expenditures in 2000 (Table 5). This is estimated by adding the 35% allowed retail pharmacy mark up to the value of BGVS sales for that year. Again, depending on the figure used as total pharmaceutical expenditure, BGVS products accounted for 41% to 42% of the market. This suggests that private suppliers accounted for 58% to 59% of the expenditures, by value. There are 33

30
registered wholesalers/distributors, of which nine are the major ones. How much of the private sector share is due to illegal imports (“suitcase” trade) is not known. Table 5. Estimated Costs for BGVS Products 2000 – 2002 Level Cost calculation 2000 2001 2002 Retail pharmacy
BGVS sales amount (x 1.35)
SRG 7,077.6 million
SRG 11,026.1 million
SRG 11,642.8 million
BGVS BGVS sales (based on recorded sales prices)
SRG 5,242.7 million
SRG 8,167.5 million
8,613.1 million
BGVS BGVS ex-warehouse costs (based on assigned costs)
SRG 3,557.0 million
SRG 5,53.5 million
SRG 6,295.1 million
BGVS suppliers
BGVS purchase costs
SRG 2,384.1 million
SRG 3,772.3 million
SRG 4,219.3
Value of BGVS purchases in US Dollars
Exchange rate: Up to October 2000: SRG 1,100 From November 2000: SRG 2,200
US$ 2.0 million US$ 1.7million US$ 1.9million
Source: BGVS database, 2003. Calculations by the authors. BGVS is still the most important supplier. We do not have data to determine how much the BGVS share of the market has decreased, if any, since the period when it practically had a monopoly on pharmaceutical importation and distribution. Even then, it seems that illegal imports were officially or unofficially allowed to compensate for BGVS stock outs. 3. Public Sector Spending on Pharmaceuticals Relative to BGVS Gross Margins and Mark ups From the public sector perspective, improving efficiency of public spending might begin by looking at ways to reduce BGVS prices to pharmacies and public hospitals. In discussions about BGVS mark ups, the mark up for gross profit was stated to be 10% of the cost price (which includes banking costs, 15% duty, import taxes, and other indirect BGVS costs). Data on BVS sales, costs and gross margins indicate that the mark up on product costs to determine the sales price far exceeds 10%, resulting in significant “excess margins” (Table 6).

31
Table 6. BGVS Pharmaceutical Sales and Real Gross Margins vs. 10% Gross margins 2000-2002
Year Sales Value
(SRG) Product Cost
SRG) Real Margin
(SRG) Excess Margin*
(SRG) 2000 5,242,673,194 3,557,102,552 1,685,570,642 1,329,860,387 2001 8,167,482,325 5,553,613,603 2,613,868,722 2,058,507,362 2002 8,613,149,427 6,295,143,712 2,318,005,715 1,688,491,344
Source: BGVS. * This was calculated by subtracting 10% of “product cost” from the amount found to be the “real margin” . The “product cost” (actually “loaded product cost”, which includes BGVS estimated costs added to the product acquisition cost and excluding the 10% for gross profit. Table 7 compares the cost and sales price calculation methods that are currently being used in BGVS and by one private supplier. The columns contain the costing elements, the calculation factor, and the resulting cost. Table 7. BGVS and Private Supplier Price Calculations With and Without Duty
BGVS Private Supplier Costing elements Calculation
factor Cost Calculation
factor Cost
A FOB 100.0000 100.0000 B Freight 5% of FOB 5.0000 5% of FOB 5.0000 C&F 105.0000 105.0000 C Insurance 0.4% of C&F 0.4200 0.4% of C&F 0.4200 D CIF Conversion to
SRG 105.4200 Conversion to
SRG 105.4200
E Banking Costs 1.25% of CIF 1.3178 (In other costs) 0.0000 Subtotal 1 106.7378 105.4200 F Duty 10% of CIF 10.542 15% of CIF 15.8130
Subtotal 2 117.2798 121.2330 G Statistics and
Consent 2% CIF 2.1084 2% CIF 2.1084
Subtotal 3 119.3882 123.3414 H Other (BGVS
Indirect) Costs 25% of Subtotal 3
29.84705 13% of CIF (1) 13.7046
I Cost Price 149.2353 137.0460 J (Gross) Profit 10% of Cost
Price 14.92353 10% of Cost
Price 13.7046
K Sales Price 164.1588 150.7506 Source: BGVS and a private supplier, 2003. Row A. Many items have been invoiced FCA. The FCA or FOB costs have been used as they are. Others Incoterms, such as CIF or CIP were used and the value filled under E.

32
Rows B and C. In principle, the BGVS system applies the real freight and insurance costs from the original invoice. However, many items are being grouped at forwarders at either Schiphol Airport (Amsterdam) or Rotterdam harbor in The Netherlands. Specific freight costs per item are not known in these cases, and 5% is applied to cover these costs. This percentage is based on BGVS experience over the years. When insurance costs are not known, BGVS uses a 0.4% estimate. Private suppliers apply actual costs, but for comparison reasons it is assumed that they pay rates that are similar to those of BGVS. The 0.4% BGVS estimate is also used here. Row D. The CIF price is converted from U.S. Dollar to Suriname Guilder (SRG). Private suppliers use the market rate (currently, SRG 3225 per USD). On the customs clearance documents the calculated CIF prices are being converted from foreign currency into SRG using the custom rates set by the Central Bank of Suriname. However, for price calculations the BGVS system uses BGVS rates that are neither the market rates nor the real rates for which foreign currency was bought from the Central Bank of Suriname (currently, SRG 2540 per USD). Since November 2000, BGVS is using an exchange rate of SRG 2200 per USD, below both that obtained from the Central Bank of Suriname and the market rate (available to private suppliers). Consequently, the results of the subsequent calculations are lower for BGVS than for the private supplier10. The difference with the current market rate of SRG 3,225 per USD is 54%, leading to complaints of BGVS “unfair competition” by private suppliers. Row E. The BGVS Banking Costs of 1.25% are fixed. The private supplier has included banking and currency fluctuations costs of 3.5% as part of the “Other Costs” factor of 13%. Row F. Duty on most medicines is 15%. Since April 2002, the BGVS database includes data on real duty paid. From 1 February 2001 to April 2002, BGVS used 10% as a standard factor for duty on all imported goods, based on duty ranges between 0% and 25% for different categories of products. The private supplier uses the actual duty paid (15%). Row G. Statistics and Consent Duties are fixed. The Statistics Duty is a tax levied for the GOS Statistics Office and the Consent Duty is an import authorization tax. Row H. The BGVS system adds 25% for Indirect Costs. There is no formal definition for these costs, but according to the BGVS General Manager, it covers both clearing costs as well as storage costs at BGVS. Storage costs are normally part of the gross margin on top of the cost price. The 13% used by the private supplier is applied for currency
10 When per 1 November 2000 BGVS changed its rate from SRG 1100 to SRG 2200 for one US$ it changed the sales prices (K) accordingly, but not the cost prices (I). Only after new items were received, did BGVS use the new rates for the weighted cost price calculation. However, because the old cost prices were not adjusted, the margins between the cost prices and sales prices have been artificially very large (see Section BGVS).

33
fluctuations (2.5%), labor costs (0.1%), transport costs (0.4%), banking costs (1%), and interest costs (9%). Although the calculation method given is clear, the data on BGVS costs and gross margins suggest that it is not consistently applied by the BGVS. The use of different costs complicates the calculation results. For example, BGVS seems to have applied real freight costs to calculations when they were known, and the estimated percentage was automatically applied by the BGVS information system when these costs are not known. On the other hand, private suppliers have to get Ministry of Trade and Industry approval for their cost price calculations. This approval forms part of the import clearance procedure for private suppliers; BGVS is not obliged to get this approval. In 1994, the Ministry of Trade and Industry allowed BGVS to use a standard calculation method that is similar to the current one, with a different percentage for “Indirect Costs”. Row J. According to current regulations, wholesalers are allowed to calculate a maximum gross profit of 22%. Both BGVS and the private supplier informants claim that they add 10% for gross profit. However, other private suppliers reported that they apply the maximum of 22%. If the 22% gross profit percentage is applied, the total markup for private suppliers would increase to 67.2%, compared to the BGVS 64% (with only a 10% gross profit factor). Row K. The BGVS database includes a calculated sales price and a current sales price. The calculated sales price is based on the cost structure described above. In some cases, products are sold well above the calculated sales price and in others, well below the cost price. According to the BGVS informant, the current BGVS sales price is based on former experience with previous purchases. BGVS managers could not provide an explanation for the inconsistency in applying calculated and actual sales prices. It would seem that private supplier markups should lead to lower prices. Options for alternative approaches to calculate markups could be explored and both BGVS and private supplier markup formulas harmonized. The BGVS sales prices are used as reference purchasing prices for the pharmacies, as these are the prices for which SZF guarantees reimbursements. This provides opportunities for private suppliers to offer products to pharmacies for a similar price as BGVS although their costs may be much less. It might also occur that pharmacies request reimbursements for items against the BGVS prices where they have purchased items against lower prices. For example, this might be the case with products from BGVS’ own production that have prices that are three times the international tendering prices (see Section on BGVS). 4. Potential Savings from Improved BGVS Procurement Table 8 projects potential savings that could have resulted, if BGVS had purchased 61 products at the median international price listed in the MSH International Price Indicator

34
Guide 2001. For 61 products in which the estimated BGVS FOB price was 110% or higher than the median international price, even at the stated markup of 64% on the FOB cost as much as SRG 1,016,906,566.48 (58.8%) could have been saved. At the estimated higher BGVS FOB cost, if the product mark up had been the current 64%, as described above, the ex-BGVS cost to hospital and retail pharmacies would still have resulted in savings of SRG 482,756,869.19 (27.9%) compared to the actual costs of SRG 1,730,817,282.00. If the markup of 64% is reduced, further savings could be effected; if the markup is reduced to 51% (as per markup calculation for private supplier), the ex-BGVS cost to hospital and retail pharmacies would be SRG 657,320,231.97, and savings would be 1,073,497,050.03 (62.0%). Table 8. Estimated Savings from Improved FOB Prices and Consistent Mark ups for 61 Essential Medicines in 2002 FOB Price Mark Up
Factor Applied to FOB Price
Sales (SRG) Difference with Current BGVS
Prices (SRG)
Difference Current BGVS Prices (US$)
Percentage Difference
(%)
Current BGVS Prices
1,730,817,282.00
BGVS Estimated FOB Prices
1.64 1,248,060,412.81 482,756,869.19 219,434.94 27.9
MSH Reference Prices
1.64 713,910,715.52 1,016,906,566.48 462,230.26 58.8
Source: BGVS. Calculations by authors. 5. Pharmaceutical Consumption Based on BGVS Sales Data Although the assessment of rationality of pharmaceutical prescribing, dispensing and use was not one of the objectives of this study, we attempted to determine if expenditures or consumption were consistent with prevalent morbidity and mortality. The REG has planned another study that will address the rational use of medicines in Suriname. It is assumed that BGVS sales (revenues) reflect consumption; the quantities of medicines that BGVS sells to hospital and retail pharmacies is assumed to be equivalent to the quantities dispensed to clients with prescriptions, or who purchase them for self-medication.
35
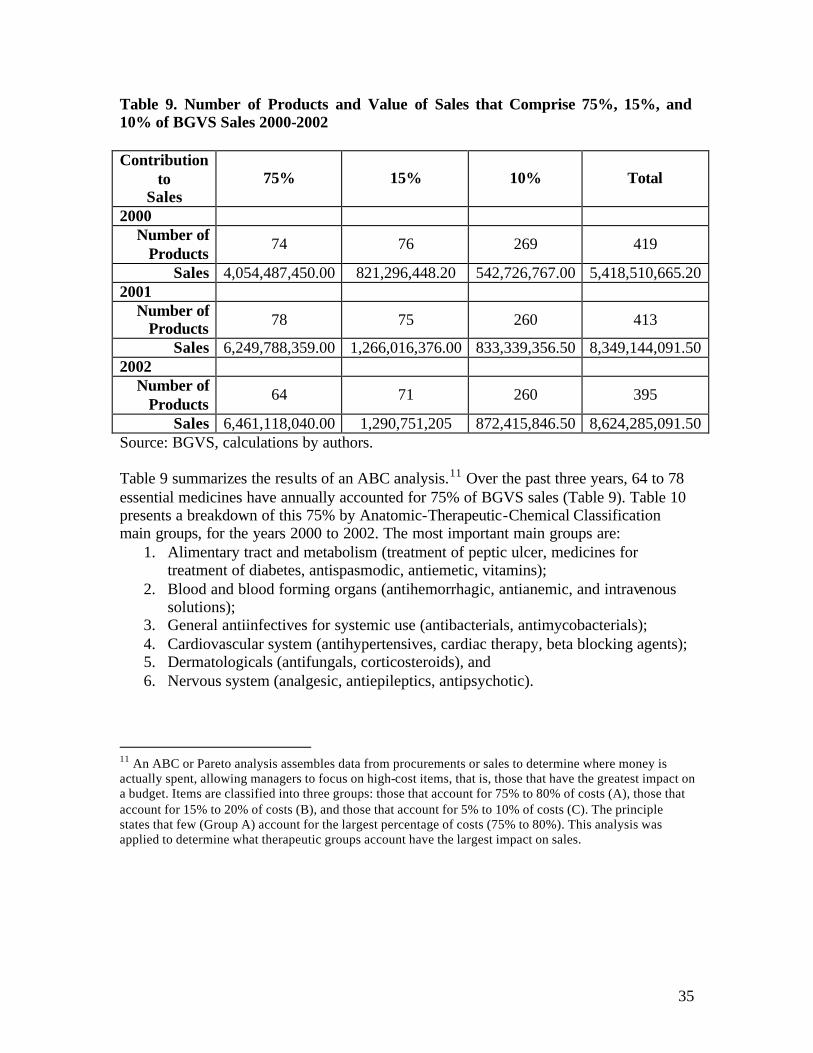
Table 9. Number of Products and Value of Sales that Comprise 75%, 15%, and 10% of BGVS Sales 2000-2002 Contribution
to Sales
75% 15% 10% Total
2000 Number of
Products 74 76 269 419
Sales 4,054,487,450.00 821,296,448.20 542,726,767.00 5,418,510,665.20 2001
Number of Products 78 75 260 413
Sales 6,249,788,359.00 1,266,016,376.00 833,339,356.50 8,349,144,091.50 2002
Number of Products
64 71 260 395
Sales 6,461,118,040.00 1,290,751,205 872,415,846.50 8,624,285,091.50 Source: BGVS, calculations by authors. Table 9 summarizes the results of an ABC analysis.11 Over the past three years, 64 to 78 essential medicines have annually accounted for 75% of BGVS sales (Table 9). Table 10 presents a breakdown of this 75% by Anatomic-Therapeutic-Chemical Classification main groups, for the years 2000 to 2002. The most important main groups are:
1. Alimentary tract and metabolism (treatment of peptic ulcer, medicines for treatment of diabetes, antispasmodic, antiemetic, vitamins);
2. Blood and blood forming organs (antihemorrhagic, antianemic, and intravenous solutions);
3. General antiinfectives for systemic use (antibacterials, antimycobacterials); 4. Cardiovascular system (antihypertensives, cardiac therapy, beta blocking agents); 5. Dermatologicals (antifungals, corticosteroids), and 6. Nervous system (analgesic, antiepileptics, antipsychotic).
11 An ABC or Pareto analysis assembles data from procurements or sales to determine where money is actually spent, allowing managers to focus on high-cost items, that is, those that have the greatest impact on a budget. Items are classified into three groups: those that account for 75% to 80% of costs (A), those that account for 15% to 20% of costs (B), and those that account for 5% to 10% of costs (C). The principle states that few (Group A) account for the largest percentage of costs (75% to 80%). This analysis was applied to determine what therapeutic groups account have the largest impact on sales.

36
Table 10. Relative Importance of Therapeutic Groups that Account for 75% of BGVS Sales, 2000-2002
2000 2001 2002
Category No. of
Items Sales (SRG)
% of Total Sales
No. of
Items Sales (SRG)
% of Total Sales
No. of
Items Sales (SRG)
% of Total Sales
Alimentary tract and metabolism 14 818,393,620.00 15.10 11 1,350,641,554.00 16.18 11 1,572,947,289.00 18.24 Blood and blood forming organs 8 622,322,619.00 11.49 9 1,164,125,638.00 13.94 8 1,309,703,659.00 15.19
Cardiovascular system 10 503,634,221.00 9.29 9 681,149,156.10 8.16 8 984,828,008.80 11.42
Dermatologicals 7 374,631,564.80 6.91 7 427,113,655.80 5.12 5 391,047,220.00 4.53 Genito urinary system and sex hormones 2 36,791,160.00 0.68 2 88,515,120.00 1.06 3 159,788,670.00 1.85 Systemic hormonal preparations, excl. sex hormones
1 31,488,000.00 0.58 2 62,621,137.00 0.75 3 109,228,869.00 1.27
General antiinfectives for systemic use 12 569,804,981.90 10.52 13 921,861,786.80 11.04 10 1,004,755,822.00 11.65 Antineoplasti c and immunodulating agents 0 0.00 0.00 2 67,534,830.00 0.81 1 27,943,533.00 0.32
Musculo-skeletal system 4 149,736,944.00 2.76 4 233,397,298.00 2.80 3 195,546,177.00 2.27
Nervous system 7 352,885,314.70 6.51 7 592,346,810.00 7.09 5 327,669,900.00 3.80
Antiparasitic products 3 72,632,380.00 1.34 5 330,702,480.00 3.96 3 168,812,800.00 1.96
Respiratory System 4 128,929,149.00 2.38 6 290,387,593.80 3.48 3 176,586,047.00 2.05
Sensory organs 1 29,916,496.00 0.55 1 39,391,300.00 0.47 1 32,260,046.00 0.37
Various 0 0.00 0.00 0 0.00 0.00 0 0.00 0.00
No Code 1 363,321,000.00 6.71 0 0.00 0.00 0 0.00 0.00
TOTAL 74 4,054,487,450.40 74.82 78 6,249,788,359.50 74.86 64 6,461,118,040.80 74.92
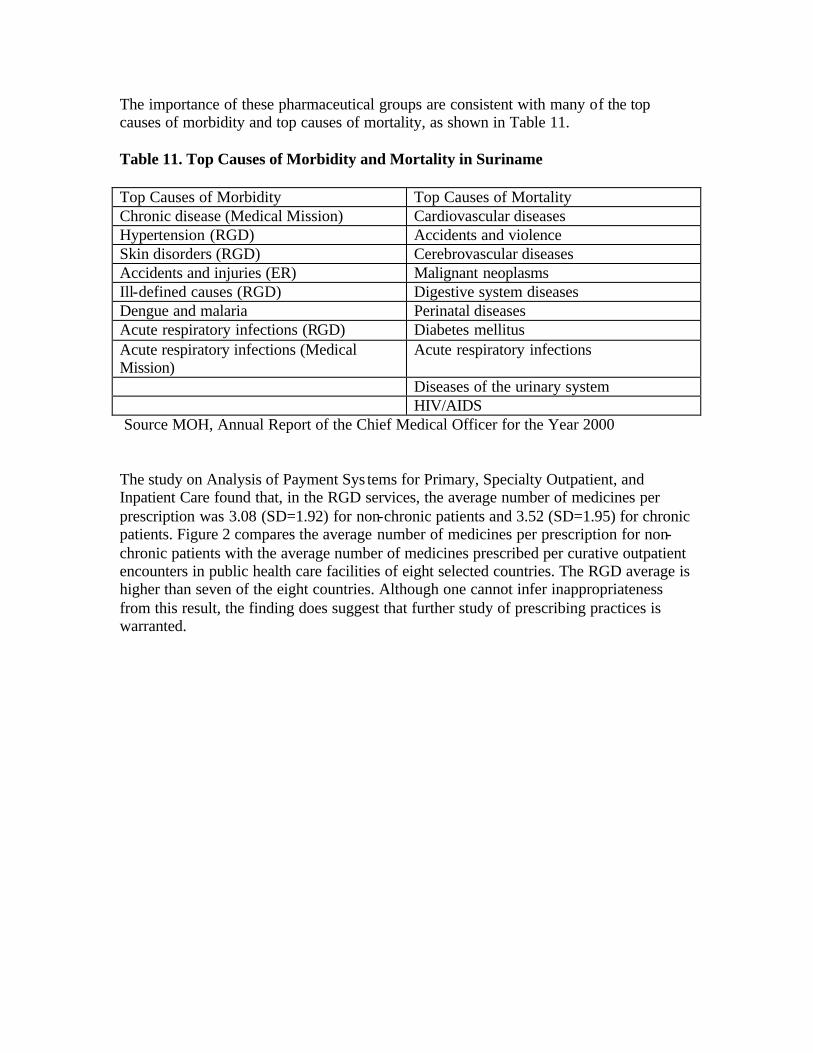
The importance of these pharmaceutical groups are consistent with many of the top causes of morbidity and top causes of mortality, as shown in Table 11. Table 11. Top Causes of Morbidity and Mortality in Suriname Top Causes of Morbidity Top Causes of Mortality Chronic disease (Medical Mission) Cardiovascular diseases Hypertension (RGD) Accidents and violence Skin disorders (RGD) Cerebrovascular diseases Accidents and injuries (ER) Malignant neoplasms Ill-defined causes (RGD) Digestive system diseases Dengue and malaria Perinatal diseases Acute respiratory infections (RGD) Diabetes mellitus Acute respiratory infections (Medical Mission)
Acute respiratory infections
Diseases of the urinary system HIV/AIDS Source MOH, Annual Report of the Chief Medical Officer for the Year 2000 The study on Analysis of Payment Sys tems for Primary, Specialty Outpatient, and Inpatient Care found that, in the RGD services, the average number of medicines per prescription was 3.08 (SD=1.92) for non-chronic patients and 3.52 (SD=1.95) for chronic patients. Figure 2 compares the average number of medicines per prescription for non-chronic patients with the average number of medicines prescribed per curative outpatient encounters in public health care facilities of eight selected countries. The RGD average is higher than seven of the eight countries. Although one cannot infer inappropriateness from this result, the finding does suggest that further study of prescribing practices is warranted.

38
Figure 2. Number of Medicines Prescribed per Curative Encounter in Selected Countries
0
0.5
1
1.5
2
2.5
3
3.5
4
4.5
5
Suriname Peru Brazil El Salvador Ghana Tanzania Senegal Cambodia India
Med
icin
es p
er E
nco
un
ter
Source: Data from Study 6 and selected MSH studies12
12 Country pharmaceutical sector assessments conducted in Brazil (Minas Gerais), Cambodia, El Salvador, Ghana, India (Rajasthan), Senegal, and Tanzania, presented at the SEAM Conference 2001: Targeting Improved Access, Washington, D.C., November 27-29, 2001; Barillas E, Guevara J, Paredes P. Rational Pharmaceutical Management Plus Program: Situación de los medicamentos en tres departamentos del Perú. Publicado para la Agencia de los Estados Unidos para el Desarrollo Internacional por el Programa Rational Pharmaceutical Management Plus. Arlington, VA: Management Sciences for Health, mayo 2002

39
IV. Availability, Cost and Quality of Medicines 1. Availability of Essential Medicines A survey was conducted to assess availability of a set of tracer medicines, availability products supplied by BGVS vs. other suppliers, and their unit prices. Since it was not possible to assess the availability of all of the 458 medicines listed on the National Drug List (NGK), this was done by using a sample of medicines, based on MSH’s rapid assessment methodology. Eighteen facilities, including 13 pharmacies, were surveyed. The sample of facilities included: • Seven private pharmacies, of which one is the pharmacy of the State Insurance
Company (SZF) and one is located in the district of Nickerie. Two out of the seven pharmacies do not have a service contract with the SZF. They only provide services to private patients and companies.
• Five hospitals, of which three are government-owned. These hospital pharmacies have a service contract with the SZF. The three government hospitals also provide services to the Ministry of Social Affairs (MSA) clients and private patients (including companies).
• Two sub-distributors, the Regional Health Services (RGD) and the Medical Mission for Primary Health Care Foundation (Medical Mission), respectively. Availability was measured in the pharmacy annex main storage facility and four of the facilities of the RGD. At the Medical Mission, availability was only measured at the warehouse in Paramaribo. These institutions cater to SZF and MSA patients as well as private patients (including companies).
All pharmacists in charge of the respective institutions were interviewed. Two of the government owned hospitals and the RGD do not have a pharmacist in their employ. In these cases the locum pharmacists and other key personnel were interviewed. Fifteen tracer medicines were selected because of their public health/therapeutic significance in primary care. These products address needs to treat the most frequent causes of visits to health facilities (bacterial respiratory infections in children and adults, acute diarrhea, intestinal parasite infestations, asthma, hypertension, diabetes mellitus, peptic ulcer disease, and prenatal care). The tracer list was discussed with Dr. Frank Bueno de Mesquita, Secretary of the Board of the Essential Drugs Program, and Vinodj Sewberath Misser, Chair of the Association of Pharmacists. For the subset of government hospitals and one private hospital, five hospital use products were added to the tracer list of medicines (nifedipine retard tablet, sodium chloride intravenous solution 500 ml, thiopental injection 500 mg, quinine injection 300 mg, and ampicillin injection 1 g.). The result is a list of 20 key items that were used to measure availability.

40
Table 12. Tracer Medicines and their Main Indications
1 10014.04 Amoxicilline trihydraat 125mg/5ml drank 100ml Respiratory infections, children 2 10014.02 Amoxicilline trihydraat 500mg capsule(or
tablets) Bacterial infections, adult
3 10024.01 Atenolol 100mg tablet Hypertension 4 10317.01 Captopril 25mg tablet Congestive heart failure;
hypertension 5 10061.02 Cimetidine 400mg tablet Peptic ulcer 6 10069.02 Co-Trimoxazol 480mg tablet Bacterial infections, urinary tract
infections 7 10114.01 Ferrofumaraat 200mg tablet Anemia 8 10123.01 Foliumzuur 5mg tablet Pregnancy control 9 10124.01 Furosemide 40mg tablet Diuretic
10 10128.01 Glibenclamide 5mg tablet Diabetes mellitus 11 10184.01 Mebendazol 100mg tablet Intestinal parasite infestation 12 10199.01 Metronidazol 250mg tablet Amebic dysentery 13 10358.01 Nifedipine 20 mg tablet retard Hypertension 14 10265.01 Oraal rehydratiemengsel samengesteld poeder
27.9 gram Acute diarrhea
15 10271.05 Salbutamol aerosol 0.1 mg/dose, 200 doses Asthma, children 16 10271.02 Salbutamolsulfaat 4mg tablet Asthma, adults 17 10015.01 Ampicillinenatrium 1g injektie poeder Bacterial infections 18 10164.04 Kinine-Dihydrochloride 300mg/ml injektie 2ml Malaria 19 10208.02 Natriumchloride 0.9% infuus 500ml Electrolyte balance 20 10289.01 Thiopentalnatrium 500mg injektie poeder Pre-operative general anesthetic
The number of items checked for availability varied, depending on the institution. In private pharmacies availability was only measured for items 1 to 16, as items 17 to 20 are hospital items. The RGD clinics do keep items 1 to 16 and item 19 in stock, but items 17, 18, and 20 are only purchased when there is demand from the periphery; the denominator was 17 for the RGD. The Medical Mission does not distribute item 20 to its health facilities; the number of items surveyed at Medical Mission facilities was 19. In the hospital pharmacies availability was assessed for the 20 tracer items. If an item was available at the time of the survey, it was checked whether the item came from BGVS, from other sources, or if the institution was buying from both BGVS and private suppliers. In case there was a supply of items from suppliers other than BGVS, the source (private supplier), brand, manufacturer and price per unit were recorded. A summary of the data is presented in Table 13.

41
Table 13. Availability of Tracer Medicines and Source of Supply
Institution Percent of Tracer Medicines available
at time of survey ( % )
Percent of Tracer Medicines
Available and Supplied by
BGVS ( % )
Percent of Tracer Medicines
Available and Supplied by another
wholesaler ( % )
Government Hospitals 90
83
52
HG 1 75 75 50 HG 2 100 90 90 HG 3 95 85 15
Private Hospitals
95
90
23
HP 1 90 90 10 HP 2 100 90 35
Medical Mission
94
95
10
RGD
94
92
1
RGD P 100 100 0 RGD 1 82 82 0 RGD 2 100 100 0 RGD 3 88 88 0 RGD 4 100 88 5
Private Pharmacies (average)
100
85
71
PP 1 100 44 100 PP 2 100 100 25 PP 3 100 75 100 PP 4 100 94 19 PP 5 100 100 56 PP 6 100 100 100 PP 7 100 81 100
Average Availability (%) 96 88 40 Legend: HG= Government Hospital, HP= Private Hospital, RGD= Regional Health Services, RGDP= Regional Health Services, Paramaribo, PP= Private pharmacy. Source: MSH medicines outlet survey, 2003. Annexes 4 and 5 contain data on the availability, sources of supply, and price relationships between the BGVS and alternative products. Availability in the pharmacies was good (96%) in general. Particularly in the private pharmacies, tracer medicines supplied by both BGVS and one or more private suppliers were available. At the same time, availability of the set of tracer medicines at the BGVS warehouse was 85%.

42
Availability of the tracer medicines in private pharmacies was 100%. Private pharmacies also had a greater percentage of tracer medicines (71%) that were supplied by private wholesalers compared to the other types of facilities (from 1% to 51%). The government hospitals had an average availability of 90% and the private hospitals, 95%; in these facilities, procurement from private suppliers was considerably lower (52% and 23% respectively). The RGD and the Medical Mission had fewer tracer medicines supplied by private suppliers. Overall, these data are consistent with the fact that hospitals and other government institutions have a cash flow problem. According to informants, these facilities were given credit by BGVS and many still have not paid up; BGVS has stopped credit sales to some of the government hospitals (see Section BGVS). Reportedly, private suppliers tend to give less credit, which limited their supplier options. From an international perspective, the availability of essential medicines in public facilities (hospitals and health facilities) Suriname compared favorably with seven of the eight countries, at least, as determined at the time of this study. 13 In each country the set of tracer medicines had been selected with criteria that were similar to the ones applied in this study, but they are not identical. Figure 3. Tracer Medicines Availability in Public Facilities in Selected Countries
0
10
20
30
40
50
60
70
80
90
100
Suriname Brazil El Salvador Peru Ghana Tanzania Senegal Cambodia India
Tra
cer
Med
icin
es A
vaila
bili
ty (
%)
Source: Data from this study and selected MSH studies (reference 12).
13 Data from studies conducted between 2000 and 2002, cited in reference 12.

43
The availability of the tracer sets of essential medicines in private pharmacies in Suriname compared quite favorably with those of eight countries for which MSH had recent data (Figure 4). Figure 4. Availability of Tracer Medicines in Private Pharmacies of Selected Countries
0
20
40
60
80
100
120
Suriname Brazil El Salvador Ghana Tanzania Senegal Cambodia India
Med
icin
es A
vaila
bili
ty (
%)
Source: Data from MSH SEAM and RPM Plus studies (reference) 2. BGVS vs. Private Suppliers’ Sales Prices to Pharmacies The following table shows availability of products and difference in prices for tracer medicines for BGVS and private suppliers.

44
Table 14. Comparison of BGVS Product Availability and Prices with Those of Private Suppliers January 2003
Pharmaceutical Product
Unit
BGVS
available
Private
Suppliers available
No. Available Private
Suppliers (PS)
BGVS Sales Price 2003
(SRG)
Lowest PS price/BGVS
(%)
Highest PS price/BGVS
(%)
1 Amoxicilline trihydraat 125mg/5ml
drank 100ml 1 Yes Yes 2 1,928.00 195% 467%
2 Amoxicilline trihydraat 500mg capsule(or tablets)
1 Yes Yes 2 150.00 117% 122%
3 Atenolol 100mg tablet 1 Yes Yes 2 64.80 192% 350%
4 Captopril 25mg tablet 1 Yes Yes 4 81.15 196% 253%
5 Cimetidine 400mg tablet 1 Yes Yes 2 102.00 147% 451%
6 Co-Trimoxazol 480mg tablet 1 Yes Yes 2 43.65 162% 550%
7 Ferrofumaraat 200mg tablet 1 No Yes 1 55.00 136% 136%
8 Foliumzuur 5mg tablet 1 No Yes 1 54.00 69% 69%
9 Furosemide 40mg tablet 1 Yes Yes 2 25.95 146% 146%
10 Glibenclamide 5mg tablet 1 Yes Yes 2 22.50 120% 467%
11 Mebendazol 100mg tablet 1 Yes Yes 1 20.95 129% 129%
12 Metronidazol 250mg tablet 1 Yes Yes 3 32.20 101% 118%
13 Nifedipine 20 mg tablet retard 1 Yes Yes 2 135.00 152% 188%
14 Oraal rehydratiemengsel samengesteld 27.9 gram
1 Yes Yes 1 186.00 242% 242%
15 Salbutamol aerosol 0.1 mg/dose, 200 doses
1 Yes Yes 2 4,514.00 115% 183%
16 Salbutamolsulfaat 4mg tablet 1 Yes Yes 1 26.20 132% 132%
17 Ampicillinenatrium 1g injektie poeder 1 Yes Yes 1 2,199.00 89% 89%
18 Kinine-Dihydrochloride 300mg/ml injektie 2ml
1 Yes No 0 477.00 0% 0%
19 Natriumchloride 0.9% infuus 500ml 1 Yes No 0 5,613.00 0% 0%
20 Thiopentalnatrium 500mg injektie poeder
1 No Yes 1 1,818.00 217% 217%
Total out of 20 items 17 (85%) 18 (90%)
Only two medicines (folic acid tablet and ampicillin injection) were available for a lower price from a private supplier than from BGVS. Most items supplied by private suppliers have prices that are considerably higher than those from BGVS. At the time of the study, private suppliers’ prices were based on the market rate of SRG 3,225 per USD. Although medicines are available in the pharmacies, the higher prices of products supplied by the private suppliers may adversely affect their accessibility for SZF patients. The SZF reimburses pharmacies based on the BGVS price list. When product prices are higher than the price on the BGVS price list (because items supplied by BGVS are out of stock), patients pay out of pocket. At the SZF administrative head office, these patients are reimbursed for their costs, based on the BGVS price list. At the time of this survey, SFZ patients may have had to pay out of pocket for approximately 12% of the tracer medicines, or go without the prescribed medicines. Alternatively, the dispensing pharmacy may obtain a temporary waiver from SZF to dispense items at a higher price when BGVS is out of stock. This applies only for registered and legally imported

45
products. How frequently this occurs and how much money is involved is not known, as the study was not designed to quantify its occurrence and impact. It does indicate, however, that even when medicines are available at priva te pharmacies, they may not necessarily be accessible to patients covered by SZF, and this probably includes those covered by MSA. According to private pharmacy staff, the pricing for the products to private patients is relatively similar among the pharmacies. A mark up of 35% is added to the supplier’s price. Most pharmacies use the BGVS sales prices as the minimum price used. Some pharmacies add a standard mark up for packaging. All pharmacies charge a minimum prescription item price varying between SRG1,000.00 and SRG2,000.00, analogous to the SRG2,000.00 minimum SZF prescription line price. The minimum sales price of most solid dosage forms such as tablets, capsules and suppositories is between SRG50.00 and SRG100.00 per unit. The only private clients that obtain credit are companies, if there is a service contract with the pharmacy. 3. Product Quality Concerns According to pharmacists, they have experienced product quality problems with products supplied by both BGVS and private suppliers. BGVS has delivered:
• expired products or products bear expiry date (for example, thiopental sodium 500mg powder for injection – expired; aminophylline 24 mg/ml injection 10 ml – close to expiry; timolol eye drops – expired in January);
• contaminated intravenous solutions; • xylomethazoline nose drops that caused contact irritation; • tablets that are not easily identifiable or that look very similar (for example,
captopril 25 mg and glibenclamide 5 mg, both looked very similar). Private suppliers have delivered: • discolored tablets and capsules (mostly non-registered products); • poorly packaged products (for example, calcium gluconate tablets that absorbed
moisture); Pharmacists also noted that both BGVS and private suppliers have sometimes not provided: • health care specialist information in generic and bulk packaged medicines; • clear instructions for powders for reconstitution available; and • complete packages for dosage forms that come as two or more components, as a
set (for example, creams with the applicators; powders with reconstitution liquid). Interviewed pharmacists also admitted that, because of long lasting stock outs at BGVS, some pharmacies have resorted occasionally to stocking sub-standard illegally imported products. Most pharmacists do not consistently report problems to BGVS. Those who do report often do not receive any follow up from BGVS.

46
V. The Drug Supply Company Suriname (BGVS) The Bedrijf Geneesmiddelenvoorziening Suriname (BGVS; Drug Supply Company Suriname) is a state-owned company located in the north of Paramaribo. Its predecessor was part of the Pharmaceutical Services Department of the Ministry of Health. In 1983 the BGVS was created by decree (i.e. the BGVS Decree, President van Suriname 1983). It was established to guarantee availability and affordability of essential medicines, supplies and equipment, through local production and importation and distribution. 1. Legal Status, Management and Organization Legally, the BGVS is a “sui generis” company, which means that its rules, responsibilities, and activities are regulated by the BGVS decree, rather than by a corporate act, as in the case of a “limited company”). The most important regulations in the decree are: • The Minister of Health appoints a Board of Directors, which has three to seven
members. • The Board of Directors nominates the General Manager and Deputy-General Managers,
who are appointed by the Minister of Health. • The General Manager is responsible for the day-to-day executive management of the
company, with power to hire and fire personnel and effect payments up to a maximum of SRG 25,000.
• The General Manager is also responsible for the annual budgets and financial reports. These documents need to be presented, after approval by the Board of Directors, to the Minister of Health within certain periods of time described in the decree. The financial accounts are subject to annual external audits.
Since the early nineties, proposals have been made to change the BGVS legal status into a limited company or, alternatively, a holding with two limited companies: a trade company (for procurement and distribution of medicines and other health supplies) and a company for the production of pharmaceuticals. These options have been described recently in the Beleidsplan BGVS NV paper (Draft Policy Plan BGVS Limited, BGVS 2002), with an outline for a new mission statement, objectives, and strategies for a restructured BGVS. However, this draft policy has not been formally discussed by the Board and BGVS managers or been developed into an official company policy. Currently, BGVS has neither a clear company policy nor a planning system14, although the General Manager indicated that BGVS operations are based on key guidelines in the BGVS decree and the National Essential Medicines List. Budgets are prepared mainly on the basis of previous expenditures and are not monitored and analyzed for planning. As of February, the budget for the current year (2003) is still under preparation. The Board of Directors has not approved budgets since 1998, although budgets have been submitted up to 2002. The 1998 audit report is the most recent one that was submitted. According to the General Manager, 1999 and 2000 annual accounts have been audited and the reports 14 BGVS is working without identified goals or targets. No path has been set out, with possible bench marks on the way, to establish the objective to make all essential drugs and supplies available.

47
will be presented soon. She also confirmed that the Minister of Health has not reacted to the report on 1994 BGVS net profits, which was submitted by the Board of Directors in 1996. However, the Minister signed off on the report. According to existing reports (Ernst & Young 1999 and BGVS 2002), BGVS has been making profits since 1988. The General Manager also indicated that, in 1996, the Board of Directors has given her approval to effect payments for day-to-day BGVS operations that exceed the limit of SRG 25,000 allowed by the BGVS decree; at current market exchange rate, the official limit is about US$ 8.00). Other findings on BGVS financial performance are being discussed below. BGVS representatives have not participated in either the drafting of the National Medicines Policy (REG 2002) or in the preparation of its implementation plan. The BGVS pharmacist is a member of a sub-committee of the REG, the NGK committee (Suriname Essential Medicines List Committee). BGVS senior staff do not participate in any other GOS committees that relate to pharmaceuticals, such as the Board for the Essential Medicines Program (REG), the sub-committee for Specialized Medicines, and the Committee for Standard Treatment Guidelines. Formal BGVS contact with the MOH occurs through the Board of Directors; however, the Board of Directors has not met with the General Manager since August 2001 The Board of Directors has informed the Minister of Health that the General Manager (appointed in 1996) should be replaced. The Minister has neither honored this request nor the subsequent request of the Board to have it released of its duties.

48
Figure 5. BGVS Organizational Structure
Figure 5 shows the current BGVS organizational structure. The number of BGVS personnel is 78, including the General Manager, one Deputy-General Manager and 6 senior staff members. There is a shortage of senior staff. Out of the 11 senior staff positions (counting from Heads of Unit up to the General Manager) three positions are vacant. Since 2001, the Deputy-General Manager Production & Warehousing stopped being responsible for the Warehouse. The position of Manager for Quality Control has been vacant since 1999 and is currently being filled by a private pharmacist on part-time basis. The Deputy-General Manager for Finance/ Head of Financial Administration and the Manager for Commercial Department positions are also vacant. BGVS has asked pharmacists to apply for the positions of Manager of Quality Control and Manager of Commercial, but no one has applied. It seems that the salaries offered are lower than those available for pharmacists in the private sector. Currently, BGVS Human Resource Management is preparing a new company analysis in order to update the organization structure and job descriptions. A study on the BGVS organization (De Meneges 2001) concluded that BGVS is being mis-managed, based on the following grounds:
Organizational Structure BGVS 2003
HeadGeneral Affairs
SecretaryGeneral Manager Secretariat
HeadHuman Resource Management
ManagerQuality Control Laboratory
vacant
HeadInternal Audit
ChiefFinancial Administration
vacant
Deputy-General ManagerFinancevacant
HeadProcurement
HeadSales/Expedition
ManagerCommercial Department
vacant
ChiefWarehouse
Chief (3)Sterile Production
TablettingGalenical
Deputy-General ManagerProduction/Warehouse
General Manager
Board of DirectorsNot operational

49
1. There is no (written) company policy. 2. There are no formal annual planning documents. 3. The annual budgets are not complete (e.g. no targets and no funding plan) and are not
being used for monitoring. 4. Financial reports are more than two years behind schedule and there is a backlog in
the data input of the ledger of more than 18 months. 5. Costs of inefficient operations are hidden in, wrongfully, calculated cost prices of
products. 6. There are either no Standard Operating Procedures or they are not adhered to. 7. There is considerable lack of communication and consultation at all levels. 8. Decisions are often not being made or are being made with delay and on unclear
grounds. 9. There is a lack of trust between management and personnel. A face-to-face discussion on the De Meneges report between the BGVS Board of Directors and the General Manager has never taken place. Parts of the De Meneges report were published in the press even before it was presented to the BGVS General Manager. The General Manager has compiled comments from senior staff and sent them to both the Board of Directors and the Minister of Health; according to the General Manager, there was no further follow up. The findings in the current study suggest that many of the observations mentioned in the De Meneges report are still valid. 2. Financial Management BGVS operations have been affected by Suriname’s economic crisis. The dramatic devaluation of the Surinamese Guilder (SRG) adversely affected BGVS financial performance, like many other companies in Suriname. However, the lack of a clear policy, both at government and company level have led to reduced gross margins in the last three years. Firstly, BGVS did not make timely adjustments of its prices to the change in rates for foreign currency (see Section on Price Calculations and Markups). Secondly, the lack of a clear policy for the management of clients’ purchases on credit has, on average, made the total debts due to credits accumulate to an amount that is equivalent to total BGVS 2002 sales (see below). Nonetheless, officially BGVS recorded annual profits from 1988 to 1998 (Ernst & Young 1999) and continued to do so in 1999 and 2000, according to internal financial reports (BGVS 2002). This was likely due to extensive markups, which are explained in Section Price Calculations and Markups. A Deputy-General Manager for Finance was in charge of BGVS Financial Administration. The post has not been filled since his resignation in September 2002, and the General Manager, in consultation with a local accountancy and consultancy firm, is recruiting a Head of the Finance instead. Recently, an interim manager was hired to assist with the most urgent work to be done. Reportedly, the ledger is 15 months in arrears. The 2003 budget is still under preparation. As mentioned previously, the budgets are not based on actual plans or company policy. Some years ago, changes were made in recording of detailed data in the chart of accounts when the accounting software was

50
changed to Exact. In the course of this study, the Head of Internal Audit found that information on several specific costs that used to be available is no longer captured. The situation with the debtors is of particular concern, as BGVS will progressively get back less money, in real terms (Figure 6). From the end of 1999 to the end of 2002, total sales on credit given to BGVS’ clients increased 58% from SRG 5,559.7 billion to SRG 9,621.1 billion, which is equivalent to 12 months of BGVS sales. This is the result of a lack of policy on credits and debt collection since 1997, when the outstanding debts from sales on credit was SRG 917 million, equivalent to four months of sales (Ernst & Young 1998). Government institutions account for 44% of the outstanding debt (Table 16). Figure 6. BGVS Outstanding Debts from Clients’ Purchases on Credit 1998 – 2002
0.0
2000.0
4000.0
6000.0
8000.0
10000.0
12000.0
1998 1999 2000 2001 2002
SRG millions
US$ x1000

51
Table 15. Major BGVS Clients’ Accumulated Debts to BGVS from Credit Purchases in Relation to Purchases Effected
BGVS Clients Purchases 2002 (SRG millions)
Debt to BGVS as of 31 Dec-
2002 (SRG millions)
Credits Received/ Purchases ratio (%)
Credits Received (in months of
purchases)
G1 1,030.0 1,011.1 98% 12 G2 410.5 597.4 146% 17 hg1 523.3 964.9 184% 22 hg2 1,335.3 849.3 64% 8 hg3 675.4 783.7 116% 14 hp1 554.9 1,207.3 218% 26 hp2 691.5 861.8 125% 15 P01 496.8 342.8 69% 8 P02 253.6 273.1 108% 13 P03 668.4 216.8 32% 4 P04 47.8 176.8 370% 44 P05 267.3 113.1 42% 5 P06 89.0 95.0 107% 13 P07 219.7 80.3 37% 4 P08 71.5 77.8 109% 13 P09 150.9 71.9 48% 6 P10 311.1 71.7 23% 3 P11 170.6 68.8 40% 5 P12 52.3 66.4 127% 15 P13 219.7 58.9 27% 3 P14 15.5 2.6 17% 2 Other 1,517.2 1,629.7 107% 13
Total/Average 9,772.3 9,621.0 98% 12 Source: BGVS. 2003.
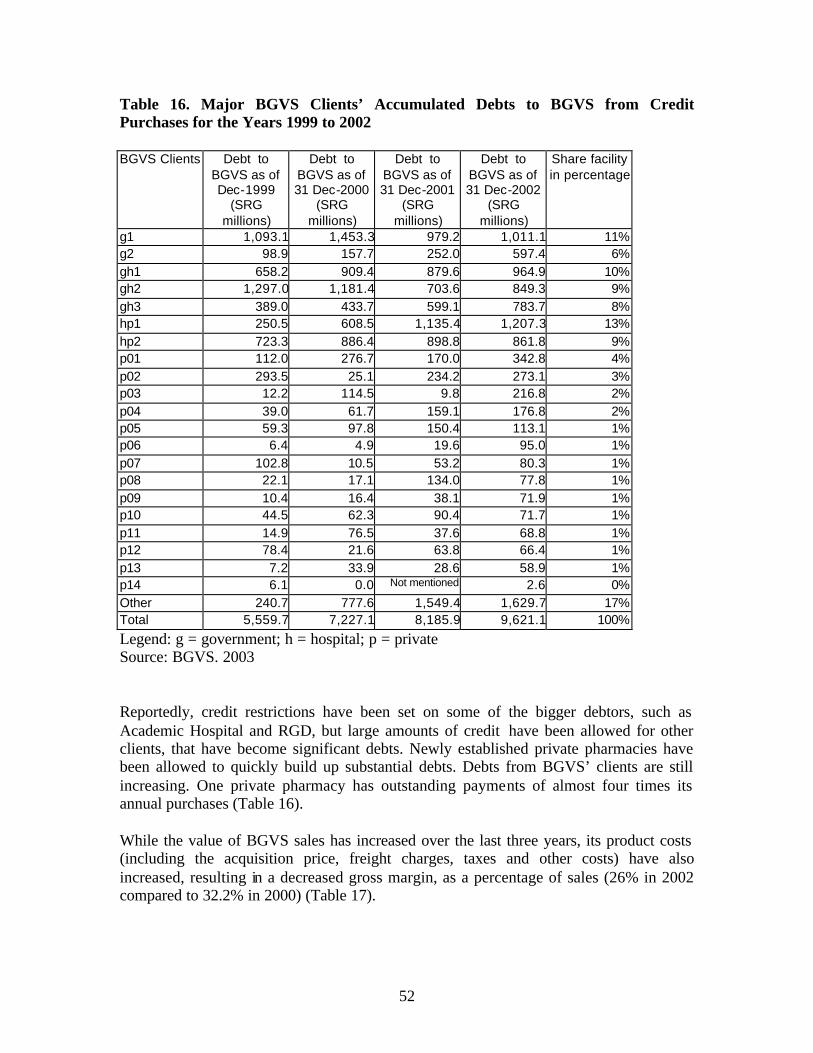
52
Table 16. Major BGVS Clients’ Accumulated Debts to BGVS from Credit Purchases for the Years 1999 to 2002 BGVS Clients Debt to
BGVS as of Dec-1999
(SRG millions)
Debt to BGVS as of 31 Dec-2000
(SRG millions)
Debt to BGVS as of 31 Dec-2001
(SRG millions)
Debt to BGVS as of 31 Dec-2002
(SRG millions)
Share facility in percentage
g1 1,093.1 1,453.3 979.2 1,011.1 11% g2 98.9 157.7 252.0 597.4 6% gh1 658.2 909.4 879.6 964.9 10% gh2 1,297.0 1,181.4 703.6 849.3 9% gh3 389.0 433.7 599.1 783.7 8% hp1 250.5 608.5 1,135.4 1,207.3 13% hp2 723.3 886.4 898.8 861.8 9% p01 112.0 276.7 170.0 342.8 4% p02 293.5 25.1 234.2 273.1 3% p03 12.2 114.5 9.8 216.8 2% p04 39.0 61.7 159.1 176.8 2% p05 59.3 97.8 150.4 113.1 1% p06 6.4 4.9 19.6 95.0 1% p07 102.8 10.5 53.2 80.3 1% p08 22.1 17.1 134.0 77.8 1% p09 10.4 16.4 38.1 71.9 1% p10 44.5 62.3 90.4 71.7 1% p11 14.9 76.5 37.6 68.8 1% p12 78.4 21.6 63.8 66.4 1% p13 7.2 33.9 28.6 58.9 1% p14 6.1 0.0 Not mentioned 2.6 0% Other 240.7 777.6 1,549.4 1,629.7 17% Total 5,559.7 7,227.1 8,185.9 9,621.1 100%
Legend: g = government; h = hospital; p = private Source: BGVS. 2003 Reportedly, credit restrictions have been set on some of the bigger debtors, such as Academic Hospital and RGD, but large amounts of credit have been allowed for other clients, that have become significant debts. Newly established private pharmacies have been allowed to quickly build up substantial debts. Debts from BGVS’ clients are still increasing. One private pharmacy has outstanding payments of almost four times its annual purchases (Table 16). While the value of BGVS sales has increased over the last three years, its product costs (including the acquisition price, freight charges, taxes and other costs) have also increased, resulting in a decreased gross margin, as a percentage of sales (26% in 2002 compared to 32.2% in 2000) (Table 17).

53
Table 17. BGVS Pharmaceutical Sales and Gross Margins 2000-2002
Year Sales Value Product Cost Gross Margin Margin (%) 2000 SRG 5,242,673,194 SRG 3,557,102,552 SRG 1,685,570,642 32.2% 2001 SRG 8,167,482,325 SRG 5,553,613,603 SRG 2,613,868,722 32.0% 2002 SRG 8,613,149,427 SRG 6,295,143,712 SRG 2,318,005,715 26.9%
Source: BGVS. We calculated operating costs as a percentage of sales for the three categories of products marketed by BGVS (Table 18).15. The comparison indicates that producing pharmaceuticals is less efficient than importing them. The costs to sales proportion for BGVS products is more than three times that of BGVS imported products. BGVS production is further discussed later. Table 18. BGVS Operating Costs as a Percentage of Sales Year 2000 Imports Production Other Products Value of Sales SRG 4,776,896,593 SRG 465,776,601 SRG 708,369,926 Operating Costs SRG 1,047,176,152 SRG 345,291,727 SRG 175,062,165 Costs as % of Sales 21.9% 74.1% 24.7%
Source: BGVS. Calculations by authors. The inventory turnover rate is the most frequently used ratio to measure of financial efficiency. The data in Table 20 shows that the BGVS turnover ratio is well below 3.0, which is considered to be the minimum, below which managers should become concerned.16 . Table 19. BGVS Turnover by Type of Products, Year 2000
Types of Products Inventory Cost of Goods Sold Turnover
Ratio Imported medicines SRG 3,015,740,082 SRG 3,160,481,862 1.05 BGVS products SRG 421,570,504 SRG 516,894,092 1.23 Other products SRG 519,076,277 SRG 502,174,045 0.97
Source: BGVS. Calculation by authors. Table 20 provides a breakdown of operating costs according to type of activity: production, purchasing, inventory holding and distribution, sales, quality control, and others (management, building, utilities, maintenance, security, and quality control). The holding costs as a percentage of the average inventory is 25%; in commercial firms, the inventory holding cost is usually between 25 and 35% of average inventory17. This suggests that BGVS inventory holding costs are within acceptable limits. Nevertheless,
15 In this calculation, the cost of acquired products, and losses from inventory were not included. 16 Marion Laboratories. Effective pharmacy management. 4 ed. Kansas City, MO: Marion Laboratories, Inc., 1987. 17 Management Sciences for Health and World Health Organization. Managing drug supply. 2 ed., revised, and expanded. West Hartford, CT: Kumarian Press, 1997.

54
the average inventory is very high, significant resulting in financial opportunity costs18 of SRG 542,194,780 (US$404,925, at exchange rate of SRG1,339 per USD). Table 20. BGVS Inventory Holding Costs Year 2000
Cost Category Total Product Acquisition Costs SRG 5,097,657,216 Average inventory SRG 3,520,745,323 Inventory Holding Costs SRG 885,490,225
Financial opportunity cost (15.4% interest rate) SRG 542,194,780 Losses from inventory SRG 106,603,872
Operating costs-storage and stock management SRG 123,576,670 Transport costs-to clients SRG 113,114,903
Holding cost as % of average inventory 25.2%
Purchasing Costs SRG 531,831,702 Quality Control Costs SRG 68,751,479 Sales Department Costs SRG 37,257,143 Production Costs SRG 162,426,162 Other Costs SRG 535,139,705 TOTAL SRG 7,318,553,632
Source: BGVS. Calculation by authors. Data was available to estimate profits for the year 2000 (Table 21). There were insufficient data to estimate profits for 2001 and 2002. The data indicate that BGVS registered a net profit in 2000, in spite of the observed inefficiencies. Since it became self-supporting in the mid-80s, the BGVS has never experienced losses, nor has it asked for financial assistance from the GOS (reported in Study 6).
18 The opportunity cost is the market value of funds tied up in inventory that could be used for some other purpose. The opportunity cost is incremental—the higher the inventory, the higher the opportunity cost.

55
Table 21. Year 2000 Gross Sales, Costs, and Net Profit GROSS SALES:
Imported products 4,130,074,207 69.4% BGVS production 465,386,113 7.8%
Others 1,355,582,801 22.8% TOTAL GROSS SALES 5,951,043,121 100.0% COST OF GOODS SOLD (*) 4,179,549,999 70.2% GROSS MARGIN (A) 1,771,493,122 29.8% EXPENSES:
Personnel 679,926,743 Purchasing costs, excl. value of items 487,072,764
Building and energy costs 128,700,853 Depreciation 66,846,644
General operating costs 175,778,488 Insurance costs 10,374,819
Warehousing costs 7,136,368 Quality Control Department 11,691,365
Miscellaneous, bad debts, etc. 797,739,975 TOTAL GROSS EXPENSES 2,365,268,019 39.7% Expenses (adjustment)** 2,007,791,558 TOTAL NET EXPENSES (B) 357,476,461 NET PROFIT (SRG) (A MINUS B) 1,414,016,661 23.8% NET PROFIT (USD) [rate=1,339] 1,056,024 NET PROFIT (USD) [rate=2,200] 642,735 Source: BGVS, calculations by authors * These costs are already loaded with operating costs, which are summarized under “Expenses”. They are not exclusively the product cost (FOB price) to BGVS. ** These expenses are already factored into the “Cost of Goods Sold”, so that they must be subtracted from the “Total Gross Expenses”; this “Total Net Expenses” amount is subtracted from the “Gross Margin” to determine the “Net Profit”.

56
3. Legal framework and BGVS procurement policy The Comptabiliteitswet (Accountability Law) of 1953 together with several GOS resolutions contain the national legal framework for public procurement. There are plans for a much needed review and update of the public procurement regulations under the ongoing Public Sector Reform. Currently, public tenders are required for all public procurement with a value of more than SRG 10 million (approximately US$ 3,500). The BGVS has not floated tenders since 1995. Neither have any advertisements been issued nor any other public announcements have been made to ensure sufficient and adequate competition among available suppliers. Most BGVS procurement is done using the international shopping method, in which a limited number of suppliers are invited to send quotations, or by direct contracting. This is not in compliance with the Comptabiliteitswet and contrary to good procurement practices19, which call for adequate competition and transparency. There is no (written) BGVS procurement policy. Some Standard Operating Procedures for procurement have been prepared, but have not been fully drafted, nor officially endorsed and implemented. In 1997 and 1998 a consultancy firm assessed BGVS procurement, developed an organizational diagram, and job descriptions. It made recommendations for staffing, office space and equipment. Recommendations also addressed procurement procedures (KPMG 1997, 1998). However, the consultancy’s impact was limited because: 1. Neither the legal procurement framework nor the MOH medicines policy were taken
into consideration, 2. BGVS procurement policy was not discussed, 3. No analysis was made in relation to the BGVS core objective to guarantee the
availability of essential drugs (qualitative analysis), 4. The proposals for the procurement organization structure, personnel and equipment
were not based on the workload (quantitative analysis), 5. Many recommended procedures were not relevant, as they were related to a one-off
donor project with its own specific rules and guidelines that has been ended since, and
6. Essential elements of procurement were not covered, such as • selection, including identification of different procurement groups; • procurement planning, including financial planning, prioritization and exceptions; • procurement thresholds; • product quality; • contracting and contract monitoring, including the set-up and maintenance of a
procurement registry and filing system; or • ethical issues addressed.
19 As stated in the Operational Principles for Good Pharmaceutical Procurement, procurement in the public health sector should be based on competitive procurement methods, except for very small or emergency orders. This applies to a parastatal organization, such as BGVS.

57
The Procurement Procedures drafted by the Head of Procurement (BGVS, undated) are based on the 1996 Procurement Guidelines of the Ministry of Foreign Affairs of The Netherlands (DGIS), but they were never fully implemented and have not been maintained. These procedures are also not comprehensive. The current DGIS guidelines require International Competitive Bidding (ICB) according to World Bank Guidelines (World Bank 1995). There is no tender or procurement committee. The extensive use of international shopping, instead of international competitive bidding, presents a risk for inappropriateness. 4. BGVS Procurement Performance There is shortage of qualified personnel in the Purchasing Department. The position of Manager for the Commercial Department has been vacant for two years. Only the Head of Procurement is qualified in procurement. The two buyers have only received a short course and do not have experience with international tenders. Management, record-keeping, and monitoring are poor. The procurement records are not well organized. The Procurement Unit could not provide an up-to-date summary of the procurement of pharmaceuticals for the last three years (2000 to 2002)20. The Procurement Unit works with at least three different software systems that are not linked to each other. (1) parts of the BGVS database procurement module, (2) MS Excel ® for contract monitoring, and (3) a program for the clearing of goods. There are no planning, budget, or annual reports. There is no procurement registry and the monitoring system is incomplete. The impetus to start procurement comes from outside the procurement unit with an “advice to procure” document. The Head of Procurement explained that, for the past two years, the “advice to procure” documents have been prepared irregularly. Since the Manager of the Commercial Department left 2 years ago it is unclear who should do this, how and when it should be done. Currently the BGVS pharmacist prepares the “advice to procure”. There are significant problems with quantification (estimation of procurement quantities). The quantification tool in the BGVS database is not used and has not been maintained for some time. The findings presented in Table 23 suggest that quantification is done in an irregular manner; one item has expired in January 2003, but no new order has been placed. At least for two items, quantities of more than two years’ requirements have been ordered; one of them still has stock for more than one year. The lack of planning and the confusion over who is responsible for what stage in the procurement process have led to many urgent orders, as reflected in the many small orders and the high ratio of purchase orders by air freight (see tables 18 to 20).
20 All procurement data used in this study has been extracted from the BGVS database. Both the Head of Procurement and the Head of Internal Control say that this data is incomplete and not always correct. For example, data on duty paid was not entered in the BGVS database until the beginning of 2002; the system assumed that no duty was paid and left these costs out in the cost price calculations.

58
Table 22. Availability of Tracer Medicines at the BGVS Warehouse, February 2003
Item description Unit Estimated annual needs
(rounded up)
Availability in # units at BGVS per 1 February
2003
Availability in # weeks at BGVS
per 1 February
2003
Remarks On order quantity
On order (#weeks)
1 Amoxicilline trihydraat 125mg/5ml
drank 100ml 1 35,000 9,847 15 50,000 74
2 Amoxicilline trihydraat 500mg capsule(or tablets)
1 2,500,000 2,307,000 48 0 0
3 Atenolol 100mg tablet 1 1,500,000 130,000 5 2,000,012 69 4 Captopril 25mg tablet 1 2,000,000 1,132,000 29 0 0 5 Cimetidine 400mg tablet 1 1,000,000 804,000 42 0 0 6 Co-Trimoxazol 480mg tablet 1 1,000,000 1,985,000 103 Half quantity
expected to expire April 2004
3,000,000 156
7 Ferrofumaraat 200mg tablet (2) 1 1,700,000 0 0 0 0 8 Foliumzuur 5mg tablet (2) 1 600,000 0 0 0 0 9 Furosemide 40mg tablet 1 500,000 290,000 30 0 0 10 Glibenclamide 5mg tablet 1 3,000,000 1,267,000 22 0 0 11 Mebendazol 100mg tablet 1 600,000 446000 39 1,652,000 143 12 Metronidazol 250mg tablet 1 250,000 180,000 37 1,200,000 has
expired already 0 0
13 Nifedipine 20 mg tablet retard 1 1,700,000 694,000 21 2,600,000 80 14 Oraal rehydratiemengsel
samengesteld 27.9 gram 1 50,000 1,146 1 14,400 15
15 Salbutamol aerosol 0.1 mg/dose, 200 doses(1)
1 22,000 6,803 16 10,000 24
16 Salbutamolsulfaat 4mg tablet 1 800,000 1,198,000 78 expiry date in 2005
2,125,000 138
17 Ampicillinenatrium 1g injektie poeder
1 40,000 4,697 6 40,000 52
18 Kinine-Dihydrochloride 300mg/ml injektie 2ml
1 3,000 2,363 41 0 0
19 Sodiumchloride 0.9% infuus 500ml 1 65,000 40,569 32 0 0 20 Thiopentalnatrium 500mg injektie
poeder 1 6,000 0 0 2198 vials
have expired January 2003
0 0
Source: BGVS database Table 23 shows the price comparison for 20 key items. There are 10 items with a higher price than the median international tender price (MSH 2001) but two of them are products from the BGVS production laboratory. Without these two products the average BGVS procurement price to median international tender price ratio is 0.87 or 87% which is much lower than the 2.46 reported in Study 6. Only one product out of 18 import products had a price almost twice the median international tender price. For all others the ratio varied between 0.25 and 1.31. In an analysis of items that accounted for 75% of revenues (sales) for 2002, we identified 61 products with estimated FOB prices that were at least 110% of the median
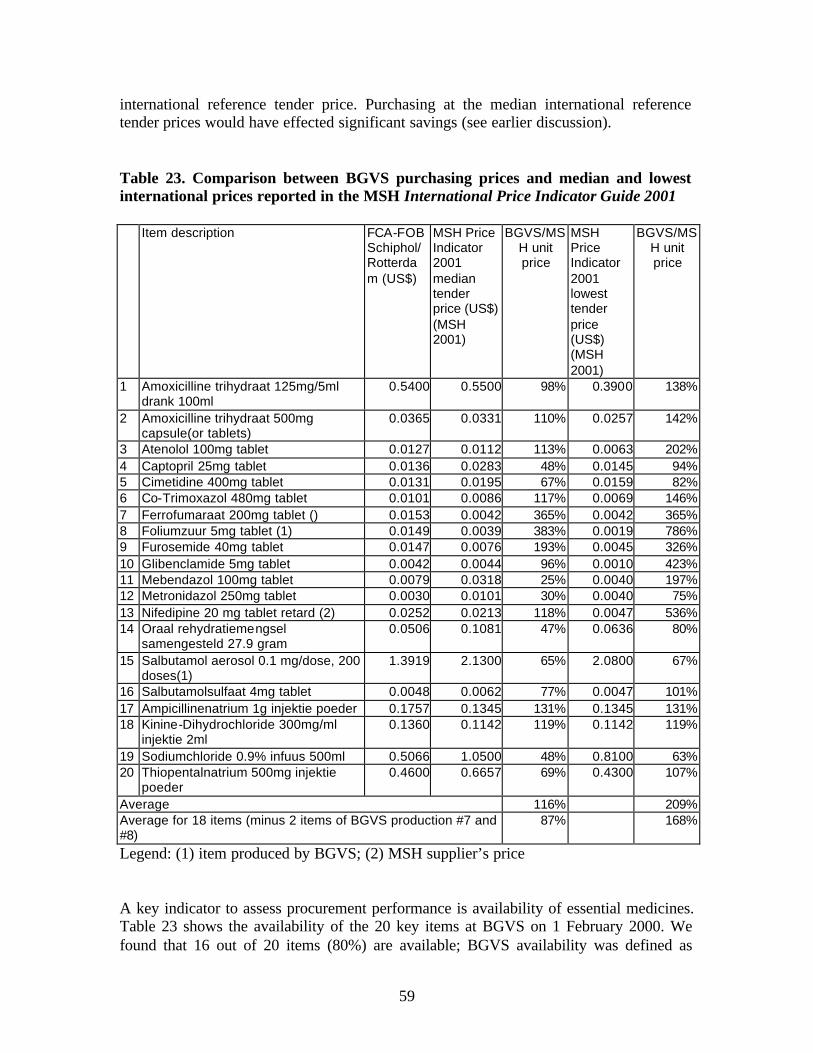
59
international reference tender price. Purchasing at the median international reference tender prices would have effected significant savings (see earlier discussion). Table 23. Comparison between BGVS purchasing prices and median and lowest international prices reported in the MSH International Price Indicator Guide 2001
Item description FCA-FOB Schiphol/Rotterdam (US$)
MSH Price Indicator 2001 median tender price (US$) (MSH 2001)
BGVS/MSH unit price
MSH Price Indicator 2001 lowest tender price (US$) (MSH 2001)
BGVS/MSH unit price
1 Amoxicilline trihydraat 125mg/5ml drank 100ml
0.5400 0.5500 98% 0.3900 138%
2 Amoxicilline trihydraat 500mg capsule(or tablets)
0.0365 0.0331 110% 0.0257 142%
3 Atenolol 100mg tablet 0.0127 0.0112 113% 0.0063 202% 4 Captopril 25mg tablet 0.0136 0.0283 48% 0.0145 94% 5 Cimetidine 400mg tablet 0.0131 0.0195 67% 0.0159 82% 6 Co-Trimoxazol 480mg tablet 0.0101 0.0086 117% 0.0069 146% 7 Ferrofumaraat 200mg tablet () 0.0153 0.0042 365% 0.0042 365% 8 Foliumzuur 5mg tablet (1) 0.0149 0.0039 383% 0.0019 786% 9 Furosemide 40mg tablet 0.0147 0.0076 193% 0.0045 326% 10 Glibenclamide 5mg tablet 0.0042 0.0044 96% 0.0010 423% 11 Mebendazol 100mg tablet 0.0079 0.0318 25% 0.0040 197% 12 Metronidazol 250mg tablet 0.0030 0.0101 30% 0.0040 75% 13 Nifedipine 20 mg tablet retard (2) 0.0252 0.0213 118% 0.0047 536% 14 Oraal rehydratiemengsel
samengesteld 27.9 gram 0.0506 0.1081 47% 0.0636 80%
15 Salbutamol aerosol 0.1 mg/dose, 200 doses(1)
1.3919 2.1300 65% 2.0800 67%
16 Salbutamolsulfaat 4mg tablet 0.0048 0.0062 77% 0.0047 101% 17 Ampicillinenatrium 1g injektie poeder 0.1757 0.1345 131% 0.1345 131% 18 Kinine-Dihydrochloride 300mg/ml
injektie 2ml 0.1360 0.1142 119% 0.1142 119%
19 Sodiumchloride 0.9% infuus 500ml 0.5066 1.0500 48% 0.8100 63% 20 Thiopentalnatrium 500mg injektie
poeder 0.4600 0.6657 69% 0.4300 107%
Average 116% 209% Average for 18 items (minus 2 items of BGVS production #7 and #8)
87% 168%
Legend: (1) item produced by BGVS; (2) MSH supplier’s price A key indicator to assess procurement performance is availability of essential medicines. Table 23 shows the availability of the 20 key items at BGVS on 1 February 2000. We found that 16 out of 20 items (80%) are available; BGVS availability was defined as

60
stock for four weeks or more. Although availability is high, this result may be not be satisfactory, since all 20 items are vital items for both the Primary Health Care as well as hospital care and they should always be available. Table 23 shows that considerable quantities of two of the 20 items have expired already, while another two have stock exceeding 52 weeks of which one will expire after one year. This kind of wastage is being confirmed by the financial data in the BGVS database that is being presented in Table 24. This table shows that 2.8% to 10.7% (on average 5.3%) of stocks had to be removed from 2000 to 2002, mainly because of expiry, with a total loss of SRG 950.2 million (against cost price). This is excessive by international standards.21 Reportedly, increased quantities of items had been purchased under a Belgian Government funded project in order to make use of the available funds before a certain deadline. The overstocking on one hand and shortages on the other indicate a planning and monitoring problem in the procurement cycle. Table 24. Losses due to Expiry, 2000 - 2002
Year Cost price expired
products
cost price sales % cost price expired drugs –
sales
Cost price stocks % cost price expired drugs –
stocks 2000 106.6 4,179.5 2.6% 3,851.9 2.8%2001 191.2 6,189.6 3.1% 7,668.3 2.5%2002 652.4 6,785.8 9.6% 6,095.7 10.7%
Total 950.2 Average 5.1% Average 5.3%Source: BGVS database The number of weeks out of stock for the same 20 items over the last 3 years, 2000 to 2002, has been calculated and is shown in Table 26. Only 2 out of the 20 items have not been out of stock at all. One item was out of stock for more than 1.5 years (85 weeks). On average, these 20 items were out of stock for 21 of 156 weeks (13% of the time).
21 Indicator OT6 in World Health Organization. Indicators for monitoring drug policies. 2 ed. Geneva: World Health Organization, 1999.

61
Table 25. Number of weeks that Tracer Items were Out of Stock, 2002
BGVS Code
Item Description Unit Number of weeks out of stock
(January – December 2002)
1 10014.04 Amoxicilline trihydraat 125mg/5ml drank 100ml 1 24 2 10014.02 Amoxicilline trihydraat 500mg capsule(or tablets) 1 0 3 10024.01 Atenolol 100mg tablet 1 30 4 10317.01 Captopril 25mg tablet 1 30 5 10061.02 Cimetidine 400mg tablet 1 0 6 10069.02 Co-Trimoxazol 480mg tablet 1 4 7 10114.01 Ferrofumaraat 200mg tablet (2) 1 28 8 10123.01 Foliumzuur 5mg tablet (2) 1 24 9 10124.01 Furosemide 40mg tablet 1 85 10 10128.01 Glibenclamide 5mg tablet 1 8 11 10184.01 Mebendazol 100mg tablet 1 10 12 10199.01 Metronidazol 250mg tablet 1 0 13 10358.01 Nifedipine 20 mg tablet retard 1 42 14 10265.01 Oraal rehydratiemengsel samengesteld 27.9 gram 1 6 15 10271.05 Salbutamol aerosol 0.1 mg/dose, 200 doses(1) 1 46 16 10271.02 Salbutamolsulfaat 4mg tablet 1 39 17 10015.01 Ampicillinenatrium 1g injektie poeder 1 1 18 10164.04 Kinine-Dihydrochloride 300mg/ml injektie 2ml 1 36 19 10208.02 Sodiumchloride 0.9% infuus 500ml 1 2 20 10289.01 Thiopentalnatrium 500mg injektie poeder 1 12
Average # weeks stock out 21
Source: BGVS database. Table 26 contains the share of purchases, by value and percentage, of the 10 suppliers that accounted for approximately 70% of BGVS purchases in 2001 and 2002. Table 26. Top 10 Suppliers and share of BGVS Purchases in US Dollars 2001-2002
2001 2002 Supplier Value (USD) Supplier Value (USD) S1 198,225 12.0% S1 324,876 22.6% S2 183,000 11.1% S2 112,248 7.8% S3 156,464 9.5% S3 100,831 7.0% S4 148,376 9.0% S4 97,239 6.8% S5 84,363 5.1% S5 83,693 5.8% S6 80,613 4.9% S6 70,288 4.9% S7 78,195 4.7% S7 69,285 4.8% S8 74,692 4.5% S8 59,427 4.1% S9 71,686 4.4% S9 49,759 3.5% S10 58,767 3.6% S10 43,432 3.0% Total 1,134,381 68.9% Total 1,011,078 70.3% S11-49 512,745 31.1% S11-43 426,822 29.7%
1,647,126 100.0% 1,437,900 100.0%
Legend: S = Supplier Source: BGVS database

62
As the administrative workload is more or less similar for purchase orders with a high or low value it is good procurement practice to try to limit the number of orders (and increase the value per order). Table 28 contains the number of orders placed listed according to the highest value. The total number of purchase orders placed was 175 with an average order value of USD 9,466 in 2001 and 180 with an average order value of USD 8,031 in 2002. The top 10 purchase orders account for 54.9% and 63.7% of the total value respectively. The average number of items per order is only 1.5. These results all indicate that efficiency in procurement can be increased by trying to minimize the number of small orders and by ordering more items per purchase order Table 27. Top 10 Purchase Orders by Value and Number of Items, 2001 and 2002
2001 2002 Pos Value (USD) #items Pos Value (USD) #items O1 198225 12.0% 1 O1 198225 13.8% 1 O2 182500 11.1% 1 O2 69285 4.8% 6 O3 75000 4.6% 1 O3 53943 3.8% 3 O4 71686 4.4% 6 O4 35000 2.4% 1 O5 55089 3.3% 1 O5 31819 2.2% 1 O6 40119 2.4% 1 O6 28362 2.0% 1 O7 31757 1.9% 1 O7 26744 1.9% 2 O8 30471 1.8% 1 O8 26430 1.8% 1 O9 30392 1.8% 1 O9 25716 1.8% 2 O10 28075 1.7% 1 O10 25716 1.8% 2 Total 743314 45.1% 15 Sub-total 521240 36.3% 20 O10-175 903,812 54.9% 238 O10-180 916,660 63.7% 240
1,647,126 100.0% 253 1,437,900 100.0% 260 Average 9466 1.5 Average 8031 1.5
Legend: O = Order Source: BGVS database Table 28 shows the purchase orders listed by value per air and sea freight for 2001 and 2002. The high value of purchase orders shipped by air is another indication of poor management and monitoring as it shows a need for urgent deliveries. Purchase orders with only one item suggest that it is made through direct contracting. BGVS has contracts with forwarders at Schiphol airport and Rotterdam harbor. Especially, the one at Rotterdam harbor saves on freight costs as it groups the BGVS items into a dedicated container. This provides also for better security. With careful planning, delays in deliveries due to the waiting time to fill a container can be avoided. Table 28. Distribution and value of BGVS Purchase Orders, according to Means of Transport 2001 and 2002 Orders by: 2001 2002 Air (US$) 839,096 51% 1,085,698 76% Sea(US$) 808,030 49% 352,202 24% Total 1,647,126 100% 1,437,900 100%
Source: BGVS database

63
The total value of purchase orders has decreased from US$ 1.6 million in 2001 to US$ 1.4 million in 2002, a decrease of 13%. It has been reported that late payments due to lack of foreign currency have decreased in number. Procurement funding also needs to be well planned. Procurement should not be initiated without the necessary financial means. Placing a purchase order without paying on time jeopardizes the necessary trust of suppliers and leads to higher costs, as suppliers will cover the risks in higher prices. 5. Warehousing As can be seen from Table 29, stocks have on average a value that is equivalent to one year of sales. The increase in 2001 compared to 2000 can be explained by purchases with the afore-mentioned Belgian project. The decrease in 2002 is a result of the low volume of purchases. As discussed before, the financial opportunity cost of maintaining such an amount of inventory is very high. The average amount kept in stock ties up too much needed cash and storage space. Table 29. Value of BGVS Inventory and Financial Opportunity Costs 2000-2002
Year Stocks cost price
(SRG million) Sales cost price
(SRG million) Stocks-Sales (%)
Interest Rate (credit)
Financial Opportunity Cost
(SRG million) 2000 3,851.9 4,179.5 92.2% 15.4% 593.2 2001 7,668.3 6,189.6 123.9% 11.1% 851.2 2002 6,095.7 6,785.8 89.8% 8.6% 524.2
Source BGVS database The storage areas at BGVS premises with a total area of 990 square meters have been divided as follows: • Bulk stores (4) – dry, climatized (15 to 24 degrees Celcius) • Bulk store – dry, not climatized • Bulk store – wet, climatized (15 to 24 degrees Celcius) • Bulk store – wet, not climatized • Store flammables (away from the main buildings), not climatized • Stores controlled drugs, climatized (15 to 24 degrees Celcius) • Refrigerator room (2 to 8 degrees Celcius) • Cold room (8 to 15 degrees Celcius) • Dispatch areas Most store areas have been air-conditioned; although there are thermometers, temperature and humidity are not regularly recorded and checked. For hygienic and security reasons the separate warehouse that has been rented for years will be abolished. However, there is no room to store all products in existing BGVS storage areas. Therefore, products are being stored in old offices. Also, a cool container has been acquired to increase storage space.

64
There is no dedicated receipt area. The main warehouse has only one entrance where goods have to come in and go out. There is no reserved space for quarantine. Part of the Stores has been reserved for the Expedition Unit, which is part of the Sales Unit under the Commercial Department. The BGVS warehouse maintains a fixed location system for its stock. There is an allocation code system. The BGVS database contains all stock data including locations and is up to date. Picking lists from the BGVS database have been sorted on location according to first expiry, first out. The warehouse looks very neat and organized with the exception of the flammables store. All goods are neatly shelved or palleted. The warehouse personnel is well experienced. Procedures are in place, but staff have complained about non-adherence to established procedures (De Meneges 2001). Thefts reported in 2001 were never solved, despite police efforts; no new thefts have been reported. There are no regulations for authorized entry, which forms a risk for theft. There are expired drugs in storage. The Quality Control Department does not have any quality assurance guidelines or procedures regarding storage conditions. Pharmaceutical products are not immediately removed after expiry and the decision has been taken to stop distribution. The differences between physical counts and stock records at the annual stock inventories (see table 22) are below 1%, indicating good adherence to stock control procedures. The BGVS auditor reported that the 2002 stock inventory was done properly. Table 30. Annual inventory results 2000 – 2002
Value according to stock count
(SRG million)
Value according to stock records (SRG million)
Percentage Difference
Dec-00 3,988.8 3,955.6 100.8% Mar-02 6,966.0 6,974.7 99.9% Nov-02 5,910.5 5,935.4 99.6%
Average 100.1%
Source BGVS database 6. Sales and Distribution The BGVS Sales and Expedition Unit is part of the Commercial Affairs Department. This unit handles approximately 260 orders per month (or 12 per day) for more than 60 different clients. According to the sales analysis, six pharmacies account for 48% of sales in the public sector, and 16 pharmacies for 39% in the private sector. Twenty-six percent of its sales go to three government hospital pharmacies and 13% to the two private hospital pharmacies. Most pharmacies are located in Paramaribo and in Nickerie, Suriname’s second largest town, 250 km away. The roads in Paramaribo and to Nickerie are reasonably good. The BGVS vans and cars are in good condition. However, the youngest vehicles date back to 1997. There are neither periodic maintenance schedules nor plans to replace vehicles, although they both are at least five years old.

65
Some clients have complained about long lead times. Calculations with BGVS data indicate that, on average, it takes two days from accepting orders at BGVS to the delivery of drugs at Expedition. Eighty percent of orders are being handled in one day, but there are also cases (1%) where the handling of orders have taken more than one week. These cases happen when clients, mostly hospital pharmacies, need more time to raise money for payment. The BGVS database does not contain data to establish the percentage of items ordered that could not be supplied. There is no back order system Clients reorder after BGVS sends information on arrival of products. The average number of items per order is 9.3 with a value of SRG 4.7 million. However, 43% of all orders contain only one item. From 2000 to 2003, sales value increased in SRG terms (8.0 to 9.5 to 9.3 billion), but decreased, when converted to USD, from US$ 7.2 to 4.2 million.(see Tables ). Sales of other health related supplies went down from SRG 1.3 billion in 2000 to SRG 0.7 billion in 2002. According to its General Manager, BGVS does not have sufficient knowledge of the market and the competition. BGVS is not doing any market surveillance and there are no structured consultations with pharmacists about their needs. BGVS does inform clients about products that have arrived. However, when products are not available no indications are given regarding when to expect new stocks. 7. BGVS Pharmaceutical Production BGVS produces 71 products. These consist of 7 tablets, 23 galenicals (oral liquids and topical preparations, such as cream, ointments, etc.), and up to 41 injections. Not all BGVS products are registered. However, quality control tests are done and must be passed before they can be released for distribution. In 1990 BGVS production was responsible for 30% of the total BGVS turno ver (Van Haperen 1991). Currently, it is not more than 8%. The table presents the revenues from BGVS products for the past three years. Almost one-half of these products are sold below BGVS estimated costs. A significant proportion of items have sold less than 1,000 units. Also, 10.8% to 12.9% of the items have sold less than 100 units annually.

66
Table 31. BGVS Production: Revenues, Gross Margin, Percentage of Items Sold Below 1,000 and 100 Units, 2000-2002 2000 2001 2002 Revenues SRG
465,776,601 SRG
814,332,924 SRG
764,959,034 Percentage of Gross Margin 11.3% -3.9% 8.2% Number of products 65 63 62 Percentage of items with negative gross margin
43.1% 47.6% 48.4%
Percentage of items sold <1,000 units
55.4% 58.7% 64.4%
Percentage of items sold <100 units
10.8% 11.1% 12.9%
Source: BGVS data base. Product stock outs may have contributed to the decreased sales. Production breakdowns occurred due to shortages of raw materials and delays or inability to effect repairs of old equipment. Currently, 23 out of the 71 BGVS products are out of stock. The two tablets in the list of 20 key items that are BGVS products were out of stock at the moment of the survey (1 February 2003). Their prices are three times higher than median international tender prices listed in the MSH International Price Indicator Guide 2001. As both of these formulations are widely available on the world market, it does not make sense for BGVS to produce and sell these items at current prices. Indeed, for this reason they had been removed from the list of products in a feasibility study, conducted in 1991 (Medicopharma 1991). As discussed previously, estimated BGVS production costs were 74% of BGVS production item sales in 2000, more than three times the costs relative to sales of BGVS pharmaceutical import and distribution. Although BGVS may still be making a net profit on locally produced items, the likely higher product costs are being passed on to clients and pharmaceutical benefits payers. In 1995 the Dutch Government had agreed to finance the set up of new production facilities on the grounds next to the BGVS premises. The agreement was based on the same 1991 feasibility study, which was updated in 1994 (Dyckhoff 1994). However, the BGVS Board of Directors never approved the project and it was not implemented. Now, eight years later, BGVS conditions that in 1994 may have supported a decision favoring local production have changed. Equipment is in bad condition due to lack of maintenance. BGVS monopoly has been abolished with GOS liberalization of imports in 1999; it is not expected that the GOS will allow a BGVS monopoly again. Existing competitive forces in the international market will make it very difficult for BGVS to be competitive for essential medicinal formulations, particularly tablets and injections. The following table compares unit costs for BGVS produced items with seven equivalent formulations listed in the MSH International Price Indicator Guide 2001. Only two of
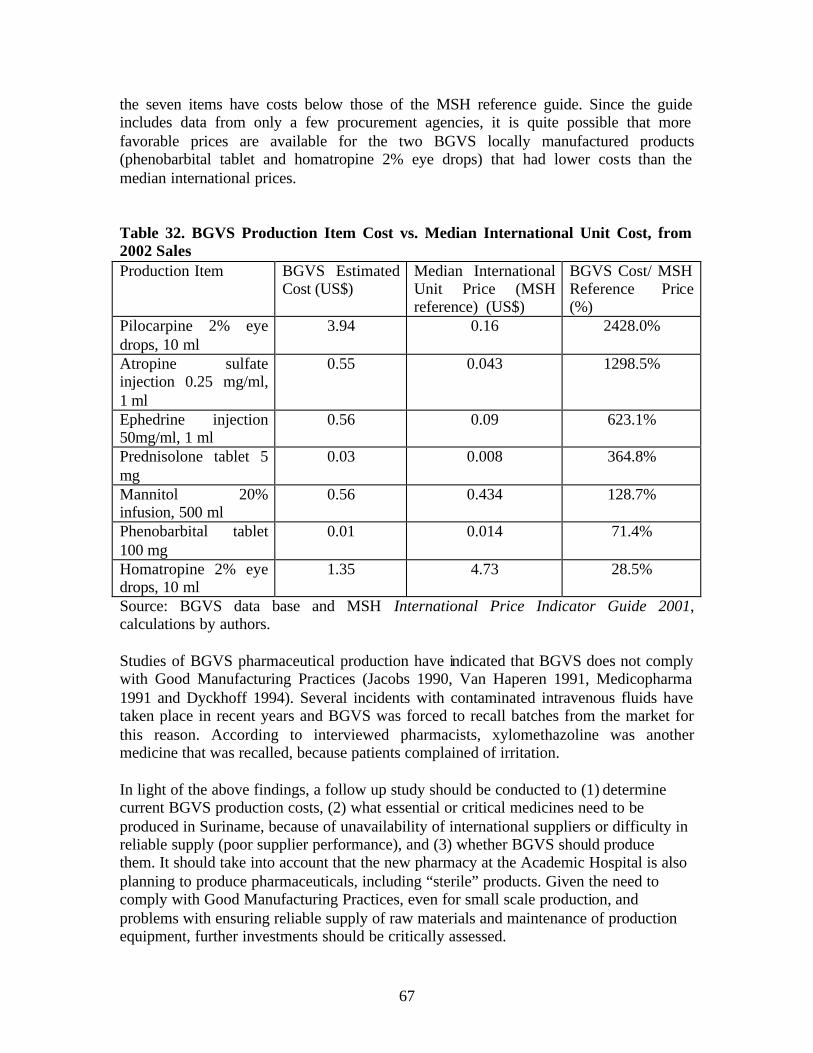
67
the seven items have costs below those of the MSH reference guide. Since the guide includes data from only a few procurement agencies, it is quite possible that more favorable prices are available for the two BGVS locally manufactured products (phenobarbital tablet and homatropine 2% eye drops) that had lower costs than the median international prices. Table 32. BGVS Production Item Cost vs. Median International Unit Cost, from 2002 Sales Production Item BGVS Estimated
Cost (US$) Median International Unit Price (MSH reference) (US$)
BGVS Cost/ MSH Reference Price (%)
Pilocarpine 2% eye drops, 10 ml
3.94 0.16 2428.0%
Atropine sulfate injection 0.25 mg/ml, 1 ml
0.55 0.043 1298.5%
Ephedrine injection 50mg/ml, 1 ml
0.56 0.09 623.1%
Prednisolone tablet 5 mg
0.03 0.008 364.8%
Mannitol 20% infusion, 500 ml
0.56 0.434 128.7%
Phenobarbital tablet 100 mg
0.01 0.014 71.4%
Homatropine 2% eye drops, 10 ml
1.35 4.73 28.5%
Source: BGVS data base and MSH International Price Indicator Guide 2001, calculations by authors. Studies of BGVS pharmaceutical production have indicated that BGVS does not comply with Good Manufacturing Practices (Jacobs 1990, Van Haperen 1991, Medicopharma 1991 and Dyckhoff 1994). Several incidents with contaminated intravenous fluids have taken place in recent years and BGVS was forced to recall batches from the market for this reason. According to interviewed pharmacists, xylomethazoline was another medicine that was recalled, because patients complained of irritation. In light of the above findings, a follow up study should be conducted to (1) determine current BGVS production costs, (2) what essential or critical medicines need to be produced in Suriname, because of unavailability of international suppliers or difficulty in reliable supply (poor supplier performance), and (3) whether BGVS should produce them. It should take into account that the new pharmacy at the Academic Hospital is also planning to produce pharmaceuticals, including “sterile” products. Given the need to comply with Good Manufacturing Practices, even for small scale production, and problems with ensuring reliable supply of raw materials and maintenance of production equipment, further investments should be critically assessed.

68
8. Quality Assurance The BGVS Quality Control Laboratory is the only pharmaceutical product quality testing facility in Suriname. It is located on the premises of the BGVS. Currently the laboratory operates with one chief analyst, two analysts, one administrative staff and one cleaner. The post of Manager of Quality Control Department, which should be filled by a pharmacist or a chemist, has been vacant since January 1999. At the moment the post is filled by a part-time locum pharmacist, who works a few hours per week. The chief of the Quality Control Department prepares annual reports and budgets, both updated, as of 2002. The charge of the Quality Control Department is to ensure the quality of medicines supplied by BGVS. Each batch of a pharmaceutical product22 or raw material that is purchased or produced by BGVS and received in the warehouse is subjected to pharmaceutical analysis before it is released for distribution. Products, either at the BGVS Production Department or at the warehouse, are held in quarantine until they have been tested. Products that have not been approved by the Manager of Quality Control cannot be distributed. Additionally, the Quality Control Department may perform pharmaceutical analyses for third parties. This occurs approximately 20 times per year and fees range from SRG 22,500 to SRG 50,000 (set in February 2002). Some private pharmacists request analyses for raw materials and some of their preparations. One local soap factory paid for analysis of its raw materials. There have been no requests for analysis from the Pharmaceutical Inspectorate. Table 33 shows the results of a quick assessment done on the relative number of analyses for finished and approved production items in relationship to the total number of analyses done and how this relates to the total sales: Table 33. Proportion of BGVS Products Tested vs. BGVS Products’ Share of Total BGVS Sales
Year Total analyzed
BGVS Products
tested and approved
% BGVS Products on
total products
tested
Ratio BGVS Production / total sales portfolio
BGVS
2000 784 454 57.9% 5.9%2001 684 358 52.3% 8.2%2002 394 192 48.7% 8.2%
Source: BGVS database
22 Exceptions are being made for opiates and service items. Service items are non-NGK (essential medicines list) items, ordered for special patients with MOH approval. These are not tested, because they come in relative small quantities. Usually these products are registered in the Netherlands.

69
The column ‘total analyzed’ comprises all the analyses done on imported drugs, raw materials and approved production items. Both the columns ‘total analyzed’ and ‘% BGVS products tested’ include analyses that were carried out on products that were not approved and tests on semi-manufactured products (during production). BGVS products account for more than 50% of the analyses, while these same products represent less than 10% of total sales. Table 34 gives an indication of the number of samples of imported products that were submitted for testing and the actual number tested, approved, and rejected. The number of samples for imported products has been decreasing in the last three years. In fact, it shows low coverage compared to the 420 items in the Essential Medicines List. This finding is consistent with the relatively low number of items procured by BGVS. Table 34. BGVS Quality Control Laboratory Rejection Rated 2000-2002
Year # of samples offered for
testing
Samples subjected to analysis
# of samples approved
# of samples rejected
Reject rate
2000 328 248 245 3 1.2%2001 305 252 249 3 1.2%2002 227 164 164 0 0.0%
Source: BGVS database The rejection rate of the products actually tested is very low; in 2002 no tested samples were rejected. This may be interpreted as BGVS producing and procuring good quality products. However, most products are not tested for the complete set of tests, due to interruptions in availability of reference materials, reagents, and other consumables, and breakdowns of equipment and delays in getting replacement parts, such as HPLC columns. In addition, the laboratory does not have an external quality control program to verify the quality of its own work. Most pharmaceutical products arrive with a certificate of analysis from the manufacturer. The results of BGVS Quality Control Laboratory analyses of 18 imported products, out of 20 tracer items, have been assessed for three years (2000 to 2003). None of the batches of the 18 imported medicines had been rejected over the past three years. One product, oral rehydration salts, was not analyzed in 2000. The analytic results of BGVS production items are entered in the system only after they have been approved by the Quality Control Laboratory. Because the BGVS system module for the production department has not been activated, products approved by the quality control department are entered into the system (and exist administratively) only after they have been received by the warehouse. Since only approved products are received by the warehouse, it was not possible to assess the rejection rate of BGVS production items from the BGVS database. As shown in the table, not all submitted imported product samples were actually tested; in 2000, 24% of samples were not tested, while in 2001, 17%, and in 2002, 28%. Opiates

70
and service items have not been included in the samples that were not tested. Reportedly, this was due to lack of equipment to perform biological analysis; chemicals or reagents; and specific product protocols/analytical literature, although the latest editions of the British Pharmacopoeia, the European Pharmacopoeia, and the United States Pharmacopeia are available. There is no regular maintenance of equipment because the service contract with the overseas manufacturer or supplier is regarded as too expensive. Currently, approximately 75% of the samples cannot be analyzed according to established pharmacopoeial standards; the spectrophotometer and the High Performance Liquid Chromatographer (HPLC) have not been functioning for the past nine and two months, respectively. There is a shortage of reference materials and mobile phase for HPLC tests. Although the requests for purchases of reagents and other supplies (submitted to BGVS Procurement) are being prepared with a lead time of up to one year in mind, shortages still occur frequently. There are neither written Standard Operating Procedures nor standard protocols in the Quality Control Department. Recently, although sampling was done by the warehouse personnel, it was not based on a pre-determined sampling procedure. The BGVS database contains references to pharmacopoeias and other literature to do the analyses. In practice, the tests performed depend on the capacity to perform the test at tha t moment, which, in turn, depends on availability of equipment and reagents. A full analysis comprises tests on identity, purity and assay, as well as tests on weight variation, disintegration and dissolution for oral solid dosage forms. Often, only some of these tests can be done. Product release by the Quality Control Laboratory is based on incomplete verification of product compliance with pharmacopeial standards. Analysts are allowed to release products for distribution in the BGVS database, a responsibility normally reserved for senior staff. On occasion, BGVS supplies expired drugs, when there are no alternatives to out-of-stock products and with approval of the receiving pharmacy. Only some of these drugs have been re-analyzed by the Quality Control Department. The Quality Control Department has limited itself to testing raw materials and pharmaceutical products. It does not assess the quality of other BGVS supplies, such as medical disposables. The BGVS does not have a quality assurance program that assures product quality through measures such Good Storage and Distribution practices (such as structured pre-qualification of suppliers and products in-process control of BGVS production, repackaging activities, storage conditions), and the Quality Control Laboratory has not been involved in developing these.

71
9. Management Information Systems Most of the calculations in this report are based on data from the BGVS database. It was not possible to disaggregate some of the data for some analyses. It was particularly difficult to determine the FOB prices due to the way the system was set up to determine cost prices, and the fact that in some cases certain cost factors were captured while in others only a percentage-based estimation was captured. The most recent data for some of the cost analyses dated back to 2000, as data had not been entered into the system for the past 18 months. Nevertheless, the results provide a reasonable picture of the situation. The system has not been upgraded since it was developed. There are several other newer software programs that are used in different departments. They have been purchased and used without a proper plan or linkage with the BGVS database. The financial department is using Exact. Data are entered manually as the Exact package cannot communicate with the BGVS database. The financial administration is reportedly more than one year behind with the entering of data in the Ledger. The Procurement Unit was not able to provide procurement reports for the last three years. It only uses part of the procurement module in the BGVS database. During this study it was discovered that the Head of Procurement did not have access to all phases of this module. There is no separate Computer Department. The Chief of Computer Systems post has not been filled. Currently the Head of Internal Audit coordinates implementation of computer system tasks. There is neither a written policy nor is there a program of action. The purchase and allocation of computers only occurs when old ones have broken down. There are many computers that have long been written off. Other departments (such as Procurement) suffer from lack of computer hardware. The BGVS website, acquired in 2001, is still “under construction”.

72
VI. Options for Improving Public Sector Pharmaceutical Procurement 1. Introduction Findings on the effectiveness and efficiency of public sector pharmaceutical spending and the role of BGVS can be summarized as follows:
• BGVS accounts for less than 50% of the pharmaceutical market. • BGVS-associated stock outs at pharmacy level appear to be attenuated by supply
through private suppliers. • BGVS operations, particularly its manufacturing operations, are inefficient. • Despite the inefficiency, BGVS has registered profits up to December, 2000. • BGVS inefficiency is passed on to its clients through high mark ups on many of
its products. • Large client debts from sales on credit and “negative markups” resulting in
below-cost sales prices are due to poor practices rather than the conscious application of “informal” subsidies.
• It should be possible for SZF, MSA, and the MOH to pay less for essential medicines.
• There are no obvious (strong) incentives for suppliers to offer more favorable prices to public sector programs.
The keys to developing an effective strategy to improve public sector pharmaceutical procurement and spending are:
• leveraging or consolidating the purchasing power of the three major players (Ministry of Social Affairs, State Health Fund, and Ministry of Health), and
• identifying appropriate incentives for change. 2. Options for Improving Effectiveness and Efficiency of Pharmaceutical Procurement and Spending There are two main options for improved effectiveness and efficiency of public sector spending through achieving lower prices charged to public sector programs. One option is to maintain the current system of pharmaceutical supply and focus on strengthening BGVS management and operations. The other major option is to reform the system by creating a pharmacy benefits management program for the public sector programs. A pharmacy benefits management program can be designed to determine which manufacturers or importers supply the products and their prices, which pharmacies provide dispensing services, and who are eligible for prescription benefits. Such a program could be developed and implemented by: (a) a unit within one of the payers (SZF, MSA, MOH), (b) an autonomous (not- for-profit) structure funded/contracted by the payers, or (c) a for-profit company contracted by the payers. In North America pharmacy benefits management companies (PBMs) design, implement, and administer outpatient pharmaceutical benefit programs for employers, managed care organizations, and other third-party payers. PBMs manage prescription drug benefits, independently of

73
other health care services, such as physician and hospital services. PBMs act as intermediaries between pharmaceutical suppliers and third-party payers, such as the SZF, MSA.23 Third-party payers should commission or carry out a study to determine the feasibility of the above-mentioned ways for establishing a PBM program in Suriname and what technical assistance may be needed. Table 34 provides a synopsis of the two major options. Each option is summarized according to:
• the specific intervention, • the relationship of the intervention to the on-going health financing initiatives, • implications for the BGVS, • implications for private-for-profit suppliers, • responsibility for product selection, • responsibility for determining sales prices, • the development focus or emphasis, • key intervention requirements, • cost issues, • likelihood of impact (improved effectiveness and efficiency of pharmaceutical
spending), and • additional analyses that may assist decision-making.
Over the past few years, stakeholders have recognized the need to reform BGVS management and operations. However, political will and external and internal incentives to improve effectiveness and efficiency have been lacking. Reliance on changes in management and operational procedures alone, without a strong external incentive, will not assure sustainability of reforms. It is up to the third-party payers to become better “buyers” of products and services through a well-designed and properly implemented pharmacy benefits program. The key is to create a situation where BGVS has to compete with other suppliers to supply public programs, so that it will have to eliminate its problems with stock outs, reduce current markup percentages, and improve its service to clients. This is consistent with current health reforms to strengthen the public payers (SZF, MSA, MOH) in their role as active purchasers. Table 35 summarizes recommendations to improve BGVS management and operations. There are other important interventions that may improve effectiveness and efficiency of public pharmaceutical spending. One strategy is to develop and implement standard treatment guidelines with appropriate monitoring and supervision. This may be done as a component of the pharmacy benefits management intervention (medicines use review program). We will not discuss other potential strategies, since we did not assess safe, effective and cost-effective prescribing (rational use). However, we understand that this is the objective of another study that is under way.
23 Lipton HL, Kreling DH, Collins T, Hertz KC. Pharmacy benefit management companies: dimensions of performance. Annu Rev Public Health 1999; 20:361-401.
74
3. Maintaining the Current Supply System and Strengthening the BGVS The focus of this strategy is to improve BGVS management and operations. It is expected that, through these improvements, BGVS will experience fewer stock outs, obtain products at prices that are lower than those currently achieved, and pass on savings to its clients. This should, in turn, lower the prices that hospital and pharmacies charge for the products, including dispensing services at the current 35% markup (or lower if this can be negotiated), to the MSA and SZF. The funds provided through the MOH would also be used more efficiently. It is anticipated that the BGVS would continue as the most important individual supplier to the public sector. Private–for-profit suppliers would be used when there are stock outs of BGVS supplies. However, supplier and product selection (BGVS and/or others) are still determined by the hospital or retail pharmacist; that is, they have the choice of stocking products from either BGVS or other suppliers or more than one pharmaceutically equivalent product. Ex-warehouse prices are basically controlled by the supplier, unless there is a mechanism to negotiate for lower prices. Since the hospital or retail pharmacy charges a standard markup to the price charged by BGVS or a private supplier, and payment is based on BGVS prices, at least for SZF, there are no strong incentives for hospital or retail pharmacies to obtain products at lower cost and pass on savings to third party payers or to clients who must pay out of pocket. BGVS would need to implement competitive tendering as well as lower their markup. Although BGVS currently imports some products at prices lower than the median prices paid by public programs in other countries, it is still possible to achieve significant savings if BGVS conducted competitive tendering instead of direct contracting or international shopping. 3.1. Interventions to strengthen BGVS management and operations As indicated earlier, the following interventions are needed, regardless of which option for the pharmaceutical supply system is desired. 3.1.1. BGVS Management The MOH must first resolve the current situation regarding BGVS leadership. Continued differences between the Board of Directors and the General Manager will only obstruct the definition and implementation of a program to enhance BGVS performance. The MOH should either adopt the Board’s recommendation for a change in BGVS leadership or appoint a new board that is willing to work with the current General Manager. The General Manager is ultimately accountable for inability to fill key management positions and criticisms regarding BGVS stock outs and quality of service. In the case that a new Board of Directors is appointed, the Minister of Health should include a REG representative to ensure that BGVS goals and policies are consistent with and support the National Medicines Policy. The Board of Directors, whether the current

75
one or a newly appointed board, should be instructed to develop a formal policy document that the General Manager will be responsible for implementing. BGVS must fill the vacant management positions. In particular, the Deputy-General Manager for Finance is critical for BGVS management. It is unacceptable for the ledger to be 15 months in arrears. The other vacant key positions are the Manager for Quality Control and the Manager of the Commercial Department and the Head of Computerization. BGVS may need to review salary levels and adjust them to attract and hire and keep qualified candidates. 3.1.2. BGVS pharmaceutical production BGVS should critically review the justification for continuing production of pharmaceuticals. One-third of BGVS production items are out of stock and the ratio of BGVS production costs relative to sales three times that of BGVS importation costs relative to sales. Two options should be explored. One option is to discontinue production and the other is to reduce production to items that are needed but are not available in the international market or that are more expensive or difficult to import than the ones currently produced. A follow up study should include an analysis of the existence of pharmaceutical equivalents or similar products that have alternative strengths, the cost of importing versus cost of producing the items, whether there are particular difficulties in ensuring reliable availability of these items, and an assessment of policy and legal implications of the two options. 3.1.3. Procurement practices BGVS should follow Good Pharmaceutical Procurement practices. The World Health Organization, the United Nations Children’s Fund, the United Nations Population Fund, and the World Bank have published guidelines for Good Pharmaceutical Procurement.24 Specifically, BGVS should conduct tenders from pre-qualified suppliers. Although existing legislation and regulation require tendering for public sector procurement, BGVS is non-compliant. Once transparent, fo rmal written procedures and explicit criteria to award contracts have been prepared, the staff will need to be trained to carry out the tenders. Technical assistance may be required to develop these standard operating procedures and train staff to conduct the tenders. BGVS should carefully plan its procurement activities, paying adequate attention to quantification and delivery schedules to ensure timeliness in delivery while at the same time reduce the amount of stock that needs to be stored (reduce inventory levels). Consolidating requirements does not necessarily mean that the total quantities need to be delivered in one shipment, but may be delivered in smaller quantities over a specified contract period. BGVS must also monitor procurement performance to assess whether it 24 Operational Principles for Good Pharmaceutical Procurement. WHO/EDM/PAR/99.5. Geneva: World Health Organization, 1999.

76
is obtaining the best prices that it can possibly get and to identify problems that need to be addressed. 3.1.4. BGVS financial management BGVS must optimize its financial management practices. It is incurring in high financial opportunity costs due to the large inventory that it maintains. The inventory turnover ratio is well below the minimum recommended level of 3.0.25 These costs may be lowered through carefully planned procurement that specifies deliveries to be distributed and paid for over a defined contract period. This also reduces the amount that must be paid up front. BGVS must define, communicate, and implement a consistent policy on credit sales. Debts from credit sales are significant and continue to accumulate. With Surinamese currency devaluation, the BGVS will not recover the initial value of the products in hard currency terms. 3.1.5. Product pricing BGVS must review the way sales prices are set, revise the markup formula, and apply it consistently to all its products. BGVS sells some products at below its own calculated cost, and many others at very large markups. Although the net result has been a positive margin, this is clearly bad business practice. While avoiding losses due to sales at below cost, BGVS may still establish preferential prices, set at lower markups, for public sector programs or facilities (RGD, hospitals, pharmacies that serve SZF and MSA beneficiaries) than for the private sector. In the interest of reducing prices to public sector programs, two interventions should be considered. One intervention involves harmonizing the legally allowed markup formulas for BGVS and the private suppliers. The other intervention is allowing equitable access to hard currency; that is, providing uniform exchange rates for both BGVS and the for-profit suppliers. This eliminates the contention that private suppliers cannot adequately compete with BGVS because of higher costs resulting from the existence of different standards. 3.1.6. Warehousing and distribution operations BGVS should follow Good Storage Practices.26 The large inventory that BGVS maintains from previous purchases contributes to the insufficiency of storage space. Storage space requirements can be reduced by specifying that suppliers make more deliveries of smaller quantities over the contract period. If stocks are reduced by half of the sales volume, the existing storage area should be sufficient and office space will not be used to store goods.
25 Effective Pharmacy Management. 4 ed. Kansas City, Missouri: Marion Laboratorios, Inc., 1987. 26 “Guide to good storage practices for pharmaceuticals”. Annex 9 in WHO Expert Committee on Specifications for Pharmaceutical Preparations. Thirty-seventh Report. WHO Technical Report Series No. 908. Geneva: World Health Organization, 2003.

77
Standard operating procedures should be reviewed, updated as needed, and communicated to staff. If needed, re-training should be conducted, particularly in connection with quality assurance measures to be developed with the Quality Control Department. BGVS should review the status of its transport vehicles and develop a plan to replace them as needed, as the most recently acquired one is already five years old. BGVS should also improve its communications with clients and provide up/to/date information on products and their availability. If products not available, BGVS should inform the client on when they are expected to arrive. 3.1.7. Quality assurance BGVS needs to determine the extent of incomplete monograph testing, identify the determinants that lead to this situation, and the implications on product approval and release for distribution, and develop a prioritized plan that optimizes product quality testing efforts. At least two incidents involving BGVS product recalls have occurred in recent times and there have been several adverse comments from pharmacists regarding the quality of BGVS supplied products. BGVS should also develop a quality assurance program that includes monitoring for good storage practices. As mentioned above, some products are currently stored in offices. Clearly, a full-time manager is needed to oversee these activities, so that it is critical that the post of the Quality Control Department Manager must be filled with a qualified professional. 3.1.8. Management information system BGVS should evaluate the software packages that are currently used and determine whether they can be linked effectively or an integrated package purchased or developed. This involves an assessment of available commercial packages and a comparative analysis of costs. It is also a priority to complete the entry of financial data. It is unacceptable that ledger entries are 15 months in arrears. Funding is not an issue, and temporary assistance can be contracted to do the work, with appropriate supervision. BGVS will need to assess the status of computer equipment in the various departments and develop a plan to provide or upgrade them as needed. 3.2. Option pre-requisites

78
This option requires strong MOH commitment to improve BGVS management and operations. As previously stated, without resolution of the BGVS leadership differences and lack of key managers, particularly the Deputy Manager for Finance, a program for strengthening BGVS cannot move forward. 3.3. Costs The following costs must be taken into account:
• Operating costs, such as filling current key vacant management positions and equipment costs, such as upgrading computers, computer applications, and transport vehicles
• Technical assistance costs, as such assistance will likely be needed to develop some of the policies, standard operating procedures, and market intelligence practices.
3.4. Likelihood of Impact on Improved Effectiveness and Efficiency of Public Sector Pharmaceutical Spending This option is dependent on (1) strong MOH commitment to improve BGVS management and operations, and (2) actual BGVS performance. In the absence of strong incentives for change, it is unlikely that the impact will be significant. 3.5. Further studies to assist decision-making The MOH leadership may consider additional studies to assist in decision-making regarding which option to develop. These include, among others:
1. an analysis of the suitability of BGVS continuing to produce pharmaceuticals vs. importing the items that it currently manufactures,
2. an analysis of technical assistance needs, and 3. the costs of a BGVS strengthening program.
4. Reforming the Pharmaceutical System and Creating a Pharmacy Benefits Management Program The focus of this strategy is to create a program that will manage the pharmaceutical benefits for SZF and MSA affiliates and beneficiaries. The program would be designed to modify current relationships within the pharmaceutical sector and stimulate more competition, leading to reduced pharmaceutical product prices and related costs to SZF and MSA. Among other responsibilities, it is envisioned that the pharmacy benefits management program would conduct tenders to select suppliers for NGK medicines and their unit prices. The BGVS would become just another supplier, without special privileges, and would have to compete with private suppliers for public sector program business. This strategy would be developed as a key component of the public health financing program, as contrasted with that of maintaining the current system, in which the payers play a more passive role.

79
The structure that would run the program could be set up either within SZF or MSA, or be contracted to an autonomous organization for the work. Currently, there are no pharmacy benefits management companies in Suriname. The capability must be developed, whether in-house at SZF and MSA, or with a private company (as a for-profit or a not- for-profit). In this option, it is the pharmacy benefits management program that determines who the supplier will be and at what price; that is, which product will be used in the public programs. The results of the tender will determine this. A separate negotiation could take place to select the private pharmacies and/or the fees that would be charged on top of the price contracted with the suppliers. Since the current system works on the basis of a percent markup on top of the supplier (BGVS) sales price, retailers may be opposed to changes. An alternative approach is to negotiate fixed dispensing fees to pay for the retail pharmacy services that is added to the supplier’s sales price; this method ensures that savings achieved from improved efficiencies at the level of pharmaceutical suppliers are passed on to payers. 4.1. Creating and implementing a Pharmacy Benefits Management Program The specific program design should be developed only after a thorough review of current programs at SZF and MSA, the analysis of the political, technical, and economic feasibility of options. SZF and/or MSA should commission or carry out the study. The following elements and issues need to be covered in the program design: 4.1.1. Definition of program coverage. What are the diagnoses and conditions that will be covered in the program? What are the medicines that will be covered? Will coverage be limited to those on the NGK (national essential medicines list)? If non-NGK medicines will also be covered, what will be the procedures for approval, if any? 4.1.2. Program management support. Will the program be managed in-house or can a private company be identified or set up to manage the program? Can a not- for-profit company be established to provide these services? 4.1.3. Financial/reimbursement mechanisms. How will payment to pharmaceutical care providers (hospital pharmacies, RGD dispensaries, retail pharmacies) be effected? Will payment be made directly to pharmaceutical care providers or through reimbursement to patients? Or, will separate payment arrangements be made to suppliers and to pharmaceutical care providers? 4.1.4. Procurement methods and operating procedures. What method and transparent procedures will be used to select suppliers and the prices at which their products will be sold to the RGD, government hospitals, and private pharmacies providing services to SZF and MSA affiliates and beneficiaries? How will the pharmacies be selected and contracted to provide pharmacy services?

80
4.1.5. Contractor performance. How will the SZF, MSA, and MOH monitor the performance of the company that provides the pharmacy benefits management services? What performance indicators will be used? How will the pharmacy benefits management company monitor the performance of suppliers and pharmacies? 4.1.6. Medicine use review program. As a quality of care component, the program would include a medicine use review program, since quality care contributes to lower overall costs to the program. How can such a program be structured and how can this involve other stakeholders outside the SZF and MSA, such as the National Essential Medicines Program, medical and pharmacy schools, and health professional associations? What strategies can be implemented to promote appropriate prescribing, including the development and implementation of standard treatment guidelines and therapeutic formulary manuals? 4.1.7. Audit plan. What are the methods and procedures to be established for an audit plan to verify program eligibility or to prevent fraudulent claims? 4.1.8. Cost control mechanisms. Will the program establish co-payment as a deterrent to over-utilization of pharmaceutical care? How will they affect MSA beneficiaries, who may not have the money to pay? Will co-pays be applied only to SZF affiliates and beneficiaries? 4.1.9. Management Information System. What are the information needs? How can a management information system be set up? What reports and when will the contractor (pharmacy benefits management company) be required to submit them? 4.2. Option pre-requisites To ensure private sector financial capability to participate in the pharmacy benefits management program tenders to select suppliers and establish product prices, this option requires that private suppliers be given equal/equitable access to international currency (uniform exchange rates for both BGVS and the private for-profit suppliers). Another intervention that would establish an even playing field would be to harmonize BGVS and private sector markup formulas. Under these conditions, all suppliers established in Suriname have an opportunity to compete for the public sector business, creating a “win-win” situation for the payers (SZF, MSA, MOH) and for the suppliers. 4.3. Costs The following costs should be considered:
• Program design and implementation costs • Recurrent program costs (whether the program will be managed by in-house staff
or whether program management will be outsourced if there is private sector capacity or potential that can be developed)

81
• Technical assistance costs, as there will certainly be a need for such assistance. 4.4. Likelihood of Impact on Improved Effectiveness and Efficiency of Public Sector Pharmaceutical Spending This option is dependent on economic/financial pressures being the incentive on the funding sources and payers (MOH, SZF, MSA) to spend more effectively and efficiently, and on the pharmacy benefits program design, effective implementation, and performance. If the program can be properly managed, it is likely that the impact may be significant, because the system provides a strong financial incentive or reward to suppliers that can provide reliable service at the lowest cost possible to the public health and pharmaceutical programs. 4.5. Further studies to assist decision-making The MOH, SZF, and MSA leadership may wish to follow up with an analysis of the political, technical, and economic feasibility of one or more options to establish the pharmacy benefits management program. Designing and implementing the pharmacy benefits management program is likely to require technical assistance. The needs and costs should be determined and may be incorporated in the options feasibility study.

82
Table 34. Comparative Summary of Options for Improving Effectiveness and Efficiency of Pharmaceutical Spending Strategy Maintain current pharmaceutical
supply system for public sector programs
Reform the pharmaceutical supply system for public sector programs
Specific Intervention
Strengthen BGVS Establish a pharmacy benefits management program to serve the MSA and SZF
Relationship to on-going health financing initiatives
Is NOT a component of public health financing programs (MSA, SZF, central government)
Is developed as a component of public health financing programs (MSA, SZF, central government)
Implications for BGVS
BGVS continues to be the primary supplier to supply public sector programs. Degree of true competition with private suppliers is unclear
Has to compete with private suppliers for public sector program business
Implications for Private-for-profit Suppliers
Generally used as alternative supplier when BGVS is out of stock
Have opportunity to compete with BGVS for public sector program business
Responsible for Product and Supplier Selection
Selected by pharmacy service provider (hospital, dispensary, retail pharmacy), by purchasing from either BGVS or an alternative private supplier
Selected by pharmacy benefits management program, based on procurement through competitive tendering
Sales Prices (ex-supplier price plus the pharmacy markup)
Set by BGVS and private suppliers; BGVS would need to implement competitive tendering
Set by pharmacy benefits management program, based on procurement by competitive tendering
Development Focus/ Emphasis
Strengthening BGVS operations and management Areas to be covered: - Management - Financial management - Pricing practices - Pharmaceutical manufacturing operations - Procurement practices - Warehousing and distribution practices - Quality assurance - Management information system (see Recommendations for Improving BGVS Management
Creating and implementing a pharmacy benefits management program Areas to be covered: - Program coverage - Program management support - Financial/reimbursement mechanisms - Procurement method and operating procedures - Contractor performance monitoring and indicators - Medicine use review program - Audit plan - Cost control mechanisms (co-

83
and Operations) pays and others) - Management Information System (information, reporting requirements)
Pre-requisites MOH commitment to improve BGVS management and operations. Resolve the BGVS management leadership situation. Vacant BGVS positions are filled.
Equal/equitable access to hard currency (uniform exchange rates for both BGVS and private suppliers) Harmonize BGVS and private sector price markup formulas
Costs (More study needed)
Operating costs -Personnel costs (filling current vacancies) -Equipment costs (computers, vehicles) Technical assistance costs
Program design and implementation costs Recurrent program costs (in-house staffing vs. outsourcing) Technical assistance costs
Likelihood of Impact on Improved Effectiveness and Efficiency of Pharmaceutical Spending
Dependent on i) MOH commitment to improve BGVS management and operations, and ii) BGVS management performance. In the absence of strong incentives for change, it is unlikely that the impact will be significant.
Dependent on i)economic pressures on funding sources and payers (MOH, MSA, SZF) to become more efficient, and ii) the pharmacy benefits program design, implementation, and performance. Because the system provides a strong financial incentive (access to increased volume of business) and an even playing field to (all) suppliers, if it can be properly managed, it is likely that the impact may be significant.
Further Studies
An analysis of the suitability of BGVS pharmaceutical manufacturing versus importation of BGVS production items. Determine technical assistance needs Costs of BGVS strengthening program
An analysis of the feasibility and costs of implementing a pharmacy benefits management program. Determine technical assistance needs and costs

84
Table 35. Recommendations for Improving BGVS Management and Operations Management
Resolve definition of BGVS leadership (Board vs. General Manager) Fill vacant positions Improve internal communications
Financial Management
Optimize use of funds for payment *Tender for large quantities, but divide delivery over time (reduces need to pay up front) *Smaller inventories reduce financial opportunity costs and losses due to expiry Define and implement a consistent policy on credit sales
Product pricing practices
Review and harmonize markup formula with private sector Apply adopted markup in a consistent manner Establish preferential/reduced prices for public sector facilities (RGD, hospitals)
Pharmaceutical Manufacturing Operations
Options: 1. Reduce pharmaceutical manufacturing to items that are
truly efficient 2. Discontinue pharmaceutical manufacturing
Procurement Practices
Follow Good Procurement Practices *Conduct tenders from pre-qualified suppliers *Establish transparent, formal written procedures and use explicit criteria to award contracts *Procurement should be planned *Monitor procurement performance
Warehousing and Distribution Practices
Good Warehousing Practices *Review current procedures and update as needed, for implementation
Quality Assurance Program
Develop and implement a quality assurance program that includes monitoring for good storage practices Identify the determinants of incomplete pharmacopeial monograph testing, in order to design and implement a priority and risk-based testing program
Management Information System
Evaluate the software packages currently used and how they can be linked or used effectively, versus purchase/development of an integrated package Complete the entry of financial data as a priority activity

85
5. Legislation and Regulatory Framework The MOH needs to assess options to improve the effectiveness of pharmaceutical regulation and to strengthen MOH regulatory capacity. Importation and retail sale of non-registered products appears to be a common practice, which cannot be justified unless there has been prior approval by the Registration Office. The options analysis should include:
• A review of existing laws to determine what may need to be modified to strengthen MOH regulatory capacity in the pharmaceutical sector
• An analysis of approaches to pharmaceutical product evaluation and approval (criteria and procedures)27, and product registration requirements and procedures, and what can be done with or without changes in legislation
• An analysis of how to effectively enforce regulations, taking into account resource limitations
• An analysis of ways to re-organize the Registration Office and the Inspection Directorate under one department or coordinate their activities28
• An analysis of costs associated with pharmaceutical product regulatory activities and potential mechanisms of sustainable financial support, such as central government funding and registration fees.
The MOH does not have the capacity to conduct post-marketing surveillance of pharmaceutical product quality, safety (side effects) and effectiveness (or lack thereof). The only product quality control laboratory in Suriname is located within the BGVS. An appropriate national quality assurance program should be designed, that builds on this resource, rather than establish another laboratory. However, careful consideration is needed regarding how the national program can be reliable and transparent, since the BGVS would be providing analytical services while it is also one of many competing suppliers.
27 The Registration Board is currently exploring ways to shorten the pharmaceutical product registration process through recognition of the product registration status in the more advanced industrialized countries. 28 For a country of half a million people it may or may not be cost-effective to create an autonomous agency, although it is imperative that product registration and enforcement decisions are transparent and shielded from political pressures.

86
VII. Next Steps The findings and major options were presented and discussed with stakeholders in a meeting held in June. Participants, including BGVS representatives who attended the meeting, acknowledged the need to reform BGVS management and operations. As indicated previously, the key is to create a situation where BGVS has to compete with other suppliers to supply public programs, providing the needed incentive to eliminate its problems with stock outs, reduce current markup percentages, and improve its service to clients. The third-party payers can achieve this through a well-designed and properly implemented pharmacy benefits program. Because stakeholders were unfamiliar with the pharmacy benefits management concept, there were concerns regarding its feasibility in Suriname. The way forward is to commission or carry out a study to assess the feasibility of one or more models for a PBM program and determine what and how much technical assistance will be needed. This will facilitate decision-making on whether and how to create the strong external incentive for BGVS to improve management and operations through the development and implementation of a pharmacy benefits management program. The MOH, MSA, SZF and the relevant ministries (Finance and Commerce) need to review the findings of this study and follow up with reforms regarding (1) the inequitable access to hard currency and (2) the standardization of markup formulas for parastatal and commercial firms. This may facilitate more competitive pricing by private suppliers under the current system. The MOH must resolve the lack of definition regarding BGVS leadership. The Minister of Health must appoint either a new board of directors or a new general manager. This will facilitate the introduction and effective implementation of management and operational reforms.
87
Annex 1. Suriname Study on Public Sector Drug Management “Core” Assessment Questions
Health Reform Context and Background to this study
• How do the health reforms affect the pharmaceutical sector? National Drug Policy and National Drug Program
• What are the objectives of the policy and the program and what is the status of program implementation?
• How is the program implemented, monitored and evaluated? Pharmaceutical Legislation and Regulation
• Are there laws or regulations governing the licensing of pharmaceutical supply facilities that require compliance with standards?
• How do the laws affect BGVS procurement? • How do the laws affect private sector importation and sales? • Are pharmaceutical prices (mark ups) established by law? • Is generic substitution allowed by law? • How do the performance of the registration authority and the pharmaceutical
inspection office impact on private importation and sales? • How do the laws and regulations affect quality assurance of pharmaceuticals? • How does the performance of the registration authority and the pharmaceutical
inspection office impact BGVS procurement? Financing
• How are medicines financed? • What are the expenditures on medicines, per source of financing? • How are prices determined (mark ups) by BGVS and by private importers and
distributors and by retail pharmacies? Pharmaceutical Supply Management
• How are medicines procured, stored and distributed in BGVS? • Are there opportunities to improve processes and procedures in BGVS? • Are there opportunities to improve BGVS service level and quality to its clients? • What percentage of medicines are supplied by alternatives sources (i.e. private
importers and distributors? • What are the BGVS operating costs and are there options to reduce them? • What are the major determinants of product availability at pharmacies and health
facility dispensing outlets? • Are there problems with product quality and what is being done to assure quality? • How do the quality assurance program design and procedures affect procurement,
and availability of products?
88
Rational Use of Medicines • Are there initiatives to promote the safe, effective and cost-effective (rational) use
of medicines? Does the National Drug Program and others promote rational use through therapeutic formulary and/or therapeutic guidelines?
Human Resources
• Is there a gap between human resource needs and availability to support the pharmaceutical sector?
• Are there programs to address perceived or actual gaps?

89
Annex 2. Suriname Demographic, Social, Economic and Health Indicators
Indicator Finding Source National Health Statistics 1. Population (most recent data ) 441356 CMO (mid year 2001) 2. Births per 1000 inhabitants 22.5 CMO 3. Deaths per 1000 habitants 7.1 CMO 4. Infant Mortality Rate 17.8 CMO 5. Gross Fertility Rate 2.4 1995 6. Percentage of population under 15 years of age 31% ABS 7. Percentage of population over 65 years of age 6% ABS 8. Life expectancy (years) 70.9 9. Life expectancy (years) men 68.3 10. Life expectancy (years) women 73.5
Demographic Indicators
11. Population distribution by region 12. Urban/rural population distribution
Annex Overview ABS
Health Services Utilization 13. Number of public facilities that dispense medicines 5 (hosp) + 22 RGD
clinics + 36 MZ clinics (KIT 2001)
14. Population per functional public facility that dispenses medicines
7,006 1/13
15. Number of qualified pharmacists (and/or) pharmacy assistants
22 pharmacists and 121 pharmacy assistants
Pharmaceutical Inspectorate (2003)
16. Population per qualified pharmacist and/or pharmacy assistant
20,061 1/15
17. Number of authorized prescribers (Paramaribo and outside Paramaribo)
85 spec.+ 146 gp+ 35 dentist= 266
CMO
18. Population per authorized prescriber (Paramaribo and outside Paramaribo)
1660 1/17
19. Top Ten Causes of Morbidity (Ambulatory Care) a. Chronic decease 50% (MM) b. Hypertension 15% (RGD) c. Diabetes 10% (RGD) d. Skin disorders 6% (RGD) e. Accidents and injuries (ER) f. Ill defined causes 13% (RGD) g. Dengue and malaria h. Acute respiratory infections 8% (RGD) i. Acute respiratory infections 30-50% (MM) j.
CMO page 17
20. Number of out-patient consultations per year 789321 (hosp + other facilities)
CMO (year 2000)
21. Year of report 22. Is there a national Drug Information Center/Service? : No
Education 23. Literacy rate 94.2 Socioeconomic
Indicators 24. Number of medical schools 1 25. Number of nursing schools 1 26. Númber of pharmacy schools 0 27. Númber of training programs for pharmacy assistant or
pharmacy technicians 1
28. How many persons are trained as pharmacy technicians or pharmacy assistants per year?
9 pharmacy assistants
Pharmaceutical Inspectorate (2003)

90
Year 2000 Total Government expenditures: 500 billion SRG Total Government Health expenditures: 54.6 billion SRG (52%) Total Government Health expenditures/ Total Government expenditures: 11% Budget MOH: 26.4 billion SRG Budget MSA: 22.5 billion SRG Budget Justice&Police: 2 billion SRG Budget Defence: 1.6 billion SRG Budget SZF: 36.7 billion Total government budget for health: 89.2 billion
SRG Total government budget: 740 billion SRG Total government budget for health/ Total
government budget: 12% Year 2002, See question 29 Flows from financial Intermediaries to classes of providers Category Public sources Private Sources External Sources All sources Primary/prev. care 28.58% 40.97% 21.21% 33.71% Hospitals 45.45% 37.13% 5.79% 36.26% Specialty care 8.80% 9.54% 74.08% 18.39% Private Pharm. 6.21% 10.44% 7.20% Health Adm. 8.56% 1.92% 4.78% Total 45.25% 40.00% 14.59% 100.34% See question 31/32/33/34 Sources of Funds Source Amount in Percent x1000 USD General Government 34,129.54 43.3
Household out of pocket 15,770.65 20.0
Firms( private and government owned) 17,544.78 22.3
Donors, NGO, Foundation 3,023.46 3.8
RLA 8,295.46 10.5
Total 78,763.78 99.9
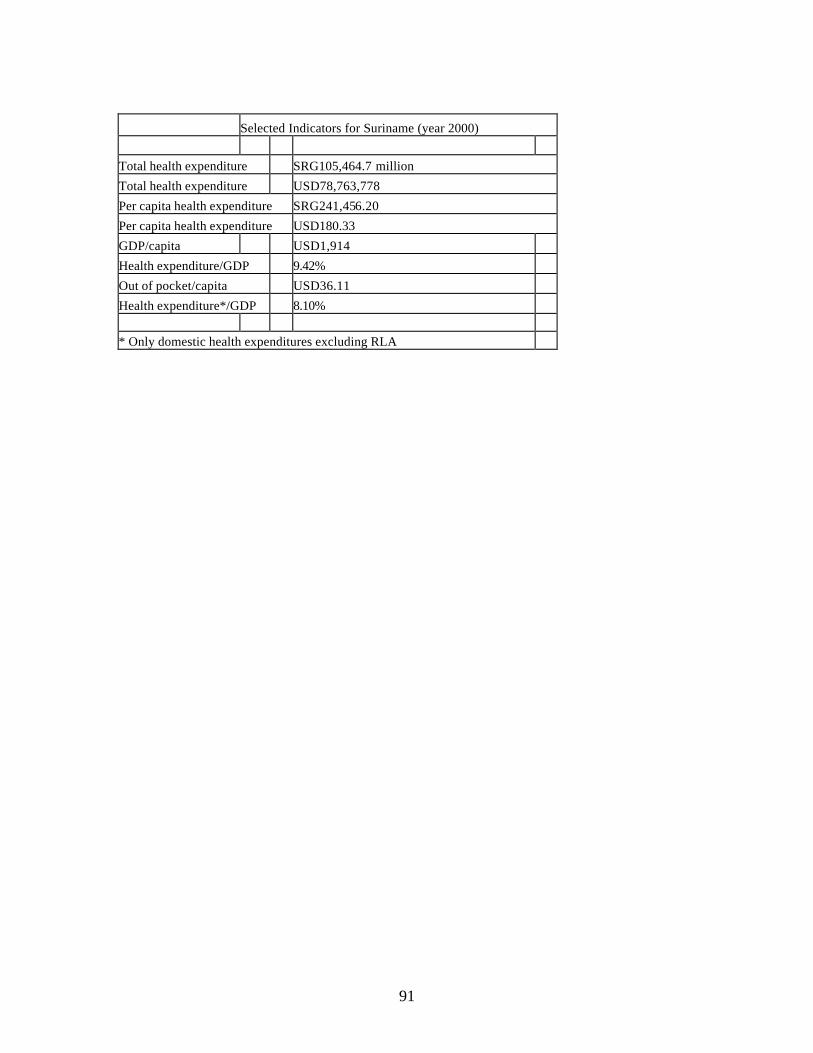
91
Selected Indicators for Suriname (year 2000) Total health expenditure SRG105,464.7 million
Total health expenditure USD78,763,778
Per capita health expenditure SRG241,456.20
Per capita health expenditure USD180.33
GDP/capita USD1,914
Health expenditure/GDP 9.42%
Out of pocket/capita USD36.11
Health expenditure*/GDP 8.10% * Only domestic health expenditures excluding RLA

92
Annex 3: Summary of Pharmaceutical System Indicators
Code Indicator Result and Sources A Policy, Legislation and Regulation A.1 Existence of a national medicines policy Draft National Drug Policy (MOH 2001)
A.2 Existence of legislation on medicines control, its regulation and existence of agencies that enforce them
Packed Medicines Law or Registration Law (Gouverneur van Suriname 1973) enforced in 1981
Registration Board and Office Pharmaceutical Inspection
A.4 Type of information system for medicines registration
Computerized database (MS Access)
A.5 Number of registered medicines Approximately 3200 (source: Registration Office)
A.6 Law that allows generic substitution Not existent
A.7 Generic substitution practiced Yes B Formulary, Essential Drug List and Drug Information B.1 Number of medicines in the Essential Drug List
or National Therapeutic Formulary Approximately 350 active substances in 600 dosage forms (MOH 1997)
B.2 Existence of an official manual, based on the EDL, that provides basic prescribing information, revised and Published within the past five years
Piloting implementation of treatment guidelines (REG 2003)
B.3 Percentage of visited facilities that have at their disposal the most recent edition of the EDL
Not measured
B.4 Existence of a Drug Information Center that provides up-to-date and unbiased information for decision-makers, health providers, and consumers
Not existent
B.N.1 Facilities with Standard Treatment Guidelines Not measured
B.N.2 Medicines selection process At BGVS based on National Essential Drug List, NGK (MOH 1997)
C. MOH Budget and Financing (and MSA Budget and Financing)
C.1 MOH budget and/or expenditures on medicines (Total in US$, for the last three years, and divided by the population that is covered by the MOH – per capita)
There is no MOH budget and/or expenditures on medicines (See for overview of expenditure Section VI)
C.2 Existence of a system for cost recovery in the public health facilities
Full cost recovery either by different funding sources and their intermediaries or paying patients (see for overview Section VI)
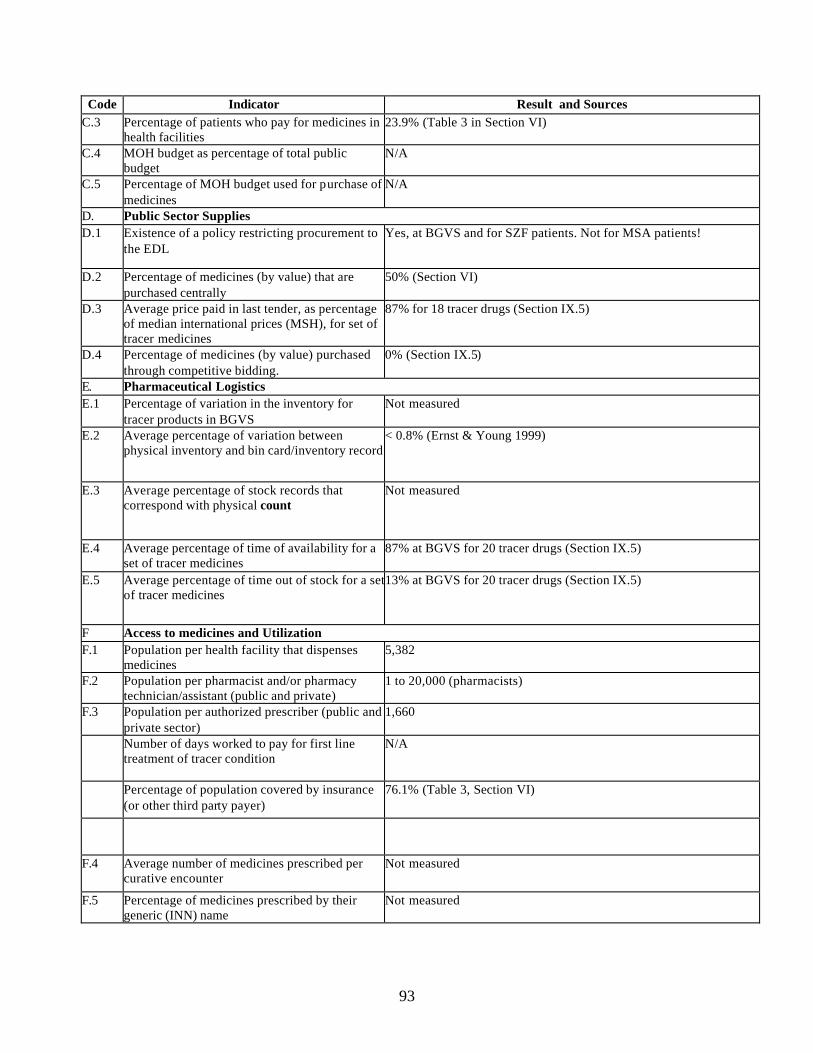
93
Code Indicator Result and Sources C.3 Percentage of patients who pay for medicines in
health facilities 23.9% (Table 3 in Section VI)
C.4 MOH budget as percentage of total public budget
N/A
C.5 Percentage of MOH budget used for purchase of medicines
N/A
D. Public Sector Supplies D.1 Existence of a policy restricting procurement to
the EDL Yes, at BGVS and for SZF patients. Not for MSA patients!
D.2 Percentage of medicines (by value) that are purchased centrally
50% (Section VI)
D.3 Average price paid in last tender, as percentage of median international prices (MSH), for set of tracer medicines
87% for 18 tracer drugs (Section IX.5)
D.4 Percentage of medicines (by value) purchased through competitive bidding.
0% (Section IX.5)
E. Pharmaceutical Logistics E.1 Percentage of variation in the inventory for
tracer products in BGVS Not measured
E.2 Average percentage of variation between physical inventory and bin card/inventory record
< 0.8% (Ernst & Young 1999)
E.3 Average percentage of stock records that correspond with physical count
Not measured
E.4 Average percentage of time of availability for a set of tracer medicines
87% at BGVS for 20 tracer drugs (Section IX.5)
E.5 Average percentage of time out of stock for a set of tracer medicines
13% at BGVS for 20 tracer drugs (Section IX.5)
F Access to medicines and Utilization F.1 Population per health facility that dispenses
medicines 5,382
F.2 Population per pharmacist and/or pharmacy technician/assistant (public and private)
1 to 20,000 (pharmacists)
F.3 Population per authorized prescriber (public and private sector)
1,660
Number of days worked to pay for first line treatment of tracer condition
N/A
Percentage of population covered by insurance (or other third party payer)
76.1% (Table 3, Section VI)
F.4 Average number of medicines prescribed per curative encounter
Not measured
F.5 Percentage of medicines prescribed by their generic (INN) name
Not measured

94
Code Indicator Result and Sources F.6 Percentage of prescribed medicines that were in
the EDL Not measured
F.7 Percentage of curative encounters that were prescribed an injection
Not measured
F.8 Percentage of curative encounters that were prescribe done or more antibiotics
Not measured
F.9 Percentage of prescribed medicines that were actually dispensed
Not measured
F.N.1 Percentage of patients who know why they were prescribed their medicines and how to take them
Not measured
G Quality Assurance G.1 Number of pharmaceutical products/samples
tested (and numberº that passed/failed) At BGVS (50% of national supplies, Section VI) all products go through Quality Control, but 21% not tested in 2002 (Section IX.9)
G.2 Use of WHO Certification Scheme Yes, for Registration purposes
G.3 Existence of a formal reporting system for (a) product problems, (b) adverse clinical events (ADRs)
No

95
Annex 4. BGVS Assessment Questionnaire
DRUG SUPPLY COMPANY SURINAME This questionnaire is to be applied at the Drug Supply Company Suriname (BGVS). The questionnaire is followed by a tracer drug inventory tick, a drug price form, and cost analysis form. General Request for relevant documentation, such as annual plans and budgets, financial reports, audit reports, management letters, consultancy reports, etc..
Organization and management
Board Director Senior staff positions 5 of which ……. vacant, see attachment Skilled workers …… of which ……. vacant, see attachment Unskilled workers …… of which ……. vacant, see attachment Ask for copy of organization structure Ask for copy of set of Standard Operating Procedures
Transportation 1. How does BGVS receive its supplies? (tick all that apply and indicate the relative
frequency of each) a. Supplies are delivered by distributors and manufacturers _________% b. Supplies are picked up by the medical store transport _________% c. BGVS contracts for transportation services _________% d. Other ______________________________________ _________%
2. How does BGVS send out orders to facilities? (Tick all that apply and indicate the
relative frequency of each) a. Supplies are sent out by medical store official transport __________% b. Supplies are delivered directly by distributors and manufacturers __________% c. Supplies are picked up by the facilities _________% d. BGVS contracts for transportation services _________ % e. Other ________________________________________ _________ % 3. What are the three most critical problems that BGVS has with the availability of
transportation? a. ______________________________________________ b. ______________________________________________ c. ______________________________________________ d. No problems

96
4. List available cars and # of mileage per year 5. List use of cars a. Distribution _________% b. Clearance _________% c. Staff use _________% d. Other _________% e. Not known _________% Communications 6. What are means of communication? a. Telephone b. Telefax c. Radio d. Computer (e.g., network, internet, e-mail) e. Cell phone f. Other: _______________________ 7. What are the most significant problems in communicating with the stores and
facilities? a. b. c.
Information systems 8. Does BGVS use a computerized system for any of the following? (tick all that apply) a. Procurement b. Tracking orders b. Tracking deliveries c. Accounting/financial d. Inventory control e. Other: ______________________ 9. What type of inventory records does BGVS maintain? a. Bin cards b. Registry/Kardex c. Computer d. Other 10. Give short description of system

97
Finance
This section applies to medical stores that sell supplies to public and/or private health facilities See also TVCA 11. What is the current markup for items sold? Ask for breakdown. 12. Is BGVS permitted to sell supplies to different clients at different prices? If YES, describe the pricing policy, if any, including exemption policies. Attach a copy of the policy. 13. How long does it take to calculate and communicate cost and sales prices after receipt
of items? 14. How does the store receive payment for orders from public health facilities? a. Cheque b. Cash c. Bank transfer d. Other: __________________________________ e. Does not apply 15. On average, what is the time between sending the order and receiving payment from
public health facilities? a. Less than a week b. One week c. One month d. More than one month e. More 16. How does the store receive payment for orders from private facilities? a. Cheque b. Cash c. Bank transfer d. Other: __________________________________ e. Does not apply 17. On average, what is the time between sending the order and receiving payment from
private facilities? a. Less than a week b. One week c. One month d. More than one month 18. List and analyze the existing debtors including the length of time of debts.

98
19. What are the most significant problems with receiving payments? a. b. c. 20. How does BGVS usually pay suppliers? a. Cash b. Bank cheque/transfer c. Credit d. Other: ________________________________________________ 21. List and analyze the existing creditors including the length of time of credit. 22. What are the most significant problems with paying suppliers? a. b. c. Procurement Ask to obtain a copy of the procurement results for the past three years. Be sure to ask about tender and non-tender results. Request for access to creditor administration to make purchase analysis. Use also Quick assessment tool (attached) Availability of 20 key items to be measured 23. What is tender frequency? a. Once a year b. Twice a year c. When needed (approximate frequency) d. Other:
24. What percentage of the products is purchased by tender? ______% What was the value of the tender for the past three years? 1998 _____________ 1999 _____________ 2000 _____________

99
25. If tenders are conducted, what methods are used, and what percent of supplies are
obtained under each method? (tick all that apply) a. International Competitive Bidding _________% b. Limited International Bidding _________% c. National Competitive Bidding ________% d. UN Agency ___________% e. Contracted procurement agent ___________% f. Other ____________________% e. Does not apply 26. How many different suppliers normally compete for tenders? _________ 27. How many different suppliers normally win tender contracts? ________ 28. What are the store's major problems with selecting suppliers through tenders? 29. What reports or registers are used when deciding the quantities to purchase? a. Bin cards b. Inventory control cards/Kardex c. Bank balance e. Other 30. Is the store regularly informed about inventory availability in other facilities? If YES, which facilities provide inventory availability information? a. Hospital b. RGD c. Pharmacy d. Other _____________________ e. Does not apply 31. How are quantities determined? a. Review of historical consumption b. Review of morbidity patterns c. Comparison of historical consumption with morbidity patterns d. Based on experience of personnel e. Purchases are programmed f. Based on quantities ordered previously g. Other

100
32. Is there a record keeping system to track purchases? Yes or No If Yes, what information is included? a. Date the order was sent b. Date the order was received c. Date the order is due d. Amount of the order e. Amount received f. Estimated cost 33. How long, on average, does it take to receive supplies once the order has been
placed? a. Less than 15 days b. 15 to 30 days c. 30 to 60 days d. 60 to 90 days e. more than 90 days 34. On average, what percentage of the orders placed are filled completely on the first
delivery? 35. What were the most critical problems that BGVS had in being able to provide needed
supplies? a. ________________________________________________ b. ________________________________________________ c. ________________________________________________ 36. In the past year, did BGVS have to return supplies to the suppliers for any of the
following reasons? (mark all that apply) a. Item not ordered b. Incorrect quantity c. Poor quality product d. Expired or near expired product e. Price change f. Damaged item g. Wrong specification h. Officia l recall by supplier I. Other: _____________________ j. None Shopping The questions in this section only apply if BGVS conducts non-tender purchases. Ask for a copy of the shopping reports for the last three years. 37. Describe non-tender procedures, i.e. shopping.

101
38. If shopping is permitted, who (official) approves the purchases?
39. How are purchases made? (tick all that apply) a. As a single facility b. At a government negotiated price c. Other ________________ 40. Approximately how many purchases through shopping were made in the last three
years? What was the value of these purchases? From how many suppliers did the store purchase?
1998 __________ purchases with a value of ____________ from ________ suppliers 1999 __________ purchases with a value of ____________ from ________ suppliers 2000 __________ purchases with a value of ____________ from ________ suppliers 41. On average, how many days does it take to receive supplies from the suppliers? a. Less than one week b. 7 to 15 days c. 15 to 30 days d. More than 30 days f. Other g. Not applicable
42. On average, how many weeks does it take from start of needs estimation to to receive
supplies, i.e. lead time? 43. List the three suppliers from whom the store purchases the most frequently and
indicate the products typically obtained from them. Supplier Product a. b. c. 44. How does BGVS usually pay suppliers? a. Cash b. Bank cheque/transfer c. Credit d. Other: ________________________________________________

102
Storage 45. Has a study been conducted in the past three years on the condition of the warehouse? Did the study include estimates of the costs for needed repairs? (Ask to obtain a copy of the report.) 46. How many square meters does the warehouse cover? ________ 47. Is the storage area sufficient?
a. Sufficient b. Overcrowded/too little space c. Underutilized space
48. Is the ventilation and circulation of air in the storage areas adequate? Yes or No 49. How is the temperature maintained in the storage areas? a. Air conditioner with thermometer b. Air conditioner without thermometer c. Fan d. Nothing e. Other __________________ 50. Is there a cold room or refrigerator/freezer for the storage of vaccines? Yes or No a. If YES, is the temperature regularly monitored? Yes or No 51. Is loss of pharmaceuticals and other supplies due to theft a problem? a. Yes, it is common b. Only occasionally c. No, it rarely if ever happens. 52. What type of storage system is used? a. Shelves b. Cabinets c. Pallets d. Other 53. What type of inventory control is used? a. FIFO (First in, first out) b. FEFO (First to expire, first out) c. None d. Other ______________ 54. How many products are currently in the inventory? _____ 55. How many of these are not on the NGK? ______

103
56. How often is a physical count of inventory done to adjust the registry/record system? a. Once a year b. Twice a year c. Three times a year d. Monthly e. Other: _____________________ 57. Are ledger books up to date? ______ Distribution 58. Is there a catalogue or alternative systems to let clients know about availability of
items? 59. How many public sector facilities does BGVS supply? a. Medical stores __________ b. Health facilities _________ c. Hospitals ____________ d. Other ________________ 60. How many private sector clients, including mission and other NGO facilities, does the
store supply? a. Medical stores __________ b. Health facilities: _________ c. Hospitals: ____________ d. Retailers _____________ e. Other: _______________ 61. If the store supplies to private sector clients, what percent of all sales are to the
private sector? _____% 62. Describe distribution system? 63. How many times in the past year was BGVS unable to supply facilities? Quality Assurance 64. Describe Quality Assurance System; is it adequate? 65. Are there any expired drugs in stock (# of items, value) 66. Does BGVS track the batch/lot numbers of products that are received and supplied?
Yes or No

104
67. List the names of the three most commonly used drug information reference books or
sources of information. Other forms: Stock out Price Comparison Cost Analysis

105
Draft January 2003 Quick Assessment Procurement Capacity BGVS/AZP/any other Copy organization structure Copy job descriptions Copy job descriptions Procurement Officers Copy organization structure and tasks Tender Committee
Or other Tender Committee
Number of posts for Procurement Officers Number posts filled Number of qualified Procurement Officers Are cv's available If yes, are they adequate Name
training/courses
Copy Procurement Procedures Nationally Copy Procurement Procedures specific organization
Copy any other Procurement Procedures References (eg World Bank)
Copy of standard bidding documents Copy of standard contracts Copy of any other standard documents used Are documents complete? Are there written Tender Evaluation Reports? Describe planning system Describe monitoring system % of timely deliveries measured What is value of procurement done from 2000 to 2002
How many contracts How many suppliers Is Procurement Register up to date? Value for Money Any other remarks
106
Annex 5. Documents Reviewed • BGVS. Beleidsplan BGVS NV concept (Policy Plan BGVS draft), februari 2002 • BGVS. Inkoophandleiding 1.0 (Procurement Manual 1.0), geen datum • BGVS. Jaarrekening 1999 (Financial Report 1999), april 2002 • BGVS. Concept Jaarrekening 2000 (Draft Financial Report 2000), juni 2002 • Braam RW. Financieel handelen van de overheid (Financial Operations by the State),
November 1988 • Brudon P, Rainhorn J, Reich MR. Indicators for Monitoring National Drug Policies
2nd edition, WHO 1999 • De Meneges HS. BGVS Rapport Organisatie Onderzoek (BGVS Report Organization
Study), 21 September 2001 • Dyckhoff R. Verbetering en Uitbreiding Produktie van Geneesmiddelen in het BGVS
Revised (Improvement and Expansion of Production of medicines in the BGVS), 9 March 1994
• Eichler R, Beith A, Lewis E, Quigley K, Seltzer J, Antonius R and Tjon Jaw Chong
HM. Analysis of Payment Systems for Primary, Specialty Outpatient, and Inpatient Care, Study #6 for Health Sector Reform submitted to MOH-PEU, MSH, Left Consultancy and MWI 17 December 2001
• Ernst & Young. Rapport inzake de controle van de jaarrekening 1998 (1998Audit
Report), 1 september 1999 • Fishstein P, Rosenthal G and Brohim R. National Health Accounts Support, Study #1
for Health Sector Reform submitted to MOH-PEU, MSH and HECORA 15 June 2002
• Gouverneur van Suriname. Verordening van 8 Mei 1896 regelende de uitoefening der
artsenijbereidkunst in de kolonie Suriname GB 1896 #26 (Suriname Drug Law), 8 Mei 1896
• Gouverneur van Suriname. Resolutie van 18 juli 1969 bepalende de thans geldende
tekst van GB 1896 #26, GB #77 (Revised Text Suriname Drug Law), 18 juli1960

107
• Gouverneur van Suriname. Landsverordening ter nadere wijziging van Verordening van 8 Mei 1896 regelende de uitoefening de artsenijbereidkunst in de kolonie Suriname GB 1896 #26, geldende tekst GB 1960 #77, #1 (Revised Suriname Drug Law), 4 januari 1973
• Gouverneur van Suriname. Landsbesluit Verpakte Geneesmiddelen #155 (Packed
Medicines Law), 16 oktober 1973 • Hansen JMM en Balraadjsing W, Evaluatie Project Geneesmiddelenvoorziening
Suriname 1994-1998 (SR004304) (Evaluation Project Drug Supply Suriname 1994-1998), November 1997
• Jacobs Ph. Bedrijf Geneesmiddelenvoorziening Suriname, een inventarisatie van
knelpunten en opties voor toekomstige ontwikkeling (BGVS, an inventory of constraints and options for future development), februari 1990
• KIT.Study of the Role and Performance of RGD clinics, General Practioners and
Medical Mission, 2001 • KPMG. BGVS Analyserapport Inkoopproces –versie 3.0 – (BGVS Analysis report
procurement process), 26 september 1997 • KPMG. BGVS Nieuwe procesbeschrijving en procedures Inkoopproces –versie 1.0 –
(BGVS New process description and procedures), 13 oktober 1997 • KPMG. BGVS Bemensing en inrichting afdeling Inkoop en Inklaring (Staffing and
Organization Procurement and Clearing Department), 23 november 1998 • Lee David and Verhage Robert. Suriname Study on Public Sector Drug Procurement
Inception Report, 23 January 2003 • Levinson Libby. Policy and programming options for reducing the procurement costs
of essential medicines in developing countries, 2003 • Medicopharma NV. Feasibility Study for a proposed Pharmaceutical Production Plant
in the Republic of Suriname, September 1991 • Minister of Health. Beslissing instelling Raad voor het nationale Essentiële
Geneesmiddelenprogramma (Decision Installation Board for the National Essential Drug Program), 25 juli 1996
• MOH. Nationale Geneesmiddelen Klapper van Suriname (Suriname National Drug
List), 1997 • MOH. Het Nationaal Geneesmiddelenbeleid concept (National Drug Policy Suriname
draft), Oktober 2001

108
• MOH. Het Nationaal Geneesmiddelen Programma (National Drug Program
Suriname) in development, no date • MOH. Beleidsplan 2000 – 2005 (Policy Plan 2000 – 2005). March 2001 • MOH. Annual Report of the Chief Medical Officer for the Year 2000 • MOH-PEU. Actuarial study and model for the Staatsziekenfonds draft, 2001??? • Moniz EA. Eindrapportage Project Geneesmiddelenvoorziening Suriname 1992 –
1996 (Final Report Project Drug Supply Suriname 1992 to 1995), BGVS Februari 1995
• MSH. Rational Pharmaceutical Management Project. Rapid pharmaceutical
management assessment: an indicator-based approach. Arlington, VA: Management Sciences for Health, July 1995
• MSH/WHO. Managing Drug Supply, 1997 • MSH/WHO. International Drug Price Indicator Guide 2001 Edition, • President van Suriname. Decreet houdende de instelling van het Bedrijf
Geneesmiddelen Voorziening Suriname E-37 (BGVS Decree E-37), 4 februari 1983 • President van de Republiek Suriname. Wijziging Besluit Verpakte Geneesmiddelen
#56 (Revision Packed Medicines Law), 4 september 1986 • REG. Geneesmiddelenvoorziening in Suriname 1996-2001 (Drug Supply in Suriname
1996-2001), April 1997 • REG. Geneesmiddelenaankoop en Voorraadbeheer: de actuele werkwijze (Drug
Procurement and Inventory Control: the way it works), April 1997 • REG. Kernvragen m.b.t. aankoop en voorraadbeheer essentiele geneesmiddelen (Core
questions about Procurement and Inventory Control Essential Drugs), April 1997 • REG. Verslag van de Workshop “Het Geneesmiddelenbeleid van Suriname: Aankoop
en voorraadbeheer geneesmiddelen” (Report of the Workshop “The Drug Policy of Suriname: Procurement and Inventory Control”), 25 mei 1997
• Tjon Jaw Chong HM en Dubbeldam RP. Health Planning Panacee of fata morgana,
september 1998.

109
• Van Haperen J. Noodhulpprogramma Gezondheidszorg Suriname Deel II: Formulering project geneesmiddelen 1991 t/m 1995 (Emergency Aid Health Sector Suriname Part II: Proposal Project Pharmaceuticals), KIT April 1991
• Vereniging van Apothekers. Actiepunten ter verbetering van de farmaceutische
dienstverlening (Steps for improvement of the pharmaceutical services), september 2000
• Verhage R. Experiences of restructuring the organization for drug-supply in Suriname
(Paper on behalf of the seminar on restructuring Central Medical Stores Malawi), February 1995
• Voedselvoorzieningsin- en Verkoopbureau. BGVS Cursus Inkoop (BGVS Procurement
Course), augustus 1994 • WHO. Medicines Strategy 2000-2003, Geneva 2000 • WHO. Indicators for Monitoring National Drug Policies Second Edition, 1999 • World Bank. Procurement under IBRD Loans and IDA Credits, January 1995 (revised
several times latest January 1999)

110
Annex 6. List of Key Informants Interviewed Ministry of Health
• Rinia Codfried-Kranenburg, Director • Norma De Vries, Pharmaceutical Inspector • Lilian Komproe, Chairperson, Drug Registration Committee • Manodj Hindori, Head, Project Executing Unit • Sharita Gangaram Panday, Economist, Project Executing Unit
Drug Supply Company Suriname (BGVS) • Ingrid M. May, Director • Etienne Moniz, Internal Control • Frank Lieveld, Deputy Director, Pharmacy • Fedor Menke, Purchasing Department • Chander Soerdjlal, Quality Control Laboratory
Association of Importers of Pharmaceutical Products (Vereniging van Importeurs van Geneesmiddelen)
• Glenn Wormer, Chairman • Hedwig Ligeon, member
Private Suppliers • Randy Chee A Tow, Agape • Raoul Akrum, Jong A Kiem • Tony Pinas, Jong A Kiem • Jerry Ausan, Ausan • Glen Wormer, CKC Incom • Cindy de Faria, CKC Incom • Hedwig Ligeon, Liam N.V. • Pertaap Ramdat Missier, N.V. Mishra • Maxim’s Wholesale • Henk Chang, Hussain Ali • Hans Singh, Hans Singh Trading
Medical Association Suriname(VMS) •
Association of Pharmacists (Vereniging van Apothekers) • Vinodj Sewberath Missier, Chairman
Board of the Essential Drugs Program (REG) • Frank Bueno de Mesquita, Secretary
Ministry of Social Affairs • S Pawironadi
State Health Insurance Fund Suriname • Harold Ramdani, Chairman of the Board, acting general manager • Marino Starke, Policy Advisor • Wim Soemodihardjo, Policy Advisor • Henk van Vliet, Head Public Relations • Beryl Polanen, Public Relations
111
• Anne Marie Sanchez, Public Relations • Shirley Tangali, Prescriprion Processing • Mildred Lie Hon Fong, Medical Advisor
St. Vincentius Hospital (RKZ) • H Pinas, Economist
Associatie Ziektekosten Pas Suriname (AZPAS) • Mario Merhai
Staff of several pharmacies and dispensing health facilities for drug availability survey and interviews
• Academic Hospital Paramaribo • Tatiana Ferrier, locum pharmacist • Marjory Braaf, pharmacy assistant, storekeeper
• Regional Health Services (RGD) • Vinodj Sewberath Misser, locum pharmacist • Ms. Chitrawatie Gobardhan, pharmacy assistant, storekeeper, Paramaribo • Ms. D Ramdas, pharmacy assistant, Paramaribo • Ms. Saida Hassankhan, pharmacy assistant, polyclinic Henar • Ms. S Saktoe, technician , polyclinic Henar
• Apotheek Fung • Patricia Refos, pharmacist
• Apotheek RKZ • Lilian Komproe, pharmacist • Ms. N Emanuelson, pharmacy assistant • J jemani, storekeeper
• ‘s Lands Apotheek • Tatiana Ferrier, pharmacist
• DKZ apotheek • Jules de Kom, pharmacist
• Medical Mission • Jules de Kom, Pharmacist
• N.V. Soma Apotheek • Vinodj Sewbertah Misser, pharmacist
• Pharmacy SZN • Drs. R Lie Fo Sjoe, observer • Ms. H Rambaran, pharmacy assistant • Ms. Lalji, pharmacy assistant
• N.V. Ligeon Apotheek • Arti Nandlall, pharmacist • Nirmala Ragoebar, storekeeper
• Apotheek Rafeka • Jacintha Despo, pharmacist
• Apotheek Polanen • Fawzia Henar- Karamat Ali, pharmacist
• Apotheek Farmsur

112
• Christien Vrede-Kort, pharmacist • Martha Waarde, pharmacy assistant
• Apotheek Esculaap • Pertaap Ramdat Missier, pharmacist
Pan-American Health Association • Primnath Ritoe EPI Officer
NV Computech • Frans Smits

113
Annex 7. Availability of Tracer Medicines Supplied by BGVS
BGVS-code
Item description BGVS stock
(weeks)
HG1 HG2 HG3 HP1 HP2 MZ RGD1 RGD2 RGD3 RGD4 RGDP PP1 PP2 PP3 PP4 PP5 PP6 PP7
1 10014.04 Amoxicilline trihydraat 125mg/5ml drank 100ml
15 1 1 1 1 1 1 1 1 1 1 1 1 1 1 1 1 1 1
2 10014.02 Amoxicilline trihydraat 500mg capsule(or tablets)
48 1 1 1 1 1 1 1 1 1 1 1 1 1 0 1 1 1 1
3 10024.01 Atenolol 100mg tablet 5 1 1 1 1 1 1 1 1 1 1 1 1 1 0 1 0 1 1 4 10317.01 Captopril 25mg tablet 29 0 1 1 1 1 1 1 1 1 1 1 0 1 1 1 1 1 1 5 10061.02 Cimetidine 400mg tablet 42 1 1 1 1 1 1 1 1 1 0 1 0 1 1 1 1 1 1 6 10069.02 Co-Trimoxazol 480mg tablet 103 1 1 1 1 1 1 1 1 1 1 1 0 1 1 1 0 1 1 7 10114.01 Ferrofumaraat 200mg tablet 0 0 0 1 1 0 1 1 0 1 1 0 0 1 1 0 0 0 0 8 10123.01 Foliumzuur 5mg tablet 0 1 1 1 0 1 0 1 1 1 1 1 0 1 1 1 1 1 0 9 10124.01 Furosemide 40mg tablet 30 1 1 1 1 1 1 1 1 1 1 1 1 1 0 1 0 1 0 10 10128.01 Glibenclamide 5mg tablet 22 1 1 0 1 1 1 1 1 1 1 1 0 1 1 1 0 1 1 11 10184.01 Mebendazol 100mg tablet 39 1 1 1 1 1 1 1 1 1 1 1 0 1 0 1 1 1 1 12 10199.01 Metronidazol 250mg tablet 37 1 1 1 1 1 1 1 1 1 0 1 0 1 1 1 1 1 1
13 10358.01 Nifedipine 20 mg tablet retard
21 0 1 0 1 1 1 1 0 1 1 0 1 1 1 1 1 0 1
14 10265.01 Oraal rehydratiemengsel samengesteld 27.9 gram
1 1 1 1 1 1 1 1 1 1 1 1 1 1 1 1 1 1 1
15 10271.05 Salbutamol aerosol 0.1 mg/dose, 200 doses
16 1 1 1 1 1 1 1 0 1 1 1 1 1 1 1 1 1 1
16 10271.02 Salbutamolsulfaat 4mg tablet
78 0 1 1 1 1 1 1 1 1 1 1 0 1 1 1 0 1 1
17 10015.01 Ampicillinenatrium 1g injektie poeder
6 1 1 1 1 1 1
18 10164.04 Kinine-Dihydrochloride 300mg/ml injektie 2ml
41 1 1 1 1 1 1
19 10208.02 Natriumchloride 0.9% infuus 500ml
32 1 1 1 1 1 1 0 1 1 1 1
20 10289.01 Thiopentalnatrium 500mg injektie poeder
0 0 0 0 0 0
Total 17 15 18 17 18 18 18 16 14 17 15 15 7 16 12 15 10 14 13
Percentage 85% 75% 90% 85% 90% 90% 95% 94% 82% 100% 88% 88% 44% 100% 75% 94% 63% 88% 81%
HG = Government Hospital HP = Private Hospital Median availability 85% MZ = Medical Mission RGD = Regional Health Services (P) is Paramaribo PP = Private Pharmacy

114
Annex 8. Availability of Tracer Medicines Supplied by Private Suppliers
Item description HG1
HG2
HG3
HP1
HP2 MZ RGD
1 RGD
2 RGD
3 RGD
4 RGD
P PP1
PP2
PP3
PP4
PP5
PP6
PP7
1 Amoxicilline trihydraat 125mg/5ml drank 100ml
0 1 0 0 0 0 0 0 0 0 0 0 0 0 0 0 0 0
2 Amoxicilline trihydraat 500mg capsule(or tablets)
0 1 0 0 0 0 0 0 0 0 0 0 0 1 0 0 1 1
3 Atenolol 100mg tablet 0 1 0 1 0 1 0 0 0 0 0 1 0 1 0 1 1 1 4 Captopril 25mg tablet 0 1 1 0 0 0 0 0 0 0 0 1 1 1 0 1 1 1 5 Cimetidine 400mg tablet 0 1 0 0 1 0 0 0 0 0 0 1 1 0 0 1 1 1 6 Co-Trimoxazol 480mg tablet 0 1 0 0 0 0 0 0 0 0 0 1 0 0 0 1 1 1 7 Ferrofumaraat 200mg tablet 0 1 0 0 1 0 0 0 0 0 0 1 1 0 1 1 1 1 8 Foliumzuur 5mg tablet 0 1 0 0 0 0 0 0 0 0 0 1 0 0 0 1 0 1 9 Furosemide 40mg tablet 0 1 0 0 0 0 0 0 0 0 0 1 0 1 0 0 0 1 10 Glibenclamide 5mg tablet
0 1 1 0 1 0 0 0 0 0 0 1 0 1 0 1 1 1
11 Mebendazol 100mg tablet
0 1 0 0 1 0 0 0 0 0 0 1 0 1 0 1 0 1
12 Metronidazol 250mg tablet
0 1 0 0 1 0 0 0 0 0 0 1 0 0 1 0 0 1
13 Nifedipine 20 mg tablet retard
1 1 1 0 1 0 0 0 0 0 1 1 1 1 1 0 1 1
14
Oraal rehydratiemengsel samengesteld 27.9 gram
0 1 0 0 0 0 0 0 0 0 0 1 0 0 0 0 0 0
15
Salbutamol aerosol 0.1 mg/dose, 200 doses
0 1 0 1 1 1 0 0 0 0 0 1 0 1 0 0 0 1
16 Salbutamolsulfaat 4mg tablet
0 1 0 0 0 0 0 0 0 0 0 1 0 1 0 1 0 0
17 Ampicillinenatrium 1g injektie poeder
0 1 0 0 0 0 0 0 0 0 0
18
Kinine-Dihydrochloride 300mg/ml injektie 2ml
0 0 0 0 0 0 0 0 0 0 0
19 Natriumchloride 0.9% infuus 500ml
0 0 0 0 0 0 0 0 0 0 0
20 Thiopentalnatrium 500mg injektie poeder
0 1 0 0 0 0 0 0 0 0

115
Totals 1 18 3 2 7 2 0 0 0 0 1 14 4 9 3 9 8 13
Percentage 5% 90%
15%
10%
35%
11% 0% 0% 0% 0% 5%
88%
25%
56%
19%
56%
50%
81%
HG = Government Hospital
HP = Private Hospital Median
availability 30%
MZ = Medical Mission RGD = Regional Health Services (P) is Paramaribo
PP = Private Pharmacy