surprising increase in yield stress of mg single crystal
TRANSCRIPT

Journal Pre-proof
Surprising increase in yield stress of Mg single crystal usinglong-period stacking ordered nanoplates
Koji Hagihara , Ryohei Ueyama , Michiaki Yamasaki ,Yoshihito Kawamura , Takayoshi Nakano
PII: S1359-6454(21)00177-4DOI: https://doi.org/10.1016/j.actamat.2021.116797Reference: AM 116797
To appear in: Acta Materialia
Received date: 23 September 2020Revised date: 7 January 2021Accepted date: 6 March 2021
Please cite this article as: Koji Hagihara , Ryohei Ueyama , Michiaki Yamasaki ,Yoshihito Kawamura , Takayoshi Nakano , Surprising increase in yield stress of Mg sin-gle crystal using long-period stacking ordered nanoplates, Acta Materialia (2021), doi:https://doi.org/10.1016/j.actamat.2021.116797
This is a PDF file of an article that has undergone enhancements after acceptance, such as the additionof a cover page and metadata, and formatting for readability, but it is not yet the definitive version ofrecord. This version will undergo additional copyediting, typesetting and review before it is publishedin its final form, but we are providing this version to give early visibility of the article. Please note that,during the production process, errors may be discovered which could affect the content, and all legaldisclaimers that apply to the journal pertain.
© 2021 Published by Elsevier Ltd on behalf of Acta Materialia Inc.

1
Surprising increase in yield stress of Mg single crystal using long-period stacking
ordered nanoplates
Koji Hagihara1*
, Ryohei Ueyama1, Michiaki Yamasaki
2,
Yoshihito Kawamura2, Takayoshi Nakano
1
1Division of Materials and Manufacturing Science, Graduate School of Engineering,
Osaka University, 2-1 Yamadaoka, Suita, Osaka 565-0871, Japan.
2Magnesium Research Center & Department of Materials Science, Kumamoto University,
2-39-1 Kurokami, Chuo-ku, Kumamoto 860-8555, Japan.
*Corresponding author: E-mail: [email protected], Tel: +81668797434
Abstract
Mg–Zn–Y ternary alloys containing the long-period stacking ordered (LPSO) phase
exhibit superior mechanical properties. This is believed to be originating from the LPSO
phase acting as the strengthening phase. However, we first clarify that the mechanical
properties of the matrix Mg solid solution in the Mg/LPSO two-phase alloy are
significantly different from those of pure Mg. The yield stress of a Mg99.2Zn0.2Y0.6 single
crystal (matrix Mg solid solution) is almost the same as that of an LPSO single-phase
alloy. This is ascribed to the formation of thin stacking-fault-like defects, named “LPSO
nanoplate”. In Mg99.2Zn0.2Y0.6, kink-band formation is induced in the same manner as that
in the LPSO phase in deformation, resulting in high strength accompanied with increased
ductility. Our results suggest that the strengthening mechanism of the Mg/LPSO
two-phase alloy must be reconsidered depending on the microstructure. Furthermore, the
results suggest that new ultrahigh-strength Mg alloys, which have much lower Zn and Y
contents but the mechanical properties are comparable or superior than the present
Mg/LPSO two-phase alloys, are expected to be developed via the appropriate control of
LPSO nanoplate microstructures.

2
Keywords: Mg alloy; strength; LPSO-phase; microstructure; nanoplate
1. Introduction
There is an increased demand for the development of new lightweight structural
materials to overcome issues related to global warming. Mg alloys are a potential
candidate for addressing these issues. However, there are serious drawbacks for
expanding the use of Mg alloys in many fields of application—notably, their insufficient
strength and low corrosion resistance. Commercial cast Mg alloys exhibit a low tensile
yield strength of ∼100–250 MPa and limited ductility (elongation: 3%–15%) at room
temperature
[1]. In order to improve these properties, Mg alloys containing the
long-period stacking ordered (LPSO) phase have recently received attention [2–15]. The
LPSO phase is known to form in Mg–Zn–Y ternary alloys. The LPSO phase has an
approximate composition of Mg–5at% Zn–7at% Y in the typical Mg/LPSO two-phase
alloy with a composition of Mg97Zn1Y2. The crystal structure of the LPSO phase is
constructed by the long-period stacking—typically, 18- or 14-fold—of close-packed
planes (the basal plane in hexagonal systems) along the c axis [16,17]. Additionally, the
Y/Zn atoms in the LPSO phase are periodically segregated into four specific layers of
close-packed planes where a face-centered cubic (fcc)-like stacking fault exists [17], as
illustrated in Supplementary Fig. S1. Kawamura et al. first reported that a rapidly
solidified Mg/LPSO two-phase alloy with a composition of Mg97Zn1Y2, which contains
the ~24 vol% of LPSO phase, exhibits an extremely high yield stress of ~600 MPa while
retaining ~5% elongation [2]. Further, a high ultimate tensile strength of ~400 MPa can
be obtained for extruded alloys fabricated by a simpler process [5]. To clarify the physical
origin of this drastic strengthening, the mechanical properties of the LPSO phase have
been extensively studied. Hagihara et al. examined the mechanical properties of the
LPSO phase by using a directionally solidified (DS) LPSO single-phase crystal [18–20].
As a result, the plastic deformation behavior of the LPSO phase was found to have strong
anisotropy. Basal slip can be operative in the LPSO phase, similar to Mg, and is

3
accompanied by a low yield stress. However, in the case where stress is applied parallel
to the basal plane, the yield stress is quite high and different from that in Mg; this is
because the formation of deformation twins is prohibited, which is ascribed to the
complicated LPSO structure [18]. Instead, unique kink bands are formed, resulting in
ductility [18–20]. A kink band is a deformation band in which basal dislocations are
aligned along a direction perpendicular to the slip plane [18–25], as illustrated in
Supplemental Fig. S2. More recently, it was found that the formed kink bands act as
effective obstacles to the motion of basal dislocations, contributing to the strengthening
of the LPSO phase (kink-band strengthening) [26,27].
In contrast, the mechanical properties of the matrix Mg phase in Mg/LPSO two-phase
alloys have not received as much attention from researchers. The composition of the Mg
matrix phase [3] is approximately Mg–0.2at% Zn–0.6at% Y. The mechanical properties
of Mg–Y and Mg–Zn binary alloys were examined by some researchers using single
crystals [28–31]. However, the effects of the coaddition of Zn and Y on the mechanical
properties have not received significant attention until now. In this study, we used a single
crystal prepared by directional solidification to ascertain the effects of coaddition. We
found that the mechanical properties of the Mg solid solution are entirely different from
those of pure Mg and similar to those of the LPSO phase, which we report here in detail.
Moreover, the physical origin of the drastic increase in yield stress is discussed.
2. Experimental procedure
A master ingot with a composition of Mg–0.2at% Zn–0.6at% Y was prepared by
induction melting in a carbon crucible. Directional solidification was conducted using the
Bridgman technique (Nissin Giken NEV-DS2) in an Ar-gas atmosphere at a growth rate
of 5.0 mm/h. The microstructure of the obtained DS crystal was examined by optical
microscopy (OM; Olympus BX51M), laser microscopy (LM; Olympus DSX510),
scanning electron microscopy (SEM; JEOL JSM-7800F) at 15 kV, and transmission
electron microscopy (TEM; JEOL JEM-3010) at 300 kV. Furthermore, the distribution of

4
Zn/Y atoms was examined by high-angle annular dark-field scanning transmission
electron microscopy (HAADF-STEM; JEOL JEM-2100F) at 200 kV. In addition to the
as-DS-grown crystals, the microstructure observation was conducted to some heat-treated
specimens. As the first condition, some as-DS-grown specimens were annealed at 520 °C
for 5 h under Ar atmosphere, followed by water quenching. As the second condition, the
specimen annealed at 520 °C was further annealed at 400 °C for 5 h, followed by water
quenching. Then, the variations in microstructure in them were examined by
abovementioned methods.
For comparison of the deformation behavior, pure-Mg single crystals were also grown
by the same method at a growth rate of 10.0 mm/h. From the microstructural analyses,
the obtained DS crystal was confirmed to consist of some large grains of the Mg solid
solution phase with a diameter of ~ 5–8 mm. From the large grains, single-crystal
rectangular specimens with dimensions of 2 × 2 × 5 mm3
were cut for compression tests
by electrodischarge machining. The crystal orientation of the specimen was determined
by X-ray backscatter Laue diffraction analysis.
Four different crystal orientations were selected as loading axes in the compression
tests to examine the orientation dependence of the plastic deformation behavior. The four
orientations correspond to [0001], [0110], [1120], and [1 1 2 1.85], as indicated in the
stereographic projection in Fig. 2(a), later. The Schmid factors for the possible
deformation modes for the four loading axes that were expected from reports on the
deformation behavior of pure Mg and its solid solutions [28–38] are listed in
Supplemental Tables S1 and S2. Before the compression tests, specimens were
mechanically polished using emery paper and then chemically polished in an ethanol–
20-vol% nitric acid solution to remove surface damage. Compression tests were
performed at a nominal strain rate of 1.67×10⁻⁴
s–1
at temperatures ranging from RT
(~20 °C) to 400 °C using universal testers (Shimadzu AG-5kNX System, and Instron
8862 System), in vacuum. The influence of the heat-treatment to the deformation
behavior was also examined by the compression test using the abovementioned

5
heat-treated specimens at [1120] at RT.
In addition, some tensile tests were conducted to examine the ductility of the
as-DS-grown single crystal. The tensile tests were conducted by using the plate-like
specimens with the gauge dimension of 2 × 1 mm2 × 5 mm, along [0001] orientation at
RT, in vacuum.
Deformation markings placed on specimen surfaces were analyzed using OM with
Nomarski interference contrast, and the operative deformation mode was determined. The
variation in the crystal orientation due to deformation was examined by electron
backscatter diffraction (EBSD) pattern analysis in the SEM at a measured step distance of
1.0 μm. During the preparation of specimens for SEM-EBSD, a specimen’s surface was
mechanically polished using emery paper, and a final treatment was conducted using a
cross-section polisher (JEOL IB19500CP). The deformation microstructure was further
examined by TEM. Specimens for TEM observation were prepared by ion milling using
Ar (Fishione Model 1051 TEM Mill,).
Fig. 1 (a) SEM image of the as-grown DS alloy. (b) Bright-field TEM image showing the
microstructure in the as-grown alloy. (c) Corresponding HAADF-STEM image. The inset

6
shows a higher-magnification image. Zn/Y atoms are segregated along four atomic layers
where an fcc-type stacking fault exists. (d, e) TEM images showing the variation in
microstructure due to heat treatment: (d) specimen in Fig.1(b) was annealed at 520 °C
for 5 h followed by water quenching, and (e) specimen in Fig.1(d) was annealed further
at 400 °C for 5 h. (f) Variation in the number of LPSO nanoplates per 1 m and their
average thickness according to heat treatment, measured along [0001] in the TEM. The
observation direction is parallel to [1120] in all the Figs. 1(a–e).
3. Results
3.1 Development of the LPSO nanoplate microstructure
Fig. 1(a) shows an SEM image of the microstructure of the as-grown DS
Mg99.2Zn0.2Y0.6 alloy. The DS alloy comprises some large Mg grains, and almost no large
precipitates exist. In the grains, a very fine straight contrast exists along an alignment
direction. From an X-ray Laue analysis, it was confirmed that fine traces exist parallel to
the basal plane in the Mg grains. Fig. 1(b) shows a bright-field TEM image of the
as-grown crystal viewed along [1120]. A large amount of stacking-fault-like contrast is
seen on (0001). This is the origin of the fine traces from the SEM observations. The
formation of stacking-fault-like defects in Mg–Zn–Y ternary alloys has been previously
reported [39-41]. The TEM image shown in Fig. 1(b) was acquired with a reflection
vector of g = 0002. The stacking faults on the basal plane in a general hexagonally
close-packed (hcp) crystal have a shift vector of R = 1/3<1010>. Thus, the contrast of the
stacking faults must be invisible if the existing stacking faults are conventional faults.
The clear contrast of the defects in Fig. 1(b) demonstrates that they are not simple
stacking faults but a thin LPSO-phase-related defect accompanied by the compositional
segregation of Zn/Y atoms. The high-magnification TEM observations demonstrate that
the fault-like contrast has a “thickness.” The thickness of the fault-like contrast is
approximately ~28 nm, and the number density of the fault-like contrast along the c axis
is ~9.8 per 1 m. We call this stacking-fault-like defect an “LPSO nanoplate” hereafter.
The detailed structure of the LPSO nanoplate was confirmed by HAADF-STEM, as
shown in Fig. 1(c). The fault-like contrast is observed with white contrast owing to the

7
segregation of Zn/Y atoms that are “heavier” than Mg, as reported previously [39-41].
The higher-magnification HAADF-STEM image in the inset of Fig. 1(c) demonstrates
that the ordering of the Zn/Y segregation along the c axis has not developed to a long
range but only along four atomic layers where an fcc-type stacking fault exists. This is
consistent with the previous reports [40,41], which further detail their nature. In our Mg–
Zn–Y single crystal, the four-layer Zn/Y segregated stacking faults are heterogeneously
distributed, as some of them gather in a localized region, implying that the LPSO
nanoplate is not a “perfect LPSO phase” but is composed of aggregated some four-layer
Zn/Y segregated stacking faults. The thickness of the LPSO nanoplate measured by TEM
is an “apparent thickness” corresponding to the average nanometer-scale distances of the
aggregated Zn/Y segregated stacking faults. The schematics explaining the LPSO
nanoplate is indicated in Supplementary Fig. S3.
Heat treatment was used to control the LPSO nanoplate microstructure. Fig. 1(d)
shows the microstructure of a specimen annealed at 520 °C for 5 h followed by water
quenching, and Fig. 1(e) shows the variation in the microstructure after further annealing
of this specimen at 400 °C for 5 h. Fig. 1(f) shows the variations in the number density of
LPSO nanoplates and their average thickness along the c axis according to heat treatment.
The number of the LPSO nanoplates drastically decreases to below 0.1 /m with
high-temperature annealing at 520 °C and is accompanied by an increase in the average
thickness to ~ 83 nm. At high temperature of 520 °C, Y and Zn are considered to show
much higher solubility in Mg than those at low temperatures. At this condition, the LPSO
nanoplate microstructure was thermally unstable. The volume fraction of the LPSO
nanoplate was drastically decreased, and the small amount of remained LPSO nanoplates
transformed into a perfect LPSO phase at a localized region. With subsequent annealing
at 400 °C, however, many thin LPSO nanoplates again precipitate, and the microstructure
almost recovers to that of the as-grown crystal. These behaviors are similar to those of the
Mg grains in a polycrystalline Mg–0.7at% Zn–1.4at% Y alloy, as reported by Lee et al.
[39].

8
3.2 Drastic strengthening of Mg solid solution due to the LPSO nanoplates
Using the as-grown single crystal containing a high density of LPSO nanoplates, the
mechanical properties were examined by compression tests. Fig. 2(a) shows the
temperature dependence of the yield (fracture) stress in four loading orientations. The
Schmid factors for the possible deformation modes for the four loading axes are listed in
Supplemental Tables S1 and S2. The yield stress shows a strong dependence on
orientation. Focusing on the yield stress at RT, the yield stress is extremely low: 9 MPa in
the [1 1 2 1.85] orientation, and it slightly decreases to 7 MPa at 400 °C. A high yield
stress of >100 MPa was measured in the [0110] and [1120] orientations. The yield stress
is slightly higher in the [1120] orientation than in the [0110] orientation, and it
moderately decreases as the temperature increases in both orientations. An extremely
high strength of >350 MPa was measured in the [0001] orientation, but all specimens
were fractured before yielding.

9
Fig. 2 (a) Temperature dependence of the yield stress of the as-grown Mg99.2Zn0.2Y0.6
single crystal in four loading orientations. The yield stress of the pure-Mg single crystals
reported in ref. [32] and that measured in this study are also plotted in gray for
comparison. (b, c) Typical stress–strain curves deformed at (b) RT and (c) 300 °C in four
different loading orientations.
In Fig. 2(a), the yield stresses of pure-Mg single crystals in ref. [32] and those measured
in this study are plotted in gray for comparison. Surprisingly, the yield stress drastically
varies, even with minute amounts of coadded 0.2at% Zn and 0.6at% Y. The yield stress in
the [1 1 2 1.85] orientation is extremely low (~1 MPa) in pure-Mg single crystals, as
expected from the previous report [30]. While the yield stress of the Mg–Zn–Y solid
solution greatly increases relative to that of pure Mg. Furthermore, the yield stress in the
[1120] orientation surprisingly increases from ~12 MPa to ~130 MPa, which is ~11 times
larger for the Mg–Zn–Y solid solution, and retains plastic deformability. A similar drastic
increase in the yield stress is observed in the [0110] orientation. In the [0001] orientation,
the fracture stress of the Mg–Zn–Y solid solution is ~350 MPa, which 1.3 times larger
than the yield stress of the pure-Mg single crystal. In contrast to the behavior of pure Mg,
the high yield stress of the Mg–Zn–Y alloy is maintained even at high temperatures.
The typical stress-strain curves for deformation at RT and 300 °C are displayed in Figs.
2(b) and (c). Except for the [0001] orientation, more than 5% plastic deformation is
possible for all temperatures and loading orientations. Weak work hardening is observed
for deformation in the [0110] orientation at RT, but almost no or a small amount of work
hardening is observed after yielding under other loading conditions.

10
Fig. 3 OM images showing the deformation traces in specimens deformed at RT.
Specimens were deformed to ~5% plastic strain in the loading orientations of (a, b)
[1 1 2 1.85], (c, d) [1120], (e, f) [0110], and (g, h) [0001]. The Miller indices of the side
surface planes in observation are indicated at the top-right corner in the images.
3.3 Deformation mechanisms of the Mg–Zn–Y alloy containing LPSO nanoplates
To clarify the origin of the strong orientation dependence of the deformation behavior
of the single crystal of the Mg–Zn–Y solid solution, the deformation microstructure was
examined. Fig. 3 shows OM images of the deformation traces introduced in specimens
deformed at RT to ~5% plastic strain. In the [1 1 2 1.85] orientation, a large number of
fine slip traces are observed [Figs. 3(a, b)]. These slip traces are introduced parallel to the
LPSO nanoplates shown in Fig. 1(a), demonstrating that the slip plane is parallel to
(0001). From a TEM analysis, the Burgers vector of a basal dislocation was confirmed to
be <1120>, the same as that in pure Mg. A nearly similar morphology of (0001) basal slip
traces was observed at any temperature. In the [0001] orientation, specimens fractured at
a very high stress of ~350 MPa before yielding. In the fractured specimens, no
deformation traces are observed [Figs. 3(g, h)]. Even at high temperature, no large plastic
strain is obtained, and the introduction of deformation traces is not observed, as indicated
in Supplemental Fig. S4. Thus, the deformation mechanism in the [0001] orientation is
still unknown. Figs. 3(c, d) show the deformation markings introduced in the specimen
deformed in the [1120] orientation. Broad deformation bands whose interfaces are
parallel to {1012} are abundantly observed. According to results reported for pure Mg
[33], the deformation bands are considered to be {1012} deformation twins. In addition
to {1012} twins, some deformation bands whose traces are wavy and introduced nearly
perpendicular to the loading axis coexist. The contrast of these wavy deformation bands
is strong on the (0001) side surface [Fig. 3(c)], but weak on the (1100) side surface [Fig.
3(d)]. The formation of such wavy deformation bands is more readily observed for the
specimen deformed in the [0110] orientation [Figs. 3(e, f)]. The contrast of the wavy

11
deformation bands has similar features as that for the specimen deformed in the [1120]
orientation; the contrast of the deformation bands is much stronger on the (0001) side
surface.

12
Fig. 4 Macroscopic views showing the variations in the deformation microstructure with
temperature. Specimens were deformed in the (a) [1120] and (b) [0110] loading
orientations to ~5% plastic strain at the temperatures indicated. The Miller indices of the
side surface planes in observation are indicated in the figure.
Figs. 4(a, b) show macroscopic views of the variations in the deformation
microstructure with temperature, for specimens deformed in the [1120] and [0110]
orientations, respectively. In contrast to the results for specimens deformed in the
[1 1 2 1.85] and [0001] orientations, the operative deformation mode varies with
temperature. For deformation along [1120] at RT, the formation of {1012} twins is
predominant, and a small number of wavy deformation bands locally coexist. Significant
“ridge” formation is confirmed when observed on the (1100) side surface by the
formation of wavy deformation bands, as indicated by red arrows; however, the side
surface remains straight, even after the formation of deformation bands when observed on
(0001) side surface. This indicates that the macroscopic shear direction of the wavy
deformation bands is parallel to [0001]. This is the origin of the much stronger contrast of
the wavy deformation bands on the (0001) side surface in Fig. 3(c). A similar deformation
microstructure is observed at 100 °C. However, at and above 200 °C, the formation of
{1012} twins drastically decreases; instead, fine slip traces are introduced in addition to
the wavy deformation bands. A two-face trace analysis demonstrates that the slip trace is
derived from {1010} prismatic slip. The feature of the contrast of the slip traces; they are
faint on (0001) but strong on (1100) side surface, suggesting that the operative slip
system is {1010}<1210>. This was further confirmed by a TEM g·b dislocation contrast
analysis. Note that the slip traces of the {1010} prismatic slip become wavy when
observed on the (1100) side surface at high temperatures, although they are relatively
straight at 200 °C. This indicates that cross-slip events frequently occur in the {1010}
prismatic slip at and above 300 °C with the help of thermal activation.
13
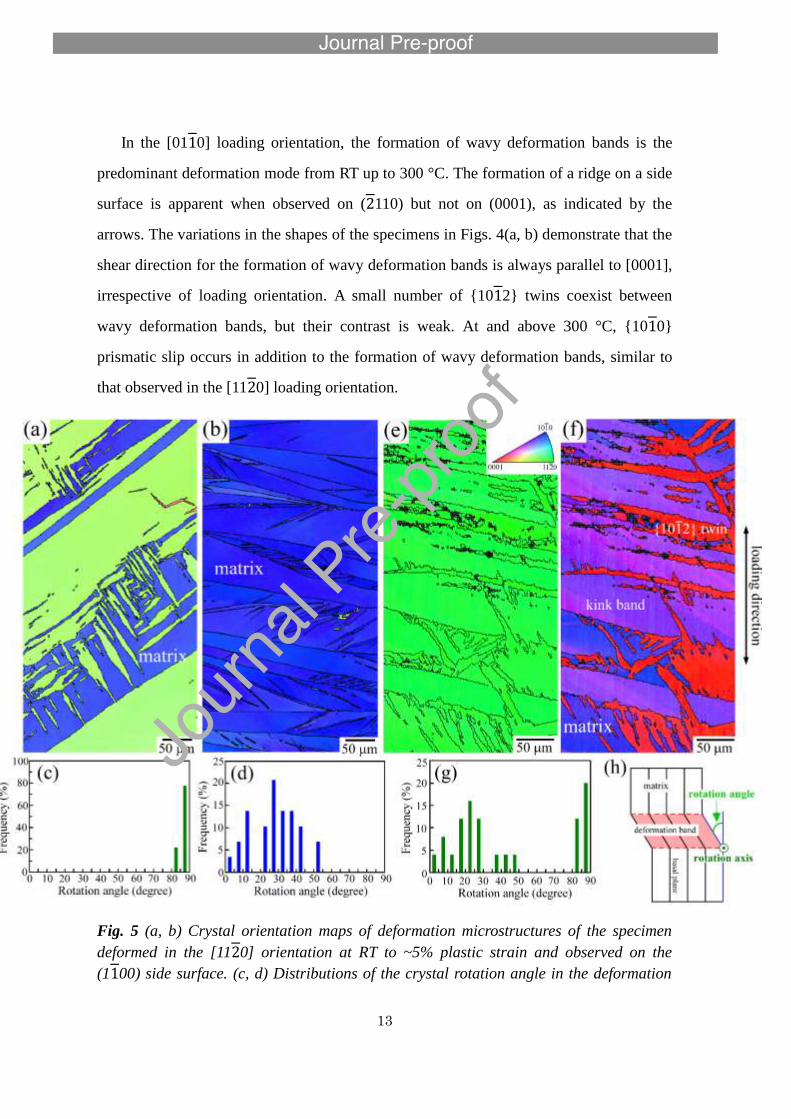
In the [0110] loading orientation, the formation of wavy deformation bands is the
predominant deformation mode from RT up to 300 °C. The formation of a ridge on a side
surface is apparent when observed on (2110) but not on (0001), as indicated by the
arrows. The variations in the shapes of the specimens in Figs. 4(a, b) demonstrate that the
shear direction for the formation of wavy deformation bands is always parallel to [0001],
irrespective of loading orientation. A small number of {1012} twins coexist between
wavy deformation bands, but their contrast is weak. At and above 300 °C, {1010}
prismatic slip occurs in addition to the formation of wavy deformation bands, similar to
that observed in the [1120] loading orientation.
Fig. 5 (a, b) Crystal orientation maps of deformation microstructures of the specimen
deformed in the [1120] orientation at RT to ~5% plastic strain and observed on the
(1100) side surface. (c, d) Distributions of the crystal rotation angle in the deformation

14
bands with respect to the matrix (undeformed region), measured in the regions around
Fig. 5(a) and (b), respectively. (e) Crystal orientation map of the specimen deformed in
the [0110] orientation at RT to ~5% plastic strain and observed on the (2110) side
surface. (f) The same region in Fig. 5(e), but the colors in the map indicate the crystal
orientation along the loading axis, in order to distinguish the orientation colors of the
deformation twins and deformation kink bands. (g) Distribution of the crystal rotation
angle in the region around Fig. 5(e). The colors of the bar graph of Figs. 5(c), (d), and
(g) indicate the crystal rotation axis of the measured bands: blue: near <2110> and
green: near <1100> with a deviation-angle tolerance of 10°. (h) Schematic showing the
definitions of the crystal rotation angle and crystal rotation axis in the deformation band.
To clarify the nature of the wavy deformation bands, SEM-EBSD analysis was
conducted for the specimen deformed in the [1120] orientation at RT. Figs. 5(a, b) show
the typical crystal orientation maps for (a) {1012} twins and (b) wavy deformation bands.
Corresponding to the crystal orientation maps, Figs. 5(c, d) show the distributions of the
crystal rotation angle with respect to the matrix (undeformed region) in the deformation
bands. This rotation angle is defined in Fig. 5(h). Additionally, the crystal rotation axis in
the measured band is indicated by color in the bar graphs; blue means near <2110>, and
green means near <1100> with a deviation-angle tolerance of 10°. In the region shown in
Fig. 5(a), the crystal rotation angle is in the range of 80°–90° in all deformation bands,
and the crystal rotation axis is along < 2 110>. This is in agreement with the
crystallographic features of {0112} twins; the ideal crystal rotation angle is 86° along
<2110> [36]. In contrast, the crystal rotation angle in the region shown in Fig. 5(b) has a
wide distribution ranging from ~5° to ~55°, although the crystal rotation axis is almost
completely parallel to <1100>. This is different from that observed for deformation twins,
in which the crystal rotation angle is fixed because they possess a definite crystal
orientation relationship with respect to the matrix. This indicates that the formed wavy
deformation bands are not twins but deformation kink bands, as observed in the LPSO
phase [42]. The change in the crystal rotation angle is induced by the variation in the
number of basal dislocations that form the kink band boundary [21,42-46].
Fig. 5(e) shows the crystal orientation map for the specimen deformed in the [0110]
orientation at RT. There is almost no change in color of the crystal orientation,
15
demonstrating that crystal rotation in the deformation band occurs along a rotation axis
parallel to the observed [2110] surface normal. Fig. 5(f) shows the crystal orientation
map for the same region, but the colors in the map indicate a crystal orientation along the
loading axis. Fig. 5(g) shows the corresponding distribution of the crystal rotation angle
in the band. The distribution of the rotation angle shows two obvious peaks—a broad
peak around 25° and a sharp peak around 85°. The former and latter correspond to a
deformation kink band and {0112} twin, respectively. In Fig. 5(f), the kink bands and
{0112} twins are shown purple and red, respectively. Kink bands and {0112} twins
collectively form during deformation in the [0110] orientation. This may be related to the
appearance of weak work hardening during deformation, as shown in Fig. 2(b). In Fig.
5(f), there is almost no difference in the red color of the {0112} twin at all locations, but
the purple color of the deformation kink band changes with location. This is evidence that
the crystal rotation angle is not fixed in the deformation kink bands.
The rotation axes of the kink bands are different in Figs. 5(b) and (e): <0110> and
< 2 110>, respectively. This implies that the rotation axis varies such that it is
perpendicular to the loading orientation on the [0001] zone axis. This arbitrariness of the
crystal rotation angle and axis in the deformation kink bands demonstrates that the
boundary of a kink band comprises the alignment of basal dislocations along a direction
perpendicular to their slip plane, as observed in the LPSO phase and illustrated in
Supplementary Fig. S2. The change in the crystal rotation axis is induced by the variation
in the type of Burgers vector of the basal dislocations that form the kink band [21,42-46].
The observed unique features of the deformation bands—the change in crystal rotation
axis in the band with loading orientation and the wavy morphology of the band observed
on (0001) side surface—are in good agreement with previous reports on deformation kink
bands in a Zn single crystal [44] and the LPSO phase [42,45].
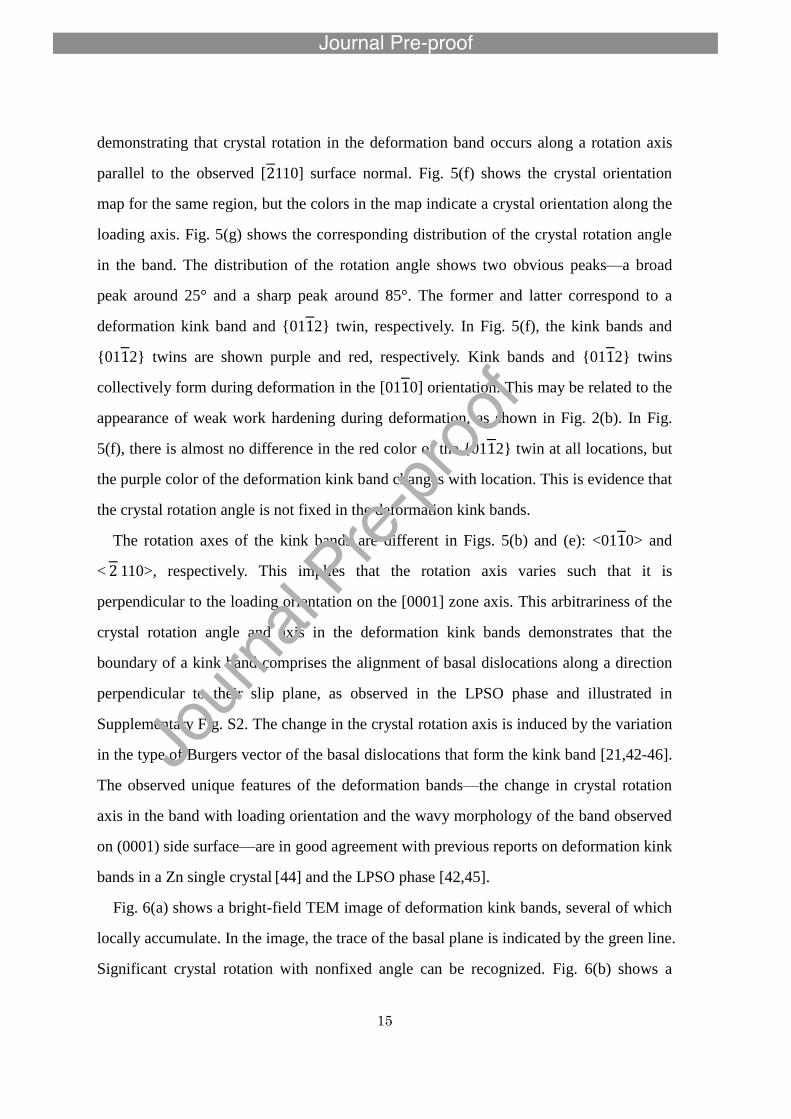
Fig. 6(a) shows a bright-field TEM image of deformation kink bands, several of which
locally accumulate. In the image, the trace of the basal plane is indicated by the green line.
Significant crystal rotation with nonfixed angle can be recognized. Fig. 6(b) shows a

16
higher-magnification image of the kink bands, and Figs. 6(c–f) show selected-area
electron diffraction (SAED) patterns at points A–D in Fig. 6(b). The SAED pattern at
point B almost corresponds to a <1100> net SAED pattern. From the SAED patterns at
points A, C, and D, the crystal is largely rotated almost along the [1100] observation
direction by the formation of kink bands, as measured in the SEM-EBSD analysis [Fig.
5(b)]. The directions of the c axis measured from SAED patterns are indicated in Fig.
6(b) for each kink band. Here, the rotation angle almost directly corresponds to the
bending angle of the LPSO nanoplates. This demonstrates that the change in the crystal
orientation does not occur by the shuffling of atomic positions, which occurs during the
formation of a deformation twin in the hcp materials. Instead, this change occurs by the
direct shear movement of atoms. In addition to the high-angle kink-band boundaries,
many low-angle boundaries with a rotation angle of less than 15° coexist, as indicated by
the red arrows in Fig. 6(a). Note that the morphology of the kink bands is very similar to
that of the deformed LPSO phase [18–20].
17
Fig. 6 (a) Bright-field TEM image of the deformation kink bands introduced in the
specimen deformed in the [1120] orientation at RT to ~5% plastic strain. The observation
direction is nearly parallel to [1100] in the matrix. (b) Higher-magnification image of the
kink bands. (c–f) SAED patterns taken at points A–D indicated in Fig. 6(b).
4. Discussion
4.1 Strengthening mechanism due to the LPSO nanoplates
We observed a drastic increase in the yield stress even with the coaddition of minute
amounts of Zn and Y. The formation of LPSO nanoplates is strongly suggested to be the
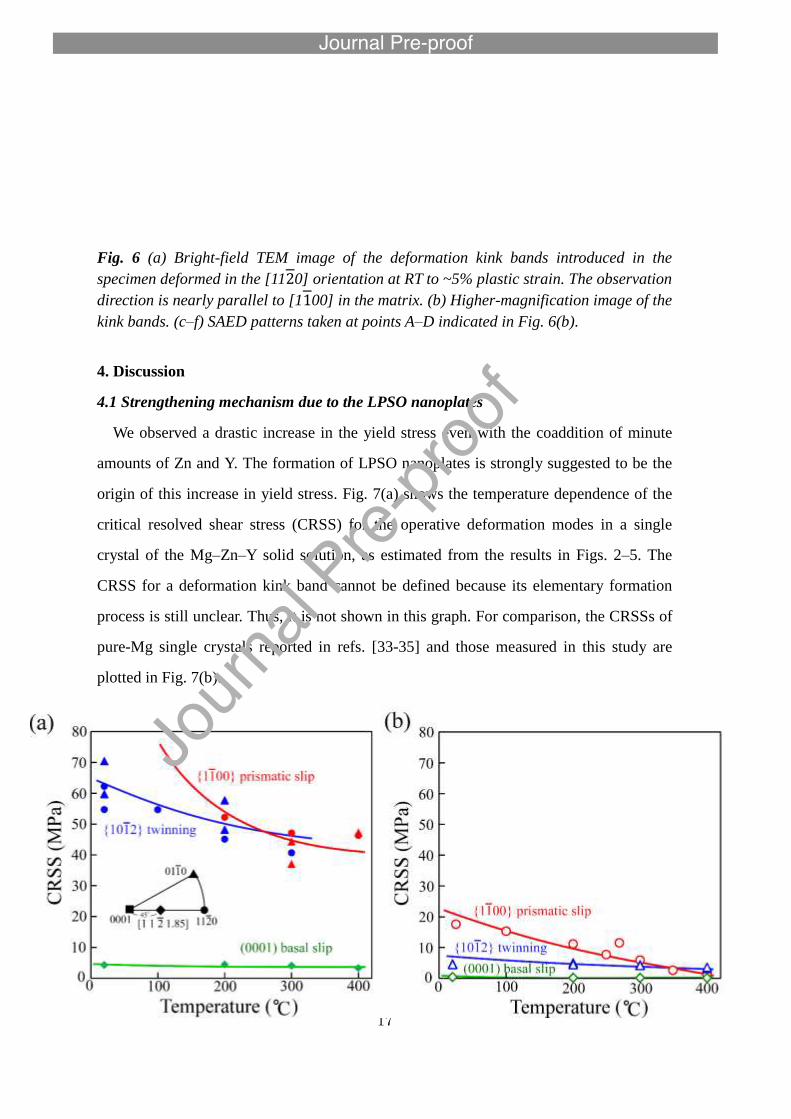
origin of this increase in yield stress. Fig. 7(a) shows the temperature dependence of the
critical resolved shear stress (CRSS) for the operative deformation modes in a single
crystal of the Mg–Zn–Y solid solution, as estimated from the results in Figs. 2–5. The
CRSS for a deformation kink band cannot be defined because its elementary formation
process is still unclear. Thus, it is not shown in this graph. For comparison, the CRSSs of
pure-Mg single crystals reported in refs. [33-35] and those measured in this study are
plotted in Fig. 7(b).

18
Fig. 7 (a) Temperature dependencies of the CRSS estimated in the as-grown
Mg99.2Zn0.2Y0.6 single crystal investigated in this study, and (b) those in pure-Mg single
crystals reported in refs. [33-35] and measured in this study.
These results demonstrate that the existence of LPSO nanoplates drastically increases the
CRSSs for {1012} twins and {1010} prismatic slip since their operation must intersect
with LPSO nanoplates. For the compression of pure Mg in the [0001] orientation, the
operation of several twinning systems such as {1011} twins and {1122}<11 2̅3̅>
pyramidal slip is reported in refs. [34, 37]. However, they were not observed in the Mg–
Zn–Y solid solution, which has a much higher fracture stress in the [0001] loading
orientation. This implies that not only the CRSSs for twinning systems but that for
{1122}<112̅3̅> slip are also drastically increased owing to the intersection with LPSO
nanoplates.
Fig. 8 (a) Variation in the yield stress with heat treatment for deformation in the [1120]
orientation at RT. (b, c) Macroscopic views of the deformation microstructure in
specimens (b) annealed at 520 °C for 5 h, and (c) annealed further at 400 °C for 5 h,
prior to compression tests. The side surface planes in observation are parallel to (0001).

19
To clarify the effects of the LPSO nanoplates more quantitatively, Fig. 8(a) shows the
variation in the yield stress in the [1120] orientation at RT with heat treatment. The yield
stress decreases with annealing at 520 °C owing to the reduction in the density of LPSO
nanoplates, as shown in Fig. 1(d). However, the high yield stress is almost recovered with
further annealing at 400 °C, which is derived from the reprecipitation of LPSO
nanoplates, as shown in Fig. 1(e). Fig. 8(b, c) show the corresponding deformation
microstructures of
the specimens. As expected, the formation of deformation twins is observed for the
specimen annealed at 520 °C owing to the reduction in the number of LPSO nanoplates.
While kink-band formation is again observed for the specimen annealed at 400 °C and
accompanied by an increase in the yield stress. These results obviously demonstrate that
the LPSO nanoplates prohibit the formation of {1012} deformation twins, and the
formation of deformation kink bands is induced as the alternative accommodation process
of plastic deformation.
The CRSS for basal slip is also increased relative to that for pure Mg. However, it is
comparable or moderately smaller than that measured for a Mg–Y binary single crystal
[28], implying that the increase in the CRSS of the single crystal of the Mg–Zn–Y solid
solution is almost induced by solid-solution hardening by Y/Zn atoms, and the additional
effect of the development of LPSO nanoplates is small since they exist parallel to the
(0001) slip plane.

20
Fig. 9 Comparison of yield stresses of the as-grown Mg99.2Zn0.2Y0.6 single crystal and
LPSO phase. The yield stresses of the Mg99.2Zn0.2Y0.6 single crystal are indicated by the
red points. In addition, the DS 18R-LPSO phase previously reported in ref. [20] are
indicated by the gray points.
4.2 Comparison of the yield stress to that of the bulk LPSO phase alloy
Fig. 9 shows a comparison of the yield stresses of a single crystal of the Mg–Zn–Y
solid solution and the bulk LPSO-single-phase DS crystal [20] with a composition of
Mg85Zn6Y9. In both crystals, the formation of kink bands is observed when the
macroscopic operation of basal slip is hindered. More precisely, kink bands are observed
for the compressive deformation of the Mg–Zn–Y single crystal in the [0110] and [1120]
orientations, and of the LPSO-phase DS crystal loaded parallel to the growth direction (0°
direction), where the basal plane is parallel to the loading orientation. Surprisingly, the
yield stresses show similar high values for both alloys when kink-band formation occurs.
This obviously demonstrates that even in a dilute Mg–Zn–Y alloy that does not contain
the “perfect” LPSO phase, the precipitation of LPSO nanoplates effectively induces the
formation of deformation kink bands by preventing the operation of other deformation
modes except basal slip.
The yield stress of the LPSO phase in the 45° orientation—in which basal slip is
operative—is moderately higher than that of Mg99.2Zn0.2Y0.6 in the [1 1 2 1.85]
orientation. This is derived from the polycrystalline microstructure of the DS
LPSO-phase alloy. Indeed, Inoue et al. estimated the CRSS for basal slip in an
21
LPSO-phase single crystal to be ~7 MPa using a micropillar compression test [47]. This
is comparable to that of Mg99.2Zn0.2Y0.6 in this study [Fig. 7(a)].
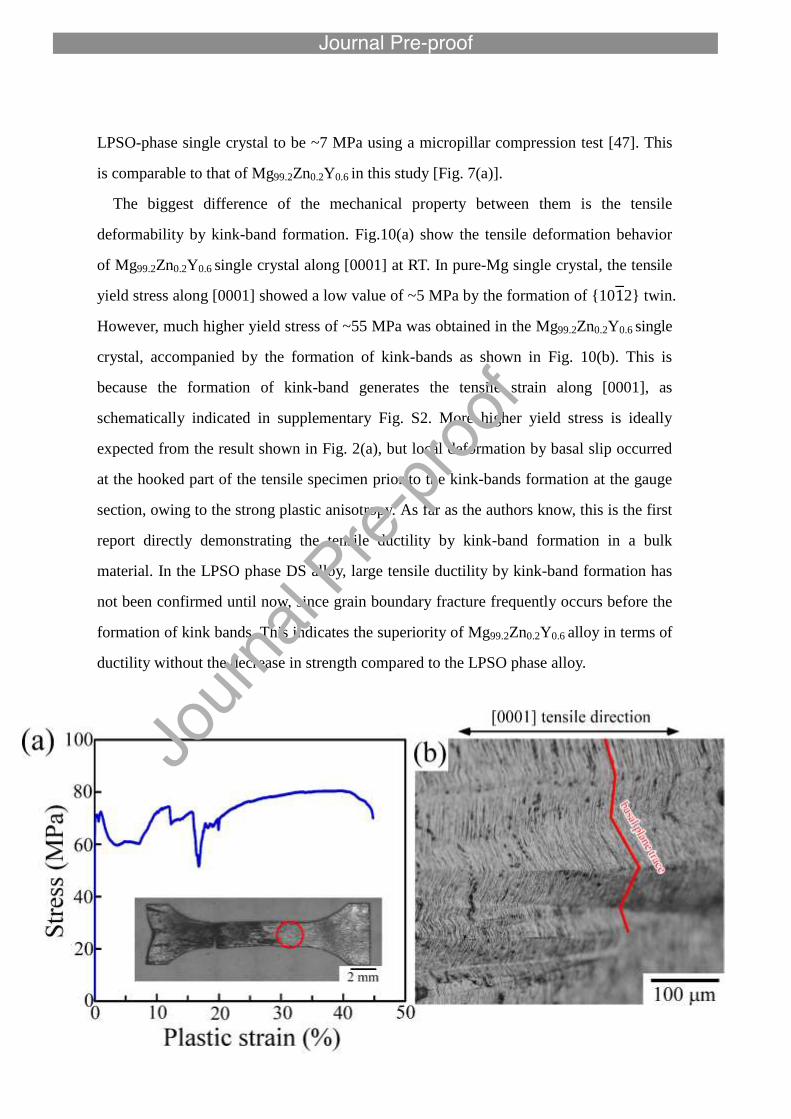
The biggest difference of the mechanical property between them is the tensile
deformability by kink-band formation. Fig.10(a) show the tensile deformation behavior
of Mg99.2Zn0.2Y0.6 single crystal along [0001] at RT. In pure-Mg single crystal, the tensile
yield stress along [0001] showed a low value of ~5 MPa by the formation of {1012} twin.
However, much higher yield stress of ~55 MPa was obtained in the Mg99.2Zn0.2Y0.6 single
crystal, accompanied by the formation of kink-bands as shown in Fig. 10(b). This is
because the formation of kink-band generates the tensile strain along [0001], as
schematically indicated in supplementary Fig. S2. More higher yield stress is ideally
expected from the result shown in Fig. 2(a), but local deformation by basal slip occurred
at the hooked part of the tensile specimen prior to the kink-bands formation at the gauge
section, owing to the strong plastic anisotropy. As far as the authors know, this is the first
report directly demonstrating the tensile ductility by kink-band formation in a bulk
material. In the LPSO phase DS alloy, large tensile ductility by kink-band formation has
not been confirmed until now, since grain boundary fracture frequently occurs before the
formation of kink bands. This indicates the superiority of Mg99.2Zn0.2Y0.6 alloy in terms of
ductility without the decrease in strength compared to the LPSO phase alloy.

22
Fig. 10 (a) Stress-strain curve in the tensile test of Mg99.2Zn0.2Y0.6 single crystal along
[0001] at RT. The entire view of the deformed specimen is inserted in the figure. (b)
Higher magnification image of the deformation microstructure showing the formation of
many deformation kink bands, observed at the part indicated by the red circle in Fig.
10(a). The side surface planes in observation is parallel to (1010).
4.3 Possibility of the development of novel high-strength Mg alloys using LPSO
nanoplates, beyond the “stacking-fault” strengthening
Until now, it was believed that the excellent mechanical properties of a Mg/LPSO
two-phase alloy are induced by the LPSO phase as a strengthening phase. However, the
present results indicate that changes in the mechanical properties of the Mg matrix phase
may also strongly contribute to these excellent mechanical properties when the Mg
matrix phase contains LPSO nanoplates. The results suggest that the strengthening
mechanism of the Mg/LPSO two-phase alloy must be reconsidered depending on the
microstructure.
Furthermore, the obtained results strongly suggest that there is a significant possibility
that an ultrahigh-strength lightweight alloy based on a dilute Mg–Zn–Y
alloy—comparable or superior than those of the Mg/LPSO two-phase alloys—is expected
to be developed via the appropriate control of LPSO nanoplate microstructures. Since Y
is an expensive rare metal, the requirement of a large amount of Y is a major drawback
for broadening the practical application of Mg/LPSO two-phase alloys. The present
findings enable the development of novel affordable high-strength Mg alloys.
Several studies report the strengthening of metallic materials by the introduction of
large numbers of stacking faults and/or thin planar faults in Mg [48,49], Al [50], Ti [51],
Co [52], CoCr [53], etc. In this study, this stacking-fault strengthening is more
significantly enhanced using the unique features of the Mg–Zn–Y alloy, as the coadded Y
and Zn atoms preferentially segregate at stacking faults [39-41] to form LPSO nanoplates.

23
We call this “mille-feuille microstructural control,” in which a soft (Mg layer) and hard
(Zn/Y segregated layer) layers are alternately stacked [54, 55]. The results demonstrate
that mille-feuille microstructural control induces the formation of deformation kink bands,
imparting greater ductility and strength.
The present results only focus on the mechanical properties of a single crystal without
macroscopic microstructural control. Nevertheless, the yield stress was surprisingly
increased compared to that of pure Mg. It is known that the yield stress of the
LPSO-phase alloy is drastically increased by grain refinement due to the increase in the
formation stress of kink bands [27]. Thus, microstructural control of the dilute Mg–Zn–Y
alloy has significant potential to enable an additional drastic increase in strength. This has
been carried out by our group; the results will be published elsewhere.
5. Conclusion
(1) In the Mg99.2Zn0.2Y0.6 single crystal grown by Bridgeman method, significant
amount of stacking-fault-like platelet defects, called LPSO nanoplate, are formed parallel
to the basal plane.
(2) The yield stress of Mg99.2Zn0.2Y0.6 anomalously increases compared to that of pure
Mg in many loading orientations where basal slip is not operative, owing to the presence
of LPSO nanoplates. Surprisingly, the yield stress shows nearly the same value as that of
the LPSO-single-phase alloy.
(3) The formation of deformation twins is strongly prohibited in the Mg99.2Zn0.2Y0.6
single crystal by the LPSO nanoplates. Instead, the formation of deformation kink bands
carries the strain, resulting in a high yield stress accompanied by large ductility.
(4) “LPSO nanoplate strengthening” has a high potential for developing new
ultrahigh-strength Mg alloys with much lower Zn and Y contents.
Declaration of competing interest
The authors declare that they have no known competing financial interests or personal

24
relationships that could have appeared to influence the work reported in this paper.
Acknowledgements
This work was supported by the Japan Society for the Promotion of Science (JSPS)
KAKENHI for Scientific Research in Innovative Areas: “MFS Materials Science” (grant
numbers JP18H05478, JP18H05476, and JP18H05475) and partly supported by JSPS
KAKENHI JP18H05254.
References
[1] F. Pan, M. Yang, X. Chen, A Review on casting magnesium alloys modification of
commercial alloys and development of new alloys, J. Mater. Sci. Tec. 32 (2016)
1211-1221.
[2] Y. Kawamura, K. Hayashi, A. Inoue, T. Masumoto, Rapidly solidified powder
metallurgy Mg97Zn1Y2 alloys with excellent tensile yield strength above 600 MPa,
Mater. Trans. 42 (2001) 1172-1176.
[3] K. Hagihara, A. Kinoshita, Y. Sugino, M. Yamasaki, Y. Kawamura, H. Y. Yasuda,
Y. Umakoshi, Effect of long-period stacking ordered phase on mechanical
properties of Mg97Zn1Y2 extruded alloy, Acta Mater. 58 (2010) 6282-6293.
[4] K. Hagihara, A. Kinoshita, Y. Sugino, M. Yamasaki, Y. Kawamura, H. Y. Yasuda,
Y. Umakoshi, Plastic deformation behavior of Mg89Zn4Y7 extruded alloy
composed of long-period stacking ordered phase, Intermetallics 18 (2010)
1079-1085.
[5] M. Yamasaki, K. Hashimoto, K. Hagihara, Y. Kawamura, Effect of multimodal
microstructure evolution on mechanical properties of Mg–Zn–Y extruded alloy,
Acta Mater. 59 (2011) 3646-3658.
[6] E. Oñorbe, G. Garcés, P. Pérez, P. Adeva, Effect of the LPSO volume fraction on
the microstructure and mechanical properties of Mg–Y2X–ZnX alloys, J. Mater. Sci.
47 (2012) 1085-1093.
25
[7] J. Wang, P. Song, X. Zhou, X. Huang, F. Pan, Influence of the morphology of
long-period stacking ordered phase on the mechanical properties of as-extruded
Mg–5Zn–5Y–0.6Zr magnesium alloy, Mater. Sci. Eng. A 556 (2012) 68-75.
[8] K. Hagihara, A. Kinoshita, Y. Fukusumi, M. Yamasaki, Y. Kawamura,
High-temperature compressive deformation behavior of Mg97Zn1Y2 extruded
alloy containing a long-period stacking ordered (LPSO) phase, Mater. Sci. Eng. A
560 (2013) 71-79.
[9] E. Oñorbe, G. Garcés, F. Dobes, P. Pérez, P. Adeva, High-temperature mechanical
behavior of extruded Mg-Y-Zn alloy containing LPSO phases, Metall. Mater. Trans.
A 44 (2013) 2869-2883.
[10] L.B. Tong, X. H. Li, H. J. Zhang, Effect of long period stacking ordered phase on
the microstructure, texture and mechanical properties of extruded Mg–Y–Zn alloy,
Mater. Sci. Eng. A 563 (2013) 177-183.
[11] G. Garces, P. Perez, S. Cabeza, H. K. Lin, S. Kim, W. Gan, P. Adeva, Reverse
tension/compression asymmetry of a Mg-Y-Zn alloys containing LPSO phases,
Mater. Sci. Eng. A, 647 (2015) 287-293.
[12] J. K. Kim, S. Sandlöbes, D. Raabe, On the room temperature deformation
mechanisms of a Mg-Y-Zn alloy with long-period-stacking-ordered structures, Acta
Mater. 82 (2015) 414-423.
[13] H. Liu, J. Bai, K. Yan, J. Yan, A. Ma, J. Jiang, Comparative studies on evolution
behaviors of 14H LPSO precipitates in as-cast and as-extruded Mg-Y-Zn alloys
during annealing at 773 K, Mater. Design 93 (2016) 9-18.
[14] R. Chen, S. Sandlöbes, X. Zeng, D. Li, S. Korte-Kerzel, D. Raabe, Room
temperature deformation of LPSO structures by non-basal slip, Mater. Sci. Eng. A,
682 (2017) 354-358.
[15] G. Garcés, K. Máthis, J. Medina, K. Horváth, D. Drozdenko, E. Oñorbe, P. Dobroň,
P. Pérez, M. Klaus, P. Adeva, Combination of in-situ diffraction experiments and
acoustic emission testing to understand the compression behavior of Mg-Y-Zn
26
alloys containing LPSO phase under different loading conditions, Inter. Jour. Plast.
106 (2018) 107-128.
[16] D. Egusa, E. Abe, The structure of long period stacking/order Mg–Zn–RE phases
with extended non-stoichiometry ranges, Acta Mater. 60 (2012) 166-178.
[17] E. Abe, A. Ono, T. Itoi, M. Yamasaki, Y. Kawamura, Polytypes of long-period
stacking structures synchronized with chemical order in a dilute Mg–Zn–Y alloy,
Philo. Mag. Lett. 91 (2011) 690-696.
[18] K. Hagihara, N. Yokotani, Y. Umakoshi, Plastic deformation behavior of Mg12YZn
with 18R long-period stacking ordered structure, Intermetallics 18 (2010) 267-276.
[19] K. Hagihara, Y. Sugino, Y. Fukusumi, Y. Umakoshi, T. Nakano, Plastic
deformation behavior of Mg12ZnY LPSO-phase with 14H-typed structure, Mater.
Trans. 52 (2011) 1096-1103.
[20] K. Hagihara, T. Okamoto, H. Izuno, M. Yamasaki, M. Matsushita, T. Nakano, Y.
Kawamura, Plastic deformation behavior of 10H-type synchronized LPSO phase in
a Mg-Zn-Y system, Acta Mater. 109 (2016) 90-102.
[21] J.B Hess, C.S. Barrett, Structure and nature of kink bands in zinc, Trans. Am. Inst.
Min. Met. Eng. 185 (1949) 599-606.
[22] M.W. Barsoum, T. El-Raghy, Room temperature ductile carbides, Metall. Mater.
Trans. A 30A (1999) 363-369.
[23] M.W. Barsoum, T. Zhen, A. Zhou, S. Basu, S.R. Kalidindi, Microscale modeling of
kinking nonlinear elastic solids, Phys. Rev. B 71 (2005) 134101.
[24] T. Zhen, M.W. Barsoum, S.R. Kalidindi, Effects of temperature, strain rate and
grain size on the compressive properties of Ti3SiC2, Acta Mater. 53 (2005)
4163-4171.
[25] A.G. Zhou, M.W. Barsoum, Kinking nonlinear elastic deformation of Ti3AlC2,
Ti2AlC, Ti3Al(C0.5,N0.5)2 and Ti2Al(C0.5,N0.5), J. Alloys Comp. 498 (2010) 62-70.
[26] K. Hagihara, Z. Li, M. Yamasaki, Y. Kawamura, T. Nakano, Strengthening
mechanisms acting in extruded Mg-based long-period stacking ordered
27
(LPSO)-phase alloys, Acta Mater. 15 (2019) 226-239.
[27] K. Hagihara, M. Yamasaki, Y. Kawamura, T. Nakano, Strengthening of Mg-based
long-period stacking ordered (LPSO) phase with deformation kink bands, Mater.
Sci. Eng. A, 763 (2019) 138163.
[28] S. Miura, S. Imagawa, T. Toyoda, K. Ohkubo, T. Mohri, Effect of rare-earth
elements Y and Dy on the deformation behavior of Mg alloy single crystals, Mater.
Trans. 49 (2008) 952-956.
[29] H. Rikihisa, T. Mori, M. Tsushida, H. Kitahara, S. Ando, Influence of yttrium
addition on plastic deformation of magnesium, Mater. Trans. 58 (2017) 1656-1663.
[30] A. Akhtar, E. Teghtsoonian, Solid solution strengthening of magnesium single
crystals-I alloying behaviour in basal slip, Acta Metall. 17 (1969) 1339-1349.
[31] A. Akhtar, E. Teghtsoonian, Solid solution strengthening of magnesium single
crystals-II the effect of solute on the ease of prismatic slip, Acta Metall. 17 (1969)
1351-1356.
[32] H. Yoshinaga, R. Horiuchi, Deformation mechanisms in magnesium single crystals
compressed in the direction parallel to hexagonal axis, Trans JIM. 4, (1963) 1-8.
[33] A. Chapuis, J. H. Driver, Temperature dependency of slip and twinning in plane
strain compressed magnesium single crystals, Acta Mater. 59, (2011) 1986-1994.
[34] H. Yoshinaga, R. Horiuchi, On the nonbasal slip in magnesium crystals, Trans JIM.
5, (1964) 14-21.
[35] B. C. Wonsiewicz, W. A. Backofen, Plasticity of magnesium crystals, Trans. Metall.
Soc. AIME, 239, (1967) 1422-1431.
[36] N. Stanford, Observation of {1121} twinning in a Mg-based alloy, Philo. Mag. Lett.
88 (2008) 379-386.
[37] T. Obara, H. Yoshinaga, S. Morozumi, {1122}<1̅1̅23> slip system in magnesium,
Acta Metall. 21 (1973) 845-853.
[38] M. H. Yoo, Slip, twinning, and fracture in hexagonal close-packed metals, Metall.
Trans. A, 12 (1981) 409-418.

28
[39] J. Lee, K. Sato, T. J. Konno, K.Hiraga, Stabilization of stacking faults and a long
period stacking phase dispersed in -Mg crystalline grains of Mg-0.7 at%Zn-1.4
at%Y alloy, Mater. Trans. 50 (2009) 222-225.
[40] Y. M. Zhu, A. J. Morton, M. Weyland, J. F. Nie, Characterization of planar features
in Mg–Y–Zn alloys, Acta Mater. 58 (2010) 464–475.
[41] J.-K. Kim, W.-S. Ko, S. Sandlobes, M. Heidelmann, B. Grabowski, D. Raabe, The
role of metastable LPSO building block clusters in phase transformations of an
Mg-Y-Zn alloy, Acta Mater. 112 (2016) 171-183.
[42] K. Hagihara, M. Yamasaki, M. Honnami, H. Izuno, M. Tane, T. Nakano, Y.
Kawamura, Crystallographic nature of deformation bands shown in Zn and
Mg-based long period stacking ordered (LPSO) phase, Philo. Mag. 95 (2015)
132-157.
[43] M. Yamasaki, K. Hagihara, S. Inoue, J. P. Hadorn, Y. Kawamura, Crystallographic
classification of kink bands in an extruded Mg–Zn–Y alloy using intragranular
misorientation axis analysis, Acta Mater. 61 (2013) 2065-2076.
[44] K. Hagihara, T. Mayama, M. Honnami, M. Yamasaki, H. Izuno, T. Okamoto, T.
Ohashi, T. Nakano, Y. Kawamura, Orientation dependence of the deformation kink
band formation behavior in Zn single crystals, Inter. Jour. Plast. 77 (2016) 174-191.
[45] K. Hagihara, T. Okamoto, M. Yamasaki, Y. Kawamura, T. Nakano, Electron
backscatter diffraction pattern analysis of the deformation band formed in the
Mg-based long-period stacking ordered phase, Scrpta Mater. 117 (2016) 32-36.
[46] T. Matsumoto, M. Yamasaki, K. Hagihara, Y. Kawamura, Configuration of
dislocations in low-angle kink boundaries formed in a single crystalline long-period
stacking ordered Mg-Zn-Y alloy, Acta Mater. 151 (2018) 112-124.
[47] A. Inoue, K. Kishida, H. Inui, K. Hagihara, Compression of micro-pillars of a long
period stacking ordered phase in the Mg-Zn-Y system, Mater. Res. Soc. Symp. Proc.
1516, (2013) 151-156.
[48] W. W. Jian, G. M. Cheng, W. Z. Xu, H. Yuan, M. H. Tsai, Q. D. Wang, C. C. Koch,
29
Y. T. Zhu, S. N. Mathaudhu, Ultrastrong Mg alloy via nano-spaced stacking faults,
Mater. Res. Lett. 1 (2013) 61-66.
[49] H. Pan, Q. Huang, G. Qin, H. Fu, M. Xu, Y. Ren, J. She, B. Song, B. Li,
Activations of stacking faults in the calcium-containing magnesium alloys under
compression, J. Alloys Comp. 692 (2017) 898-902.
[50] H. Wang, H. Geng, D. Zhou, K. Niitsu, O. Muransky, D. Zhang, Multiple
strengthening mechanisms in high strength ultrafine-grained Al–Mg alloys, Mater.
Sci. Eng. A 771 (2020) 138613
[51] M. Ana, Q. Denga, Y. Lia, H. Song, M. Su, J. Cai, Molecular dynamics study of
tension-compression asymmetry of nanocrystal -Ti with stacking fault, Mater.
Design 127 (2017) 204–214.
[52] R. Su, D. Neffati, J. Cho, Q. Li, J. Ding, H. Wang, Y. Kulkarni, X. Zhang, Phase
transformation induced plasticity in high-strength hexagonal close packed Co with
stacking faults, Scripta Mater. 173 (2019) 32–36.
[53] K. Hagihara, T. Nakano, K. Sasaki, Anomalous strengthening behavior of Co–Cr–
Mo alloy single crystals for biomedical applications, Scripta Mater. 123 (2016)
149-153.
[54] K. Hagihara, K. Hayakawa, K. Miyoshi, Inducement of kink-band formation in
directionally solidified Mg/Mg17Al12 eutectic alloy - Inspired by the deformation
behavior of the long-period stacking ordered (LPSO) phase, Mater. Sci. Eng. A 798
(2020) 140087.
[55] http://www.mfs-materials.jp/en/
Additional information
Supplementary Information accompanies this paper.
(4 figures and 2 tables are included.)

30
Figure captions
Fig. 1 (a) SEM image of the as-grown DS alloy. (b) Bright-field TEM image showing the
microstructure in the as-grown alloy. (c) Corresponding HAADF-STEM image. The inset
shows a higher-magnification image. Zn/Y atoms are segregated along four atomic layers
where an fcc-type stacking fault exists. (d, e) TEM images showing the variation in
microstructure due to heat treatment: (d) specimen in Fig.1(b) was annealed at 520 °C for
5 h followed by water quenching, and (e) specimen in Fig.1(d) was annealed further at
400 °C for 5 h. (f) Variation in the number of LPSO nanoplates per 1 m and their
average thickness according to heat treatment, measured along [0001] in the TEM. The
observation direction is parallel to [1120] in all the Figs. 1(a–e).
Fig. 2 (a) Temperature dependence of the yield stress of the as-grown Mg99.2Zn0.2Y0.6
single crystal in four loading orientations. The yield stress of the pure-Mg single crystals
reported in ref. [32] and that measured in this study are also plotted in gray for
comparison. (b, c) Typical stress–strain curves deformed at (b) RT and (c) 300 °C in four
different loading orientations.
Fig. 3 OM images showing the deformation traces in specimens deformed at RT.
Specimens were deformed to ~5% plastic strain in the loading orientations of (a, b)
[1 1 2 1.85], (c, d) [1120], (e, f) [0110], and (g, h) [0001]. The Miller indices of the side
surface planes in observation are indicated at the top-right corner in the images.
Fig. 4 Macroscopic views showing the variations in the deformation microstructure with
temperature. Specimens were deformed in the (a) [1120] and (b) [0110] loading
orientations to ~5% plastic strain at the temperatures indicated. The Miller indices of the
side surface planes in observation are indicated in the figure.
Fig. 5 (a, b) Crystal orientation maps of deformation microstructures of the specimen

31
deformed in the [1120] orientation at RT to ~5% plastic strain and observed on the (1100)
side surface. (c, d) Distributions of the crystal rotation angle in the deformation bands
with respect to the matrix (undeformed region), measured in the regions around Fig. 5(a)
and (b), respectively. (e) Crystal orientation map of the specimen deformed in the [0110]
orientation at RT to ~5% plastic strain and observed on the (2110) side surface. (f) The
same region in Fig. 5(e), but the colors in the map indicate the crystal orientation along
the loading axis, in order to distinguish the orientation colors of the deformation twins
and deformation kink bands. (g) Distribution of the crystal rotation angle in the region
around Fig. 5(e). The colors of the bar graph of Figs. 5(c), (d), and (g) indicate the crystal
rotation axis of the measured bands: blue: near <2110> and green: near <1100> with a
deviation-angle tolerance of 10°. (h) Schematic showing the definitions of the crystal
rotation angle and crystal rotation axis in the deformation band.
Fig. 6 (a) Bright-field TEM image of the deformation kink bands introduced in the
specimen deformed in the [1120] orientation at RT to ~5% plastic strain. The observation
direction is nearly parallel to [1100] in the matrix. (b) Higher-magnification image of the
kink bands. (c–f) SAED patterns taken at points A–D indicated in Fig. 6(b).
Fig. 7 (a) Temperature dependencies of the CRSS estimated in the as-grown
Mg99.2Zn0.2Y0.6 single crystal investigated in this study, and (b) those in pure-Mg single
crystals reported in refs. [33-35] and measured in this study.
Fig. 8 (a) Variation in the yield stress with heat treatment for deformation in the [1120]
orientation at RT. (b, c) Macroscopic views of the deformation microstructure in
specimens (b) annealed at 520 °C for 5 h, and (c) annealed further at 400 °C for 5 h, prior
to compression tests. The side surface planes in observation are parallel to (0001).
Fig. 9 Comparison of yield stresses of the as-grown Mg99.2Zn0.2Y0.6 single crystal and
32
LPSO phase. The yield stresses of the Mg99.2Zn0.2Y0.6 single crystal are indicated by the
red points. In addition, the DS 18R-LPSO phase previously reported in ref. [20] are
indicated by the gray points.
Fig. 10 (a) Stress-strain curve in the tensile test of Mg99.2Zn0.2Y0.6 single crystal along
[0001] at RT. The entire view of the deformed specimen is inserted in the figure. (b)
Higher magnification image of the deformation microstructure showing the formation of
many deformation kink bands, observed at the part indicated by the red circle in Fig.
10(a). The side surface planes in observation is parallel to (1010).
Declaration of interests
☒ The authors declare that they have no known competing financial interests or
personal relationships that could have appeared to influence the work reported in this
paper.
☐The authors declare the following financial interests/personal relationships which
may be considered as potential competing interests:

33
Graphic Abstract