surveying the topographic height from srtm data … · surveying the topographic height from srtm...
TRANSCRIPT

SURVEYING THE TOPOGRAPHIC HEIGHT FROM SRTM DATAFOR CANOPY MAPPING IN THE BRAZILIAN PANTANAL
Viviana Aguilar MUÑOZ1,2
Márcio de Morisson VALERIANO1,3
Polyanna da Conceição BISPO1,3
Abstract
An algorithm was developed in Geographical Information Systems (GIS) for the extractionof topographic height from the Digital Elevation Models (DEM) of the Shuttle Radar TopographyMission (SRTM), C and X bands, applied to mapping vegetation canopy in the Pantanal Floodlands.According to previous studies, these bands are sensitive to surface vegetation and thus elevationvalues increase in relation to terrain proportional to the height of the canopy, known as canopyeffect. The proposed algorithm identifies minimum elevations within a search radius, which arelikely to represent bare earth values, to generate a reference surface. The topographic heightresults from the subtraction between the elevations of this surface and of the original DEM. It isexpected that, in this region, the height values be related to the vegetation height. Wheneverpossible, the algorithm results were observed together with optical images and vegetation mapsof RADAMBRASIL project, for the establishment of height slicing levels as related to vegetal groups.The visual examination and statistical analysis have provided three levels of slicing height, whichwould be related to herbaceous, shrub and tree (forest) vegetation communities. Although slicinglevels could be related to general classes of vegetation canopy in this region, field data and, or,fine resolution optical data are required for more detailed mappings. Regardless of the classificationapproach, height estimates from SRTM DEM represent a subsidiary data for the remotecharacterization of the Pantanal Floodlands vegetation, which complements traditionally usedoptical data.
Key-words: Topography height. Canopy effect. Floodlands. Pantanal. SRTM.
1 National Institute of Spatial Research � INPE - Av. dos Astronautas, 1758 - Caixa Postal 515 - 12201-970- São José dos Campos - SP, Brasil - E-mails: {viaguila; valerian; polyanna}@dsr.inpe.br
2 PhD CAPES/CNPq � IEL National - Brazil3 CNPq Researcher
GEOGRAFIA, Rio Claro, v. 38, Número Especial, p. 139-155, ago. 2013.

140 GEOGRAFIASurveying the topographic height from SRTM DATA for canopy
mapping in the brazilian Pantanal
Resumo
Extração da altura topográfica a partir de dados SRTM paramapeamento da vegeação no Pantanal brasileiro
Foi desenvolvido em Sistemas de Informação Geográfica (SIG) um algoritmo para a extraçãoda altura topográfica a partir de Modelos Digitais de Elevação (MDE) derivados da missão SRTM(Shuttle Radar Topography Mission), nas bandas C e X, para ser aplicado ao mapeamento dacobertura vegetal no Pantanal. Trabalhos precursores indicam que estes comprimentos de ondasão sensíveis à superfície da vegetação e assim ocorre um acréscimo no valor da elevação emrelação ao terreno proporcional à altura da cobertura vegetal, conhecido como efeito dossel. Oalgoritmo aqui proposto identifica as cotas mínimas dentro de um raio de busca, possivelmenteassociadas ao terreno nu, para serem utilizadas na geração de uma superfície de referência. Aaltura topográfica resulta da subtração entre o modelo de elevação e a superfície de cotas mínimas.Espera-se que, na área de estudo, seus valores estejam relacionados à altura da vegetação. Osresultados do algoritmo, quando possível, foram observados junto a imagens óticas e a mapasde vegetação do projeto RADAMBRASIL, com o intuito de estabelecer níveis de fatiamento daaltura relacionados a grupos vegetais. A interpretação visual e análises estatísticas permitirampropor o fatiamento em três classes de altura, que estariam relacionadas a formações vegetaisde porte herbáceo, arbustivo e florestal. Embora estes níveis de fatiamento indiquem categoriasgerais de cobertura vegetal no Pantanal, seu mapeamento em detalhe requer dados de campo e,ou, dados óticos de resolução fina. Independente da representação em classes, a altura calculadacom dados SRTM representa um dado subsidiário na caracterização remota da vegetação pantaneira,que complementa os dados óticos tradicionalmente utilizados.
Palavras-chave: Altura topográfica. Efeito dossel. Planície de inundação. Pantanal, SRTM.
INTRODUCTION
In studies of distribution and characterization of plant species through Remote Sensing(RS), data from optical spectrum band are traditionally used, complemented by field data. Inresearch involving radar images of Synthetic Aperture Radar (SAR) the use of full-polarimetricimages have been highlighted as an interesting alternative (MARTINS, 2012). Besides forestryclassification, vegetation height is critical to estimate biomass and thus raising inputs forcarbon cycle modeling. Research has indicated the potential of Polarimetric SAR Interferometrydata (PolInSAR) for vegetation height estimation, but this data has limitations in signal tonoise ratio for this application. A promising alternative for that question is the dual-wavelengthSAR Interferometry (InSAR). The surface of the canopy is obtained from X-band data andthe surface of bare earth from L-band data (BALZTER et al, 2007).
Some authors (i.e. KIRKBY, et al. 1990; FLORINSKY; KURIAKOVA, 1996) investigatedthe inverse relationship, that is, relief was studied as an indicator of the physical elements(soil, climate, hydrology, etc.), since these metrics are related to characteristics of theterrain that influence the availability of resources for plant survival (GUISAN; ZIMMERMANN,2000). Data from interferometric radar mission SRTM (Shuttle Radar Topography Mission,USGS EROS-2009) have been in this sense in Brazil (BISPO et al, 2009; MUÑOZ, 2009;BISPO, 2012). Interferometric data are still useful in estimating the vegetation cover heightand biomass by considering the canopy effect (KELLNDORFER et al., 2004; WALKER et al.,2007; TIGUE et al, 2009).
The canopy effect is an error in elevation due to the ability of partially penetrate inplant canopies of C and X radar waves (like SRTM), which depends on the structural anddielectric characteristics of vegetation components (LE TOAN et al. 1992; BECEK, 2008).Once radar beam penetration is partial, the return signal originates at higher elevations (theterrain altitude) (VALERIANO et al, 2006), which constitutes the canopy effect. This approach
141Muñoz, V. A. / Valeriano, M. de M. / Bispo, P. da C.v. 38, Número Especial ago. 2013
of exploring canopy effect for vegetation height estimation (KELLNDORFER et al., 2004)requires knowledge of the land elevation, to be used as a reference (height zero). Thiscondition is not possible in Brazil because of the very limited availability of good quality anddetailed topographic maps and of InSAR-L data.
An attempt to extract the canopy effect from SRTM data in the Brazilian Pantanalwas firstly conducted by Valeriano and Abdon (2007), whose methodology relied on landsurface perception given by SRTM data itself. Their approach consisted in a point selectionof places that meet metric criteria typical of low lands (low slope, convergent plan curvature,concave profile curvature and local thalwegs), followed by interpolation into the reference(terrain) DEM. Finally, the original DEM is subtracted by the estimated reference DEM. Theresults showed negative values, suggesting some error in the algorithm selection of minimumquotas. As a consequence, the result analyses were limited by post-processing attempts tocorrect this error. A reported alternative to this approach consisted in fitting a statisticaltrend surface to topography. This approach was used for the characterization of the Taquarimegafan active and inactive channels (ZANI et al., 2012), but it results in positive andnegative quotas, thus heights could only be observed on a relative basis.
In soil distribution studies, a specific methodology was developed for the digitalestimation of topographic height (MUÑOZ, 2009) based on other fundamentals. The proposedGIS processing consisted basically in the identification of regional minima through the gatheringof SRTM (C-band) data values in a given range at the same point location. This wasaccomplished by means of directional filters and logical operations, in combined displacementsto gather regional quotas in different GIS layers. This set allows analyses of quota distributionaround each point, such as the extraction of minima quotas of the land for the constructionof the reference DEM to subtract from original SRTM data.
Due to the large variation of elevation over short distances in rugged relief conditions(mountainous regions) the topographic height value is not expected to represent thevegetation height under this condition. On the other hand, in flat regions of homogeneouselevation, such as Pantanal, the quota variations in short distances are due to the result ofsurface objects height variations, mostly vegetation. The relief of the Pantanal is characterizedby extreme flatness, a characteristic expected to be a favorable condition for the extractionof height features, which include the height of the vegetation. The main purpose of thispaper is to apply this methodology and assess its usefulness in mapping vegetation canopyheight in the Brazilian Pantanal.
MATERIALS AND METHOD
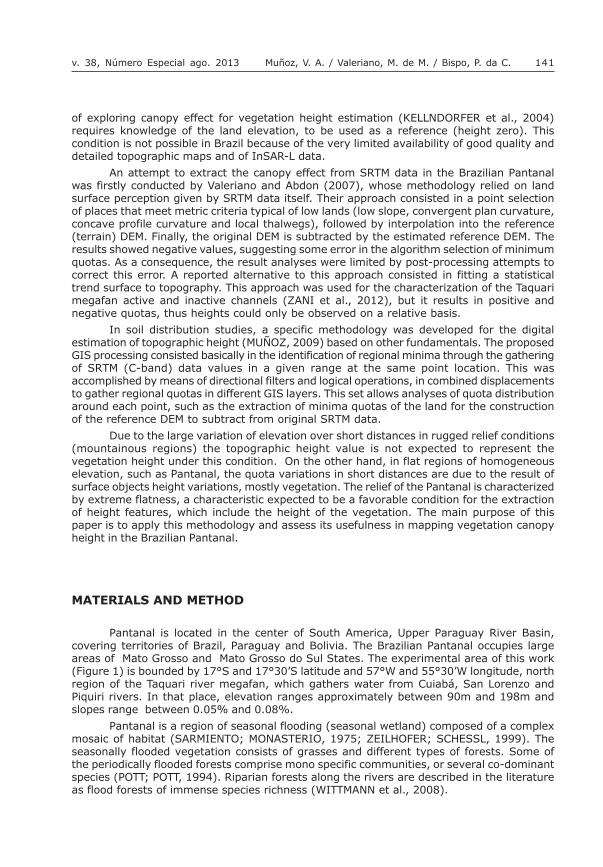
Pantanal is located in the center of South America, Upper Paraguay River Basin,covering territories of Brazil, Paraguay and Bolivia. The Brazilian Pantanal occupies largeareas of Mato Grosso and Mato Grosso do Sul States. The experimental area of this work(Figure 1) is bounded by 17°S and 17°30�S latitude and 57°W and 55°30�W longitude, northregion of the Taquari river megafan, which gathers water from Cuiabá, San Lorenzo andPiquiri rivers. In that place, elevation ranges approximately between 90m and 198m andslopes range between 0.05% and 0.08%.
Pantanal is a region of seasonal flooding (seasonal wetland) composed of a complexmosaic of habitat (SARMIENTO; MONASTERIO, 1975; ZEILHOFER; SCHESSL, 1999). Theseasonally flooded vegetation consists of grasses and different types of forests. Some ofthe periodically flooded forests comprise mono specific communities, or several co-dominantspecies (POTT; POTT, 1994). Riparian forests along the rivers are described in the literatureas flood forests of immense species richness (WITTMANN et al., 2008).
142 GEOGRAFIASurveying the topographic height from SRTM DATA for canopy
mapping in the brazilian Pantanal
The phytophysiognomies of the study site include: Savana (Cerrado and Chaco),with vegetation varying from dense to woody-grassy formations; Deciduous Seasonal Forest(Floresta Estacional Decidual); and Savana-Seasonal Forest (Savana � Floresta Estacional)hotspot contact, with semideciduous forest communities with emergent canopy(RADAMBRASIL, 1982), as shown in figure 2. Dense Arboreal Savanna - Sd (A), Open ArborealSavanna without Gallery Forest - Sas (B and C); Park Savanna without Gallery Forest - Sps(B and C), Grassy-woody Savanna without Gallery Forest - Sgs (A and B), contact betweenSavanna - Alluvial Semideciduous Seasonal Forest with emergent canopy - Fae1 (a, B andC), and contact between Savanna - Lowland Semideciduous Seasonal Forest with emergentcanopy - Fbe1 (B) are the phytophysiognomies among the highlights of figure 1.
The Savana structure can be described as small trees with cork bark and largeleaves, spaced over a field of graminoid and large-leaved plants, typically developed on plainterrains. The Deciduous Seasonal Forest is very heterogeneous, with a large number ofdeciduous arboreal species. These communities present general height around 20m, withmany emergent species, which present high foliar seasonality in unfavorable periods . TheSavana-Seasonal Forest contact area is the largest class, notably important near drainagechannels; the graminoid types prevail on floodplain areas, whereas forest fragments occur inrelatively higher lands disposed on elongated patches, locally known as cordilheiras (ridges).
To calculate the topographic height, elevation models from both the topographicdatabase Topodata and the German Aerospace Center DLR X-SAR SRTM Digital ElevationModel (DEM X-SAR) were taken as input. Topodata DEM (www.dsr.inpe.br/topodata)corresponds to a refinement of the SRTM data (C-band) by kriging (geostatistical interpolationtechnique), from ~90m to ~30m (VALERIANO; ROSSETTI, 2012).
Figure 1 � Experimental area. The box highlight (A, B and C) represents three selectedareas for results detailing interpretations beside optical images
143Muñoz, V. A. / Valeriano, M. de M. / Bispo, P. da C.v. 38, Número Especial ago. 2013
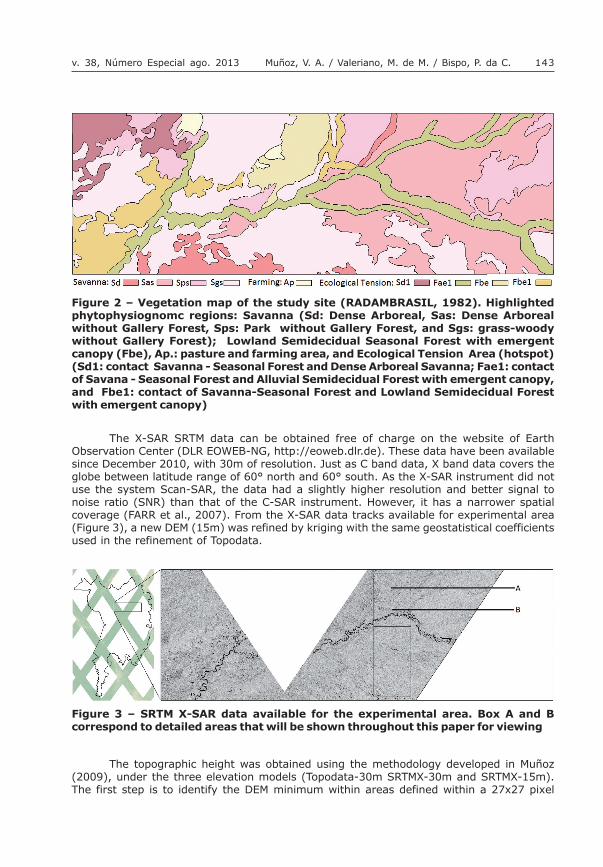
The X-SAR SRTM data can be obtained free of charge on the website of EarthObservation Center (DLR EOWEB-NG, http://eoweb.dlr.de). These data have been availablesince December 2010, with 30m of resolution. Just as C band data, X band data covers theglobe between latitude range of 60° north and 60° south. As the X-SAR instrument did notuse the system Scan-SAR, the data had a slightly higher resolution and better signal tonoise ratio (SNR) than that of the C-SAR instrument. However, it has a narrower spatialcoverage (FARR et al., 2007). From the X-SAR data tracks available for experimental area(Figure 3), a new DEM (15m) was refined by kriging with the same geostatistical coefficientsused in the refinement of Topodata.
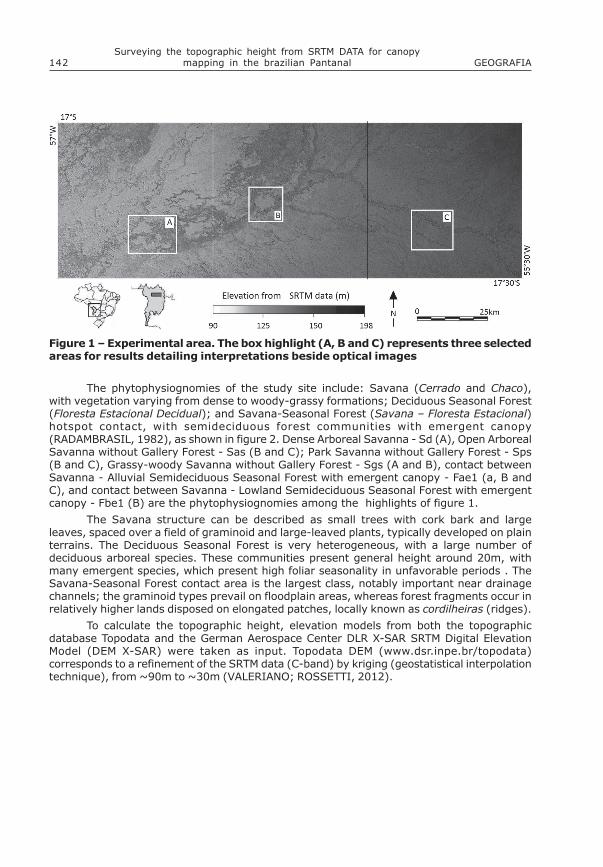
Figure 2 � Vegetation map of the study site (RADAMBRASIL, 1982). Highlightedphytophysiognomc regions: Savanna (Sd: Dense Arboreal, Sas: Dense Arborealwithout Gallery Forest, Sps: Park without Gallery Forest, and Sgs: grass-woodywithout Gallery Forest); Lowland Semidecidual Seasonal Forest with emergentcanopy (Fbe), Ap.: pasture and farming area, and Ecological Tension Area (hotspot)(Sd1: contact Savanna - Seasonal Forest and Dense Arboreal Savanna; Fae1: contactof Savana - Seasonal Forest and Alluvial Semidecidual Forest with emergent canopy,and Fbe1: contact of Savanna-Seasonal Forest and Lowland Semidecidual Forestwith emergent canopy)
Figure 3 � SRTM X-SAR data available for the experimental area. Box A and Bcorrespond to detailed areas that will be shown throughout this paper for viewing
The topographic height was obtained using the methodology developed in Muñoz(2009), under the three elevation models (Topodata-30m SRTMX-30m and SRTMX-15m).The first step is to identify the DEM minimum within areas defined within a 27x27 pixel
144 GEOGRAFIASurveying the topographic height from SRTM DATA for canopy
mapping in the brazilian Pantanal
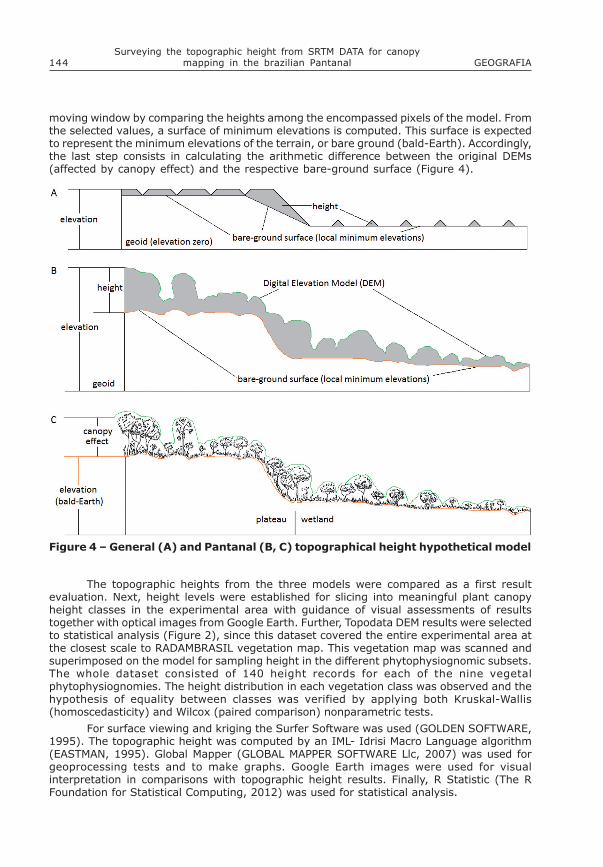
moving window by comparing the heights among the encompassed pixels of the model. Fromthe selected values, a surface of minimum elevations is computed. This surface is expectedto represent the minimum elevations of the terrain, or bare ground (bald-Earth). Accordingly,the last step consists in calculating the arithmetic difference between the original DEMs(affected by canopy effect) and the respective bare-ground surface (Figure 4).
The topographic heights from the three models were compared as a first resultevaluation. Next, height levels were established for slicing into meaningful plant canopyheight classes in the experimental area with guidance of visual assessments of resultstogether with optical images from Google Earth. Further, Topodata DEM results were selectedto statistical analysis (Figure 2), since this dataset covered the entire experimental area atthe closest scale to RADAMBRASIL vegetation map. This vegetation map was scanned andsuperimposed on the model for sampling height in the different phytophysiognomic subsets.The whole dataset consisted of 140 height records for each of the nine vegetalphytophysiognomies. The height distribution in each vegetation class was observed and thehypothesis of equality between classes was verified by applying both Kruskal-Wallis(homoscedasticity) and Wilcox (paired comparison) nonparametric tests.
For surface viewing and kriging the Surfer Software was used (GOLDEN SOFTWARE,1995). The topographic height was computed by an IML- Idrisi Macro Language algorithm(EASTMAN, 1995). Global Mapper (GLOBAL MAPPER SOFTWARE Llc, 2007) was used forgeoprocessing tests and to make graphs. Google Earth images were used for visualinterpretation in comparisons with topographic height results. Finally, R Statistic (The RFoundation for Statistical Computing, 2012) was used for statistical analysis.
Figure 4 � General (A) and Pantanal (B, C) topographical height hypothetical model
145Muñoz, V. A. / Valeriano, M. de M. / Bispo, P. da C.v. 38, Número Especial ago. 2013
RESULTS AND DISCUSSION
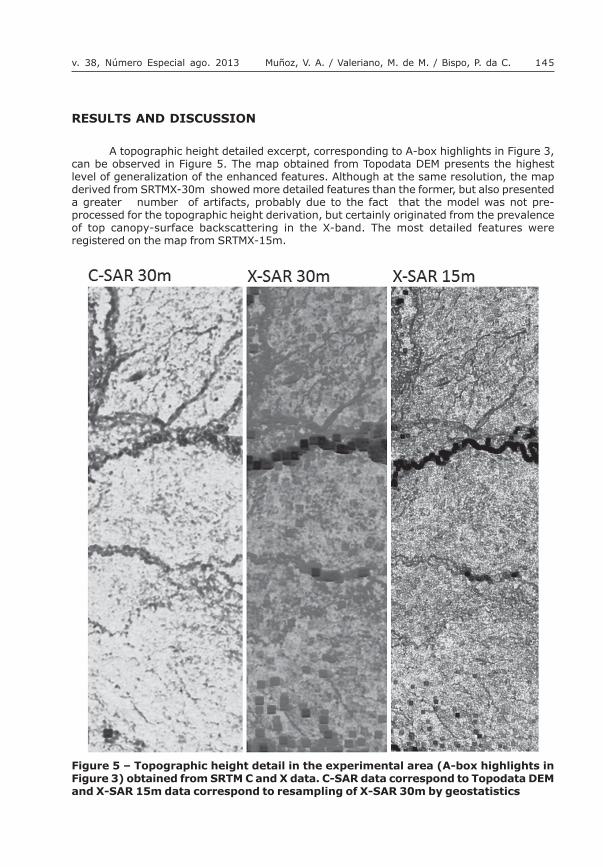
A topographic height detailed excerpt, corresponding to A-box highlights in Figure 3,can be observed in Figure 5. The map obtained from Topodata DEM presents the highestlevel of generalization of the enhanced features. Although at the same resolution, the mapderived from SRTMX-30m showed more detailed features than the former, but also presenteda greater number of artifacts, probably due to the fact that the model was not pre-processed for the topographic height derivation, but certainly originated from the prevalenceof top canopy-surface backscattering in the X-band. The most detailed features wereregistered on the map from SRTMX-15m.
Figure 5 � Topographic height detail in the experimental area (A-box highlights inFigure 3) obtained from SRTM C and X data. C-SAR data correspond to Topodata DEMand X-SAR 15m data correspond to resampling of X-SAR 30m by geostatistics

146 GEOGRAFIASurveying the topographic height from SRTM DATA for canopy
mapping in the brazilian Pantanal
The frequency distribution shape is equivalent for the three topographical heightmodels (Figure 6). Values between 2m and 6m predominate; values between 6 and 10m areless frequent but may represent taller and more scattered vegetation; values greater than10 are rare and related to an artifact in the three images, particularly expressive on SRTMX-30m derived topographical height model.
Figure 6 � Topographic height frequency distribution in Figure 5 area
This artifact is a type of square feature, originated from landmarks in an isolatedcondition and below the surrounding elevation, particularly noticeable in the X-SAR 30mdata (Figure 7). Solutions to remove it may focus on the moving window used to extract thetopographic height, with changes in the area of analysis, so that bald-Earth surface resultsare free from those negative singularities. Alternatives may consider DEM itself, perhaps apre-processing technique that eliminates these singularities or, less suitable, on post-processing operations to operate directly on the results of topographic height.
Figure 7 � Topographic height detail in experimental area (B-box highlights in Figure3) where artifacts of square shape were observed
The topographic height distribution, restricted to positive values, indicates an importantgain in relation to the geomorfometric classification approach experienced in a prior study(VALERIANO; ABDON, 2007). In that experiment, the minimum quota selection criteria wereflawed because the resulting terrain surface has elevations above those of DEM in 25% ofthe tested area. This caused computing negative heights up to -13.7m and, when applyingan offset (sum) of 2m, the negative value area is reduced to less than 5%. However, theremainder topographic height had its potential extent reduced, with evident commitment ofrelative differences. In this paper, selecting minimum quotas ensured that the ground surfacewas always estimated below the DEM surface.
Another possible difference on behalf of this result quality refers to the DEM used inboth studies. The DEM used in the first study was interpolated with geostatistical coefficientsraised in Pantanal, whilst the current study uses data from the X-band SRTM mission, withgreater surface detail, and the Topodata DEM whose interpolation coefficients were selectedfrom a broader base. In a retrospective study, Valeriano and Rossetti (2012) compared
147Muñoz, V. A. / Valeriano, M. de M. / Bispo, P. da C.v. 38, Número Especial ago. 2013
manifold interpolations of regional projects and a greater power of detail interpolator wasused to make the Topodata DEM, whilst the old Pantanal DEM stood among those thatcaused surface smoothing. In addition to the mentioned +2m offset needed in the previousstudies, the higher sharpness of Topodata DEM led to the expectation that the topographicheights in this work would be larger and more approximate to the variations that in factoccurred.
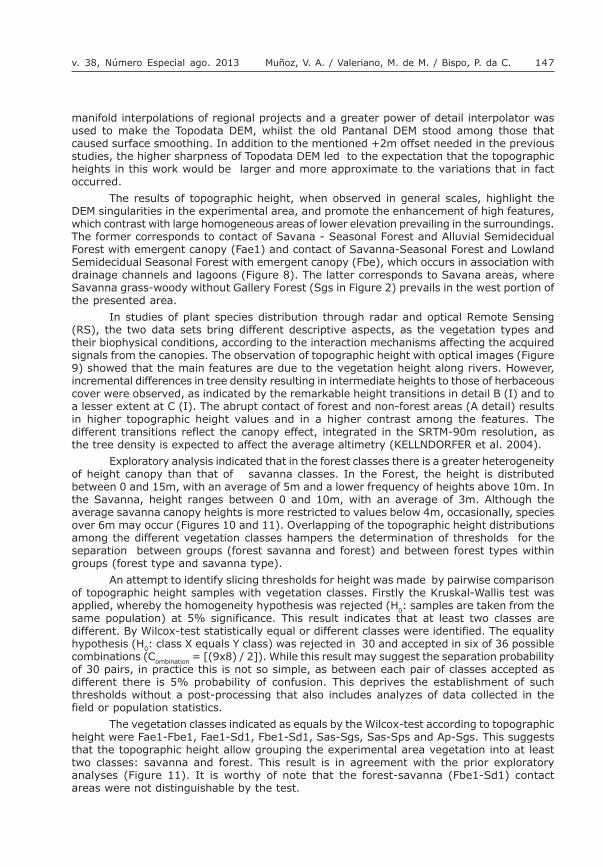
The results of topographic height, when observed in general scales, highlight theDEM singularities in the experimental area, and promote the enhancement of high features,which contrast with large homogeneous areas of lower elevation prevailing in the surroundings.The former corresponds to contact of Savana - Seasonal Forest and Alluvial SemidecidualForest with emergent canopy (Fae1) and contact of Savanna-Seasonal Forest and LowlandSemidecidual Seasonal Forest with emergent canopy (Fbe), which occurs in association withdrainage channels and lagoons (Figure 8). The latter corresponds to Savana areas, whereSavanna grass-woody without Gallery Forest (Sgs in Figure 2) prevails in the west portion ofthe presented area.
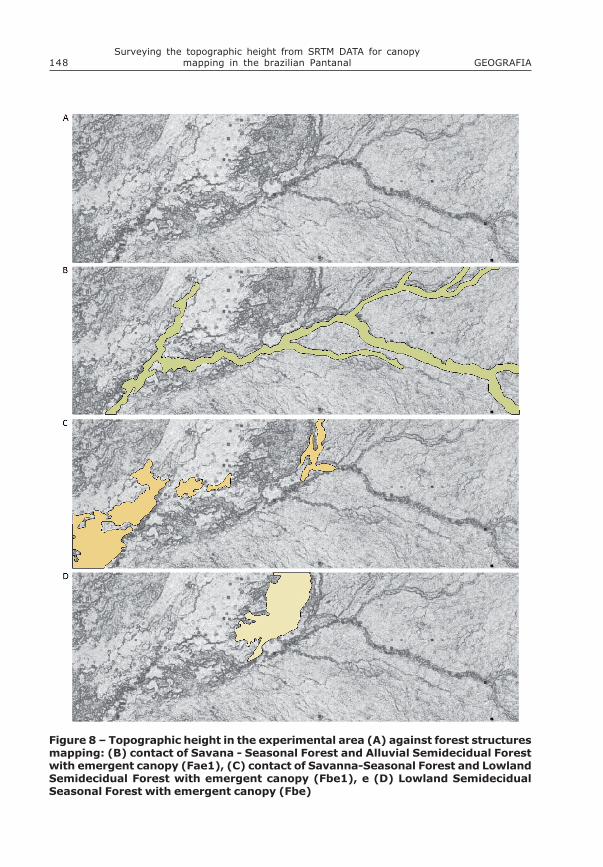
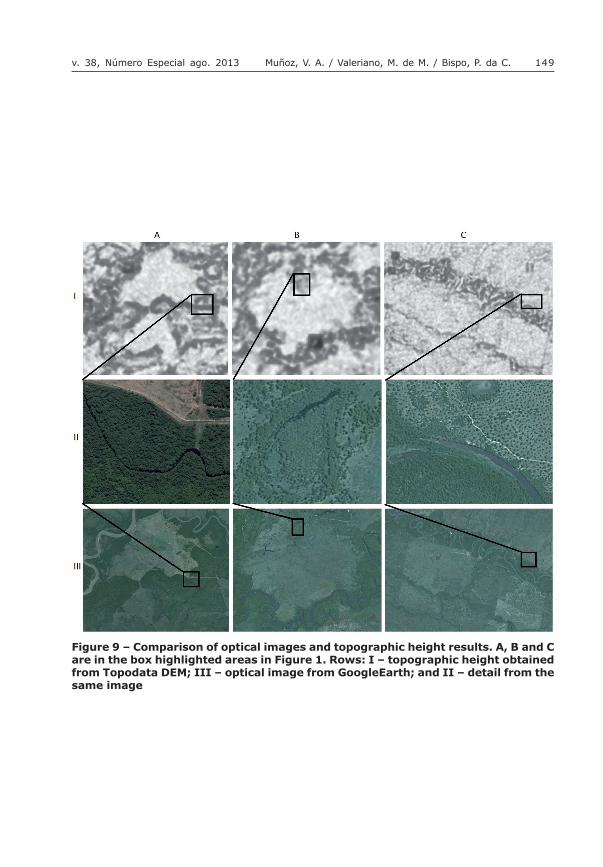
In studies of plant species distribution through radar and optical Remote Sensing(RS), the two data sets bring different descriptive aspects, as the vegetation types andtheir biophysical conditions, according to the interaction mechanisms affecting the acquiredsignals from the canopies. The observation of topographic height with optical images (Figure9) showed that the main features are due to the vegetation height along rivers. However,incremental differences in tree density resulting in intermediate heights to those of herbaceouscover were observed, as indicated by the remarkable height transitions in detail B (I) and toa lesser extent at C (I). The abrupt contact of forest and non-forest areas (A detail) resultsin higher topographic height values and in a higher contrast among the features. Thedifferent transitions reflect the canopy effect, integrated in the SRTM-90m resolution, asthe tree density is expected to affect the average altimetry (KELLNDORFER et al. 2004).
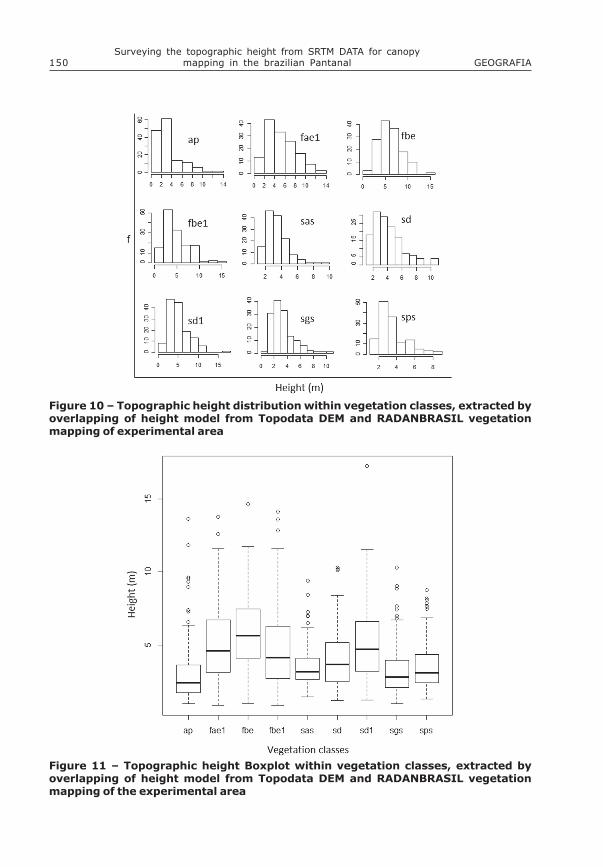
Exploratory analysis indicated that in the forest classes there is a greater heterogeneityof height canopy than that of savanna classes. In the Forest, the height is distributedbetween 0 and 15m, with an average of 5m and a lower frequency of heights above 10m. Inthe Savanna, height ranges between 0 and 10m, with an average of 3m. Although theaverage savanna canopy heights is more restricted to values below 4m, occasionally, speciesover 6m may occur (Figures 10 and 11). Overlapping of the topographic height distributionsamong the different vegetation classes hampers the determination of thresholds for theseparation between groups (forest savanna and forest) and between forest types withingroups (forest type and savanna type).
An attempt to identify slicing thresholds for height was made by pairwise comparisonof topographic height samples with vegetation classes. Firstly the Kruskal-Wallis test wasapplied, whereby the homogeneity hypothesis was rejected (H0: samples are taken from thesame population) at 5% significance. This result indicates that at least two classes aredifferent. By Wilcox-test statistically equal or different classes were identified. The equalityhypothesis (H0: class X equals Y class) was rejected in 30 and accepted in six of 36 possiblecombinations (Combination = [(9x8) / 2]). While this result may suggest the separation probabilityof 30 pairs, in practice this is not so simple, as between each pair of classes accepted asdifferent there is 5% probability of confusion. This deprives the establishment of suchthresholds without a post-processing that also includes analyzes of data collected in thefield or population statistics.
The vegetation classes indicated as equals by the Wilcox-test according to topographicheight were Fae1-Fbe1, Fae1-Sd1, Fbe1-Sd1, Sas-Sgs, Sas-Sps and Ap-Sgs. This suggeststhat the topographic height allow grouping the experimental area vegetation into at leasttwo classes: savanna and forest. This result is in agreement with the prior exploratoryanalyses (Figure 11). It is worthy of note that the forest-savanna (Fbe1-Sd1) contactareas were not distinguishable by the test.
148 GEOGRAFIASurveying the topographic height from SRTM DATA for canopy
mapping in the brazilian Pantanal
Figure 8 � Topographic height in the experimental area (A) against forest structuresmapping: (B) contact of Savana - Seasonal Forest and Alluvial Semidecidual Forestwith emergent canopy (Fae1), (C) contact of Savanna-Seasonal Forest and LowlandSemidecidual Forest with emergent canopy (Fbe1), e (D) Lowland SemidecidualSeasonal Forest with emergent canopy (Fbe)
149Muñoz, V. A. / Valeriano, M. de M. / Bispo, P. da C.v. 38, Número Especial ago. 2013
Figure 9 � Comparison of optical images and topographic height results. A, B and Care in the box highlighted areas in Figure 1. Rows: I � topographic height obtainedfrom Topodata DEM; III � optical image from GoogleEarth; and II � detail from thesame image
150 GEOGRAFIASurveying the topographic height from SRTM DATA for canopy
mapping in the brazilian Pantanal
Figure 10 � Topographic height distribution within vegetation classes, extracted byoverlapping of height model from Topodata DEM and RADANBRASIL vegetationmapping of experimental area
Figure 11 � Topographic height Boxplot within vegetation classes, extracted byoverlapping of height model from Topodata DEM and RADANBRASIL vegetationmapping of the experimental area
151Muñoz, V. A. / Valeriano, M. de M. / Bispo, P. da C.v. 38, Número Especial ago. 2013
The selection of threshold levels should take into account the fact that the topographicheight values derived from SRTM DEM represent a variable fraction of the canopy height,according to the penetration in the vegetation mass of radar waves C and X bands, whichdepends on many factors (LE TOAN et al. 1992). In the absence of accurate and appropriatereferences to specific vegetation of the experimental area, we can consider the generalrelation obtained by Kellndorfer et al. (2004) which indicates an adjustment factor (ratio) ofabout 0.8 (80%) between height canopy values collected in the field and those topographicheight values derived from SRTM DEM. It happens, however, that this ratio is highly variabledepending on the factors mentioned above. Therefore, more suitable than using absolutevalues of topographic height to directly estimate canopy height, mapping the differences ingeographic scales proved to be feasible for the separation of phyto physiognomies of structuralcontrast, as a pre-sampling technique for more detailed surveys, and as a complementarydata input for image classification of vegetation in flat areas like Pantanal.
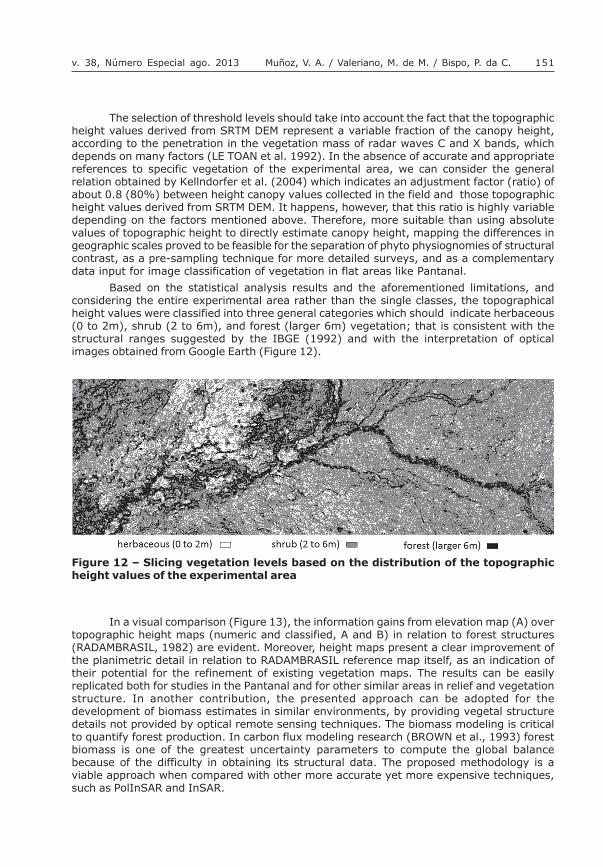
Based on the statistical analysis results and the aforementioned limitations, andconsidering the entire experimental area rather than the single classes, the topographicalheight values were classified into three general categories which should indicate herbaceous(0 to 2m), shrub (2 to 6m), and forest (larger 6m) vegetation; that is consistent with thestructural ranges suggested by the IBGE (1992) and with the interpretation of opticalimages obtained from Google Earth (Figure 12).
Figure 12 � Slicing vegetation levels based on the distribution of the topographicheight values of the experimental area
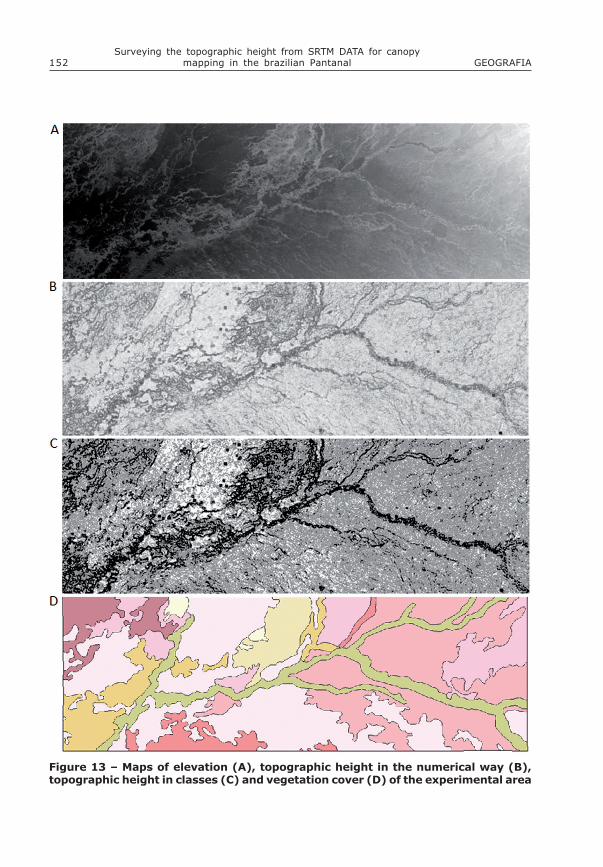
In a visual comparison (Figure 13), the information gains from elevation map (A) overtopographic height maps (numeric and classified, A and B) in relation to forest structures(RADAMBRASIL, 1982) are evident. Moreover, height maps present a clear improvement ofthe planimetric detail in relation to RADAMBRASIL reference map itself, as an indication oftheir potential for the refinement of existing vegetation maps. The results can be easilyreplicated both for studies in the Pantanal and for other similar areas in relief and vegetationstructure. In another contribution, the presented approach can be adopted for thedevelopment of biomass estimates in similar environments, by providing vegetal structuredetails not provided by optical remote sensing techniques. The biomass modeling is criticalto quantify forest production. In carbon flux modeling research (BROWN et al., 1993) forestbiomass is one of the greatest uncertainty parameters to compute the global balancebecause of the difficulty in obtaining its structural data. The proposed methodology is aviable approach when compared with other more accurate yet more expensive techniques,such as PolInSAR and InSAR.
152 GEOGRAFIASurveying the topographic height from SRTM DATA for canopy
mapping in the brazilian Pantanal
Figure 13 � Maps of elevation (A), topographic height in the numerical way (B),topographic height in classes (C) and vegetation cover (D) of the experimental area

153Muñoz, V. A. / Valeriano, M. de M. / Bispo, P. da C.v. 38, Número Especial ago. 2013
CONCLUSION
Calculation of the vegetation height in the Brazilian Pantanal from DEM was developedby adapting a computational algorithm based on a regionalized analysis of elevation datadispersion. Once developed for the estimation of topographic feature height, the algorithmwas applied to different DEM obtained by remote sensing (radar interferometry). Due to itsconsistency with the concept of topographic height, this calculation was superior to previousattempts, and the efficiency in calculating the surface minimum was evident in the numericaldistribution of the results. Besides overcoming this major task, the visual interpretation ofoptical data and statistical analysis allowed evaluating the potential and limitations of themethod compared to observable differences in vegetation cover. The selection of appropriatelevels of slicing allowed the rapid mapping of herbaceous, shrubs, and forest formations.This methodology proved to be of great potential for forestry study applications, both forthe structural characterization of the forest and for research related to forest biomassestimations. The improvements of the DEM-X SAR, refined by the pre-processing geostatisticapproach, could not be evaluated due to the lack of vegetation data in finer and compatibleresolutions. Research to advance on this particular data can be exploited only experimentally,due to its limited spatial coverage. Projects aiming to include L-band InSAR into this approachare also suggested.
REFERENCES
BALZTER, H.; ROWLAND, C.S.; SAICH, P. Forest canopy height and carbon estimation atMonks Wood National Nature Reserve, UK, using dual-wavelength SAR interferometry. RemoteSensing of Environment, v.108, n.3, p. 224-239, 2007.
BECEK, K. Investigation of elevation bias of the SRTM C- and X � band digital elevationmodels. The International Archives of the Photogrammetry, Remote Sensing and SpatialInformation Sciences, v.37, part B1, p. 105-110, 2008.
BISPO, P. C.; VALERIANO, M. M.; KUPLICH, T. M. Variáveis geomorfométricas locais e suarelação com a vegetação da região do interflúvio Madeira-Purus (AM-RO). Acta Amazonica,v. 39, n. 1, p. 71-80, 2009.
BISPO, P. C. Efeitos de geomorfometria na caracterização florístico-estrutural dafloresta tropical na região de Tapajós com dados SRTM e PALSAR. Tese (Doutorado emSensoriamento Remoto) � Instituto Nacional de Pesquisas Espaciais, São José dos Campos,2012.
BROWN, S.; IVERSON, L. R.; PRASAD, A.; LIU, D. Geographical distributions of carbon inbiomass and soils of Tropical Asian Forests. Geocarto International, v.4, p.45-59, 1993.
EASTMAN, J. R. Idrisi for Windows: User´s guide. Worcester: Clark University, 2000.
FARR, T. G.; ROSEN, P.A.; CARO, E.; CRIPPEN, R.; DUREN, R.; HENSLEY, S.; KOBRICK M.;PALLER, M.; RODRIGUEZ, E.; ROTH, L.; SEAL, D.; SHAFFER, S.; SHIMADA, J.; UMLAND, J.The Shuttle Radar Topography Mission, Rev. Geophys., v. 45, 43p. RG2004, doi:10.1029/2005RG000183.
FLORINSKY, I. V.; KURIAKOVA, G.A. Influence of topography on some vegetation coverproperties. Catena, v. 27, n. 2, p.123-141, 1996.
GUISAN, A.; ZIMMERMANN, N. E. Predictive habitat distribution models in ecology.EcologicalModelling, v.135, p.147-186, 2000.
154 GEOGRAFIASurveying the topographic height from SRTM DATA for canopy
mapping in the brazilian Pantanal
GLOBAL MAPPER LLC. Global Mapper Software Versão 9.0: user´s manual. 2007.
IBGE � INSTITUTO BRASILEIRO DE GEOGRAFIA E ESTATÍSTICA. Manual Técnico daVegetação Brasileira. Rio de Janeiro: IBGE, 1992. 92 p.
KIRKBY, M.; ATKINSON, K.; LOCKWOOD, J. G. Aspect vegetation cover and erosion onsemi-arid hillslopes. In: J. THOMES (ed). Vegetation and Geomorphology. NewYork: John Wiley,1990, p. 25�39.
KELLNDORFER, J. M., WALKER, W. S., PIERCE, L. E., DOBSON, M. C., FITES, J., HUNSAKER, C.Vegetation height derivation from shuttle radar topography mission and national elevationdata sets. Remote Sensing of Environment, v. 93, p. 339-358, 2004.
LE TOAN, T., BEAUDOIN, A., RIOM, J., GUYON, D. Relating forest biomass to SAR data. IEEETransactions on Geoscience and Remote Sensing, v. 30, p. 403-411, 1992.
MARTINS, F. S. R. V. Caracterização e estimativa de biomassa aérea de florestasatingidas pelo fogo a partir de imagens polarimétricas ALOS/PALSAR. 2012. 171 p.(sid.inpe.br/mtc-m19/2012/03.08.13.38-TDI). Dissertação (Mestrado em SensoriamentoRemoto) - Instituto Nacional de Pesquisas Espaciais, São José dos Campos, 2012. Disponívelem: <http://urlib.net/8JMKD3MGP7W/3BFTRJP>. Acesso em: 19 jan. 2013.
MUÑOZ, V. A. Análise geomorfométrica de dados SRTM aplicada ao estudo das relaçõessolo-relevo. Dissertação (Mestrado em Sensoriamento Remoto) � Instituto Nacional dePesquisas Espaciais, São José dos Campos, 2009.
POTT A.; POTT V.J. Plantas do Pantanal (Plants of the Pantanal). Corumbá: EmpresaBrasileira de Pesquisa Agropecuária (EMBRAPA), 1994.
RADAMBRASIL. Departamento Nacional de Produção Mineral. Folha SE.21- Corumbá e parteda folha SE.20 Geologia, eomorfologia, pedologia, vegetação e uso potencial da terra.Rio de Janeiro: DNPM, 452 p. (Levantamento dos Recursos Naturais, v. 27), 1982.
SARMIENTO G.; MONASTERIO, M.A. Critical consideration of the environmental conditionsassociated with the occurrence of savanna ecosystems in tropical America. In GOLLEY F.B.,MEDINA E. (Ed.). Tropical ecological systems. Berlin: Springer, p. 223�250, 1975.
THE R FOUNDATION FOR STATISTICAL COMPUTING. Disponível em: < http://www.r-project.org/>. Acesso em: nov.2012.
TIGUE, M. L.; KING, D.; BALZTER, H.; McNAIRN, H. Comparison of X/C-HH InSAR and L-PolInSAR for canopy height estimation in a lodgepole pine forest. In: 4TH INT. WORKSHOPON SCIENCE AND APPLICATIONS OF SAR POLARIMETRY AND POLARIMETRIC INTERFEROMETRY� POLINSAR, 2009, Frascati, Italy (ESA SP-668, April 2009). Disponível em http://earth.esa.int/workshops/polinsar2009/participants/470/paper_470_p4_5tigh.pdf. Acesso: janeiro de 2012.
USGS/EROS (U.S. Geological Survey/Earth Resources Observation and Science Center).Shuttle Radar Topography Mission (SRTM). 2009. http://eros.usgs.gov/#/Find_Data/Products_and_Data_Available/SRTM Acesso em: 13 jun. 2012.
VALERIANO, M. M. ; KUPLICH, T. M. ; STORINO, M. ; AMARAL, B. D.; MENDES JÚNIOR, J. N.;LIMA, D. J. . Modeling small watersheds in Brazilian Amazonia with shuttle radar topographicmission-90m data. Computers & Geosciences, v. 32, n. 8, p. 1169-1181, 2006.
VALERIANO, M. M. ; ABDON, M. M. . Aplicação de dados SRTM a estudos do Pantanal. RBC.Revista Brasileira de Cartografia, v. 59, p. 63-71, 2007.
VALERIANO, M. M. ; ROSSETTI, D. F. . Topodata: Brazilian full coverage refinement of SRTMdata. Applied Geography, v. 32, p. 300-309, 2012.
ZANI, H.; ASSINE, M.L.; MCGLUE, M. M. Remote sensing analysis of depositional landforms inalluvial settings: Method development and application to the Taquari megafan, Pantanal(Brazil). Geomorphology, v.161-162, p. 82-92, 2012.

155Muñoz, V. A. / Valeriano, M. de M. / Bispo, P. da C.v. 38, Número Especial ago. 2013
ZEILHOFER, P., SCHESSL, M. Relationship between vegetation and environmental conditionsin the northern Pantanal of Mato Grosso, Brazil. J Biogeogr, v. 27, p. 159�168, 1999.
WALKER, W.; KELLNDORFER, J.; PIERCE, L. Quality assessment of SRTM C- and X-bandinterferometric data: implications for the retrieval of vegetation canopy height. RemoteSensing of Environment, v.106, n.4, pp 428-448, 2007.
WITTMANN, F.; ZORZI, B.T; TIZIANEL, F.A.T. Tree species composition, structure, andaboveground wood biomass of a riparian forest of the Lower Miranda River, southern Pantanal,Brazil. Folia Geobotânica, v. 43, p.397-411, 2008.