survival of the sweetest - paceapes.weebly.com
TRANSCRIPT

TE
AC
HE
R
PA
GE
S
1Copyright © 2013 National Math + Science Initiative, Dallas, Texas. All rights reserved. Visit us online at www.nms.org.
Environmental Science
MATERIALS AND RESOURCES
EACH GROUP TEACHER
teacher-provided materials
2 dice
bags, brown paper, small
3 bags Skittles®, 1 lb
Survival of the SweetestA Tasty Tale of Natural Selection and Community Dynamics
ABOUT THIS LESSON
In Part I, students will simulate the events of natural selection for a population of mussels. Candy pieces of two different colors will represent
the variations of thick, strong shells and thin, weak shells found in a population of mussels. Beneficial variations increase the chance of survival for some organisms, leading to a shift in the population’s genetic makeup. In Part II, students will simulate the effects of a predator on the diversity of a community. The students will become familiar with the role of keystone species and their importance to an ecosystem.
OBJECTIVES
Students will:• Simulate the impact of natural selection on a
population of mussels• Simulate the effects of a predator on the diversity
of a community
LEVEL
Environmental Science

TE
AC
HE
R
PA
GE
S
2 Copyright © 2013 National Math + Science Initiative, Dallas, Texas. All rights reserved. Visit us online at www.nms.org.
Environmental Science – Survival of the SweetestSurvival of the Sweetest – Environmental Science
NEXT GENERATION SCIENCE STANDARDS
DEVELOPING ANDUSING MODELS
STABILITYAND CHANGE
SYSTEMS ANDSYSTEM MODELS
LS4: EVOLUTION LS2: ECOSYSTEMS
LESSON CONSUMABLES
Item 1 – Feeding ChartItem 2 – Shoreline Model, Part IItem 3 – Shoreline Model, Part II
COMMON CORE STATE STANDARDS
(LITERACY) RST.9-10.3
Follow precisely a multistep procedure when carrying out experiments, taking measurements, or performing technical tasks, attending to special cases or exceptions defined in the text.
(MATH) A_CED.2
Create equations in two or more variables torepresent relationships between quantities; graph equations on coordinate axes with labels and scales.
ASSESSMENTS
The following types of formative assessments are embedded in this lesson:• Visual assessment of graphs• Discussion of specialized vocabulary in Part I.• Assessment of students’ understanding of the
importance of a keystone species• Assessment of students’ understanding of the
carrying capacity concept
The following assessments are located on the website• Populations & Environmental Assessment
(Biology)• Evolution and Taxonomy Assessment (Biology)
ACKNOWLEDGEMENTS
Skittles® is a registered trademark of the Wm. Wrigley Jr. Company, a division of Mars, Inc.

TE
AC
HE
R
PA
GE
S
3Copyright © 2013 National Math + Science Initiative, Dallas, Texas. All rights reserved. Visit us online at www.nms.org.
Environmental Science – Survival of the SweetestSurvival of the Sweetest – Environmental Science
CONNECTIONS TO OTHER AP* COURSES
1BIOLOGYAP
A.1 Natural selection is a major mechanism of evolution.
A.2 Natural selection acts on phenotypic variations in populations.
2BIOLOGYAP
A.1 All living systems require constant input of free energy.
D.1 All biological systems from cells and organisms to populations, communities and ecosystems are affected by complex biotic and abiotic interactions involving exchange of matter and free energy.
4BIOLOGYAP
A.5 Communities are composed of populations of organisms that interact in complex ways.
A.6 Interactions among living systems and with their environment result in the movement of matter and energy.
B.3 Interactions between and within populations influence patterns of species distribution and abundance.
C.4 The diversity of species within an ecosystem may influence the stability of the ecosystem.
*Advanced Placement® and AP® are registered trademarks of the College Entrance Examination Board. The College Board was not involved in the production of this product.

TE
AC
HE
R
PA
GE
S
4 Copyright © 2013 National Math + Science Initiative, Dallas, Texas. All rights reserved. Visit us online at www.nms.org.
Environmental Science – Survival of the SweetestSurvival of the Sweetest – Environmental Science
TEACHING SUGGESTIONS
This activity simulates a classic study by Robert T. Paine. “Food Web Complexity and Species Diversity” was published in
The American Naturalist in 1966, and discussed the impact of predators on an ecosystem. The article can be found online at http://biology.unm.edu/jhbrown/Documents/511Readings/Paine%201966.pdf
After completing this activity, a discussion of this article with your students would provide a deeper understanding of the model’s purpose.
This activity is divided into two parts. Part I is designed to introduce the concept of natural selection. Emphasize to the students that a single organism cannot adapt to its environment, but that it will survive if it possesses a successful adaptation. In this case, mussels with strong, thick shells are more likely to survive because the predator prefers mussels with thin, weak shells.
The students will be using orange and yellow colored candies to represent variation within a single species. You will need to prepare brown bags for each group consisting of 20 yellow and 20 orange candies. The students take on the role of a predaceous starfish on the mussel population.
The data collected in Part I can be a reference point for specialized vocabulary used during presentations on microevolution and speciation. It is important for students to randomly select the first generation and follow guidelines established in the procedure for subsequent generations. Use the class data table as a template to collect data on all five generations from each lab group. Students will then total the numbers for each generation and record the averages in Table A.
Part II is designed to introduce the importance of keystone species to an ecosystem. Prior to the activity, you will need to prepare brown bags for
each group consisting of the candies shown in Figure A.
Figure A. Candy representation of species
It is important that students select 25 organisms randomly and place them on the rocky shoreline in the order of red, orange, yellow, green, and violet. This illustrates the concept of zonation for species in an intertidal community. Remind students that the rocky shoreline is a finite space with limited resources, which means that some organisms may be pushed out of the ecosystem if other organisms are more successful at reproduction. Students should find that the community is relatively stable for the first four generations as the predaceous starfish keeps the system in check as it preys upon the most numerous species.
However, at the beginning of Generation 5 the predaceous starfish is removed and students should begin to see the exponential growth of the orange mussel. When they graph their data, they should see a stable population of orange mussels for Generation 1 through Generation 4 with exponential growth when the predator is removed starting with Generation 5 and then a leveling-off when the carrying capacity is reached. The takeaway of this lesson is that many species, like the predaceous starfish, have larger than expected effects on their environment. Biologists call such species keystone species.

TE
AC
HE
R
PA
GE
S
5Copyright © 2013 National Math + Science Initiative, Dallas, Texas. All rights reserved. Visit us online at www.nms.org.
Environmental Science – Survival of the SweetestSurvival of the Sweetest – Environmental Science
TEACHING SUGGESTIONS (CONTINUED)
Table A. Class Results, First Five Generations
GroupYellow Mussels Orange Mussels
G1 G2 G3 G4 G5 G1 G2 G3 G4 G5
1
2
3
4
5
6
7
8
9
10
11
12
13
14
Total
Average

TE
AC
HE
R
PA
GE
S
6 Copyright © 2013 National Math + Science Initiative, Dallas, Texas. All rights reserved. Visit us online at www.nms.org.
Survival of the Sweetest – Environmental Science
This page is intentionally left blank.
www.nms.org
7Copyright © 2013 National Math + Science Initiative, Dallas, Texas. All rights reserved. Visit us online at www.nms.org.
Environmental Science
MATERIALS
teacher-provided materials
Charles Darwin published The Origin of Species in 1859. In his book, Darwin presented two main concepts, descent with modification and natural selection. Descent with modification is the phrase Darwin
used to describe how modern species arose from a series of ancestors through accumulated changes over time. Natural selection, however, is the process by which biological traits become more or less pronounced in a population as a function of reproductive advantage.
Reproduction allows organisms to pass on beneficial traits to the next generation. Without these beneficial traits, organisms are more likely to die before they have a chance to reproduce. The overall composition of the biological traits of the population will change as the survivors with more beneficial genes produce more offspring.
Natural selection is sometimes referred to as “survival of the fittest.” For example, in an arid environment narrow leaf plants survive at a greater rate than broad leaf plants. The narrow leaf plant conserves water much better than the broad leaf plant. It is important to note that individual organisms do not adapt to their environment. Rather, they possess traits that make them better suited for survival and ultimately afford them a reproductive advantage.
The struggle for existence does not only shape the traits of a population but also shapes communities. Competition for finite resources and predation both determine the size and diversity of a community. The relationships of the species in the community are often more complex than they first appear with some species having a disproportionate effect on their environment.
Survival of the SweetestA Tasty Tale of Natural Selection and Community Dynamics

8 Copyright © 2013 National Math + Science Initiative, Dallas, Texas. All rights reserved. Visit us online at www.nms.org.
Environmental Science – Survival of the SweetestSurvival of the Sweetest – Environmental Science
PURPOSE
In Part I, you will simulate the events of natural selection for a population of mussels living in the rocky, intertidal zone of the Pacific Ocean. Mussels are bivalves much like clams and oysters. This simulated population of mussels (Peloris dulcis) has individuals with thick, strong shells and others with thin, weak shells. The thick shell provides more protection from the predaceous starfish lurking in the shallows. The starfish more readily eats the mussels with the thin shells. Orange and yellow candies will represent the variation found in this species of mussel.
In Part II, you will simulate the effects of a predaceous starfish on the diversity of a community made up of barnacles, mussels, chitons, and snails. It is important to point out that each candy color represents a different species, not variations within a species as modeled in Part I. You will also simulate the effects of removing the predaceous starfish on the diversity of the community. In addition, each species is competing for limited space. Competition can force some species out of the ecosystem.
9Copyright © 2013 National Math + Science Initiative, Dallas, Texas. All rights reserved. Visit us online at www.nms.org.
Environmental Science – Survival of the SweetestSurvival of the Sweetest – Environmental Science
PROCEDURE
PART I
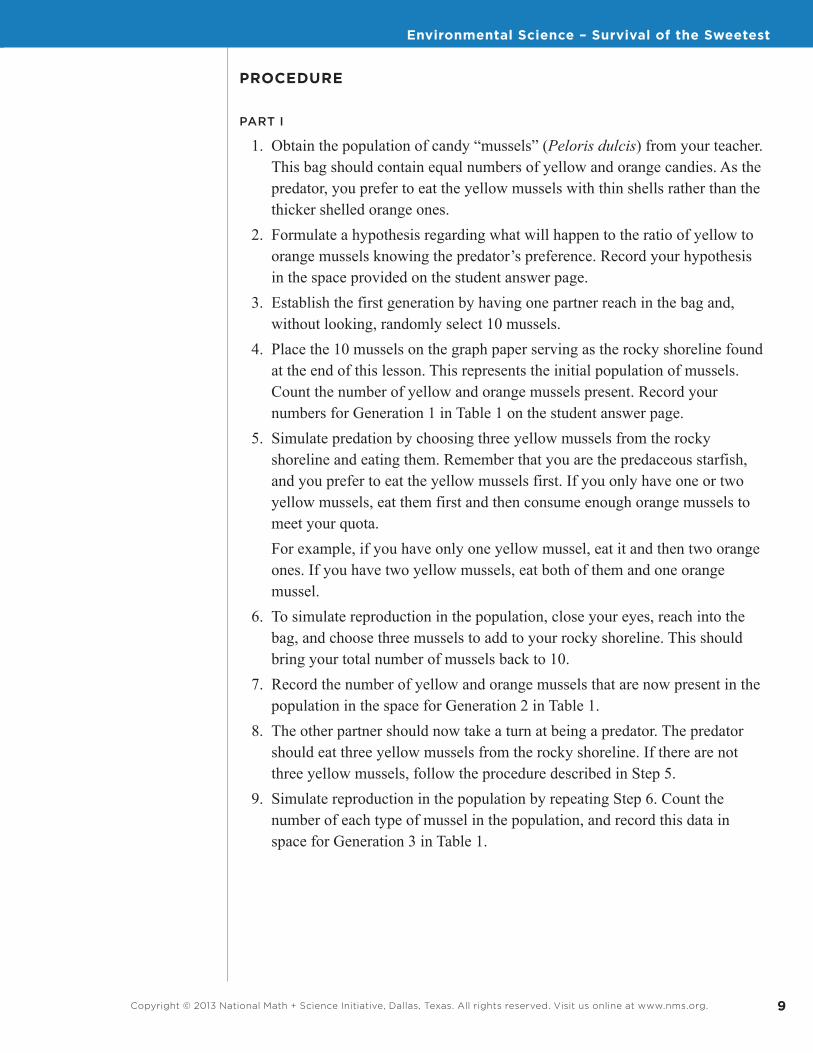
1. Obtain the population of candy “mussels” (Peloris dulcis) from your teacher. This bag should contain equal numbers of yellow and orange candies. As the predator, you prefer to eat the yellow mussels with thin shells rather than the thicker shelled orange ones.
2. Formulate a hypothesis regarding what will happen to the ratio of yellow to orange mussels knowing the predator’s preference. Record your hypothesis in the space provided on the student answer page.
3. Establish the first generation by having one partner reach in the bag and, without looking, randomly select 10 mussels.
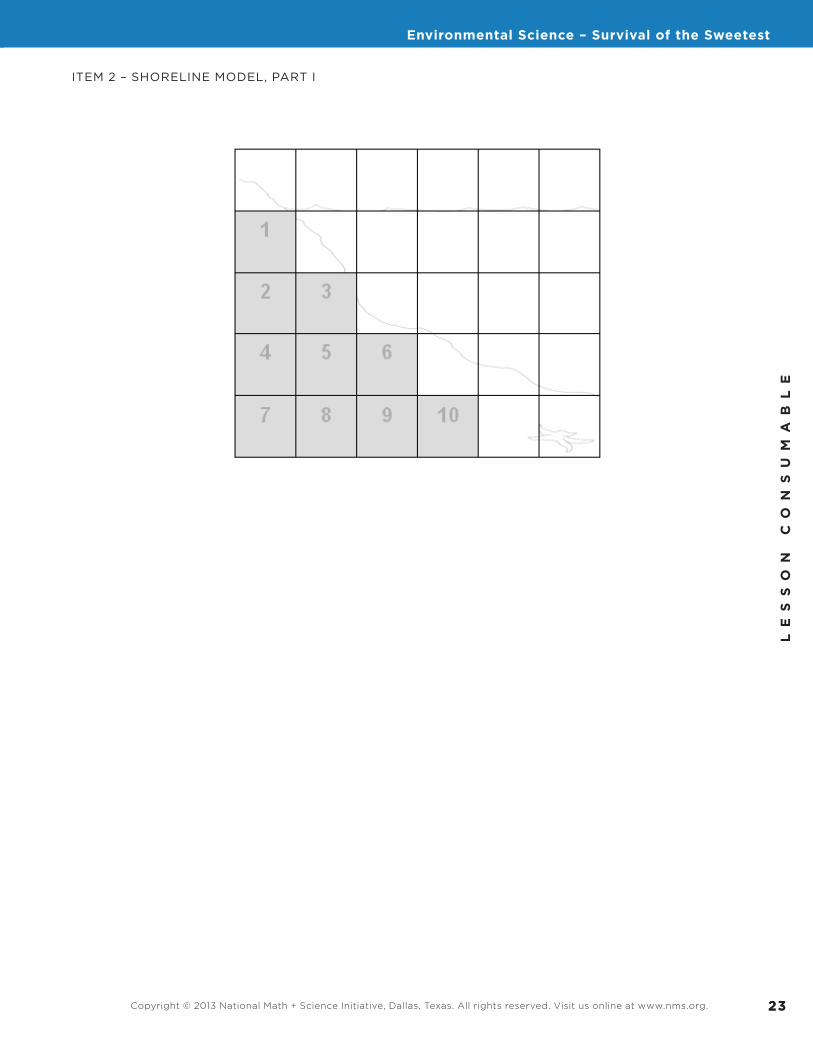
4. Place the 10 mussels on the graph paper serving as the rocky shoreline found at the end of this lesson. This represents the initial population of mussels. Count the number of yellow and orange mussels present. Record your numbers for Generation 1 in Table 1 on the student answer page.
5. Simulate predation by choosing three yellow mussels from the rocky shoreline and eating them. Remember that you are the predaceous starfish, and you prefer to eat the yellow mussels first. If you only have one or two yellow mussels, eat them first and then consume enough orange mussels to meet your quota. For example, if you have only one yellow mussel, eat it and then two orange ones. If you have two yellow mussels, eat both of them and one orange mussel.
6. To simulate reproduction in the population, close your eyes, reach into the bag, and choose three mussels to add to your rocky shoreline. This should bring your total number of mussels back to 10.
7. Record the number of yellow and orange mussels that are now present in the population in the space for Generation 2 in Table 1.
8. The other partner should now take a turn at being a predator. The predator should eat three yellow mussels from the rocky shoreline. If there are not three yellow mussels, follow the procedure described in Step 5.
9. Simulate reproduction in the population by repeating Step 6. Count the number of each type of mussel in the population, and record this data in space for Generation 3 in Table 1.
10 Copyright © 2013 National Math + Science Initiative, Dallas, Texas. All rights reserved. Visit us online at www.nms.org.
Environmental Science – Survival of the SweetestSurvival of the Sweetest – Environmental Science
PROCEDURE (CONTINUED)
10. Repeat this process detailed in Step 5 through Step 9 until you have a total of five generations of data.
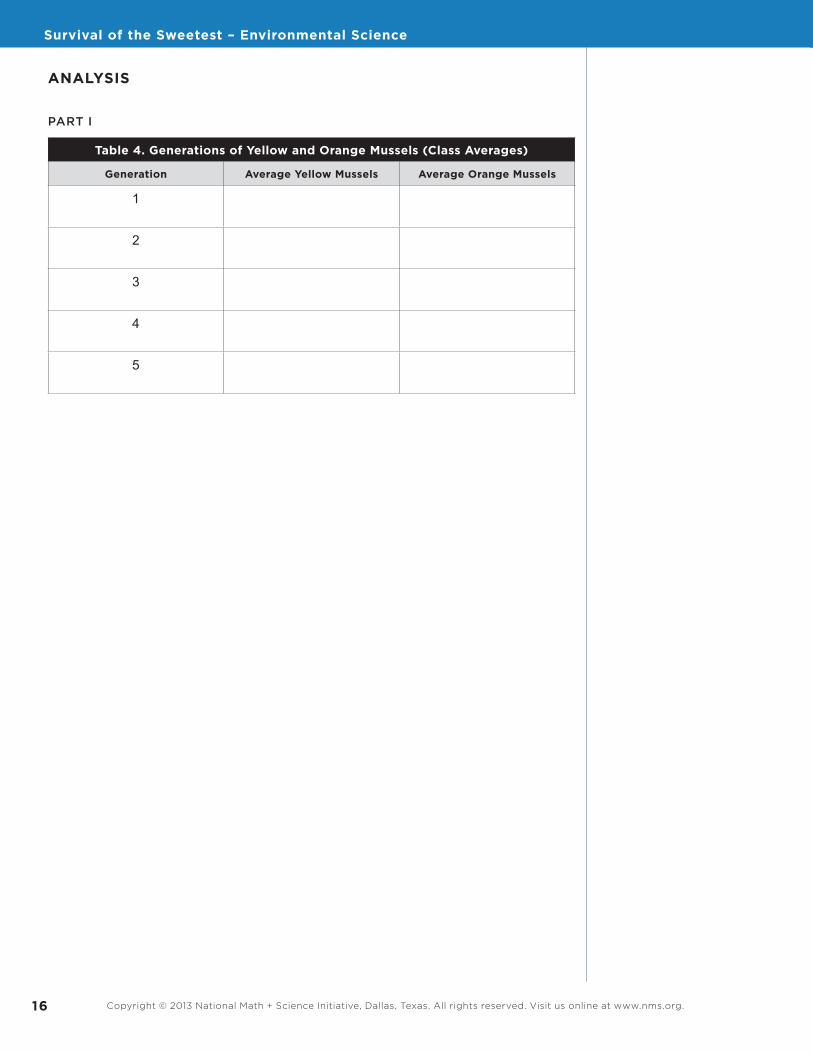
11. As instructed by your teacher, combine your individual data with the class data for each of the five generations. Calculate the class average for each mussel for each generation. Record class averages in Table 4 of the Analysis section.
PART II
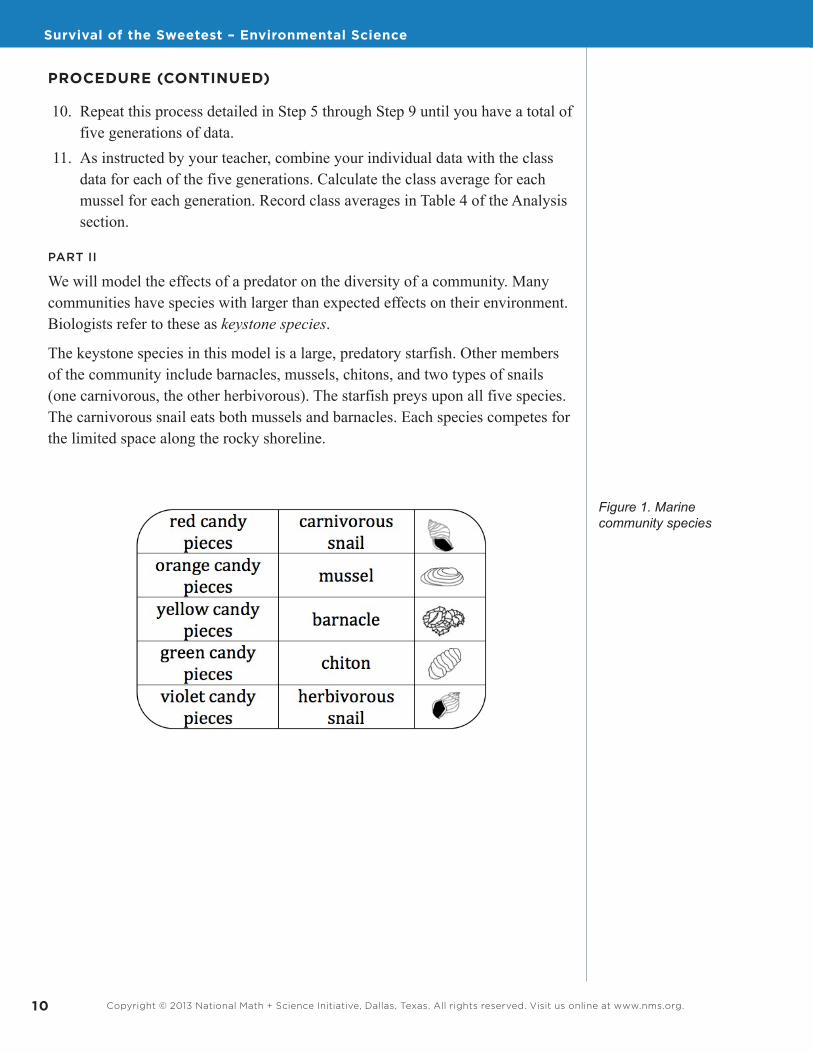
We will model the effects of a predator on the diversity of a community. Many communities have species with larger than expected effects on their environment. Biologists refer to these as keystone species.
The keystone species in this model is a large, predatory starfish. Other members of the community include barnacles, mussels, chitons, and two types of snails (one carnivorous, the other herbivorous). The starfish preys upon all five species. The carnivorous snail eats both mussels and barnacles. Each species competes for the limited space along the rocky shoreline.
Figure 1. Marine community species

11Copyright © 2013 National Math + Science Initiative, Dallas, Texas. All rights reserved. Visit us online at www.nms.org.
Environmental Science – Survival of the SweetestSurvival of the Sweetest – Environmental Science
PROCEDURE (CONTINUED)
1. Illustrate a food web representing the feeding relationships described above in the space provided on the student answer page.
2. After considering the illustrated food web, formulate a hypothesis predicting the abundance of the five prey species if the predatory starfish is removed from the environment. Record your hypothesis in the space provided.
3. Obtain the candy “marine invertebrates” from your teacher. This bag will contain the items described in Figure 1. You will serve as the predatory starfish.
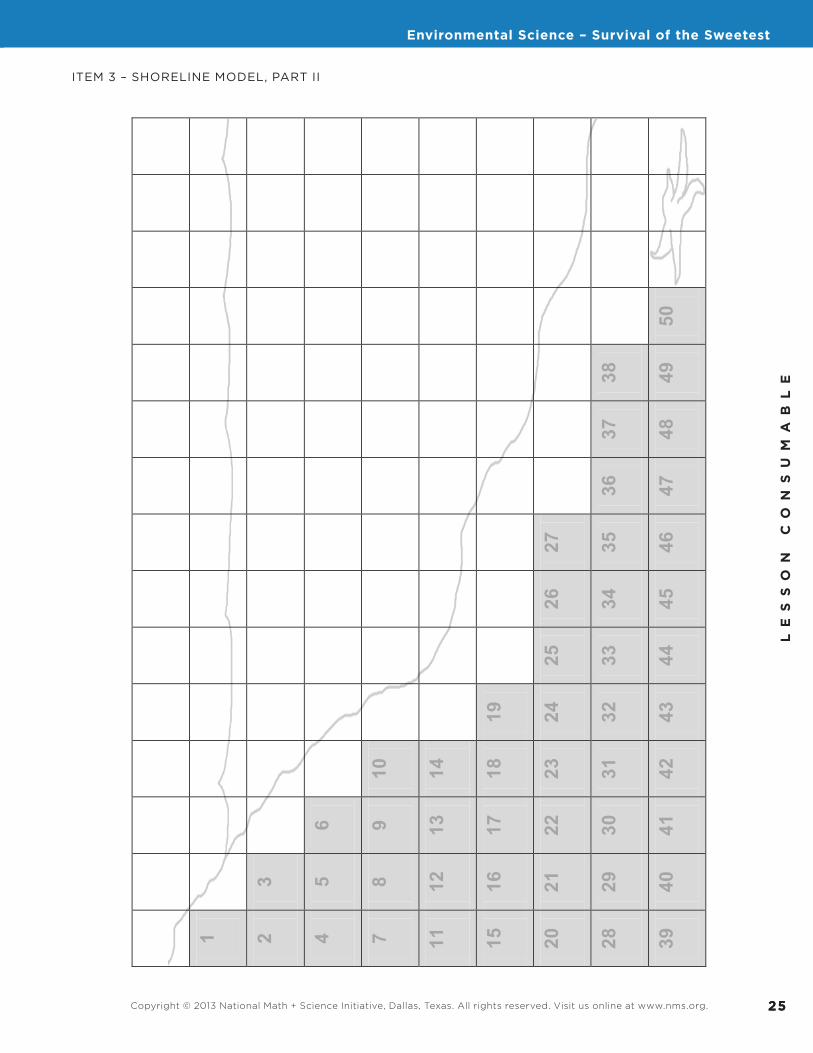
4. Select 25 organisms (candy pieces) at random and place them on the graph paper serving as the rocky shoreline found at the end of this lesson. Each organism must be placed on a gray, numbered square within the outline of the rocky shoreline. Always place the red snails first (start with number 1). Next, place the orange mussels, then the yellow barnacles, then the green chitons and, finally, the violet snails (all in numerical order). Although the mussel, barnacle, chiton, and herbivorous snail do not eat one another, they do compete for available space. If one of the more competitive species quickly reproduces, it will push the other populations out of the ecosystem.
5. Count the number of each type of organism and record the data in the space marked Initial Population for Generation 1 in Table 3.
6. Using the Feeding Chart located elsewhere in this lesson, roll the die once to determine the next meal of the starfish (round up if there is half of a prey item). The choices of the starfish are found on the inner ring. Remove the organisms (candy pieces) consumed by the starfish.
7. Roll the die a second time to determine the action of the carnivorous snails. The choices of the carnivorous snail are located on the outer ring of the Feeding Chart. Remove a carnivorous snail, mussel, or barnacle as determined by your roll.
8. Once you have rolled the die twice and removed the organisms consumed, record the final population of each species in the space marked Final Population for Generation 1 in Table 3.

12 Copyright © 2013 National Math + Science Initiative, Dallas, Texas. All rights reserved. Visit us online at www.nms.org.
Environmental Science – Survival of the SweetestSurvival of the Sweetest – Environmental Science
PROCEDURE (CONTINUED)
9. Before the next round, the organisms will reproduce. Use the following rules to determine the correct number of each species after reproduction:a. The orange mussels will double their number b. The yellow barnacles, green chitons, and violet herbivorous snails will add
one organism for every two individuals present (do not round up)c. The red carnivorous snails will add one organism for every four
individuals present (again, do not round up)d. If one of the populations does not meet the requirements for reproduction,
add one individual to that population. Example: After Generation 2, there are three red carnivorous snails in the final population. According to (c), you must have at least four red carnivorous snails to reproduce; however, (d) states that you always add at least one individual to the population. Therefore, your initial population of red carnivorous snails for Generation 3 will be four.
10. After adding the appropriate number of individuals, record the new population in the space marked Initial Population for Generation 2 in Table 3.
11. Following the sequence established in Step 4, place the red snails first, then the orange mussels, then the yellow barnacles, then the green chitons and, lastly, the violet snails (all in numerical order). If there is not enough room to place all of the individuals, adjust the initial population of the species that is “crowded out.”
12. Repeat Step 6 through Step 9 to simulate events through Generation 4. Record your data in Table 3.
13. The starfish is now removed from the ecosystem. After Generation 4, you will only need to roll the die once to determine the actions of the carnivorous snails. Continue to follow Step 7 through Step 9 (with only one die and using the outer ring of the Feeding Chart) to simulate events through Generation 10. Record your data in Table 3.

13Copyright © 2013 National Math + Science Initiative, Dallas, Texas. All rights reserved. Visit us online at www.nms.org.
Environmental Science – Survival of the SweetestSurvival of the Sweetest – Environmental Science
HYPOTHESIS
PART I
PART II
DATA AND OBSERVATIONS
PART I
Table 1. Generations of Yellow and Orange Mussels
Generation Yellow Mussels Orange Mussels
1
2
3
4
5
PART II
Table 2. Intertidal Food Web

14 Copyright © 2013 National Math + Science Initiative, Dallas, Texas. All rights reserved. Visit us online at www.nms.org.
Environmental Science – Survival of the SweetestSurvival of the Sweetest – Environmental Science
DATA AND OBSERVATIONS (CONTINUED)Ta
ble
3. P
op
ulat
ion
of
Eac
h S
pec
ies
by
Gen
erat
ion
Con
tinue
with
G
ener
atio
n 5
Rem
ove
S
tarf
ish
Gen
erat
ion
4
Fin
alIn
itia
l
Gen
erat
ion
3
Fin
alIn
itia
l
Gen
erat
ion
2
Fin
alIn
itia
l
Gen
erat
ion
1
Fin
alIn
itia
l
Red
ca
rniv
orou
s sn
ail
Ora
nge
mus
sel
Yello
w
barn
acle
Gre
en
chito
n
Viol
et
herb
ivor
ous
snai
l

15Copyright © 2013 National Math + Science Initiative, Dallas, Texas. All rights reserved. Visit us online at www.nms.org.
Environmental Science – Survival of the SweetestSurvival of the Sweetest – Environmental Science
DATA AND OBSERVATIONS (CONTINUED)
Tab
le 3
. Po
pul
atio
n o
f E
ach
Sp
ecie
s b
y G
ener
atio
n (c
ont
inue
d)
Gen
erat
ion
10
Fin
alIn
itia
l
Gen
erat
ion
9
Fin
alIn
itia
l
Gen
erat
ion
8
Fin
alIn
itia
l
Gen
erat
ion
7
Fin
alIn
itia
l
Gen
erat
ion
6
Fin
alIn
itia
l
Gen
erat
ion
5
Fin
alIn
itia
l
Red
ca
rniv
orou
s sn
ail
Ora
nge
mus
sel
Yello
w
barn
acle
Gre
en
chito
n
Viol
et
herb
ivor
ous
snai
l
16 Copyright © 2013 National Math + Science Initiative, Dallas, Texas. All rights reserved. Visit us online at www.nms.org.
Environmental Science – Survival of the SweetestSurvival of the Sweetest – Environmental Science
ANALYSIS
PART I
Table 4. Generations of Yellow and Orange Mussels (Class Averages)
Generation Average Yellow Mussels Average Orange Mussels
1
2
3
4
5
17Copyright © 2013 National Math + Science Initiative, Dallas, Texas. All rights reserved. Visit us online at www.nms.org.
Environmental Science – Survival of the SweetestSurvival of the Sweetest – Environmental Science
ANALYSIS (CONTINUED)
Prepare a graph of the class averages of orange and yellow mussels for each generation. Be sure to include axes labels, units, and a title on your graph.
PART II
Prepare a graph of the orange mussels for each generation (final generation). Be sure to include axes labels, units, and a title on your graph.

18 Copyright © 2013 National Math + Science Initiative, Dallas, Texas. All rights reserved. Visit us online at www.nms.org.
Environmental Science – Survival of the SweetestSurvival of the Sweetest – Environmental Science
CONCLUSION QUESTIONS
1. Write a statement describing how the number of yellow and orange mussels changed over the period of five generations in Part I of the Procedure.
2. What do you predict would happen to the number of yellow mussels if you continued predation for a total of 10 generations? Explain your prediction.
3. Which type of mussel would Darwin consider “most fit” in this predation situation? Why?
4. What adaptation do these mussels possess that allows them to survive?
5. Explain why it is incorrect to say that an individual adapts to its environment.
19Copyright © 2013 National Math + Science Initiative, Dallas, Texas. All rights reserved. Visit us online at www.nms.org.
Environmental Science – Survival of the SweetestSurvival of the Sweetest – Environmental Science
CONCLUSION QUESTIONS (CONTINUED)
6. In Part II of the Procedure, which organism possesses traits that enable it to exploit the rocky shoreline more efficiently than the other populations in the community? Explain.
7. Compare the change in the diversity of the community in Generation 1 to Generation 10. What major factor accounts for this change?
8. Consider the following hypothesis of Robert Paine.
“Local species diversity is directly related to the efficiency with which predators prevent the monopolization of the major environmental requisites (necessities of life) by one species.”
Does your data support or refute this hypothesis? Explain your answer using evidence from Generation 1 through Generation 10.

20 Copyright © 2013 National Math + Science Initiative, Dallas, Texas. All rights reserved. Visit us online at www.nms.org.
Survival of the Sweetest – Environmental Science
CONCLUSION QUESTIONS (CONTINUED)
The “Population Growth of Orange Mussels” graph (Figure 2) was generated by a student performing this simulation last year. Considering the data you collected, answer the following questions.
9. Identify and discuss the major factors responsible for Section A on the graph.
10. Identify and discuss the major factors responsible for Section B and Section C on the graph.
Figure 2. Population growth of orange mussels

21Copyright © 2013 National Math + Science Initiative, Dallas, Texas. All rights reserved. Visit us online at www.nms.org.
LE
SS
ON
C
ON
SU
MA
BL
E
21
Environmental Science – Survival of the Sweetest
ITEM 1 – FEEDING CHART
FEEDING CHART
If#multiple#populations#are#the#same#size,#choose#the#species!highest'on'the'shoreline!(towards)1))to)consume!
.
1. Determine(the(starfish’s(next(meal(by(rolling(one(die.((#2. Select&the&corresponding§ion&from&the&inner&circle.#3. Remove&the&organisms)indicated.#4. Determine(the(carnivorous(snails’(actions(by(rolling(one(die.((#5. Select&the&corresponding§ion&from&the&outer&circle.#6. Remove&the&organisms&indicated.#7. Before&the&next&roll,&make&sure&you!follow%the%procedure%for%
adding&new&members&to&the$community#
22 Copyright © 2013 National Math + Science Initiative, Dallas, Texas. All rights reserved. Visit us online at www.nms.org.
LE
SS
ON
C
ON
SU
MA
BL
E
Environmental Science – Survival of the SweetestEnvironmental Science – Survival of the Sweetest
23Copyright © 2013 National Math + Science Initiative, Dallas, Texas. All rights reserved. Visit us online at www.nms.org.
LE
SS
ON
C
ON
SU
MA
BL
E
23
Environmental Science – Survival of the SweetestEnvironmental Science – Survival of the Sweetest
ITEM 2 – SHORELINE MODEL, PART I

24 Copyright © 2013 National Math + Science Initiative, Dallas, Texas. All rights reserved. Visit us online at www.nms.org.
LE
SS
ON
C
ON
SU
MA
BL
E
Environmental Science – Survival of the SweetestEnvironmental Science – Survival of the Sweetest
25Copyright © 2013 National Math + Science Initiative, Dallas, Texas. All rights reserved. Visit us online at www.nms.org.
LE
SS
ON
C
ON
SU
MA
BL
E
25
Environmental Science – Survival of the SweetestEnvironmental Science – Survival of the Sweetest
ITEM 3 – SHORELINE MODEL, PART II
1
2 3
4 5
6
7 8
9 10
11
12
13
14
15
16
17
18
19
20
21
22
23
24
25
26
27
28
29
30
31
32
33
34
35
36
37
38
39
40
41
42
43
44
45
46
47
48
49
50

26 Copyright © 2013 National Math + Science Initiative, Dallas, Texas. All rights reserved. Visit us online at www.nms.org.
LE
SS
ON
C
ON
SU
MA
BL
E
Environmental Science – Survival of the Sweetest