susan e. minkoff thanks to: noemi petra, john zweck ...rostamia/umbcposter/gallery/minkoff... ·...

1
MATHEMATICAL MODELING FOR THE NEXT GENERATION OF T RACE GAS S ENSORS Susan E. Minkoff Thanks to: Noemi Petra, John Zweck, Michael Reid (UMBC), Anatoliy Kosterev, Frank Tittel, James. H. Doty III, and David Thomazy (Rice University) MIRTHE Goals: To develop trace gas sensors using two new technologies: Quantum Cascade Lasers (QCL’s) – see ex- hibit by Claire Gmachl (Princeton) Quartz-Enhanced PhotoAcoustic Spec- troscopy (QEPAS) developed by Kosterev and Tittel at Rice University. NSF ENGINEERING RESEARCH CENTER:MID–I NFRARED TECH- NOLOGIES FOR HEALTH AND THE ENVIRONMENT (MIRTHE) Non-invasive disease diagnosis (e.g., liver disease and lung cancer) using breath bio- markers. Environmental and industrial monitoring us- ing networks of sensors (e.g., monitoring of atmospheric carbon dioxide levels). Homeland security (e.g., chemical weapon detection at airports, train stations, etc). APPLICATIONS In 1888 Alexander Graham Bell discovered the photoacoustic effect: * Specifically that periodic absorption of light by matter produces sound. * He used this phenomenon to develop a wireless communication device. Since light is only absorbed by the gas at par- ticular wavelengths the photoacoustic effect can detect trace gases. In the 1970’s PAS was used to detect nitric oxide in the stratosphere which was proof of ozone depletion by man-made chemicals. PHOTOACOUSTIC SPECTROSCOPY (PAS) QEPAS Sensors detect the sound produced in PAS us- ing a quartz tuning fork (like the one in your watch) to amplify and detect the sound wave. QEPAS Greater sensitivity due to the strong absorp- tion by simple molecules in the infrared spec- trum and the power of QCL’s. Rugged and small in size portable Cost Effective can be deployed in sensor networks. Left: Actual QEPAS sensor device. Right: Schematic diagram of QEPAS device for simulation. ADVANTAGES OF QEPAS WITH QCL’ S OVER PREVIOUS TECHNIQUES Goals: Increase physical understanding of QEPAS, Optimize design of sensors. Outline of Model The interaction of the laser and the trace gas generates a sound wave which we model us- ing a forced acoustic wave equation. 0 0.5 1 1.5 2 0 0.1 0.2 r (mm) Amplitude (mPa) f = 32.8 kHz (Exact) f = 32.8 kHz (Approx.) f = 4.25 kHz Simulated acoustic pressure wave as a function of radial distance from laser beam. The sound wave excites a vibration of the quartz tuning fork. Left: The displacement of the 32.8 kHz tuning fork. The red and blue colors show the maximum and minimum displacement, re- spectively. Right: The first principal stress. The stress is largest (red) where the tines of the tuning fork meet the base. The photoelectric effect in quartz converts this vibration to an electric current whose strength is proportional to the concen- tration of the trace gas. AMATHEMATICAL MODEL FOR QEPAS SENSORS Left: Mathematical Modeling Group (John Zweck, Noemi Petra, Susan Minkoff). Right: Experimental Group (Lei Dong, Anatoliy Kosterev, Jim Doty, Christian Zaugg; Not shown: Frank Tittel and David Thomazy). PROJECT PARTICIPANTS 0 1 2 3 4 5 0 0.2 0.4 0.6 0.8 1 Beam Position (mm) Normalized Signal Theory Exp 450 Torr Exp 60 Torr Normalized amplitude of the piezoelectric current as a function of the vertical position of the laser beam for a QEPAS sensor with a 32.8 kHz tuning fork. We used experiments and computer simulation to find the po- sition that produces the largest current. These results validate the model and confirm the optimal placement of the laser beam. SENSOR OPTIMIZATION The heat generated by absorption of light can be directly detected using a tuning fork. ROTADE and QEPAS are complementary techniques operating in different pressure regimes. Experiments and simulations show that the laser must be positioned close to the walls of the tuning fork and near the base of the tines. 0 0.5 1 1.5 0.5 1 1.5 Source position (mm) Normalized signal strength 0 0.5 1 1.5 0.5 1 1.5 Source position (mm) Normalized signal strength Left: The normalized experimental signal strength vs the position of the laser beam. Right: the numerically computed signal strength vs laser position. Experimental Results. Left: tuning fork image depicting transmit- ted power and signal as a function of beam position for 300 torr of pure CO 2 . Observed signal primarily due to photoacoustic effect. Right: tuning fork (in black) shows the signal due to ROTADE as a function of beam position at a reduced pressure of 20 torr of pure CO 2 . We plan to use the models to improve performance of both methods by optimizing the geometry of the tuning fork. RESONANT OPTOTHERMOA- COUSTIC DETECTION (ROTADE) This research was funded by the National Science Foundation un- der Grant No. EEC-0540832. ACKNOWLEDGEMENT

Upload: hatuyen

Post on 09-May-2018

217 views

Category:

Documents


2 download

TRANSCRIPT

MATHEMATICAL MODELING FOR THE NEXT GENERATIONOF TRACE GAS SENSORS

Susan E. MinkoffThanks to: Noemi Petra, John Zweck, Michael Reid (UMBC),

Anatoliy Kosterev, Frank Tittel, James. H. Doty III, and David Thomazy (Rice University)

MIRTHE Goals: To develop trace gas sensors usingtwo new technologies:

• Quantum Cascade Lasers (QCL’s) – see ex-hibit by Claire Gmachl (Princeton)

• Quartz-Enhanced PhotoAcoustic Spec-troscopy (QEPAS) developed by Kosterevand Tittel at Rice University.

NSF ENGINEERING RESEARCHCENTER: MID–INFRARED TECH-

NOLOGIES FOR HEALTH ANDTHE ENVIRONMENT (MIRTHE)

• Non-invasive disease diagnosis (e.g., liverdisease and lung cancer) using breath bio-markers.

• Environmental and industrial monitoring us-ing networks of sensors (e.g., monitoring ofatmospheric carbon dioxide levels).

• Homeland security (e.g., chemical weapondetection at airports, train stations, etc).

APPLICATIONS

• In 1888 Alexander Graham Bell discoveredthe photoacoustic effect:

∗ Specifically that periodic absorption oflight by matter produces sound.

∗ He used this phenomenon to develop awireless communication device.

• Since light is only absorbed by the gas at par-ticular wavelengths the photoacoustic effectcan detect trace gases.

• In the 1970’s PAS was used to detect nitricoxide in the stratosphere which was proof ofozone depletion by man-made chemicals.

PHOTOACOUSTIC SPECTROSCOPY (PAS)

QEPAS Sensors detect the sound produced in PAS us-ing a quartz tuning fork (like the one in your watch)to amplify and detect the sound wave.

QEPAS

• Greater sensitivity due to the strong absorp-tion by simple molecules in the infrared spec-trum and the power of QCL’s.

• Rugged and small in size → portable

• Cost Effective → can be deployed in sensornetworks.

Left: Actual QEPAS sensor device. Right: Schematic diagram ofQEPAS device for simulation.

ADVANTAGES OF QEPAS WITHQCL’S OVER PREVIOUS TECHNIQUES

Goals:

• Increase physical understanding of QEPAS,

• Optimize design of sensors.

Outline of Model

• The interaction of the laser and the trace gasgenerates a sound wave which we model us-ing a forced acoustic wave equation.

0 0.5 1 1.5 2 0

0.1

0.2

r (mm)

Am

plitu

de (

mP

a)

f = 32.8 kHz (Exact)f = 32.8 kHz (Approx.)f = 4.25 kHz

Simulated acoustic pressure wave as a function of radial distancefrom laser beam.

• The sound wave excites a vibration of the quartz tuning fork.

Left: The displacement of the 32.8 kHz tuning fork. The red andblue colors show the maximum and minimum displacement, re-spectively. Right: The first principal stress. The stress is largest(red) where the tines of the tuning fork meet the base.

• The photoelectric effect in quartz converts this vibration to anelectric current whose strength is proportional to the concen-tration of the trace gas.

A MATHEMATICAL MODELFOR QEPAS SENSORS

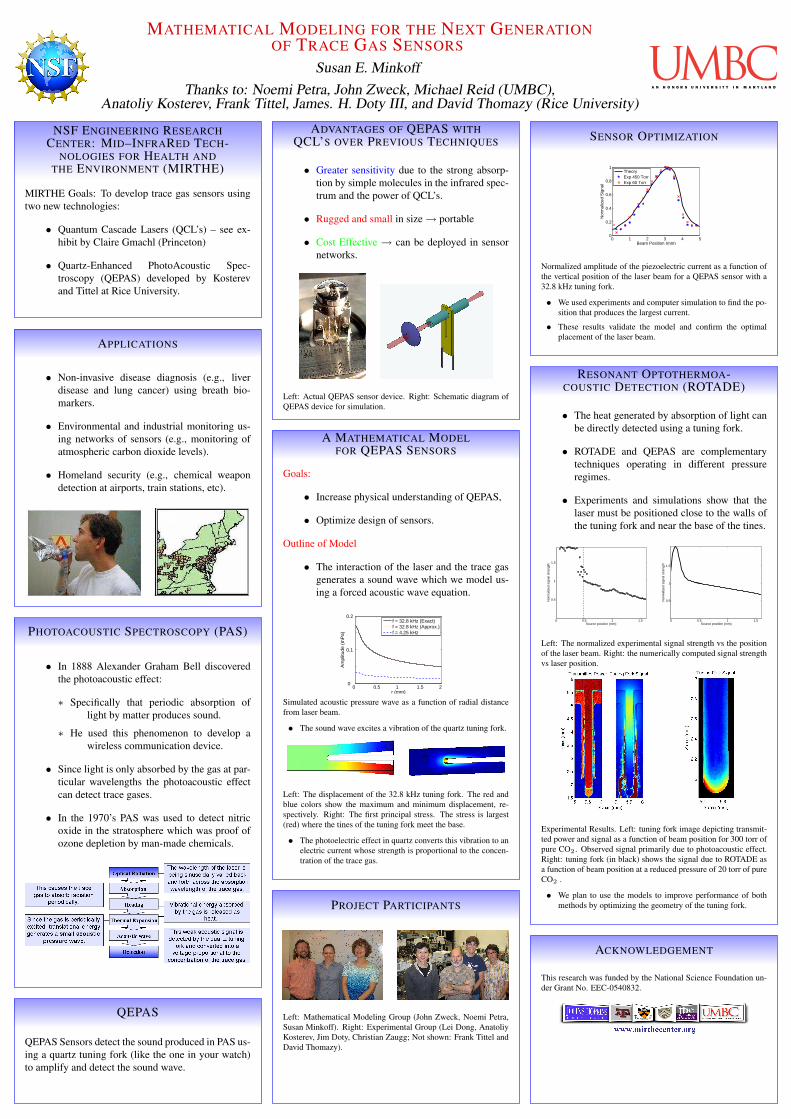
Left: Mathematical Modeling Group (John Zweck, Noemi Petra,Susan Minkoff). Right: Experimental Group (Lei Dong, AnatoliyKosterev, Jim Doty, Christian Zaugg; Not shown: Frank Tittel andDavid Thomazy).

PROJECT PARTICIPANTS

0 1 2 3 4 50

0.2

0.4

0.6

0.8

1

Beam Position (mm)

Nor

mal

ized

Sig

nal

TheoryExp 450 TorrExp 60 Torr

Normalized amplitude of the piezoelectric current as a function ofthe vertical position of the laser beam for a QEPAS sensor with a32.8 kHz tuning fork.

• We used experiments and computer simulation to find the po-sition that produces the largest current.

• These results validate the model and confirm the optimalplacement of the laser beam.

SENSOR OPTIMIZATION

• The heat generated by absorption of light canbe directly detected using a tuning fork.

• ROTADE and QEPAS are complementarytechniques operating in different pressureregimes.

• Experiments and simulations show that thelaser must be positioned close to the walls ofthe tuning fork and near the base of the tines.

0 0.5 1 1.5

0.5

1

1.5

Source position (mm)

Nor

mal

ized

sig

nal s

tren

gth

0 0.5 1 1.5

0.5

1

1.5

Source position (mm)

Nor

mal

ized

sig

nal s

tren

gth

Left: The normalized experimental signal strength vs the positionof the laser beam. Right: the numerically computed signal strengthvs laser position.

Experimental Results. Left: tuning fork image depicting transmit-ted power and signal as a function of beam position for 300 torr ofpure CO2 . Observed signal primarily due to photoacoustic effect.Right: tuning fork (in black) shows the signal due to ROTADE asa function of beam position at a reduced pressure of 20 torr of pureCO2 .

• We plan to use the models to improve performance of bothmethods by optimizing the geometry of the tuning fork.

RESONANT OPTOTHERMOA-COUSTIC DETECTION (ROTADE)

This research was funded by the National Science Foundation un-der Grant No. EEC-0540832.

ACKNOWLEDGEMENT