sustainability in the s e ranking to identify/i m ... · bradesco financial institution natura...
TRANSCRIPT

Chapter 13
SUSTAINABILITY IN THE STOCK EXCHANGE:
A RANKING TO IDENTIFY/INVEST IN MORE
SUSTAINABLE BUSINESSES
Carlos A. Di Agustini a, Biagio F. Giannetti b, Cecilia M. V. B. Almeida b, Feni Agostinho b
and Fábio Sevegnani b
a Fundação Getulio Vargas, São Paulo, Brazil
b Paulista University, São Paulo, Brazil
ABSTRACT
Economic sectors are ranked according to the environmental dimensions of the Corporate Sustainability Index BMF&BOVESPA. The interference of each sector in the biosphere is measured scientifically. All sectors evaluated depend on the use of natural resources and pollution potential, including the use of renewable resources, non-renewable resources, economic inputs; energy, water and occupied area (acreage, pasture, building area, sea and forests); adverse impacts to human health and the issue of toxic pollution and greenhouse gases. This chapter presents the estimated impact of sectors in proportion to their economic scale; ranking them according to the Law No. 10,165 criteria (low, moderate and high), pointing their interference on the biosphere (environmental dimension).The methodologies employed include pollution, ecological footprint, emergy analysis and life-cycle assessment, and were selected to establish the sectors’ ranking, posing a new classification and depicting sectors that should be the object of stakeholders’ attention. A ranking of companies, built through an emergy evaluation, highlights resources usage. Scientific measurement methodologies (able to physically reach the ecosystems’ limits and measure the interference of productive activities on the biosphere) are the safest way to assess the environmental sustainability.

1. INTRODUCTION The biosphere provides to the anthropogenic production system all inputs
and a huge variety of free environmental resources. It is the main supplier for all production systems, which emits no invoice and does not charge overtime when working beyond its limits.
The concern on the environmental sustainability in several areas of study, together with the pressure exerted by anthroposphere on the ecosphere, has been raising awareness about the interference of the production systems in natural ecosystems.
Many efforts are employed by business managers and investors seeking sustainability, but the complex relationship between the biosphere and productive systems cannot be measured by metrics only based on currency gains and depletion of natural resources (Gaye, 2007). Scientific indicators are necessary to assess the use of resources and the impacts of production systems.
In the last few years, the demand for investment in sustainable companies is being strengthened and is served by several instruments in domestic and international market. Given this demand, in Brazil, the Corporate Sustainability Index (CSI) was created in 2005, a pioneering initiative in Latin America. The Index is a tool for comparative analysis of the performance of companies listed on the Stock Exchange, Mercantile and Future Exchange (BM&FBOVESPA). The purpose of this index is to be compatible with the demands of sustainable development of society and encourage more sustainable practices in businesses.
Sustainable companies aggregate value to shareholders’ investments in the long run, because they are better prepared to face economic, social and environmental risks, and CSI acts as a quality label, recognized by the market, certifying that the company operates towards sustainability.
In this chapter, the estimated impact of industrial sectors, differentiated by their economic scale are classified according to the Law No.10,165 criteria (low, moderate and high), pointing their interference in the biosphere (environmental dimension). A ranking for sectors is proposed with the aid of measures that include pollution, ecological footprint, emergy analysis and life-cycle assessment. A new classification depicts the sectors that should be object of stakeholders’ attention.

2. THEORETICAL BACKGROUND The term indicator originates from the Latin indicare, which means to
point out, to advertise and / or to estimate (Hammond et al., 1995). According to Gallopin (1996), the most relevant indicators are those that summarize and simplify information making certain that complex phenomena occurred in the real world become more apparent - an important aspect in the issue of sustainability.
Indicators partially reflect reality and have imperfections and associated uncertainties (Meadows, 1998). Most of them rely on conceptual models and / or simplified measurements and are based on researchers’ values and perspectives. Tunstall (1994) supports the use of indicators based on its main functions:
To evaluate conditions; To evaluate tendencies related to goals and objectives; To supply information and advertise; and To anticipate future conditions and tendencies.
2.1. Measuring Sustainability For Collen et al. (2008), metrics and indicators for measuring complex
variables, such as sustainability, eventually present operational difficulties. For example, measuring the planet's ecosystems requires allocation of estimates and analogies. Estimates, by their nature, are controversial and disputed, mainly because the degree of subjectivity to which they are associated. When seeking to quantify natural resources using monetary values, these difficulties are aggravated, since the degree of subjectivity is even greater.
The selection of variables and indicators for a given system is inevitably fraught with subjectivity, given that the concept of sustainability is still under quarrel and varies according to different lines of research (Wilson et al., 2006), scientific fields and political interests.
There are several metrics, indicators and tools proposed for measuring sustainability. According Kerk & Manuel (2008), no current metrics provide a comprehensive insight into all relevant aspects of sustainability in a transparent, simple and easy to understand way. Despite that, sustainability indicators are increasingly recognized as useful subsides in policy-making, decision and public communication, gathering information on countries,

economic sectors, companies, products and processes, and their performance on environmental, economic and social dimensions.
According to Pulselli et al. (2008) when analyzing a sustainability measurement, given the complexity of the processes, the indicator must meet and address the following requirements:
based on sound scientific basis recognized by the international
community; relevant to encompass the crucial aspects of sustainable development,
including local and global issues; clear to be understood by non-specialized public on the issue, despite
its complexity; quantifiable and anchored on data available or easy to obtain and
update; and limited in quantity depending on the purpose of use.
2.2. Assessing Sustainability of Investors and Stock Market According to Giannetti (in Di Agustini, 2009), the stock exchange is the
place where companies can raise capital, stimulating entrepreneurial activity and generating capital accumulation. Figure 1 shows the main components of the system investment brokered by the stock exchange. Among the different investment choices, the perceived value of shares and businesses is very important for the investors’ decision making, influenced by liquidity (or the ability to easily turn assets or investments into cash), return and risk, measured with objective and subjective information from the stock exchange and other sources.
Resource and services flows from nature are essential to the functioning of the economic and social systems (Giannetti (in Di Agustini, 2009)). Figure 2 illustrates that the environmental resources can be differentiated in renewable (R) and nonrenewable (N), and that natural resources are not accompanied by cash flows.
From the point of view of the entrepreneur agent, the invested capital (C) enables to acquire and organize goods (G) and labor (L). The investment intensity is based on the expectation of future sales of goods or services that will be produced. This expectation of the entrepreneur is based on the company's plans which are greatly influenced by the market economic conditions. Money circulates only in the right side of Figure 2, being

employed in transactions provided by the market, for services and products. No money is employed in the environmental production, which provides resources and free services such as clean water, fertile soil, good weather conditions, among others, for the support of life in society and the economy.
Figure 1. Representation of capital flows by the stock exchange.

Figure 2. Flows and important components in the valuation of socially responsible investment., where: renewable (R) and nonrenewable (N), capital (C), goods (G) and labor (L).
Figure 2 expands perception of the diagram of Figure 1. Flows and
important components in the sustainability of the system are highlighted with thicker lines (Giannetti, in Di Agustini, 2009).
Since money is used to pay people and never for rewarding environmental contributions, the market value cannot be used to determine the real wealth received from the environment. When environmental resources are abundant, little work is required to obtain them, the costs are low and prices underestimate their actual contribution to the economic system. Moreover, scarce resources in the economic system will have high prices, which are not proportional to their real contribution to the economy. Another important aspect of the socially responsible investor, shown in Figure 2, is the drain that is harmful to the sustainability because it demands resources to treat wastes.
2.3. Corporate Sustainability Index (CSI) The BM&FBOVESPA CSI, created in 2005, is the fourth indicator of this
kind in the world and the first in Latin America. It compares the performance

of companies listed on the BM&FBOVESPA under the sustainability perspective (MARCONDES & BACARJI, 2010). This is a referential stock index for socially responsible investments, comprised of companies that concern to be sustainable in the long-term.
The Advisory Board of CSI is composed by members from the following institutions: Associação Brasileira das Entidades Fechadas de Previdência Complementar (ABRAPP); Associação Nacional de Bancos de Investimentos (ANBID); Associação dos Analistas e Profissionais de Investimento do Mercado de Capitais (Apimec), Bolsa de Valores, Mercadorias e Futuros de São Paulo (BM&FBOVESPA); ETHOS Institute; Instituto Brasileiro de Governança Corporativa (IBGC); International Finance Corporation (IFC); Ministério do Meio Ambiente (MMA) and United Nations Environment Programme (UNEP). The Fundação Getúlio Vargas (FGV) is responsible for the research and methodology of CSI. In the biennium 2009/2010, the CSI was composed of 32 participating companies, as shown in Table 1.
Since its inception in December 2005 until 2011, the CSI underwent higher growth rate than the Ibovespa index, as shown in Table 2. The Bovespa Index (Ibovespa) is compiled as a weighted average of a theoretical portfolio of stocks. It is designed to gauge the stock market’s average performance tracking changes in the prices of the more actively traded and better representative stocks of the Brazilian stock market.
The performance of the Ibovespa Index exceeded the performance of CSI the in the period from 2006 to 2010, but in 2011 the CSI had higher performance than Ibovespa. One possible cause is the perceived value of the CSI by investors only after 2010 (Figure 3).
Figure 3. Behavior of the CSI and the Ibovespa.

Table 1. Companies participating of CSI in the biennium 2009/2010
Company Sector BRF FOODS Food production TELEMAR Telecom services GERDAU Steel and metallurgy ITAUUNIBANCO Financial institution VIVO Telecom services USIMINAS Steel and metallurgy EMBRAER Airplane production BRADESCO Financial institution NATURA Production of cosmetics, hygiene and cleaning CEMIG Production and distribution of electricity ELETROBRAS Production and distribution of electricity SABESP Water supply and sewerage TIM Telecom services DASA Clinical analysis and diagnostic medicine BRASKEM Petrochemical industry FIBRIA Production of pulp and paper SUZANO PAPEL Production of pulp and paper DURATEX Manufacture of chipboard panels CPFL ENERGIA Production and distribution of electricity SUL AMERICA Financial institution TRACTEBEL Production and distribution of electricity CESP Production and distribution of electricity BANCO DO BRASIL Financial institution COPEL Production and distribution of electricity ELETROPAULO Distribution of electricity AES TIETE Production of electricity REDECARD Accreditation transactions with payment cards ENERGIAS BR Production and distribution of electricity EVEN Construction and civil engineering INDS ROMI Machines / tools Industry LIGHT Distribution of electricity COELCE Distribution of electricity
Source: BM&FBOVESPA (2010).

Table 2. Growth rate of CSI and Ibovespa
Growth rate (%) Year CSI Ibovespa
2006 +37.80 +32.90 2007 +40.40 +43.60 2008 -41.10 -41.20 2009 +66.40 +82.60 2010 +5.80 +1.00% 2011 - 6.70% -17.90% Accumulated +87.18 +69.91 Annual average +11.02 +9.24 Monthly average +0.87 +0.74
Source: BM&FBOVESPA (2012).
Table 3. Sectors, their impacts on the environment and relevant environmental according to the CSI classification
Sector Environmental
impact Relevant environmental
aspects Water, Sanitation and Electricity
High Intensive use of natural resources and interference in the territory
Extractive: mining, pulp and paper, oil and gas, steel etc.
High Consumption of natural resources and emissions (manufacturing process)
Transformation: dairy products, personal products, machinery and equipment use, medications etc.
High Consumption of raw materials and emissions (manufacturing process)
Logistics and storage: air, trucking, warehousing services etc.
Moderate Emissions
Service: highway operation, analysis and diagnostics, telephony etc.
Low Consumption of energy, water and materials (administrative proceedings)
Financial sector No classification
Indirect aspects, energy, water and materials
Source: BM&FBOVESPA (2010).
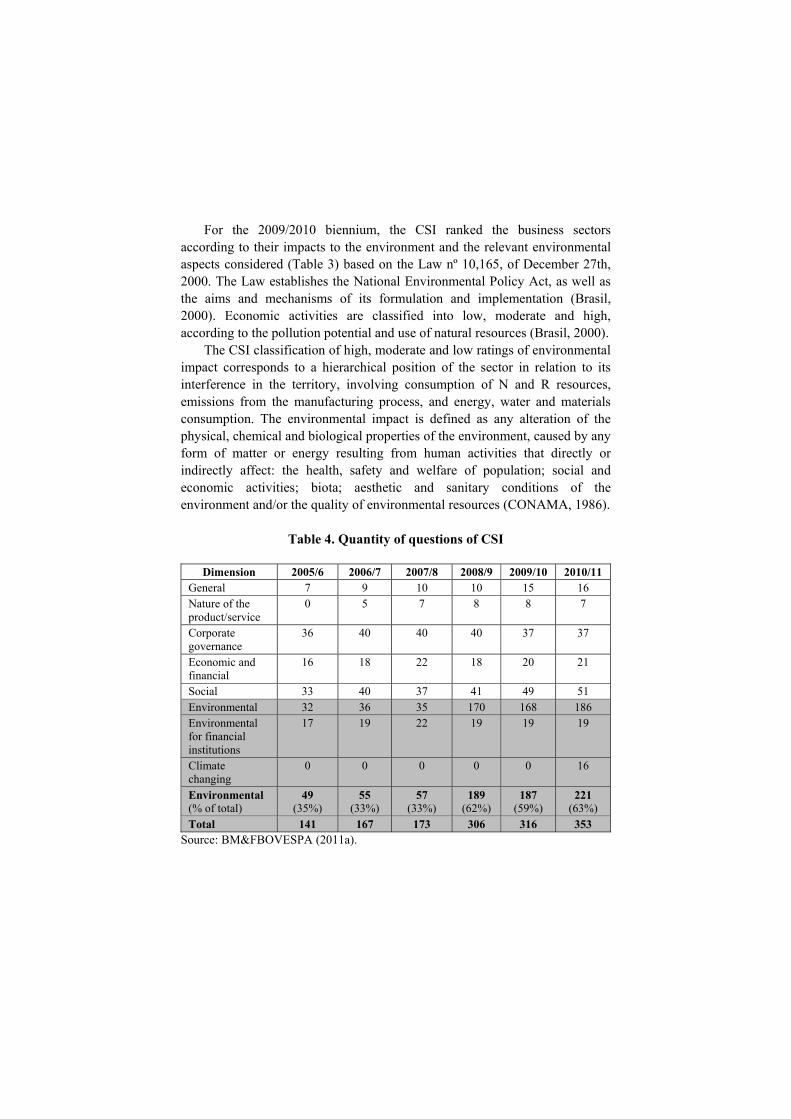
For the 2009/2010 biennium, the CSI ranked the business sectors according to their impacts to the environment and the relevant environmental aspects considered (Table 3) based on the Law nº 10,165, of December 27th, 2000. The Law establishes the National Environmental Policy Act, as well as the aims and mechanisms of its formulation and implementation (Brasil, 2000). Economic activities are classified into low, moderate and high, according to the pollution potential and use of natural resources (Brasil, 2000).
The CSI classification of high, moderate and low ratings of environmental impact corresponds to a hierarchical position of the sector in relation to its interference in the territory, involving consumption of N and R resources, emissions from the manufacturing process, and energy, water and materials consumption. The environmental impact is defined as any alteration of the physical, chemical and biological properties of the environment, caused by any form of matter or energy resulting from human activities that directly or indirectly affect: the health, safety and welfare of population; social and economic activities; biota; aesthetic and sanitary conditions of the environment and/or the quality of environmental resources (CONAMA, 1986).
Table 4. Quantity of questions of CSI
Dimension 2005/6 2006/7 2007/8 2008/9 2009/10 2010/11
General 7 9 10 10 15 16 Nature of the product/service
0 5 7 8 8 7
Corporate governance
36 40 40 40 37 37
Economic and financial
16 18 22 18 20 21
Social 33 40 37 41 49 51 Environmental 32 36 35 170 168 186 Environmental for financial institutions
17 19 22 19 19 19
Climate changing
0 0 0 0 0 16
Environmental (% of total)
49 (35%)
55 (33%)
57 (33%)
189 (62%)
187 (59%)
221 (63%)
Total 141 167 173 306 316 353 Source: BM&FBOVESPA (2011a).

Table 5. Percentage of weight of environmental dimension
Criterion Weight Policies 10.83% Management 40.83% Performance 31.67% Legal compliance 16.67%
Source: ISE Metodologia (2012). The concept of corporate sustainability adopted by CSI involves several
dimensions (Table 4), where environmental dimension represents 62% of total index. From 2011, the BM&FBOVESPA and FGV disclose methodology for CSI calculation, which allows inserting any company on the CSI ranking. Calculations are based on a questionnaire that includes the different dimensions of corporate sustainability. Table 4 shows the various dimensions and the respective number of questions from the questionnaires sent to the companies from 2005 to 2011.
The gray area in Table 4 shows the environmental dimension in the amount of questions CSI from 2005 to 2011, whose representation rose from 35% in 2005 to 63% in 2011, attesting the importance of the environmental dimension. The same weight (100) is assigned to each dimension, and the weights for items that compose the environmental dimension are shown in Table 5, in which is possible to identify that the CSI assigns higher importance to the environmental management.
The CSI portfolio is reviewed annually and its composition is made through pre-selected companies, which respond the questionnaires, and the Advisory Board chooses those with better rankings. In the biennium 2009/2010 the CSI was composed of 15 sectors with 34 companies listed, as shown in Table 6.
Several methodologies are proposed to supply indicators that can measure and guide decision making towards sustainability. Figure 4 summarizes the scope of each methodology used in this work to aid investors in the search for the sustainable company. Dashed lines delimit the scope and the coverage of each methodology to evaluate the economic sectors and their interfaces with ecosystems; stocks of R and N resources, and resources F; customers (beneficiaries), the generation of waste and impacts.

Table 6. CSI sectors and economic scales
Economic scale
Sector CSI 2009 (US$106) Machines / tools Industry 238
Construction 585
Clinical analysis and diagnostic medicine 695
Manufacture of chipboard panels 720
Accreditation transactions with payment cards 1,213
Production of cosmetics, hygiene and cleaning 2,124
Water supply and sewerage 2,456
Airplane production 4,012
Production of pulp and paper 4,983
Petrochemical industry 7,634
Food production 7,963
Steel and metallurgy 18,756
Telecom services 25,939
Production and distribution of electricity 34,089
Financial institution 116,393 Source: BM&FBOVESPA (2011b).
Figure 4. Limits of methodologies.

The limits of coverage for the "indicators of environmental dimension" of Figure 4 indicate that the CSI, Law No. 10,165, the LCA and Ecological Footprint, despite achieving the stocks of N and R resources of the biosphere, do not differentiate N and R resources; treat them as resources of the biosphere as a function of energy use, use water, occupied area and emissions. It is worthy to note that the Emergy Assessment methodology covers more aspects of the interference of production systems on natural ecosystems.
3. METHODS
Sector Ranking To rank the environmental dimension of the CSI sectors, net revenue, in
USD, for the year 2009 was grouped, from 32 member companies in order to calculate the impact of each sector. The actual net sales in Reais of the companies participating in the CSI correspond to the economic scale of each sector (Table 6), converted into the average US dollar in 2009. The impact of each sector is calculated as the multiplication of the weights (intensity) by the net revenue (economic scale) of the CSI sectors. The weights were given (3 = low, 6 = moderate and 9 = high) for the sectors according to their respective environmental impacts (CSI) and relevant environmental aspects (Law nº 10,165).
The next step was to calculate the percentage impact of each CSI sector (Table 7). The columns on the right present data related to incorporated pollution retrieved from the World Bank (Hettige et al. (1994)), Ecological Footprint (Wiedmann et al. (2006)), Emergy Assessment (Brown & Ulgiati (2002)), the Industrial Pollution Projection System (Hettige et al. (1994)) and Life Cycle Assessment (Economic Input-Output Life Cycle Assessment (Hendrickson et al., 1998).
From the calculated impact of each CSI sector, each factor was classified as low, moderate and high, and distributed according to percentile statistical evaluation, in which low, moderate and high were established as: up to 33%, 34% to 66%, and above 67%, respectively.
Each rated sector of the CSI (low, moderate and high) was re-divided within each percentile interval (low (L↓, L→, L↑), moderate (M↓, M→, M↑), and high (H↓, H→, H↑), as shown in Table 8. Weights from 1 to 9 were assigned to each relative interval ranking of the sectors, as shown in Table 9.

Table 7. Data of each CSI sector

Table 8. Ranking of each CSI sector

C. A. Di Agustini, B. F. Giannetti, C. M. V. B. Almeida et al. 16
Table 9. Weight of interval classifications
Relative classification Weight L↓ 1 L→ 2 L↑ 3 M↓ 4 M→ 5 M↑ 6 H↓ 7 H→ 8 H↑ 9
The multiplication of all weights for each sector results in a non-
dimensional number that indicates the magnitude of the sector’s impact that includes:
the potential pollution and use of natural resources according to Law
nº 10,165; the impact to the environment and relevant environmental aspects of
the CSI; the toxic pollution generated (air, land and water) by the inventory of
the Industrial Pollution Projection System (IPPS); the energy use and occupied area (crop area, pasture, building area,
sea and forests) calculated by the ecological footprint; the use of N and R resources and harmful impacts to human health
(Is) by the emergy evaluation; and the greenhouse gases in CO2 equivalents, inventoried by LCA.
4. RESULTS The last column of Table 10 shows the non-dimensional indicative of the
the magnitude of the sector’s impact. It considers the environmental impacts defined by Law nº 10,165 and the other important environmental dimensions that include, especially, the intensive use of renewable resources, which leads to company/industry in a favorable direction towards sustainability (Daly, 1996 and Giannetti et al. 2007b). The final ranking and classification of the CSI sectors is presented in Table 11.

Table 10. Final assessment results of each sector by considering the impacts weights

Table 11. Final ranking and classification of CSI sectors
Position Sectors of CSI Relative ranking 1 Machines / tools Industry L↓ 2 Clinical analysis and diagnostic medicine L↓ 3 Construction L→ 4 Accreditation transactions with payment cards L↑ 5 Manufacture of chipboard panels L↑ 6 Water supply and sewerage M↓ 7 Production of cosmetics, hygiene and cleaning M↓ 8 Airplane production M→ 9 Production and distribution of electricity M↑ 10 Financial institution M↑ 11 Telecom services H↓ 12 Production of pulp and paper H↓ 13 Food production H→ 14 Petrochemical industry H↑ 15 Steel and metallurgy H↑
Sectors in the highlighted area of Table 11 are those that require more attention from
stakeholders because they present above moderate (M↑) total impact. Table 12 presents the CSI sectors that should be the object of attention from stakeholders due to
presenting critical factors non-aligned to the concept of environmental sustainability. Table 13 presents the CSI sectors that may be subject to performance improvement in the factors
measured by the "indicators of environmental dimension".
Table 12. Critical CSI sectors that require attention
CSI sectors Critical factors of attention Steel and metallurgy
H↑ Moderate generation of toxic pollution (air, land and water), high footprint, high use of N resource, moderate use of R resources, high-impact Is, high consumption of energy and water and high emission of greenhouse gases in CO2eq
Petrochemical industry
H↑ High generation of toxic pollution (air, land and water), high footprint, high use of N resource, average use of R resources, high-impact Is, high
CSI sectors Critical factors of attention
consumption of energy and water and high emission of greenhouse gases in CO2eq
Food production- H→ Moderate generation of toxic pollution (air, land and water), moderate use of N resource, high-impact Is, high energy consumption, moderate water consumption and high emission of greenhouse gases in CO2eq
Production of pulp and paper
H↓ Moderate area occupied, high use of N resource, moderate use of resources R, medium impact Is, high consumption of energy and water and high emission of greenhouse gases in CO2eq
Telecom services H↓ High generation of toxic pollution (air, land and water), low use of R resources, high use of energy and water and moderate emission of greenhouse gases in CO2eq
Financial institution
M↑ Low use of R resources, high footprint, moderate power consumption, high water consumption and moderate emission of greenhouse gases in CO2eq

Production and distribution of electricity
M↑ Moderate use of N resources
Table 13. CSI sectors and factors subject to improvement
CSI sectors Factors subject to improvement
Airplane production M→ High generation of toxic pollution (air, land and water), low use of R resources and moderate consumption of energy and water.
Production of cosmetics, hygiene and cleaning
M↓ High generation of toxic pollution (air, land and water), moderate use of N resource, low use of R resources, moderate power and water consumption and emission of greenhouse gases in CO2e
Water supply and sewerage
M↓ Moderate area occupied, high use of N resource, high-impact Is, moderate energy consumption and high emission of greenhouse gases in CO2e
Manufacture of chipboard panels
L↑ High use of N resource, high-impact Is and moderate water consumption
Accreditation transactions with payment cards
L↑ Low use of R resources and moderate water consumption
Construction L→ Moderate use of N and R resources and moderate emission of greenhouse gases in CO2e
Table 13. (Continued)
CSI sectors Factors subject to improvement Clinical analysis and diagnostic medicine
L↓ Low use of R resource and moderate generation of toxic pollution (air, land and water)
Machines / tools Industry
L↓ Moderate use of N and R resources and moderate impact Is
CONCLUSION The use of methodologies that scientifically measured the interference of the CSI sectors in the
biosphere (environmental dimension) is a challenge for stakeholders toward assessing the sustainability in its environmental dimension.
The aim of this study was to conduct a sector ranking of the environmental dimension of the CSI of BM&FBOVESPA in the biennium 2009/2010 and a way of ranking companies in accordance with the determinations of the Advisory Board of CSI. According to Meadows (1998), one of the most efficient ways to change the behavior of a system is to change the existing indicators, since these can change the perspective of reality.
The calculation of the impact of the sectors and the assessment made by the "indicators of environmental dimension" extend the original classification (low, moderate and high) of the CSI and of Law No. 10,165.
The limits that define the range of tools and methodologies presented in Figure 10 are important for selection of tools and methodologies for measuring the interference of businesses / industries in the biosphere.
The ranking of CSI sectors together with the relative impact rating (intensity x economic scale) the environmental dimension of each sector considering the provisions of Law No. 10,165, the CSI and the assessment made by the "indicators of environmental dimension" should be considered based in the following aspects:

CSI represents companies with a pattern of industrialization and economic scale compatible with companies U.S. and Europe;
the ranking is influenced by the economic scale of the sector. Whereas the impact was obtained by the intensity x economic scale, possible changes in economic scale can change the ranking. Changes in economic scale may occur due to the exit of companies from the CSI and entry of new participants and various other factors that alter the economic scale;
the intensity established in each sector has more perennial nature than the economic scale and may be altered by optimizing production processes, resource substitution by N and R resources and/or resources N from less critical stocks, reducing the impacts Is, reducing the water and energy consumption, reducing generation of toxic pollution (air, land and water), less use of area and reduction of emission of greenhouse gases in CO2e.
REFERENCES
Barret, G. W. & Odum, E. P. (2007). Fundamentos de ecologia. São Paulo: Thomson Learning, São Paulo.
Bm & Fbovespa. Questionário-base do ISE, 2008/2009, Dimensão Ambiental. Disponível em: <http://www.bmfbovespa.com.br/ Indices/download/ ISE_Questionario2009.pdf>. Last access October 2011.
Bm & Fbovespa, (2012). Índice de Sustentabilidade Empresarial – ISE. Composição/Carteira do Índice. Available at: http://www.bmfbovespa. com.br/indices/ResumoCarteiraQuadrimestreISE.aspx?Idioma=pt-br. Last access February 2012.
Brasil. Lei nº 10.165, de 27 de dezembro de 2000. Altera a Lei no 6.938, de 31 de agosto de 1981, que dispõe sobre a Política Nacional do Meio Ambiente, seus fins e mecanismos de formulação e aplicação, e dá outras providências. Diário Oficial [da República Federativa do Brasil], Brasília, 27 dez. 2000.
Brasil. Altera e revoga dispositivos da Lei nº 6.404. Lei nº 11.638 de 28 de dezembro de 2007. Diário Oficial [da República Federativa do Brasil], Brasília, 28 dez. 2007.
Brown, L. R. (2009). Plano B 4.0. Mobilização para salvar a civilização. New Content Editora, São Paulo.
Brown, M. T. & Ulgiati, S. (2002). Emergy Evaluations and Environmental Loading of Electricity Production Systems. Journal of Cleaner Production, 10, 321-334.
Brown, M. T. & Ulgiati, S. (1997). Emergy-based indices and ratios to evaluate sustainability: monitoring economies and technology toward environmentally sound innovation. Ecological Engineering, 9, 51-69.
Collen, B., Goldfinger, S., Kalter, R., McRae, L., Kitzes, J. & Wackernagel, M. (2008). 2010 And Beyond - Rising to the biodiversity challenge. Gland, Switzerland: WWF.
Conama - Conselho Nacional Do Meio Ambiente. (1986). Resolução Conama Nº 001, De 23 De Janeiro De 1986. Diário Oficial [Da República Federativa Do Brasil], Brasília, 17 Fev.
Daly, H. E. (1996). Beyond growth. Beacon Press Books, Boston. Di Agustini, C. A. (2009). Mercado de capitais e análise de ações. Globus Editora, São Paulo. Gallopín, G. C. (1996). Environmental and Sustainability Indicators and the Concept of Situational
Indicators. A System Approach. Environmental Modelling & Assessment, 1, 101-117. Gaye, A. (2007). Contribution to Beyond GDP. Virtual Indicator Expo - Human Development Index
(HDI). International Conference Beyond GDP. Measuring progress, true wealth, and the well-being of nations. Brussels, Belgium.
Giannetti, B. F., Neis, A. M., Bonilla, S. H. & Almeida, C. M. V. B. (2007). Decisões e Sustentabilidade Ambiental. In: COSTA NETO, P. L. O. (Org.). Qualidade e Competência nas Decisões. Edgard Blücher, São Paulo.
Hammond, A., Adriaanse, A., Rodenburg, E., Bryant, D. & Woodward, R. (1995). Environmental Indicators: A Systematic Approach to Measuring and Reporting on Environmental Policy Performance in the Context of Sustainable Development. Washington, D.C.: World Resources Institute.
Hettige, H., Martin, P., Singnh, M. & Wheeler, D. (1994). The Industrial Pollution Projection System. Infrastructure and Agriculture Division, Policy Research Dept. World Bank. Dec.
Hendrickson, C., Horvath, A., Joshi, S. & Lave, L. (1998). Economic Input-Output Models for Environmental Life-Cycle Assessment. Policy Analysis. v.32, I.7, 184 -191.
ISE Metodologia, (2012). Processo de seleção. Available at: http://isebvmf.com.br/index.php?r=site/conteudo&id=9. Last access May 2012.
Kassai, J. R., Feltran-Barbieri, R., Carvalho, L. N. Foschine, A. Cintra, Y. C. & Afonso, L. E. (2012). Balanço contábil das nações: reflexões sobre os cenários de mudanças climáticas locais. Brazilian Business Review. Vitória, Brazil.
Kerk, G. & Manuel, A. (2008). Contribution to Beyond GDP. Virtual Indicator Expo - Sustainable Society Index (SSI): a new comprehensive index for world‐wide use. International Conference Beyond GDP. Measuring progress, true wealth, and the well-being of nations. Brussels, Belgium.
Marcondes, A. W. & Bacarji, C. D. (2010). ISE – Sustentabilidade no Mercado de Capitais. Bm&Fbovespa, Report Editora, São Paulo.
McKelvey, B. (1982). Organizational systematics: traxonomy, evolution, classification. Berkeley: University of California Press.
Meadows, D. (1998). Indicators and information systems for sustainable development. The Sustainability Institute.
Odum, H. T. (1996). Environmental Accounting: Emergy and Environmental Decision Making. Wiley, New York.
Phyllis, D. (1967). Book Reviews: Modern Economic Growth: Rate, Structure and Spread. The Economic Journal, 882-883.
Pulselli, M. F., Bastianoni, S., Marchettini, N. & Tiezzi, E. (2008). The road to sustainability. WIT Press, Boston.
Talberth, J., (2007). Contribution to Beyond GDP. Virtual Indicator Expo - Genuine Progress Indicator (GPI). International Conference Beyond GDP. Measuring progress, true wealth, and the well-being of nations. Brussels, Belgium.
Tunstall, D. (1994). Development and Using Indicators of Sustainability in Africa: an Overview. Prepared for the Network for Environment and Sustainable Development in Africa (NESDA). Thematic Workshop on Indicators of Sustainable Development. Banjul, The Gambia.
Wiedmann, T., Minx, J., Barret, J. & Wackernagel, M. (2006). Allocating ecological footprints to final consumption categories with input-output analysis. Ecological economics, 56, 28-48.
Wilson, J., Tyedmers, P. & elot, R. (2006). Contrasting and comparing sustainable development. Ecological Indicators, 7, 299-314.
World Commission on Environment and Development, (1987). Our common future. Oxford University Press, Oxford and New York.