sustainable development indicators for the · experts who participated in the meeting on...
TRANSCRIPT
Sustainable Development Indicators for the Arab Region Guiding Principles and Methodologies Part 3 Economic Development Indicators
January 2011
i
Disclaimers
The contents and views expressed in this publication do not necessarily reflect the views or policies of the
agencies cooperating in this project.
The opinions, figures and estimates set forth in this publication should not necessarily be considered as
reflecting the view or carrying the endorsement of UNEP or cooperating agencies.
The designations employed and the presentation of material in this publication do not imply the
expression of any opinion whatsoever on the part of UNEP or cooperating agencies concerning the legal
status of any country, territory or city or area of its authorities, or the delineation of its frontiers and
boundaries.
Mention of a commercial company or product in this publication does not imply the endorsement of the
United Nation Environment Programme or cooperating agencies.
The use of information from this publication concerning proprietary products for publicity or advertising
in not permitted. Trademark names and symbols are used in an editorial fashion with no intention of
infringement on trademark or copyright laws
We regret any errors or omissions that may have been unwittingly made.
ii
Acknowledgments
The team acknowledges the Presidency of Meteorology and Environment (PME) of Saudi Arabia for preparing an Arabic draft of the summary of methodologies. UNEP acknowledges the contributions made by many individuals and institutions in the preparation of this document. A special word of thanks goes to Abu Dhabi Global Environmental Data Initiative (AGEDI) for compiling the first draft of the document. We also acknowledge the efforts and support of the League of Arab States for the co-organization of the expert meetings related the core set of sustainable development for the Arab region. We also extend our appreciation to ESCWA and the Islamic Educational, Scientific and Cultural Organization (ISESCO) for their support to the expert meetings. The full list of names to acknowledge is given below. Compiled by: Huda Al Houqani, Khamis Raddad Coordination and Supervision: UNEP: Adel Abdel-Kader and ESCWA: Wafa Aboul Hosn UNEP Extended Team: Yasmina Adra, Hiba Sadaka ESCWA Extended Team: Giovanni Savio, Ismail Lubbad, Wassim Hammoud, Therese El Gemayel, Jala El-Akoum Experts who participated in the meeting on Environmental and sustainable development indicators for the Arab region that was held in Kuwait in 2007 for the selection of core set of environmental indicators Adel Farid Abdel-Kader, Ahmed Mohammed Ali Abdelrehim, Mohammed Abel, Wafa Aboulhosn, Khalil Abdelhameed Abu-Afeefa, Huda Rabee Mohammed Abu Layl, Muna Abdelhafeez Ahmed, Mohammed Ahmed Ali Akber, Khalid Ghanim Nasir Al-Ali, Sayid Abdo Ali, Fuad Ali Abdulrahman Aldood, Mubarak Khalifa Al-Dosari, Mohammed Yihya wild Al-Fadel, Abdulaziz Jasim Al-Hajeri, Hamid Abdo Ahmed Al-Hammadi, Mohammed bin Saif Al-Kalbani, Mohammed Al-Frigui, Mohammed Yaqoob Al-Furaih, Ali Jasim Mohammed Al-Hesabi, Huda Al-Houqani, Mahmoud Ali Moflih Al-Khawaldeh, Hossam Allam, Jomaa Hasan Al-Mansouri, Hamad Issa Hasan Al-Matroushi, Ahmed Salim Saeed Abdullah Al-Medhani, Rashid Abdulrahman Al-Noaimi, Khawla Mohammed Al-Obaidan, Abdulkarim Habib Abdulmajeid Al-Radhi, Mohammed Salih Saeed Al-Sahafi, Faraj Al-Taleb, Ainache Abdulrahman Atman, Hasan Albanna Awad, Sameera Alnafzy Bin Jrad, Ramzi Fanous, Ali Abbas Haidar, Hametal Wild Ibno Ammar, Safwat Salaheldin Ibrahim, Mohammed Ismail Mohammed Ismail, Bensouda Karimah, Mazen Malkaweh , Mohammed Mirreh , Huda Hadawy Mohammed, Rola Nasreddine, Sameera Moftah Naseeb, Damnati Adib Nazha, Ameen Mohammed Qaid, Tariq Sadiq, Faisal Abdullah Saif-Ahmed, Gassan Salih, Shahira Hasan, Ahmed Wahbi

iii
Content METHODOLOGICAL STRUCTURE 1 THEME 13: ECONOMIC DEVELOPMENT 2
SUB-THEME: MACROECONOMIC PERFORMANCE 3 SUB-THEME: SUSTAINABLE PUBLIC FINANCE 19
THEME 13: ECONOMIC DEVELOPMENT 22 SUB-THEME: EMPLOYMENT 22 SUB-THEME: EMPLOYMENT 28 SUB-THEME: INFORMATION AND COMMUNICATION TECHNOLOGIES 44 SUB-THEME: TOURISM 53
THEME 14: GLOBAL PARTNERSHIP 63 SUB-THEME: TRADE 64 SUB-THEME: EXTERNAL FINANCING 70
THEME 15: CONSUMPTION AND PRODUCTION PATTERNS 80 SUB-THEME: MATERIAL CONSUMPTION 81 SUB-THEME: MATERIAL CONSUMPTION 84 SUB-THEME: ENERGY USE 88 SUB-THEME: WASTE GENERATION AND MANAGEMENT 103 SUB-THEME: TRANSPORTATION 116

1
Methodological Structure
THEME/SUBTHEME 1- INDICATOR Name Brief Definition Unit of Measurement Placement in the CSD Indicator set 2- POLICY RELEVANCE Purpose Relevance to Sustainable/Unsustainable Development (theme/sub-theme) International Conventions and Agreements International Targets/Recommended Standards Linkages to Other Indicators 3- METHODOLOGICAL DESCRIPTION Underlying Definitions and Concepts Measurement Methods Limitations of the Indicator Status of Methodology Alternative Definitions/Indicators 4- ASSESSMENT DATA Data Needed to Compile the Indicator National and International Data Availability and Sources Data References 5- AGENCIES INVOLVED IN THE DEVELOPMENT OF THE INDICATOR Lead Agency Other Contributing Organizations 6- REFERENCES Readings Internet site
2
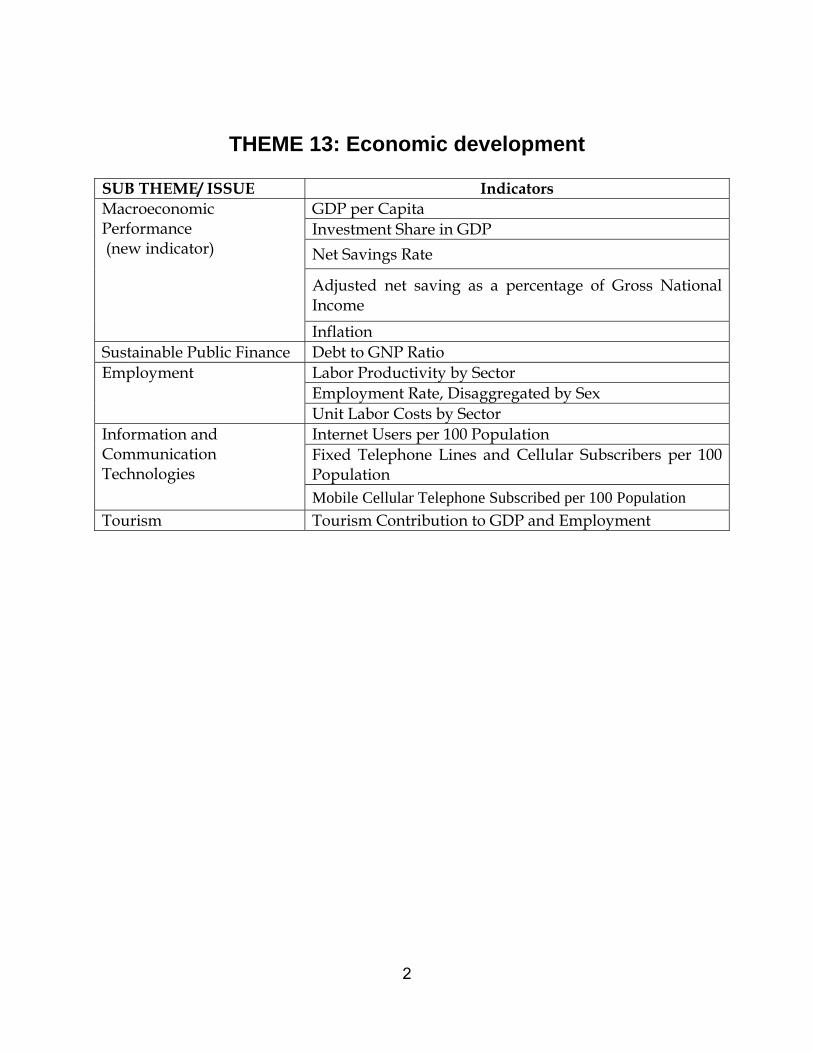
THEME 13: Economic development SUB THEME/ ISSUE Indicators Macroeconomic Performance (new indicator)
GDP per Capita Investment Share in GDP Net Savings Rate
Adjusted net saving as a percentage of Gross National Income Inflation
Sustainable Public Finance Debt to GNP Ratio Employment Labor Productivity by Sector
Employment Rate, Disaggregated by Sex Unit Labor Costs by Sector
Information and Communication Technologies
Internet Users per 100 Population Fixed Telephone Lines and Cellular Subscribers per 100 Population Mobile Cellular Telephone Subscribed per 100 Population
Tourism Tourism Contribution to GDP and Employment
3
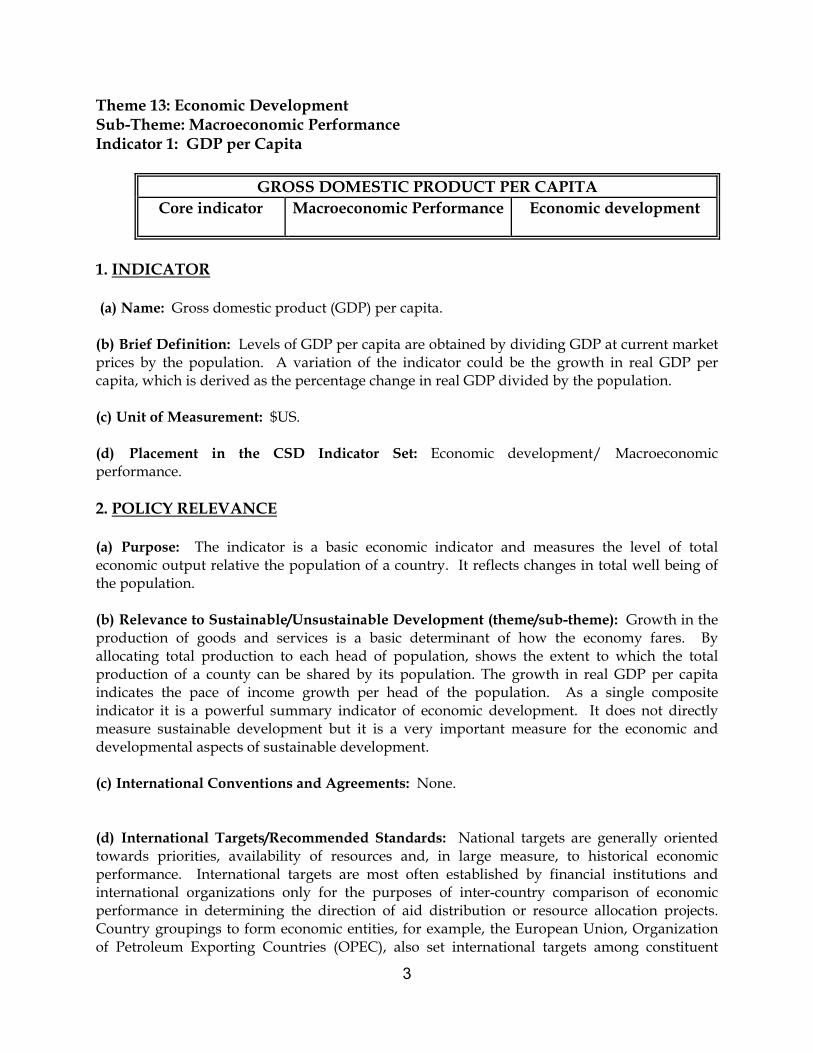
Theme 13: Economic Development Sub-Theme: Macroeconomic Performance Indicator 1: GDP per Capita
GROSS DOMESTIC PRODUCT PER CAPITA Economic development Macroeconomic Performance Core indicator
1. INDICATOR (a) Name: Gross domestic product (GDP) per capita. (b) Brief Definition: Levels of GDP per capita are obtained by dividing GDP at current market prices by the population. A variation of the indicator could be the growth in real GDP per capita, which is derived as the percentage change in real GDP divided by the population. (c) Unit of Measurement: $US.
(d) Placement in the CSD Indicator Set: Economic development/ Macroeconomic performance. 2. POLICY RELEVANCE (a) Purpose: The indicator is a basic economic indicator and measures the level of total economic output relative the population of a country. It reflects changes in total well being of the population. (b) Relevance to Sustainable/Unsustainable Development (theme/sub-theme): Growth in the production of goods and services is a basic determinant of how the economy fares. By allocating total production to each head of population, shows the extent to which the total production of a county can be shared by its population. The growth in real GDP per capita indicates the pace of income growth per head of the population. As a single composite indicator it is a powerful summary indicator of economic development. It does not directly measure sustainable development but it is a very important measure for the economic and developmental aspects of sustainable development.
(c) International Conventions and Agreements: None. (d) International Targets/Recommended Standards: National targets are generally oriented towards priorities, availability of resources and, in large measure, to historical economic performance. International targets are most often established by financial institutions and international organizations only for the purposes of inter-country comparison of economic performance in determining the direction of aid distribution or resource allocation projects. Country groupings to form economic entities, for example, the European Union, Organization of Petroleum Exporting Countries (OPEC), also set international targets among constituent
4
members to serve as guidelines in setting priorities for national policy. . Moreover, the United Nations uses per capita income to determine the level of relief allowance for countries and in its formulation of the scale of assessments of member states. (e) Linkages to Other Indicators: As a highly aggregated composite measure, this indicator has close links with many, more disaggregated indicators. Examples would include population growth, net migration, other GDP indicators, land use change, arable land per capita, and forest area. 3. METHODOLOGICAL DESCRIPTION
(a) Underlying Definitions and Concepts: GDP as described in the 1993 SNA can be derived in three ways: Firstly, it is the sum total value added of all production units including all taxes and subsidies on products which are not included in the valuation of output. It is also equal to the sum of final uses of goods and services measured in purchasers' prices, less the value of imports of goods and services. Finally, it can be measured as the sum of primary incomes distributed by resident producer units. (b) Measurement Methods: The current price estimates of GDP are adjusted to GDP at constant prices using appropriate price deflators. Real GDP can also be derived by extrapolating total value added in the base year with production indicators in physical terms. GDP divided by population estimates enable the conversion of GDP to per capita levels. ,. (c) Limitations of the Indicator: As a necessary condition to being a key economic performance indicator of sustainable development, one of the often-cited limitations of GDP is that it does not account for the social and environmental costs of production; it therefore is not a good measure of the level of over-all well being. For example, GDP per capita reveals nothing concerning energy and material interactions with the environment. (d) Status of Methodology: The 1993 System of National Accounts (SNA) provides international standards for national accounts. There may be some differences in national accounting and demographic reporting procedures and practices between countries. One other possible drawback could be the comparability of price information used in deflating current price data and technical differences in the choice of base year for the original data. Additionally, a considered basic limitation is related to the conversion of GDP into a common denomination as a result of current misalignments in exchange rates for some countries vis-à-vis the comparator currency (US dollar) particularly for those countries in transition whose market exchange rates produce unrealistic levels of GDP, making any meaningful inter-country interpretation difficult. (e) Alternative Definitions/Indicators: Economic indicators that measure the achievement of higher levels of goods and services more efficiently are better indicators of sustainable development. Consumption trends are better reflected by such indicators as final consumption expenditure by households as used in the USA. Such indicator can be derived from the SNA. The GDP indicator and its GDP growth variant may be broken down by economic activity. Such indicator, expressed as value added per (main) economic activity, can also be derived from the SNA and provides information on shifts in economic structure in general and the degree of
5
industrialization in particular. 4. ASSESSMENT OF DATA (a) Data Needed to Compile the Indicator: The conversion rates used by the UN Statistics Division (UNSD) are normally the market or blended rates of exchange obtained from the International Monetary Fund (IMF). In some cases, use is made of UN operational rates that are established primarily for the settlement of administrative transactions between host countries and the UN. In very unique circumstances the use of purchasing power parities (PPP) or price-adjusted rates of exchange (PARE) is necessary. The World Bank also uses a special exchange rate where the official exchange rate produces distortion in the dollar levels of GDP. (b) National and International Data Availability and Sources: The indicator has no serious limitations in terms of data availability. The principal data elements for a majority of countries are mostly and regularly available from national and international sources on a historical basis. Internationally accepted conceptual guidelines, are also available to assist with the compilation of the indicator. Annual GDP data in current and constant prices are generally reported by national statistical offices or central banks through the United Nations National Accounts Questionnaire (UN NAQ) and supplemented by estimates prepared by the UN as well as other international organizations such as the World Bank and the IMF. The Organization for Economic Co-operation and Development (OECD) compiles quarterly GDP estimates for its Members. Population data are mainly obtained either through censuses or surveys. These are supplemented by growth estimates prepared by the UN Population Division.
(c) Data References: Comprehensive national accounts statistics are published by the UN in the series National Accounts Statistics: Main Aggregates and Detailed Tables. A historical series of GDP is available from the national accounts database of the UN Statistics Division. Population data and projections are available in the World Population Prospects published by the Population Division of the UN Department of Economic and Social Affairs. Exchange rates are published by the IMF in International Financial Statistics. 5. AGENCIES INVOLVED IN THE DEVELOPMENT OF THE INDICATOR (a) Lead Agency: The lead agency is the United Nations Department of Economic and Social Affairs (DESA). The contact point is the Director, Statistics Division, DESA; fax no. (1 212) 963 9851. (b) Other Contributing Organizations: None. 6. REFERENCES
(a) Readings: The 1993 SNA provides international standards on national accounts and is the product of collaborative efforts between EUROSTAT, IMF, OECD, UN and the World Bank.

6
(b) Internet site: United Nations Statistics Division: http://www.un.org/Depts/unsd
7
Theme 13: Economic Development Sub-Theme: Macroeconomic Performance Indicator 2: Investment Share in GDP (NC)
INVESTMENT SHARE IN GROSS DOMESTIC PRODUCT Economic development Macroeconomic Performance Core indicator
1. INDICATOR (a) Name: Investment Share in Gross Domestic Product (GDP). (b) Brief Definition: This indicator refers to the share of investment in total production. It is obtained by calculating gross capital formation as percentage of gross domestic product. (c) Unit of Measurement: Per cent. (d) Placement in the CSD Indicator Set: Economic development/ Macroeconomic performance. 2. POLICY RELEVANCE (a) Purpose: Investment provides a stimulus to economic development, and the rate of investment reflects the infusion of requisite capital to support the development process. (b) Relevance to Sustainable/Unsustainable Development (theme/sub-theme): This indicator deals with the processes and patterns of economic activities. It is an important element of the sustainable development process in developing countries, aimed at increasing their partnership in the global economy. It reflects an objective aimed at accelerating the pace of development. (c) International Conventions and Agreements: None. (d) International Targets/Recommended Standards: None. National targets for investment share in GDP are usually included in government policy as a basis for budget funding programmes and for priority-setting exercises. (e) Linkages to Other Indicators: This indicator is closely linked with other measures of economic development, such as GDP per capita and capital labor ratio. 3. METHODOLOGICAL DESCRIPTION (a) Underlying Definitions and Concepts: Gross capital formation (investment) is defined in the System of National Accounts (SNA) as the total value of gross fixed capital formation plus changes in inventories and acquisitions less disposal of valuables. Gross fixed capital formation is the total value of produced assets used in the production process for more than one year.

8
(b) Measurement Methods: Gross capital formation at purchasers’ prices as percentage of gross domestic product at purchasers’ prices. (c) Limitations of the Indicator: Investment in SNA terms, as in this indicator, constitutes only investment on produced assets. Any expenditure on non-produced assets, for example, land or payments for education and health that enhance the quality of human capital are not included. (d) Status of the Methodology: The concepts of gross capital formation and GDP are standardized in the SNA and, therefore, comparable between countries. (e) Alternative Definitions/Indicators: An alternative indicator would be one which would identify selected investment expenditures by sector, such as environmental protection, health and education, housing, nutrition, etc., that are individually considered relevant to sustainable development. A second alternative would report the indicator using only gross fixed capital formation. 4. DATA ASSESSMENT (a) Data Needed to Compile the Indicator:
(i) Gross capital formation at purchasers’ prices;
(ii) Gross domestic product at purchasers’ prices.
(b) National and International Data Availability and Sources: Data is of reasonable quality and commonly available from national sources on a historical basis. Data on gross capital formation and GDP are generally reported by national statistical offices or central banks to the United Nations Statistics Division (UNSD) through the United Nations National Accounts Questionnaire (UN NAQ). These are supplemented by estimates prepared by the UNSD as well as other international organizations, such as the World Bank and the International Monetary Fund (IMF). (c) Data References: National accounts statistics are published in the series National Accounts Statistics: Main Aggregates and Detailed Tables. 5. AGENCIES INVOLVED IN THE DEVELOPMENT OF THE INDICATOR (a) Lead Agency: The lead agency is the United Nations Department of Economics and Social Affairs (DESA). The contact point in terms of SNA references as well as data compilation on an international level is the Director, Statistics Division, DESA; fax no. (1 212) 963 9851. (b) Other Contributing Organizations: None.

9
6. REFERENCES (a) Readings: Further details on the conceptual definitions of gross capital formation and GDP are contained in the System of National Accounts, 1993. (b) Internet site: United Nations Statistics Division: http://www.un.org/Depts/unsd
10
Theme 13: Economic Development Sub-Theme: Macroeconomic Performance Indicator 3: Net Savings Rate
GROSS SAVING Economic development Macroeconomic Performance Core indicator
1. INDICATOR (a) Name: Gross saving (b) Brief Definition: Gross saving is disposable income less consumption. It can be calculated for each institutional sector and the total economy. (c) Unit of Measurement: $US or local currency. (d) Placement in the CSD Indicator Set: Economic development/ Macroeconomic performance. 2. POLICY RELEVANCE (a) Purpose: The indicator is a basic economic indicator and measures the level and extent of resources available for investment in capital assets. (b) Relevance to Sustainable/Unsustainable Development (theme/sub-theme): Saving is closely related to investment. By not using income to buy consumer goods and services, it is possible for resources to instead be invested in productive capital, such as factories and machinery. Saving can therefore be vital to increase the amount of capital available, contributing to sustainable future economic growth. (c) International Conventions and Agreements: None. (d) International Targets/Recommended Standards: National targets are generally included in government policy. (e) Linkages to Other Indicators: This indicator is closely linked with other measures of economic development, in particular gross capital formation and saving as percentage of GDP. 3. METHODOLOGICAL DESCRIPTION (a) Underlying Definitions and Concepts: Gross saving as described in the 1993 SNA can be derived in three ways: Firstly, it is the gross disposable income less consumption. It is also equal to the sum of gross capital formation, net capital inflows from the rest of the world and changes in foreign reserves. Finally, it can be derived from net lending/borrowing to/from the
11
rest of the world by adding gross capital formation and net capital transfers to the rest of the world. Net lending/borrowing to/from the rest of the world, in turn, can be obtain from the rest of the world account as, the current external balance plus net capital transfers from the rest of the world or, the financial account as, the net acquisition of financial assets less net disposal of financial liabilities. (b) Measurement Methods: Gross saving is available only in current prices (c) Limitations of the Indicator: Gross saving does not account for social and environmental conditions. (d) Status of Methodology: The 1993 System of National Accounts (SNA) provides international standards for national accounts. A considered basic limitation is related to the conversion of saving into a common denomination as a result of current misalignments in exchange rates for some countries vis-à-vis the comparator currency (US dollar) particularly for those countries in transition whose market exchange rates produce unrealistic levels of saving, making any meaningful inter-country interpretation difficult. (e) Alternative Definitions/Indicators: An alternative indicator would be net saving (gross saving less consumption of fixed capital) or gross or net saving as per cent of GDP. 4. ASSESSMENT OF DATA (a) Data Needed to Compile the Indicator: The conversion rates used by the UN Statistics Division (UNSD) are normally the market or blended rates of exchange obtained from the International Monetary Fund (IMF). In some cases, use is made of UN operational rates that are established primarily for the settlement of administrative transactions between host countries and the UN. In very unique circumstances the use of purchasing power parities (PPP) or price-adjusted rates of exchange (PARE) is necessary. (b) National and International Data Availability and Sources: The indicator is not generally available for all countries. However, annual saving data in current prices are generally reported by national statistical offices or central banks through the United Nations National Accounts Questionnaire (UN NAQ) and supplemented by estimates prepared by the UN as well as other international organizations such as the World Bank and the IMF. (c) Data References: Comprehensive national accounts statistics are published by the UN in the series National Accounts Statistics: Main Aggregates and Detailed Tables. A historical series of saving is available from the national accounts database of the UN Statistics Division. 5. AGENCIES INVOLVED IN THE DEVELOPMENT OF THE INDICATOR (a) Lead Agency: The lead agency is the United Nations Department of Economic and Social Affairs (DESA). The contact point is the Director, Statistics Division, DESA; fax no. (1 212) 963 9851.

12
(b) Other Contributing Organizations: None. 6. REFERENCES
(a) Readings: The 1993 SNA provides international standards on national accounts and is the product of collaborative efforts between EUROSTAT, IMF, OECD, UN and the World Bank. (b) Internet site: United Nations Statistics Division: http://www.un.org/Depts/unsd

13
Theme 13: Economic Development Sub-Theme: Macroeconomic Performance Indicator 4: Adjusted net saving as a percentage of Gross National Income
Adjusted net saving as a percentage of Gross National Income
Economic development Macroeconomic performance Core indicator
1. INDICATOR (a) Name: Adjusted Net Saving (ANS) as a percentage of Gross National Income (GNI). (b) Brief Definition: Adjusted net saving is derived from the standard national accounting measure of gross saving by making four adjustments: (i) consumption of fixed capital is deducted to obtain net national saving; (ii) current public expenditure on education is added to account for investment in human capital; (iii) estimates of the depletion of a variety of natural resources are deducted to reflect the decline in asset values associated with extraction and depletion; (iv) deductions are made for damages from carbon dioxide and particulate emissions. The indicator is then computed by dividing ANS by GNI. (c) Unit of Measurement: %. (d) Placement in the CSD Indicator Set: Economic development/ macroeconomic performance. 2. POLICY RELEVANCE (a) Purpose: Adjusted net saving provides a measure of a country’s sustainability by measuring the change in comprehensive wealth during a specified accounting period. In particular it provides a test to check the extent to which today’s rents from a number of natural resources (i.e. change in natural capital) and changes in human capital are balanced by net saving (i.e. change in man-made capital), that is, this generation’s bequest to future generations. (b) Relevance to Sustainable/Unsustainable Development (theme/sub-theme): Adjusted net saving measure the change in value of a specified set of assets, excluding capital gains. If a country’s net saving is positive and the accounting includes a sufficiently broad range of assets, economic theory suggests that the present value of social welfare is increasing. Conversely, persistently negative adjusted net saving indicates that an economy is on an unsustainable path. (c) International Conventions and Agreements: None. (d) International Targets/Recommended Standards: For developed and developing countries, adjusted net saving should not be negative. This constitutes a necessary condition for
14
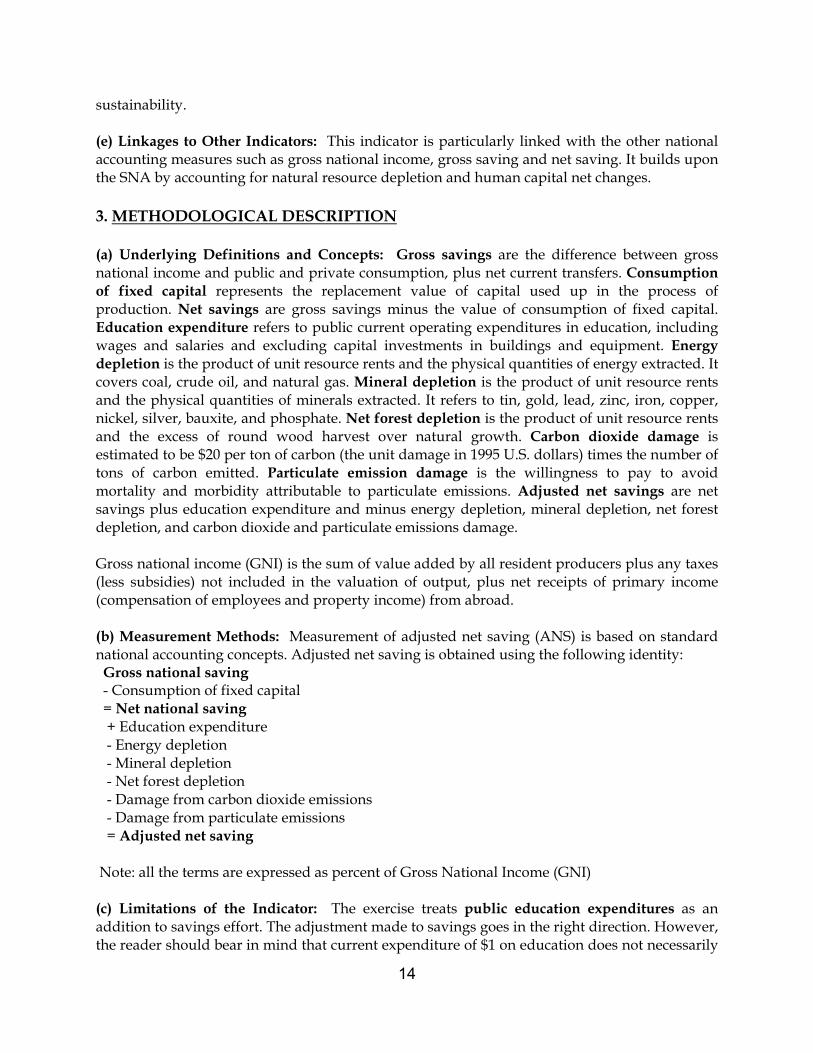
sustainability. (e) Linkages to Other Indicators: This indicator is particularly linked with the other national accounting measures such as gross national income, gross saving and net saving. It builds upon the SNA by accounting for natural resource depletion and human capital net changes. 3. METHODOLOGICAL DESCRIPTION (a) Underlying Definitions and Concepts: Gross savings are the difference between gross national income and public and private consumption, plus net current transfers. Consumption of fixed capital represents the replacement value of capital used up in the process of production. Net savings are gross savings minus the value of consumption of fixed capital. Education expenditure refers to public current operating expenditures in education, including wages and salaries and excluding capital investments in buildings and equipment. Energy depletion is the product of unit resource rents and the physical quantities of energy extracted. It covers coal, crude oil, and natural gas. Mineral depletion is the product of unit resource rents and the physical quantities of minerals extracted. It refers to tin, gold, lead, zinc, iron, copper, nickel, silver, bauxite, and phosphate. Net forest depletion is the product of unit resource rents and the excess of round wood harvest over natural growth. Carbon dioxide damage is estimated to be $20 per ton of carbon (the unit damage in 1995 U.S. dollars) times the number of tons of carbon emitted. Particulate emission damage is the willingness to pay to avoid mortality and morbidity attributable to particulate emissions. Adjusted net savings are net savings plus education expenditure and minus energy depletion, mineral depletion, net forest depletion, and carbon dioxide and particulate emissions damage. Gross national income (GNI) is the sum of value added by all resident producers plus any taxes (less subsidies) not included in the valuation of output, plus net receipts of primary income (compensation of employees and property income) from abroad. (b) Measurement Methods: Measurement of adjusted net saving (ANS) is based on standard national accounting concepts. Adjusted net saving is obtained using the following identity: Gross national saving - Consumption of fixed capital = Net national saving + Education expenditure - Energy depletion - Mineral depletion - Net forest depletion - Damage from carbon dioxide emissions - Damage from particulate emissions = Adjusted net saving Note: all the terms are expressed as percent of Gross National Income (GNI) (c) Limitations of the Indicator: The exercise treats public education expenditures as an addition to savings effort. The adjustment made to savings goes in the right direction. However, the reader should bear in mind that current expenditure of $1 on education does not necessarily
15
yield $1 of human capital. The calculation should also consider private education expenditure, but data are not available for a large number of countries. The accounting of natural resource depletion and pollution costs still has some gaps. Key estimates missing on the resource side include the value of fossil water extracted from aquifers, net depletion of fish stocks, and depletion and degradation of soils. The energy and mineral depletion figures are part of a range of depletion estimates that are possible depending on the assumptions made about future quantities, prices, and costs, and there is reason to believe that it is at the high end of the range. Because the net forest depletion estimates reflect only timber values, they ignore all the external and non timber benefits associated with standing forests. (d) Status of Methodology: The methodology is kept under review by the World Bank. (e) Alternative Definitions/Indicators: Adjusted net saving has been referred to as ‘genuine saving’. 4. ASSESSMENT OF DATA (a) Data Needed to Compile the Indicator: GNI, consumption of fixed capital, current education expenditure. For energy and minerals: extraction volumes, price, cost of extraction. For forest: round wood production, price, cost of production. For carbon dioxide damage: emission levels. For particulate emissions damage: concentration levels, dose-response relationship, baseline mortality and morbidity data, value of a statistical life. (b) National and International Data Availability and Sources: The data is published by World Bank in World Development Indicators (Table 3.15). (c) Data References: World Bank, World Development Indicators; World Bank, Little Green Data Book. 5. AGENCIES INVOLVED IN THE DEVELOPMENT OF THE INDICATOR (a) Lead Agency: The lead agency is the World Bank. The contact point is the Environment Department, World Bank; e-mail [email protected]. (b) Other Contributing Organizations: None 6. REFERENCES (a) Readings: World Bank, World Development Indicators 2007. World Bank: Washington DC. Katharine Bolt, Mampite Matete, and Michael Clemens, 2002, Manual for Calculating Adjusted Net Savings, Environment Department, World Bank: Washington DC. (b) Internet sites: www.worldbank.org/environmentaleconomics http://go.worldbank.org/3AWKN2ZOY0
16
Theme 13: Economic Development Sub-Theme: Macroeconomic Performance Indicator 5: Inflation
INFLATION RATE Economic Development Macroeconomic performance Core indicator
1. INDICATOR (a) Name: Inflation rate (b) Brief Definition: The annual percentage increase of the cost of living as measured by the consumer price index. Consumer price indices are based on a representative basket of goods and services purchased by consumers in an economy. Composition and relative weights of the basket are reviewed periodically. (c) Unit of Measurement: Percentage point (d) Placement in the CSD Indicator Set: Economic Development/ Macroeconomic performance. 2. POLICY RELEVANCE (a) Purpose: The indicator measures the change in prices of consumer goods and services acquired, used or paid for by households. The rate of inflation is one of the indicators monitored by the authorities to set monetary policy. (b) Relevance to Sustainable/Unsustainable Development (theme/sub-theme): High inflation is a sign of macroeconomic imbalances. It often reduces economic growth and future growth prospects, thereby reducing the means of implementation available for achieving sustainable development goals. However, no agreement exists on costs (or benefits) resulting from low or moderate inflation. Also low inflation by itself in the absence of other factors that contribute to a favorable investment climate does not guarantee high growth. High and unanticipated inflation increases uncertainty and leads to inter-and intra-temporal misallocation of resources as long as prices are not full flexible. Inflation, especially if unanticipated, has often unwanted distributional effects, as it reduces real income of fixed income earners and shifts wealth away from creditors to debtors. Moreover, high and accelerating inflation rates may be the consequence of financing of public deficits through seignorage (that is, through a transfer of real resources from the public to the central bank or government caused by the creation of notes, coins, and reserve money) due to an inability of the government to issue debt instruments or to collect taxes. In such cases, inflation is an indicator of unsustainable public finances. (c) International Conventions and Agreements: None.

17
(d) International Targets/Recommended Standards: None (e) Linkages to Other Indicators: The consumer price index is closely linked to whole sale price index, producer's price index, food price index and gross domestic product (GDP) deflator. All these indicators measures inflation rate, the broadest being the GDP deflator. 3. METHODOLOGICAL DESCRIPTION (a) Underlying Definitions and Concepts: The indicators measures changes over time in the general level of prices of goods and services that a reference population acquires, uses or pays for consumption. A consumer price index is estimated as a series of summary measures of the period-to-period proportional change in the prices of a fixed set of consumer goods and services of constant quantity and characteristics, acquired, used or paid for by the reference population. Each summary measure is constructed as a weighted average of a large number of elementary aggregate indices. Each of the elementary aggregate indices is estimated using a sample of prices for a defined set of goods and services obtained in, or by residents of, a specific region from a given set of outlets or other sources of consumption goods and services. (b) Measurement Methods: The indicator is typically expressed as annual change in percentage points of the CPI. Alternatively, the indicator can be expressed by the value of the CPI. (c) Limitations of the Indicator: Because there is no fixed method, each country has adopted their own method of compiling the consumer price index, depending on data availability, and their budget. For example, in some countries, the consumer price index refers only to cities and not to the whole country. In some cases it may refer to only a particular group such as the low- or high-income group. Further the number of items chosen to be included in the index and the regularity with which data are collected vary from country to country. Therefore, it is often very difficult to compare data across countries. One has to be extremely careful in using this indicator across countries, and exceptions should be footnoted clearly. (d) Status of Methodology: The methodology is generally well developed.
(e) Alternative Definitions/Indicators: The deflator of the gross domestic product is an alternative, more broad-based indicator of inflation in the general economy. For the purpose of setting and monitoring monetary policy, some countries use a narrower measure, excluding certain items such as energy prices or unprocessed food process from the consumer price index. 4. ASSESSMENT OF DATA (a) Data Needed to Compile the Indicator: Retail price data and national accounts data for GDP. (b) National and International Data Availability and Sources: In most countries national statistical offices or central banks regularly collect data on consumer price indices. Internationally, the International Monetary Fund (IMF) and the International Labor Organization (ILO) regularly publish time series data on consume price indices. The World Bank publishes inflation data from the IMF as well as inflation data based on the GDP deflator

18
in its World Development Indicator series. (c) Data References: The World Development Indicators of the World Bank are available at http://go.worldbank.org/3JU2HA60D0 IMF data on CPI is included in the International Financial Statistics as well as in the World Economic Outlook series, see http://www.imf.org/external/data.htm ILO data is included in the LABORSTA series, see http://laborsta.ilo.org/ IMF and ILO data is also included in the United Nations Common Database, available at http://unstats.un.org/unsd/cdb/cdb_help/cdb_quick_start.asp 5. AGENCIES INVOLVED IN THE DEVELOPMENT OF THE INDICATOR (a) Lead Agency: The lead agency is the World Bank. International data on this indicator is compiled by the statistical department of IMF. (b) Other Contributing Organizations: UN Statistics Division, and ILO. 6. REFERENCES
(a) Readings: International Monetary Fund, International Financial Statistics, various years. World Bank, Word Development Indicators, various years. (b) Internet sites: World Bank: www.worldbank.org/data. IMF: http://www.imf.org/external/data.htm ILO: http://laborsta.ilo.org/ UNSD: http://unstats.un.org/unsd/cdb/cdb_help/cdb_quick_start.asp

19
Theme 13: Economic Development Sub-Theme: Sustainable Public Finance Indicator 6: Debt to GNP Ratio
DEBT-TO-GNI RATIO Economic development Sustainable public finance Core indicator
1. INDICATOR (a) Name: Debt to GNI ratio (b) Brief Definition: The indicator can be defined as the total amount of outstanding debt (internal and external) issued by the general government divided by gross national income. For countries where external debt is a major concern, the indicator can alternatively or additionally be defined as total external debt divided by gross national income. (c) Unit of Measurement: Percentage (d) Placement in the CSD Indicator Set: Economic development/ Sustainable public finance and/or Global Economic Partnership/ External financing 2. POLICY RELEVANCE (a) Purpose: With regard to public debt, this is a standard measure for public finances. With regard to external debt, this indicator measures the liabilities of the public sector for external debt of a country in relation to its total income (GNI). (b) Relevance to Sustainable/Unsustainable Development (theme/sub-theme): External debt sustainability for poor countries is one of the MDG goals. While external borrowing is a method of supplementing savings and financing the investment gap in a country, an unsustainable debt burden will choke development. For poor countries borrowing to finance previous borrowing can become a vicious circle, which may require drastic measures and outside aid to close. Public debt constitutes a burden for future generations as it reduces the amount of resources available for their consumption and investments. High and increasing debt ratios can be seen as an indication of unsustainable public finances. (c) International Conventions and Agreements: On external debt, there exist agreements on Highly-Indebted Poor Countries (HIPC) and the Multilateral Debt Relief Initiative (MDRI), initiated by the G8, to aid poor countries. There exist also the Paris and London “clubs” for renegotiation of debt and debt service payments to public and private creditors. No global conventions or agreements exist for public debt. (d) International Targets/Recommended Standards: Millennium Development Goal (MDG) 8, target 15, “Deal comprehensively with the debt problems of developing countries through

20
national and international measures in order to make debt sustainable in the long term” addresses external debt. (e) Linkages to Other Indicators: This indicator is closely linked with measures such as total debt as a share of GNI and debt service as a ratio to exports of goods and services, which is measures debt burden in relation to a country’s foreign exchange earning capacity. 3. METHODOLOGICAL DESCRIPTION (a) Underlying Definitions and Concepts: Gross general government debt comprises the stock (at year-end) of all government gross liabilities (both to residents and nonresidents). To avoid double counting, the data are based on a consolidated account (eliminating liabilities and assets between components of the government, such as budgetary units and social security funds). General government should reflect a consolidated account of central government plus state, provincial, or local governments, social security funds and special funds, but exclude public corporation. General government debt can also be expressed in net terms, defined as gross general government debt minus all government assets (domestic as well as foreign). Total external debt is debt owed to nonresidents repayable in foreign currency, goods or services. It is the sum of public, publicly guaranteed, and private nonguaranteed long-term debt, use of IMF credit and short-term debt. Short term debt includes all debt having an original maturity of one year or less and interest in arrears on long-term debt. Long-term debt is debt that has an original or extended maturity of more than one year. It has three components: public, publicly guaranteed, and private non-guaranteed debt. Public and publicly guaranteed debt comprises the long-term external obligations of public debtors, including the national government and political subdivisions (or an agency of either) and autonomous public bodies, and the external obligations of private debtors that are guaranteed for repayment by a public entity. Gross national product (GNI) is the sum of value added by all resident producers plus any taxes (less subsidies) not included in the valuation of output, plus net receipts of primary income (compensation of employees and property income) from abroad. (b) Measurement Methods: The indicator is derived by dividing total public debt and/or external debt outstanding and disbursed as contained in the World Bank’s Global Development Finance (GDF) database by total GNI. (c) Limitations of the Indicator: While a high debt to GNI ratio is not desirable, a high ratio by itself is not a definite sign of trouble. There are no absolute rules to determine when the ratio of debt to GNI is too high. The sustainable level debt varies from country to country. The same value of ratio could be sustainable for one country whereas a heavy burden for another country. For example, countries with fast growing economies and, in case of external debt, exports can sustain a higher debt ratio than countries with low growth and limited resources.

21
(d) Status of Methodology: The methodology is generally well developed. (e) Alternative Definitions/Indicators: Gross domestic product (GDP) can be used as a denominator instead of GNI. Also present value of debt can be used instead of total external debt as the numerator. 4. ASSESSMENT OF DATA (a) Data Needed to Compile the Indicator: Debt data for public debt and/or for external debt and national accounts data for GNI. (b) National and International Data Availability and Sources: In most developing countries central bank or ministry of finance collects and reports external borrowings to the World Bank Debt Reporting System. Data reported by the IMF and OECD, based in part on credit reports may differ due to varying methodology and timing of data collection. Availability of international data on general government debt is scarce and the data is often not comparable. (c) Data References: Information on external debt, including a breakdown in public and publicly-guaranteed external debt and private non-guaranteed external debt, and GNI are available in World Banks GDF and WDI publications and databases. 5. AGENCIES INVOLVED IN THE DEVELOPMENT OF THE INDICATOR (a) Lead Agency: The lead agency is the World Bank. The contact point is I. Levent (phone: +1 202. 473-3843; email: [email protected]) (b) Other Contributing Organizations: IMF and OECD 6. REFERENCES (a) Readings: World Bank, Global Development Finance, various years World Bank, Word Development Indicators, various years (b) Internet sites: World Bank www.worldbank.org/debt IMF: www.imf.org

22
Theme 13: Economic Development Sub-Theme: Employment Indicator 7: Labor Productivity by Sector
LABOUR PRODUCTIVITY AND UNIT LABOUR COST Economic development Employment Core indicator
1. INDICATOR (a) Name: Labor productivity and unit labor costs. (b) Brief Definition: Labor productivity is defined as output per unit of labor. The Key Indicators of Labor Markets (KILM) distinguish five different categories. These are: i. the total economy. ii. manufacturing. iii. transport and communication. iv. trade, including sales and repairs of motor vehicles, wholesale, retail, hotels and
restaurants. v. agriculture, forestry and fisheries. The unit labor cost is defined as labor cost per unit of output. (c) Unit of Measurement: 1990 US$. (d) Placement in the CSD Indicator Set: Economic development/ Employment. 2. POLICY RELEVANCE (a) Purpose: This indicator provides estimates of growth rates of labor productivity. All estimates are made according to the national accounts conventions to ensure that labor productivity for individual sectors can be compared. Labour productivity therefore is a key measure of economic performance. Unit labor cost represents a direct link between productivity and the cost of labor used in generating output. (b) Relevance to Sustainable/Unsustainable Development (theme/sub-theme): Economic growth in a country or a sector could be ascribed either to increased employment or to more effective work by those who are employed. The latter effect can be demonstrated through statistics on labor productivity. The understanding of the driving forces behind labor productivity, in particular the accumulation of machinery and equipment, improvements in organization as well as physical and institutional infrastructures, improved health and skills of workers (“human capital”) and the generation of new technology, is important for formulating policies to support economic growth.
Labour productivity estimates can serve to develop and monitor the effects of labor market policies. For example, high labor productivity is often associated with high levels or particular

23
types of human capital, indicating priorities for specific education and training policies. Likewise, trends in productivity estimates can be used to understand the effects of wage settlements on rates of inflation or to ensure that such settlements will compensate workers for (part of) realized productivity improvements. Finally, productivity measures can contribute to the understanding of how labor market performance affects living standards. When the intensity of labor utilization − the average number of annual working hours per head of the population − is low, the creation of employment opportunities is also an important means of raising per capita income in addition to productivity growth. In contrast, when labor utilization is already high, productivity will be the key to improving living standards. A rise in a country’s unit labor cost represents an increased reward for labor’s contribution to output. However, a rise in labor cost that is higher than the rise in labor productivity may be a threat to a country’s competitiveness, if other costs are not adjusted in compensation. As a competitiveness indicator, unit labor costs are particularly relevant for the manufacturing industry where many internationally tradable products are produced. (c) International Conventions and Agreements: None (d) International Targets/Recommended Standards: The overall goal of the International Labour Organization is decent work for all women and men in all countries. Decent work is about opportunities for women and men to obtain decent and productive employment in conditions of freedom, equity, security and human dignity. The revised MDG monitoring framework, presented in 2007 to the General Assembly, includes the new target “Achieve full and productive employment and decent work for all, including women and young people” under MDG 7 (Eradicate extreme poverty and hunger). (e) Linkages to Other Indicators: While increasing labor force participation is at best a transitional source of growth depending on the rate of population growth and the age structure, the productivity of labor determines in the long run the rise in per capita income. For a substantial number of countries, the productivity measures for the total economy and manufacturing are complemented with measures of unit labor cost, which are defined as labor cost per unit of output. 3. METHODOLOGICAL DESCRIPTION (a) Underlying Definitions and Concepts: Productivity represents the amount of output per unit of input. Output is measured as “value added”, which is the total production value minus the value of intermediate inputs, such as raw materials, semi-finished products, services purchased and energy inputs. Value added, called “gross domestic product” (GDP) in the national accounts, represents the compensation for input of services from capital (including depreciation) and labor directly engaged in production. The GDP concepts for the total economy are expressed at market prices, which reflect the market value of the output produced. For the individual sectors, GDP at market prices is adjusted to basic price levels, i.e. indirect taxes on products are subtracted and subsidies on products are added. The adjusted GDP,

24
therefore, represents the amount receivable by the producer for a unit of good or service produced. Labour productivity growth may be due to either increased efficiency of workers themselves (without greater use of other inputs), or improvements or increases in inputs used by workers, such as physical capital, human capital or intermediate inputs. Estimated labor productivity may also show an increase if the mix of activities in the economy or in an industry has shifted from activities with low levels of productivity to activities with higher levels, even if none of the activities have become more productive. Unit labor cost is defined as labor compensation per unit of gross value added produced. Total labor compensation is measured to include gross wages and salaries of employees in addition to other costs of labor that are paid by employers, including employers’ contributions to social security and pension schemes. In addition to employees’ compensation, estimated labor costs of the self-employed are included where possible, mostly imputed on the assumption that the labor compensation per self-employed person equals that of an employee. Therefore, this adjustment can only be made when the number of self-employed persons is known separately. (b) Measurement Methods: For a constant “mix” of activities, the best measure of labor input to be used in the productivity equation would be “total number of annual hours actually worked by all persons employed”. In many cases, however, this labor input measure is difficult to obtain or estimate reliably. For this reason, the labor productivity measures often show both gross value added per person employed and gross value added per hour worked. Labour compensation estimates are obtained from the national accounts estimates so that value added (GDP) and labor costs are compatible. Gross value added and total labor compensation figures, expressed in constant prices, may be taken from national accounts. Especially for sectors producing tradable goods, cross-country comparisons are important. To compare labor productivity and unit labor cost levels across countries, it is necessary to convert gross value added to US dollars on the basis of adjusted purchasing power parity (PPP). PPP represents the amount of a country’s currency that is required to purchase a standard set of goods and services worth one US dollar. The use of PPPs takes account of differences in relative prices between countries. Had official currency exchange rates been used instead, the implicit assumption would be that there are no differences in relative prices across countries. The total economy estimates of gross value added used for KILM 18 are expressed in terms of 1990 US dollars, as the 1990 PPP made it possible to compare the largest set of countries. For the individual sectors, the base year is 1997. This year was chosen due to the availability of a new set of multilateral PPPs by industry for this benchmark year. (c) Limitations of the Indicator: Limitations to the international and historical comparability of the estimates are summarized under the following four headings. Output measures in national currencies Output measures are obtained from national accounts and represent, as much as possible, GDP at market prices for the total economy and value added at basic prices for the individual sectors.
25
However, despite common principles that are mostly based on the United Nations System of National Accounts, there are still significant problems in international consistency of national accounts estimates, in particular for countries outside the OECD. Such factors include different treatment of output in services sectors, different procedures in correcting output measures for price changes, in particular the use of different weighting systems in obtaining deflators and different degree of coverage of informal economic activities in developing economies and of the underground economy in developed economies in national accounts. Employment Estimates of employment are, as much as possible, for the average number of persons with one or more paid jobs during the year. As in the case of output estimates, the employment estimates are sensitive to under-coverage of informal or underground activities, which accounts for a substantial portion of labor input. In some cases, informal activities are not included in the production and employment statistics at all. In agriculture the labor force estimates include a substantial number of (part-time and seasonal) family workers. However, the estimates presented for the countries in this data set are meant to cover all economic activity. Working hours Estimates of annual working hours are often unavailable or are relatively unreliable. Even for developed economies, annual working hours are not consistently defined across countries. For example, statistics on working hours often refer to paid hours rather than to actually worked hours, implying that no adjustments are made for paid hours that are not worked, such as hours for paid vacation or sickness, or for hours worked that are not paid for. Moreover, statistics on working hours often are only available for a single category of the workforce (in many cases, only employees), or only for a particular industry (such as manufacturing) or for particular types of establishments (for example, those above a certain size or in the formal sector). As always, these problems are particularly serious for a substantial number of low-income economies. Whether and how the estimates of annual hours worked have been adjusted for such weaknesses in the primary statistics is often undocumented. Total labor compensation The national accounts of developing economies often do not provide estimates of labor compensation which explains the limited number of developing countries for which unit labor cost estimates are available. Purchasing power parities The International Comparison Program (ICP) price surveys to obtain PPPs are carried out for selected benchmark years only. Not all estimates are for the same year, so that it was necessary in Maddison (1995) to carry some data forward to 1990 with the use of national price indices. The precise nature of the ICP price surveys can differ across countries, principally for non-OECD countries. The ICP pricing procedures have been criticized for lack of comparability and reflection of the specified items between countries. Furthermore, the multilateral character of the estimates is affected by the fact that the PPPs were, in fact, estimated for six different regions, and “globalized” with particular interregional (binary) links. Finally, within each of the regions, the aggregation procedures of the PPPs differ. (d) Status of the Methodology: The methodology is well established. The indicator is widely
26
used in developed and developing countries. (e) Alternative Definitions/Indicators: It could be useful to break down this indicator by age group and sex as we might see an evolution of the labor productivity with more experience and gender differences in pay for the same work. 4. ASSESSMENT OF DATA (a) Data Needed to Compile the Indicator: Growth Domestic Product, gross value added per sector, the number of annual hours actually worked by all persons employed per sector, total labor compensation and the number employers and self-employed persons. (b) National and International Data Availability and Sources: At the international level, the productivity indicator in ILO’s KILM for the total economy covers 97 countries with coverage extending to all KILM regional groups (table 18a). Together, these countries represent more than 93 per cent of the world population and more than 98 per cent of world GDP. For a subset of countries (mostly in Europe and North America, with some in Asia and South America), separate measures are provided for manufacturing (31 countries), transport and communication (18 countries) and trade (15 countries). For agriculture, forestry and fisheries estimates include 113 countries. For unit labor cost, 14 countries are included in the KILM database. (c) Data References: KILM is accessible at http://www.ilo.org/public/english/employment/strat/kilm/ The estimates available in the database from both the OECD and the GGDC (Groningen Growth and Development Centre), were originally obtained from national statistical offices and, where possible, have been harmonized for differences in concepts and industry classifications and supplemented, where necessary, with national accounts statistics obtained directly from the individual countries. For non-OECD countries, the national accounts and labor statistics, which were assembled from national sources by international organizations such as the World Bank, the Asian Development Bank, the Food and Agriculture Organization (FAO), the ILO and the United Nations Statistical Office, are mostly taken as the point of departure. These sources are complemented by the series from Maddison (2003), in particular to cover the period 1980-90. 5. AGENCIES INVOLVED IN THE DEVELOPMENT OF THE INDICATOR (a) Lead Agency: The lead agency is the International Labour Office (ILO), located in Geneva, Switzerland. Contact: [email protected] (b) Other Contributing Organizations: None. 6. REFERENCES (a) Readings: Yearbook of Labour Statistics (ILO, Geneva). Bulletin of Labour Statistics (biannual) (ILO, Geneva).

27
Statistical yearbooks and other publications issued by the national statistical offices. Surveys of Economically Active Population, Employment, Unemployment and Underemployment -An ILO Manual on Concepts and Methods (ILO, Geneva, 1992). Sources and Methods: Labour Statistics, Volume 3 - Economically active population, employment, unemployment and hours of work (household surveys), third edition (ILO, Geneva, 2004). Sources and Methods: Labour Statistics, Volume 4- Employment, unemployment, wages and hours of work (administrative records and related sources), second edition (ILO, Geneva, 2004). Sources and Methods: Labour Statistics, Volume 5- Total and economically active population, employment and unemployment (population censuses), second edition (ILO, Geneva, 1996) (third edition under preparation). ILO-comparable annual employment and unemployment estimates, in Bulletin of Labour Statistics, 2004-4 (ILO, Geneva, 2004) System of National Accounts 1993 (Commission of the European Communities, International Monetary Fund, Organization for Economic Co-operation and Development, United Nations, World Bank, Brussels/Luxembourg, New York, Paris, Washington, D.C., 1993) Current international recommendations on labor statistics (ILO, Geneva, 2000). See in particular: Resolution concerning Statistics of the Economically Active Population, Employment, Unemployment and Underemployment, adopted by the Thirteenth International Conference of Labour Statisticians (October 1982). (b) Internet sites: International Labour Office, Bureau of Statistics: the ILO's statistical database on labor statistics, including unemployment data and ILO-comparable estimates: http://laborsta.ilo.org International recommendations on labor statistics, including the resolution concerning statistics of the economically active population, employment, unemployment and underemployment: http://www.ilo.org/public/english/bureau/stat/res/index.htm Key Indicators of the Labour Market, Geneva, 2003 (available on CD-ROM; sample tables on web site): http://www.ilo.org/public/english/employment/strat/kilm/
28
Theme 13: Economic Development Sub-Theme: Employment Indicator 8: Employment Rate, Disaggregated by Sex
EMPLOYMENT-TO-POPULATION RATIO Economic Development Employment Core indicator
1. INDICATOR (a) Name: Employment-to-Population Ratio. (b) Brief Definition: The employment-to-population ratio is defined as the proportion of a country’s working-age population that is employed. (c) Unit of Measurement: %. (d) Placement in the CSD Indicator Set: Economic development/ Employment 2. POLICY RELEVANCE (a) Purpose: The employment-to-population ratio provides information on the ability of an economy to create employment; for many countries the indicator is often more insightful than the unemployment rate. If unemployment can been seen as, for the most part, the undesirable portion (although some short-term unemployment may be unavoidable), employment is viewed as the desired portion of the economically active population (labor force). Employment-to-population ratios are of particular interest when broken down by sex, as the ratios for men and women can provide information on gender differences in labor market activity in a given country. (b) Relevance to Sustainable/Unsustainable Development (theme/sub-theme): Employment is useful and relevant to measuring sustainable development, especially if uniformly measured over time, and considered with other socio-economic indicators. It should be noted, however, that it is common to find people working full-time but remaining poor due to the particular social conditions, low earnings, and type of industrial relations prevalent in their country, industry, or occupation. Remunerative and productive employment is one of the main means to tackle poverty. (c) International Conventions and Agreements: The measures of employment and the working age population are defined for statistical purposes in the International Labour Office (ILO): Resolution concerning statistics of the economically active population, employment, unemployment and underemployment, adopted by the Thirteenth International Conference of Labour Statisticians, Geneva, 1982. (d) International Targets/Recommended Standards: The ILO Convention concerning Employment Policy, 1964 (No. 122) states that “With a view to stimulating economic growth and development, raising levels of living, meeting manpower requirements and overcoming

29
unemployment and underemployment, each Member shall declare and pursue, as a major goal, an active policy designed to promote full, productive and freely chosen employment”. The revised MDG monitoring framework, presented in 2007 to the General Assembly, includes the new target “Achieve full and productive employment and decent work for all, including women and young people” under MDG 7 (Eradicate extreme poverty and hunger). (e) Linkages to Other Indicators: Although a high overall ratio is typically considered as positive, the indicator alone is not sufficient to describe employment characteristics and quality of work and for assessing the level of decent work. Additional indicators are required to assess such issues as earnings, hours of work, informal sector employment, underemployment and working conditions. In fact, the ratio could be high for reasons that are not necessarily positive – for example, where education options are limited so that young people take up any work available rather than staying in school to build their human capital. For these reasons, it is strongly advised that indicators should be reviewed collectively in any evaluation of country-specific labor market policies. The employment characteristics include important job classifications: status in employment and employment by sector and by occupation. These indicators reflect most of the important aspects of possessing a job and should be viewed together to give a more in-depth picture of the working lives of a population and to assess the progress made toward the goal of decent work. 2. METHODOLOGICAL DESCRIPTION (a) Underlying Definitions and Concepts: Employment is defined in the resolution adopted by the 13th International Conference of Labour Statisticians (ICLS) as persons above a specified age who performed any work at all (paid or self employment), in the reference period, for pay or profit (or pay in kind), or were temporarily absent from a job for such reasons as illness, maternity or parental leave, holiday, training or industrial dispute. The resolution also states that unpaid family workers who work for at least one hour should be included in the count of employment, although many countries use a higher hour limit in their definition. Members of the armed forces are typically included among persons employed; however, some countries restrict measurement to civilian employment. The population base for employment ratios can vary across countries. In most cases, the resident non-institutional population of working age living in private households is used, excluding members of the armed forces and individuals residing in mental, penal or other types of institution. Many countries, however, include the armed forces in the population base for their employment ratios even when they do not include them in the employment figures (for example, the United States). An age limit: For most countries, the working-age population is defined as persons aged 15 years and older, although this may vary slightly from country to country. The ILO standard for the lower age limit is, in fact, 15 years. In countries, where compulsory schooling and legislation on the minimum age for admission to employment have broad coverage and are widely respected, the age specified in these regulations may be used as a basis for determining an appropriate minimum age limit for measuring the economically active population. In other countries, the minimum age limit should be determined empirically on the basis of (i) the extent and intensity of participation in economic activities by young people, and (ii) the feasibility and cost of measuring such participation with acceptable accuracy. Some countries also determine a maximum age for inclusion in the labor force, although the international standards do not

30
recommend the use of a maximum age limit. -- The involvement in economic activities (or availability for such involvement) during the survey reference period: The concept of economic activity, or employment, adopted by the Thirteenth International Conference of Labour Statisticians (1982) is defined in terms of production of goods and services as set forth by the United Nations System of National Accounts (revised in 1993). -- A short reference period: For example, one week or a day. (b) Measurement Methods: In general, information for this indicator is derived from household surveys of the labor force, that is, sample surveys of the population. Some countries, however, use “official estimates” or population censuses as the source of their employment figures. Virtually every country in the world that collects information on labor market status should, theoretically, have the requisite information to calculate employment-to-population ratios; data on the working-age population – ideally, individuals' aged 15 years and older – and total employment are required. (c) Limitations of the Indicator: A high ratio means that a large proportion of a country’s population is employed, while a low ratio means that a large share of the population is not involved directly in market-related activities, because they are either unemployed or (more likely) out of the labor force altogether. Comparability of employment ratios across countries is affected most significantly by variations in the definitions used for the employment and population figures. Perhaps the biggest differences result from age coverage, such as the lower and upper bounds for labor force activity. Employment can also vary according to whether the armed forces are included or excluded. Estimates of both employment and population are likely to vary according to whether members of the armed forces are included. There is also the issue of exclusion of the institutionalized population, as noted above. Another area with scope for measurement differences has to do with the national treatment of particular groups of workers. The international definition, as stated above, calls for inclusion of all persons who worked for at least one hour during the reference period. The worker could be in paid employment or in self-employment or engaged in less obvious forms of work, each of which is dealt with in detail in the resolution, such as unpaid family work, apprenticeship or non-market production. The majority of exceptions to coverage of all persons employed in a labor force survey have to do with slight national variations to the international recommendation applicable to the alternate employment statuses. (d) Status of the Methodology: The methodology is well established. The indicator is widely used in developed and developing countries. (e) Alternative Definitions/Indicators: The importance of employment indicators should come as no surprise to analysts of labor markets, since employment and the lack of it (where employment is the goal) are largely what labor market policies are all about. It is not sufficient, however, to discuss the quantity of employment alone, especially given the ILO’s framework of the decent work agenda, which
31
brings quality aspects of employment into the picture. To better assess working conditions, one needs to understand that the underlying concept of work is broad and encompasses all forms of economic activity, including self-employment, economic unpaid family work and wage employment in both the informal and formal sectors. 4. ASSESSMENT OF DATA (a) Data Needed to Compile the Indicator: Working age population (total number of persons) and total number of employed persons, preferably derived from the same survey. (b) National and International Data Availability and Sources: 125 countries in the KILM database. (c) Data References: Most of the information for this indicator was gathered from two international repositories of labor market data: the ILO Bureau of Statistics, Yearbook of Labour Statistics (LABORSTA) database and the Organization for Economic Co-operation and Development (OECD). 5. AGENCIES INVOLVED IN THE DEVELOPMENT OF THE INDICATOR (a) Lead Agency: The lead agency is the International Labour Office (ILO), located in Geneva, Switzerland. Contact: [email protected] (b) Other Contributing Organizations: None. 6. REFERENCES (a) Readings: Key Indicators of the Labour Markets, 4th edition (ILO, Geneva). Yearbook of Labour Statistics (ILO, Geneva). Bulletin of Labour Statistics (biannual) (ILO, Geneva). Statistical yearbooks and other publications issued by the national statistical offices. Surveys of Economically Active Population, Employment, Unemployment and Underemployment -An ILO Manual on Concepts and Methods (ILO, Geneva, 1992). Sources and Methods: Labour Statistics, Volume 3 - Economically active population, employment, unemployment and hours of work (household surveys), third edition (ILO, Geneva, 2004). Sources and Methods: Labour Statistics, Volume 4- Employment, unemployment, wages and hours of work (administrative records and related sources), second edition (ILO, Geneva, 2004).

32
Sources and Methods: Labour Statistics, Volume 5- Total and economically active population, employment and unemployment (population censuses), second edition (ILO, Geneva, 1996) (third edition under preparation). ILO-comparable annual employment and unemployment estimates, in Bulletin of Labour Statistics, 2004-4 (ILO, Geneva, 2004) System of National Accounts 1993 (Commission of the European Communities, International Monetary Fund, Organization for Economic Co-operation and Development, United Nations, World Bank, Brussels/Luxembourg, New York, Paris, Washington, D.C., 1993) Current international recommendations on labor statistics (ILO, Geneva, 2000). See in particular: Resolution concerning Statistics of the Economically Active Population, Employment, Unemployment and Underemployment, adopted by the Thirteenth International Conference of Labour Statisticians (October 1982). (b) Internet sites: International Labour Office, Bureau of Statistics: the ILO's statistical database on labor statistics, including unemployment data and ILO-comparable estimates: http://laborsta.ilo.org International recommendations on labor statistics, including the resolution concerning statistics of the economically active population, employment, unemployment and underemployment: http://www.ilo.org/public/english/bureau/stat/res/index.htm Key Indicators of the Labour Market, Geneva, 2005 (available on CD-ROM; sample tables on web site): http://www.ilo.org/public/english/employment/strat/kilm/

33
Theme 13: Economic Development Sub-Theme: Employment Indicator 9: Employment Status, by Sex (NC)
VULNERABLE EMPLOYMENT
Economic development Employment Core indicator 1. INDICATOR (a) Name: Vulnerable employment, by sex (b) Brief Definition: Vulnerable is measures as the proportion of own-account workers and contributing family members in total employment. The indicator is based on the status in employment indicator contained in ILO’s Key Labour that generally distinguishes between three categories of the total employed. These are:
- wage and salaried workers (also known as employees); - self-employed workers that include self-employed workers with employees
(employers), self-employed workers without employees (own-account workers) and members of producers’ cooperatives;
- contributing family workers (also known as unpaid family workers). (c) Unit of Measurement: %. (d) Placement in the CSD Indicator Set: Economic development/ Employment 2. POLICY RELEVANCE (a) Purpose: This indicator provides information how many persons are vulnerable to economic risk because of weak institutional employment arrangements. The categories of own-account workers and contributing family workers are thought to be particularly vulnerable when it comes to both economic risk and strength of the institutional arrangement, two qualities which are closely intertwined. Given that the institutional arrangements for the work of own-account workers and contributing family workers are likely to be weak, such workers are more likely to (a) lack contractual arrangements which can lead to a lack of job security and (b) lack the degree of social protection and social safety nets that govern wage and salaried workers and are therefore not likely to benefit from social security, health or unemployment coverage.
(b) Relevance to Sustainable/Unsustainable Development (theme/sub-theme): The indicator of vulnerable employment may be used to confirm or refute claims of an increasing informalization of labor markets, because contributing family workers and own account workers are by definition not likely to have formal work arrangements. If the proportion of vulnerable workers is sizeable, it may be an indication of a large agriculture sector, lack of growth in the formal economy or widespread poverty. The poverty connection arises because workers in the vulnerable statuses lack the social protection and safety nets to guard against times of low economic demand and often are not capable of generating sufficient savings for themselves and their families to offset times of low demand.

34
(c) International Conventions and Agreements: None. (d) International Targets/Recommended Standards: The overall goal of the International Labour Organization is decent work for all women and men in all countries. Decent work is about opportunities for women and men to obtain decent and productive employment in conditions of freedom, equity, security and human dignity. The revised MDG monitoring framework, presented in 2007 to the General Assembly, includes the new target “Achieve full and productive employment and decent work for all, including women and young people” under MDG 7 (Eradicate extreme poverty and hunger). (e) Linkages to Other Indicators: The indicator is strongly linked to the employment-by-sector indicator. With economic growth, one would expect to see a shift in employment from the agricultural to the industry and services sectors, which, in turn, would be reflected in an increase in the number of wage and salaried workers. Also, a shrinking share of employment in agriculture would result in a lower proportion of contributing family workers, who are often widespread in the rural sector in developing economies. Countries that show falling proportions of either the share of own-account workers or contributing family workers, and a complementary rise in the share of employees, accompany the move from a low-income situation with a large informal or rural sector to a higher-income situation with high job growth. Shifts in proportions of status in employment are generally not as sharp or as clear as shifts in sectoral employment. A country with a large informal economy, in both the industrial and services sectors, may tend to have larger proportions of both self-employed and contributing family workers than a country with a smaller sector. It may be more relevant to view status in employment within the various sectors in order to determine whether there has been a change in their relative shares, and such degree of detail is likely to be available for countries in the results of recently conducted labor force surveys or population censuses. 3. METHODOLOGICAL DESCRIPTION (a) Underlying Definitions and Concepts: According to the International Classification of Status in Employment (ICSE), the basic criteria used to define the status groups are the types of economic risk that they face in their work, an element of which is the strength of institutional attachment between the person and the job, and the type of authority over establishments and other workers that the job-holder has or will have as an explicit or implicit result of the employment contract. At the 15th International Conference of Labour Statisticians (ICLS) in 1993, the definitions of categories were revised. The 1993 revisions retained the existing major categories, but attempted to improve the conceptual basis for the distinctions made and the basic difference between wage employment and self-employment. The 1993 ICSE categories and extracts from their definitions follow:
i. Employees are all those workers who hold the type of jobs defined as “paid employment jobs”, where the incumbents hold explicit (written or oral) or implicit employment contracts that give them a basic remuneration that is not directly

35
dependent upon the revenue of the unit for which they work. ii. Employers are those workers who, working on their own account or with one or a
few partners, hold the type of jobs defined as a “self-employment jobs” (i.e. jobs where the remuneration is directly dependent upon the profits derived from the goods and services produced), and, in this capacity, have engaged, on a continuous basis, one or more persons to work for them as employee(s).
iii. Own-account workers are those workers who, working on their own account or with one or more partners, hold the type of jobs defined as a “self-employment jobs” [see ii above], and have not engaged on a continuous basis any employees to work for them.
iv. Members of producers’ cooperatives are workers who hold “self-employment jobs” [see ii or iii above] in a cooperative producing goods and services.
v. Contributing family workers are those workers who hold “self-employment jobs” as own-account workers [see iii above] in a market-oriented establishment operated by a related person living in the same household.
vi. Workers not classifiable by status include those for whom insufficient relevant information is available, and/or who cannot be included in any of the preceding categories.
Please note that contributing family workers are also technically self-employed according to the classification and could therefore be combined with the other self-employed categories to derive the total self-employed. The choice to remove contributing family workers from among the self-employed group was made for the purpose of this publication in order to emphasize the difference between the two statuses, since the socio-economic implications associated with each status can be significantly varied. (b) Measurement Methods: Household or labor force surveys are generally the most comprehensive and comparable sources for employment statistics. Other sources include population censuses, employment office records and official estimates. (c) Limitations of the Indicator: The indicators on vulnerable employment, and on status in employment in general, can be used to study how the distribution of the workforce by status in employment has changed over time for a particular country; how this distribution differs across countries; and how it has developed over the years for different countries. However, there are often differences in definitions, as well as in coverage, across countries and for different years, resulting from variations in information sources and methodologies that make comparisons difficult. Some definitional changes or differences in coverage can be overlooked. For example, it is not likely to be significant that status-in-employment comparisons are made between countries using information from labor force surveys with differing age coverage. (The generally used age coverage is 15 years and over, but some countries use a different lower limit or impose an upper age limit.) In addition, in a limited number of cases one category of self-employed – the members of producers’ – are included with wage and salaried workers. The effects of this non-standard grouping are likely to be small. What is more important to note is that information from labor force surveys is not necessarily consistent in terms of what is included in employment. For example, the information supplied

36
by the OECD relates to civilian employment, which can result in an underestimation of “employees” and “workers not classifiable by status”, especially in countries that have large armed forces. The other two categories, self-employed and contributing family workers, would not be affected, although their relative shares would be. With respect to geographic coverage, information from a source that covers only urban areas or only particular cities cannot be compared fairly with information from sources that cover both rural and urban areas, that is, the entire country. It is, therefore, not meaningful to compare results from many of the Latin American countries with results from the rest of the world because employment-by-status information for most Latin American countries relates to urban areas only. Similarly, for some sub-Saharan African countries – where very limited information is available anyway – the self-employed group often does not include members of producers’ cooperatives, while for other countries it may. For “wage and salaried workers” one needs to be careful about the coverage, noting whether, as mentioned above, it refers only to the civilian population or to the total population. Moreover, the status-in-employment distinctions do not allow for finer distinctions in working status – in other words, whether workers have casual or regular contracts and the kind of protection the contracts provide against dismissals, as all wage and salaried workers are grouped together. (d) Status of the Methodology: The methodology for status in employment, on which the vulnerable employment indicator is based, is well established. The indicator is widely used in developed and developing countries. (e) Alternative Definitions/Indicators: The indicator is only broken down by sex. It would be useful to break down this indicator by age group or by economic sector as these two variables certainly have a major effect on the results of this indicator. 4. ASSESSMENT OF DATA (a) Data Needed to Compile the Indicator: Employment by status and total number of employed persons preferably derived from the same survey. (b) National and International Data Availability and Sources: 131 countries in the KILM database. (c) Data References: Most of the information for this indicator was gathered from three international repositories of labor market data: (a) the ILO Bureau of Statistics, Yearbook of Labour Statistics (LABORSTA) database; (b) the Organization for Economic Co-operation and Development (OECD); and the Labour Market Indicators Library (LMIL). 5. AGENCIES INVOLVED IN THE DEVELOPMENT OF THE INDICATOR (a) Lead Agency: The lead agency is the International Labour Office (ILO), located in Geneva, Switzerland. Contact: [email protected] (b) Other Contributing Organizations: None.
37
6. REFERENCES (a) Readings: Yearbook of Labour Statistics (ILO, Geneva). Bulletin of Labour Statistics (biannual) (ILO, Geneva). Statistical yearbooks and other publications issued by the national statistical offices. Surveys of Economically Active Population, Employment, Unemployment and Underemployment -An ILO Manual on Concepts and Methods (ILO, Geneva, 1992). Sources and Methods: Labour Statistics, Volume 3 - Economically active population, employment, unemployment and hours of work (household surveys), third edition (ILO, Geneva, 2004). Sources and Methods: Labour Statistics, Volume 4- Employment, unemployment, wages and hours of work (administrative records and related sources), second edition (ILO, Geneva, 2004). Sources and Methods: Labour Statistics, Volume 5- Total and economically active population, employment and unemployment (population censuses), second edition (ILO, Geneva, 1996) (third edition under preparation). ILO-comparable annual employment and unemployment estimates, in Bulletin of Labour Statistics, 2004-4 (ILO, Geneva, 2004) System of National Accounts 1993 (Commission of the European Communities, International Monetary Fund, Organization for Economic Co-operation and Development, United Nations, World Bank, Brussels/Luxembourg, New York, Paris, Washington, D.C., 1993) Current international recommendations on labor statistics (ILO, Geneva, 2000). See in particular: Resolution concerning Statistics of the Economically Active Population, Employment, Unemployment and Underemployment, adopted by the Thirteenth International Conference of Labour Statisticians (October 1982). (b) Internet sites: International Labour Office, Bureau of Statistics: the ILO's statistical database on labor statistics, including unemployment data and ILO-comparable estimates: http://laborsta.ilo.org International recommendations on labor statistics, including the resolution concerning statistics of the economically active population, employment, unemployment and underemployment: http://www.ilo.org/public/english/bureau/stat/res/index.htm Key Indicators of the Labour Market, Geneva, 2003 (available on CD-ROM; sample tables on web site): http://www.ilo.org/public/english/employment/strat/kilm/

38
Theme 13: Economic Development Sub-Theme: Employment Indicator 10: Unit Labor Costs by Sector (NC)
LABOUR PRODUCTIVITY AND UNIT LABOUR COST Economic development Employment Core indicator
1. INDICATOR (a) Name: Labour productivity and unit labor costs. (b) Brief Definition: Labour productivity is defined as output per unit of labor. The Key Indicators of Labour Markets (KILM) distinguish five different categories. These are: i. the total economy. ii. manufacturing. iii. transport and communication. iv. trade, including sales and repairs of motor vehicles, wholesale, retail, hotels and
restaurants. v. agriculture, forestry and fisheries. The unit labor cost is defined as labor cost per unit of output. (c) Unit of Measurement: 1990 US$. (d) Placement in the CSD Indicator Set: Economic development/ Employment. 2. POLICY RELEVANCE (a) Purpose: This indicator provides estimates of growth rates of labor productivity. All estimates are made according to the national accounts conventions to ensure that labor productivity for individual sectors can be compared. Labour productivity therefore is a key measure of economic performance. Unit labor cost represents a direct link between productivity and the cost of labor used in generating output. (b) Relevance to Sustainable/Unsustainable Development (theme/sub-theme): Economic growth in a country or a sector could be ascribed either to increased employment or to more effective work by those who are employed. The latter effect can be demonstrated through statistics on labor productivity. The understanding of the driving forces behind labor productivity, in particular the accumulation of machinery and equipment, improvements in organization as well as physical and institutional infrastructures, improved health and skills of workers (“human capital”) and the generation of new technology, is important for formulating policies to support economic growth. Labour productivity estimates can serve to develop and monitor the effects of labor market policies. For example, high labor productivity is often associated with high levels or particular types of human capital, indicating priorities for specific education and training policies.

39
Likewise, trends in productivity estimates can be used to understand the effects of wage settlements on rates of inflation or to ensure that such settlements will compensate workers for (part of) realized productivity improvements. Finally, productivity measures can contribute to the understanding of how labor market performance affects living standards. When the intensity of labor utilization − the average number of annual working hours per head of the population − is low, the creation of employment opportunities is also an important means of raising per capita income in addition to productivity growth. In contrast, when labor utilization is already high, productivity will be the key to improving living standards. A rise in a country’s unit labor cost represents an increased reward for labor’s contribution to output. However, a rise in labor cost that is higher than the rise in labor productivity may be a threat to a country’s competitiveness, if other costs are not adjusted in compensation. As a competitiveness indicator, unit labor costs are particularly relevant for the manufacturing industry where many internationally tradable products are produced. (c) International Conventions and Agreements: None (d) International Targets/Recommended Standards: The overall goal of the International Labour Organization is decent work for all women and men in all countries. Decent work is about opportunities for women and men to obtain decent and productive employment in conditions of freedom, equity, security and human dignity. The revised MDG monitoring framework, presented in 2007 to the General Assembly, includes the new target “Achieve full and productive employment and decent work for all, including women and young people” under MDG 7 (Eradicate extreme poverty and hunger). (e) Linkages to Other Indicators: While increasing labor force participation is at best a transitional source of growth depending on the rate of population growth and the age structure, the productivity of labor determines in the long run the rise in per capita income. For a substantial number of countries, the productivity measures for the total economy and manufacturing are complemented with measures of unit labor cost, which are defined as labor cost per unit of output. 3. METHODOLOGICAL DESCRIPTION (a) Underlying Definitions and Concepts: Productivity represents the amount of output per unit of input. Output is measured as “value added”, which is the total production value minus the value of intermediate inputs, such as raw materials, semi-finished products, services purchased and energy inputs. Value added, called “gross domestic product” (GDP) in the national accounts, represents the compensation for input of services from capital (including depreciation) and labor directly engaged in production. The GDP concepts for the total economy are expressed at market prices, which reflect the market value of the output produced. For the individual sectors, GDP at market prices is adjusted to basic price levels, i.e. indirect taxes on products are subtracted and subsidies on products are added. The adjusted GDP, therefore, represents the amount receivable by the producer for a unit of good or service
40
produced. Labour productivity growth may be due to either increased efficiency of workers themselves (without greater use of other inputs), or improvements or increases in inputs used by workers, such as physical capital, human capital or intermediate inputs. Estimated labor productivity may also show an increase if the mix of activities in the economy or in an industry has shifted from activities with low levels of productivity to activities with higher levels, even if none of the activities have become more productive. Unit labor cost is defined as labor compensation per unit of gross value added produced. Total labor compensation is measured to include gross wages and salaries of employees in addition to other costs of labor that are paid by employers, including employers’ contributions to social security and pension schemes. In addition to employees’ compensation, estimated labor costs of the self-employed are included where possible, mostly imputed on the assumption that the labor compensation per self-employed person equals that of an employee. Therefore, this adjustment can only be made when the number of self-employed persons is known separately. (b) Measurement Methods: For a constant “mix” of activities, the best measure of labor input to be used in the productivity equation would be “total number of annual hours actually worked by all persons employed”. In many cases, however, this labor input measure is difficult to obtain or estimate reliably. For this reason, the labor productivity measures often show both gross value added per person employed and gross value added per hour worked. Labour compensation estimates are obtained from the national accounts estimates so that value added (GDP) and labor costs are compatible. Gross value added and total labor compensation figures, expressed in constant prices, may be taken from national accounts. Especially for sectors producing tradable goods, cross-country comparisons are important. To compare labor productivity and unit labor cost levels across countries, it is necessary to convert gross value added to US dollars on the basis of adjusted purchasing power parity (PPP). PPP represents the amount of a country’s currency that is required to purchase a standard set of goods and services worth one US dollar. The use of PPPs takes account of differences in relative prices between countries. Had official currency exchange rates been used instead, the implicit assumption would be that there are no differences in relative prices across countries. The total economy estimates of gross value added used for KILM 18 are expressed in terms of 1990 US dollars, as the 1990 PPP made it possible to compare the largest set of countries. For the individual sectors, the base year is 1997. This year was chosen due to the availability of a new set of multilateral PPPs by industry for this benchmark year. (c) Limitations of the Indicator: Limitations to the international and historical comparability of the estimates are summarized under the following four headings. Output measures in national currencies Output measures are obtained from national accounts and represent, as much as possible, GDP at market prices for the total economy and value added at basic prices for the individual sectors. However, despite common principles that are mostly based on the United Nations System of
41
National Accounts, there are still significant problems in international consistency of national accounts estimates, in particular for countries outside the OECD. Such factors include different treatment of output in services sectors, different procedures in correcting output measures for price changes, in particular the use of different weighting systems in obtaining deflators and different degree of coverage of informal economic activities in developing economies and of the underground economy in developed economies in national accounts. Employment Estimates of employment are, as much as possible, for the average number of persons with one or more paid jobs during the year. As in the case of output estimates, the employment estimates are sensitive to under-coverage of informal or underground activities, which accounts for a substantial portion of labor input. In some cases, informal activities are not included in the production and employment statistics at all. In agriculture the labor force estimates include a substantial number of (part-time and seasonal) family workers. However, the estimates presented for the countries in this data set are meant to cover all economic activity. Working hours Estimates of annual working hours are often unavailable or are relatively unreliable. Even for developed economies, annual working hours are not consistently defined across countries. For example, statistics on working hours often refer to paid hours rather than to actually worked hours, implying that no adjustments are made for paid hours that are not worked, such as hours for paid vacation or sickness, or for hours worked that are not paid for. Moreover, statistics on working hours often are only available for a single category of the workforce (in many cases, only employees), or only for a particular industry (such as manufacturing) or for particular types of establishments (for example, those above a certain size or in the formal sector). As always, these problems are particularly serious for a substantial number of low-income economies. Whether and how the estimates of annual hours worked have been adjusted for such weaknesses in the primary statistics is often undocumented. Total labor compensation The national accounts of developing economies often do not provide estimates of labor compensation which explains the limited number of developing countries for which unit labor cost estimates are available. Purchasing power parities The International Comparison Program (ICP) price surveys to obtain PPPs are carried out for selected benchmark years only. Not all estimates are for the same year, so that it was necessary in Maddison (1995) to carry some data forward to 1990 with the use of national price indices. The precise nature of the ICP price surveys can differ across countries, principally for non-OECD countries. The ICP pricing procedures have been criticized for lack of comparability and reflection of the specified items between countries. Furthermore, the multilateral character of the estimates is affected by the fact that the PPPs were, in fact, estimated for six different regions, and “globalized” with particular interregional (binary) links. Finally, within each of the regions, the aggregation procedures of the PPPs differ. (d) Status of the Methodology: The methodology is well established. The indicator is widely used in developed and developing countries.

42
(e) Alternative Definitions/Indicators: It could be useful to break down this indicator by age group and sex as we might see an evolution of the labor productivity with more experience and gender differences in pay for the same work. 4. ASSESSMENT OF DATA (a) Data Needed to Compile the Indicator: Growth Domestic Product, gross value added per sector, the number of annual hours actually worked by all persons employed per sector, total labor compensation and the number employers and self-employed persons. (b) National and International Data Availability and Sources: At the international level, the productivity indicator in ILO’s KILM for the total economy covers 97 countries with coverage extending to all KILM regional groups (table 18a). Together, these countries represent more than 93 per cent of the world population and more than 98 per cent of world GDP. For a subset of countries (mostly in Europe and North America, with some in Asia and South America), separate measures are provided for manufacturing (31 countries), transport and communication (18 countries) and trade (15 countries). For agriculture, forestry and fisheries estimates include 113 countries. For unit labor cost, 14 countries are included in the KILM database. (c) Data References: KILM is accessible at http://www.ilo.org/public/english/employment/strat/kilm/ The estimates available in the database from both the OECD and the GGDC (Groningen Growth and Development Centre), were originally obtained from national statistical offices and, where possible, have been harmonized for differences in concepts and industry classifications and supplemented, where necessary, with national accounts statistics obtained directly from the individual countries. For non-OECD countries, the national accounts and labor statistics, which were assembled from national sources by international organizations such as the World Bank, the Asian Development Bank, the Food and Agriculture Organization (FAO), the ILO and the United Nations Statistical Office, are mostly taken as the point of departure. These sources are complemented by the series from Maddison (2003), in particular to cover the period 1980-90. 5. AGENCIES INVOLVED IN THE DEVELOPMENT OF THE INDICATOR (a) Lead Agency: The lead agency is the International Labour Office (ILO), located in Geneva, Switzerland. Contact: [email protected] (b) Other Contributing Organizations: None. 6. REFERENCES (a) Readings: Yearbook of Labour Statistics (ILO, Geneva). Bulletin of Labour Statistics (biannual) (ILO, Geneva).
43
Statistical yearbooks and other publications issued by the national statistical offices. Surveys of Economically Active Population, Employment, Unemployment and Underemployment -An ILO Manual on Concepts and Methods (ILO, Geneva, 1992). Sources and Methods: Labour Statistics, Volume 3 - Economically active population, employment, unemployment and hours of work (household surveys), third edition (ILO, Geneva, 2004). Sources and Methods: Labour Statistics, Volume 4- Employment, unemployment, wages and hours of work (administrative records and related sources), second edition (ILO, Geneva, 2004). Sources and Methods: Labour Statistics, Volume 5- Total and economically active population, employment and unemployment (population censuses), second edition (ILO, Geneva, 1996) (third edition under preparation). ILO-comparable annual employment and unemployment estimates, in Bulletin of Labour Statistics, 2004-4 (ILO, Geneva, 2004) System of National Accounts 1993 (Commission of the European Communities, International Monetary Fund, Organization for Economic Co-operation and Development, United Nations, World Bank, Brussels/Luxembourg, New York, Paris, Washington, D.C., 1993) Current international recommendations on labor statistics (ILO, Geneva, 2000). See in particular: Resolution concerning Statistics of the Economically Active Population, Employment, Unemployment and Underemployment, adopted by the Thirteenth International Conference of Labour Statisticians (October 1982). (b) Internet sites: International Labour Office, Bureau of Statistics: the ILO's statistical database on labor statistics, including unemployment data and ILO-comparable estimates: http://laborsta.ilo.org International recommendations on labor statistics, including the resolution concerning statistics of the economically active population, employment, unemployment and underemployment: http://www.ilo.org/public/english/bureau/stat/res/index.htm Key Indicators of the Labour Market, Geneva, 2003 (available on CD-ROM; sample tables on web site): http://www.ilo.org/public/english/employment/strat/kilm/
44
Theme 13: Economic Development Sub-Theme: Information and Communication Technologies Indicator 11: Internet users per 100 Population
INTERNET USERS PER 100 POPULATION Economic development Information and communication
technologies Core
indicator 1. INDICATOR (a) Name: Internet users per 100 population. (b) Brief Definition: Internet users are those who use the Internet from any location. The Internet is defined as a world-wide public computer network that provides access to a number of communication services including the World Wide Web and carries email, news, entertainment and data files. Internet access may be via a computer, Internet-enabled mobile phone, digital TV, games machine etc. Location of use can refer to any location, including work. The indicator is derived by dividing the number of Internet users by total population and multiplying by 100. (c) Unit of Measurement: Number of users per 100 population. (d) Placement in the CSD Indicator Set: Economic development/ Information and communication technologies 2. POLICY RELEVANCE (a) Purpose: The number of Internet users is a measure of Internet access and use. (b) Relevance to Sustainable/Unsustainable Development (theme/sub-theme): As an information distribution system, the Internet and its usage provide opportunities for bringing education and information within the reach of all. It can significantly shorten time lags as well as opening up a new range of information resources. It also opens up significant, new economic opportunities as well as possibilities for more environment-friendly options for the marketplace. The Internet can allow businesses from developing nations to leapfrog into the development mainstream and offer considerable promise in facilitating the delivery of basic services, such as health and education, which are unevenly distributed at present. (c) International Conventions and Agreements: WSIS documents and targets and ITU Strategic plan highlighting the need to bridge the national and international digital divide in ICTs (d) International Targets/Recommended Standards: World Summit on the Information Society (WSIS) target 10 (2015): “To ensure that more than half the world's inhabitants have access to ICTs within their reach.” Millennium Development Goals (MDGs) target 18 “In cooperation with the private sector, make
45
available the benefits of new technologies, especially information and communications (e) Linkages to Other Indicators: There are also other variables (e.g., hosts and subscribers) which provide a measure of how many people are accessing the Internet. This indicator is also related to other telecommunication indicators (e.g. main telephone lines, mobile cellular subscribers), as well as income and education indicators. 3. METHODOLOGICAL DESCRIPTION (a) Underlying Definitions and Concepts. The Internet is a linked world-wide network of computers in which users at any one computer can, if they have permission, get information from other computers in the network. For most developed and larger developing nations, Internet users’ data are based on methodologically sound user surveys conducted by national statistical agencies or industry associations. These data are either directly provided to the ITU by the country concerned or the ITU does the necessary research to obtain the data. For countries where Internet user surveys are not available, the ITU calculates estimates based on average multipliers for the number of users per subscriber. The ITU is currently, through the Partnership on Measuring ICT for Development, trying to get more countries to collect more, better and harmonized Internet users' data40. The number Internet users are part of the core list of ICT indicators, which has been adopted by this Partnership. This means that more countries will start to collect this data through official surveys (such as a stand-alone household ICT survey or as a modules to existing household surveys) and that the quality of data should improve over time. (b) Measurement Methods: Internet users’ data are collected through Internet user surveys. For countries where Internet user surveys are not available, data can be estimated based on average multipliers for the number of users per Internet subscriber. (c) Limitations of the Indicator: Data for the indicator is not universally available in most developing countries although improvements in this area are currently being made. (d) Status of the methodology: In the past, the number of Internet users was often based on multipliers (e.g., a certain number per Internet subscriber). As the commercialization of the Internet has grown, so has the use of Internet use surveys by both market research companies as well as statistical offices to count the number of Internet users. (e) Alternative Definitions: not available 4. ASSESSMENT OF DATA (a) Data Needed to Compile the Indicator: Total population, number of Internet users. (b) National and International Data Availability and Sources: A number of government agencies, typically communication regulators and national statistical agencies are compiling country-level Internet user data. At the international level, the International Telecommunication Union collects data across countries.

46
(c) Data References: World Telecommunication Indicators Database, International Telecommunication Union; World Telecommunication Development Report, ITU; Yearbook of Statistics, ITU. 5. AGENCIES INVOLVED IN THE DEVELOPMENT OF THE INDICATOR (a) Lead Agency: The lead agency is the International Telecommunication Union (ITU). The contact point is the Head, Market, Economic and Finance Unit, Telecommunication Development Bureau (BDT), ITU; fax no. (41-22) 730-6449. (b) Other Contributing Organizations: None. 6. REFERENCES (a) Readings: World Telecommunication Report, various years, ITU Telecommunication Indicator Handbook (b) Internet site: http://www.itu.int/ict
47
Theme 13: Economic Development Sub-Theme: Information and Communication Technologies Indicator 12: Fixed Telephone Line and cellular Subscribers per 100 Population (NC)
FIXED TELEPHONE LINES PER 100 POPULATION Economic
development Information and communication
technologies Core
indicator 1. INDICATOR (a) Name: Fixed telephone per 100 population (b) Brief Definition: The indicator is derived by dividing the number of fixed telephone lines by the population and multiplying by 100. (c) Unit of Measurement: Measured as the % of population. (d) Placement in the CSD Indicator Set: Economic development/ Information and communication technologies. 2. POLICY RELEVANCE (a) Purpose: Together with the indicator ‘mobile cellular subscribers’, this indicator is the broadest and most common measurement of the degree of telecommunication development in a country. (b) Relevance to Sustainable/Unsustainable Development (theme/sub-theme): Telecommunications and social, economic, and institutional development are closely linked. Modern communications is considered to be relatively benign to the environment. There is unlikely to be sustainable development without a well-developed communications infrastructure. Communications is critical to support sustainable development. (c) International Conventions and Agreements: WSIS documents and targets and ITU Strategic plan highlighting the need to bridge the national and international digital divide in ICTs. (d) International Targets/Recommended Standards: World Summit on the Information Society (WSIS) target 10 (2015): “To ensure that more than half the world's inhabitants have access to ICTs within their reach.” Millennium Development Goals (MDGs) target 18 “In cooperation with the private sector, make available the benefits of new technologies, especially information and communications (e) Linkages to Other Indicators: The linkages between this indicator and other sustainable development indicators are many. For instance, a well-developed communication infrastructure will reduce the need for transport with beneficial effects on the environment.
48
Another example is the requirement of telecommunications for the innovative delivery of health and educational services. Yet, another example is the potential of telecommunications for reducing economic and social gaps within an economy and assisting to reduce the need for urbanization. Access to telecommunications provides those in rural and remote areas with contact to the outside world, reducing their sense of isolation and providing them with a tool to improve economic, social and cultural awareness. 3. METHODOLOGICAL DESCRIPTION (a) Underlying Definitions and Concepts: Fixed telephone lines refer to telephone lines connecting a customer's terminal equipment (e.g., telephone set, facsimile machine) to the Public Switched Telephone Network (PSTN) and which have a dedicated port on a telephone exchange. (b) Measurement Methods: The indicator is derived by dividing the number of fixed telephone lines by the population and multiplying by 100. (c) Limitations of the Indicator: There is concern that fixed lines per 100 inhabitants does not always accurately reflect the degree of telecommunications development. First, there are other indicators of telecommunication development such as data network subscribers. Second, fixed lines on a country level does not indicate the breakdown of the distribution of lines into business or residential or urban and rural although this disaggregated information is available for some countries. The indicator provides no measure of the quality or reliability of the telephone service. (d) Status of the methodology: The indicator is widely used in over 200 economies around the world. (e) Alternative Definitions: If accessibility is a main interest, then the number of households with telephone (fixed or mobile) service may be more relevant especially for countries which have large households. 4. ASSESSMENT OF DATA (a) Data Needed to Compile the Indicator: The data needed to compile the indicator are fixed telephone lines and population. (b) National and International Data Availability and Sources: The International Telecommunications Union (ITU) collects this information on an annual basis. Data are available for 1960, 1965, 1970, and annually from 1975 onwards. Population data is widely available from UN agencies. (c) Data References: World Telecommunication Indicators (WTI) database, International Telecommunication Union; World Telecommunication Development Report, ITU; Yearbook of Statistics, ITU.
49
5. AGENCIES INVOLVED IN THE DEVELOPMENT OF THE INDICATOR (a) Lead Agency: The lead agency is the International Telecommunications Union (ITU). The contact point is the Head, Market, Economics and Finance Unit, ITU; fax no. (41 22) 730 6449. (b) Other Contributing Organizations: None. 6. REFERENCES (a) Readings: Definitions, methodology and other information regarding telecommunication indicators can be found in the ITU's Telecommunication Indicator Handbook. Application of the indicator including country data can be found in the ITU's World Telecommunication Development Report. The data are also provided by the ITU to other agencies and appear in the following publications: UN Statistical Yearbook, World Bank World Development Indicators, UNDP Human Development Report, and OECD Communication Outlook and EUROSTAT Communications Statistics. (b) Internet site: http://www.itu.int/ict

50
Theme 13: Economic Development Sub-Theme: Information and Communication Technologies Indicator 13: Mobile Cellular Telephone Subscribed per 100 Population
MOBILE CELLULAR TELEPHONE SUBSCRIBERS PER 100 POPULATION Economic development Information and communication
technologies Core indicator
1. INDICATOR (a) Name: Mobile cellular telephone subscribers per 100 population (b) Brief Definition: The indicator is derived by dividing the number of mobile cellular telephone subscribers by the population and multiplying by 100. (c) Unit of Measurement: Measured as the % of population. (d) Placement in the CSD Indicator Set: Economic development/ Information and communication technologies 2. POLICY RELEVANCE (a) Purpose: This indicator, together with the fixed telephone lines, is the broadest and most common measurement of the degree of telecommunication development in a country. (b) Relevance to Sustainable/Unsustainable Development (theme/sub-theme): Telecommunications and social, economic, and institutional development are closely linked. Modern communications is considered to be relatively benign to the environment. There is unlikely to be sustainable development without a well-developed communications infrastructure. Communications is critical to support sustainable development. (c) International Conventions and Agreements: WSIS documents and targets and ITU Strategic plan highlighting the need to bridge the national and international digital divide in ICTs. (d) International Targets/Recommended Standards: World Summit on the Information Society (WSIS) target 10 (2015): “To ensure that more than half the world's inhabitants have access to ICTs within their reach.” Millennium Development Goals (MDGs) target 18 “In cooperation with the private sector, make available the benefits of new technologies, especially information and communications (e) Linkages to Other Indicators: The linkages between this indicator and other sustainable development indicators are many. For instance, a well-developed communication infrastructure will reduce the need for transport with beneficial effects on the environment. Another example is the requirement of telecommunications for the innovative delivery of health

51
and educational services. Yet, another example is the potential of telecommunications for reducing economic and social gaps within an economy and assisting to reduce the need for urbanization. Access to telecommunications provides those in rural and remote areas with contact to the outside world, reducing their sense of isolation and providing them with a tool to improve economic, social and cultural awareness. 3. METHODOLOGICAL DESCRIPTION (a) Underlying Definitions and Concepts: Mobile cellular telephone subscribers refer to users of portable telephones subscribing to an automatic public mobile telephone service using cellular technology, which provides access to the Public Switched Telephone Network PSTN. (b) Measurement Methods: The indicator is derived by dividing the number of mobile cellular telephone subscribers by the population and multiplying by 100. (c) Limitations of the Indicator: The indicator provides no measure of the quality or reliability of the telephone service. (d) Status of the methodology: The indicator is widely used in over 200 economies around the world. (e) Alternative Definitions: If accessibility is a main interest, then the number of households with telephone (fixed or mobile) service may be more relevant especially for countries which have large households. 4. ASSESSMENT OF DATA (a) Data Needed to Compile the Indicator: The data needed to compile the indicator are mobile cellular telephone subscribers and population. (b) National and International Data Availability and Sources: The International Telecommunications Union (ITU) collects this information on an annual basis. Data are available for 1960, 1965, 1970, and annually from 1975 onwards. Population data is widely available from UN agencies. (c) Data References: World Telecommunication Indicators (WTI) database, International Telecommunication Union; World Telecommunication Development Report, ITU; Yearbook of Statistics, ITU. 5. AGENCIES INVOLVED IN THE DEVELOPMENT OF THE INDICATOR (a) Lead Agency: The lead agency is the International Telecommunications Union (ITU). The contact point is the Head, Market, Economics and Finance Unit, ITU; fax no. (41 22) 730 6449. (b) Other Contributing Organizations: None.

52
6. REFERENCES (a) Readings: Definitions, methodology and other information regarding telecommunication indicators can be found in the ITU's Telecommunication Indicator Handbook. Application of the indicator including country data can be found in the ITU's World Telecommunication Development Report. The data are also provided by the ITU to other agencies and appear in the following publications: UN Statistical Yearbook, World Bank World Development Indicators, UNDP Human Development Report, and OECD Communication Outlook and EUROSTAT Communications Statistics. (b) Internet site: http://www.itu.int/ict

53
Theme 13: Economic Development Sub-Theme: Tourism Indicator 14: Tourism Contribution to GDP and Employment
TOURISM CONTRIBUTION TO GDP Economic Development Tourism Core indicator
1. INDICATOR (a) Name: Tourism contribution to Gross Domestic Product (TGDP). (b) Brief Definition: The sum of the value added (at basic prices) generated by all industries in response to internal tourism consumption and the amount of net taxes on products and imports included within the value of this expenditure (c) Unit of Measurement: national currency (d) Placement in the CSD Indicator Set: Economic Development/Tourism. 2. POLICY RELEVANCE (a) Purpose: GDP generated by visitor consumption is the most comprehensive aggregate illustrating the economic relevance of tourism. There is an increasing consensus on the importance of tourism as a strategic sector in the national economy insofar as it provides an essential contribution to the economic well-being of the resident population contributes to the economic objectives of governments and shows its possible role as a relevant player in moving towards a more innovative economy. (b) Relevance to Sustainable/Unsustainable Development (theme/sub-theme): Tourism comprises the activities of persons travelling to and staying in places outside their usual environment for not more than one consecutive year for leisure, business and purposes other than being employed in the place visited This activity of visitors refers both to non-residents, residents travelling in the country of residence and abroad for tourism purposes (leisure and others) and it is conceptualized as inbound, domestic and outbound tourism, respectively. Although defined from the demand side, the economic analysis of tourism requires nevertheless the identification of the resources used by visitors on their trips, the consumption of goods and services that they acquire, and therefore the identification of the economic units that provide those goods and services. Both the demand and the supply perspectives are of particular importance. These sets of flows (both physical and monetary) impact different areas such as travelling, physical planning at destinations, employment and general economic performance, natural and cultural heritage. Consequently, tourism impacts upon the sustainability of national and local
54
economies and the environmental and socio-cultural resource base. (c) International Conventions and Agreements: the United Nations Statistical Commission approved in 2000 the Tourism Satellite Account (TSA) conceptual framework as a new international standard in tourism statistics. As mentioned in the official document (Tourism Satellite Account: Recommended Methodological Framework) the TSA takes the form of a basic system of concepts, classifications, definitions, tables and aggregates linked (“satellite”) to the standard tables of 1993 System of National Accounts (SNA) from a functional perspective. Consequently, TSA aggregates (such as Tourism GDP and related indicators) are comparable with other internationally recognized macroeconomic aggregates and compilations (d) International Targets/Recommended Standards: UNWTO General Assembly approved in his last meeting (Dakar, Senegal 28 November-2 December 2005) the document “UNWTO Agenda 2010” which identifies the following expected results and performance indicators regarding statistics: - two-thirds of members countries using United Nations tourism statistics standards; - two-thirds of the countries of the world regularly providing statistical data for the Compendium of Tourism Statistics; - one-third of member countries having a TSA compliant with United Nations standards; - one-third of member countries publishing significant data on employment in tourism, within the framework of WTO/ILO cooperation; - one-third of member countries engaged in improving knowledge of the “travel” item of the balance of payments, within the framework of WTO/IMF cooperation. (e) Linkages to Other Indicators: the relationship of TGDP and other aggregates from the point of view of supply is indicated in the TSA official document
Value added of tourism industries (VATI)
Tourism value added (TVA)
Tourism gross domestic product (TGDP)
Value added (at basic prices) generated by the supply to visitors by the tourism industries
Yes
Yes
Yes
Value added (at basic prices) generated by the supply to non-visitors by the tourism industries
Yes
No
No
Value added (at basic prices) generated by the supply to visitors by activities not in the tourism industries
No
Yes
Yes
55
Value added (at basic prices) generated by the supply to non-visitors by activities not in the tourism industries
No
No
No
Net taxes on products and imports included in the value of internal tourism consumption (at purchasers’ prices)
No
No
Yes
It is important to address three issues here: • The only indicators strictly characterizing tourism supply emerge from tourism value added and tourism GDP. Value added of tourism industries (VATI) is a measure of the supply side of tourism but is not sufficiently well defined in terms of its links to visitor consumption to allow it to be the most accurate measure of tourism supply; • Tourism value added and tourism GDP can provide measures of the economic importance of tourism in a country in the same sense as the GDP of any productive activity does. However, they do not refer to tourism as a productive activity comparable to productive activities in 1993 SNA. They are indicators emanating from a reconciliation of tourism consumption and supply, and their values will depend on the scope of measurement of visitor consumption that a country adopts; • The estimation of tourism value added and tourism GDP relies on a number of measurement assumptions, and thus special care must be taken when using or interpreting these aggregates. The TSA also identifies other related aggregates and indicators such as internal tourism consumption (both in cash and in kind), tourism employment and tourism gross fixed capital formation 3. METHODOLOGICAL DESCRIPTION (a) Underlying Definitions and Concepts: Travel relates to the displacement of persons between different geographic locations, for any type of purpose and for less than a year. Those who travel are usually called travelers. Travel can happen within a country or region or involve more than one country. Travel has an economic impact mainly in the places visited by the traveler, and has become an important field of economic observation. In Not all travelers are visitors: Generally speaking, tourism is more limited than travel as it refers to specific types of trips: those that take the traveler outside his/her usual environment for less than a year and for a purpose other than being employed in the place visited. Individuals when taking such trips are called visitors. “Tourism” is therefore a subset of “Travel” both in an international context and in a domestic one. This distinction is crucial both for the compilation of data on flows of travelers and for analysis of mobility.

56
Tourism statistics identify tourism characteristic products as those products (following the Central Product Classification - CPC) which, in the absence of visitors, in most countries would probably cease to exist in meaningful quantity or for which the level of consumption would be significantly reduced and for which it seems possible to obtain statistical information. Once the set of tourism characteristic products is defined, the identification of tourism characteristic activities (or tourism industries) may be closed, since they can be identified (following the International Standard Industrial Classification of All Economic Activities- ISIC) as productive activities that produce a principal output which has been identified as characteristic of tourism. Due to the criteria given for the determination of tourism characteristic products, some activities may be considered as characteristic of tourism because of the importance of this typical commodity for the visitors even though their typical output is not principally sold to visitors. This is the case for restaurants, or for transport services where commuting is important, or when the activity of freight transportation cannot be separated statistically from that of passenger transportation. One important feature of tourism characteristic activities is that they must serve the visitors themselves, that is, there must be a direct contact between the provider of the product and the consumer. Although a direct physical relationship is very often involved in the delivery of the goods and services to the visitor, the term “direct contact” cannot be reduced to physical contact but must be used in a broader sense, in accordance with the objective of measuring the economic impact of tourism in a macroeconomic context. Definition of GDP can be found in other CSD-ISD files (b) Measurement Methods: Physical indicators associated to the flow of visitors (number of tourism displacements –trips by overnight and same day visitors and their characteristics-, as well as overnights) continue to be basic of the measurement of tourism from the demand side , but it is no less true that countries now need additional information and indicators to improve the measurement of the economic contribution of tourism. Without doubt, the estimation of the expenditure associated to the different forms of tourism (inbound, domestic and outbound) is the main priority. In the case of inbound and outbound tourism, the measurement and characterization of flows of visitors is usually based on that of non-residents entering the country for a duration of less than a year, and is performed at the borders, either using Entry/Departure cards, or using surveys at the borders usually at the moment the non residents leave the country, although a few countries, combine in an integrated manner both instruments (administrative controls and surveys). Some countries, mainly from Europe where controls at the borders have disappeared, also make measurements in the place of accommodations (either as a complement to border surveys or as an alternative to them) In the case of domestic tourism, as there are no borders to cross under administrative control, the observation of the flows of domestic tourism requires surveys and not just administrative procedures. UNWTO considers household surveys to be the most efficient and suitable instrument for measuring domestic tourism activity. Usually they use a stratified sample using demographic (size of habitat) and socio-economic criteria
57
Daily average expenditure by visitors has to be estimated mainly using specific questions within a survey applied to visitors. Alternative estimation methods are different type of administrative data (such as bank reporting systems, transportation expenditures provided by companies or transportation regulatory authorities, etc.). In addition, some components might be estimated from other sources, as for instance those related to vacation homes, time share and social transfers in kind Finally, estimation of total visitor consumption takes into account the number of trips (estimated by the arrivals/ departures of visitors) and the average daily expenditure by visitors. From the supply side, it should be remembered that in order for individuals to take tourism trips to a given country or location, an infrastructure of services must be in place to respond to their specific needs: basically this means that modes of transport and transportation facilities, different types of accommodation, food serving services, recreation facilities, as well as other services. The measurement of tourism supply is therefore linked to the proportion of visitors consumption of different type of industries output (not just tourism industries but others): estimation of tourism ratios is the key issue in this regard. (c) Limitations of the Indicator: The level of development of national systems of tourism statistics explains the basic limitations of Tourism GDP both in terms of number of information available and the coverage of basic variables. The reconciliation of information on consumption and supply in the economy is at the core of the TSA exercise. UNWTO recommends, when obtaining and disseminating tourism statistics, to be sure that the data present a basic structure of consistency, internally and with the representation of the remainder of the economy. This consistency should be checked and this control could cover the following aspects: - Overnights by visitors, supply of beds and bed occupancy rates in organized paid accommodation - Income per room or person night and expenditure per person night in organized paid accommodation - Consistency in the sequences of income per person night among categories of accommodation establishments - Consistency of expenditure by visitors as compared to total supply for some specific tourism products (d) Status of the Methodology: The methodology is well established in the TSA official text: nevertheless, an Inter-Agency Coordination Group on Tourism Statistics has been created in order to bringing closer the conceptual framework of TSA to the revision of 1993 SNA and Balance of Payment Manual (BPM5) and introduce editorial amendments to the present text for clarification purposes
58
(e) Alternative Definitions/Indicators: UNWTO has designed as a complementary initiative to TSAs work in progress, the development of a number of macroeconomic indicators based on tourism statistics, Balance of Payment and National Account items generally available in most countries. It should be remembered that the TSA is a medium term project. A total of 55 indicators have been identified and classified in the following groups:
1. Basic macroeconomic equilibrium 2. Production 3. Consumption and prices 4. Employment and wages 5. Investment
UNWTO warns about the possibility that once certain countries have their own TSA, the results indicate a different situation regarding the impact of tourism on the economy to that initially foreseen using the indicators proposed here. However, it is also possible that the new data (TSA aggregates and related indicators) will offer greater credibility as they will be the result of rationalization of the basic statistical research and the application of several consistency tests applied during development of the summary statistics. 4. ASSESSMENT OF DATA (a) Data Needed to Compile the Indicator: arrivals of international visitors, trips by resident visitors in the country of reference, international departures by resident visitors, expenditure and production of goods and services demanded by visitors, tourism share values (how much value of the variable is attributable to visitor consumption), tourism related imported goods. (b) National and International Data Availability and Sources: about 70 countries are right now in either of these situations: a) they already have an established Tourism Satellite Account, b) expecting that the implementation of their TSA will be highly developed during the next three years and also; or c) countries that have recently developed relevant macroeconomic studies on the economic importance of tourism. (c) Data References: UNWTO will start by 2007 to request TSA data and will distribute the results in the “Compendium of Tourism Statistics” 5. AGENCIES INVOLVED IN THE DEVELOPMENT OF THE INDICATOR (a) Lead Agency: United Nations World Tourism Organization (UNWTO), located in Madrid, Spain. Contact: Statistics and Economic Measurement of Tourism ([email protected] ) World Tourism Organization Capitán Haya, 42 28020 Madrid – Spain Tel: (+34) 91 5678100 Fax: (+34) 91 5713733

59
(b) Other Contributing Organizations: European Commission, CARICOM 6. REFERENCES (a) Readings: Juan Falconi, (2003) Measuring the Economic Contributions of Tourism: A Proposal for some Basic Indicators, document published in the UNWTO publication “Enzo Paci Papers on Measuring the Economic Significance of Tourism, volume 3” (http://www.unwto.org/statistics/tsa/project/indicators.pdf ) United Nations, World Tourism Organization, Organization for Economic Cooperation and Development and Commission of the European Communities (Eurostat) (2001). Tourism Satellite Account: Recommended Methodological Framework. United Nations, New York. World Tourism Organization. (2005). Tourism as an International Traded Service - A Guide for Measuring Arrivals and Associated Expenditures of Non-Residents (http://www.unwto.org/statistics/border.pdf ) World Tourism Organization (2005). Measuring Domestic Tourism and the Use of Household Surveys (http://www.unwto.org/statistics/sts/strengthening/household.pdf ) World Tourism Organization. (2001). Basic References on Tourism Statistic Measuring visitor expenditure for inbound tourism (http://www.unwto.org/statistics/basic_references/index-en.htm ) World Tourism Organization. (2006). Compendium of Tourism Statistics. World Tourism Organization, Madrid. (a) Internet site: World Tourism Organization http://www.unwto.org/

60
Theme 13: Economic Development Sub-Theme: Research and Development Indicator: Gross Domestic Expenditure on R&D as a Percent of Gross Domestic Product (GDP).
GROSS DOMESTIC EXPENDITURE ON RESEARCH AND DEVELOPMENT AS A PERCENT OF GROSS DOMESTIC PRODUCT
Economic development Research and development
1. INDICATOR (a) Name: Gross Domestic Expenditure on R&D as a Percent of Gross Domestic Product (GDP). (b) Brief Definition: Gross domestic expenditure on scientific research and experimental development (R&D) expressed as a percentage of Gross Domestic Product (GDP). (c) Unit of Measurement: expressed as a percentage (%). (d) Placement in the CSD Indicator Set: Economic development/ Research and development 2. POLICY RELEVANCE (a) Purpose: This ratio provides an indication of the level of financial resources devoted to R&D in terms of the share of the GDP. (b) Relevance to Sustainable/Unsustainable Development (theme/sub-theme): This indicator is required to assess the level and trends of R&D expenditure in relation to GDP, at a given point of time. Adequate R&D funding that is commensurate with economic growth and national income is necessary for ensuring sustainable development. Scientists are improving their understanding on policy-relevant issues such as climate change, growth in resource consumption rates, demographic trends, and environmental degradation. Changes in R&D investments in these and other areas need to be taken into account in devising long-term strategies for development. Scientific knowledge should be applied to assess current conditions and future prospects in relation to sustainable development. (c) International Conventions and Agreements: None. (d) International Targets/Recommended Standards: None. (e) Linkages to Other Indicators: This indicator can be most closely linked with indicator 40: Investment share of GDP, in providing more precise complementary indications on the level of financial resources devoted to R&D. 3. METHODOLOGICAL DESCRIPTION (a) Underlying Definitions and Concepts: The OECD Frascati Manual (2002) defines gross

61
domestic expenditure on R&D (GERD) activities as the total intramural expenditure on research and development performed on the national territory during a given period. This includes both current costs and capital expenditures. It includes R&D performed within a country and funded from abroad but excludes payments for R&D performed abroad. (b) Measurement Methods: The indicator is calculated by dividing gross domestic expenditure on R&D by GDP and expressed as a percentage. Both data on R&D expenditure and GDP can be expressed in current values and in the national currency. (c) Limitations of the Indicator: The indicator does not show the proportion of expenditure on R&D which contributes specifically to sustainable development. To date, most developed and a few developing countries are able to regularly collect and provide internationally comparable and timely data. This indicator is widely used to measure the so-called R&D intensity. However, it is not always the most appropriate indicator when measuring S&T in developing countries. Researchers as a percentage of population, labor force, or employment, might be more pertinent indicators, since they focus on human capacities and skills rather than on expenditure. There are several weaknesses of measuring only expenditure. Expenditure does not reflect the potential of R&D in a given country, but only the effort conducted in a given year. As a single figure, it hides the question if this effort comes from government, private, or foreign sources. A significant part of expenditure corresponds usually to researchers’ salaries, and these depend on the position of researchers in society and also the ups and downs of the economy, and in particular the public sector in developing countries. Data on expenditure can also be of poorer quality, since accounting systems are usually not well set up to reflect R&D. Also, inflation and the existence of vast informal sectors make the analysis of these figures more difficult. (d) Status of the Methodology: Concepts and the corresponding definitions as well as suggestions for the collection of data as set out in the Recommendation Concerning the International Standardization of Science and Technology (UNESCO, 1978) still apply. The OECD Frascati Manual (2002) maps out proposed standard practices for surveys on research and experimental development for OECD countries. The UNESCO Institute for Statistics (UIS) is currently extending this work for non-OECD countries. (e) Alternative Definitions/Indicators: None. 4. ASSESSMENT OF DATA (a) Data Needed to Compile the Indicator: Gross domestic expenditure on R&D and GDP expressed in national currency. (b) National and International Data Availability and Sources: Data on R&D expenditure for 1996 on are available for 114 countries. At the national level, the availability of these data depends on the existence and frequency of R&D surveys. To construct this indicator at the international level, the GDP data can be obtained from the World Bank whilst those relating to R&D expenditure can be obtained through UNESCO Institute for Statistics’ (UIS) international surveys on scientific research and experimental development. At the national level, data on R&D expenditure are collected normally through special R&D surveys conducted by the
62
ministry/department/council of science and technology and/or the central statistical office and/or specialized institutions, whereas those on GDP can be obtained from either the ministry of finance or the central statistical office. (c) Data References: UNESCO Institute for Statistics (UIS) website: http://www.uis.unesco.org 5. AGENCIES INVOLVED IN THE DEVELOPMENT OF THE INDICATOR (a) Lead Agency: The lead agency is the United Nations Educational, Scientific and Cultural Organization (UNESCO). The contact point is the Director, UNESCO Institute for Statistics (UIS); email: [email protected] and fax (1-514) 343-5740. (b) Other Contributing Organizations: The OECD (Organization for Economic Co-operation and Development) and EUROSTAT are two organizations that have been actively developing methodologies and collecting data from their respective member countries on R&D. 6. REFERENCES (a) Readings: UNESCO. Recommendation concerning the International Standardization of Statistics on Science and Technology. Adopted by the General Conference of UNESCO in 1978. UNESCO. Manual for Statistics on Scientific and Technological Activities. 1984. UNESCO. Guide to the Collection of Statistics on Science and Technology. 1984. OECD (Organisation for Economic Co-operation and Development). Proposed Standard Practice for Surveys and Research and Experimental Development, "Frascati Manual". 2002.
(b) Internet site: http://www.uis.unesco.org

63
THEME 14: Global Partnership SUB THEME/ ISSUE Indicators Trade Current Account Deficit as Percentage of GDP
Share of Imports and Exports by Sector for Total GDP External Financing Total Official Development Assistance (ODA) Given or
Received as a Percentage of GNI Net FDI Inflows and Outflows as Percentage of GNI (NC) Remittances as Percentage of GNP (inflows and outflows)

64
Theme 14: Global Partnership Sub-Theme: Trade Indicator 1: Current Account Deficit as Percentage of GDP
CURRENT ACCOUNT DEFICIT AS PERCENTAGE OF GDP Global Economic Partnership External financing Core indicator
1. INDICATOR (a) Name: Current account deficit as share of Gross domestic product (GDP) (b) Brief Definition: The balance of the current account (deficit or surplus) in a country divided by Gross Domestic Product. (c) Unit of Measurement: Percentage (d) Placement in the CSD Indicator Set: Global Economic Partnership/ External financing 2. POLICY RELEVANCE (a) Purpose: Current account balance is a part of the measure of an economy’s savings. Along with net capital transfers and acquisition/disposal of non-produced, non-financial assets, the current account balance represents the net foreign investment or net lending/borrowing position of a country vis-à-vis the rest of the world. (b) Relevance to Sustainable/Unsustainable Development (theme/sub-theme): Persistent current account deficits or surpluses indicate a macroeconomic instability that is not conducive to sustained economic growth and, therefore, to sustained means of implementation of sustainable development goals. Persistent deficits require a reversal in the future, typically through a combination of increased savings (private and/or public), a depreciation of the real effective exchange rate and, possibly, a revaluation of external liabilities. In countries with incomplete financial markets, high current account deficits may, depending on the financing of the deficit, macroeconomic conditions and possible international capital market sentiments, also indicate a risk of future sudden reversal of international financial flows and, thereby, abrupt decrease in the means of implementation of sustainable development goals. (c) International Conventions and Agreements: None. (d) International Targets/Recommended Standards: None (e) Linkages to Other Indicators: This indicator is closely linked to changes in international reserves, capacity to import, and capacity to service debt along with other measures of economic development and macro stability.

65
3. METHODOLOGICAL DESCRIPTION (a) Underlying Definitions and Concepts: The current account covers all transactions (other than those in financial items) that involve economic values and occur between residents and non-resident entities. As per the current 5th edition of the Balance of Payment Manual, the main categories of the current account are goods, services, income (compensation of employees and investment income) and current transfers. The counterparts of the current account are the capital and financial accounts. The major components of the capital account are capital transfers and acquisition/disposal of non-produces/non-financial assets. Standard components of the financial account are direct investment, portfolio investment, other investment and reserve assets. In principle (ignoring measurement problems), the current account equals the inverse of the financial and capital account. Consequently, a current account deficit has to be financed through an increase in financial and non-financial liabilities or a decrease in reserve assets. However due to the difficulties in compiling the data, the balance is often achieved by inserting an errors and omissions row. In some cases the errors and omissions may be larger than other components, especially when the data compiling practices are poor. Gross domestic product (GDP) at purchaser’s prices is the sum of value added by all resident producers in the economy plus any taxes (less subsidies) not included in the valuation of output. No allowances are made for the depreciation of capital assets or the depletion and degradation of natural resources. (b) Measurement Methods: The indicator is derived by dividing the current account by GDP. (c) Limitations of the Indicator: The indicator does not provide information on the financing of a current account deficit, which may contain important information on the sustainability of the deficit. The indicator also does not indicate whether and at which point of time policy measures are appropriate to address current account imbalances. (d) Status of Methodology: The methodology is generally well developed. (e) Alternative Definitions/Indicators: Gross national income (GNI) may be chosen as denominator instead of GDP. The different component of the current account, especially the trade balance, may provide important information on its own. 4. ASSESSMENT OF DATA (a) Data Needed to Compile the Indicator: Balance of payment data for the current account and national accounts data for GDP. (b) National and International Data Availability and Sources: In most countries national statistical offices, central banks, or ministries collect balance of payment statistics and report them to the International Monetary Fund (IMF). The IMF publishes current account data in its Year book of Balance of Payments Statistics, and monthly International Financial Statistic (IFS).

66
The World Bank publishes current account data in its World Development Indicators series (WDI) and World Development Report (WDR). (c) Data References: Information on current account is included in the World Development Indicators of the World Bank, see about the data table 4.15. 5. AGENCIES INVOLVED IN THE DEVELOPMENT OF THE INDICATOR (a) Lead Agency: The lead agency is the World Bank. The contact point is K. M. Vijayalakshmi ((202-473-3827), [email protected] . (b) Other Contributing Organization The IMF, which is the source of international data on the current account. 6. REFERENCES
(a) Readings: International Monetary Fund, Balance of Payment Manual, 5th edition, 1993. International Monetary Fund, Year book of Balance of Payments, various years. World Bank, Word Development Indicators, various years. (b) Internet sites: IMF: http://www.imf.org/external/np/sta/bop/ World Bank: www.worldbank.org/data.

67
Theme 14: Global Partnership Sub-Theme: Trade Indicator 2: Share of Imports and Exports by Sector for Total GDP
SHARE OF IMPORTS AND EXPORTS BY SECTOR FOR TOTAL GDP
Global economic partnership Trade Core indicator 1. INDICATOR (a) Name: Share of Imports and Exports by Sector for Total GDP (b) Brief Definition: This is a measure of the openness of an economy, represented as the sum of exports and imports of goods and services as a ratio of GDP. (c) Unit of Measurement: %. (d) Placement in the CSD Indicator Set: Global economic partnership/External financing 2. POLICY RELEVANCE (a) Purpose: The purpose of this indicator is to measure the openness of a country's economy to international trade. (b) Relevance to Sustainable/Unsustainable Development (theme/sub-theme): In general, international trade promotes better utilization of resources domestically and globally. This relationship between trade and sustainable development is specifically recognized by Agenda 21. Thus, if an economy is more open to international trade, it can benefit more from the given resources. Dynamically, the economy can also benefit from innovative technologies available throughout the world. However, since prices of internationally traded goods and services do not reflect fully environmental costs and benefits, international trade may not always promote better utilization of environmental resources. Also, while the indicator captures the degree to which an economy is integrated with the international economy, it does not show environmental effects (depletion, pollution) associated with particular material flows. (c) International Conventions and Agreements: None. (d) International Targets/Recommended Standards: There is no numerical target for this indicator. The JPOI calls for developing countries, especially the least developed among them, to secure their share in the growth of world trade commensurate with the need of their economic development. (e) Linkages to Other Indicators: This indicator is closely linked to other economic, environmental, and institutional indicators, such as GDP per capita, capital goods imports,

68
imports and exports of hazardous wastes, sustainable development strategies, and ratification and implementation of international agreements. 3. METHODOLOGICAL DESCRIPTION (a) Underlying Definitions and Concepts: Exports and imports of goods and services are standard items in the balance of payments and national accounts. Exports of goods and services consist of sales, barter, or gifts or grants, of goods and services from residents of an economy to non-residents, while imports consist of purchases, barter, or receipts of gifts or grants, by residents from non-residents. Goods include general merchandise, goods for processing, major repairs on goods, goods procured in ports by carriers and non-monetary gold. Services include transportation, communication, travel, construction services, insurance, financial services, computer and information services, royalties and license fees, other business services, personal, cultural and recreational services, and government services. In general, exports and imports of goods are recorded at the market value of the goods at the customs frontier of the economy from which they are exported. Thus, the value of exports or imports do not include customs tariff. Exports and imports of services are valued at the actual price agreed upon between resident and non-resident. GDP is a measure of the value created by the productive activities of the economy's residents. The GDP used for this indicator should be valued at purchasers' prices. (b) Measurement Methods: The indicator is derived by calculate the sum of exports and imports of goods and services and divide by GDP. (c) Limitations of the Indicator: The indicator does not cover all trade in services, due to limited data availability. (d) Status of Methodology: The methodology is well established and constantly reviewed. (e) Alternative Definitions/Indicators: not available 4. ASSESSMENT OF DATA (a) Data Needed to Compile the Indicator: exports and imports of goods and services separated by country, and GDP in national currency terms. (b) National and International Data Availability and Sources: Data for this indicator is generally available. The openness of a country's economy can be derived from national accounts data on exports and imports of goods and services, and GDP in national currency terms. However, when the official exchange rate is significantly appreciated or depreciated in real terms, the openness indicator derived from national accounts data may be distorted. In such cases, the indicator can be computed from the balance of payments data on exports and imports in US dollars and GDP data converted to US dollars at the implicit exchange rate, effectively applied to actual foreign exchange transactions.

69
For the underlying national accounts data, the principal contact is the Statistical Division of the United Nations Department for Economic and Social Information and Policy Analysis (DESIPA); and for the balance of payments data, it is the Statistics Department of the International Monetary Fund (IMF). (c) Data References: United Nations Comtrade for merchandise trade, see http://comtrade.un.org 5. AGENCIES INVOLVED IN THE DEVELOPMENT OF THE INDICATOR (a) Lead Agency: The lead agency involved in the development of this indicator is the World Bank (WB). The contact point is the Chief, Indicators and Environmental Valuation Unit, Environment Department, WB; fax no. (1-202) 477 0968. (b) Other Contributing Organizations: None 6. REFERENCES (a) Readings: United Nations, International Merchandise Trade Statistics: Compiler’s Manual, 2003. United Nations, Manual on International Trade in Services, 2002 World Trade Organization, General Agreement on Trade in Services, Geneva, 1996. (b) Internet site: http://unstats.un.org/unsd/comtrade/default.aspx

70
Theme 14: Global Partnership Sub-Theme: External Financing Indicator 3: Total Official Development Assistance (ODA) Given or Received as a Percentage of GNI
TOTAL OFFICIAL DEVELOPMENT ASSISTANCE GIVEN OR RECEIVED AS A PERCENTAGE OF GROSS NATIONAL INCOME
Global economic partnership External financing Core indicator
1. INDICATOR (a) Name: Total Official Development Assistance (ODA) given or received as a percentage of Gross National Income (GNI). (b) Brief Definition: This indicator is defined as the total ODA given or received as a share of GNI of the source or recipient country, respectively, net of repayment of principal. When ODA flows by donor countries are measured, ODA comprises bilateral disbursements of concessional funds to developing countries and multilateral institutions. When ODA receipts by developing countries are measured, ODA comprises disbursement of concessional finance from both bilateral and multilateral sources. (c) Unit of Measurement: %. (d) Placement in the CSD Indicator Set: Global economic partnership/External financing 2. POLICY RELEVANCE (a) Purpose: The indicator is a measure of the size of flows that are both concessional, and aimed mainly at promoting development and welfare of developing countries. It conveys information about the borrower’s receipts of aid from official lenders or official lender’s concessional flows to developing countries. (b) Relevance to Sustainable/Unsustainable Development (theme/sub-theme): Financial resources are obviously needed for the attainment of sustainable development. Agenda 21 calls for the monitoring of the provision of financial resources, particularly in developing countries, so that the international community can take further action on the basis of accurate and reliable data. (c) International Conventions and Agreements: None. (d) International Targets/Recommended Standards: For developed countries, the United Nations has recommended that ODA should represent 0.7% of GNI. (e) Linkages to Other Indicators: This indicator is particularly linked with the other financial
71
and international cooperation indicators. 3. METHODOLOGICAL DESCRIPTION (a) Underlying Definitions and Concepts: Measurement of Official Development Assistance (ODA) is based on Balance of Payments concepts. See Annex 3 of the Development Assistance Committee (DAC) Statistical Reporting Directives for details (www.oecd.org/dac/stats/dac/directives ). The definition of ODA is given in paragraph 32. (b) Measurement Methods: Official Development Assistance (ODA) consists of grants or loans to developing countries that are undertaken by the official sector with the purpose of promoting economic development and welfare. Grants are defined as disbursements, in money or in kind, for which there is no repayment required. ODA loans are provided at concessional financial terms, which are with a grant element of 25 percent or more. The degree of concessionality is determined by the terms of a loan -interest rate, maturity, and grace period. ODA data are usually presented net. Net flows equal total new flows (gross disbursements) minus amounts received (e.g. repayments of principal, offsetting entries for debt relief, repatriation of capital, and occasionally recoveries on grants or grant-like flows). Gross national income (GNI) is the sum of value added by all resident producers plus any taxes (less subsidies) not included in the valuation of output, plus net receipts of primary income (compensation of employees and property income) from abroad. (c) Limitations of the Indicator: Not Available. (d) Status of Methodology: The methodology is kept under review by the OECD DAC Working Party on Statistics and updated in the Directives referred to above. (e) Alternative Definitions/Indicators: None. 4. ASSESSMENT OF DATA (a) Data Needed to Compile the Indicator: Net Official Development Assistance (ODA) given or received and GNI data. (b) National and International Data Availability and Sources: The unique source of the information is the Organization for Economic Co-operation and Development (OECD)’s DAC statistical system. The OECD data are obtained from donor sources. (c) Data References: The OECD DAC Development Co-operation Report (Statistical Annex) and Geographical Distribution of Financial Flows to Aid Recipients (annual publications). 5. AGENCIES INVOLVED IN THE DEVELOPMENT OF THE INDICATOR (a) Lead Agency: The lead agency is the Organization for Economic Co-operation and Development (OECD). The contact point is the Statistics and Monitoring Division, Development Co-operation Directorate, OECD; e-mail dac.contact@oecd,.org.
72
(b) Other Contributing Organizations: None 6. REFERENCES (a) Readings: OECD.DAC Development Co-operation Report. 2005. OECD.DAC Geographical Distribution of Financial Flows to Aid Recipients. 2006 (b) Internet site: http://ww.oecd.org/dac/stats
73
Theme 14: Global Partnership Sub-Theme: External Financing Indicator 4: Net FDI Inflows and Outflows as Percentage of GNI (NC)
NET FDI INFLOWS AND OUTFLOWS AS PERCENTAGE OF GNI (NC) Global Economic Partnership External financing Core indicator
1. INDICATOR (a) Name: Net FDI Inflows and Outflows as Percentage of GNI (NC) (b) Brief Definition: Total annual current private transfers received by residents in a country plus compensation of employees earned by nonresident workers and migrants’ transfers divided by Gross National Income (GNI). (c) Unit of Measurement: percentage (d) Placement in the CSD Indicator Set: Global Economic Partnership/ External financing 2. POLICY RELEVANCE (a) Purpose: This indicator shows the extent of financial benefit for a country from temporary and permanent movements of its residents who are able to work abroad. (e) Relevance to Sustainable/Unsustainable Development (theme/sub-theme): For many developing countries, remittances are a major and stable source of external financing and thereby provide important means of implementation of sustainable development goals. As a result of increased globalization the importance of remittances has been rapidly increasing in the last decade. (f) International Conventions and Agreements: None. (g) International Targets/Recommended Standards: None (h) Linkages to Other Indicators: This indicator is closely linked to current account, reserves, and other measures of international economic development, and measures of migration. 3. METHODOLOGICAL DESCRIPTION (a) Underlying Definitions and Concepts: Workers’ remittances are defined in the Balance of Payment Manual. In the current, 5th edition, workers’ remittances are defined as current transfers by migrants considered as residents (they are expected to stay and work for more than a year in the new economy) to residents in their country of origin. However, due to difficulty in classifying residents, the World Bank uses an extended definition of remittances which includes, in addition to worker’s remittances, compensation of employees (net wages and

74
salaries of nonresident migrants) and migrant’s capital transfers. For the upcoming revision of the Balance Of Payment Manual, total remittances are defined as the sum of personal transfers, net compensation of employees, capital transfers between households, and social benefits. Gross national product (GNI) is the sum of value added by all resident producers plus any taxes (less subsidies) not included in the valuation of output, plus net receipts of primary income (compensation of employees and property income) from abroad. (b) Measurement Methods: The indicator is derived by dividing remittances (as defined by the World Bank) by GNI. (c) Limitations of the Indicator: It is difficult to measure the exact amount of remittances sent and received both in developed and developing economies due to money transfers through unofficial channels. Furthermore, the indicator does not provide information on the impact of temporary or permanent migration on human capital of a country, which can be negative (temporary or permanent loss of human capital in the form of ‘brain drain’) or positive (skill upgrading of temporary migrants in the form of ‘brain gain’). (d) Status of Methodology: The methodology is generally well developed. The change for the 6th edition of the balance of payment manual increases the alignment with the 1993 System of National Accounts. (e) Alternative Definitions/Indicators: Gross domestic product can be substituted for GNI as the denominator. 4. ASSESSMENT OF DATA (a) Data Needed to Compile the Indicator: Balance of payment data for workers’ remittances, compensation of employees, and migrants’ transfers and national accounts data for GNI. (b) National and International Data Availability and Sources: In most countries national statistical offices, central banks or Ministries collect balance of payment statistics and report them to the International Monetary Fund (IMF). However, in many countries data are incomplete and may not be comparable. The World Bank collects data on remittances based on the Balance of Payment Yearbook of the IMF, resorting to estimates in case balance of payments statistics are incomplete. (c) Data References: Information on remittances is included in the World Development Indicators of the World Bank, see about the data in table 6.14. 5. AGENCIES INVOLVED IN THE DEVELOPMENT OF THE INDICATOR (a) Lead Agency: The lead agency is the World Bank. The contact point is K. M. Vijayalakshmi ((202-473-3827), [email protected] (b) Other Contributing Organizations: IMF 6. REFERENCES

75
(a) Readings: International Monetary Fund, Balance of Payment Manual, 5th edition, 1993. IMF, Committee on Balance of Payments Statistics, Annual Reports, various years. IMF, Balance of Payments Statistics yearbook, various years. World Bank, Word Development Indicators, various years. (b) Internet sites: World Bank: www.worldbank.org/data IMF: http://www.imf.org/external/np/sta/bop/remitt.htm

76
Theme 14: Global Partnership Sub-Theme: External Financing Indicator 5: Foreign Direct Investment net inflows and net outflows as share of GDP
FOREIGN DIRECT INVESTMENT (FDI) NET INFLOWS AND NET OUTFLOWS AS SHARE OF GDP
Global Economic Partnership External financing Core indicator 1. INDICATOR (a) Name: Foreign Direct Investment net inflows and net outflows as share of GDP
(b) Brief Definition: Foreign Direct investment (FDI) is investment made to acquire a lasting interest in or effective control over an enterprise operating outside of the economy of the investor. FDI net inflows are the value of inward direct investment made by non-resident investors in the reporting economy, including reinvested earnings and intra-company loans, net of repatriation of capital and repayment of loans. FDI net outflows are the value of outward direct investment made by the residents of the reporting economy to external economies, including reinvested earnings and intra-company loans, net of receipts from the repatriation of capital and repayment of loans. These series are expressed as shares of GDP. (c) Unit of Measurement: Percentage
(d) Placement in the CSD Indicator Set: Global Economic Partnership/ External financing 2. POLICY RELEVANCE (a) Purpose: These indicators show the provision of external financing resources in the form of direct investments in the reporting economy from foreign investors and to external economies by domestic investors. Negative values of FDI net inflows for a particular year show that the value of disinvestment by foreign investors was more than the value of capital newly invested in the reporting economy. Negative values of FDI net outflows show that the value of direct investment made by domestic investors to external economies was less than the value of repatriated (disinvested) direct investment from external economies. (b) Relevance to Sustainable/Unsustainable Development (theme/sub-theme): For many developing countries, FDI inflows are a major source of external financing and thereby provide important means of implementation of sustainable development goals and growth of the private sector. Moreover, FDI is typically less volatile than foreign portfolio investment. In many cases, FDI also contributes to the transfer (spill-over) of technology and improvement of labor and management skills. Sustained increases in FDI inflows are often a sign of an improved investment climate. Although the largest share of FDI goes from high income economies to other high income economies, flows to developing countries are increasing and are very important in helping to support sustainable development. They now dwarf flows of official development assistance. In recent year, FDI flows between developing countries have

77
also increased. (c) International Conventions and Agreements: None. (d) International Targets/Recommended Standards: None (e) Linkages to Other Indicators: This indicator is closely linked with other measures of international and domestic economic development. 3. METHODOLOGICAL DESCRIPTION (a) Underlying Definitions and Concepts: The internationally accepted definition of FDI is provided in the fifth edition of the IMF’s Balance of Payments Manual (1993). Under this definition FDI has three components: equity investment, reinvested earnings, and short- and long-term inter-company loans between parent firms and foreign affiliates. The components of direct investment capital transactions are recorded on a directional basis (i.e., resident direct investment abroad and nonresident direct investment in the recording economy). The FDI net inflow records the net flow of nonresident direct investment in the recording economy, while the FDI net outflows records the net flow of resident direct investment abroad. Distinguished from other kinds of international investment, FDI is made to establish a lasting interest in or effective management control over an enterprise in another country. As a guideline, the IMF suggests that investments should account for at least 10 percent of voting stock to be counted as FDI. In practice, many countries set a higher threshold. Also, many countries fail to report reinvested earnings, and the definition of long-term loans differs among countries 41 GDP at purchaser's prices is the sum of gross value added by all resident producers in the economy plus any product taxes and minus any subsidies not included in the value of the products. It is calculated without making deductions for depreciation of fabricated assets or for depletion and degradation of natural resources. (b) Measurement Methods: These indicators are derived by dividing net inflows and net outflows of FDI by total GDP. (c) Limitations of the Indicator: Foreign direct investment does not include capital raised locally, which has become an important source of financing for investment projects in some developing countries. In addition, foreign direct investment data capture only cross-border investment flows that involve equity participation and thus omit non-equity cross-border transactions such as intra-firm flows of goods and services. (d) Status of Methodology: The methodology is generally well developed. (e) Alternative Definitions/Indicators: Total private capital investment (direct plus portfolio) as percentage of GDP may be used as indicator to measure the financing provided by foreign investors for development if volatility and technology transfers are not major concerns. A sectoral breakdown of FDI inflows may provide additional information, but it requires information not included in the balance of payments records.
78
4. ASSESSMENT OF DATA (a) Data Needed to Compile the Indicator: Data on foreign direct investment flows from the balance of payment records and GDP data from national accounts records.
(b) National and International Data Availability and Sources: In most countries national statistical offices, central banks or ministries collect the balance of payment statistics which contains records of resident direct investment abroad and nonresident direct investment in the recording economy. The World Bank publishes FDI data based on balance of payment data reported by the International Monetary Fund (IMF), supplemented by staff estimates using data reported by the United Nations Conference on Trade and Development (UNCTAD) and official national sources. UNCTAD publishes data on foreign direct investment in its annual World Investment Report. Because of the multiplicity of sources and differences in definitions and reporting methods, there may be more than one estimate of foreign direct investment for a country, and data may not be comparable across countries.
(c) Data References: Data on FDI is included in the World Development Indicators (WDI) publications and WDI Online database of the World Bank, see http://go.worldbank.org/3JU2HA60D0 and http://go.worldbank.org/6HAYAHG8H0 Data on FDI for developing countries that report to the World Bank’s Debt Reporting System are included in the Global Development Finance (GDF) publications and GDF Online database, see http://go.worldbank.org/KHJME9OSU0 , http://go.worldbank.org/HK59C6HQL0 , and http://go.worldbank.org/6HAYAHG8H0 International Monetary Funds’ data on FDI is available in the Balance of Payment Statistics database, http://www.imfstatistics.org/bop/
UNCTAD data on FDI is available in the World Investment Report and in the Foreign Direct Investment online database, available at http://www.unctad.org/Templates/Page.asp?intItemID=1923&lang=1 5. AGENCIES INVOLVED IN THE DEVELOPMENT OF THE INDICATOR (a) Lead Agency: The World Bank. The contact point is Data Help Desk: [email protected] (b) Other Contributing Organizations: The IMF, which is the source of international data on FDI flows published by the World Bank. 6. REFERENCES (a) Readings: International Monetary Fund, Balance of Payment Manual, 5th edition, 1993. IMF Committee on Balance of Payments Statistics, Annual Report, various years. The World Bank, Word Development Indicators, various years.

79
The World Bank, Global Development Finance, various years. UNCTAD, World Investment Report, various years.
(b) Internet sites: The World Bank: www.worldbank.org/data World Development Indicators: http://go.worldbank.org/3JU2HA60D0 Global Development Finance (GDF) Volume I: http://go.worldbank.org/KHJME9OSU0 Global Development Finance (GDF) Volume II: http://go.worldbank.org/HK59C6HQL0 , IMF: http://www.imf.org/external/pubs/ft/bopman/bopman.pdf UNCTAD: http://www.unctad.org/Templates/Page.asp?intItemID=1923&lang=1
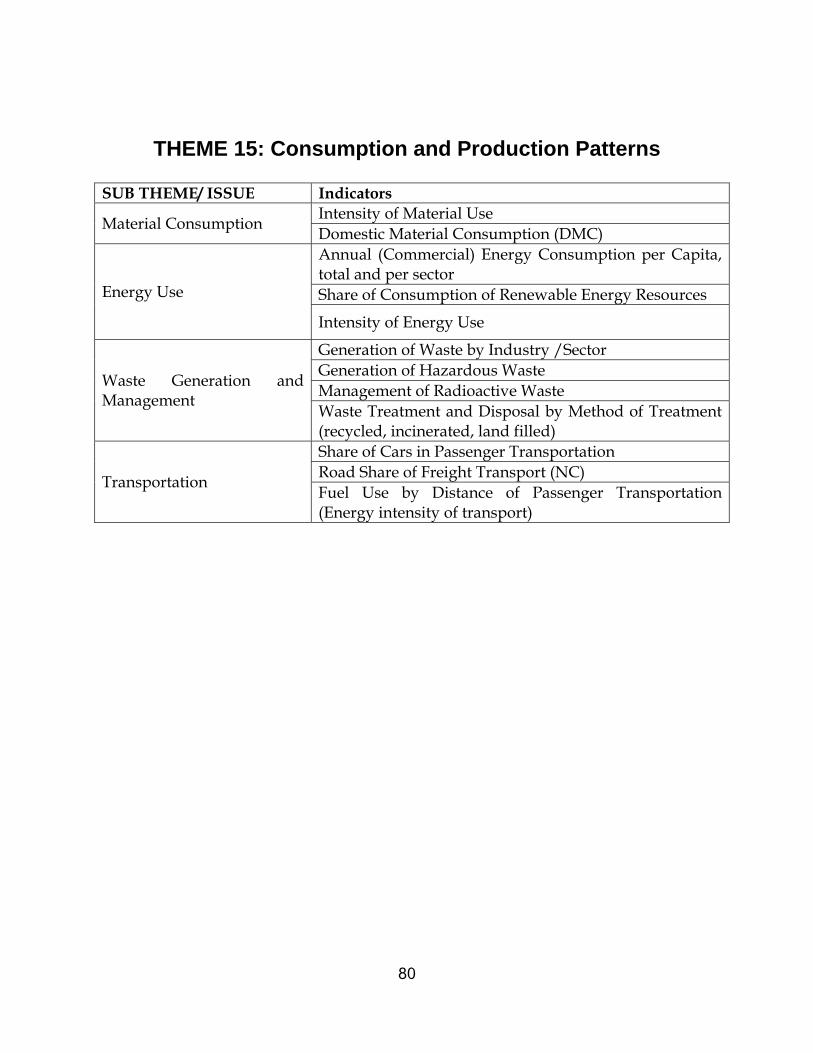
80
THEME 15: Consumption and Production Patterns SUB THEME/ ISSUE Indicators
Material Consumption Intensity of Material Use Domestic Material Consumption (DMC)
Energy Use
Annual (Commercial) Energy Consumption per Capita, total and per sector Share of Consumption of Renewable Energy Resources
Intensity of Energy Use
Waste Generation and Management
Generation of Waste by Industry /Sector Generation of Hazardous Waste Management of Radioactive Waste Waste Treatment and Disposal by Method of Treatment (recycled, incinerated, land filled)
Transportation
Share of Cars in Passenger Transportation Road Share of Freight Transport (NC) Fuel Use by Distance of Passenger Transportation (Energy intensity of transport)
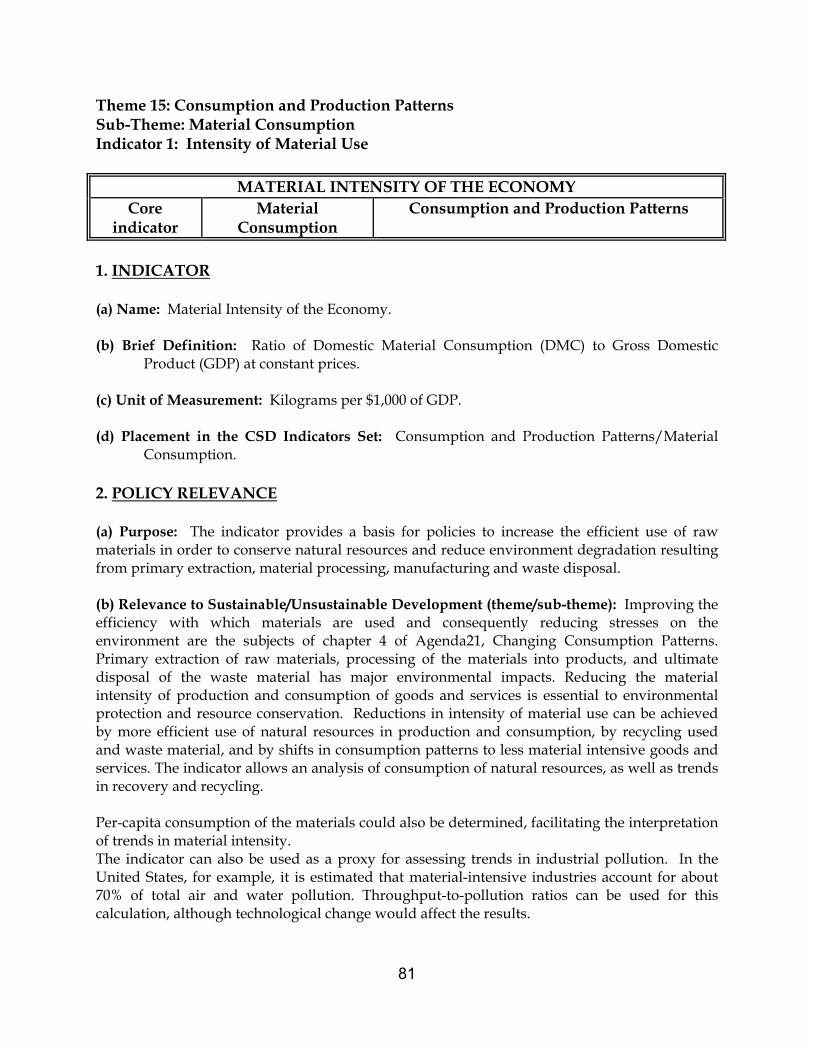
81
Theme 15: Consumption and Production Patterns Sub-Theme: Material Consumption Indicator 1: Intensity of Material Use
MATERIAL INTENSITY OF THE ECONOMY Consumption and Production Patterns Material
Consumption Core
indicator 1. INDICATOR (a) Name: Material Intensity of the Economy. (b) Brief Definition: Ratio of Domestic Material Consumption (DMC) to Gross Domestic
Product (GDP) at constant prices. (c) Unit of Measurement: Kilograms per $1,000 of GDP. (d) Placement in the CSD Indicators Set: Consumption and Production Patterns/Material
Consumption. 2. POLICY RELEVANCE (a) Purpose: The indicator provides a basis for policies to increase the efficient use of raw materials in order to conserve natural resources and reduce environment degradation resulting from primary extraction, material processing, manufacturing and waste disposal. (b) Relevance to Sustainable/Unsustainable Development (theme/sub-theme): Improving the efficiency with which materials are used and consequently reducing stresses on the environment are the subjects of chapter 4 of Agenda21, Changing Consumption Patterns. Primary extraction of raw materials, processing of the materials into products, and ultimate disposal of the waste material has major environmental impacts. Reducing the material intensity of production and consumption of goods and services is essential to environmental protection and resource conservation. Reductions in intensity of material use can be achieved by more efficient use of natural resources in production and consumption, by recycling used and waste material, and by shifts in consumption patterns to less material intensive goods and services. The indicator allows an analysis of consumption of natural resources, as well as trends in recovery and recycling. Per-capita consumption of the materials could also be determined, facilitating the interpretation of trends in material intensity. The indicator can also be used as a proxy for assessing trends in industrial pollution. In the United States, for example, it is estimated that material-intensive industries account for about 70% of total air and water pollution. Throughput-to-pollution ratios can be used for this calculation, although technological change would affect the results.

82
(c) International Conventions and Agreements: The 2002 WSSD Johannesburg Plan of Implementation has set an objective for 'delinking economic growth and environmental degradation through improving efficiency and sustainability in the use of resources and production processes, and reducing resource degradation, pollution and waste.' (d) International Targets/Recommended Standards: None. (e) Linkages to Other Indicators: This indicator will of course be affected by changes in the DMC indicator. Moreover, this indicator is linked to other indicators which reflect the stage of economic development and the structure of the economy, such as share of manufacturing value-added in GDP and energy use per unit GDP. 3. METHODOLOGICAL DESCRIPTION (a) Underlying Definitions and Concepts: A commonly agreed measurement method is described in the Eurostat methodological guide. (b) Measurement Methods: The calculated volume of DMC is divided by GDP at constant prices to compute material consumption per unit of GDP. (c) Limitations of the Indicator: A ratio using GDP can be misleading as growth in GDP may be driven by relatively small quantities of high-value materials, whereas material consumption is dominated by construction materials. Therefore, it might be preferable to present the 2 elements of the ratio separately, in order to facilitate the analysis of the evolution of both. (d) Status of the Methodology: The Eurostat methodological guide is a worldwide standard reference, and is used by EU and OECD countries and the London Group (UN). There is limited use of indicators of material intensity in some developed countries, with varying methodologies. (e) Alternative Definitions/Indicators: Alternatively, an indicator measuring 'Resource productivity' ($/kg) can be compiled, by dividing GDP at constant prices by DMC. This is, in fact, the inverse ratio to material intensity and useful to calculate "eco-efficiency (€/impact)" an indicator which measures the environment impact. 4. ASSESSMENT OF DATA (a) Data Needed to Compile the Indicator: DMC and GDP at constant prices. (b) National and International Data Availability and Sources: Data is available at national level for some countries having already established MFA and on an international level at OECD and ESTAT: Eurostat has EU15 estimations on DMC/GDP and will have estimations for EU25 by end of 2007 based on a questionnaire containing commonly agreed standard tables - developed by the ESTAT Task Force and coordinated with OECD. (c) Data References: http://europa.eu.int/comm/eurostat

83
5. AGENCIES INVOLVED IN THE DEVELOPMENT OF THE INDICATOR (a) Lead Agency: The lead agency is Eurostat. (b) Other Contributing Organizations: OECD (a joint Eurostat-OECD guidance manual is planned for publication in 2007. United Nations Conference on Trade and Development (UNCTAD), World Resources Institute, and the Wuppertal Institute on Climate, Environment and Energy have contributed to the development of this indicator. 6. REFERENCES (a) Readings: Eurostat. Economy-wide material flow accounts and derived indicators – A methodological guide, 2001 Ndiaye, D. Statistical Study on the Consumption of Metals. Centre d'Economie des Ressources Naturelles, Ecole Nationale Supérieure des Mines de Paris. Paris, 1991. World Resources Institute. World Resources 1994-95, part IV, Chapter 21, 1995. Behrensmeier, R. and S. Bringezu. On the Methodology of Analysing Macro-economic Material Intensity. Wuppertal Institute on Climate, Environment and Energy, Wuppertal Papers, No. 34, April 1995. Hammond, Allen, et al. Environmental Indicators: A Systematic Approach to Measuring and Reporting on Environmental Policy Performance in the Context of Sustainable Development, (Chapter VI and Appendix I). World Resources Institute, Washington, D.C., 1995. Hoffmann, U and D. Zivkovic. Demand Growth for Industrial Raw Materials and its Determinants: An Analysis for the Period 1965-1988. UNCTAD Discussion Papers, No. 50, Geneva, November 1992. (b) Internet site: http://europa.eu.int/comm/eurostat
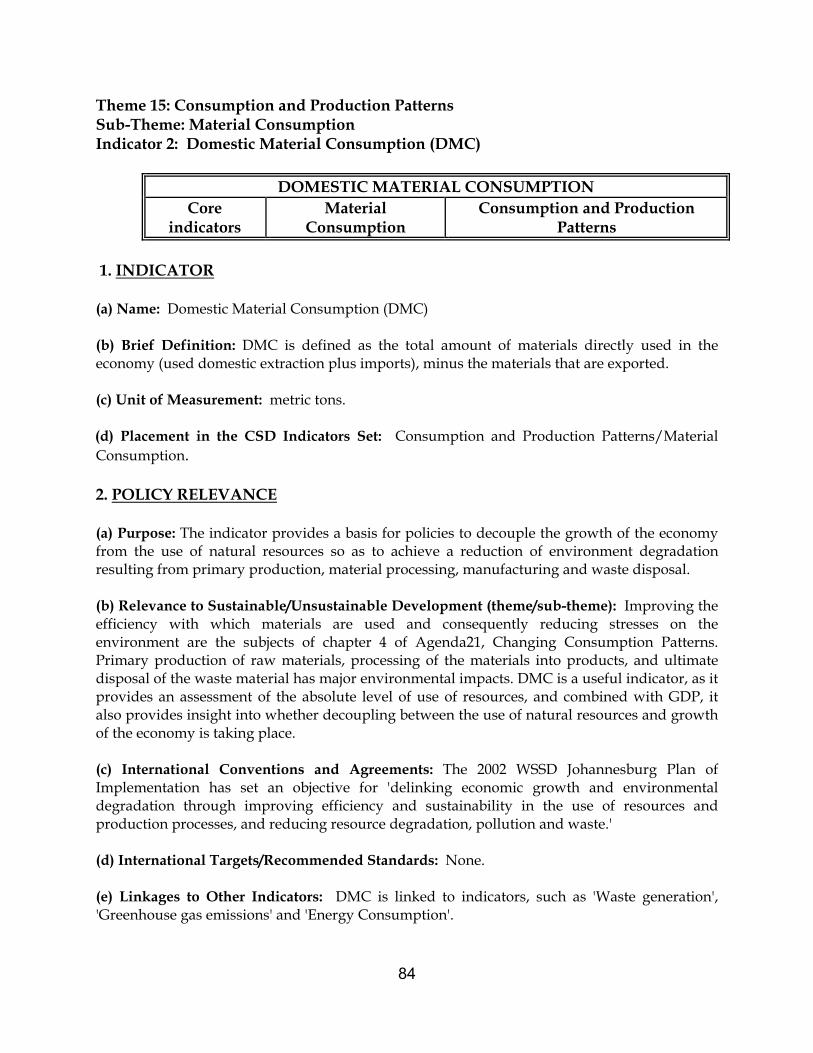
84
Theme 15: Consumption and Production Patterns Sub-Theme: Material Consumption Indicator 2: Domestic Material Consumption (DMC)
DOMESTIC MATERIAL CONSUMPTION Consumption and Production
Patterns Material
Consumption Core
indicators 1. INDICATOR (a) Name: Domestic Material Consumption (DMC) (b) Brief Definition: DMC is defined as the total amount of materials directly used in the economy (used domestic extraction plus imports), minus the materials that are exported. (c) Unit of Measurement: metric tons. (d) Placement in the CSD Indicators Set: Consumption and Production Patterns/Material Consumption. 2. POLICY RELEVANCE (a) Purpose: The indicator provides a basis for policies to decouple the growth of the economy from the use of natural resources so as to achieve a reduction of environment degradation resulting from primary production, material processing, manufacturing and waste disposal. (b) Relevance to Sustainable/Unsustainable Development (theme/sub-theme): Improving the efficiency with which materials are used and consequently reducing stresses on the environment are the subjects of chapter 4 of Agenda21, Changing Consumption Patterns. Primary production of raw materials, processing of the materials into products, and ultimate disposal of the waste material has major environmental impacts. DMC is a useful indicator, as it provides an assessment of the absolute level of use of resources, and combined with GDP, it also provides insight into whether decoupling between the use of natural resources and growth of the economy is taking place. (c) International Conventions and Agreements: The 2002 WSSD Johannesburg Plan of Implementation has set an objective for 'delinking economic growth and environmental degradation through improving efficiency and sustainability in the use of resources and production processes, and reducing resource degradation, pollution and waste.' (d) International Targets/Recommended Standards: None. (e) Linkages to Other Indicators: DMC is linked to indicators, such as 'Waste generation', 'Greenhouse gas emissions' and 'Energy Consumption'.
85
3. METHODOLOGICAL DESCRIPTION (a) Underlying Definitions and Concepts: The indicator is defined as domestic material consumption, broken down by component (exports, imports, domestic extraction), and by material (minerals, biomass, fossil fuels). Direct (used) material inputs are defined as all solid, liquid and gaseous materials that enter the economy for further use in production and consumption processes. Water and air consumption are, apart from the water content of materials, not included. Quantitatively important “memorandum items” for balancing air and water should be included in the input. For example, air is used during the fuel combustion process. Material inputs of domestic origin are classified into three main material groups:
• minerals (metal ores, other industrial minerals, construction materials), • biomass (from agriculture reported by harvest statistics, from agriculture as a by-
product of harvest, from grazing of agricultural animals, from forestry, from fishing, from hunting, from other activities),
• Fossil fuels: hard coal, lignite, crude oil, natural gas, other. • Imports are classified according to their level of manufacturing into: • raw materials, • semi-manufactured products, • finished products • other products (mostly products of the nutrition industry), • packaging material imported with products, • Waste imported for final treatment and disposal. • Each category of imports is further classified according to the basic material
components of the commodities: • fossil fuels (further subdivided by type of fuel), • minerals (further subdivided by metals and non-metallic minerals), • Biomass (from agriculture, forestry, fishing or hunting).
The more complex the material mix of a manufactured product, the more critical its attribution to a “dominant” material category and conversion tables may need to be set up for the detailed attribution of imports to material categories. Exports are classified in the same way as imports. This allows accounting for DMC per category of materials. Agricultural harvest is reported like in agricultural statistics as domestic extraction (from the natural system) while flows of nutrients between the soil and roots of agricultural plants are considered natural flows and not part of material flow accounts. Animal livestock is considered part of the economic system. Consequently, uptake of grass on meadows has to be accounted for as domestic extraction but production of meat and milk are flows within the economic system. Finally, the extraction of metal ores is accounted for as run-of-mine (ROM) or gross ore (i.e. including the sterile parts) and not as metal content. (b) Measurement Methods: The sum of raw materials domestically extracted and imports constitutes the Direct Material Input (DMI). Deducting exports from DMI results in the
86
Domestic Material Consumption (DMC). It is important to note that the term “consumption” as used in DMC denotes “apparent consumption” and not “final consumption”. DMC, thus, is defined in analogy to “total primary energy supply” - TPES (see Haberl 2001). Conceptually, DMC most closely represents a “physical GDP equivalent”. (c) Limitations of the Indicator: A limitation of this indicator is that it does not include unused domestic extraction and indirect flows of imports and exports, thus it is only a proxy for the actual total material consumption. (d) Status of the Methodology: The Eurostat methodological guide is a worldwide standard reference, used by EU and OECD countries and the London Group (UN). National data collection methods may vary significantly from country to country. (e) Alternative Definitions/Indicators: Total Material Consumption (TMC) would be a more complete measure of material use compared to DMC, as it measures the total material use associated with domestic production and consumption activities, including indirect import flows, less export and associated indirect export flows. The main advantage is the possibility of showing the "real" environment impacts (through indirect flows) of production and consumption in the case of outsourcing "dirty" production/extraction to other countries. Some countries are already using this measure; however, there remain difficulties in calculating these indirect flows from a practical point of view. 4. ASSESSMENT OF DATA (a) Data Needed to Compile the Indicator: Data on material flows in and out of the economy, i.e. consumption and trade of all materials. GDP data is needed for visualizing it together with DMC in one graph, in order to assess whether a decoupling effect is taking place. Moreover, for country comparisons GDP per capita could be calculated, for which population data would be needed (b) National and International Data Availability and Sources: Data are available at national level for some countries which have already established Material Flow Accounts (MFA). Economy-wide material flow accounts are generally compiled by national statistical offices. Eurostat has collected data from 15 EU countries, and has recently revised its questionnaire which will be used for all 27 EU Member States and associated countries. (b) Data References: http://europa.eu.int/comm/eurostat 5. AGENCIES INVOLVED IN THE DEVELOPMENT OF THE INDICATOR (a) Lead Agency: The lead agency is Eurostat.
87
(b) Other Contributing Organizations: OECD (a joint Eurostat-OECD guidance manual is planned for publication in 2007. United Nations Conference on Trade and Development (UNCTAD), World Resources Institute, and the Wuppertal Institute on Climate, Environment and Energy have contributed to the development of this indicator. 6. REFERENCES (a) Readings: Eurostat. Economy-wide material flow accounts and derived indicators – A methodological guide, 2001. Eurostat. Development of material use in the EU-15: 1970-2001 - Material composition, cross-country comparison, and material flow indicators, 2005. Ndiaye, D. Statistical Study on the Consumption of Metals. Centre d'Economie des Ressources Naturelles, Ecole Nationale Supérieure des Mines de Paris. Paris, 1991. World Resources Institute. World Resources 1994-95, part IV, Chapter 21, 1995. Hammond, Allen, et al. Environmental Indicators: A Systematic Approach to Measuring and Reporting on Environmental Policy Performance in the Context of Sustainable Development, (Chapter VI and Appendix I). World Resources Institute, Washington, D.C., 1995. Hoffmann, U and D. Zivkovic. Demand Growth for Industrial Raw Materials and its Determinants: An Analysis for the Period 1965-1988. UNCTAD Discussion Papers, No. 50, Geneva, November 1992. (b) Internet site: http://europa.eu.int/comm/eurostat

88
Theme 15: Consumption and Production Patterns Sub-Theme: Energy Use Indicator 3: Annual (commercial) Energy Consumption per Capita, Total and per Sector
ANNUAL ENERGY CONSUMPTION, TOTAL AND BY MAIN USER CATEGORY
Consumption and Production Patterns Energy Use Core indicator
1. INDICATOR (a) Name: Annual energy consumption, total and by main user category (b) Brief Definition: The amount of energy - liquids, solids, gases and electricity – used in a
given year in a country, total, and by main user category. (c) Unit of Measurement: Tonnes of oil equivalent (d) Placement in the CSD Indicator Set: Consumption and Production Patterns/Energy Use 3. POLICY RELEVANCE (a) Purpose: The indicator should be used in combination with energy intensity/efficiency indicators to measure the development of energy use, individual and industrial energy consumption patterns and the energy intensity of a society. When compared in time it shows the trend in the absolute amount of energy used in a country and its distribution among main economic activities and households. (b) Relevance to Sustainable/Unsustainable Development: Energy is a key factor in industrial development and in providing vital services that improve the quality of life. Traditionally energy has been regarded as the engine of economic progress. However, its production, use, and byproducts have resulted in major pressures on the environment, both from a resource use and pollution point of view. The decoupling of energy use from development represents a major challenge of sustainable development. The long term aim is for development and prosperity to continue through gains in energy efficiency rather than increased consumption and a transition towards the environmentally friendly use of renewable resources. On the other hand, limited access to energy is a serious constraint to development in the developing world, where the per capita use of energy is less than one sixth that of the industrialized world. (c) International Conventions and Agreements: Currently there are no international conventions or agreements that specifically refer to the regulation and/or limitation of energy use. However, calls have been made for the prudent and rational utilization of natural resources (Article 174 of the Treaty Establishing the European Community – Nice 2001), improved energy efficiency (The Energy Charter Protocol on Energy Efficiency and Related Environmental
89
Aspects – Lisbon 1994) and a switch to cleaner forms of energy. The United Nations Framework Convention on Climate Change and its Kyoto Protocol call for limitations on total greenhouse gas emissions, which are dominated by CO2 from the combustion of fossil fuels. (d) International Targets/Recommended Standards: None. (e) Linkages to Other Indicators: The indicator is closely linked with other indicators of the economy, with environmental indicators such as climate change, air quality and land use, and also with social indicators. 3. METHODOLOGICAL DESCRIPTION (a) Underlying Definitions and Concepts: Gross inland consumption of energy is a key aggregate in the energy balances. Total consumption of energy refers to “apparent” consumption and is derived from the formula that takes into account production, exports, imports and stock changes. Production refers to the first stage of production. International trade of energy commodities is based on the “general trade” system, that is, all goods entering and leaving the national boundary of a country are recorded as exports and imports. Bunkers refer to fuels supplied to ships and airplanes engaged in international transport, irrespective of the carriers’ flag. In general, data on stocks refer to changes in stocks of producers, importers and/or industrial consumers at the beginning and the end of the year. Consumption of energy by main user categories refers to final consumption. This is a different concept from the one used for total consumption. Apparent consumption refers to primary energy, and includes energy lost to the environment in transformation processes. Final consumption, on the other hand, mixes primary and secondary sources of energy and is linked to the concept of total energy requirement, not taking transformation losses into account. The main user categories should be established ideally at the two-digit level of the International Standard Industrial Classification of Economic Activities (ISIC rev. 4), but at least on the one letter Alpha level. Domestic/household use is a separate category. (b) Measurement Methods: Total energy requirement (gross inland consumption) is calculated from the following formula: Primary production + Imports – Exports – Bunkers +/- Stock changes = Total energy requirement. Consumption by main user categories is available from the national energy balances. (c) Limitations of the Indicator: Apparent consumption may in some cases represent only an indication of the magnitude of actual gross inland availability. The actual value of the indicator is strongly influenced by a multitude of economic, social and geographical factors. When using it as an indicator of sustainability the indicator has to be interpreted in connection with other indicators of economic development and energy use, as smaller or larger values of the indicator do not necessarily indicate more or less sustainable development. (d) Status of the Methodology: The methodology of energy balances has been developed by the United Nations Statistics Division, the International Energy Agency and Eurostat.
90
(e) Alternative Definitions/Indicators: None 4. ASSESSMENT OF DATA (a) Data Needed to Compile the Indicator: Energy commodity data for consumption at the national level and by main user categories. National energy balances. (b) National and International Data Availability and Sources: Energy commodity data for production and consumption are regularly available for most countries at the national level; and for some countries, at the sub-national level. The data are compiled by and available from national statistical offices and country publications. 5. AGENCIES INVOLVED IN THE DEVELOPMENT OF THE INDICATOR (a) Lead Agency: The lead agency is the United Nations Department of Economic and Social Affairs (DESA). The contact point is the Chief of Energy Statistics, Statistics Division. (b) Other Contributing Organizations: Other organizations involved in the indicator development include the International Energy Agency of the Organization for Economic Co-operation and Development (OECD/IEA) and Eurostat. (c) Data References: United Nations: Energy Statistics Yearbook. United Nations: Energy Balances and Electricity Profiles: IEA: Energy Balances of the OECD Countries; Energy Balances of the non-OECD Countries.. 6. REFERENCES (a) Readings: Concepts and Methods in Energy Statistics, with Special Reference to Energy Accounts and Balances. United Nations, 1982. Energy Statistics: Definitions, Units of Measure and Conversion Factors. United Nations, 1987. Energy Statistics: A Manual for Developing Countries. United Nations, 1991. IEA/OECD/Eurostat – Energy Statistics Manual, Paris, France, International Energy Agency (b) Internet Sites: United Nations Statistics Division: http://unstats.un.org/unsd/energy/default.htm International Energy Agency: http://iea.org IAEA, UN DESA, IEA, Eurostat and EEA, 2005. Energy Indicators for Sustainable Development. Vienna, IAEA.
91
Theme 15: Consumption and Production Patterns Sub-Theme: Energy Use Indicator 4: Share of Consumption of Renewable Energy Resources (NC)
SHARE OF RENEWABLE ENERGY SOURCES IN TOTAL ENERGY USE Consumption and Production Patterns Energy use Core indicator
1. INDICATOR (a) Name: Share of renewable energy sources in total energy use (b) Brief Definition: The share of energy from renewable sources in total energy used by the
country. (c) Unit of Measurement: % (d) Placement in the CSD Indicator Set: Consumption and Production Patterns/Energy use 2. POLICY RELEVANCE (a) Purpose: This indicator traces the use of renewable energy as a share of country’s total energy use. (b) Relevance to Sustainable/Unsustainable Development: Chapter 4 of Agenda 21 calls for an improvement of efficiency in the use of energy sources and for a transition towards the environmentally friendly use of renewable resources. Energy is a key aspect of consumption and production. Dependence on non-renewable sources can be regarded as unsustainable in the long term. Renewable sources, on the other hand, can supply energy continuously under sustainable management practices and their use in general create less environmental pressure. The ratio of renewable to non-renewable energy sources represents a measure of a country's energy sustainability. (c) International Conventions and Agreements: Not available. (d) International Targets/Recommended Standards: Some voluntary targets at national and regional levels have been established. (e) Linkages to Other Indicators: Interpretation of this indicator is enhanced when combined with annual energy production, annual energy consumption per capita, and lifetime of proven energy reserves. It is also closely linked to some of the environmental indicators such as greenhouse gas emissions and land use change. 3. METHODOLOGICAL DESCRIPTION (a) Underlying Definitions and Concepts: The two elements comprising this indicator are the
92
consumption of energy from renewable sources, and the total energy consumption. Renewable sources refer to energy collected from current ambient energy flows or from substances derived from them. They can be classified as combustible or non-combustible. Non-combustible renewable includes geothermal, solar, wind, hydro, tide and wave energy. Combustible renewable and wastes include biofuels (biogas, ethanol, biodiesel); biomass products (fuel wood, vegetal waste, pulp and paper waste, animal waste, bagasse), and the portion of industrial and municipal waste (produced by the residential, commercial and public service sectors and collected by the local authorities for disposal) that is used for production of heat and/or power. The total energy consumption can be found in a country’s energy balances under names that can be interchangeably used: “apparent consumption”, "gross inland availability", or “total energy requirements” (b) Measurement Methods: This indicator is computed by dividing the consumption of energy from renewable sources by the total energy consumption. The total energy consumption is calculated from the following formula: Production of primary energy + Imports – Exports – Bunkers +/- stock changes. (Only production of primary energy is taken into account to avoid double-counting). Consumption of energy from renewable sources can be calculated using a similar formula, naturally taking into account only renewable energy sources. However, in some countries, consumption of renewable energy might not always be easily measurable, since exports and imports of energy, and electricity in particular, are often given as totals, without a breakdown by the source. It such cases, the production of energy from renewable sources could be used as a first approximation. (c) Limitations of the Indicator: Data availability; the lack of standardized methodology; the need to use conversion factors; the challenges associated with summation of various forms of energy (e.g., after-losses electricity with pre-losses energy of fossil fuels). Due to potential export and import of renewable energy, there might be significant differences between production of renewable energy and the actual consumption by the country, so in some cases an adjustment to account for these flows might be necessary. (d) Alternative Definitions/Indicators: None 4. ASSESSMENT OF DATA (a) Data Needed to Compile the Indicator: Consumption of energy from renewable resources and wastes; total energy consumption. (b) National and International Data Availability and Sources: National data and estimates on renewable resources are available from national statistical offices and country publications for many countries. The United Nations Statistics Division and the International Energy Agency of
93
the Organization for Economic Co-operation and Development compile data and estimates based on information from national and international sources. Due to the large variety of forms of renewable and their uses, data collection is difficult. Data availability for developing countries may be a limitation. (c) Data References: United Nations: Energy Statistics Yearbook and Energy Balances and Electricity Profiles; International Energy Agency: Energy Balances of OECD Countries, Energy Balances of Non-OECD Countries; Eurostat, Energy Balance Sheets; World Energy Council: Survey of Energy Resources. 5. AGENCIES INVOLVED IN THE DEVELOPMENT OF THE INDICATOR (a) Lead Agency: The lead agency is the United Nations Department of Economic and Social Affairs, Statistics Division. (b) Other Contributing Organizations: Other agencies involved in the development of this indicator are the World Energy Council (WEC), the International Energy Agency of the Organization for Economic Co-operation and Development (OECD/IAE), Eurostat, and the Economic Commission for Europe. 6. REFERENCES (a) Readings: World Energy Council: Survey of Energy Resources. United Nations: Energy Statistics Yearbook United Nations: Concepts and Methods in Energy Statistics, with Special Reference to Energy Accounts and Balances--A Technical Report (http://unstats.un.org/unsd/publication/SeriesF/SeriesF_29E.pdf ) IAEA, UN DESA, IEA, Eurostat and EEA, 2005. Energy Indicators for Sustainable Development. Vienna, IAEA. (b) Internet Sites: United Nations Statistics Division: http://www.un.org/Depts/unsd
94
Theme 15: Consumption and Production Patterns Sub-Theme: Energy Use Indicator 5: Intensity of Energy Use
INTENSITY OF ENERGY USE Consumption and Production Patterns Energy use Core indicator
1. INDICATOR (a) Name: Intensity of Energy Use in the Commercial/Service Sector (b) Brief Definition: Energy consumption per unit of commercial/service sector output or per unit commercial/service sector floor area. (c) Unit of Measurement: Megajoules per US$ (mJ/$) or Megajoules per square meters (mJ/m2). (d) Placement in the CSD Indicator Set: Consumption and Production Patterns 2. POLICY RELEVANCE (a) Purpose: This indicator is used to monitor trends in energy consumption in the commercial/service sector, which is the largest sector of most economies. (b) Relevance to Sustainable/Unsustainable Development (theme/sub-theme): The service sector is less energy intensive than manufacturing, and the growth of the sector relative to manufacturing contributes to the long-term reduction in the ratio of total energy consumption to GDP. The sector, however, is a large consumer of electricity, generation of which contributes to many local or global environmental problems. The transport serves contributes on the highest quantity of energy used compare with other services activities. However, energy use for transport also leads to the depletion of resources and to air pollution and climate change. Reducing energy used in transport can reduce the environmental impacts of transport while maintaining the economic and social benefits. (c) International Conventions and Agreements: There are no international conventions directly related to energy intensities. International conventions on energy emissions, such as the United Nations Framework Convention on Climate Change (UNFCCC) and its Kyoto Protocol, are indirectly related to transport energy intensities. The European Union voluntary commitments on carbon dioxide (CO2) emissions by European, Japanese and Korean car manufacturer associations are for reductions in CO2 emissions per kilometer for new automobiles. (d) International Targets/Recommended Standards: Many industrialized countries have targets for reducing energy use and carbon emissions. (e) Linkages to Other Indicators: this indicator are linked to indicators for total energy use, greenhouse gas emissions and air pollution emissions.
95
3. METHODOLOGICAL DESCRIPTION (a) Underlying Definitions and Concepts: Energy consumption per unit of value added or per unit of floor area in the commercial/service sector is one way of measuring energy requirements and trends in the sector. As with the manufacturing sector, the commercial/service sub-sectors are diverse and difficult to classify. They include sub-sectors that require a great deal of electricity per unit of output (retail trade), those that use large quantities of fuel for water and space cooling (health care establishments), and those that by their nature consume little energy (warehousing, parking). Energy efficiency in this sector is more directly related to the efficiency of general energy services (lighting, ventilation, computing, lifting, etc.) than to the efficiency of the particular sectoral activities. But there are almost no data on actual energy service outputs per unit of energy input (lumens of light, cubic meters of air moved, computing power or use, tonnes raised in lifts, etc.). Hence, the usual measure of energy intensity, Megajoules per unit of output in economic terms (mJ/$), can be a useful indicator provided, it is clear that this summarizes many processes and types of buildings. Because of the differences in processes, it is very important to separate electricity from fossil fuel and purchased heat. It is often difficult to measure and interpret energy intensities per unit of value added within subsectors (private services, public service, etc.) because different activities often take place in the same building, hence, the real partition of energy use between activities is uncertain. In such cases, intensities expressed per unit area disaggregated by building type may be more easily related to real energy efficiencies. However, these have the similar problem that a variety of activities may take place in a particular type of building. A hospital, for example, will contain space for food preparation or laundry services, as well as for health care. Linkages to Other Indicators This indicator is one of a set for energy intensity in different sectors (manufacturing, transportation, commercial/services and residential), with the indicator for energy use per unit of GDP as an aggregate energy intensity indicator. These indicators are also linked to indicators for total energy consumption, greenhouse gas emissions, and air pollution emissions. (b) Measurement Methods: Energy consumption is usually measured at the point of use, i.e., the building or enterprise. Data for buildings must be collected through surveys of building owners, operators, or tenants, while data for enterprises are usually collected through the enterprise’s normal accounting of expenditures or consumption of energy. Note, however, that the correspondence between enterprise and building type can be very loose.
In a few countries, energy consumption in buildings is measured or imputed by surveys of actual buildings (United States, France and Japan, and Sweden for space and water heating only). Where these data exist, they can be used to represent real efficiencies. Cooling energy consumption per sq. meter of floor area cooled is an important example of such a measure. Electricity use per sq. meter is important to measure, but it is difficult to disaggregate into cooling, water heating/cooking, lighting, etc., without recourse to detailed surveys.
Despite all these uncertainties, fuel intensities and electricity intensities recorded separately give useful indicators of space/water heating/cooking on the one hand and electricity services on the other. Primary energy use should be used to aggregate electricity and fuel consumption
Unit: The preferable unit is a multiple of joules, usually terajoules (1012J), petajoules (1015J), or exajoules (1018J).

96
Output: There are different approaches to measuring output in the commercial/service sector, with value added as the most direct measure of economic output. However, for estimating energy efficiency, physical area is preferred because most energy services (cooling, heating, lighting, etc.) are related to the floor area and size of the building. Surveys of floor area by building type have been carried out in many IEA countries. Often, the building type is specifically related to the activity of the enterprise, e.g., school (education), hospital (health care), or restaurant (food services). However, in many cases, particularly for offices and restaurants, buildings contain a mix of activities and enterprises, each with its own energy system and with considerably different energy use patterns.
(c) Limitations of the Indicator: Data availability may limit the disaggregation of the indicator to the desired level. Considerable work is often required to disaggregate energy balances into various modes of transport. Measurement and interpretation of energy intensities are complicated by differences among products within a category, such as size (e.g. automobile weight), engine technology (e.g. gasoline or diesel) and utilization (vehicle occupancy if passenger-km is the measure of output).
(d) Status of the methodology: not available (e) Alternative Definitions: An alternative measure of output that may be useful for measuring the economic impact of the entire sector and its energy use is energy consumption of the sector relative to its GDP share. In this case, it may be desirable to remove the contribution of transportation services as well as the contribution of “implied value of household mortgages and rents”, as transportation is considered as a separate sector and mortgages and rents do not directly involve energy use. However, using service sector energy consumption relative to its share of GDP means that the resulting intensity should not be associated with energy efficiency. As with manufacturing, care must be taken in deflating sectoral GDP to the desired base year.
Unit: Constant US dollar. Market value of output in real local currency is deflated to a base year using GDP deflators corresponding to each branch. Local currency is then converted to a common international currency, normally US dollars, preferably using purchasing power parity for the base year. For floor area, sq. meters of built space is usually the unit, but in some hotter countries, sq. meters of occupied or cooled space is recorded. The difference, which can be significant (up to 10%), reflects unheated spaces, garages and stairwells, etc. 4. ASSESSMENT OF DATA (a) Data Needed to Compile the Indicator: quantity of Energy use by type for each economic activity and GDP for each economic activity are required to calculate this indicator. (b) National and International Data Availability and Sources: National energy balances and energy statistics from the International Energy Agency (IEA) is the main source of data at international level. The central bank and national statistics office are the main source of national data.

97
5. AGENCIES INVOLVED IN THE DEVELOPMENT OF THE INDICATOR (a) Lead Agency: The International Energy Agency (b) Other Contributing Organizations: The International Atomic Energy Agency (IAEA) 6. REFERENCES (a) Readings:
Krackeler, Tom and Lee Schipper, 1998. “Carbon Dioxide Emissions in OECD Service Sectors. The Critical Role of Electricity use”. Energy Policy (February).
Schipper, L., and Steve Meyers, 1986. “Energy Use in the Service Sector. An International Comparison”. Energy Policy (June).
Meyers, S., Ed., 1986. Electricity Use in the Service Sector. “Report of An International Workshop”. Palo Alto, CA: Electric Power Research Institute.
The International Energy Agency: http://www.iea.org/
National Energy Consumption Surveys and Statistical Abstracts. Eurostat, 2003. Energy Efficiency Indicators. Luxembourg, European Communities. IAEA, UN DESA, IEA, Eurostat and EEA, 2005. Energy Indicators for Sustainable Development. Vienna, IAEA. IEA, 1997. Indicators of Energy Use and Energy Efficiency. Paris, France: International Energy Agency (IEA)/Organization for Economic Co-operation and Development (OECD). IEA, 2004. Oil Crises and Climate Challenges: 30 Years of Energy Use in IEA Countries. Paris, France: International Energy Agency. Schipper, L., Figueroa, M.J., Price, L., Espey, M., 1993. Mind the gap: The vicious circle of measuring automobile fuel use. Energy Policy 21(12): 1173–1190. (b) Internet site: International Energy Agency: http://www.iea.org/

98
Theme 15: Consumption and Production Patterns Sub-Theme: Waste Generation and Management Indicator 6: Generation of Waste
GENERATION OF WASTE Consumption and Production
Patterns Waste Generation and
Management Core indicator
1. INDICATOR (a) Name: Generation of Waste. (b) Brief Definition: The amount of all waste, both hazardous and non-hazardous, generated by main groups of industries or sectors of the economy, expressed per capita and per unit of value added (in US $) by economic activity (at constant prices). The recommended categories are based on the International Standard Industrial Classification of All Economic Activities (ISIC) Rev. 4 and include:
- Manufacturing; - Mining and quarrying; - Construction; - Electricity, gas, steam and air conditioning supply; - Agriculture and forestry; - All other economic activities; - Households.
It also can be compiled for the whole economy without the breakdown by economic activity. In this case, it should be divided by Gross Domestic Product (GDP) (at constant prices). (c) Unit of Measurement: kg/capita and kg/US $. (d) Placement in the CSD Indicator Set: Economic/Consumption and Production Patterns/Waste Generation and Management. 2. POLICY RELEVANCE (a) Purpose: The main purpose is to show the trend in the generation of waste produced by different human activities. Waste generation per capita allows comparisons of countries with similar economies, while waste generated per unit of value added will show if there has been any decoupling of waste generation from economic growth. For each industry or sector selected, the two time series should be shown together to get the full benefit of the indicator. (b) Relevance to Sustainable/Unsustainable Development (theme/sub-theme): Sound and efficient use of natural resources is an important part of sustainable development. Waste represents a considerable loss of resources both in the form of materials and energy. The treatment and disposal of the generated waste may cause environmental pollution and expose humans to harmful substances and bacteria, and therefore impact on human health. Generation of waste is intimately linked to the level of economic activity in a country. It reflects society’s

99
production and consumption patterns, and wealthier economies tend to produce more waste. In many developed countries, a reduction in the volume of waste generated is an indication of a development towards less material-intensive production and consumption patterns, particularly as the economy moves from a heavy industry base to a more service base. (c) International Conventions and Agreements: No international conventions or agreements exist covering the reduction of waste production. However, there is growing support in countries for the OECD’s 3R’s approach to tackling waste: Reduce, Reuse, and Recycle. (d) International Targets/Recommended Standards: Some countries have set national targets for the reduction of waste within a specified time frame. (e) Linkages to Other Indicators: This indicator is intimately linked to other socio-economic and environmental indicators especially those related to income-level and economic growth. Those would include: rate of growth of urban population, Gross Domestic Product (GDP) per capita, wastewater treatment, and waste treatment and disposal. 3. METHODOLOGICAL DESCRIPTION (a) Underlying Definitions and Concepts: The precise definition of what constitutes waste is variable, but principally it can be considered as materials that are not prime products (i.e. products produced for the market) for which the generator has no further use for his own purpose of production, transformation or consumption, and which he discards, or intends or is required to discard. It excludes residuals directly recycled or reused on the site of generation and pollutants that are directly discharged into ambient water or air as waste water or air emission. Waste is produced through the extraction of raw materials, the production and consumption of goods and services; through the processing of waste from these services (e.g. incineration residues); and through end-of-pipe control or treatment of emissions. Waste statistics usually group waste according to main economic/industrial activities in which they are generated, for example agriculture and forestry waste; mining and quarrying waste, construction waste; waste generated during energy production; manufacturing industries’ waste and other industrial waste; household and similar waste; and sewage sludge. The importance of these waste categories depends on the economy of the country, and countries may choose to focus only on the activities or sectors which are most relevant for them, or to combine groups of industries because of data constraints. (b) Measurement Methods: To measure the generation of waste, four different methods can be used: surveys, administrative or other sources, statistical estimation procedures and a combination of the above methods. Surveys on waste statistics can be carried out in order to gather the relevant information directly from enterprises or households. Survey method collects information on waste generation using a questionnaire on waste from enterprises (they can be waste generators or waste collectors and transport operators) or households. Since the number of waste collector and transport operators is limited, a census method can be considered.

100
Administrative information source refers to any information which is collected and put together by the administration for purposes other than for waste statistics, but can also be used directly or with some additional effort to generate some of the information required for waste statistics, for example, data sets from environment agencies and other supervising authorities, associations and organizations in the public sector which organize or handle specific aspects of waste management. Administrative sources are primarily useful for filling in gaps but not for supplying the core data sets. Statistical estimation procedures can be: the estimation of waste generation by waste factors to be applied to waste-related activities; the estimation of waste generation via models; the indirect determination of waste generation via waste treatment or waste collection. To measure the generation of waste, a combination of the above methods can also be used. When using a combination of different sources, double counting and under-coverage should be avoided. GDP and value added (at constant prices) are generally obtained from standard national accounts. (c) Limitations of the Indicator: The classification of what is or is not waste is largely dependent on technological innovations achieved and applied; the borderline between waste/non-waste varies therefore by country, and even within a country. Currently there are no uniform definitions of municipal and industrial waste applied by the countries. The problems of varying definitions and classifications severely limit data comparability between countries or even between regions within countries. Waste production can be expensive to measure at source, unless already done for other purposes, such as billing; thus, consistent and comparable statistics can be difficult to obtain. Generation of waste is often mistakenly treated as a synonym for the amount of waste collected/treated/disposed of, which is measured by recording the weight or volume of waste removed and handled at the treatment or disposal site. (d) Status of the Methodology: Not Available. (e) Alternative Definitions/Indicators: Waste collection, which is easier to measure, may be a suitable proxy measure for this indicator in some countries. In the absence of data on household waste, municipal waste - defined as waste collected by or on behalf of municipalities - can be used as a proxy. However it should be borne in mind that municipal waste includes waste from households, streets, commerce and trade, small businesses, office buildings and institutions (schools, hospitals, government buildings). It may therefore overlap with some of the industrial sectors. In some countries a non-negligible proportion of household and similar waste is generated in areas with no municipal waste collection, and this needs to be taken into account.
101
4. ASSESSMENT OF DATA (a) Data Needed to Compile the Indicator: Total weight of waste generated by manufacturing industries, mining & quarrying, construction, energy production (excluding mining), agriculture & forestry, and household and similar waste, as well as population data, and GDP and value added by economic activity (at constant prices). (b) National and International Data Availability and Sources: At the national level, data sources would include ministries responsible for the selected economic/industrial activities, ministries responsible for urban affairs and the environment, and statistical agencies. At the international level, the United Nations Statistics Division (UNSD), OECD and Eurostat collect data on waste generation from their member countries, and some good results are available for developed countries. Data for most developing countries is sparse and comparability is limited. (c) Data References: UNSD Web site (http://unstats.un.org/unsd/environment/q2004indicators.htm OECD website (http://www.oecd.org/statisticsdata ) Eurostat website (http://epp.eurostat.cec.eu.int/portal/page?_pageid=0,1136239,0_45571444&_dad=portal&_schema=PORTAL ) Economic information is available at http://unstats.un.org/unsd/snaama/Introduction.asp 5. AGENCIES INVOLVED IN THE DEVELOPMENT OF THE INDICATOR (a) Lead Agency: The lead agency is the United Nations Statistics Division (UNSD). The contact point is the Chief, Environment and Energy Statistics Branch, UNSD. fax no. (1 212) 963 0623. (b) Other Contributing Organizations: The United Nations Centre for Human Settlements (Habitat), the United Nations Environment Programme (UNEP), the World Bank, the World Health Organization (WHO), the Organization for Economic Co-operation and Development (OECD), and Eurostat are involved in the development of waste indicators. 6. REFERENCES (a) Readings: UNSD/UNEP Questionnaire 2006 on Environment Statistics – Waste Section. Eurostat: A Selection of Environmental Pressure Indicators for the EU and Acceding Countries – 2004 Edition. Eurostat: Manual for the implementation of Regulation (EC) No 2150/2002 on Waste Statistics. Various publications from the Settlement Infrastructure and Environment Programme, Habitat.
102
OECD. OECD Environmental Data Compendium 2004. OECD, Paris, 2004. European Environment Agency. Europe's Environment: the third Assessment. 2003. United Nations (2006a). International Standard Industrial Classification of all Economic Activities, ST/ESA/STAT/SER.M/4/Rev.4. United Nations (2005). National Accounts Statistics: Analysis of Main Aggregates, 2004. ST/ESA/STAT/Ser.X/35. Sales No. E.06.XVII.8. (b) Internet site: UNSD home page: http://unstats.un.org/unsd/environment/
103
Theme 15: Consumption and Production Patterns Sub-Theme: Waste Generation and Management Indicator 7: Generation of Hazardous Waste
GENERATION OF HAZARDOUS WASTES Consumption and Production Patterns Waste Generation and
Management Core
indicator
1. INDICATOR (a) Name: Generation of Hazardous Wastes. (b) Brief Definition: The total amount of hazardous wastes generated per year through industrial or other waste generating activities, according to the definition of hazardous waste as referred to in the Basel Convention and other related conventions (see sections 3(e) and 7 below). (c) Unit of Measurement: Tonnes per unit of Gross Domestic Product (GDP). (d) Placement in the CSD Indicator Set: Agenda 21: Consumption and Production Patterns/Waste Generation and Management. 2. POLICY RELEVANCE (a) Purpose: It provides a measure of the extent and type of industrialization in a country and in this connection the nature of the industrial activities including technologies and processes generating hazardous wastes. (b) Relevance to Sustainable/Unsustainable Development (theme/sub-theme): The generation of hazardous wastes has a direct impact on health and the environment through exposure to this kind of wastes. Normally, long-term exposure is required before harmful effects are seen. Reduced generation of hazardous wastes may indicate either reduced industrial activities in a country, introduction of cleaner production in the industrial processes, or changing patterns in consumers' habits, or changing in national hazardous waste legislation. The introduction of environmentally sound management systems for hazardous wastes implies reduction of risks to health and environment due to lesser exposure to hazardous wastes. A review of different categories of wastes being generated provides an indication of the nature of industrial activities being undertaken in a country. In the case of other hazardous wastes such as hospital wastes, it is first of all a measure of the size of the population, and secondly, the percentage of this population being treated in hospitals and other medical care units. (c) International Conventions and Agreements: The following conventions and agreements pertain to this indicator: Basel Convention on the Control of Trans boundary Movements of Hazardous Wastes and their Disposal; Bamako Convention on the Ban on the Import into Africa and the Control of Trans boundary Movement of Hazardous Wastes within Africa; Waigani Convention to Ban the Importation of Hazardous and Radioactive Wastes into Forum Island

104
Countries, and to Control the Trans boundary Movement and Management of Hazardous Wastes within the South Pacific Region; Central American Agreement; Protocol for the Prevention of Pollution of the Mediterranean Sea by Trans boundary Movements of Hazardous Wastes and Their Disposal; Organization for Economic Co-operation and Development (OECD), Council Decisions, and EC Council Directives and Regulation on Waste and Hazardous Wastes. (d) International Targets/Recommended Standards: No quantitative targets exist at the international level. In Agenda 21, Chapter 20, an overall target of "preventing or minimizing the generation of hazardous wastes as part of an overall integrated cleaner production approach" is provided. Targets exist at the national level in many countries. (e) Linkages to Other Indicators: This indicator is linked to the amount of hazardous wastes exported or imported, as well as to the indicators on area of land contaminated by hazardous wastes, and expenditures on hazardous waste treatment or disposal. It is further directly connected to indicators related to material consumption and energy use, including intensity of material use, annual energy consumption per capita, and intensity in energy use. In a wider context, it is also related to the indicators on international cooperation concerning implementation of ratified global agreements. 3. METHODOLOGICAL DESCRIPTION (a) Underlying Definitions and Concepts: In order to facilitate the definition of whether a waste, as defined under the Basel Convention, is hazardous or not, the Technical Working Group established under the Basel Convention has developed lists of wastes that are hazardous and wastes that are not subject to the Convention, as well as an outline of a review procedure for the inclusion, or deletion, of wastes from those lists. These lists were approved at the Fourth Meeting of the Conference of the Parties (UNEP, 1998). It is expected that such lists will considerably facilitate the development and application of indicators of hazardous wastes as mentioned later. In relation to the definition of hazardous wastes under the Basel Convention (article 1 of the Convention), it should be noted that under article 3 of the Convention, Parties should inform the Secretariat of the Convention (SBC) of wastes, other than those listed in Annexes I and II of the Convention, considered as hazardous under national legislation. Such information is being disseminated by the Secretariat to all Parties in order to enable them to respect such definitions in relation to planned trans boundary movements involving such wastes. (b) Measurement Methods: In relation to the Basel Convention, its Secretariat requests information from the Parties to the Convention on a yearly basis regarding the amount of hazardous wastes generated at the national level. This information is being introduced in the SBC database, which includes data and information on hazardous wastes related issues in accordance with Articles 13 and 16 of the Convention. Other agencies, such as OECD, are also collecting information on hazardous wastes generated by OECD countries. (c) Limitations of the Indicator: The problem of defining whether a waste is hazardous or not will, in some cases, cause difficulties in relation to the use of an indicator on hazardous wastes

105
generation. The quantity of the hazardous wastes generated alone may not reflect changes towards a more "sustainable" society. Consideration of the nature of the different kinds of hazardous wastes generated would be a better indicator of sustainable development progress. Availability and accuracy of data represents another limitation of this indicator. Finally, the nature of the waste itself makes it sometimes difficult to use them as indicators because wastes are often mixed and not produced to specifications. (d) Status of the Methodology: The methodology has not at present been considered by Parties of the Basel Convention. Decision V/14 of the Fifth Meeting of the Conference of the Parties requested the Secretariat of the Convention to explore possibilities of developing indicators on hazardous wastes to facilitate decision-making and report thereon to the Conference of the Parties at its sixth meeting. However, the Conference of the Parties to the Basel Convention at its seventh meeting ( October 2004) did not consider work on indicators as a priority issue for the current biennium and thus it was not included in the work programme of the Open-ended Working Group for 2005-2006. (e) Alternative Definitions: The amounts and type of specific waste streams generated per year through industrial or other waste generating activities as defined in the Basel Convention represents an alternative indicator which would allow for normalization based on hazardous properties of the wastes (e.g., infectious, flammable, toxic, corrosive, ecotoxic). Consideration of the waste management infrastructure at national level could constitute an indicator on the status of addressing hazardous wastes related issues in any particular country. In general, hazardous waste indicators, in order to be useful for management, have to have some resonance with policy makers whether they are within the local community, or at the national level. There is, therefore, the need to develop hazardous waste indicators that reflect concern for the hazardous properties of waste, the implications of their impacts on the environment, on ecosystems and their functioning, as well as on human health. A profile or set of indicators that can address these multiple issues and meet the needs of a variety of users is essential. Such indicators would be broader than the indicator on generation of hazardous wastes as referred to in this paper and the Secretariat of the Basel Convention will take the lead in the further development of indicators on hazardous wastes in collaboration with relevant institutions. 4. ASSESSMENT OF DATA (a) Data Needed to Compile the Indicator: Data on the generation of hazardous wastes. (b) National and international Data Availability and Sources: Data are available for many developed countries, but, so far, few developing countries are collecting data on hazardous waste generation. The Parties of the Basel Convention are requested to provide data to the Conference of the Parties through the Secretariat of the Convention on a yearly basis. Assistance to developing countries will be needed in identifying the main hazardous waste streams being generated in their countries in order to prepare and maintain inventories of hazardous wastes. In this connection difficulties may be encountered in relation to hazardous waste generation by small scale enterprises, since they are scattered and often operating on an

106
informal basis and are therefore not registered. It may be less of a problem to identify amounts of hazardous wastes generated by larger industries, since they are normally registered. (c) Data References: The primary source of data at the international level is the Secretariat of the Basel Convention. 5. AGENCIES INVOLVED IN THE DEVELOPMENT OF THE INDICATOR (a) Lead Agency: The lead agency is the Secretariat to the Basel Convention (SBC), United Nations Environment Programme (UNEP). The contact point is the Executive Secretary, SBC; fax no. (41 22) 797 3454, e-mail: [email protected]. (b) Other Contributing Organizations: Other organizations include: United Nations Statistics Division, UNEP, ICRED, OECD, European Topic Centre for Wastes, Denmark, US Environmental Protection Agency, Institute for Applied Environmental Economics, the Netherlands, European Institute of Business Administration, France, Technical University, Graz, Austria, Wuppertal Institute, CEFIC, Netherlands National Institute of Public Health and Environment, Canada. Additional organizations with expertise in the domain of hazardous waste generation are: UN-ECE (Transport); IMO (Maritime); FAO (Pesticides); WHO; ILO; IAEA; UNIDO, SPREP. 6. REFERENCES (a) Readings: Basel Convention for the Control of Transboundary Movement of Hazardous Wastes and their Disposal. Bamako Convention on the Ban of the Import into Africa and the Control of Transboundary Movement and Management of Hazardous Wastes within Africa, 1991. Waigani Convention to Ban the importation into Forum Island Countries of Hazardous and Radioactive Wastes and to Control the Transboundary Movement and Management of Hazardous Wastes within the South Pacific Region. Protocol for the Prevention of Pollution of the Mediterranean Sea by Transboundary Movements of Hazardous Wastes and Their Disposal. Bakkes, J.A. et al. An Overview of Environmental Indicators: State of the Art and Perspectives. Environment Assessment Technical Reports. Netherlands National Institute of Public Health and Environmental Protection in cooperation with the University of Cambridge, United Kingdom. June 1994. Å. Granados and P.J. Peterson “Hazardous Waste Indicators for National Decision-makers”, Journal of Environmental Management (1999).
1. Reporting and Transmission of Information under the Basel Convention for the year 1993. Geneva, 1996.
2. Reporting and Transmission of Information under the Basel Convention for the year
107
1994. Geneva, June 1997, document SBC No. 97/014, 175 p. 3. Reporting and Transmission of Information under the Basel Convention for the year
1995. Geneva, May 1999, document SBC No. 99/004, 130 p. 4. Reporting and Transmission of Information under the Basel Convention for the year
1996. Geneva, June 1999, document SBC No. 99/006, 178 p. 5. Reporting and Transmission of Information under the Basel Convention for the year
1997: Part II (Statistics on generation and transboundary movements of hazardous wastes and other wastes). Basel Convention Series SBC No. 99/001, Geneva, November 1999, 148 p.
(b) Internet sites: Secretariat of the Basel Convention: http://www.basel.int/ European Topic Centre on Waste: http://www.etc-waste.int/

108
Theme 15: Consumption and Production Patterns Sub-Theme: Waste Generation and Management Indicator 8: Management of Radioactive Waste NC
MANAGEMENT OF RADIOACTIVE WASTE Consumption and Production
Patterns Waste Generation and
Management Core indicator
1. INDICATOR (a) Name: Management of Radioactive Waste. (b) Brief Definition: Radioactive waste arises from various sources, such as nuclear power generation and other nuclear fuel cycle related activities, radioisotope production and use for applications in medicine, agriculture, industry and research. The indicator provides a measure of both the current status of radioactive waste management at any point in time and the progress made over time towards the overall sustainability of radioactive waste management. (c) Unit of Measurement: a dimensionless indicator ranging from 0 (least sustainable condition) to 100 (most sustainable condition) in increments dependent on the progress towards safe storage or disposal. The factor may be calculated for each waste class used by a country or it may be presented as an average for all waste classes. (d) Placement in the CSD Indicator Set: Consumption and production patterns/Waste generation and management. 2. POLICY RELEVANCE (a) Purpose: The purpose is to represent the progress in managing the various radioactive wastes that arise from the nuclear fuel cycle and/or from nuclear applications. Quantitative information is required to indicate this progress by way of a baseline for full sustainability coupled with knowledge of the key steps towards full sustainability. (b) Relevance to Sustainable/Unsustainable Development (theme/sub-theme): Radioactive waste, if not properly managed, can have a direct impact on health and the environment through exposure to ionizing radiation. In order to protect human health and the environment, appropriate waste management strategies and technologies must be employed. Fundamental principles of radioactive waste management, as well as activities such as minimization of waste risings, involve systematically considering the various steps in treatment, conditioning, storage and disposal. Effective management of waste (control of inventory) has a positive impact regarding sustainability as it reduces the pressure on the environment and the commitment of resources. Waste management strategies seek ultimately to confine and contain the radionuclides within a system of engineered and natural barriers so that any releases to the environment are small compared to natural background. (c) International Conventions and Agreements: The Joint Convention on the Safety of Spent

109
Fuel Management and the Safety of Radioactive Waste Management [Ref 1] entered into force June 2001. This convention binds Contracting Parties to manage spent nuclear fuel and radioactive wastes using sustainable waste management practices. (d) International Targets/Recommended Standards: The International Atomic Energy Agency (IAEA) has established Safety Standards, Fundamentals, Requirements and Guides [Ref 2 - 4] applicable to the management of radioactive wastes. It has also established Basic Safety Standards for the Protection of Humans against Ionizing Radiation [Ref 5], which are consistent with recommendations of the International Commission on Radiological Protection (Ref 6, 7). (e) Linkages to Other Indicators: A large portion of radioactive waste arises from practices within the nuclear fuel cycle, therefore major current risings are related to a significant generation of electricity by nuclear means with an equivalent reduction of environmental impacts by other energy sources (Chapter 4 of Agenda 21). This implies a reduction in the release of atmospheric pollutants; notably greenhouse gases, contributing to the protection of the atmosphere (Chapter 9 of Agenda 21). Since some radioactive waste arises from medical applications, such as treatment with radioisotopes or sealed radiation sources and nuclear medicine research, a link exists with the extent of these applications and with the protection and promotion of human health (Chapter 6 of Agenda 21). Additional links are with the transfer of environmentally sound technology (Chapter 34 of Agenda 21) and with the environmentally sound management of hazardous waste (Chapter 20 of Agenda 21). 3. METHODOLOGICAL DESCRIPTION (a) Underlying Definitions and Concepts: Principles regarding the protection of future generations are formulated in the International Atomic Energy Agency's Safety Fundamentals [Ref. 4]. IAEA definitions and the classification of radioactive waste are given in relevant standards, accessible via [Ref 8]. (b) Measurement Methods:. Management progress is measured against key milestones related to both the processing of waste into forms suitable for either safe storage or for placement into a designated endpoint (the “form factor”) and to the placement of waste into an endpoint facility (“endpoint factor”). Each factor has four states with values assigned according to specified milestones. Determination of progress to towards sustainable waste management requires a knowledge of the status of the designated milestones, which is in turn related to (1) the rate of waste generation, (2) the rate that wastes are put into suitable forms and (3) the rate that wastes are placed into an endpoint facility. All rates have units m3/a or tonnes/a (mass is typically used for spent nuclear fuel that is declared to be waste). A five year moving average is recommended for the determination of these rates. Details of the methodology to calculate the indicator can be obtained via the contact point identified in Point 5 below or via the link “GUIDANCE FOR CALCULATING THE INDICATOR OF SUSTAINABLE DEVELOPMENT FOR RADIOACTIVE WASTE MANAGEMENT” before Point 4 below. (c) Limitations of the Indicator: The management of radioactive waste is only a first approximation of its hazard. It is assumed that only improperly managed waste can have an impact on human health and the environment. The actual impact requires a site specific analysis taking into account the isotopic and chemical composition of the waste. This indicator gives a
110
measure of progress towards reduction in the volume of waste that could impact upon health and the environment. As configured, this indicator does not seek to establish progress with historic waste management. (d) Status of the Methodology: Safety assessment of the radiological hazard of radioactive waste disposal is considerably advanced and is used as the basis for regulatory decisions in many countries (the milestones of factors are related to specified regulatory decisions, such as the approval of a disposal facility for operation). (e) Alternative Definitions/Indicators: None. 4. ASSESSMENT OF DATA (a) Data Needed to Compile the Indicator: the volumes or masses of the various classes of radioactive waste (1) arising annually, (2) processed to suitable forms and (3) consigned to an endpoint facility expressed in cubic meters per annum (m3/a) or tonnes per annum (tonnes/a) plus a knowledge of the status of specified milestones for the form and endpoint factors (b) National and International Data Availability and Sources: At the national level, the volume or masses of radioactive waste risings can be obtained from the waste accountancy records maintained by the various waste generators or, in consolidated form, from either national waste management organizations or regulatory bodies. Almost one third of the IAEA member states keep some type of national radioactive waste registry. The Joint Convention on the Safety of Spent Fuel Management and on the Safety of Radioactive Waste Management requires Contracting Parties to report an inventory of radioactive waste that is subject to the Convention. Through this mechanism, both the availability and the quality of data is likely to increase over time. (c) Data References: The primary source for data includes national or provincial/state level governmental organizations. A secondary source may be databases managed by international organizations such as the IAEA or the Nuclear Energy Agency of the Organization of Economic Cooperation and Development (OECD/NEA). 5. AGENCIES INVOLVED IN THE DEVELOPMENT OF THE INDICATOR (a) Lead Agency: The International Atomic Energy Agency. The contact point is:
Indicator of Sustainable Development for Radioactive Waste Contact Point International Atomic Energy Agency Department of Nuclear Energy Division of Nuclear Fuel Cycle and Waste Technology Waste Technology Section Wagramer Strasse 5, P.O. Box 100 A-1400, Vienna, Austria E-mail: [email protected]
(b) Other Contributing Organizations: Governments and inter-governmental organizations, possibly the European Commission (EC), the OECD/NEA, the United Nations Environment

111
Programme (UNEP), non-governmental and other organizations, such as the International Union of Producers and Distributors of Electrical Energy (UNIPEDE) and the Electric Power Research Institute (EPRI). 6. REFERENCES: The Joint Convention on the Safety of Spent Fuel Management and on the Safety of Radioactive
Waste Management, as adopted in September 1997 (IAEA Press Release PR 2001/05, 20 March 2001, http://www.iaea.org/worldatom/Press/P_release/2001/prn0105.shtml).
IAEA's Safety Guides (Safety Series No. 111-G-1.1), 1994, Classification of Radioactive Waste. IAEA's Safety Standards (Safety Series No. GS-R-1), 2000, Legal and Governmental
Infrastructure for Nuclear, Radiation, Radioactive Waste and Transport Safety. IAEA's Safety Fundamentals (Safety Series No. 111-F), 1995. The Principles of Radioactive
Waste Management. IAEA's Safety Standards (Safety Series No. 115), 1996. International Basic Safety Standards for
Protection against Ionizing Radiation and for the Safety of Radiation Sources. ICRP Publication 46, 1996. Radiation Protection Principles for the Disposal of Solid Radioactive
Waste, Pergamon Press, Oxford. ICRP Publication 60, 1991. 1990 Recommendations of the International Commission on
Radiological Protection. Annals of the ICRP 21 (1- 3), Pergamon Press, Oxford. World Atom Internet site: http:/ww.iaea.org/worldatom/
112
Theme 15: Consumption and Production Patterns Sub-Theme: Waste Generation and Management Indicator 9: Waste Treatment and Disposal by Method of Treatment (recycled, incinerated, land filled)
WASTE TREATMENT AND DISPOSAL Consumption and Production Patterns Waste Generation and
Management Core
indicator
1. INDICATOR (a) Name: Waste Treatment and Disposal (b) Brief Definition: Percentage of Waste which is i) recycled; ii) composted; iii) incinerated; and iv) land-filled on a controlled site. (c) Unit of Measurement: %. (d) Placement in the CSD Indicator Set: Consumption and Production Patterns/ Waste Generation and Management. 2. POLICY RELEVANCE (a) Purpose: The purpose of this indicator is to measure the proportion of waste generated which is recycled, composted, incinerated, or land-filled on a controlled site. It gives an indication of the environmental impact of waste management in the country. The proper treatment and disposal of waste is important from an environmental and social viewpoint but can be an economic burden on industries, municipalities and households. (b) Relevance to Sustainable/Unsustainable Development (theme/sub-theme): The way a country manages its solid waste has significant long-term implications for public health, the economy and the natural environment. Therefore it is essential to promote an environmentally sound solid waste treatment and disposal programme. Generally, adequate waste management indicates that the authorities are aware of the health and environmental risks and that they support or impose suitable measures to prevent or reduce waste. Solid waste recycling and composting is an important component of a sustainable approach to solid waste management. As well as reducing the amount of waste that needs to be disposed of, increasing the amount of waste recycled and composted reduces the demand for raw materials, leading to a reduction in resource extraction. There may also be a benefit of increased income generation for the urban poor through recycling schemes. For waste that is not suitable for recycling or composting, incineration is often considered the next best option, if the incineration plants comply with legislation for emission standards, and if energy from waste incineration is recovered, as this will reduce the overall volume of waste.
113
If recycling, composting or incineration is excluded, waste should be land filled on a controlled site, with suitable technical control in line with national legislation. Uncontrolled land filling may cause serious environmental problems to soil and ground water and should be avoided. (c) International Conventions and Agreements: While no international agreements currently apply, there is growing international backing for the OECD’s 3R’s approach to tackling waste: Reduce, Reuse and Recycle. (d) International Targets/Recommended Standards: No specific target for waste treated in different categories. Some developed countries have established voluntary targets for the proportion of waste recycled. (e) Linkages to Other Indicators: This indicator is intimately linked to other solid waste management indicators. It is also associated with some of the indicators for human settlements and financial mechanisms, such as percent of population in urban areas, and environmental protection expenditures. 3. METHODOLOGICAL DESCRIPTION (a) Underlying Definitions and Concepts: The amount of waste treated or disposed of under different methods is closely related to the national policy on waste management: incentives for minimization, recycling/recovery, stricter legislation for waste to be land filled (e.g. ban on land filling of combustible waste) and differentiated taxation. Recycling is defined as any reprocessing of material in a production process that diverts it from the waste stream, except reuse as fuel. Both reprocessing as the same type of product, and for different purposes should be included. Direct recycling within industrial plants at the place of generation should be excluded. Composting is defined as a biological process that submits biodegradable waste to anaerobic or aerobic decomposition, resulting in a product (compost) that is added to soil to improve fertility. Incinerating is thermal treatment of waste during which chemically fixed energy of combusted matters is transformed into thermal energy. Combustible compounds are transformed into combustion gases leaving the system as flue gases. Incombustible inorganic matters remain in the form of slag and fly ash. Incinerating includes incinerating with or without energy recovery. Land filling is defined as depositing waste into or onto land, in a controlled manner. It includes specially engineered landfill and temporary storage of over one year on permanent sites. The definition covers both landfill in internal sites (i.e. where a generator of waste disposes of its own waste at the place of generation) and in external sites. Landfill waste includes all amounts going to landfill, directly or after sorting and/or treatment. Controlled land filling requires submission to a permit system and technical control procedures in compliance with the national legislation in force. (b) Measurement Methods: The main sources of data on waste treatment and disposal are the treatment and disposal facilities, such as recycling plants, composting plants, incineration plants

114
and landfills. Data collection on waste treatment and disposal relies strongly on the use of administrative data collected for licensing and monitoring purposes such as facility registers, consignment notes, or waste management reports. Comprehensive waste facility registers are a prerequisite for the collection of facility-related information and for data on treated quantities. Where data on waste treatment and disposal are not obtained from administrative sources, they are usually gathered through surveys. Statistics on waste treatment and disposal are usually based on surveys of all waste treatment and disposal facilities that are subject to the relevant obligations. Due to the wide variety of waste treatment operations and waste streams, data often have to be drawn from different sources, which make the harmonization of definitions, classifications and reporting requirements an important issue. (c) Limitations of the Indicator: Although the indicator gives relevant information about the existence and use of different waste treatment and disposal facilities, it does not give the full picture. For example, it does not give any indication of the level of control of the landfill sites, or the emissions of incineration plants. And in many countries, after the waste has been disposed of at a landfill site, it may be sorted mechanically or by scavengers and a fraction removed for reuse or recycling. It can be difficult to quantify this fraction. For practical reasons, the calculation of the waste incineration rate only considers waste incinerated through the registered waste management system. Households or industries incinerating their own waste are not included. Similarly, households and industries composting their own waste are not covered. (d) Status of the Methodology: Not Available. (e) Alternative Definitions/Indicators: The solid waste recycling rate would be more useful if expressed in terms of particular waste streams, e.g. percentage of paper waste recycled. It may also be useful to express the % recycled based on the usage of a particular commodity, for example volume of aluminum recycled per volume produced. This enables a better estimation of the level of resource conservation. The percentage of waste incinerated can be divided into two: incineration with or without energy recovery. Since the total amount of solid waste treatment and disposal are difficult to measure, municipal waste treatment and disposal might be a viable alternative indicator. The indicator could also be presented as the percentage of waste collected, rather than of total waste generated, as data on the latter can be difficult to obtain. 4. ASSESSMENT OF DATA (a) Data Needed to Compile the Indicator: Total waste generated, weight of total waste recycled, weight of total waste composted, weight of total waste incinerated, and weight of total waste land filled. (b) National and International Data Availability and Sources: At national level, data sources

115
would include ministries responsible for urban affairs and the environment, and statistical agencies. At the international level, the United Nations Statistics Division (UNSD), OECD and Eurostat collect available data on municipal and hazardous waste treatment and disposal from countries. Currently, some good results are available from developed countries, but data for developing countries are very scarce. (c) Data References: UN Statistics Division Web site (http://unstats.un.org/unsd/environment/ ). 5. AGENCIES INVOLVED IN THE DEVELOPMENT OF THE INDICATOR (a) Lead Agency: The lead agency is the United Nations Statistics Division (UNSD). The contact point is the Chief, Environment and Energy Statistics Branch, UNSD. fax no. (1 212) 963 0623. (b) Other Contributing Organizations: The United Nations Centre for Human Settlements (Habitat), the United Nations Environment Programme (UNEP), the World Health Organization (WHO), OECD, Eurostat and industry associations would be interested in the development of this indicator. 6. REFERENCES (a) Readings: UNSD/UNEP Questionnaire 2006 on Environment Statistics – Waste Section. Eurostat: Manual for the implementation of Regulation (EC) No 2150/2002 on Waste Statistics. UNEP. Global Environmental Outlook, 2007. United Nations Department of Economic and Social Affairs, Measuring Changes in Consumption and Production Patters: A Set of Indicators, (ST/ESA/264), 1998. (b) Internet site: UNSD home page: http://unstats.un.org/unsd/environment/

116
Theme 15: Consumption and Production Patterns Sub-Theme: Transportation Indicator 10: Share of Cars in Passenger Transportation NC
MODAL SPLIT OF PASSENGER TRANSPORT Consumption and Production Patterns Transportation Core indicator
1. INDICATOR (a) Name: Modal split of passenger transport (b) Brief definition: Share of each mode (passenger cars, buses and coaches, and trains) in total inland passenger transport, in passenger-km. (c) Unit of Measurement: % of passenger-kilometers (d) Placement in the CSD Indicator Set: Consumption and Production Patterns/ Transportation. 2. POLICY RELEVANCE (a) Purpose: To provide information on the relative importance of different modes of passenger transport at the global, regional and national levels. (b) Relevance to Sustainable/Unsustainable Development (theme/subtheme): Cars are less energy-efficient and produce more emissions per passenger-kilometer than either buses or trains. Therefore, the use of cars for passenger transportation has greater environmental and social impacts, such as pollution, global warming as well as a higher accident rate, than mass transit. Policies are needed which reduce the use of cars as a mode of passenger transport and support a shift towards the use of less environmentally damaging modes, such as public transport. (c) International Conventions and Agreements: None. (d) International Targets/Recommended Standards: No international targets have been established. (e) Linkages to other indicators: This indicator is related to the indicators "Distance travelled per capita by means of transport", "Intensity of Energy Use in Transportation", “Emission of Greenhouse Gases”, and “Ambient Concentration of Air Pollutants in Urban Areas”. 3. METHODOLOGICAL DESCRIPTION (a) Underlying definitions and concepts: The indicator is defined as the percentage of each
117
mode in total inland transport performance measured in passenger-km. Inland passenger transport includes transport by passenger cars, buses and coaches, and trains.
(b) Measurement method: The preferred method is to measure transport performance (passenger-kilometers) based on movements on national territory. (c) Limitations of the Indicator: The indicator is based on inland transport only. Due to their predominantly international nature, there are conceptual difficulties in dealing with air and sea transport in a manner consistent with the inland modes (road, rail and inland waterways). In addition, given that the environmental and social impacts are related to the use of vehicles rather than volumes transported, an indicator based on movements of vehicles (vehicle-kilometers) would be preferable. However, since transport statistics have been generally more concerned with following the movement of passengers than the movement of vehicles, the indicator is based on transport performance (passenger-kilometers). If comprehensive data on vehicle movements for all modes of transport become available the indicator could be modified.
(d) Status of the Methodology: An agreed methodology at the international level concerning passenger transport statistics has not yet been established. Moreover, the coverage of passenger transport for many countries is incomplete, mainly due to lack of data on transport by passenger car. (e) Alternative definitions/Indicators: In the absence of reliable transport statistics, the number of vehicles (per 1,000 inhabitants) and/or the total length of roads (or paved roads), railway tracks and waterways maybe used. 4. ASSESSMENT OF DATA (a) Data needed to compile the indicator: The indicator is compiled from series of passenger-kilometer for passenger cars, buses and coaches, and trains. (b) National and International Data Availability and Sources: For some countries data on passenger transport performance are available through the Eurostat/ECMT/UNECE Common Questionnaire on Transport Statistics. Where data is unobtainable from these sources, data might be available through national statistical institutes, ECMT, UNECE or UIC. (c) Data References: ECMT: Trends in the Transport Sector: http://www.cemt.org UNECE: Annual Bulletin of Transport Statistics for Europe and North America: http://www.unece.org International Road Federation: World Road Statistics: http://www.irfnet.org UIC: International Railway Statistics: http://www.uic.asso.fr/stats 5. AGENCIES INVOLVED IN THE DEVELOPMENT OF THE INDICATOR (a) Lead Agency: The lead agency is Eurostat (the Statistical Office of the European

118
Communities). (b) Other Contributing Organizations: not available 6. REFERENCES (a) Internet site: ECMT: Trends in the Transport Sector: http://www.cemt.org UNECE: Annual Bulletin of Transport Statistics for Europe and North America. http://www.unece.org International Road Federation: World Road Statistics: http://www.irfnet.org UIC: International Railway Statistics: http://www.uic.asso.fr/stats http://europa.eu.int/comm/eurostat
119
Theme 15: Consumption and Production Patterns Sub-Theme: Transportation Indicator 11: Road Share of Freight Transport NC
MODAL SPLIT OF FREIGHT TRANSPORT Consumption and Production Patterns Transportation Core indicator
1. INDICATOR (a) Name: Modal split of freight transport (b) Brief definition: Share of each mode (road, rail and inland waterways) in total inland freight transport, measured in tonne-km. (c) Unit of Measurement: % of tonne-kilometers (d) Placement in the CSD Indicator Set: Consumption and Production Patterns/ Transportation. 2. POLICY RELEVANCE (a) Purpose: To provide information on the relative importance of different modes of goods transport at the global, regional and national levels. (b) Relevance to Sustainable/Unsustainable Development (theme/subtheme): Road transport is less energy-efficient and produces more emissions per tonne-kilometer than either rail or inland waterways transport. Therefore, the use of road for freight transport has greater environmental and social impacts, such as pollution, global warming, as well as a higher accident rate, than either rail or inland waterways transport. Policies are needed which encourage the use of less environmentally harmful means for transporting freight, such as rail or waterways. (c) International Conventions and Agreements: None. (d) International Targets/Recommended Standards: No international targets have been established. (e) Linkages to other indicators: This indicator is related to the indicators "Intensity of Energy Use in Transportation", “Emission of Greenhouse Gases”, and “Ambient Concentration of Air Pollutants in Urban Areas”. 3. METHODOLOGICAL DESCRIPTION (a) Underlying definitions and concepts: This indicator is defined as the percentage of each
120
mode in total inland transport performance measured in tonne-kilometers. Inland freight transport includes road, rail and inland waterways. (b) Measurement method: The preferred method is to measure transport performance (tonne-kilometers) based on movements on national territory. (c) Limitations of the Indicator: The indicator is based on inland transport only. Due to their predominantly international nature, there are conceptual difficulties in dealing with air and sea transport in a manner consistent with the inland modes (road, rail and inland waterways). In addition, given that the environmental and social impacts are related to the use of vehicles rather than volumes transported, an indicator based on movements of vehicles (vehicle-kilometers) would be preferable. However, since transport statistics have been generally more concerned with following the movement of goods than the movement of vehicles, the indicator is based on transport performance (tonne-kilometers). If comprehensive data on vehicle movements for all modes of transport become available the indicator could be modified. (d) Status of the Methodology: Data collection methodologies are not harmonized at the global level. (e) Alternative definitions/Indicators: not available 4. ASSESSMENT OF DATA (a) Data needed to compile the Indicator: The indicator is compiled from series of tonne-kilometer for road, rail and inland waterways. (b) National and International Data Availability and Sources: Data on goods transport performance are available through either national statistical institutes, ECMT, UNECE or UIC. (c) Data References: ECMT: Trends in the Transport Sector: http://www.cemt.org UNECE: Annual Bulletin of Transport Statistics for Europe and North America: http://www.unece.org International Road Federation: World Road Statistics: http://www.irfnet.org UIC: International Railway Statistics: http://www.uic.asso.fr/stats 5. AGENCIES INVOLVED IN THE DEVELOPMENT OF THE INDICATOR (a) Lead Agency: The lead agency is Eurostat (the Statistical Office of the European Communities). 6. REFERENCES (a) Readings:

121
Eurostat, 2003. Calculation of Indicators of Environmental Pressures Caused by Transport — Main Report. Luxembourg, European Communities. Eurostat, 2004. Glossary for Transport Statistics Document prepared by the Intersecretariat Working Group on Transport Statistics. Third edition. Luxembourg, European Communities Eurostat, various editions. Transport and Environment: Statistics for the Transport and Environment Reporting Mechanism (TERM) for the European Union. Luxembourg, European Communities. (b) Internet site: ECMT: Trends in the Transport Sector: http://www.cemt.org UNECE: Annual Bulletin of Transport Statistics for Europe and North America: http://www.unece.org International Road Federation: World Road Statistics: http://www.irfnet.org UIC: International Railway Statistics: http://www.uic.asso.fr/stats http://europa.eu.int/comm/eurostat
122
Theme 15: Consumption and Production Patterns Sub-Theme: Transportation Indicator 12: Fuel Use by Distance of Passenger Transportation (Energy Intensity of Transport
ENERGY INTENSITY OF TRANSPORT Consumption and Production Patterns Transportation Core indicator
1. INDICATOR (a) Name: Energy Intensity of Transport (b) Brief Definition: Energy use per unit of freight-kilometer (km) hauled and per unit of passenger-km travelled by mode. (c) Units of Measurement: Freight: tonnes of oil equivalent (toe) per tonne-km. Travel: toe per passenger-km. (d) Placement in the CSD Indicator Set: Consumption and Production Patterns/ Transportation. 2. POLICY RELEVANCE (a) Purpose: Transport is a major user of energy, mostly in the form of oil products, which makes transport the most important driver behind growth in global oil demand. The transport indicators measure how much energy is used for moving both goods and people. (b) Relevance to Sustainable Development: Transport serves economic and social development through the distribution of goods and services and through personal mobility. However, energy use for transport also leads to the depletion of resources and to air pollution and climate change. Reducing energy intensity in transport can reduce the environmental impacts of transport while maintaining the economic and social benefits. (c) International Conventions and Agreements: There are no international conventions directly related to energy intensities in the transport sector. International conventions on energy emissions, such as the United Nations Framework Convention on Climate Change (UNFCCC) and its Kyoto Protocol, are indirectly related to transport energy intensities. The European Union voluntary commitments on carbon dioxide (CO
2) emissions by European, Japanese and
Korean car manufacturer associations are for reductions in CO2 emissions per kilometer for new
automobiles. (d) International Targets/Recommended Standards: Many industrialized countries have targets for reducing energy use and carbon emissions from transport. (e) Linkages to Other Indicators: This indicator is part of a set for energy intensities in different

123
sectors (manufacturing, agriculture, service/commercial and residential), with energy use per unit of gross domestic product (GDP) as an aggregate energy intensity indicator. These indicators are also linked to indicators for total energy use, greenhouse gas emissions and air pollution emissions. 3. METHODOLOGICAL DESCRIPTION (a) Underlying Definitions and Concepts: The transport indicators reflect how much energy is used to transport goods and people. The separation of freight transport and passenger travel is essential for energy analysis, both because they are largely based on different modes and because the activities driving energy use are different. The two activity measures (tonne-km and passenger-km) are quite distinct and are collected separately. However, separating the energy use in these two activities is often complicated given the way data are available from typical energy statistics. Changes in intensities are affected by factors other than energy efficiency; therefore, analyzing intensity trends provides important insights into how energy efficiency and other factors affect energy use. Annex 3 includes a decomposition method for energy intensities. (b) Measuring Methods: Energy Use: Ideally, for road transport, energy use should be measured for each type of vehicle or means of transport, including two-wheel vehicles, automobiles, sport utility vehicles (SUVs) and buses for personal travel, and small trucks, heavy trucks and miscellaneous road vehicles for freight transport. Outside of road transport, both freight and personal travel should be divided into trains, ships and aircraft for domestic transport. In general, however, national energy balances are only disaggregated by fuel and broad traffic type or mode of transport: road, rail, water, air and pipeline. Thus, they give no information on energy use by individual means of road transport or, even more importantly, on the split between personal travel and freight transport. International air or maritime transport should not be included. Output or Activity: For assessing the efficiency of road vehicles, vehicle-km is a useful activity measure, assuming that data are available for each vehicle type. However, to be able to construct indicators across all modes for personal travel and freight transport, passenger-km and tonne-km, respectively, must be used as activity variables. This also provides a better indication of how efficiently energy is used to provide personal mobility and distribution of goods. For example, from this perspective, a bus carrying 20 passengers for 10 km (200 passenger-km) is less energy intensive (more efficient) than the same bus carrying 5 passengers for the same distance (50 passenger-km). Similarly, a fully loaded truck is less energy intensive than the same truck carrying a partial load. Vehicle Intensities: Energy use per vehicle-km by vehicle and fuel type is an important indicator, as many standards for air pollution (and more recently, goals for CO
2 emissions
reductions) are expressed in terms of vehicle characteristics, that is, emissions per vehicle-km. Modal Intensities: Energy use per passenger-km or tonne-km should be disaggregated by vehicle type, namely, two-wheel vehicle, automobile/van, bus, airplane, local and long-distance train, metro (also known as ‘subway’ or ‘underground’), tram, ship or ferry for passengers, and
124
truck, train, ship or airplane for freight. Note: Aggregate energy intensities for travel or freight are a meaningful summary indicator whose value depends on both the mix of vehicles and the energy intensities of particular types of vehicles. The energy intensities of public train and bus transport per passenger-km are significantly lower than the energy intensities for automobiles or air transport. Freight, rail and ship transport are commonly less energy intensive than is trucking per tonne-km. It should also be noted that fuel consumption per vehicle-km also depends on traffic conditions as well as vehicle characteristics. The energy intensity of a vehicle depends on both capacity and capacity utilization. A large vehicle that is fully loaded generally has lower energy intensity per tonne-km than a fully loaded smaller vehicle, but a small vehicle fully loaded will have lower energy intensity than a large vehicle with the same load. For some developed countries, typical load factors for private automobiles are 1.5 persons per automobile. For rail and bus, load factors vary from well below 10% (e.g. United States city buses on average) to over 100% of nominal capacity at peak times (in many developing countries during most of the day). Typical load factors for trucking might be 60–80% of weight capacity when loaded, but trucks commonly run 20–45% of their kilometers empty, yielding a relatively low overall load factor. Underutilized transport capacity means more pollution and road damage per unit of transport service delivered; hence capacity utilization itself is an important indicator of sustainable transport. (c) Limitations of the Indicator: Data availability may limit the disaggregation of the indicator to the desired level. Considerable work is often required to disaggregate energy balances into various modes of transport. Some countries’ transport energy statistics include fuel consumed by domestic airlines or shipping lines in international transport. Efforts should be made to exclude such transport and energy use from the indicators. Measurement and interpretation of energy intensities are complicated by differences among products within a category, such as size (e.g. automobile weight), engine technology (e.g. gasoline or diesel) and utilization (vehicle occupancy if passenger-km is the measure of output). (d) Alternative Definitions/Indicators: An alternative, simpler measure of energy intensity for transport could be overall average fuel consumption per passenger-km or tonne-km for all modes, but the results would be strongly influenced by the mix of modes and vehicle types, which varies enormously among countries and over time. 4. ASSESSMENT OF DATA (a) Data Needed to Compile the Indicator
• Energy use by mode of transport, vehicle type and fuel for passenger travel and freight transport separately • Distance travelled by vehicles, passengers and freight, including load factors • Distance travelled by urban public transport and corresponding share of electric vehicles

125
(b) National and International Data Availability and Sources: National energy balances and energy statistics from the International Energy Agency (IEA) and Eurostat normally do not disaggregate road transport into individual means of transport, but this information is sometimes published by transport ministries. Few sources of energy data separate fuel consumption for air, rail or domestic shipping into that for passengers and that for freight, but national or private rail and shipping organizations may have this information. Energy use for local electric transport (commuter rail, metro, trams) is often published separately by national authorities. Eurostat, the European Conference of Ministers of Transport (ECMT) and the United Nations Economic Commission for Europe (UNECE) are leading agencies for the collection of data on vehicle-, passenger- and tonne-km in Europe. Transport ministries in the United States, Canada, Japan, Australia and other countries publish similar data, often through their statistical agencies. In developing and transitional countries, fewer data are available. 5. AGENCIES INVOLVED IN THE DEVELOPMENT OF THE INDICATOR (a) Lead Agencies: The International Energy Agency (b) Other Contributing Organizations: The International Atomic Energy Agency (IAEA) 6. REFERENCES (a) Readings: EEA, 2002. TERM 2002 — Paving the Way for EU Enlargement — Indicators of Transport and Environment Integration. Environmental issue report no. 32. Copenhagen, Denmark: European Environment Agency. EEA, 2004. Ten Key Transport and Environment Issues for Policy-Makers. TERM 2004: Indicators Tracking Transport and Environment Integration in the European Union. EEA Report no. 3/2004. Copenhagen, Denmark: European Environment Agency. Eurostat, 2003. Calculation of Indicators of Environmental Pressures Caused by Transport — Main Report. Luxembourg, European Communities. Eurostat, 2003. Energy Efficiency Indicators. Luxembourg, European Communities. Eurostat, 2004. Glossary for Transport Statistics Document prepared by the Intersecretariat Working Group on Transport Statistics. Third edition. Luxembourg, European Communities Eurostat, various editions. Transport and Environment: Statistics for the Transport and Environment Reporting Mechanism (TERM) for the European Union. Luxembourg, European Communities. IAEA, UN DESA, IEA, Eurostat and EEA, 2005. Energy Indicators for Sustainable Development. Vienna, IAEA.

126
IEA, 1997. Indicators of Energy Use and Energy Efficiency. Paris, France: International Energy Agency (IEA)/Organization for Economic Co-operation and Development (OECD). IEA, 2001. Saving Oil and Reducing CO2 emissions in Transport: Options and Strategies. Paris, France: International Energy Agency. IEA, 2004. Oil Crises and Climate Challenges: 30 Years of Energy Use in IEA Countries. Paris, France: International Energy Agency. Schipper, L., Figueroa, M.J., Price, L., Espey, M., 1993. Mind the gap: The vicious circle of measuring automobile fuel use. Energy Policy 21(12): 1173–1190. (b) Internet site: International Energy Agency: http://www.iea.org/

127