sustainable electricity pricing for - igc · pdf filesustainable electricity pricing for...
TRANSCRIPT

Working paper
Sustainable electricity pricing for Tanzania
Donna Peng Rahmatallah Poudineh
August 2016 When citing this paper, please use the title and the followingreference number:E-40305-TZA-1

1
Sustainable electricity pricing for Tanzania
Donna Peng
OIES-Saudi Aramco fellow, Oxford Institute for Energy Studies, Oxford, UK
Email : [email protected]
Rahmatallah Poudineh
Senior research fellow, Oxford Institute for Energy Studies, Oxford, UK
Email: [email protected]
This paper was written for the Tanzania Country Programme of the International Growth Centre (IGC)
under Contract No.1-VCE-VTZA-VXXXX-40305. We are grateful for the support provided by Chris
Adam and the IGC Country Office in Dar es Salaam especially Ms Anne Laski and Ms Claire
Lwehabura. We also acknowledge the comments and assistance from President's Delivery Bureau,
TANESCO Utility Company, Rural Energy Agency (REA), Tanzania Petroleum Development
Corporation (TPDC), Department for International Development (DfID) office in Tanzania, USAID,
Millennium Challenge Corporation (MCC) and Songas and Symbion companies. The opinions
expressed in the paper are solely those of the authors.

2
Contents List of abbreviations ................................................................................................................................... 4
Executive summary ..................................................................................................................................... 6
Introduction ............................................................................................................................................... 16
Review of power and gas sectors in Tanzania .......................................................................................... 21
Current power and gas sector governance structure ............................................................................. 21
Gas sector infrastructure ....................................................................................................................... 24
East African gas boom .......................................................................................................................... 26
Power sector infrastructure ................................................................................................................... 31
Access to electricity .............................................................................................................................. 38
Structural reform of the power sector ................................................................................................... 40
Institutional framework for investment..................................................................................................... 44
Vehicles of investment in the power sector .......................................................................................... 47
Investment via TANESCO ............................................................................................................... 48
Other vehicles ................................................................................................................................... 57
Outlook for investment in the gas sector .............................................................................................. 67
Cost-reflective electricity tariff? ............................................................................................................... 70
Principles of electricity tariff design .................................................................................................... 71
Revenue determination ..................................................................................................................... 73
Tariff structure and allocation ........................................................................................................... 77
Current electricity tariff setting in Tanzania ........................................................................................ 83
Revenue determination ..................................................................................................................... 86
Tariff structure and allocation ........................................................................................................... 99
Discussion ....................................................................................................................................... 111
International experiences ........................................................................................................................ 118
Bangladesh .......................................................................................................................................... 121
Power sector .................................................................................................................................... 121
Gas sector ........................................................................................................................................ 128
Learning point for Tanzania ............................................................................................................ 131
Côte d'Ivoire ........................................................................................................................................ 132
Power sector .................................................................................................................................... 132
Gas sector ........................................................................................................................................ 139
Learning point for Tanzania ............................................................................................................ 140
Conclusion .............................................................................................................................................. 142
Appendix I: Data ..................................................................................................................................... 145

3
Appendix II: Assumptions used in the comparison of TANESCO proposal with AF-Mercados CoSS . 151
Appendix III: Assumptions to derive revenue requirement based on tariff levels .................................. 152
References ............................................................................................................................................... 154

4
List of Abbreviations ADB Asian Development Bank
AFUDC Allowance for Funds Used during Construction
ANARE Autorité Nationale de Régulation
BERC Bangladesh Energy Regulatory Commission
BPDB Bangladesh Power Development Board
BRN Big Results Now!
CDC Commonwealth Development Corporation
CIE Compagnie Ivoirienne d'Electricité
CI-Energies Société des Energies de Côte d'Ivoire
CIP Capital Investment Plan
CIPREL Compagnie Ivoirienne de Production d'Electricité
CoSS Cost of Service Study
CPI Consumer Price Index
DEG German Investment & Development Company
DESCO Dhaka Electric Supply Company
DPDC Dhaka Power Distribution Company
EIB European Investment Bank
EPP Emergency Power Producer
EWURA Energy and Water Utility Regulatory Authority
FMO Netherlands Development Finance Company
GASCO Gas Supply Company
GoT Government of Tanzania
GSA Gas Supply Agreement
HHV Higher heating value
ICC International Chamber of Commerce
ICSID International Centre for Settlement of Investment Disputes
IDA International Development Association
IFC International Finance Corporation
IOC International Oil Company
IPP Independent Power Producer
IPTL Independent Power Tanzania Limited
LCOE Levelized cost of electricity

5
LNG Liquefied natural gas
LRMC Long-run marginal cost
MCM Millennium Challenge Corporation
MEM Ministry of Energy and Minerals
MPSA Model Production Sharing Agreement
mtpa million tonnes per annum
NKRA National Key Results Area
NOC National Oil Company
NORAD Norwegian Agency for Development Cooperation
PAE Pan Africa Energy
PAP Pan African Power
Petrobangla Bangladesh Oil, Gas, and Mineral Corporation
PETROCI Société Nationale d’Opérations Petrolières de Côte d’Ivoire
PGCB Power Grid Company of Bangladesh
PPP Public Private Partnership
PSMP Power System Master Plan
QRPP Quick Rental Power Plant
REA Rural Energy Agency
REB Rural Electrification Board
SAUR Société d'Aménagement Urbain et Rural
SCB-HK Standard Chartered Bank Hong Kong
SIDA Swedish International Development Cooperation Agency
SIPP Small Independent Power Producer
SPP Small Power Producer
TANESCO Tanzania Electric Supply Company Limited
TDFL Tanzania Development Finance Company Limited
TPDC Tanzania Petroleum Development Corporation
WACC Weighted average cost of capital

6
Executive summary
1. Achieving the Government of Tanzania’s goal of being a middle-income country by
2025 will require a substantial increase in energy supply to satisfy the sharp
increase in per capita—and hence total—energy consumption this higher level of
income is likely to entail. Historically, per capita electricity consumption in
Tanzania has been and remains low relative to other countries at similar levels of
overall energy consumption. Electricity consumption is constrained by a lack of
infrastructure at all segments of the electricity supply chain: generation,
transmission, and distribution. If left unresolved, the non-availability of electricity
in Tanzania will constrain sustained economic development and prevent the
achievement of the goals laid out in the Tanzania National Development Vision.
2. Traditionally, power generation in Tanzania has relied on hydroelectricity,
supplemented by oil-fired generation contracted from emergency power producers
(EPPs) when required. Increasingly uncertain hydrology, the high cost of oil-fired
generation, and increased domestic availability of natural gas are driving the
government toward an aggressive natural-gas led capacity expansion plan in the
near-term, to be supplemented by hydro and coal-based generation capacity in the
long-term.
3. At the same time, a structural reform of the national utility company TANESCO is
under way, with the aim of transitioning from the current single-buyer power
market model, to a less centralized model with unbundling across all market
segments (generation, transmission, and distribution).
4. Tanzania’s two natural gas producers currently supply natural gas to TANESCO
and other independent power producers (IPPs). The first of these, Songas, was
developed as part of a gas-to-power package and enjoys a discount on the gas that is
allocated to it. The second, younger producer, Mnazi Bay, was largely stranded
from domestic markets until the construction of the Mnazi Bay to Dar es Salaam
pipeline. The recent discovery of large off-shore gas reserves has led to the proposal

7
of an LNG-export facility, although legislation anticipates an off-take dedicated to
the domestic market.
5. These gas discoveries have led to greater interest in the use of natural gas in
electricity generation, with plans underway to expand the existing distribution
network and pilot projects to promote gas use in transportation. However,
developments in the international gas market show that global oversupply is
expected from 2016 and onward due to softening Asian demand and the completion
of multiple export projects commissioned earlier. The development of Tanzania’s
offshore resources is therefore expected to be delayed until international market
conditions make the investment more commercially attractive.
6. The Ministry of Energy and Minerals (MEM) forecasts per capita electricity
consumption will increase by over 500 percent between 2010 and 2035. Meeting
this demand will require investment of over US$40bn in power generation and
distribution over this period, a sum equivalent to over 80% of current GDP.
7. Investment will need to be financed from a range of sources, including foreign
private sources, donor partners and international financial institutions, and the
domestic capital market. Funds will be channeled through a variety of investment
vehicles: directly through TANESCO and the independent power producers (IPPs);
through the small power producers (SPPs) and the emergency power producers
(EPPs); and through a variety of public-private partnerships (PPPs). Different
investment channels imply different investment drivers and institutional
arrangements and hence different structures for remuneration and risk-sharing.
8. Historically, the bulk of investment was channelled through TANESCO, although
since the early 2000s direct investment through IPPs and EPPs has become more
common. Given TANESCO’s role as the principal purchaser in the system, all
power generation capacity procured not directly through TANESCO still need to
sign Power Purchase Agreements (PPAs) with the utility. TANESCO’s financial
health as well as its ability to structure and implement adequate PPAs is critical to
power generation investment in Tanzania; unless this can be secured, the authorities
8
may need to give serious consideration to prioritize structural un-bundling that is
currently ongoing in the sector, so that the counterparty risk for PPAs are diversified.
9. Recent efforts to bring private capital into the power sector via the IPPs and EPPs
have had mixed results in Tanzania. Weaknesses in due diligence during the
procurement and negotiation of PPAs have led to long and controversial legal
disputes that incurred significant indirect costs, as well as blemished the public
perception of private investment in Tanzania.
10. TANESCO’s financial performance has been weak for some time, and since 2012—
when poor hydrological conditions led to the use of emergency power plants and
extensive use of its own thermal generation—TANESCO’s cash flow has been
severely stressed, threatening its ability to deliver planned investment (and to fulfill
its role as the counterparty to many PPAs).
11. From 2011 to 2013, accumulated losses within TANESCO’s balance sheet almost
doubled (from Tsh 800 bn to almost Tsh 1,500 bn. By 2013 80% of the company’s
total assets were debt-financed, while pressures on liquidity since 2009 have
increasingly hampered the company’s ability to service its debts, despite sufficient
revenue collection. Before 2011 TANESCO’s operating income was roughly in
line with its operating expenses, but in 2012 and 2013, it reported significant net
operating losses, due in part to significant increases in the purchased (and
emergency) electricity component of its cost of sales.
12. The continuous depreciation of the Tanzanian Shilling has also had an adverse
impact on financial sustainability of TANESCO and its ability to make reliable
payments towards PPAs. PPAs with IPPs and EPPs are usually denominated in U.S.
Dollars, while TANESCO collects power tariff denominated in Tanzanian Shillings.
It is estimated that currency depreciation might have contributed to about 20% of
increase in the costs of purchased electricity.
13. Given the important role that natural gas plays in power generation expansion,
investment is also needed in the natural gas sector. The production capacity for the
near-shore resources needs to be doubled in the short term. In the long-term,

9
capacity expansion requires the government to carefully monitor the effect of its
PSA terms and the international gas market on its IOC partners’ willingness to
invest in off-shore production.
Cost-reflective electricity tariff
14. Under the current regulatory regime, it is the duty of the Energy and Water Utilities
Regulatory Authority EWURA to advise government on tariff setting for
TANESCO. Critical here is the determination of costs to be recovered via the
regulated tariff and governmental contribution and of costs to be recovered by
TANESCO through cost savings.
15. The setting of the electricity tariff by a regulator is necessary for the network
segments in countries with liberalized power sectors and for all segments in
countries with vertically integrated utilities. Well-designed tariff schedules are built
around some basic principles, including: economic sustainability, economic
efficiency, equity (or ‘fairness’), transparency, simplicity, stability, and consistency.
16. These principles can often be in conflict. Concerns about fairness can clash with
efficiency and sustainability considerations, while transparency and simplicity may
be compromised by concerns about equity. Any tariff-setting methodology requires
the decision-makers to make an informed compromise between these competing
principles, based on the underlying values and goals of the local economy.
17. Any methodology for determining electricity tariffs can be divided into two steps:
Calculation of allowed revenues to be recovered;
Definition of a tariff structure and allocation of allowed costs to the tariff
structure.
18. There are two common ways for regulators to determine what revenue recovery
should be allowed through the electricity tariff: the traditional method known as
cost-of-service (or rate-of-return regulation), and an extension of it, the incentive-
based regulation. The two differ mainly in incentive for gaining cost efficiency, in
how often the tariff review is conducted and how tariffs are set for intervening years
between reviews.
10
19. In cost-of-service regulation, the allowed regulated revenues are determined by
identifying total costs of the company based on submitted historical accounting
information. At each tariff review, the regulator constructs the total cost of the
company based on the summation of operation and maintenance costs, depreciation
costs plus an estimated return on assets (the so-called weighted average cost of
capital) and relevant taxes. Not all incurred costs are ‘allowed’ in this calculation of
if costs are deemed to be imprudently incurred. In practice detailed engineering or
econometric models are used to benchmark costs.
20. In incentive based regulation, the determination of allowed revenues is based on a
weighted average of actual historical costs for the past accounting period (ex- post
costs) and forecast or projected future costs (ex-ante costs). By shifting the balance
between these two components, the regulator can affect the incentives facing the
regulated utility. The more weight is placed on historical costs, the lower the
incentive to operate efficiently, since any costs will be passed on to consumers; by
contrast the more weight is placed on future expected costs, the greater the incentive
to generate economies since the savings accrue to the company.
21. Incentive-based regulation can operate either a price cap or a revenue cap, but in
either case, it is important that factors outside the control of the utility -- such as
fuel price increases and inflation – are incorporated into the cap, especially if tariff
reviews are conducted at large intervals. Some adjustment for improvements in
productivity is usually incorporated by a downward adjustment in the cap.
22. Once the volume of allowed revenues is determined, the second step of the rate
setting methodology involves setting the tariff structure so that costs can be
allocated to each element in the structure. The regulator may choose to allow the
company flexibility to design its end-user tariffs based on its allowed revenues, or it
may decide to design the end-user tariff itself to prevent cost shifting among
consumer classes.
23. An approximate benchmark for the structure of the tariff is usually the underlying
cost structure for providing electricity. The exact costs of providing for each
individual consumer at each moment in time are all different, so some broad

11
categorization of end-users is required (by voltage level of the connection, by
geographic area, by season, by blocks of hours, or by sector). For each category of
end-users, the tariff can contain an element based on the maximum capacity
contracted/installed (per kW), an element based on the energy consumed (per kWh),
and a fixed charge (per connection).
24. The electric power industry in Tanzania currently operates under a multi-year
integral tariff proposed by TANESCO and approved by EWURA, to be reviewed at
least once in every three years. This is equivalent to the price cap variety of
incentive-based regulation with a standard regulatory lag. The integral tariff does
not distinguish between the origin of costs that need to be recovered into functional
segments such as generation, transmission, and distribution. This is a feature which
reflects the current not yet unbundled power industry structure in the country.
25. Since the establishment of EWURA in 2006, the regulator has already undergone
five rounds of tariff reviews. A sixth review is planned for 2016 but at time of
writing this had not taken place.
26. We analyse the 2013 tariff review in the light of the core principles noted above,
focusing primarily on efficiency, economic sustainability, and equity. In doing so,
we distinguish between TANESCO’s application and the final EWURA
recommendation and describe some of the incompatibilities in method between the
approaches adopted by the company and its regulator. Our analysis shows that the
computation of revenue requirement is based on the ex-ante forecast of the cost
elements rather than an ex-post evaluation of historically incurred costs. In principle,
this incentivizes TANESCO to provide regulated services at costs lower than those
approved.
27. We also found that the generation-related costs are highly sensitive to the
underlying assumptions around generator availability assumptions. This finding
corresponds to Tanzania’s three-tiered generation capacity: very low variable cost
hydro forms the first tranche, gas generation capacity with medium variable cost,
and liquid-fuel fired generation with high variable cost. Hydrology and gas
availability are factors outside of TANESCO’s control, and any calculation of

12
generation revenue requirement which does not explicitly address these two
exogenous uncertainties will have a high margin for error. This increases the
difficulty of ex ante revenue requirement determination, which is the currently
adopted method.
28. We have also analysed whether the tariff charged incentivizes consumers to use
electricity efficiently. Within the approved tariff design, the capacity charge
incentivizes larger consumers (T2 and T3) to use contracted capacity more evenly
and contract only as much as needed. The increasing block design for the energy
charge of the customer class with the smallest consumption (D1) incentivizes them
to switch to the general class (T1) once monthly consumption exceeds 400 kWh.
All users consuming more than 200 kWh are incentivized to contract power at the
highest voltage level possible, given the lower average cost of electricity charged.
29. Given Tanzania’s power system’s high sensitivity to peak demand, it should be
investigated whether additional measures such as time-of-use tariff could bring
important system savings by avoiding the use of expensive oil-fired generation units
(EPPs). In the long-term, EWURA might consider transitioning from the accounting
approach of cost allocation to the marginal cost approach, so that the use of
electricity by Tanzanian ratepayers is based on the knowledge of the amount of
future resources used to provide it.
30. Third, we analyzed whether the allowed revenues to be recovered are sufficient to
cover the operating expenditures of the licensees, including a reasonable return for
the capital invested. Furthermore, we investigated if the totality of tariff charged
corresponds to the allowed revenues (additivity). We noticed that because EWURA
published the approved tariff levels but not the approved revenue requirement from
which they were derived, it is not possible to ascertain the regulator’s position
toward specific items in TANESCO’s proposed revenue requirement.
31. Our analysis also indicates that the tariff levels proposed by TANESCO for the
present year is additive and sufficient to recover all revenue requirement (including
operating expenses, loan repayment, and self-funded investment) proposed for the
previous year. Likewise, the tariff approved by EWURA for the current year is just

13
sufficient to recover operating expenses forecasted for the previous year. On the
other hand, comparison of TANESCO’s revenue requirement with the AF-
Mercados Cost of Service Study shows that the amount of transmission and
distribution network investment planned by TANESCO is significantly lower than
what is expected, possibly indicating that the (historical and expected) approved
revenue requirement is not high enough to sustain TANESCO’s own investments.
32. Fourth, we analysed the way grants from the government and development partners
were treated in the computation of the revenue requirement. Our results confirm that
when calculating its revenue requirement, TANESCO deducts its other sources of
revenue, including government revenue grants, from the revenue requirement. This
is consistent with the legislated principle that the costs covered by such revenue
shall not be reflected in the revenue requirement. The EWURA-approved revenue
requirement formula should be adjusted to incorporate such revenues.
33. Fifth, we examined whether there are cases which customer classes are charged
more than the costs they impose upon TANESCO (cross-subsidization) and how are
such cases justified. We found that the extent of cross-subsidization in the case of
the lifeline rate is limited and delivers a small overall effect. Assuming costs are to
be allocated based on contribution to total demand, then the latest approved tariffs
might have attributed more costs to be borne by T1 customers and less to be borne
by T3-MV customers. It is hypothesized that this might be a decision on the part of
the regulator, after consultation with representatives of electricity consumers, to
cross-subsidize the industrial customers (T3-MV class).
34. Finally, we explored whether approved tariffs are consistent over time. Our analysis
demonstrates that the approved tariff has been steadily increasing (especially the
energy component of the tariff) since 2006. EWURA has consistently approved
tariffs which are lower than the ones that TANESCO has applied for, and average
increase has never been higher than 40%. When considering consumer categories,
D1 (<50/75 kWh) and T3-MV customers have been increasing more slowly than
those of other classes of customers. This observation is consistent with the cross-

14
subsidization of D1 lifeline customers and the hypothesized cross-subsidization of
T3-MV customers.
35. The approved adjustment mechanism of tariff for changes in fuel costs, foreign
currency exchange rate, and inflation, meant to reflect changes in costs that are
beyond the utility’s control, is expected to increase the volatility of the approved
tariff over time. However, its implementation is unlikely to be automatic in the near
future. The regulator has shown that it assesses the likely impact of the tariff
adjustment before approving/disapproving adjustment according to the formula. If
automatic adjustment does not take place, EWURA should conduct more frequent
tariff reviews with smaller scope, focusing on changes in fuel costs, exchange, and
inflation. This should decrease the regulatory lag in Tanzania’s tariff setting process
and, in theory, decrease the incentive for the regulated utility to seek efficiency
savings. Meanwhile, until a full oil-to-gas transition in the power sector is complete,
fuel costs are largely outside of the control of the utility (volatile oil prices and
uncertain hydrology) and should be adjusted accordingly. This is a necessary step
toward improving risk sharing between the utility and consumers.
International Experiences
36. To supplement the analysis, two countries – Bangladesh and Côte d'Ivoire – are
selected, and their experiences in the co-development of natural gas and electricity
sectors are presented to shed light on the path forward for Tanzania. These countries
are chosen based on the relative use of natural gas in power generation in their
energy system and their level of electricity consumption.
37. The case study of Bangladesh reveals that the availability of a domestic fuel for
power generation and a low tariff for its use in the power sector do not guarantee
unconstrained growth of the power sector’s ability to meet demand. Instead, the
same problem encountered in the power sector – a demand that is growing at rate
that cannot be sustained by local conditions – could be replicated in the gas sector.
It also illustrates how the contracting of emergency power, perceived as a temporary
solution, consumed project management capacity and cash flow from the public

15
utility, potentially weakening the power sector’s ability to develop more permanent
forms of power generation capacity.
38. The Ivoirian experience demonstrates the critical nature of timing, the pacing of
supply growth relative to demand growth. Once supply (sourced at reasonable
prices) is sufficient to cover existing demand with a comfortable margin, it becomes
easier to procure future supply, changing the dynamics of power system planning
from demand-pulled to supply-pushed.
Conclusions
39. Tanzania’s development goals require $40 billion investment in the power
generation sector to meet rising demand. In order that key investments can be
secured in time, the institutional arrangements for investment in Tanzania’s power
sector are presented. The track record in funneling investment to the sector has been
surveyed, and possible bottlenecks are discussed. Special attention is given to the
gas sector, given the power sector’s planned reliance upon natural gas as a
generation fuel. It is found that the financial health of TANESCSO, the state power
utility, is central to all investment vehicles, since it is either directly responsible for
investment, or indirectly, as the counter party to the variety of PPAs available with
IPPs, EPPs, SPPs, or PPPs.
40. Increases in costs are partially attributable to non-favourable hydrology, partially
attributable to the depreciation of Tanzanian shilling against the US dollar, the
currency in which PPAs are denominated. It is found that the core tension existing
within Tanzania’s tariff setting methodology is the trade-off between efficiency,
sufficiency, and stability principles. The ex ante assessment of TANESCO’s
revenue requirement, a typical incentive-based price cap regulation, is theoretically
efficient but not robust: TANESCO’s costs of service are subject to important
external uncertainties like hydrology, currency depreciation, and global fuel prices.
In order to take revenue sufficiency into account, the regulator then needs to
periodically adjust tariff based on ex post fuel costs and inflation rate.

16
Introduction
The United Republic of Tanzania, the union of the mainland Tanganyika and the islands of
Zanzibar, Pemba, and several smaller islands, is a medium-sized East African country with
50 million inhabitants. The Government of Tanzania (GoT) is working toward the
realization of its development targets, articulated as the ‘Tanzania Development Vision
2025’ through the national development strategy MKUKUTA II, which sets out to reduce
income poverty, to improve quality of life and social well-being, and to improve
governance and accountability. Transformation of Tanzania’s public service delivery is
considered necessary to achieve the country’s aspirations. Since 2013, the GoT has adopted
the Malaysian ‘Big, Fast Results’ model, a domestic results-driven reform agenda for
public sector reforms, known locally as ‘Big Results Now!’ (BRN) (Janus & Keijzer, 2015).
The BRN focuses on delivering implementation of specific goals within a stipulated
delivery timeline. Energy is one of the six National Key Results Areas (NKRA) identified
by the GoT, along with agriculture, education, resource mobilization, transport, and water.
One of Tanzania’s key development targets is to grow its economy to reach middle-income
status by 2025,1 crossing the Gross National Income (GNI) per capita threshold of $1,045
to at least $3,000. Access to available energy is considered a pillar for economic and human
development. Empirically, consumption of electricity is positively correlated with the GNI
per capita achieved by a country. The correlation of electricity consumption with the GNI
per capita is especially strong for countries with electricity consumption below 10,000 kWh
per capita2 (Figure 1). The relative level of consumption of electricity in a country is also
positively correlated with GNI per capita.
1 The low, middle and, high-income categories are World Bank operational lending categories. A country’s
status is determined on the basis of its GNI per capita in international dollars using the Atlas method of
currency conversion. 2 At higher electricity consumption, the correlation with GNI per capita decreases; the effect of electricity use
has diminishing returns in terms of per capita income beyond a certain threshold.

17
Figure 1: Correlation between electricity consumption and GNI per capita for 2012
(Data source: World Bank)
The economic growth of Tanzania has been impressive, with nominal GNI per capita
increasing on average by 9.5 percent each year between 2006 and 2014, resulting in a
growth from $450 to $930.3 Real GDP growth has also proved resilient, averaging 7 per
cent over the past decade. In comparison, the per capita electricity consumption in Tanzania
grew from 51 kWh to 99 kWh between 2000 and 2012, at an annualized growth rate of 6
per cent, but it remains low relative to other countries with similar levels of total energy
consumption (Figure 2). The other forms of energy consumed by Tanzania are biomass
(86.4 per cent), oil products (10.6 per cent), natural gas (0.7 per cent), and coal (0.2 per cent)
(IEA, 2013). The consumption of electricity in the country is constrained by a lack of
infrastructure at all segments of the electricity supply chain: generation, transmission, and
distribution. If left unresolved, the limited availability of electricity in Tanzania will
constrain sustained economic development and prevent the achievement of socio-economic
goals.
3 Part of this is attributable to the GDP rebasing in 2014 (Sy, 2015)

18
Figure 2: Overall energy use and electricity consumption for world countries in 2012
(Data source: World Bank)
In 2012, the Ministry of Energy and Minerals (MEM) made projections for unconstrained
electricity consumption for the period 2010 to 2035, forecasting that per capita electricity
consumption would increase five-fold by 2035, to levels on par with Pakistan, Sri Lanka,
and Guatemala in 2012 (Table 1). The investment required in generation and transmission
to increase installed power generation capacity from 1,466 to 8,960 MW and to increase
overall electrification rate from 14 per cent to 72 per cent, is expected to be more than $40

19
billion, the same order of magnitude as Tanzania’s GDP ($49 billion in 2014). The BRN
Energy lab has set even more ambitious targets for the medium term: for installed capacity
to reach 6,000 MW and per capita consumption to reach 490 kWh by 2025 (NKRA Energy,
2015).
Table 1: Summary of unconstrained electricity demand forecast results (Ministry of
Energy and Minerals, 2013a).
Year Annual consumption
(GWh)
Population
(million)
Electricity consumption per
capita (kWh)
Peak demand
(MW)
2010 4,176 43.2 97 1,054
2025 22,243 65.4 340 4,690
2035 40,083 85.0 472 7,589
In order to increase the use of electricity, the government has made aggressive
electrification targets, hoping to achieve electrification rate to 30 per cent by 2015, 55 per
cent by 2025, and at least 75 per cent by 2035 (NKRA Energy, 2015). Although this is less
ambitious than the United Nations’ goal of universal access to modern energy services by
2030, it is aligned with estimates from McKinsey, a consultancy: the sub-Saharan Africa is
more likely to achieve an electrification rate of 80 per cent by 2040, based on experiences
elsewhere such as Tunisia, South Africa, Indonesia, and Brazil (Castellano, Kendall,
Nikomarov, & Swemmer, 2015). The first target has already been reached after important
increases in electrification rate in the last two years (Figure 3).

20
Figure 3: Historical and target electrification rate (Data sources: World Bank, IEA,
PDB)
Investment in Tanzania’s power sector could be channelled from a number sources: the
Tanzanian public (electricity ratepayers and/or taxpayers), international financial
institutions and donors, domestic and foreign private investors, or from commercial banks.
Rarely is an investment made entirely with funds from a single source. Existing investment
arrangements in the sector tap into the sources of funds differently, with varying types of
constraints, sharing of risks, costs, and benefits. In the next section, the current industry
structure of the Tanzanian power sector is reviewed, following that of its nascent gas sector,
a new development which can greatly affect power generation. In the third section, the
institutional arrangements that interface different sources of finance and the power sector
are presented, with a focus on generation investment, which represents two-thirds of the
$40 billion investment gap estimate. In the fourth section, the setting of the electricity tariff
– the institutional mechanism that regulates cost recovery for power sector investment from
ratepayers – is analyzed in detail. In the fifth section, international experiences from
Bangladesh and Côte d'Ivoire, countries which have managed interdependent co-
developing gas and power sector investments, are discussed and potential learning points
highlighted. Finally, the sixth section provides our concluding remarks.

21
Review of Tanzania’s power and gas sectors
The development of Tanzania’s electricity sector roughly mirrors the development of the
national economy as a whole, from small private companies in the former German
protectorate in the early 20th
century to today’s national utility in transition toward
liberalization. The natural gas sector’s development has followed a different trajectory due
to the relative late discovery of gas (1974) and the lack of interest in major development
until the recent discovery of important off-shore gas reserves by international oil and gas
companies. It is important to understand key development constraints in both sectors,
because the national strategy of Tanzania, described in more detail in the next section, is to
boost the development of gas-fired power generation given availability of domestic
resources. The power and gas industries thus form an interdependent supply chain.
Current power and gas sector governance structure
The Ministry of Energy and Minerals (MEM) oversees the power and gas sectors in
Tanzania. It is mandated to develop energy and mineral resources and has the power to
develop and review government policies in the energy sector. The Petroleum Act of 1980
empowers the Minister of Energy and Minerals to grant, renew, suspend, or cancel licences
for oil and gas exploration or development, aided by the Commissioner for Petroleum
Affairs, appointed by the Tanzanian President (Economic and Social Research Foundation,
2009). As a matter of general practice, all licences for petroleum explorations and
production are issued to the Tanzania Petroleum Development Corporation (TPDC), a fully
government-owned parastatal organization under the MEM. TPDC then engages with
foreign companies through Tanzania’s tripartite Production Sharing Agreement (PSA),
entered into between the GoT, TPDC, and the investing company, authorizing the company
to carry out the petroleum operations on its behalf, granting it exclusive rights over the
licence area.
Operational since 2006, the Energy and Water Utility Regulatory Authority (EWURA), an
autonomous multi-sectoral regulatory authority, is responsible for the technical and
economic regulations of electricity, downstream oil and gas, and the water sector in

22
Tanzania. EWURA awards licences to entities seeking to undertake licensed activities
(EWURA, 2012b).4 It also approves and enforces tariffs and fees of licensees (including the
transmission tariff for gas and the retail tariff for electricity).
Before 1992, Tanzania Electric Supply Company Limited (TANESCO), a vertically
integrated, fully state-owned utility, has been the sole company responsible for electricity
generation, transmission, and distribution. The company was fully nationalized in 1964,
after the United Republic of Tanzania was formed by the merger of Tanganyika and
Zanzibar. In 1992, as part of the structural adjustment that started in the mid-1980s, and
owing to drought-induced electricity crises, the government lifted TANESCO's monopoly
in power generation with the intention of attracting private sector investment to supplement
the TANESCO-owned generation capacity (Vagliasindi & Besant-Jones, 2013). Today,
TANESCO remains the sole licensee for transmission and the main licensee for distribution
activities, though it purchases electricity generated by a number of Independent Power
Producers (IPPs), Emergency Power Producers (EPPs), and Small Power Producers (SPPs).
The Rural Energy Agency (REA), another autonomous body under the MEM, operational
since 2007, is responsible for the support and facilitation of improved access to modern
energy in rural areas by running training programmes, financing rural grid expansion, and
partially financing rural energy projects (mostly projects developed by SPPs).5
The division of responsibilities among the public entities mentioned above is illustrated in
Figure 4.
Currently, the MEM chairs the NKRA steering committee for energy, formed by members
from the MEM, the Ministry of Finance, President’s Delivery Bureau, TANESCO,
Commission for Energy and Petroleum Affairs, REA, TPDC, and Kilwa Energy Company
Limited (NKRA Energy, 2015).
4 EWURA licensable activities include gas processing, transportation, distribution, import/export, and supply,
as well as power generation, transmission, distribution, import/export, and supply, among others. 5 Rural distribution networks, after construction is complete, are transferred to TANESCO without payment
from TANESCO (Innovation Energie Developpement, 2014).

23
Figure 4: Existing responsibilities of Tanzanian public institutions in the power and
gas sectors
Ministry of Energy and Minerals (MEM)
Minister & Commissioner for Petroleum Affairs
Energy and Water Utilities Regulatory Authority (EWURA)Rural Energy Agency (REA)
Tanzania Petroleum
Development Corporation
(TPDC)
PSA contractors
TANESCO
Oversees
Awards license to
Enters into PSA with
Licensed companies
Other power producers
Awards license to and sets tariffs for
Partially finances eligible projects from
Purchases power from
Finances rural network expansion
Gas production Gas T&D
Power generation Power T&D

24
Gas sector infrastructure
Currently, there are only two commercialized natural gas projects in Tanzania: Songo
Songo, operational since 2004, and Mnazi Bay, operational since 2006. The reserves for
these projects were discovered in 1974 and 1982, respectively, but were left undeveloped
because exploitation was then not considered commercially viable.
The Songo Songo gas field, with unrisked mean recoverable resources of 551 Bcf, located
15 km from the Tanzanian mainland and 200 km south of the commercial capital, Dar es
Salaam, is operated by Pan Africa Energy (PAE), an Orca Exploration subsidiary, under a
PSA with the TPDC. Part of the gas produced from the Songo Songo field, from reserves
owned by TPDC, is allocated for use by Songas, a gas-to-power joint venture. The rest is
marketed by PAE to TANESCO for power generation and 38 industrial customers in the
Dar es Salaam area, ranging from cement, steel, and textile producers to breweries
(Bukurura, 2015). Songas owns the gas processing plant and the 225 km pipeline that
connects Songo Songo to Dar es Salaam; as one of the two IPPs, Songas also owns and
operates a 190 MW gas-fired power plant in Ubungo, a ward of Dar es Salaam. The
‘protected gas’ allocated to Songas under a 20-year contract until July 2024 is about 229
Bcf of the total reserve. The protected gas is sold at a price of $0.55/MMBtu, indexed to the
USA Consumer Price Index (CPI) over the course of the 20-year contract, reflecting the
costs that PAE incurs for delivering the gas to Songas. In other words, the wellhead price of
protected gas is free; this was agreed upon as part of the gas-to-power project. For the
marketing of non-protected gas, PAE’s Portfolio Gas Supply Agreement (PGSA) with
TANESCO has set the contract wellhead price for gas delivered to be $1.98/MMBtu, with
additional processing and transportation tariff of $0.59/MMBtu, both indexed to the annual
average USA CPI (White & Case LLP, 2011). The rest of gas that is marketed from Songo
Songo is priced at a maximum of 75 per cent of the price that the buyer pays for equivalent
liquid fuel (Gratwick, Ghanadan, & Eberhard, 2007).
The Mnazi Bay project, operated by Maurel et Prom, co-owned by Wentworth Resources
and TPDC, has unrisked mean recoverable resources of 1,596 Bcf. Other than supplying a
gas-fired power plants of 18 MW belonging to TANESCO, this resource had been largely
stranded. By August 2015, however, the construction of a pipeline from Mnazi Bay to Dar

25
es Salaam, with connection to Songo Songo, had been completed and first gas delivery
taken place (Rigzone Staff, 2015). The pipeline is owned and operated by the Gas Supply
Company (GASCO), a subsidiary of TPDC within its newly established downstream
directorate. The gas distribution network is under expansion to supply more residential,
institutional, and industrial customers. Also, according to TPDC, dual-fueled vehicles,
running on compressed natural gas and gasoline, are being encouraged via the planned
building of natural gas filling stations (TPDC, personal communication, 2016). The
distribution of existing Tanzanian gas sector infrastructure is shown in Figure 5. Given that
the deep-water natural gas finds in Tanzania, discovered in recent years, are located near
Mtwara, the newest pipeline is expected to transport a proportion of deep-sea production to
Dar es Salaam, if these projects come online (see Figure 7). In the short to medium term,
however, power generation expansion based on gas use and other gas consumption depends
upon the more modest coastal margin reserves.
Figure 5: Natural gas fields and pipelines in Tanzania

26
East African gas boom
Since 2010, there have been significant deep-water gas finds in East Africa due to
convergence of technological, market, and political drivers: increased capability in seismic
interpretation and deep-water drilling/completion, expected rise of LNG demand in the high
value markets of Asia, and governments supportive of gas project developments (Ledesma,
2013; Wood Mackenzie, 2015). These discoveries have propelled Tanzania and
Mozambique to become the focus of attention as a source of new global gas supply. In
Figure 6, the latest proven reserves figures for the two countries are shown together with
other high-reserve countries for comparison (EIA, 2014; Ng’wanakilala, 2015).

27
Figure 6: Countries with highest proven gas reserves (Data source: all from EIA for
end of 2013 except for Mozambique and Tanzania)
By December 2012 there were 26 PSAs signed with 18 oil exploration companies seeking
to conduct exploration activities both offshore and onshore6 (Ministry of Energy and
Minerals, 2013b). The most significant natural gas discoveries so far have been made by
6 In July 2014, a leaked PSA between Statoil and TPDC has caused controversy within the country about
whether Tanzania will gain the full benefits of its sizeable gas deposits. In November, the chairman and
director-general of TPDC were temporarily arrested after the state body refused to provide the Public Audits
Committee with the details of the confidential contracts (Manson, 2014; The Economist, 2014).

28
major exploration companies including BG,7 ExxonMobil, Ophir, and Statoil in offshore
blocks 1, 2, 3, and 4 (Figure 7). At the request of the Tanzanian government, an integrated
project team has been set up involving the four companies to study the viability of
developing a joint onshore LNG facility where infrastructure costs will be shared. It is
believed that the gas uncovered should be enough to support a two-train 10 million tonne
per annum (mtpa) LNG plant and meet potential domestic market obligations (Gas
Strategies, 2014). Along with neighbouring Mozambique, Tanzania is in a race with
Australia, the United States, and Canada to build LNG liquefaction terminals, aiming to
exploit a gap in global supply that is expected to emerge in the 2020s (Ledesma, 2013).
Figure 7: Recent Tanzania offshore natural gas discoveries (Source: Gas Strategies)
7 The takeover of BG group by Shell places the latter back in the East Africa gas scene after losing a bidding
war for stakes in Mozambique to PTT Exploration & Production (Bloomberg, 2015).

29
Domestically, the Lindi Bay LNG export project, costing about $20 billion, represents more
than a third of the country’s GDP ($49 billion in 2014) and the largest investment ever in
Tanzania. Government revenues from the LNG project may reach $3 billion annually
(Norton Rose Fulbright, 2014a; Pedersen & Bofin, 2015). By comparison, total government
revenues in 2011–12 amounted to $4.4 billion and official development assistance to $1.8
billion. The Tanzanian government is in the process of updating its fiscal, legislative, and
regulatory framework that governs the gas sector to reflect changes in the sector. Since
2013, a flurry of new energy legislation and review of existing instruments has been
proposed in Tanzania. The National Natural Gas Policy, adopted in 2013, applies to the
midstream and downstream segments and emphasizes the following elements: precedence
given to supplying the domestic market over the export market8, local content sourcing,
potential requirement for International Oil Companies (IOCs) to be listed on the Dar stock
exchange, mandatory Corporate Social Responsibility obligations, and the establishment of
a Natural Gas Revenue Fund, managed by the Bank of Tanzania (Norton Rose Fulbright,
2014b). Other important pieces of legislation are the Petroleum Act 2015, the Tanzania
Extractive Industry (Transparency and Accountability) Act 2015, and the Oil and Gas
Revenues Management Act 2015. Together, they repeal the Petroleum (Exploration and
Production) Act 1980, covering upstream petroleum operations, and the Petroleum Act
2008, covering mid and downstream petroleum supply options. The Petroleum Act 2015
establishes new institutions, namely an Oil and Gas Bureau within the Office of the
President to advise the Cabinet and a Petroleum Upstream Regulatory Authority – distinct
from EWURA and TPDC – that advises the Minister of Energy and Minerals on
negotiations of PSAs, the implementation of local content in the petroleum sector, and the
granting of exploration, development, and production licences. It also designates TPDC as
the official National Oil Company (NOC), which is the only entity that can be granted
petroleum rights including licences. As these licences are not transferrable, private sector
participants must partner with the NOC, which shall retain 25 per cent interest in any joint
venture vehicle (Clyde&Co, 2015). The Petroleum Act also makes provision for the NOC
to have a designated subsidiary as the gas aggregator. This new entity will have the
exclusive right to purchase, collect, and sell natural gas from producers. Private sector
8 A proportion of proven reserves are to be dedicated to the domestic market based on reserve assessment.

30
operators, given the applicable licences have been obtained, are allowed to operate
midstream and downstream infrastructure after acquiring gas from the aggregator.9 The
Extractive industry act (Transparency and Accountability ) proposes to publish all Mining
Development Agreements and PSAs through a website, including those entered into during
and before the passage of the bill. Altogether, these newly passed pieces of legislation
reflect a more assertive bargaining position of the Tanzanian government with potential
PSA counterparties (Pedersen & Bofin, 2015).
The speed and volume of LNG exports from Tanzania will be determined not only by the
amount of gas in place and domestic politics and policies, but also by the economics of the
proposed export projects and the global demand for LNG. By extension, the availability of
off-shore gas resources for domestic use (the domestic off-take component of PSAs with
LNG developers), is also contingent upon external conditions. Preliminary assessment
suggests that the landed costs in Asia for gas from East Africa, US Gulf, and Australia are
very similar, therefore the price and contract terms of LNG sales will play an important role
in the competition for the Asian market (Ledesma, 2013). As of February 2016, there is no
LNG off-take agreements between the LNG project developers and potential buyers. Key
LNG purchasers in Asia are not in a rush to conclude contracts, since there will soon be an
oversupply as projects already under construction come on-stream. Furthermore, Wood
Mackenzie, in a global gas analysis published in September 2015, recognizes that, given
250 mtpa of global LNG supply and a further 140 mtpa under construction, the global
market will struggle to absorb such a large supply increase, especially since Asia – China in
particular – has shown subdued industrial output and increasing fuel competition driven by
the low price of oil (Tomnay, 2015). Therefore, the final investment decision, initially
planned for 2016, and the subsequent commissioning of the export facility, initially planned
for 2020, are expected to be delayed beyond the original timeline. The uncertain global
outlook casts shadows over the economic feasibility of developing Tanzania’s offshore gas
resources.
9 Three types of licences are available: processing, transportation and storage licence; liquefaction, shipping
and re-gasification licence; distribution licence.

31
Power sector infrastructure
Today, TANESCO remains the main company which owns and operates downstream
power sector infrastructure. The 4 MW Mwenga hydro project is the only other company
that also holds a licence for distribution and supply activities. The main grid owned and
operated by TANESCO consists of 4,869 km of transmission lines at 220 kV, 132 kV, and
66 kV. The lines are concentrated along its main transport and development corridors,
where most of the population and agricultural activity is concentrated: from Dar es Salaam
west to Dodoma, then northwest to Mwanza on Lake Victoria in the northern part of the
country, connecting to Uganda and Kenya, from Dar es Salaam southwest to Mbeya and on
to Zambia; from Dar es Salaam north to the mountainous area around Kilimanjaro in the
northeast of the country, near Arusha (Figure 8). The development of road, water,
information, and communication technology infrastructure backbone broadly follow this
pattern. The rest of the country is less densely populated and has only fragmentary
infrastructure coverage.

32
Figure 8: The Tanzania transmission grid (The Business Year, 2014)
Based on the availability of connection to the national grid, the installed power generation
capacity in Tanzania can be divided into two categories: on-grid facilities which are
connected to the main grid connecting major load centres, and off-grid facilities connected
to isolated mini grids.10
Of the first type, there were 561 MW of hydropower projects commissioned between 1964
and 2000, dominated by the Kidatu Dam (204 MW) and the Kihansi Dam (180 MW). This
infrastructure is the legacy of the ‘Big Dam Era’, during which large hydroelectric dam
projects were funded by development aid programmes with sponsors such as the World
Bank, the Swedish International Development Cooperation Agency (SIDA), and the
Norwegian Agency for Development Cooperation (NORAD). Currently, these
10
The installed capacity of captive generation, generators owned and operated by households and businesses,
is not accounted for. Only anecdotal data on such capacity is available.

33
hydroelectric facilities are owned and operated by TANESCO. Increasingly, they suffer
from recurrent droughts and cannot be depended upon to generate electricity reliably.11
Hydropower stations, responsible for about half of the electricity generated in the country,
are located in southern Tanzania, while most load centres are in the north. There are also
fossil fuel-fired, on-grid power generating plants built since the 2000s, owned and operated
by different companies, reflecting the lifting of TANESCO’s monopoly in generation in
1992. Fossil fuel-fired generation plants owned and operated by IPPs came online in the
early 2000s, ten years after the lifting of monopoly: Independent Power Tanzania Limited
(IPTL)12
in 2002 and Songas – the joint venture mentioned previously – in 2004. In 2011,
TANESCO contracted EPPs13
, US company Symbion Power and Glasgow-based Aggreko,
to bridge the electricity supply gap caused by droughts and to provide diesel-fired rented
capacity. Since 2010, a few SPPs are also active, providing electricity to the grid burning
local biomass feedstock or generating small-scale hydroelectricity.
In regions where connection to the grid is not available, TANESCO owns and operates
isolated diesel generator-powered mini-grids mainly in the western belt from Bukoba to
Songea. The mini-grids located on the eastern shore, namely in Somangu and Mtwara,
small-scale gas-fired power plants, supplied by natural gas from the Songo Songo and
Mnazi Bay projects. Some SPPs contracted also provide electricity to the mini-grids.
The breakdown of installed generation by owner, type of generator and grid connection
status is shown in Figure 9. A further 15 MW of generation capacity is available through
imports from Uganda and Zambia.
11
Droughts have been recorded for the years 1967, 1977, 1984, 1988, 1990, 1996, 2003, 2004, 2006, 2011
(Masih, Maskey, Mussá, & Trambauer, 2014). 12
Changing hydrological conditions in the country between 1994 (IPTL project conception) and 1997 (end of
IPTL construction) and higher than expected construction costs led TANESCO to seek rescinding the PPA
signed with IPTL. The arbitrator, World Bank’s International Centre for Settlement of Investment Disputes
(ICSID) ruled against it finally in 2001, upholding the original PPA with some adjustments. In 2014, two
senior politicians were ousted following a scandal surrounding misuse of the TANESCO-IPTL joint escrow
account (Gratwick et al., 2007; Kabendera & Anderson, 2014). 13
The former Prime Minister Edward Lowassa resigned in 2008 over allegations of improperly awarding of
an EPP contract to US-based Richmond Development in 2006 (BBC News, 2008).
34
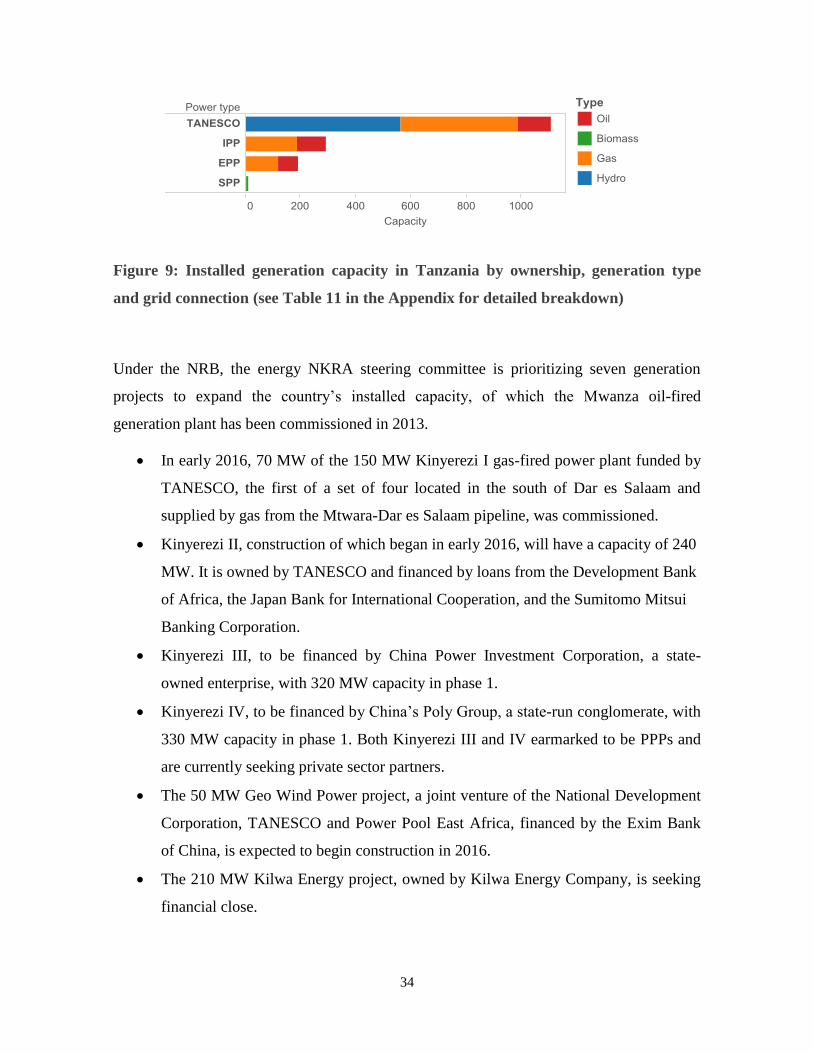
Figure 9: Installed generation capacity in Tanzania by ownership, generation type
and grid connection (see Table 11 in the Appendix for detailed breakdown)
Under the NRB, the energy NKRA steering committee is prioritizing seven generation
projects to expand the country’s installed capacity, of which the Mwanza oil-fired
generation plant has been commissioned in 2013.
In early 2016, 70 MW of the 150 MW Kinyerezi I gas-fired power plant funded by
TANESCO, the first of a set of four located in the south of Dar es Salaam and
supplied by gas from the Mtwara-Dar es Salaam pipeline, was commissioned.
Kinyerezi II, construction of which began in early 2016, will have a capacity of 240
MW. It is owned by TANESCO and financed by loans from the Development Bank
of Africa, the Japan Bank for International Cooperation, and the Sumitomo Mitsui
Banking Corporation.
Kinyerezi III, to be financed by China Power Investment Corporation, a state-
owned enterprise, with 320 MW capacity in phase 1.
Kinyerezi IV, to be financed by China’s Poly Group, a state-run conglomerate, with
330 MW capacity in phase 1. Both Kinyerezi III and IV earmarked to be PPPs and
are currently seeking private sector partners.
The 50 MW Geo Wind Power project, a joint venture of the National Development
Corporation, TANESCO and Power Pool East Africa, financed by the Exim Bank
of China, is expected to begin construction in 2016.
The 210 MW Kilwa Energy project, owned by Kilwa Energy Company, is seeking
financial close.

35
Beyond the prioritized projects, the Symbion Southern Electrification Project, a 400 MW
gas-fired power plant and a 400 kV transmission line from the plant in Mtwara to Songea,
is being negotiated as a PPP between TANESCO and US-based (Washington DC) Symbion
Power – a company already operating within Tanzania as an EPP (Symbion Power, 2015;
Wentworth Resources Limited, 2015c). Furthermore, between 2013 and 2015 a total of 155
MW of potential small-scale hydro, biomass, and solar PV SPPs have sent letters of intent
to EWURA, a prerequisite for project implementation (Tsakhara, 2015). If all planned
projects were to come online by 2020, the resulting 1,705 MW of capacity would mean a
doubling of Tanzania’s on-grid installed power generation capacity, which stands at around
1,520 MW. Beyond the projects already mentioned, there is another 4,332 MW of
tentatively planned generation capacity, where project names have been mentioned in the
2012 Power System Master Plan, but no procurement work has started (Figure 10).
Figure 10: Breakdown of Tanzania's generation capacity expansion plan (see Table 11
in the Appendix for detailed breakdown)
Transmission and distribution losses in Tanzania are comparable to its neighbours (Zambia,
Kenya, and Mozambique), but significantly higher when compared to countries around the
globe, standing at 18 per cent in 2012 (Figure 11). High losses in distribution have been

36
attributed to aging infrastructure, unplanned extensions of distribution lines and the
overloading of equipment due to inadequate investment in the past (Kihwele, Hur, &
Kyaruzi, 2012). Other than these technical causes, electricity theft is also believed to
contribute to non-correspondence between billed electricity and electricity fed to the power
grid, on small and large scales (Mwamunyange, 2013b). Such commercial losses are
thought to make up around half of the total transmission and distribution losses (NKRA
Energy, 2015).
Figure 11: Electric power transmission and distribution losses in 2012 (Data source:
World Bank)
In the near term, the transmission investment announced by TANESCO reflects the goals of
integrating the gas-producing south with the main grid, reinforcing the transmission
backbone around and to the west of Dar es Salaam, and expanding the grid toward inner
Tanzania, where diesel-powered isolated mini-grids operate (see Figure 12).

37
Figure 12: Current and planned power infrastructure (Data source: Lazimah, 2014;
NKRA Energy, 2015)
Between 2000 and 2012, annual consumption of electricity in Tanzania increased from
1,861 GWh to 4,419 GWh. Of the total electricity demand, half is residential demand and
half is more or less evenly split between industrial consumption and commercial demand.
Drivers in electricity demand growth include increasing mining activity (mines either
operate their own generators or connect to the grid), population growth, urbanization,
electrification rate increase, and increase in household consumption level (Castellano et al.,
2015; Tsakhara, 2015). Extrapolating from the current trend – the trend line grows
exponentially, with R2 = 0.976 – in 10 years, annual residential demand is expected to
increase to 5,000 GWh, commercial and industrial each to about 2,000 MWh, which
corresponds to a doubling of current demand to 9 TWh (Figure 13). Forecasts performed by
MEM in 2012 estimated a quadrupling of demand by 2025 to 20 TWh, if unconstrained by
the grid’s capacity to deliver electricity (Ministry of Energy and Minerals, 2012). Another
recent analysis forecasts a total electricity demand of 14 TWh by 2025 (Kichonge, John,

38
Mkilaha, & Hameer, 2014). Regardless of the exact figure, power demand in Tanzania is
expected to experience significant growth in the near term, in tandem with its economic
growth.
Figure 13: Extrapolation of electricity consumption trend in Tanzania (Data source:
IEA)
Access to electricity
Electricity was first used in Tanzania in 1908, when a railway company installed the first
power generator in what was then Germany’s East African colony in Dar es Salaam. In the
following four decades, colonial administrators, utility company officials, and (after 1931)
managers of the privatized Tanganyika power utility limited their efforts to meeting the
demand of the small European communities in the city and of the plantation agriculture,
instead of developing new markets among Africans (Straeten, 2015). Thus, by the 1950s,
when universal access to electricity was almost achieved in Europe and the United States,

39
electricity was only available for a few hundred customers in the capital and some towns of
Tanganyika, then under British mandate.
After its independence in 1962, Tanganyika united with neighbouring Zanzibar to form the
United Republic of Tanzania in 1964. In that same year, the government of Tanzania
acquired shares in the private Tanganyika Electricity Supply Company and Dar es Salaam
Electricity Supply Company, which became fully nationalized and merged to form
TANESCO in 1975 (Ghanadan, 2009). At the beginning of this period, in 1960, total
installed capacity in the country had been below 50 MW. Then, focusing on large-scale
generation and the establishment of a centralized power grid, with credit from the World
Bank and technical assistance from SIDA, TANESCO added 380 MW of hydropower to
the national grid by 1990. The overall electrification rate was 6.8 per cent in 1990 (IEA),
and though access in urban areas deepened, the lack of any coordinated rural energy
planning (Straeten, 2015) meant that less than 1 per cent of the rural population had access
to electricity in 1990.
In 1992, catalyzed by macro-reform priorities, national energy policy, drought-induced
electricity crises, and changes in World Bank’s lending policy, the GoT initiated reforms in
the power sector, which originally aimed to restructure and unbundle the power sector for
eventual privatization (Diu, 2011). TANESCO was performing adequately throughout the
1970s and 1980s, but the performance of the utility gradually declined toward the end of
the 1980s. It was unable to cover its operation and maintenance costs and debt service
repayment from its collected revenue: the average tariff was below costs levels in the early
1990s due to reluctance to increase tariffs during prescribed currency devaluation.
Furthermore, TANESCO experienced difficulties in enforcing payments for services and
arrears. The weak financial position of the company led to insufficient investment in
generation capacity and network reinforcement, power outages and distribution losses
increased accordingly, lasting until the end of the 1990s despite tariff increases in the
middle of that decade14
.
In 2002, TANESCO was placed under a two-year management contract with the South
African company NET Group Solutions, in pursuit of a financial turnaround in view of
14
Tariff was revised to $0.093/kWh in 1995 and $0.103/kWh in 1998, but eroded again to $0.07/kWh by
2001 due to inflation (Diu, 2011).

40
privatization. NET Group Solutions implemented measures to increase revenues, mainly
through enforcing collections and arrears payments and applying disconnection in the case
of non-payment, even to high-profile customers such as the police or the national post
office. Between 2002 and 2004, TANESCO revenue collection doubled. The management
contract was extended for two years in 2004, during which time the focus was to include
improvement in electrification and system reliability targets. By the end of the contract,
technical turnaround was limited, with poor hydrological conditions, costly contracts with
IPPs, and insufficient tariff rates15
cited as obstacles. Electrification rates stagnated between
1990 and 2008.
Currently, the main drivers of electrification in Tanzania are political priorities and
development policies, as demonstrated by the creation of the REA in 2005 and the setting
of aggressive electrification targets. The target-driven National Electrification Program is
financed by the REA-managed Rural Energy Fund, which is funded by donor contributions,
levies on electricity, and levies on liquid fuel import and purchase. At the end of 2013,
TANESCO had about 1.3 million connected customers. Beginning in 2014, a densification
program is proposed to increase the number of customers from already electrified
settlements by 1.8 million. A three-phase grid extension program, involving 5,526
settlements, is expected to further increase the total number of customers connected by
2022 to more than 5 million (Innovation Energie Developpement, 2014). A successful
electrification programme requires timely and sufficient investment in generation capacity
and in network infrastructure. While the private sector is expected to contribute to invest in
generation capacity via the PPP and SPP frameworks which have been established recently,
it is not expected to engage in grid extension, which is seen as economically unprofitable
(Ahlborg &Hammar,2014).
Structural reform of the power sector
The Tanzanian electricity sector is currently mired between two structural models: it has
opened up toward private sector investments in generation, but transmission and
distribution infrastructure investment is still the responsibility of TANESCO, the
15
Tariff in 2005 was revised to $0.076/kWh under the management of NET Group Solutions (Diu, 2011).

41
incumbent monopoly. Furthermore, although other vehicles have been created to channel
private sector investment, they do not yet directly enter into transactions with the Tanzanian
electricity consumers; TANESCO acts as the single buyer of electricity, interfacing
between private generation operators and all electricity consumers16
. The integral tariff rate
that is charged to all electricity consumers has been regulated by EWURA since 2006,
while the payments that TANESCO makes to purchase power from private power
generators have been privately negotiated in the form of PPAs17
.
According to the Tanzanian Electricity Supply Industry Reform Strategy and Roadmap, the
GoT has embarked on further reforming of the power sector from 2014 to 2025. Figures 14
and 15 show the current gas and power structure and the structure that Tanzania aspires to
have in the future. The transition from the existing single buyer structure to the retail
competition structure is to be conducted in stages:
By 2015: ring-fencing (accounting unbundling) of generation, transmission, and
distribution;
By 2018: administrative unbundling of generation (Gx) from transmission and
distribution and designation of an independent market operator; bulk off-takers able
to purchase power directly from generators, after paying wheeling charges to the
transmission owner;
By 2021: administrative unbundling of distribution from transmission (Tx);
By 2025: horizontal unbundling of distribution into several zonal companies (Dx);
By the end of the reform period, only the transmission and distribution tariffs are to be
regulated (MEM, 2014). The wholesale price of power that bulk off-takers and retailers
(who might or might not be distributors) are to be negotiated bilaterally through PPAs. The
retail price is to be determined competitively by market forces.
16
Mwenga Hydro project, an SPP, is the only other owner of distribution and supply activity licence awarded
by EWURA. It directly retails electricity to 15 remote and otherwise unserved villages. 17
The Songas and IPTL PPAs were signed before EWURA existed. Recently, the EWURA has established
and approved Model Power Purchase Agreements (Model PPAs) for projects above 10 MW (Ngamlagosi,
2015).

42
Figure 14: Current structure of Tanzania's gas and power sectors (Based on personal
communication with stakeholders)
Figure 15: Desired structure of Tanzania's gas and power sectors (Adapted from MEM,
2014)
EWURA approved tariff
SONGAS
IPPs
EPPs
SPPs
TANESCO
Bulk offtaker
Consumers
EWURA approved tariff
PPAs
Limited distribution at TANESCO tariff
Songo Songo PSA
Mnazi Bay PSA
TPDC
Gas supply agreement
Gas supply aggrement
EWURA approved tariff
Gas production
Power generation Power T&D
Power and gas consumptionGas T&D
IPPs
PPPs
SPPs
Bulk offtaker
Consumers
Gx Tx
Aggregator
Netback of substitute prices
Cost based price
Joint venture
Licensed companies
PPAs
Dx
Dx
Dx
Retail prices
PSAs GSAs
Regulated tariff
Gas production Gas T&D
Power generation Power T&D
Power and gas consumptionGas export

43
Based on communications with the President’s Delivery Bureau in February 2016, the
structural reform of the power sector has not yet reached its first milestone: the unbundling
of generation, transmission, and distribution within TANESCO’s accounts. It should be
noted that the restructuring of the power industry in all countries is a highly path-dependent
and political process, because it involves the redistribution of resources, control over key
infrastructure, and the associated rents. In addition, consultations with multiple power
sector stakeholders during the authors’ research trip suggests that the prioritization of
structural reform relative to other issues is different for different groups. Therefore, delayed
implementation of the timeline proposed above is expected.

44
Institutional framework for investment
The long-term investment needed in the power sector for the period 2010 to 2035, as
determined in PSMP 2012, is $40 billion. Of this, the short-term investment needed
between 2013 and 2017 is $11.4 billion, of which $8.4 billion is in generation capacity
(Ministry of Energy and Minerals, 2013a).
It can be seen from Figure 16 that the strategy adopted is to rapidly develop gas-fired
generation in the short-term (2014 to 2017), coal-fired generation in the mid-term (2017–
19), and bring online hydro generation capacity in the long-term (2019 to 2025). The
actively planned capacity of gas generation is 1,700 MW, which, in combination with
existing gas-fired generation capacity of 736 MW, amounts to a total of 2,436 MW by 2017,
if all planned power plants come online on time. If run at 70 per cent load (the average load
factor of Tanzanian demand) and assuming a higher heating value (HHV) based efficiency
of 40 per cent, supplying all these power plants will require a gas supply of 340
MMcf/day.18
Estimates from TANESCO, using different assumptions, forecast a 2018
demand of 475 MMcf/day (Wentworth Resources Limited, 2015b). The existing production
capacity at Songo Songo and Mnazi Bay is 102 MMcf/day and 70 MMcf/day, respectively,
adding up to 172 MMcf/day, falling short of the planned demand. Furthermore, the total
near-shore reserve, estimated to be 2,147 Bcf, will only be able to support consumption by
power generation plants at the planned rate for 17 years.
18
HHV used is 1,022.72 BTU/CF, based on the quality of Songo Songo gas (White &Case LLP, 2011).

45
Figure 16: Generation mix of historical and planned installed capacity in 2013 (see
Table 11 in the Appendix for detailed breakdown)
Given the above, the success of the investment plan presented above is not only conditional
upon timely investment in generation capacity, but it is also dependent upon timely
investment to double gas production and processing at Songo Songo and Mnazi Bay in the
near term. In the long term (beyond 15 years), it is conditional upon the successful
development of Tanzania’s offshore gas resources for domestic use (unlikely independent
of an export LNG project).
Based on the $120 million investment made to expand production at Songo Songo from 92
MMcf/day to 102 MMcf/day, it can be estimated that the expansion needed (160 to 300
MMcf/day) will require investment in the order of $2 billion to $3.5 billion (Simbeye,
2015). The existing gas transmission capacity between the production fields and the

46
proposed locations for the power plants, the Mnazi Bay–Dar es Salaam pipeline, is reported
to have a total capacity of 784 MMcf/day, which is adequate and is not expected to require
expansion in the near term (Wentworth Resources Limited, 2015a). In the long term, if the
gas-fired plants are to supply Tanzania beyond 2035, then the off-shore reserves will also
need to be developed by that time. The involvement of IOCs in providing investment and
the technical skills needed to develop such resources is perceived to be of great importance,
and it is conditional upon the development of the on-shore LNG export facility, reported to
range between $20 billion and $30 billion (Ng’wanakilala, 2014). A proportion of the gas
produced by the IOCs will be used to supply the domestic market under the domestic
supply obligation contained in their PSAs. Given proven reserve of 55 Tcf, the planned gas-
fired generation and planned 10 mtpa LNG export facility (equivalent of 1,435 MMcf/day)
can be supported simultaneously at full capacity for approximatively 80 years. The
investment needs required in the Tanzania power and gas sectors in the near term and long
term are compared in Table 2.
Table 2: Comparison of investment needs in Tanzania's electricity and gas sectors
Sector Near term (until 2018) Long term (2018 to 2035)
Electricity $11.4 billion $30 billion
Gas $2-3.6 billion $20-30 billion
The following section presents and compares the institutional arrangements that exist to
funnel in investment to electricity generation from the Tanzanian public, international
financial institutions and donors, domestic and foreign private investors, and commercial
banks. Their performance in bringing in investment is evaluated, after which the outlook
for investment in the gas sector upstream to power generation is discussed.
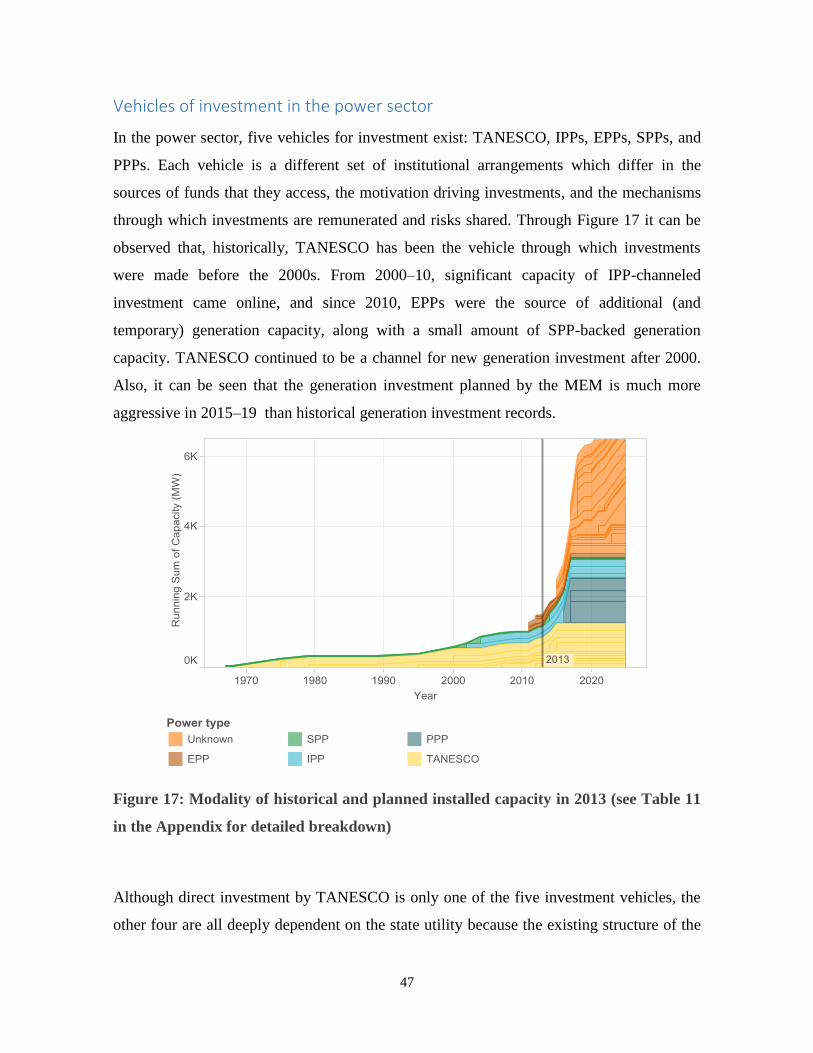
47
Vehicles of investment in the power sector
In the power sector, five vehicles for investment exist: TANESCO, IPPs, EPPs, SPPs, and
PPPs. Each vehicle is a different set of institutional arrangements which differ in the
sources of funds that they access, the motivation driving investments, and the mechanisms
through which investments are remunerated and risks shared. Through Figure 17 it can be
observed that, historically, TANESCO has been the vehicle through which investments
were made before the 2000s. From 2000–10, significant capacity of IPP-channeled
investment came online, and since 2010, EPPs were the source of additional (and
temporary) generation capacity, along with a small amount of SPP-backed generation
capacity. TANESCO continued to be a channel for new generation investment after 2000.
Also, it can be seen that the generation investment planned by the MEM is much more
aggressive in 2015–19 than historical generation investment records.
Figure 17: Modality of historical and planned installed capacity in 2013 (see Table 11
in the Appendix for detailed breakdown)
Although direct investment by TANESCO is only one of the five investment vehicles, the
other four are all deeply dependent on the state utility because the existing structure of the

48
Tanzanian power structure makes TANESCO either the only power off-taker allowed (for
IPPs, EPPs, and PPPs) or the most important power off-taker (SPPs). Consequently, all
power generation projects procured not directly through TANESCO still need to sign
Power Purchase Agreements (PPAs) with the utility. Therefore, TANESCO’s financial
health as well as its ability to structure and implement adequate PPAs is critical to power
generation investment in Tanzania.
Investment via TANESCO
Funds collected from Tanzanian ratepayers (via collected tariff revenue), taxpayers (via
GoT advances toward capital share, other grants and subsidies), international financial
institutions and donors (hereafter referred to as development partners, via basket funds and
direct project funds), and commercial banks (via borrowings) flow into TANESCO (Table
3). Unless earmarked specific projects by sponsors, the funds collected typically go to pay
for the utility’s own operating expenses and loan repayments before they are directed
toward investment. Given the role of TANESCO as the single buyer of all electricity from
other generators, the funds that TANESCO collects also need to pay for power procured
purchased from other power generators.
Since the 1990s, a gradual transition has occurred in the logic behind the operations and
investments of TANESCO, from a state-led model to a market-led model (Ghanadan, 2009).
This has had impact on the preferred sources of funds for TANESCO-based investments.
Prior to 1990, the government and development partners were the only source of finance.
Such development-oriented investors did not seek a commercial rate of return upon the
investments made. Electricity pricing was perceived to be a channel for income
redistribution, providing cross-subsidies to residential customers, small businesses, and
local industries, fulfilling a social function. The ongoing electricity sector reform has a new
vision for the sector: instead of financing investment in electricity sector via public means
and provide it as a public service, the private sector is to play a more important role in
financing new investment. It is hoped that domestic and foreign private investors seeking
commercial returns upon investment will be shouldering the burden of financing
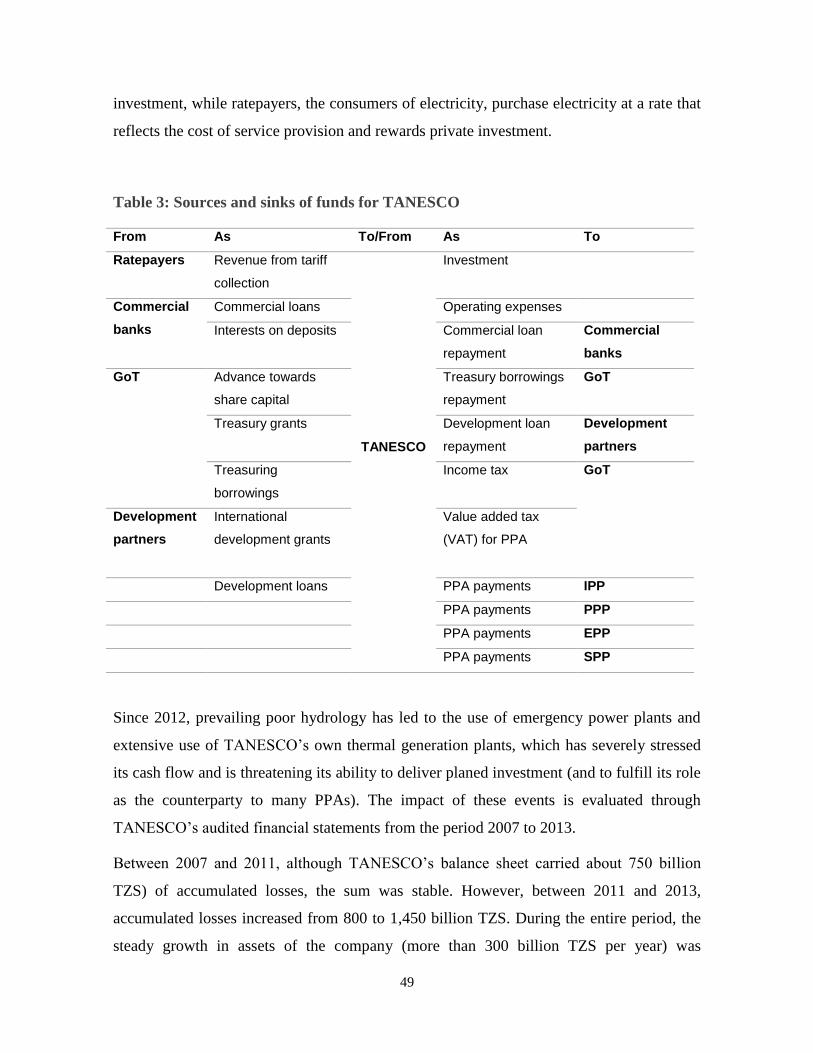
49
investment, while ratepayers, the consumers of electricity, purchase electricity at a rate that
reflects the cost of service provision and rewards private investment.
Table 3: Sources and sinks of funds for TANESCO
From As To/From As To
Ratepayers Revenue from tariff
collection
TANESCO
Investment
Commercial
banks
Commercial loans Operating expenses
Interests on deposits Commercial loan
repayment
Commercial
banks
GoT
Advance towards
share capital
Treasury borrowings
repayment
GoT
Treasury grants Development loan
repayment
Development
partners
Treasuring
borrowings
Income tax GoT
Development
partners
International
development grants
Value added tax
(VAT) for PPA
Development loans PPA payments IPP
PPA payments PPP
PPA payments EPP
PPA payments SPP
Since 2012, prevailing poor hydrology has led to the use of emergency power plants and
extensive use of TANESCO’s own thermal generation plants, which has severely stressed
its cash flow and is threatening its ability to deliver planed investment (and to fulfill its role
as the counterparty to many PPAs). The impact of these events is evaluated through
TANESCO’s audited financial statements from the period 2007 to 2013.
Between 2007 and 2011, although TANESCO’s balance sheet carried about 750 billion
TZS) of accumulated losses, the sum was stable. However, between 2011 and 2013,
accumulated losses increased from 800 to 1,450 billion TZS. During the entire period, the
steady growth in assets of the company (more than 300 billion TZS per year) was

50
accompanied by a proportional growth in equity, showing that the investments are financed
by borrowings and grants with growing shares in the balance sheet (Figure 18). By 2013,
80 per cent of TANESCO’s total assets was financed by liabilities – mostly consisting of
borrowings, grants, and trade payables – which is an increase compared to 40 per cent in
2007. The decrease in the share of equity in TANESCO’s balance sheet has two drivers:
non-proportional growth in equity injection in the form of share capital or retained earnings,
and the devaluation of existing equity by the increase of accumulated losses.
Figure 18: TANESCO balance sheet from 2007 to 2013 (Data source: TANESCO)
Furthermore, TANESCO’s liquidity ratio (current assets/current liabilities) gradually
worsened since 2009: starting from that year, its current assets have never been able to
cover its current liabilities, consisting mostly of trade payables (Figure 19). This indicates
the company’s mounting inability to pay off its creditors and its likelihood of default.
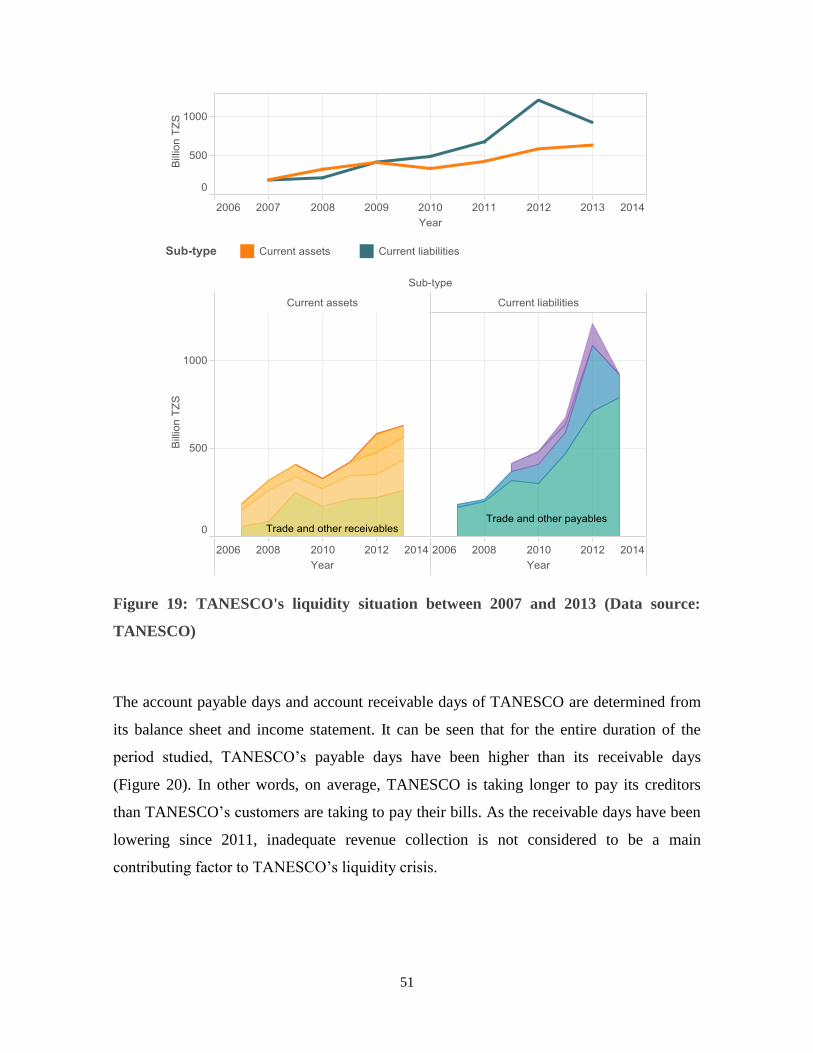
51
Figure 19: TANESCO's liquidity situation between 2007 and 2013 (Data source:
TANESCO)
The account payable days and account receivable days of TANESCO are determined from
its balance sheet and income statement. It can be seen that for the entire duration of the
period studied, TANESCO’s payable days have been higher than its receivable days
(Figure 20). In other words, on average, TANESCO is taking longer to pay its creditors
than TANESCO’s customers are taking to pay their bills. As the receivable days have been
lowering since 2011, inadequate revenue collection is not considered to be a main
contributing factor to TANESCO’s liquidity crisis.

52
Figure 20: Comparison of TANESCO payable and receivable (Data source:
TANESCO)
According to the company’s income statements, for the period 2007 to 2011, TANESCO’s
operating income was roughly in line with its operating expenses (net operating profit/loss
smaller than 60 billion TZS). However, in 2012 and 2013 the net operating loss reported
were 174 billion TZS and 387 billion TZS respectively, significantly above the previous
trend (Figure 21). Comparing the change in individual items in the income statement to
their value in 2007, it can be found that the most significant changes in 2012 and 2013
occurred in operating revenue and cost of sales. In 2013, operating revenue was 642 billion
TZS above the 2007 figure, while the cost of sales was 1,033 billion higher than that of
2007. The cost of sales includes TANESCO’s own generation and transmission, purchased
electricity, distribution expenses, and depreciation. The tariff collected and other operating
incomes such as government contribution were insufficient to cover the cost of sales, not to
mention operating expenses and finance cost. Therefore, the net losses reported for 2012
and 2013 were 178 billion and 468 billion TZS respectively.
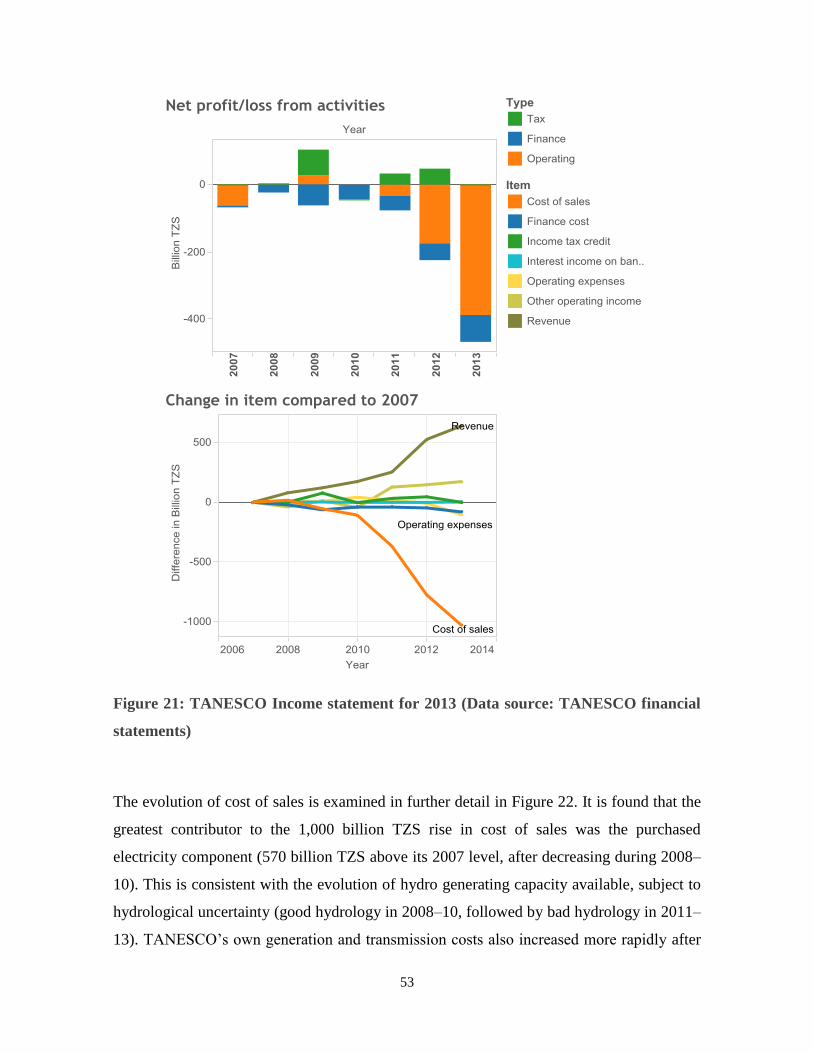
53
Figure 21: TANESCO Income statement for 2013 (Data source: TANESCO financial
statements)
The evolution of cost of sales is examined in further detail in Figure 22. It is found that the
greatest contributor to the 1,000 billion TZS rise in cost of sales was the purchased
electricity component (570 billion TZS above its 2007 level, after decreasing during 2008–
10). This is consistent with the evolution of hydro generating capacity available, subject to
hydrological uncertainty (good hydrology in 2008–10, followed by bad hydrology in 2011–
13). TANESCO’s own generation and transmission costs also increased more rapidly after

54
2011. On the other hand, the increase in revenue collected from different category of
customers has not matched the increase in cost of sales. The extent to which these increases
in costs are prudently incurred, and therefore eligible for cost recovery from the ratepayers,
is the central topic of the section entitled ‘Cost-reflective electricity tariff?’.
Figure 22: Breakdown of TANESCO cost of sales and revenue during 2007 – 2013
(Data source: TANESCO)

55
Between 2009 and 2011, TANESCO was able to sustain its investment cash flow and loan
repayment using cash generated from operating activities and proceeds from borrowings
and grants. However, by 2012, instead of being a source of positive cash flow, operating
activities had turned into a burden which needed to be financed by more grants and
borrowings (Figure 23).
Figure 23: TANESCO net change in cash between 2007 and 2013 (Data source:
TANESCO)
The continuous depreciation of the Tanzanian shilling also had an adverse impact on
financial sustainability of TANESCO and its ability to make reliable payments towards
PPAs (Figure 24). PPAs with IPPs and EPPs are usually denominated in US dollars, while
TANESCO collects power tariff denominated in Tanzanian shillings. Therefore,
depreciation of the shilling results in a funding gap between TANESCO’s payment
obligations and its revenues. For instance, the costs of purchased electricity, when
denominated in USD, increased by 49 per cent from 2010 to 2011. However, the same
increase in costs, when converted to TZS (factor in the depreciation of the local currency in
the same period of 9 per cent) reflects an annual increase of 63 per cent.

56
Figure 24: The value of one Tanzanian shilling in US cent
Despite TANESCO’s deteriorating financial position (accumulating losses in its balance
sheet and decreasing liquidity), it has directed about $1 billion of its cash flow toward
capital work in progress. The investments undertaken by TANESCO in 2013 mainly
focused on the extension of the transmission and distribution network, funded by the
treasury and various development partners such as SIDA, ORET, and JICA. The generation
capacity owned by TANESCO, commissioned in the last ten years or currently under
development (Tegetea, Ubungo I and II, Mwanza, Kinyerezi I and II) has also been
financed by the treasury and development partners. This demonstrates that, despite the wish
of transitioning toward a market-led model to encourage private investments, TANESCO
was still operating under a state-led model in 2013; acting as a state-owned utility making
investment mostly financed by earmarked development and government loans/grants
dedicated to particular projects. Yet, the vision for the power sector is one of financial
sustainability, in which investment is financed by firms’ operating activities and private
sector capital rather than external funds, so that the national budget and development grants
can be made available for other uses. This desired transition in investment dynamics
depends on successfully mobilizing funds from the ratepayers, commercial banks, and

57
domestic and foreign investors. At the same time, this transition should not compromise
service quality, after all, continuous improvement in access and reliability to the provision
of electricity is the ultimate goal that drives restructuring in the sector.
Other vehicles
In the remainder of this section, other types of investment vehicles which enable the
participation of private sector capital in the generation segment are presented. Emphasis is
put on their relationship with TANESCO, the only off-taker of all power generated (except
for SPPs directly distributing to consumers) at the time of writing.
Investment via Independent Power Producers (IPPs)
From 1990, IPPs have been a channel for generation investments from domestic and
foreign investors. In general, initial investments by IPPs are financed by private equity and
commercial debt, but development loans from international financial institutions
(sometimes on-lent through the government) are sometimes available, too. Once the
generation plant is online and operating, the IPP recovers its investment with an added rate
of return via payments received within the PPA lasting on average 15–20 years (Table 4).
Table 4: Sources and sinks of funds for IPPs
From As To/From as To
Commercial
banks
Commercial loans
IPP
Investment
Private equity Share equity Operating costs
Development
partners
Development loans Commercial loan
repayment
Commercial
banks
GoT On-lent loans Dividend Private equity
TANESCO Revenue from PPA
payments
Income tax GoT

58
Since the opening of the generation segment to private investors, Tanzania has only
successfully engaged two IPPs: IPTL and Songas. The development of Songas began in
1993, when the MEM invited 16 companies to bid for the Songo Songo gas-to-electricity
project. It received only two bids, one of which was submitted by OTC, a joint venture
between Ocelot (known today as PAE) and TransCanada Pipelines (Gratwick et al., 2007).
During the project’s formalization in 1994, drought threatened the country’s already tight
power supply, leading to the proposal of the IPTL project, a joint venture between
Mechmar, a Malaysian firm, and VIP Engineering Limited, a Tanzanian firm, directly
submitted to the GoT without tender. Financial closure for both IPPs took more than two
years and required additional security arrangements and/or credit enhancements to be
included in the PPAs.
IPTL, financed entirely with private sector equity and debt, was described as a South-South
collaboration between Tanzania and Malaysia, and an alternative to the North-South donor-
recipient model. The Malaysian company Mechmar, a boiler manufacturer, was already
active in Tanzania, developing generator units for the Tanganyika Wattle Company. The
Tanzanian partner, VIP, had no power sector experience, but it was experienced in
promoting and negotiating for projects. IPTL’s commercial debt from two Malaysian banks
received an informal sovereign guarantee by the Malaysian government. In addition, an
escrow account held by the Bank of Tanzania was created to act as a liquidity facility. It
held between two and four months equivalent of capacity charges negotiated to support
payment obligations of TANESCO, the off-taker. However, in the implementation of the
project, a number of issues emerged and unravelled the relationship between IPTL and
TANESCO, and that between the equity partners and the project’s creditors.
In 1998, TANESCO and IPTL disagreed upon the costs of the project and the
corresponding PPA tariff calculation. The arbitration process employed by the World
Bank’s International Centre for Settlement of Investment Disputes (ICSID) lasted until
2001. The tribunal refused TANESCO’s request to rescind the PPA, but it also adjusted
capacity charges from $3.6 million to $2.6 million per month to reflect the difference
between cost estimates used in the PPA ($163 million) and the actually incurred costs

59
($127 million)19
. Payments were made pursuant to the ICSID ruling, but in January 2007
TANESCO suspended capacity charge payments, claiming to have discovered that the
equity contribution from VIP had been lower than the amount agreed upon in the PPA.
Meanwhile, in 2005, the Standard Chartered Bank Hong Kong (SCB HK) acquired the
IPTL loan from its Malaysian creditor and inherited the right, title, and interests of IPTL’s
contracts, including the PPA. From October 2006 onwards, IPTL did not service its debt,
and the SCB HK, vested with IPTL’s contractual rights, requested TANESCO to pay it
outstanding payments of $259 million. This dispute led to another long arbitration by
ICSID between 2011 and 2014. An escrow account was established after TANESCO
stopped paying IPTL’s capacity charges to collect the amount not disbursed. If TANESCO
won the case, it would be refunded the unnecessary payments already paid, but if it lost,
then the monies banked at the escrow account would go to IPTL. During the second
arbitration, IPTL experienced turnover in its ownership: Pan African Power (PAP) bought
the shares from Mechmar (via Piper Link) and VIP under contested circumstances, and
took possession of the escrow account (The Citizen Investigative Team, 2014). The
disposition of the $270 million balance deposited in the escrow account was a source of a
scandal that polarized the country, prompting international donors to withhold nearly $500
million in general budget support to the country (Kabendera & Anderson, 2014).
Furthermore, although no longer a shareholder of IPTL, VIP sued SCB HK, Mechmar, and
Wartsilar (manufacturer of the diesel engines) in 2015 for allegedly impeding conversion of
the plant from oil to gas firing since 2005 (Sunday News Reporter, 2015).
Songas, a much less controversial project, required the use of an escrow account for its
equity contribution to mitigate the risk of expropriation. It also required a liquidity facility
that held the equivalent of four months of capacity charges to mitigate non-payment of PPA
charges. In order to incentivize the use of equity by Songas prior to financial closure for
debt fund, the MEM offered a nominal interest rate of 22 per cent on all equity disbursed
during construction. This Allowance for Funds Used during Construction (AFUDC) was
compounded annually until the project started to generate revenue (projected for 1999).
During the first ICSID arbitration for IPTL, Songas was put on hold, yet the AFUDC for
19
A portion of the costs incurred has not been deemed to have been prudently incurred by the tribunal,
therefore it was disallowed as the basis of tariff calculation.

60
equity investment made between 1996–97 continued to be compounded until 2001. The
buy-down of the AFUDC in 2003 resulted in $103 million of additional cost born by the
GoT (50 per cent), the escrow facility (40 per cent), and TANESCO (10 per cent).
Commercial loans were not available, therefore the debt financing for Songas followed an
atypical model, with the GoT on-lending a World Bank International Development
Association (IDA) credit together with a loan from the European Investment Bank (EIB).
On the other hand, the two most important project partners, Ocelot and TransCanada, both
arranged for the sale of its shares to AES, an American power generation and distribution
company, on the grounds of strategic consolidation of assets, in 1999 and 2001,
respectively. Later, during the global downturn in private power sector investment,
following the Asian and Latin American financial crises and the Enron scandal, AES
disposed of Songas and other assets while its stock price plummeted. The AES shares in
Songas were then picked up by Globeleq (a spin-off of CDC) and the Dutch Development
Company (FMO). Of the four original minor partners from development backgrounds
(Tanzania Development Finance Company Limited [TDFL], International Finance
Corporation [IFC], German Investment & Development Company [DEG], and
Commonwealth Development Corporation [CDC]), IFC, and DEG pulled out of Songas
after the IPTL dispute became known.
Songas experienced delays in the delivery of gas from Songo Songo, reportedly due to the
failure of a sub-contractor to deliver the gas infrastructure on time. Subsequent periods of
non-availability occurred to accommodate expansion (originally planned, but postponed
due to fast tracking of IPTL) and turbine failure. The penalties that Songas paid for non-
availability of capacity as contracted did not match the additional costs incurred by
TANESCO, due to the unfavourable hydrology necessitating the use of expensive fuel for
generation. As part of the subsidiary loan agreement, signed between Songas and GoT for
the on-lending of World Bank funds, if TANESCO fails to pay Songas the amount
equivalent to the principal and interest, Songas is relieved of debt repayment for up to that
amount. TANESCO had exercised this ‘grace period’ and did not pay full capacity charge
to Songas between mid-2005 and mid-2006. In late 2015, Songas threatened to shut-down
operations if TANESCO did not arrange to pay off arrears of $100 million, claiming
TANESCO payments had been erratic since early 2012 (Daily News Reporters, 2015).

61
Overall, IPPs did channel new sources of funds to investment in generation capacity in
Tanzania’s power sectors ($393 million in total, or $187 million without the concessionary
loan), but unexpected costs from these first experiences with PPAs, especially the disputes
with IPTL, were high and tainted them negatively, generating controversial press coverage
at home and abroad. Moreover, TANESCO’s low liquidity threatens the operations of IPPs
and negatively impact their willingness to invest. Given that the PPAs of both IPPs were
negotiated before EWURA was established, and that future PPAs contracted are to be
reviewed by the regulator, the performance of future IPPs is expected to improve, if the
procurement process is completed as specified by EWURA.
The motivation that drove IPTL to invest in Tanzania’s power sector is deeply entangled in
multiple debates and hard to ascertain. On one hand, IPTL did channel commercial loans
into generation investment which would not have been possible otherwise. On the other
hand, the indirect costs of the IPTL case, in terms of negative public opinion and
international reputation, is damaging to Tanzania’s attractiveness as a country for
investment. Development partners’ grants were also frozen due to concerns with local
governance and transparency issues. The delayed conversion of turbines to run on natural
gas is arguably another impact of the extended disputes between TANESCO, IPTL
shareholders and IPTL’s creditors. Its opportunity cost is high, given the important
difference between the prices of these fuels. The two disputes between TANESCO and
IPTL, regarding construction costs used to calculate PPA payments and IPTL partner’s
actual equity contribution, both have roots in the PPA’s lack of a comprehensive outline of
how such conflicts will be resolved. This points out the importance of due diligence before
and after signing a PPA, assessing the project partner and monitoring project finance in a
reliable way, and the importance of the PPA itself in attributing rewards and risks.
As for Songas, it is a government-initiated, development-oriented initiative that was passed
on from commercial firms to development financial institutions as the project prospective
evolved, and it was in large part financed by a concessionary development loan. It was
inadvertently affected by the fast-tracking of IPTL: the unexpected AFUDC buy-out and
the postponement of originally planned capacity both incurred higher costs for TANESCO.
This suggests that TANESCO, as the sole off-taker of all IPPs on behalf of all power
consumers, should coordinate the contracting of the IPPs to minimize unintended impacts
62
of one deal on another, through identification of risks that could propagate and their
containment within individual PPAs (such as conditional compounding of AFUDC and
penalty for project delays that is tied to actual costs incurred).
Investment via Emergency Power Producers
In terms of sources of funds channelled, EPPs are similar to IPPs. EPPs differ from other
vehicles of investment, however, because the generation assets that they finance are not
location specific. Emergency power, also known as temporary power, is typically provided
via modular generation units mounted in shipping containers that can be relocated and
assembled in a few weeks. Therefore, EPPs are willing to engage in shorter PPAs compared
to IPPs, at relative higher charges, after which the private operator removes the power plant.
The mobility of the investment involved thus makes EPPs less risk-averse than
conventional power generator investors. Such specialized firms target emerging market
countries with supply-demand shortfall (Aggreko, 2015a).
Since 2006, TANESCO has contracted emergency power from a number of multinational
companies –Aggreko, APR Energy, and Symbion – as the government decided that the
costs of procuring temporary emergency generation projects, about $0.30–0.40 per kWh
generated, were lower than that of load-shedding, estimated to be $1.1/kWh (Luhwago,
2011). While depending on EPPs in the short term, the government perceives EPPs as
expensive service providers which should no longer be used when their contracts expire, if
the needed capacity to ensure power supply has been procured through more permanent
investment vehicles (MEM, 2014). The contracts that TANESCO signed with Aggreko and
APR Energy in 2006 terminated by the end of 2008 (Kapika & Eberhard, 2013). Aggreko
was later contracted to operate two 50 MW gas generator units between 2011 and 2013.
Currently, 70 MW from Aggreko is contracted, and the contract is subject to renewal every
three months.
TANESCO’s dealings with Richmond Development Corporation and its successor lasted
from 2006 to 2013, and they have been mired in controversy and legal disputes as in the
IPTL case. The procurement of the Richmond/Dowans unit in 2006 took place under
allegedly suspect circumstances that led to the November 2007 formation of a select
investigative committee by the parliament. The investigation revealed that Richmond was a
63
company without power generation experience. The tabling and debating of the committee
report led to the resignation of the then prime minister and two cabinet members,
subsequently leading to the dissolution of the entire cabinet (BBC News, 2008). The
controversy was accompanied by the revoking of the power generation contract awarded to
Richmond in February 2008. However, when Richmond was unable to deliver working
generators within the agreed period specified in the contract in late 2006, it assigned
Dowans Holdings to undertake the responsibility of supplying electricity to TANESCO,
associated with its two-year contract with a daily capacity charge of $150,000. Dowans
supplied electricity between 2007 and 2008, and it took TANESCO to the International
Chamber of Commerce (ICC) for the termination of the contract and won. In 2013,
Tanzania’s Court of Appel upheld the ICC decision and ordered TANESCO to pay $77.5
million to Dowans for breach of contract (Mwamunyange, 2013a). The Richmond/Dowans
120 MW temporary gas-fired generators were acquired by Symbion in 2011 and have been
since under Symbion’s operation.
Again, as with Tanzania’s experience with IPPs, the outcome of involvement of EPPs is
mixed. EPPs do provide the much desired power generation capacity at relatively short
notice, and they have PPAs which are relatively more flexible than those of IPPs, lasting
15–20 years, being signed for shorter terms, albeit at higher charges and in smaller
quantities. Nevertheless, the lack of due diligence and non-compliance with formal
procurement procedures could have extremely high political and financial costs that
undermine the usefulness of EPP arrangements. In addition, the distribution of high EPP
purchase costs between the government, ratepayers (which can be further disaggregated
into different categories), and TANESCO is a major point for contention in the tariff setting
process.
Investment via Small Power Producers
In contrast with Tanzania’s experience with IPPs and EPPs, mainly taking place before the
establishment of the independent regulator in 2006, the development of the SPP investment
regulatory framework is driven by EWURA, whose work has been cited as an example for
other countries developing SPP projects (Tenenbaum, Greacen, Siyambalapitiya, &

64
Knuckles, 2014). A framework consisting of standardized PPA, tariff methodology, process
guidelines with standardized forms, process rules, and interconnection guidelines have been
developed. The regulatory framework was developed consciously to streamline the process
of developing SPPs by removing the need for negotiation and regulatory review of tariff, to
reduce transaction and administrative costs. Under the EWURA regulations, an SPP is
defined as a power plant that uses a renewable energy source with an export capacity of
between 100 kW and 10 MW (Mtepa, 2014). Due to their proximity to electricity
consumers, and sometimes their position as the sole electricity source in a particular
community, SPPs in Tanzania can bypass the monopoly of TANESCO in transmission and
distribution and sell power directly to end-users. Based on the connectedness of the SPP
and their off-taker, four main types of SPPs can be differentiated (Table 5). For cases 1 and
2, the tariff is based on the avoided costs for TANESCO in the main grid or the isolated
mini-grid. For cases 3 and 4, the developer must submit an application to EWURA for a
cost-based tariff. SPPs connected to isolated mini-grids can convert to main-grid based
PPAs upon interconnection with the national grid.
Table 5: Four basic types of SPPs (Kahyoza & Greacen, 2011)
Location of SPP
Off-taker of generation Connected to main grid Connected to isolated mini-grid
TANESCO Case 1 Case 2
End-users Case 3 Case 4
Up to the time of writing, SPPs in operation have channelled investments from domestic
industry (Tanganyika Planting Company, Tanganyika Wattle Company), development
partners and the government (ACRA-CCS, African, Caribbean and Pacific – EU Energy
Facility, REA), and private investors, with a total of 15 MW net installed capacity.
Potential SPPs that are in the works, if all realized, have a total capacity of 150 MW. Of the
operational SPPs, most of the commercially driven initiatives have access to indigenous
fuel sources (bagasse, wood chips, or coconut wood) which lead to important cost
advantages for power generation. Other development-oriented initiatives, backed by
development organizations, are rooted in community development which actively enhance

65
the productive use of electricity, which include not only generation but also local
distribution (Ahlborg & Sjöstedt, 2015).
Despite Tanzania’s world-class reputation in its practice of SPP regulation, the investment
for generation capacity brought online via the SPP mechanism is low compared to other
vehicles. Projects in the pipeline, if all realized and replenished at the current rate, could
bring relief to demand unserved by other types of generation capacity, especially those in
isolated areas expensive to be connected to the national grid. But, they need to overcome
several challenges (Mtepa, 2014). Domestic private investors interested in SPPs face
difficulties in securing long-term financing, because they are unable to provide the equity
requirement of local banks (30 per cent of total investment). Business risks for SPPs are
heightened in the isolated areas, given the uncertainty around grid expansion: the tariffs that
they could charge and the number of customers that they could serve change once the
isolated grid is connected to the main grid. SPP tariffs, when based on the cost avoided by
TANESCO, are not sufficiently attractive for more expensive renewable technology such as
wind and solar; thus, development interest has been mainly focused on waste biomass and
hydro, a subset of allowed technologies. Also, as for IPPs, when power is sold to
TANESCO, delay or non-payment is a possibility for SPPs given the utility’s low liquidity.
Investment via Public-Private Partnerships
In recent years a new investment vehicle, PPPs – partnerships of government and one or
more private sector companies – have been promoted by the MEM in its roadmap for the
electricity sector (MEM, 2014). Traditionally, PPPs refer to long-term contracts between a
public-sector party and private-sector party for the design, construction, financing, and
operation of public infrastructure by the private-sector party, with payments over the life of
the contract made directly by the public sector or users of the facility, and with the facility
remaining or reverting to public-sector ownership at the end of the contract (Yescombe,
2007). However, according to interviews with the President’s Delivery Bureau, PPPs in
Tanzania’s power sector mainly refer to joint ventures between the government (via
TANESCO) and private companies in generation. PPP projects are now sourced in two
ways: open bidding through the PPP units in the Ministry of Finance, and direct negotiation

66
with ready investors (closed tender) (NKRA Energy, 2015). At the time of writing, there
are four planned PPP projects, totalling 1,300 MW of generation capacity (Kinyerezi III
and IV, Mtwara, and Geo Wind), or 2,280 MW, if all phases of these generation projects
are realized. It is the most ambitious of any investment vehicle to date, but because none of
the planned PPPs have started construction, details about the nature of the long-term
contract between TANESCO, the public-sector actor, and its private partners are not
available.
Kinyerezi III, IV, and Geo Wind are all financed by Chinese institutions such as the
Export-Import Bank of China, Poly Technologies20
, and China Power Investment
Corporation. Mtwara, a potential PPP with Symbion, is still in the stage of feasibility
studies and has not reached financial close. The dominance of Chinese finance in new
large-scale power generation projects in Tanzania is not coincidental, it is part of increasing
Chinese engagement concerned with natural resources extraction, infrastructure
development, and manufacturing all over Africa. It is estimated by the chief country risk
analyst of the Export-Import Bank of China (Exim Bank) that China will have provided the
whole continent with $1 trillion in direct investment, soft loans, and commercial loans by
2025 (Shih, 2013).
The Chinese approach, unlike traditional development assistance, actively mixes
development finance and aid in order to maximize feasibility and flexibility of Chinese
project to circumstances in the recipient country (Sun, 2014). In return, China’s aid/finance
is usually tied to Chinese companies and its loans are backed by natural resources from the
recipient country. In practice, the disbursement of tranches of Exim Bank funding could be
tied to Chinese company’s acquisition of stake in local resources. A RAND Corporation
paper has found that Chinese engagement in Africa has contributed to the development of
critically needed infrastructure and economic growth, especially in areas where other
investors (international financial institutions, other government and foreign investors) have
been unwilling to engage, under terms that other investors are reluctant to provide (Hanauer
& Morris, 2014). However, Chinese engagement has also reinforced many countries’
20
Poly Technologies is a subsidiary of China Poly Group, a central government-administered state enterprise
originally founded by the People’s Liberation Army, later transferred to the State-owned Assets Supervision
and Administration Commission.

67
dependence on raw materials and unskilled labour and contributed to high levels of debt,
economically nonviable decisions, and official corruption.
In comparison, after directly providing grants for large hydroelectric projects in the late 20th
century, development assistance from OECD countries is now focused on promoting local
ownership and leadership to achieve national development, good governance, transparency,
accountability, and capacity building. For example, Millennium Challenge Corporation
(MCC), an independent US foreign aid agency, is in the process of negotiating a $472
million compact with Tanzania which ties distribution network grant disbursement to the
GoT’s progress in reforming its electricity sector. The new compact also contains grants
directly allocated to the unbundling process itself, incentivizing process change rather than
unconditionally financing infrastructure projects (MCC, personal communication, 2016).
The generation capacity, financed by China, is expected to contribute positively to the
electricity supply-demand gap in Tanzania once commissioned. Nevertheless, previous
experiences with IPPs and EPPs have shown complex investment vehicles such as PPPs are
vulnerable to corrupt procurement and negotiation processes. Development partners’ push
for capacity building could encourage the development of transparent procedures for the
sourcing and negotiation of PPP projects. However, Gray, in her study of political economy
of grand corruption in Tanzania, points out that the underlying distribution of power in
Tanzania (not always aligned with the formal structure of institution) is what drives
corruption related to off-budget expenditures of the state (TANESCO-led investment and
PPAs involving TANESCO included) and what prevents curbing of such corruption cases
(Gray, 2015). Therefore, ultimately, the likelihood of curbing corruption in Tanzania’s
power sector investments, so that they contribute positively to the country’s socio-
economic transformation, is dependent on the distribution of economic and political power
in the country, stable but not immune from emerging social forces.
Outlook for investment in the gas sector
As previously established, the availability of natural gas as a generation fuel for all planned
gas-fired power plants will require expansion of gas production capacity in the near and
long term. This section discusses the outlook for investment in the Tanzanian gas sector.

68
The national oil company, Tanzania Petroleum Development Corporation (TPDC), does not
invest significantly in exploration or development of oil and gas resources independently.
From 2010 to 2012, the annual cash flow directed toward capital work in progress is less
than $1 million per year. In 2013, however, financed by a $1.2 billion long-term loan
obtained from the Export-Import Bank of China, TPDC invested in the Mtwara-Dar es
Salaam gas pipeline, which was commissioned in 2015. The pipeline relieves the country’s
need for gas transmission capacity in the medium term.
All other entities wishing to invest in the Tanzanian gas production capacity must do so via
a PSA signed with GoT and TPDC. Under the tripartite PSA, the state (as the owner of oil
and gas resources) licences the exploration and development of resources in a particular
area by TPDC, which engages the third-party company as a contractor to provide technical
services and financing for petroleum operations. The distribution of rewards and risks
among the partners (represented in the PSA) and external factors – such as the geological
features of the area, the general investment climate, and the domestic and global market
context – are thought to influence private (and mostly foreign) investment in the sector
(Pedersen & Bofin, 2015).
In the near term, the necessary expansion of near-shore gas production, estimated to be
180–300 MMcf/day, can only be undertaken by the current operators engaged in PSAs.
PAE, the operator of Songo Songo, has announced plans to increase gas production there
from 92 MMcf/day to 190 MMcf/day. It hopes to finance the $160 million expansion
spending through a loan from the IFC. In 2015, a $60 million loan was granted by the IFC
for the first phase of Songo Songo production capacity expansion. The company expressed
that subsequent investment will be conditional upon:
(i) the agreement on commercial terms with TPDC, the expected gas aggregator, or
other buyers regarding the sale of incremental gas volumes;
(ii) TANESCO receivables being brought up to date, through guarantees or other
arrangements to payment satisfactory to the company21
;
(iii) the establishment of payment guarantees with multi-lateral lending agencies to
secure future receipts under any contracts with government entities; and
21
As of the end of 2014, TANESCO owned PAE $64.6 million, of which $52.2 million were in arrears.

69
(iv) future arrangements of finance (Orca Exploration Group Inc., 2015).
The management of Orca, PAE’s parent company, has also expressed concerns over the
potential negative effect on its rights under the PSA as a result of the new National Natural
Gas Policy. As for the operators of Mnazi Bay, Wentworth Resources and Maurel & Prom,
their gas resources were effectively stranded prior to the commissioning of the Mtwara–Dar
es Salaam pipeline. The partners only signed their first Gas Sales Agreement with TPDC in
September 2014, which is for up to 130 MMcf/day of gas delivery for 17 years. Therefore,
the near-term plan is only to expand current capacity of 80 MMcf/day to 130 MMcf/day.
In the long term, the sustainability of gas-fired generation in Tanzania requires the
development of off-shore natural gas resources, which is dependent on the involvement of
IOCs, given the success of any project requires their technical expertise and financial
backing. The participation of IOCS, in turn, depends on the investment prospects for the
LNG export facility. The potential investors in question (BG, Statoil, ExxonMobil, and
Ophir), have not yet made a final investment decision. Because the export of LNG is
intended to supply the global LNG market, investment decisions of the IOCs will depend
not only on Tanzania’s domestic context (attractiveness of PSAs, general investment
climate, geological conditions etc.), but also on developments in the international gas
market (supply from other sources, demand, and the resulting price).
Considering the above, securing the investment needed to guarantee natural gas supply
needed in the near term by the planned gas-fired generation will require TANESCO to
improve its financial position and payment records for its existing gas supply contracts.
Such incremental gas supply also requires successful contracting between TPDC and the
gas field operators, as well as between the PSA partners and the power generators
(TANESCO and future IPPs/PPPs. In the long term, off-shore natural gas investment is
subject to international market uncertainty and not within the control of Tanzanian agents;
therefore, long-term power planning needs to take this uncertainty into consideration and be
prepared to further diversify generation fuel.
70
Cost-reflective electricity tariff?
Reflecting upon the recent history of Tanzania’s electricity sector, hydrological uncertainty,
an important external factor, continues to upset the precarious balance in the power sector.
In the immediate term, droughts trigger the governmental decision to procure relatively
expensive EPPs (which have TANESCO as their contractual off-taker) and the use of more
expensive thermal generation plants by TANESCO. Given TANESCO sells electricity at
regulated tariff levels, which are not freely adjusted by the utility in the short term to reflect
its sudden increase in costs, it has to carry such additional costs on its balance sheet unless
it receives revenue grants from the government, passes them on to ratepayers through an
increased tariff, or captures more profit from existing tariff levels by reducing its spending
forward.
The historical distribution of costs and revenue is illustrated in Figure 25. Between 2007
and 2010, revenue collected through tariffs was enough to cover TANESCO’s cost of sales,
while its other expenses (operating expenses and finance cost) were covered through other
operating incomes (mainly in the form of government contribution). Starting in 2011, the
revenue collected through tariffs, despite increases, no longer covers its cost of sales.
Governmental contributions, also despite increases, do not make up the gap between the
collected tariffs and TANESCO’s full costs. Therefore, all three parties (the ratepayers, the
government, and TANESCO) have borne some of the cost increases since 2011.

71
Figure 25: Evolution of TANESCO revenue and revenue requirement (Data source:
TANESCO)
Under the current regulatory regime, it is the duty of EWURA to scrutinize all expenses
incurred by TANESCO, safeguarding the interests of ratepayers, deciding which costs are
to be recovered via the regulated tariff and governmental contribution, and which costs are
to be borne by TANESCO through cost savings. In this section, the governing principles
for electricity tariff setting and common approaches in practice are introduced, followed by
a description of the tariff setting methodology used by EWURA during its most recent tariff
review in 2013. The Tanzanian approach is then evaluated against the rate design principles
that it upholds in local legislation.
Principles of electricity tariff design
The setting of electricity tariffs by the regulator is necessary for the network segments in
countries with liberalized power sectors and for all segments in countries with vertically
integrated utilities. Tariff schedules need to answer to several governing principles

72
whenever possible. Laws, directives, and regulations of countries commonly cite the
following fundamental principles (Table 6).
Table 6: Ratemaking principles for the power sector (Summarized from Reneses,
Rodríguez, & Pérez-Arriaga, 2013)
Principle Objective
Economic
sustainability
A sustainable tariff must enable a regulated company to finance its
businesses and new investment required for future operations.
Economic
efficiency
An efficient tariff is a price signal that incentivizes consumers to use the
amount of resources that are efficient for the system as a whole.
Equity An equitable tariff does not discriminate against one (group of) customer(s)
unduly in service provision and cost allocation.
Transparency A transparent tariff has procedures and results that are published in clear and
understandable terms.
Additivity The total sum collected from end-users by an additive tariff for a particular
segment should be equal to the total allowed revenues to be collected for that
segment.
Simplicity A simple tariff is easy to understand and accept.
Stability A stable tariff has calculation methodology that is consistent over time.
Consistency A consistent tariff is coherent with the industry structure and regulatory
framework in place in the country at any given time.
Among these ratemaking principles, equity, also referred to as ‘the fairness principle’, is
one that has the most ambiguous definition and is interpreted differently in different
countries. In some instances, it is operationalized as subsidizing electricity for low-income
consumers in order to promote universal access. It can also be understood to mean that
power consumption should be charged according to the burdens they impose on the system
(beneficiaries pay). It is impossible to fully meet all the above principles simultaneously.
Though this is sometimes due to the lack of know-how, it is more often due to inherent
conflicts among the principles listed. Tariff setting methodology, which promotes the
principle of economic efficiency, may clash with the principles of sufficiency, equity, or
simplicity. This is demonstrated in the survey of common tariff setting methodology
presented below. Therefore, it should be kept in mind that the choice of any tariff setting

73
methodology requires the decision makers to make an informed compromise, reaching a
balance among all the principles discussed.
Any methodology for determining electricity tariffs can be divided into two steps, to which
the different principles apply to differing extents:
1. Calculation of allowed revenues to be recovered;
2. Definition of a tariff structure and allocation of allowed costs to the tariff structure.
For example, the determination of the allowable volume of regulated revenues mainly
needs to be weighed between economic sufficiency (ensuring the company’s medium and
long-term viability) and economic efficiency (ensuring that resources have been allocated
efficiently in the company’s operations). On the other hand, the design of the tariff structure
and the allocation of allowed revenues using this structure need to balance equity,
efficiency (providing the end-users with price signals that motivate efficient use of
electricity), and sufficiency (ensuring that receipts from tariffs concur with the volume of
allowed revenues).
Revenue determination
There are two common ways for regulators to determine what revenue recovery should be
allowed through the electricity tariff: the traditional method known as cost-of-service or
rate-of-return regulation; and an extension of the first, the incentive-based regulation. The
two differ mainly in the frequency that tariff reviews are conducted and how tariffs are set
for intervening years between reviews.
Cost-of-service regulation
In cost-of-service regulation, the allowed regulated revenues are traditionally determined
by identifying the total costs of the company based on submitted accounting information
for the previous regulatory period. The following accounting formula is typically used
(Reneses et al., 2013). At each tariff review, the regulator reviews all items included in the
equation to arrive at the revised volume of allowed revenues.
allowed tot OM addR C C D s RB T R (1.1)

74
allowed
tot
OM
R : allowed revenues
C : total cost of service
C : allowed operating and maintenance costs
D: depreciation expenses
s: allowed rate of return
RB: rate base, gross assets less depreciation
T: taxes
R add : additional revenue
The operating and maintenance costs include the cost of fuel, material and replacement
parts, energy purchases, supervision, personnel, and overhead. The allowed operating and
maintenance costs might not be the totality of incurred costs, since not all of them are
necessarily considered prudently incurred. In practice, the determination of allowed costs
may involve the use of detailed analyses of each cost item and engineering or econometric
models that allow benchmarking of utility companies against each other. The allowed rate
of return is commonly calculated as the weighted average cost of capital (WACC). The rate
base, a measure of the value of the company’s investment, is its net fixed assets (fixed
assets less the cumulative depreciation), plus current assets (fuel and other inventories,
research and development expenses, and current asset requirements). From year to year, it
is increased by capital investment and decreased by depreciation. Due to information
asymmetry, the actual rate of return resulting from the allowed revenues might be above or
below the true cost of capital, leading to overinvestment (if the rate of return is higher than
true WACC) or underinvestment (if the rate of return is lower than true WACC).
The valuation of the rate base is critical, especially when it is established for the first time
for existing assets. There are several popular valuation methods: book value, reproduction
value, replacement cost, and market value. Not all valuation methods are always available.
For instance, in the case that no reliable accounting data is available (book value is not
reliable) and the regulated company is not publicly traded (hence no market value is
available), only the reproduction value, an estimate of the current cost of a replica of the
assets, and the replacement cost, the cost of replacing current assets with new assets, can be
used.

75
Two issues are the hardest for the utility and the regulator to agree on while reviewing the
cost-of-service: the allowed rate of return to the rate base, and the investments to be
included in the rate base. For the rate of return, a regulator has discretion in the rate of
return awarded to the equity portion of the capital invested, since the cost of debt is known.
For the rate base, a regulator needs to decide whether to include works in progress in the
rate base, ignoring delay between investment and commissioning to reward capital during
construction, and what valuation methods to use to determine the rate base.
In terms of the equation below, including works in progress in the rate base is equivalent to
setting the delay d to zero, directly adding all investment to the rate base, regardless of
construction time. Not including them is the equivalent of setting d to the construction time
required, therefore investments are only added to the rate base once construction has ended.
0
1
t t d
t t t
d
RB RB D I
(1.2)
t
0
RB : rate base for the year t
RB : initial rate base
D: depreciation
I: investment
d: delay for investment to be added to the rate base
Incentive-based regulation
The determination of costs can be based directly on actual expenditure for the past
accounting period (ex post), or be based on forecast of expenditure informed by historical
information (ex ante). It is possible to affect the incentives of the regulated company
through the choice of sources of cost information.
(1 )allowed ex ante ex postR b C bC (1.3)
allowed
ex-ante
ex-post
R : allowed revenues
b: coefficient, 0 < b < 1
C : estimated costs or costs allowed under incentive regulation
C : incurred costs

76
When the value of the coefficient b approaches 1, the company is allowed to recover all the
costs incurred and has low incentive to operate efficiently, since savings will not result in
additional revenues. This is the case of cost-of-service regulation with annual or frequent
reviews. When the value of the coefficient b approaches 0, the company is incentivized to
cut costs in order to maximize profits, by harvesting the difference between the ex ante
allowed revenues and actual costs, the most extreme case being a tariff freeze. By
increasing the period between price reviews, cost-of-service regulation achieves a lower b
coefficient, because the ex post assessment of allowed cost is maintained so that it becomes
an ex ante assessment for the years further away from the tariff review.
Compared to traditional cost-of-service regulation, incentive-based regulation allows a
company to receive more revenue during a regulatory period, but passes on the savings
achieved by the companies to customers in the following regulatory period through the
tariff review. If the tariff is frozen (an extreme form of incentive-based regulation) and
adjustment toward ex post does not occur, then the total revenues received by the company
may be excessively high, so customers are overcharged, or excessively low, so the
sustainability of the company is threatened. Therefore, an intermediate value for the
coefficient b is preferable. In practice, the period between tariff reviews is typically four to
five years, and the process for the tariff review is similar to the process described for the
cost-of-service regulation.
Two basic schemes for incentive-based regulation exist: price cap and revenue cap. When
tariff reviews are far apart, it is important to take into consideration the effect of inflation
and events beyond the control of the utility, such as fuel price increases, and incorporate
them into the price or revenue cap. A productivity factor is also used to account for
increases in productivity (hence an annual decrease in price/revenue). In the first case, the
price that the company can charge for each service throughout the regulatory is set by the
following formula:
, , 1 1m t m t tP P RPI X Z (1.4)

77
m,t
t
P : maximum price for service m in year t
RPI : the annual price variation per unit (retail price index or inflation rate) in year t
X: productivity factor per unit
Z: adjustment owing to unforseen events
The common formula that specifies the revenue cap during the regulatory period looks
similar:
, , 1 1allowed t allowed t tR R RPI X Z (1.5)
allowed,t-1
t
R : allowed revenues in the previous year
RPI : annual price variation (retail price index or inflation rate) in year t
X: the productivity factor per unit
Z: any adjustment owing to unforseen events beyond the control of the utility
In order to avoid deterioration in the quality of service provided due to aggressive cost
cutting, it is necessary to set service quality standards for the regulated company, which
include measures such as the number and severity of power supply outages, the number of
end-users connected to the power grid (in the case that electrification rate is low), and the
level of consumer satisfaction.
Tariff structure and allocation
Once the volume of allowed revenues is determined, it is still necessary to perform the
second step of the rate-setting methodology: to decide on the structure that the tariff should
adopt (once decided, this is seldom changed upon tariff review) and the costs to be
allocated to each element in the structure. The regulator may choose to allow the company
flexibility to design its end consumer tariffs based on its allowed revenues or to design the
end-user tariff itself to prevent cost shifting among consumer classes.
The structure of the tariff is supposed to be a simplified representation of the cost structure
for providing electricity. The exact costs of providing for each individual consumer at each
moment in time are all different, but in practice tariff structure typically differentiates end-
users in limited ways due to metering/billing limitations, and the necessity to remain

78
comprehensible to the consumers. Possible categorization of end-users can be done by the
voltage level of the connection, by geographic area, by season, by blocks of hours, or by
sector. For each category of end-users, the tariff can contain an element based on the
maximum capacity contracted/installed (per kW), an element based on the energy
consumed (per kWh), and a fixed charge (per connection). This is because capacity
requirement, energy consumption, and number of customers are the three key cost drivers.
The two dominant approaches in allocating costs to an accepted tariff structure are the
accounting approach and the marginal cost approach.
The accounting approach requires the breakdown of total allowed revenues into different
functional segments, followed by further breakdown into several cost components: costs
associated with demand (installed capacity), costs associated with the amount of energy
produced, and costs associated with the number of users – matching the three components
of the aforementioned tariff structure. Finally, the costs itemized by function and
component are allocated among end-users of all categories, and the costs allocated to each
category is averaged over all users of the same category (Parmesano, Rankin, Nieto, &
Irastorza, 2004). Given that the cost allocated to different categories is averaged over the
demand, energy consumption, and number of end-users belonging to the same category, the
accounting approach is also known as the average cost approach.

79
Total revenue requirement
Generation
Transmission
Distribution
Retail
Energy costs
Capacity cost
Capacity costs
Consumer cost
Total energy demand
Peak transmission
capacity
Peak distribution
capacity
Number of customers
Energy charge
Energy charge
Energy charge
Energy charge
Capacity charge
Capacity charge
Capacity charge
Capacity charge
Service charge
Service charge
Service charge
Service charge
Determine revenue requirement disaggregated by segment
Allocate to each class based on contribution to
cost driver
Average cost within class
Figure 26: The accounting approach for cost allocation
The marginal cost-based approach, unlike the accounting approach, does not directly
allocate the allowed revenues to be recovered over the tariff structure. Instead, it allocates
the Long-Run Marginal Cost (LRMC) – the economic value of future resources required to
meet incremental changes in consumption of electricity over the next 5–10 years – for each
category of customers. For example, if the use of more expensive generation is required
with an incremental increase in electricity demand, then the LRMC is higher than the
current cost. Similarly, if the use of a less expensive generation technology is needed with
an incremental increase in electricity (typically due to economies of scale), then the LRMC
is a value that is lower than the current cost. Detailed procedures for the calculation of
capacity, energy, and consumer components of LRMC for the generation, transmission, and
distribution segments can be found in Munasinghe’s discussion of modern electricity
pricing ( Munasinghe, 1981). After that, the revenue that can be collected with tariffs set

80
equivalent to LRMC values is estimated and compared to the total revenue that is required
to cover all current expenses. Typically, the two revenues are not equivalent and revenue
reconciliation is required. If the revenue collected based on LRMC is more than the total
current expenses of the utility, the surplus could be taxed away or used on subsidizing non-
energy related charges such as connection fees. Conversely, when the revenue collected
based on LRMC is lower the total current expenses of the utility, then the deficit could be
made up by higher connection fees, service fees, or even government subsidies.
Figure 27: The marginal cost approach for cost allocation
These two methods each have their advantages and disadvantages. The direct allocation of
allowable costs in the accounting approach, which averages costs components over
different consumer categories, provides end-users with cost signals largely based on
Total revenue requirement
Generation
Transmission
Distribution
Retail
Energy LRMC
Energy LRMC
Energy LRMC
Energy LRMC
Capacity LRMC
Capacity LRMC
Capacity LRMC
Capacity LRMC
Total collection expected
based on pure LRMC
Revenue reconciliation
Service charge / Connection charge
Tax/Subsidy
Determination of average cost of serving all clients
Determination of LRMC of serving each customer class

81
historical costs. This signal implies that the future costs of providing electricity will be as
cheap or as expensive as in the past, potentially leading to over-consumption or under-
consumption of electricity, infringing the principle of economic efficiency. However, this
approach is relatively simple to understand and to use, and the regulated company can be
sure that all allowable regulated revenues are recovered. On the other hand, if prices were
set equal to the strict LRMC, then customers would be informed of the marginal cost of
their electricity consumption and thus make their decisions correspondingly: lowering their
consumption if the LRMC is high and increasing it if the LRMC is low. However, the tariff
revenue collected based on LRMC is likely to be different from the actual costs the utility
incurred in providing electricity: a surplus is collected when the LRMC is higher than the
current average cost, such as in the case that incremental consumption will require the use
of more expensive generation unit, and a deficit is experienced when the LRMC is lower
than the current average cost, such as in the case that incremental consumption will allow
economies of scale given an existing generator is not fully utilized (Figure 28). The
mismatch of revenue collected and cost incurred infringes the principle of economic
sufficiency, which then requires revenue conciliation. If not executed carefully, this could
compromise the efficiency of the LRMC tariff. In other words, the marginal cost approach
provides ratepayers with cost information about the future, whereas the average cost
approach is based on historical data and thus provides ratepayers with cost information
about the past. Applying the marginal cost approach will lead to a tariff allocation process
that is more complex and that will sometimes require revenue reconciliation, so the
revenues collected based on future-oriented costs match the historical ones incurred by the
utility. However, it is theoretically more conducive to efficient use of electricity, since the
customers are made aware of the implications of their consumption choices.

82
When it comes to the principle of equity, the performances of both cost allocation methods
vary depending on which interpretation is adopted. First, neither directly address access to
electricity for low-income consumers. This social concern is often dealt with through the
implementation of a lifeline rate, providing lower subsidized rates for a first block of
consumption, deemed enough to cover basic needs, possibly reinforced by subsidized
connection fees. As for the ‘beneficiaries pay’ interpretation, the strict marginal cost
approach embodies this interpretation in principle, but it is commonly modified to achieve
economic sufficiency (in the case that the non-modified tariffs would lead to a deficit in the
utility’s budget) or to avoid consumer resistance (in the case the non-modified tariffs would
lead to a surplus in the utility’s budget) (Munasinghe, 1981). The array of adjustment
methods available has implications for different rate making principles.
Figure 28: Revenue surplus and revenue deficit under different LRMC curves

83
Current electricity tariff setting in Tanzania
At the time of writing, remuneration for the electric power industry in Tanzania is
recovered via a multi-year integral tariff, proposed by TANESCO and approved by
EWURA, to be reviewed at least once in every three years. This is equivalent to the price
cap variety of incentive-based regulation with a standard regulatory lag. The integral tariff
does not distinguish between the origin of costs that need to be recovered into functional
segments such as generation, transmission, and distribution. This is a feature which reflects
the fact that Tanzania’s power industry structure is not yet unbundled.
Since the establishment of EWURA in 2006, the regulator has already undertaken five
rounds of tariff reviews (Table 7). This section describes the rate-setting principles upheld
by Tanzanian legislation and the integral tariff determination process in use during the
latest tariff review. A tariff review is planned for the year of writing (2016), but it had not
taken place by the time the authors completed research for this paper, therefore it is not
included as part of this study.
Table 7: History of EWURA tariff reviews (Based on: EWURA, 2012a, 2013;
TANESCO, 2013)
Proposal submitted on
Proposed tariff Tariff approved on
Approved tariff
EWURA comments Valid starting from
6 % increase Cater for inflation applicable Feb 2007
Aug 2007 40% increase
Dec 2007 21.7% increase
Only to cover its operation and maintenance costs, except for depreciation and provision for doubtable debts Direct TANESCO to order CoSS
Jan 2008
May 2010 Increase of 34.6% for 2011 13.8% for 2012 13.9% for 2013
Dec 2010 18.5% increase
CoSS found unsatisfactory: assumptions, concepts, data are not reflective of true costs CoSS ordered by EWURA from AF-Mercados
Jan 2011
Nov 2011 155% increase due to EPP
Jan 2012 40.29% increase
Determined based on forward looking AF-Mercados CoSS rate-setting methodology
Jan 2012
Jan 2013 2012 tariff maintained
TANESCO has withdrawn application for 155% increase in Jan 2013
Jan 2013
Sept 2013 Increase of 67.87% for Oct 2013 12.74% for 2014 9.17% for 2015
Dec 2013 39.19% increase
Determined based on forward looking AF-Mercados CoSS rate-setting methodology
Jan 2014

84
Section 23.2 of the 2008 Electricity Act states that the EWURA shall be guided by the
following principles:
a) Tariffs should reflect the cost of efficient business operation;
b) Tariffs should allow licensees to recover a fair return on their investments, provided
that such investments have been approved by the Authority;
c) Costs covered by subsidies or grants provided by the Government or donor agencies
shall not be reflected in the costs of business operation;
d) Tariff adjustments shall, to the extent possible, ensure price stability;
e) Access charges for use of transmission or distribution system shall be based upon
comparable charges for comparable use;
f) No customer class should pay more to a licensee than is justified by the costs it
imposes upon such a licensee;
g) Tariffs should enhance efficiency in electricity consumption and should encourage
adequate supply to satisfy demand.
These principles reflect the general rate making principles of economic efficiency (items a
and g), economic sufficiency (item b), stability (item d) and equity (items c, e, and f).
Subsection 23.2.c reflects the fact that a significant part of the Tanzanian power
infrastructure is financed through public funds or development grants, which should be
distinguished from other assets in the utility’s rate base. The questions that need to be
answered while scrutinizing the integral tariff in place are therefore focused on the
legislated principles mentioned above (Table 8).

85
Table 8: Evaluation framework for the tariff setting mechanism in Tanzania
Principle Revenue determination Tariff allocation
Economic
efficiency
Do the allowed revenues, to be
recovered from ratepayers, represent
efficient use of resources by TANESCO?
Does the tariff charged incentivize
consumers to use electricity efficiently?
Economic
sufficiency
Are the allowed revenues to be
recovered sufficient to cover the
operating expenditures of the licensees,
including a reasonable rate of return for
the capital invested?
Does the totality of tariff charged
correspond to the allowed revenues
(additivity)?
Equity How are grants from the government and
development partners treated in the
computation of the revenue requirement?
Are there cases when customer
classes are charged more than the
costs they impose upon TANESCO
(cross-subsidization)? How are such
cases justified?
Stability Is the approved tariff stable over time?
The Tariff Application Guidelines 2009 describe the procedures to be followed by an
applicant and by EWURA when processing a tariff application. They are applicable to all
regulated suppliers seeking a new tariff or to change an existing one. The guidelines
encourage economic efficiency and sufficiency in principle. They set out in writing that
tariffs approved by EWURA shall reflect ‘prudently-incurred costs of providing the
regulated service’ which are independently verifiable, and that, in the case that a tariff
change that will not attain full cost recovery is proposed by the applicant, a plan for
attaining full cost recovery shall be supplied (EWURA, 2009, p.1). Upon receiving the
application, EWURA held public hearings and consultations with the Government
Consultative Council and EWURA Consumers Consultative Council. Based on the guiding
clauses cited previously, the discussion from public consultations, and the Cost of Service
Study (CoSS) performed by AF-Mercados, the multi-year tariffs were determined.
(EWURA, 2013). EWURA concluded that the proposed tariff increase by TANESCO was
reasonable, except for some key elements which were adjusted to arrive at the approved
86
tariff. Nevertheless, the final tariff approved by EWURA for the 2013–15 regulatory period
is significantly lower than that proposed by TANESCO.
Revenue determination
In this section, the revenue requirement as per TANESCO’s 2013 tariff application is
presented. It is then compared to the AF-Mercados 2012 CoSS, the only benchmark study
available, as an approximate evaluation of its efficiency. Finally, the revenue approved by
EWURA is compared with the original TANESCO proposal.
TANESCO proposal
According to the 2009 guidelines, the formula for computing revenue requirement, unless
another has been approved by EWURA, is the following (EWURA, 2009, p. 5):
required OMR C D T WACC RB (1.6)
required
OM
R : revenue requirement
C : allowed operating and maintenance costs, including general and administrative expenses
D: depreciation expenses
WACC: weighted average cost of capital
RB: rate base, gross assets less depreciation
T: taxes
However, in the 2013 tariff application, TANESCO uses a different formula to compute its
revenue requirement (TANESCO, 2013, p. 5).
required OM otherR C D L I R (1.7)

87
required
OM
other
R : revenue requirement
C : allowed operating and maintenance costs, including general and administrative expenses
D: depreciation expenses
L: loan repayment
I: investment plan
R : revenue from other sources
The evolution of revenue requirement computed by TANESCO in its 2013 tariff
application is presented in Figure 29. The per unit revenue requirement, averaged over the
expected sales of electricity, is also shown. A detailed breakdown of revenue requirement
forecasted for the year 2013 is shown in Figure 30.
In TANESCO’s application, operating expenses represent the most important component of
the five categories, expected to rise in absolute terms but stabilize on a per unit basis since
its historical increase in 2012. Financial costs – loan interest payments and fees due to long
outstanding creditors – are expected to increase and other operating income (including
government subsidy) decrease. Finally, depreciation and TANESCO’s Capital Investment
Plan (CIP) remain at similar levels throughout the entire period forecasted.

88
Figure 29: The evolution of historical (2011–12) and forecasted (2013–15) components
making up revenue requirement (Data source: TANESCO, 2013)
TANESCO has also requested that a tariff indexation mechanism be used to adjust changes
in costs that are outside of TANESCO control, so that the tariff revenue keeps pace with
rising costs during periods between formal reviews. Local inflation and foreign exchange
rate fluctuation adjustments based on reports as published by the Bank of Tanzania are
proposed, along with the indexation of fuel costs. It is hoped that the adjustments would be
published by EWURA on a quarterly basis. The formula that TANESCO proposes to
compute fuel adjustment in its tariff application possibly contains layout mistakes
(TANESCO, 2013, p. 8).

89
, 1 , 1
1, 1 , 1
p Qi t i t
iFACt AS BFC
i t i t
(1.8)
FAC : Fuel adjustment in month t-1t-1
p : Actual price of fuel i and associated operating costs in month t-1i,t-1
Q : Actual quantity of fuel i consumed in month t-1i,t-1
AS : Actual end use energy soldi,t-1
in month t-1
BFC : Base fuel cost per energy forecast to be sold as approved by EWURAi,t-1
Figure 30: Breakdown of TANESCO forecasted 2013 revenue requirement (Data
source: TANESCO, 2013)

90
It is believed that the following formula was intended, after the consistency of physical
units is checked:
, 1 , 1
1 , 1, 1
p Qi t i t
iFAC BFCt i tAS ii t
i
(1.9)
FAC : Fuel adjustment in month t-1, $/kWht-1
p : Actual price of fuel i and associated operating costs in month t-1, $/MMBTUi,t-1
Q : Actual quantity of fuel i consumed in month t-1, MMBTUi,t-1
AS : Acti,t-1
ual end use energy sold in month t-1, kWh
BFC : Base fuel cost per energy forecast to be sold as approved by EWURA, $/kWhi,t-1
The above fuel cost adjustment formula passes on all changes in fuel consumption and fuel
prices relative to the planned ones to the ratepayers. In the case that fuel
consumption/prices increased, the fuel adjustment charge would be the difference between
the actual fuel cost incurred per unit sold and the approved fuel cost, an increase in the
energy charge for all tariffs. Conversely, in the case that fuel consumption/prices decreased,
the fuel adjustment would be a decrease in the energy charge for all tariffs. This formula
does not explicitly state the actual generation (it is different from the actual sales due to
commercial and technical losses), therefore the adjustment does not reflect whether the fuel
costs are efficiently incurred. By February 2016, automatic fuel cost adjustment had not
yet been implemented.

91
Comparison with AF-Mercados CoSS
The consultancy AF-Mercados conducted a CoSS as per request of EWURA and published
it in January 2013, eight months before TANESCO’s tariff application. The same
consultancy designed a rate-setting methodology which has been used by EWURA as a
reference since 2012. The AF-Mercados CoSS is the best approximate for TANESCO’s
efficient costs. Therefore, its findings are compared to the TANESCO proposal.
Within the CoSS, the total revenue requirement of the utility is determined based on cost
estimates for each segment: generation, transmission, and distribution.
required G T DR R R R (1.10)
G
T
D
R : revenue requirement for the generation segment
R : revenue requirement for the transmission segment
R : revenue requirement for the distribution segment
Since TANESCO did not present its revenue requirement per functional segment, the items
that it reported as part of its revenue requirement were sorted based on assumptions in
Appendix II to provide best estimates that could be compared with the CoSS values. It is
also noted that two components of the TANESCO tariff application – revenue from other
sources and financial costs – are not addressed in the CoSS. They are discussed separately
in terms of their efficiency.
To estimate costs incurred by the generation segment in 2013–15, the consultants used the
demand forecast and generation expansion plan outlined in the PSMP of 2011, and they
assumed fixed fuel price and typical water conditions (as opposed to low water conditions)
for the three years forecasted. The total generation segment revenue requirement included
plant dispatch variable costs (variable O&M and fuel consumption) and fixed cost (fixed
O&M costs and annualized capital expenses). The annualized capital costs were not
calculated but directly taken from the PSMP, bundled with fixed O&M costs. Theoretically,
they should incorporate the joint effect of reward to capital invested and depreciation.
Therefore, Equation (1.11) is closer to Equation (1.6) than Equation (1.7).

92
,var ,G OM OM fixR C C A (1.11)
f
OM,var
OM,fix
C : fuel cost
C : variable O&M cost
C : fixed O&M cost
A: annualized capital cost
Fuel consumption, the most important contributor to variable O&M cost, is dependent on
the demand and the mix of generation dispatched to meet it. The gross demand forecast
used by the CoSS, including electricity that is generated but lost during transmission and
distribution, and the gross demand inferred from TANESCO forecasted sales (based on
known T&D loss targets) are compared in Figure 31. The TANESCO estimate is visibly
lower than the CoSS estimate. This is an important difference, because it indicates that the
generation revenue requirements computed by AF-Mercados and TANESCO cannot be
compared in their absolute terms, because they are calculated based on different electricity
provision requirements. Instead, the unit cost should be used for comparison.
Figure 31: Comparison of gross power demand (Data source: AF-Mercados, 2013;
TANESCO, 2013)

93
The generation revenue requirement estimate from CoSS (capacity cost and energy cost),
averaged over gross demand, is compared to the TANESCO value (the sum of EPP,
purchased electricity, own generation cost, and depreciation, averaged over gross demand)
(Figure 32). It can be seen that the generation segment cost estimate of TANESCO is
significantly higher than that from the CoSS for 2013 and 2014. The difference can be
traced to a more optimistic assumption of hydrology in the CoSS (statistically available
hydrology rather than low hydrology which has been experienced by Tanzania since 2011),
which has implications for the load factors of thermal generators and consequent fuel
consumption. This difference is recognized by EWURA, which adjusted the utilization of
hydro plants to reassess the generation cost estimates originally presented by the CoSS
(EWURA, 2013). The costs of EPPs procured increase the anticipated unit generation cost
by about 50 TZS/kWh.
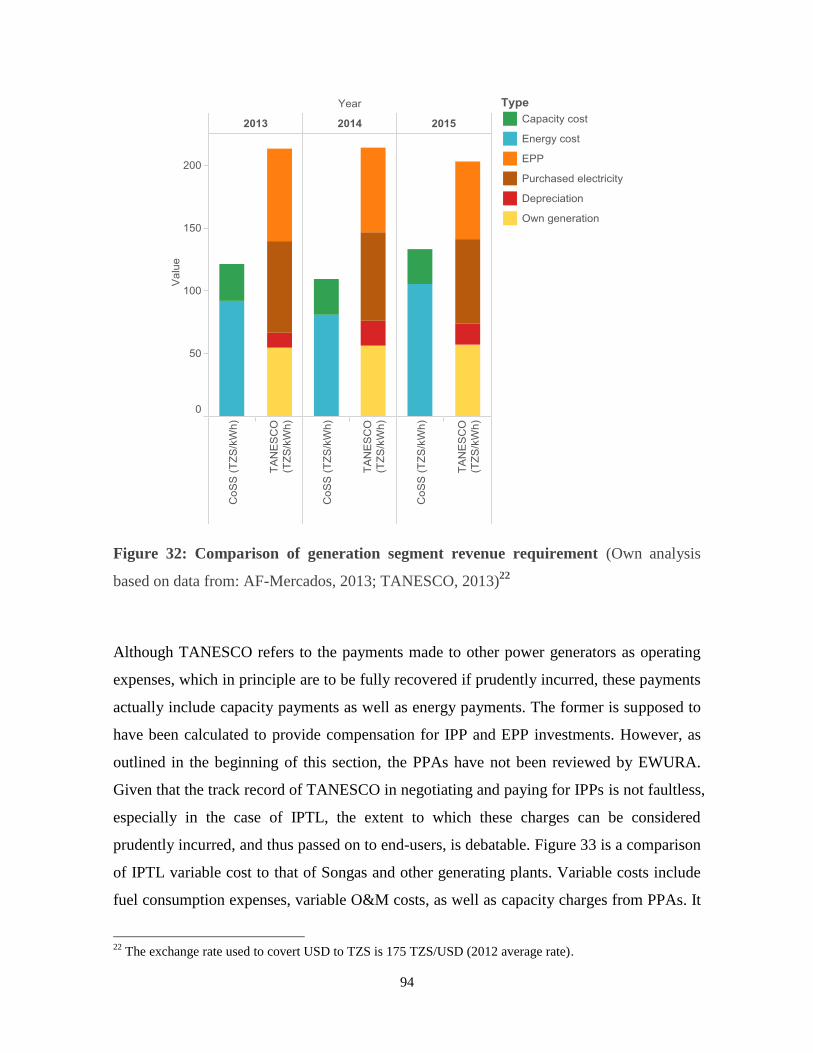
94
Figure 32: Comparison of generation segment revenue requirement (Own analysis
based on data from: AF-Mercados, 2013; TANESCO, 2013)22
Although TANESCO refers to the payments made to other power generators as operating
expenses, which in principle are to be fully recovered if prudently incurred, these payments
actually include capacity payments as well as energy payments. The former is supposed to
have been calculated to provide compensation for IPP and EPP investments. However, as
outlined in the beginning of this section, the PPAs have not been reviewed by EWURA.
Given that the track record of TANESCO in negotiating and paying for IPPs is not faultless,
especially in the case of IPTL, the extent to which these charges can be considered
prudently incurred, and thus passed on to end-users, is debatable. Figure 33 is a comparison
of IPTL variable cost to that of Songas and other generating plants. Variable costs include
fuel consumption expenses, variable O&M costs, as well as capacity charges from PPAs. It
22
The exchange rate used to covert USD to TZS is 175 TZS/USD (2012 average rate).

95
can be seen that the IPTL capacity charge, the non-fuel portion of its variable cost, is much
higher than that of any other generator.
Figure 33: Comparison of variable costs of different generating plants (Data source:
AF-Mercados, 2013, all historical EPPs are included)
In the CoSS, the transmission segment revenue requirement consists of two main
components: capital expenditure and the operating expenditure. The transmission segment
revenue requirement is assumed to be equivalent to the PSMP estimates, and the operating
expenses are assumed to be 2 per cent of the new replacement value of the transmission
segment rate base. As for the distribution segment, the revenue requirement for capital
expenditure includes network expansion, renewal, and loss reduction allowance, while the

96
operating expenditure revenue requirement includes staff salary and other overheads,
benchmarked against international references. Since TANESCO’s non-generation operating
expenses and investment plan (CIP) is not disaggregated between transmission and
distribution, the CoSS revenue requirements for both network segments are summed and
compared to the ones presented in TANESCO’s tariff application (Figure 34).23
Figure 34: Comparison of transmission and distribution segment revenue
requirement (Data source: AF-Mercados, 2013; TANESCO, 2013)24
Unlike generation costs, which are subject to important external uncertainties, revenue
requirement by the network segments should be relatively predictable. The operating
23
Since network maintenance is counted toward capital expenditure in the CoSS, the repair and maintenance
cost in the TANESCO application is assigned to the CAPEX rather than the OPEX component. 24
TANESCO revenue requirement for the years 2011 and 2012 are based on historical data, and the exchange
rate used to covert USD to TZS is 175 TZS/USD (2012 average rate).

97
expenditure estimated by the CoSS is slightly but consistently below that provided in
TANESCO’s tariff proposal, while the capital expenditure estimated by the COSS is
significantly above the CIP planned by TANESCO. This suggests that there is some slim
margin for improvement in TANESCO’s network operations and other administrative
overheads, and that the utility is not making as much investment as expected in order to
serve future demand. It should be noted that REA is funding much of the distribution
network expansion in rural areas. This might offset part of the difference in planned
network investment.
‘Loan repayment’ and ‘revenue from other sources’ are two components which are not
directly established in the CoSS but do figure in the revenue requirement of TANESCO.
The deduction of other sources of revenue, including government revenue grants, from the
revenue requirement is consistent with the legislated principle that the costs covered by
such revenue shall not be reflected in the revenue requirement. The EWURA-approved
revenue requirement formula should be adjusted to incorporate such revenues.
For the ‘loan repayment’ component, it was previously established that levying funds for
loan repayment as planned by TANESCO via the revenue requirement can be seen as the
collection of return on debt. Therefore, the loan repayment levy proposed by TANESCO is
compared to the best approximate of the debt-funded portion of the rate base (Figure 35).
' fixed
debt
current fixed
ARB D
A A
(1.12)
'
debt
current
fixed
RB : Estimate of debt-funded rate base
D: Forecasted total liabilities
A : Forecasted current assets
A : Forecasted fixed assets

98
Figure 35: Comparison of planned loan repayment with expected utility liabilities
(Data source: TANESCO, 2013)
The loan repayment to be levied via tariff increases as the expected debt-funded rate base
decreases, meaning that the equivalent cost of debt paid by the tariff increases with time.
The equivalent cost of debt thus collected grows from 4 per cent to 25 per cent between
2013 and 2015, becoming significantly higher than the after-tax cost of debt determined by
the CoSS (11 per cent).
Comparison with approved revenue requirement
EWURA published the approved tariff levels but not the approved revenue requirement
from which they were derived. The approved revenue requirement was thus inferred from
the tariff levels in the next section and then compared to the original revenue requirement
proposed by TANESCO.
In response to TANESCO’s request for fuel cost, inflation, and foreign exchange
adjustment, EWURA announced that the utility’s proposal lacked some key regulatory
monitoring parameters, such as the heat rates (efficiency ratings) of thermal power plants.
Therefore, it will be using the Fuel Adjustment and Foreign Exchange Rate Fluctuation

99
Adjustment that was established in the Rule 7(2) of Electricity (Tariff Setting) Rules, 2013
(EWURA, 2013). In 2014, after the first review of tariff adjustment, applying fuel cost and
foreign exchange indexation, EWURA decided that a reduction of planned revenue
requirement for 2014 was due, given decreased generation in the thermal plants (EWURA,
2014). However, given that TANESCO’s financial status further deteriorated between 2013
and 2014, quarterly tariff adjustments for the year were deferred until 2015.
Tariff structure and allocation
Independently of the revenue requirement proposed by TANESCO, the tariff structure
proposed in its tariff application and the EWURA approved tariff are evaluated in terms of
efficiency, sufficiency, equity, and stability.
The structure of the Tanzanian electricity tariff has remained fixed since at least 2006. It
does not differentiate between different geographic regions of the country or different
consumption periods. The five categories of customers are differentiated based on the
voltage at which they are connected and their average level of consumption. The tariff
applicable to each class of customers can include an energy charge, a capacity charge, and a
service charge:
1. Domestic low usage tariff (D1): this category covers domestic customers with low
consumption at low voltage (230 V). The first 50 kWh of consumption is charged at
a subsidized lifeline rate, and monthly consumption exceeding that is charged at a
higher rate and capped at 283 kWh. This tariff only contains an energy component.
In the tariff approved for 2014, the lifeline consumption block has been increased to
75 kWh.
2. General usage tariff (T1): this category covers customers from a wide range of
sectors, with average consumption above 283 kWh per month, supplied at low
voltage (230 V for single phase and 400 V for three phase). There is both an energy
component and a fixed component in this tariff.

100
3. Low voltage maximum demand usage tariff (T2): this category covers customers
with monthly average consumption of more than 7,500 kWh at 400 V. Energy,
demand (capacity), and fixed components all exist for this tariff.
4. Medium voltage maximum demand usage tariff (T3-MV): this category covers
customers connected to the grid at 11 kV and above. Energy, demand (capacity),
and fixed components all exist for this tariff.
5. High voltage maximum demand usage tariff (T3-HV): this category covers
customers connected to the grid at 132 kV and above. Energy and demand (capacity)
components exist for this tariff. The fixed component was abolished in the tariff
approved for 2014. It is also known as the bulk tariff (T5).
The tariff levels proposed by TANESCO are presented in Figure 36, Figure 37, and Figure
38, shown alongside the evolution of approved tariff levels.
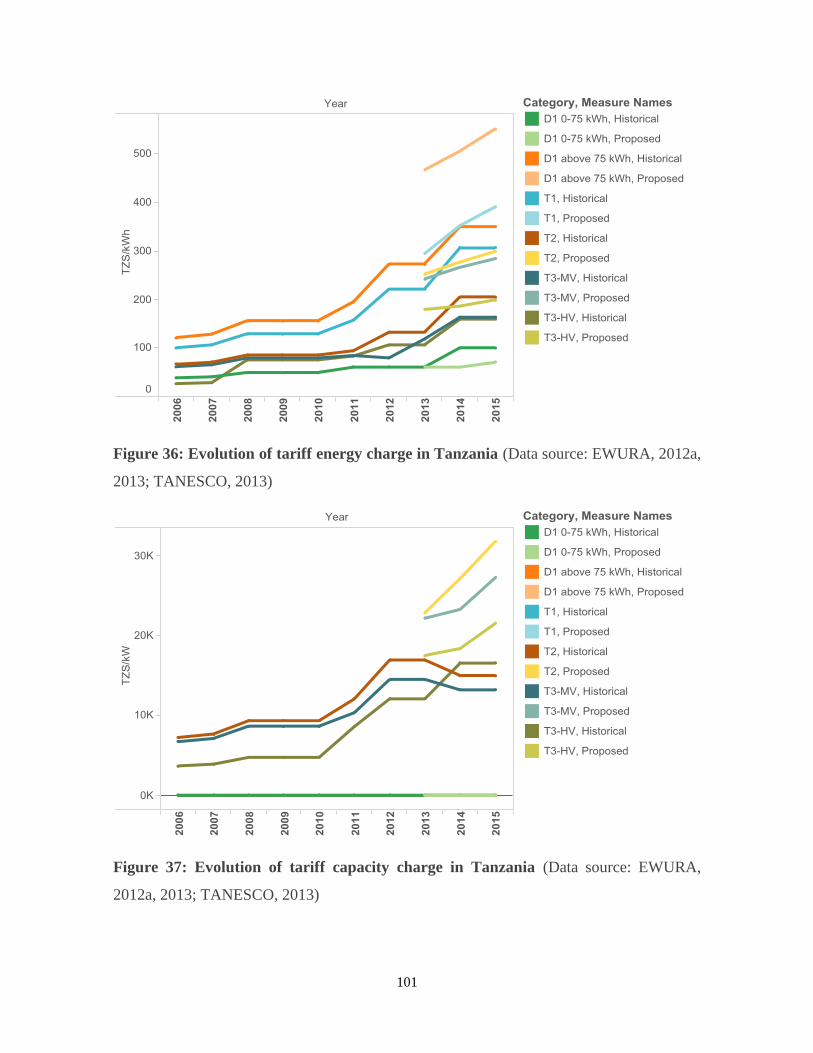
101
Figure 36: Evolution of tariff energy charge in Tanzania (Data source: EWURA, 2012a,
2013; TANESCO, 2013)
Figure 37: Evolution of tariff capacity charge in Tanzania (Data source: EWURA,
2012a, 2013; TANESCO, 2013)

102
Figure 38: Evolution of tariff service charge in Tanzania (Data source: EWURA, 2012a,
2013; TANESCO, 2013)
Tariff sufficiency
Before inferring the approved revenue requirement from approved tariff levels, the
proposed tariff levels need to be checked for tariff additivity. Based on assumptions in
Appendix III, the proposed tariff levels are converted to equivalent revenue requirement. It
is found that the tariff design is additive, given the demand forecast available in ex post
terms: if applied, the tariffs collected in year t will yield collected tariffs whose sum
matches the revenue requirement for year t-1 (Figure 39).
The tariff levels approved by EWURA are applied to the same demand forecasts as the
ones used for the additivity check, and the resulting tariff billed is compared to
TANESCO’s proposed revenue requirement (Figure 40). It is inferred that the revenue
requirements approved by EWURA are those related to operating expenses: the estimated
sum that can be charged using the approved tariff for 2014 is roughly the magnitude of the
estimated operating expenses for 2013 (1,480 billion TZS vs. 1,410 billion TZS). The same

103
observation applies for the subsequent year (1,608 billion TZS vs. 1,525 billion TZS). This
is consistent with the historical trend noted in Figure 25 for the period prior to 2011.
Figure 39: Comparison of the estimates for proposed tariff charged to customers and
for TANESCO’s revenue requirement (Own analysis based on data from: EWURA,
2013; TANESCO, 2013)

104
Figure 40: Comparison of the estimates for approved tariff charged to customers and
for TANESCO’s revenue requirement (Own analysis based on data from: EWURA,
2013; TANESCO, 2013)
Tariff efficiency
The average price of electricity per kWh consumption (including the effect of energy,
capacity, and service charges) is plotted for different categories of customers as a function
of their monthly consumption under the newly approved tariff, in Figure 41. For all
costumer classes but one, the average cost of electricity decreases with monthly
consumption, then rapidly stabilizes. For ratepayers in category D1, exceeding the lifeline
consumption quota leads to a steep increase in average cost of electricity. This increase
eventually stabilizes once monthly assumption exceeds 1,000 kWh. For consumption below
200 kWh, D1 is the most advantageous customer class, but it becomes the most expensive
once monthly consumption is above 400 kWh. This incentivizes customers with average
consumption above 400 kWh to contract for a T1 tariff rather than a D1 tariff. As a special
case of an increasing block design, the stepped energy charge for D1, the only customer

105
class with such design, deters non-qualified customers from profiting from the subsidized
lifeline rate. However, for users with monthly consumption between 200 and 400 kWh,
there is incentive for them to remain within the D1 class to take advantage of the lifeline
rate, because the average cost of power is lower than that of T1.
Figure 41 Average price of electricity for different categories of customers at load
factor = 0.7 (Own analysis based on data from: EWURA, 2013)
For customers belonging to categories T2, T3-MV, and T3-HV, the existence of the
capacity component of tariff encourages these customers to increase their load factor (to
require less network capacity for the same quantity of energy consumed) (Figure 42). In
other words, spreading out energy use over a period of time rather than consuming
electricity that would produce sharp profiles. In the previous section, it was noted that small
incremental increases in peak demand may require the use of generation units with much
higher marginal cost (requiring units fired by liquid fuel), therefore a tariff price designed
to incentivize customers to curb peak demand might generate important system savings.
Additional tariff features, such as time-of use-tariff, could be incorporated to further
incentivize customers to curb peak demand, especially in the T3-MV class, where only a
few customers are responsible for a third of overall power consumption.

106
Figure 42 Average price of electricity for select categories of customers at load factor
= 0.1 and 0.9 (Own analysis based on data from: EWURA, 2013)
Tariff equity
To assess the equity of the cost allocation, it needs to be determined whether the tariff
collected from each customer class reflects all costs (energy driven, capacity driven, and
customer driven) that each class imposes upon TANESCO. EWURA uses the average cost
rather than the marginal approach to allocate costs to the tariff structure (AF-Mercados,
2013; EWURA, 2012a). Conventionally, using this approach, the energy charge is used to
recover generation-related costs, the capacity charge is use to recover network-related costs,
and the service charge is used to recover the administrative costs of service provision. For
both the tariff levels proposed and the tariff levels approved, energy components make up
the majority of the sum of all bills charged to customers (Figure 43). In the case of the
proposed tariff levels, the total energy charge collected exceeds generation related costs in
the expected revenue requirement (yellow-coloured items), suggesting that the energy
charge is used to recover other categories of costs from customers.

107
Figure 43: Contribution of different types of charges to total tariff collected (Own
analysis based on data from: EWURA, 2013; TANESCO, 2013)
Given TANESCO did not disclose each customer class’ contribution toward network cost
(only the forecasted breakdown of demand per customer class is available), the share of
tariff collected from each customer class under the proposed tariff is compared to its
contribution to total demand, a stand-in for its contribution toward total costs.
D1 >50 kWh, T2, and T3-MV customers roughly contribute the same amount to the tariff
collected under the levels proposed. These levels are also consistent with their contribution
toward total demand. D1 <50 kWh customers, bearing about 0.5 per cent of all tariffs
collected, is responsible for 1–3 per cent of total demand. Correspondingly, the tariff
collected from T1 customers are higher than the expected level, based on their share of total
demand. Thus, the lifeline rate present can be seen as a cross-subsidy from T1 customers to
D1 <50 kWh customers. The size of this cross-subsidy is small relative to the size of the
overall sector. Interestingly, the tariff collected from T3-HV customers, under the proposed
tariff levels, is also slightly under its expected shares (4 per cent vs. 6 per cent). It could be

108
because they are charged the bulk tariff, excluding network costs given that they are
connected at 132 kV. Overall, the tariff structure and levels proposed by TANESCO are
aligned with different customer contributions toward total demand, except for the cross-
subsidy to lifeline rate customers.
Figure 44: Comparison of customer class contribution to tariff collection and demand
(Own analysis based on data from: EWURA, 2013; TANESCO, 2013)25
Given that the approved tariff levels have changed the cost recovery allowed from each
customer class from the one proposed by TANESCO, an approximately equitable
distribution, it is also necessary to analyze their impact on outcome equity. In Figure 45 the
total revenue collected from all customer classes over 2013–15, compared to TANESCO’s
initial proposal, is shown to have decreased under the approved tariff. The only exception is
in the energy charge collected from D1 <50 kWh customers, which increased under the
approved tariff (from 26 to 34 billion TZS). However, the degree to which tariff collection
is cut back from the proposed level is different for different classes: approved revenue to be
collected from T1 customers is 80 per cent of the proposed amount, while approved
revenue to be collected from T3-MV customers is 55 per cent of the proposed amount.
Such unevenness across the approved tariff leads to a cost distribution among users that is
different from that proposed. Relatively more costs are borne by T1 customers and less by
T3-MV customers under the approved tariffs (Figure 46).
25
The effect of increasing the lifeline rate allowance from 50 kWh to 75 kWh for D1 customers is neglected.

109
Figure 45: Comparison of proposed and approved tariff charges to be collected 2013–
15 (Authors' analysis based on data from: EWURA, 2013; TANESCO, 2013)
Figure 46: Comparison of customer class contribution to tariff collection under
proposed and approved tariffs (Own analysis based on data from: EWURA, 2013;
TANESCO, 2013)
Tariff stability
Since 2007, EWURA has always rejected TANESCO’s proposed tariff increases and
approved lower ones. Overall, the year-to-year increase has never exceeded 40 per cent.
However, the overall trend has been for a consistently increasing tariff. Given that the

110
energy charge is the most important component of all electricity bills collected (Figure 43),
the relative change of the energy component of the historically approved tariffs for different
customer classes is used as a proxy for the relative change in electricity bill for different
classes (Figure 47).
Figure 47: Relative change in the energy charge for various customer classes since
2006 (Own analysis based on data from: EWURA, 2012a, 2013; TANESCO, 2013)
The energy charge for T3-HV class customers has changed the most since 2006, by 500 per
cent, while the increase for all other customers are limited to between 163 per cent and 210
per cent. The increase in tariff for D1 <lifeline threshold customers and T3-MV lag behind
that for the other classes. This is probably due to concerns over the ability of economically
vulnerable customers to afford electricity and with the competitiveness of Tanzanian
industries (especially the more electricity intensive ones).

111
EWURA’s approval of new tariffs for 2014 and onward included a requirement for
EWURA to adjust TANESCO’s tariffs on a quarterly basis to reflect changes in fuel costs
and fluctuations in foreign currency exchange rates. The effect of inflation is also to be
considered by EWURA every six months. This occurred despite the Government
Consultative Council’s comment, during the stakeholders consultation process, that
indexation will make tariffs unpredictable (EWURA, 2013). This suggests that the
regulator is willing to pursue tariff sufficiency with some cost to tariff stability. In
application, however, the approved tariff has not yet been adjusted. In 2014, after the first
tariff adjustment evaluation, EWURA decided that tariff reduction due to decreased fuel
use in thermal generation would be deferred until 2015, given TANESCO’s deteriorating
financial position. This demonstrates that the implementation of tariff indexation is far from
automatic, and that the regulator’s deliberation still prevails.
Discussion
Having examined the current practice of integral tariff setting, the paper now presents
observations on the process of tariff setting and discusses the outcome in terms of the
ratemaking principle that EWURA upholds.
To begin, the formula used by TANESCO to calculate its revenue requirement in its 2013
tariff review application is different from the one specified by EWURA in its 2009
guidelines. The two formulas have in common the pass-through of operating and
maintenance costs, but they have different ways of accounting for and rewarding
investment in the power sector.
In EWURA’s original formula, the underlying logic is that the equity and liability owners
of the utility company – in TANESCO’s case, the government and development banks –
provide up-front funds for the planned additions to an existing asset base; therefore, the
updated rate base and the recognized WACC inform the calculation of revenue requirement,
based on which the company collects a return upon the capital invested. The annual
revenue collected, in principle, other than covering operating expenditure, is enough to
cover interest repayments and dividend payments. After that, the utility executive can make
decisions to make further investment on behalf of the shareholders.

112
In TANESCO’s formula the rate base is absent, but there is a depreciation term
(supposedly calculated based on a certain book value of all existing fixed assets, a stand-in
for the rate base but not shown). Consequently, a return upon the rate base cannot be
determined, so loan repayment and investment are levied directly via the revenue
requirement. Some type of equivalence could be drawn between the two formulae, in the
case that some conditions are met (see box below). However, this inconsistency in tariff
setting methodology needlessly complicates the way revenue requirement items are to be
analyzed. Therefore, either EWURA or TANESCO need to revise their tariff setting
guidelines/application to consolidate the formula to be used.
Secondly, the CoSS performed by AF-Mercados presents estimated cost of service for
TANESCO in terms of different industry segments: generation, transmission, and
distribution. However, TANESCO did not report its revenue requirements disaggregated by
segments. This makes it difficult to conduct direct comparison between the two to assess
cost efficiency, making independent verification difficult. Therefore, in the future, as
TANESCO progresses toward the first milestone in structural reform (accounting
unbundling of generation, transmission, and distribution), the revenue requirement that it
supplies in its tariff review applications should be correspondingly disaggregated.
Lastly, in the tariff order published by EWURA in response to the TANESCO 2013
application, the regulator has listed the various tariff schedules approved, but not the
approved revenue requirement upon which they are based. Therefore, the regulator’s
Investment funds directly levied from current ratepayers could be an alternative form of
financing. One condition exists: the assets financed by the levy should not be included in the rate
base awarded with a rate of return, should that become the method through which the future
revenue requirement is calculated. In other words, if the current ratepayers were to finance the
investments directly, then they (and future ratepayers) should not have to pay returns to the
capital invested in those assets to TANESCO, who will be holding these assets.
As for the loan repayment levied, it could be considered to be the rate of return charged for the
debt portion of the asset base. Therefore, if the sum levied is in line with the known cost of debt,
then it could be justified as a reasonable cost to be passed on to the ratepayers, with the
condition that the debt portion of the rate base is not receiving any other form of compensation.

113
assessment of the appropriateness of the TANESCO tariff review application is not in the
public domain. Given that the tariff application is already in the public domain, publication
of the approved revenue requirement and its breakdown will increase the transparency of
the rate-setting process.
Economic efficiency
Do the allowed revenues, to be recovered from ratepayers, represent efficient use of
resources by TANESCO?
The computation of the revenue requirement is based on the ex ante forecast of the cost
elements rather than an ex post evaluation of historically incurred costs. In principle, this
incentivizes TANESCO to provide regulated services at costs lower than those approved.
It is found that the generation-related costs are highly sensitive to generator availability
assumptions. The availability of different types of generation capacity is a parameter that
has high sensitivity in forecast outcomes, given that the supply stack of installed capacity in
Tanzania has a three-tier structure: very low variable cost hydro forms the first tranche,
followed by gas generation capacity with medium variable cost, and liquid-fuel fired
generation with high variable cost (Figure 48). The availability of hydro generation is
dependent on hydrology, while the availability of gas generation is dependent on gas
availability, two factors which are beyond the control of TANESCO. This means that any
generation revenue requirement which does not explicitly address these two exogenous
uncertainties will have a high margin for error. This increases the difficulty of ex ante
revenue requirement determination, which is the currently adopted method. For the same
reason (tier-shaped supply stack), a small increase in incremental peak demand might lead
to disproportionally higher marginal generation costs. Therefore, it is hard to assess the
efficiency of generation costs unless availability and peak demand assumptions are agreed
upon by the utility and the regulator.

114
Figure 48: Merit order of Tanzanian installed capacity (Data source: AF-Mercados,
2013, all historical EPPs are included)
Does the tariff charged incentivize consumers to use electricity efficiently?
Within the approved tariff design, the capacity charge incentivizes T2 and T3 customers to
increase their load factor (in other words, use contracted capacity more evenly and contract
only as much as needed). The increasing block design for the energy charge of D1
incentivizes customers in this category with monthly consumption higher than 400 kWh to
switch to T1. All users consuming more than 200 kWh are incentivized to contract power at
the highest voltage level possible, given the lower average cost of electricity charged.
Given the Tanzanian power system’s high sensitivity to peak demand (see the question
above), it should be investigated whether additional measures such as time-of-use tariff
could bring important system savings by avoiding the use of expensive oil-fired generation
units (EPPs). In the long term, EWURA might consider transitioning from the accounting
approach of cost allocation to the marginal cost approach, so that the use of electricity by
Tanzanian ratepayers is based on the knowledge of the amount of future resources used to
provide it.

115
Economic sufficiency
Are the allowed revenues to be recovered sufficient to cover the operating expenditures of
the licensees, including a reasonable rate of return for the capital invested? Does the
totality of tariff charged correspond to the allowed revenues (additivity)?
Because EWURA published the approved tariff levels but not the approved revenue
requirement from which they were derived, it is not possible to ascertain the regulator’s
position toward specific items in TANESCO’s proposed revenue requirement.
The tariff levels proposed by TANESCO for year t is additive and sufficient to recover all
revenue requirement (including operating expenses, loan repayment, and self-funded
investment) proposed for the year t-1. The tariff approved by EWURA for year t is just
sufficient to recover operating expenses forecasted for the year t-1. This is consistent with
the trend exhibited by TANESCO’s overall expenses and tariff-based revenue during 2006–
10. Comparison of TANESCO’s revenue requirement with the AF-Mercados CoSS shows
that the amount of transmission and distribution network investment planned by
TANESCO is significantly lower than what is expected. Possibly, part of that investment is
shouldered by REA which is funding much of the distribution network expansion in rural
areas. However, it could also be a sign that the (historical and expected) approved revenue
requirement is not high enough to sustain TANESCO’s own investments.
Equity
How are grants from the government and development partners treated in the computation
of the revenue requirement?
When calculating its revenue requirement, TANESCO deducts its other sources of revenue,
including government revenue grants, from the revenue requirement. This is consistent with
the legislated principle that the costs covered by such revenue shall not be reflected in the
revenue requirement. The EWURA-approved revenue requirement formula should be
adjusted to incorporate such revenues.

116
Are there cases when customer classes are charged more than the costs they impose upon
TANESCO (cross-subsidization)? How are such cases justified?
The extent of cross-subsidization in the case of the lifeline rate is limited. D1 customers
who benefit from the subsidized lifeline rate consume 2.3 per cent of all energy supplied.
They are responsible for 0.9 per cent of customer bills. The overall effect of the lifeline
subsidy is small, and it is not formally justified in TANESCO/EWURA’s documents.
Assuming costs are to be allocated based on contribution to total demand, then the latest
approved tariffs might have attributed more costs to be borne by T1 customers and less to
be borne by T3-MV customers. It is hypothesized that this might be a decision on the part
of the regulator, after consultation with representatives of electricity consumers, to cross-
subsidize the industrial customers (T3-MV class).
Stability
Is the approved tariff consistent over time?
The approved tariff has been steadily increasing (especially the energy component of the
tariff) since 2006. EWURA has consistently approved tariffs which are lower than the ones
that TANESCO has applied for, and the average increase has never been higher than 40 per
cent. When distinguished by customer class, the energy charges of D1 <50/75 kWh
customers and of T3-MV customers have been increasing more slowly than those of other
classes of customers. This observation is consistent with the cross-subsidization of D1
lifeline customers and the hypothesized cross-subsidization of T3-MV customers.
The approved adjustment mechanism of tariff for changes in fuel costs, foreign currency
exchange rate, and inflation, meant to reflect changes in costs that are beyond the utility’s
control, is expected to increase the volatility of the approved tariff over time. However, its
implementation is unlikely to be automatic in the near future. The regulator has shown that
it assesses the likely impact of the tariff adjustment before approving/disapproving
adjustment according to the formula. Effectively, they become more frequent tariff reviews
with smaller scope (only a component of the tariff is reviewed). This will decrease the
regulatory lag in Tanzania’s tariff setting process and, in theory, decrease the incentive for
the regulated utility to seek efficiency savings. However, before a full oil-to-gas transition

117
in the power sector is complete, fuel costs should be adjusted due to the fact that they are
largely outside of the control of the utility (volatile oil prices and uncertain hydrology), so
that not all risks are borne by the utility.

118
International Experiences
The experiences of Bangladesh and Côte d'Ivoire in the co-development of natural gas and
electricity sectors can be used to shed light on the path forward for Tanzania. These
countries were chosen based on the relative use of natural gas in power generation in their
energy system and their level of electricity consumption. Based on 2012 data, Bangladesh,
Côte d'Ivoire, Nigeria, and Bolivia, were the only lower-middle income countries with
higher use of gas for power generation than that of Tanzania while exhibiting a per capita
electricity consumption of less than 1,000 kWh (Figure 49).
Figure 49: Electricity consumption vs. electricity produced from natural gas for world
countries (Data source: World Bank)
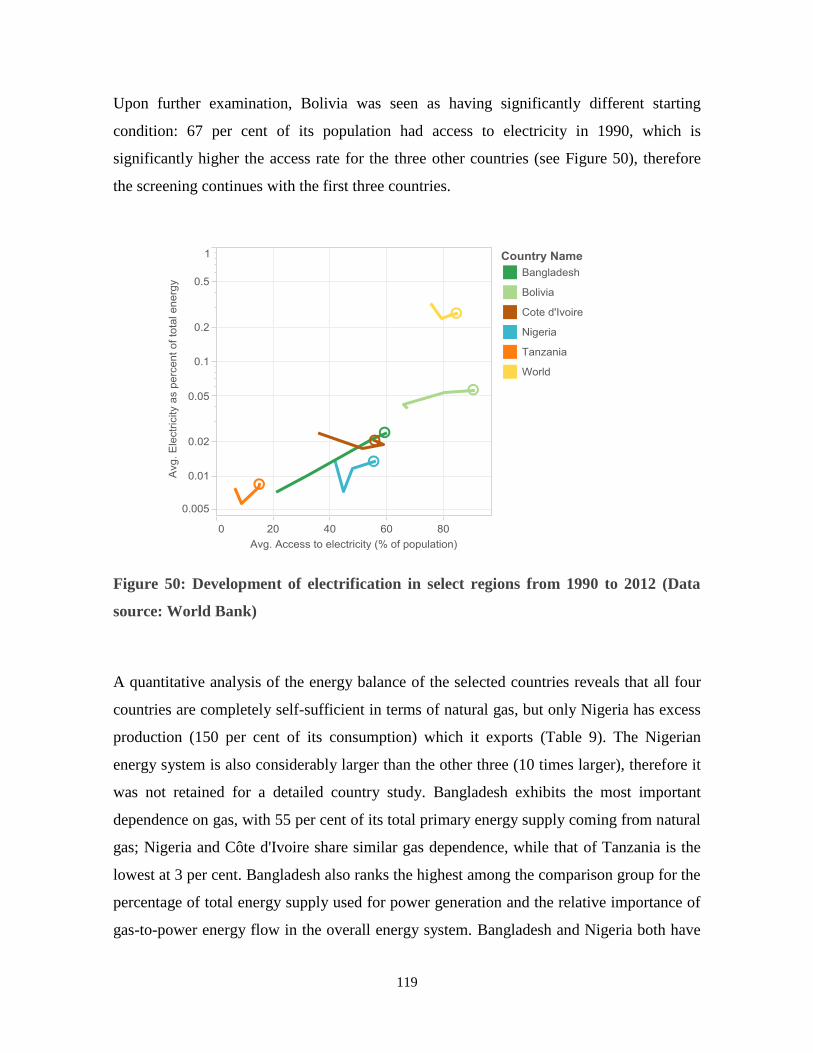
119
Upon further examination, Bolivia was seen as having significantly different starting
condition: 67 per cent of its population had access to electricity in 1990, which is
significantly higher the access rate for the three other countries (see Figure 50), therefore
the screening continues with the first three countries.
Figure 50: Development of electrification in select regions from 1990 to 2012 (Data
source: World Bank)
A quantitative analysis of the energy balance of the selected countries reveals that all four
countries are completely self-sufficient in terms of natural gas, but only Nigeria has excess
production (150 per cent of its consumption) which it exports (Table 9). The Nigerian
energy system is also considerably larger than the other three (10 times larger), therefore it
was not retained for a detailed country study. Bangladesh exhibits the most important
dependence on gas, with 55 per cent of its total primary energy supply coming from natural
gas; Nigeria and Côte d'Ivoire share similar gas dependence, while that of Tanzania is the
lowest at 3 per cent. Bangladesh also ranks the highest among the comparison group for the
percentage of total energy supply used for power generation and the relative importance of
gas-to-power energy flow in the overall energy system. Bangladesh and Nigeria both have

120
more diversified use for natural gas, as only about half of all natural gas is used for power
generation. Relative to other comparison countries, Tanzania’s generation mix has the
lowest, but still significant, percentage of natural gas (56 per cent).
Table 9: Comparison of energy systems of Tanzania, Bangladesh, Nigeria, and Côte
d'Ivoire (Data source: IEA for the year 2013)
Country Tanzania Bangladesh Nigeria Côte d'Ivoire
En
erg
y f
low
(M
toe)
Production and imports (1) 23.79 34.37 264.6 16.54
Exports (2) 0 0.11 131.4 3.46
Total primary energy supply (3) 23.79 34.26 133.2 13.08
NG production (4) 0.82 18.96 30.4 1.6
NG consumption (5) 0.82 18.96 12.2 1.6
Power gen fuel cons. (6) 1.22 12.54 5.6 1.8
Power import (7) 0.01 0 0 0.005
Power consumption (8) 0.38 4.56 2.5 0.65
Power export (9) 0 0 0 0.06
NG for power generation (10) 0.68 10.92 5.1 1.46
Rati
o
% NG sourced locally (4) / (5) 100% 100% 249% 100%
Gas dependence (5) / (3) 3% 55% 9% 12%
Energy used for power gen (6) / (3) 5% 37% 4% 14%
Power gen efficiency [(8) -(7)] / (6) 30% 36% 45% 36%
Power dependence (8) / (3) 2% 13% 2% 5%
% Gas used for power gen (10) / (5) 83% 58% 42% 91%
% Gas in power gen fuel (10) / (6) 56% 87% 91% 81%
Relative NG for power gen (10) / (3) 3% 32% 4% 11%

121
Bangladesh
Bangladesh has significantly higher use of domestic natural gas compared to Tanzania. It
also increased its installed generation capacity from 3,555 MW in 2000 to 11,877 MW by
2015 (which is an equivalent of annualized growth of 8 per cent). However, it still
experiences the same problem of energy demand growing rapidly to outstrip supply: in the
country’s Power Sector Master Plan of 2010, the addition of 30,000 MW of capacity
addition is planned by 2030, which will require an estimated $59 billion in investment (The
World Bank, 2014).
Power sector
In 2000, IPPs owned about 320 MW of available generation capacity, while the rest was
provided by the Bangladesh Power Development Board (BPDB) (Murshid & Wiig, 2001).
Of the current total installed capacity, 6,365 MW is owned by public sector entities such as
BPDB and its subsidiaries or joint ventures with the Rural Electrification Board (Ashuganj
Power Station Company, Electricity Generation Company of Bangladesh, North West
Power Generation Company, and Rural Power Company Ltd). A further 5,015 MW is
owned by private sector entities such as IPPs, Small Independent Power Producers (SIPPs),
quick rental power plants (QRPP, the equivalent of EPPs in Tanzania), and long-term rental
(BPDB, 2015b). This means that in the last 15 years, investment for 2,810 MW of
generation capacity has been channelled through BPDB and its subsidiaries, while 4,695
MW of generation capacity has been channelled through vehicles that tap into private
sector funds, such as IPPs, EPPs, and rental power. Breakdown of the generation capacity
by ownership and by fuel is available for the year 2013: in that year, it can be seen that the
non-public investment vehicle that contributed the most to installed capacity is rental power
with contracts lasting from three to five years. Note that more than 60 per cent of the
QRPPs are supplied by liquid fuel. These high-cost temporary rental units were undertaken
on a fast-track basis to address power shortage (Mujeri & Chowdhury, 2013). The majority
of all installed capacity (> 60 per cent) is made up by natural-gas fired generation capacity,
given their dominance in the publicly owned generation and IPP portfolios.

122
Figure 51: Breakdown of generation capacity in Bangladesh (Data source: BPDB, 2014)
The structure of the Bangladesh power sector has undergone unbundling, but not full
privatization. BPDB, the original vertically integrated public utility, was created in 1972. In
1977, the Rural Electrification Board (REB), a semi-autonomous government agency, was
established to assist setting up Rural Electric Societies, also known as Palli Bidyut Samity
(PBS), which own, operate, and manage distribution systems within their areas of
jurisdiction. There are now 76 operating PBSs, covering more than 90 per cent of the area
for rural electrification (REB, 2015). Partial transmission, distribution network
development, customer service and, since 1991, to lessen the administrative burden on
BPDB26
. Responsibility over parts of the Metropolitan area was transferred to Dhaka
Electric Supply Company (DESCO) in 1998 and DESA was later corporatized and became
the Dhaka Power Distribution Company Ltd. (DPDC) in 2008. In 2002, further geographic
disaggregation occurred with the creation of the West Zone Power Distribution Company
Ltd. to improve accountability in electricity delivery and reduce distribution system loss.
The unbundling between generation and transmission occurred between 1996 and 2003,
when the Power Grid Company of Bangladesh (PGCB) was created to own, operate, and
26
Revenue collection in the Greater Dhaka Area was served by a separate entity, the Dhaka Electric Supply
Authority DESA.

123
expand the transmission grid (IAEA, 2013). The PGCB has regulated monopoly over the
transmission network.
In 1996, BPDB was made into a holding company, and operational control over generation
was decentralized into a number of independently managed entities. Ashuganj Power
Company was created to take over the power station at Ashuganj, and the Meghnaghat
Power Company (later Electricity Generation Company of Bangladesh, EGCB) and North
West Power Generation Company were established to implement generation plants
financed by development partners (IMF, 2013). Rural Power Company (RPC), the first
non-BPDB entity licenced to take up power generation, did so in 1994. Its entire equity
investment has been mobilized domestically, with the REB owning 20 per cent share and
the remaining 80 per cent owned by nine PBSs.
Despite the horizontal and vertical unbundling, BPDB still acts as the single buyer which
purchases electricity generated by its public subsidiaries and private IPPs, SIPPs, and
QRPPs at bulk power tariff rates, which are negotiated as part of the PPAs signed between
them. For the year 2013–14, the average cost of electricity generated from all sources
(BPDB and other public entities, IPP, rental power, and import from India), after removing
additional costs such as interests on budgetary support and provision for maintenance and
development fund from total costs, was Tk5.9/kWh ($0.076/kWh) (BPDB, 2014)27
.
Having acted as the single buyer, BPDB then sells electricity to distribution utilities, some
of which are its subsidiaries, at wholesale tariffs regulated by the Bangladesh Energy
Regulatory Commission (BERC). Distribution utilities then supply electricity to end-users
at a retail tariff, also regulated by BERC. The categories of wholesale and retail tariffs are
shown in Table 10. Categories G-1 and I-1 through I-4 are wholesale tariffs, while the
remaining are retail tariff categories. In 2013–14, a total of 29.6 TWh of electricity was
sold by BPDB to distribution utilities, and Tk135.3 billion was billed; this means an
average wholesale tariff of Tk4.6 /kWh ($0.059/kWh), which only recovers 78 per cent of
the BPDB’s procurement costs, or 73 per cent of overall costs. The retail customers of
BPDB were charged Tk42,749 million for 8,456 GWh delivered (distribution system loss
was 12 per cent), which was the equivalent of Tk5/kWh, higher than wholesale tariff but
27
The reference exchange rate used in this section is 1 USD = 78 Tk (Bangladeshi taka).

124
still lower than the overall procurement costs. The implication of this is that BPDB’s net
operating income was a loss of $647 million. The accumulated deficit in BPDB’s balance
sheet is $4.37 billion28
, given a total asset of $6.13 billion. The company’s net cash flow is
negative in the order of Tk45.4 billion ($584 million), but receives Tk61 billion ($782
million) from the government as budgetary support.29
As for the cost recovery of distribution utilities, DESCO and DPDC are sampled. In 2013–
14, DESCO paid Tk5.4/kWh to BPDB and another Tk0.23/kWh to PGCB, a wheeling
charge to recover the costs for the transmission grid operator (DESCO, 2014). Meanwhile,
its effective retail tariff charge (after accounting for distribution system loss) is Tk6/kWh.
In the same year, DPDC paid BPDB Tk5.34/kWh and the wheeling charge to PGCB, also
achieving an effective retail tariff charge of Tk6/kWh (DPDC, 2014). A survey of the
financial statements of PGCB reveals that the revenue from wheeling charges and other
operating incomes is enough to cover operating expenditure, depreciation, and financing
costs. This means that the systemic difference between operating costs and income is
contained within BPDB’s books.
In the Bangladeshi power sector, the prevailing dynamic is one of demand growth
continually outstripping the ability to provide stable supply (Figure 52). Although installed
capacity caught up with peak demand in 2010, peak generation falls under peak demand,
constrained by fuel shortage and generator outages due to lack of maintenance.
Transmission and distribution losses, estimated to be 14 per cent in total, further detract
from the supply of electricity available to meet demand.
28
This is almost five times larger than the accumulated deficit in TANESCO’s balance sheet. 29
This is the equivalent of 0.5% of the country’s GDP of Tk135,09 billion.

125
Table 10: Categories of BERC-regulated wholesale and retail tariffs (Data source:
BPDB, 2015a)
Category Use Capacity
limit
A. Residential light & power Charged for single meter in a dwelling place 50 kW
B. Agricultural pumping Charged for single meter for irrigation and
land drainage
50 kW
C. Small industrial Charged for single meter for small scale
production
50 kW
D. Non-residential light &
power
Charged for single meter in public
establishments
50 kW
E. Commercial Charged for single meter for offices and
businesses
50 kW
F. Medium voltage general
purpose
Charged at consumer sub-station 5 MW
G. Extra high voltage
1) DESA
2) General
1) Charged to DPDCL (successor of
DESA)
2) All consumer receiving at 132 kV
15 to 150
MW
H. High voltage general
purpose
All non-PBS consumers receiving at 33 kV at
own sub-station
15 MW
I. High voltage bulk supply
for
1) PBS
2) DESCO
3) West Zone
4) BPDB
PBS consumers receiving at 33 kV at own
sub-station
15 MW
J. Street light and water
pumps
Charged for a single meter for street lighting
and drinking water pumping stations
50 kW

126
Figure 52: Evolution of installed capacity, demand, and peak generation in
Bangladesh (Data source: BPDB)
There are several factors that drive demand in electricity. Given that Bangladesh has not yet
reached universal access to electricity, a significant number of new customers is added each
year to the grid. From 2012 to 2013, the number of connected consumers on BPDB’s
distribution boards grew by 9.3 per cent. This is effectively the most important contribution
to demand. The demand per connected consumer is also growing, because the current level
is still below the world average. However, the growth is less significant: in 2012 the
average electricity consumption per connected end-user of BPDB was 2,899 kWh, and this
grew by 0.5 per cent in 2013 to reach 2,915 kWh.30
Finally, the population of the country is
also growing at 1.4 per cent per year.
Since access to and consumption of electricity is perceived positively, their measures are
used as government policy goals. Rather than actively managing demand, the current
structure leaves the supply side to catch up with demand and fill the gap between them. In
30
The average consumption per connected customer is significantly higher than the per capita consumption of
electricity, because a large percentage of the population are not connected to the grid. Demand per consumer
will be more accurate with disaggregated data that distinguishes between end-users of different types.

127
the short term, the increase of electricity generated is limited by the shortage of natural gas
and the net capacity available, while it also simultaneously undermined by absolute
distribution losses which grow with electricity transmitted over the network. In the long
term, the increase of generation capacity is limited by the failure to maintain existing
capacity, construction time, technical expertise, and financing required.
The main solution adopted by BPDB, the central actor within the power sector, has been to
shorten construction time and avoid fuel shortages by installing liquid fuel-fired capacity
that can be quickly procured. The financing constraint is addressed by signing PPAs with
generator rental companies which provide the investment required for obtaining and
installing the generation units. The contracted companies are compensated in the future via
capacity charges and pass-through of their fuel charges. The average cost of rental power
paid by BPDB in 2013 was Tk10.12/kWh, or $0.13/kWh, almost 70 per cent higher than
the effective retail tariff charged to end-users, and 120 per cent higher than the average
wholesale tariff charged to distribution utilities.
It was hoped that the emergency would be temporarily relieved by rental power, while
larger-scale projects are planned concurrently to expand generation capacity. However, it
was found that the implementation of the Power System Master Plan was taking longer
than anticipated, and ‘some flaws seem to have cropped in’ that led to allegations of
improper power plant investor behaviour (Mujeri & Chowdhury, 2013, p. 34). The single
buyer has high spending needs (the need to pay for liquid fuel and high capacity charges),
while revenue recovered through wholesale tariffs is not enough to cover these costs. This
leads to high accumulated losses in BPDB’s books. Therefore, day-to-day operation of
BPDB is sustained by injection of government support. Transmission and distribution
utilities, which are the vehicles through which network expansion investment are made,
have healthy financial positions because the margin between the regulated retail tariff and
the regulated wholesale tariff is able to sustain their operations. Although contained within
BPDB, the intervention by the state is in no way small – measuring 0.5 per cent of national
GDP.

128
Gas sector
The shortage of gas, one of the most serious constraints limiting power generation using
existing capacity with affordable fuels, has its root cause in the development of the
Bangladeshi gas sector. The first oil and gas exploratory activity took place during the
1890s, but commercial production of natural gas in Bangladesh only began in 1960, due to
disruption by the Second World War and the Independence movement in India. Of 23
discovered gas fields, 17 are currently in production. It was estimated that 10.8 Tcf of 20.6
Tcf recoverable natural gas reserve remained by June 2011. Daily gas production capacity
in 2014 was 2,200 MMcfd, which could be sustained by the existing recoverable reserve
figure for 13.4 years if it were to stay at the same level.
Figure 53: Historical and forecasted demand for natural gas in Bangladesh (Data
source: Petrobangla)
As early as 1980, 37 per cent of natural gas produced was used for power generation, which
accounted for 59 per cent of all power generation. As shown in Table 9, 58 per cent of
natural gas produced in Bangladesh was used for power generation in 2013. Of the
remainder, 16.9 per cent was used in industrial production, 12.3 per cent was used by the
residential sector, 7.5 per cent was used as non-energy feedstock such as in fertilizer

129
production, and 5 per cent was used for road transport through compressed natural gas
vehicles (one-third of all transport energy uses). Between 1990 and 2013, the annual
average growth rate of gas demand in different sectors was highest in compressed natural
gas (including a rapid burst between 2002 and 2008), industry, and domestic sectors
(Figure 54).
Figure 54: Compound growth rate of gas demand in different sector since 1990
(Source: Petrobangla)
The Bangladesh Oil, Gas, and Mineral Corporation (Petrobangla) is the leading institution
in the gas sector. It is responsible for all state-owned assets in the gas industry, with
subsidiaries involved in all segments of the gas supply chain: exploration and production,
production of compressed natural gas and liquefied petroleum gas, transmission, and
distribution. At first, gas was only produced by state entities, and a uniform tariff that left
minimal margins for gas sector entities was used. This arrangement discouraged private
investment in the gas sector; consequently, the country decided to offer Production Sharing
Contracts (same as PSAs) in 1996. According to Bangladesh’s model PSC, the contractor
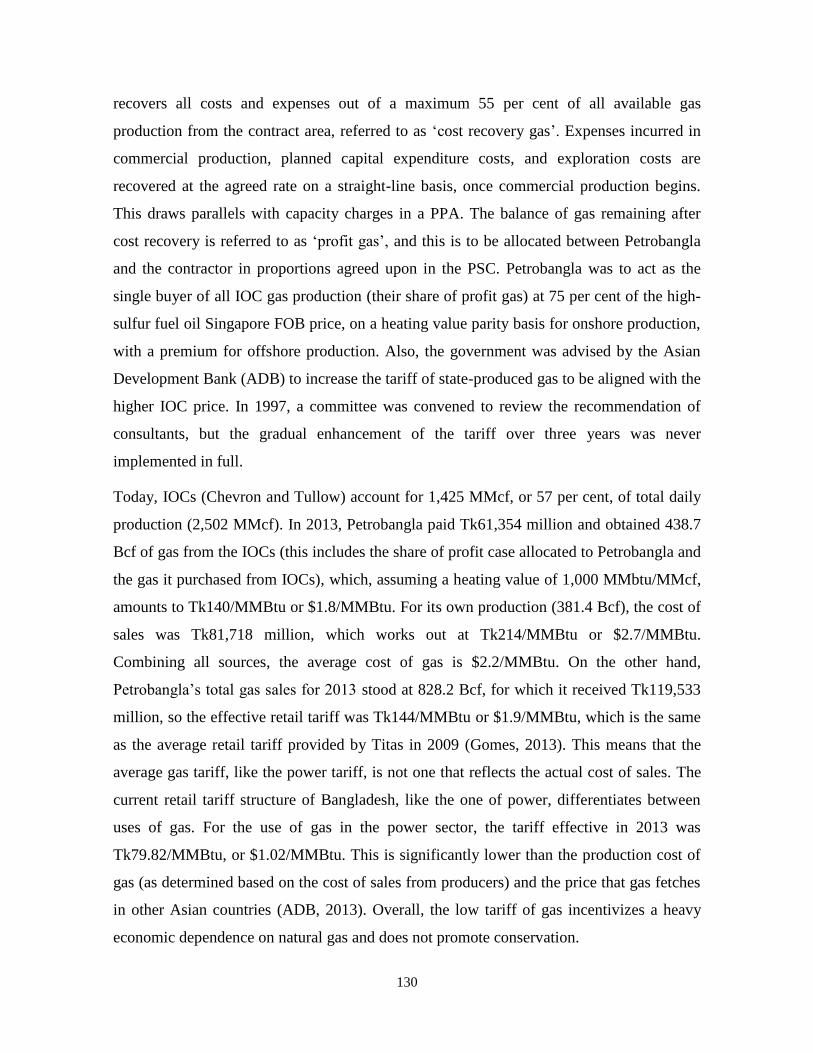
130
recovers all costs and expenses out of a maximum 55 per cent of all available gas
production from the contract area, referred to as ‘cost recovery gas’. Expenses incurred in
commercial production, planned capital expenditure costs, and exploration costs are
recovered at the agreed rate on a straight-line basis, once commercial production begins.
This draws parallels with capacity charges in a PPA. The balance of gas remaining after
cost recovery is referred to as ‘profit gas’, and this is to be allocated between Petrobangla
and the contractor in proportions agreed upon in the PSC. Petrobangla was to act as the
single buyer of all IOC gas production (their share of profit gas) at 75 per cent of the high-
sulfur fuel oil Singapore FOB price, on a heating value parity basis for onshore production,
with a premium for offshore production. Also, the government was advised by the Asian
Development Bank (ADB) to increase the tariff of state-produced gas to be aligned with the
higher IOC price. In 1997, a committee was convened to review the recommendation of
consultants, but the gradual enhancement of the tariff over three years was never
implemented in full.
Today, IOCs (Chevron and Tullow) account for 1,425 MMcf, or 57 per cent, of total daily
production (2,502 MMcf). In 2013, Petrobangla paid Tk61,354 million and obtained 438.7
Bcf of gas from the IOCs (this includes the share of profit case allocated to Petrobangla and
the gas it purchased from IOCs), which, assuming a heating value of 1,000 MMbtu/MMcf,
amounts to Tk140/MMBtu or $1.8/MMBtu. For its own production (381.4 Bcf), the cost of
sales was Tk81,718 million, which works out at Tk214/MMBtu or $2.7/MMBtu.
Combining all sources, the average cost of gas is $2.2/MMBtu. On the other hand,
Petrobangla’s total gas sales for 2013 stood at 828.2 Bcf, for which it received Tk119,533
million, so the effective retail tariff was Tk144/MMBtu or $1.9/MMBtu, which is the same
as the average retail tariff provided by Titas in 2009 (Gomes, 2013). This means that the
average gas tariff, like the power tariff, is not one that reflects the actual cost of sales. The
current retail tariff structure of Bangladesh, like the one of power, differentiates between
uses of gas. For the use of gas in the power sector, the tariff effective in 2013 was
Tk79.82/MMBtu, or $1.02/MMBtu. This is significantly lower than the production cost of
gas (as determined based on the cost of sales from producers) and the price that gas fetches
in other Asian countries (ADB, 2013). Overall, the low tariff of gas incentivizes a heavy
economic dependence on natural gas and does not promote conservation.
131
As a result of below-cost gas tariffs, the power, industrial, and even transport sectors
depend heavily on natural gas. Estimates from BP, Petrobangla, and the EIA indicate a
growing supply-demand gap in the natural gas sector of Bangladesh. The ensuing narrative
is one that mirrors the structure of that in the power sector: the possible growth in gas
supply capacity is outstripped by the rapid growth in demand. On the supply side, there
exist financial and technical constraints for the NOCs to develop offshore gas fields, and
therefore they are almost completely dependent on IOCs to pursue offshore exploration.
Given that the natural gas produced in Bangladesh is consumed domestically rather than
exported, the terms of the PSC and the tariff at which IOCs can sell their profit gas will
determine their interest in the country. Currently, commercial returns are not at a level that
incentivizes IOC involvement. Furthermore, lack of addition/replenishment to supply
capacity is not the only problem plaguing the gas sector. Also to blame are distribution
losses and the use of gas in inefficient power generators, which can be partially attributed to
a pricing of gas which does not reflect its just value.
Learning point for Tanzania
The case study of Bangladesh is a valuable one for Tanzania, given the many similarities in
the recent development of their power sectors. Moreover, Bangladesh’s power sector has
developed to the stage which Tanzania aspires to reach in the future, namely: vertical
unbundling between generation, transmission, and distribution; horizontal unbundling
within generation and distribution; and the establishment of separate wholesale,
transmission, and retail tariffs.
The case study reveals that the availability of a domestic fuel for power generation and a
low tariff for its use in the power sector do not guarantee unconstrained growth of the
power sector’s ability to meet demand. Instead, the same problem encountered in the power
sector – a demand that is growing at rate that cannot be sustained by local conditions –
could be replicated in the gas sector. When the tariff of natural gas, a depletable resource
that is extracted, is set to recover strictly necessary costs for extraction instead of the
opportunity cost of its use, high and inefficient demand for gas is likely to develop in all
sectors of the economy. This becomes problematic when the country in question does not

132
have the developed technical and financial capacity to develop additional gas resources or
alternative energy sources, bringing development to a halt. The case study also illustrates
how the contracting of emergency power, perceived as a temporary solution, consumed
project management capacity and cash flow from the public utility, potentially weakening
the power sector’s ability to develop more permanent forms of power generation capacity.
Finally, decentralized rural electrification through PBS is very effective, but it also
contributes to the rapid build-up of demand and stresses the fragile power system
infrastructure.
Côte d'Ivoire
For Côte d’Ivoire, the 2000 to 2010 decade was marked by a series of extremely disruptive
events: a military coup overthrew the ruling president in 1999, an armed rebellion split the
nation into the rebel-held north and the government-controlled south between 2002 and
2007, and violent events after the long-delayed 2010 presidential elections left 3,000 people
dead and 500,00 displaced (BBC, 2016). Despite these socio-political challenges, the
performance of Côte d’Ivoire’s power sector relative to its neighbours has won it praise in
the international press. The case study of Côte d’Ivoire is a story with unexpected turns:
stagnant demand due to civil unrest and sluggish rural electrification was leveraged by the
country to become a regional powerhouse in electricity export. But, the limitation of its
domestic natural gas production is gradually becoming a constraint for Côte d’Ivoire’s
power sector. Diversification in generation capacity is sought through the procurement of
additional hydro generation capacity and diversification in gas supply through planned
procurement of LNG from Nigeria.
Power sector
Like Tanzania, Côte d'Ivoire opened its power sector to private participation in the early
1990s. In 1990, the Ivorian government signed a concession contract with a private
company, the Compagnie Ivoirienne d’Electricité (CIE), granting it a concession covering
the purchase, transmission, and distribution of electricity in exchange for a lease fee
(Traoré, 2013). The 15-year contract was renewed in 2005 for another 15 years. Meanwhile,

133
the state retained the ownership rights to the power sector infrastructure. Currently, the
state-owned company Société des Énergies de Côte d’Ivoire (CI-Energies) is responsible
for managing the publicly owned assets. It is also responsible for planning investment in
the sector and for allocating the tariff revenue that CIE collects to different stakeholders in
the power sector. CIE, the private concessionary, has no contractual obligation to invest
capital in the sector.
The state-owned generation capacity is a portfolio of predominantly hydro-based facilities,
all commissioned before 1990. In 1995, the first IPP of Côte d’Ivoire – Compagnie
Ivoirienne de Production d’Electricité (CIPREL) – commissioned its natural gas-fired
generator of 99 MW, followed by a 111 MW unit in 1997. CIPREL later expanded its
capacity twice, to reach a total installed capacity of 543 MW (IFC, 2013). The other IPP,
Azito, commissioned its expansion generators in 2016, adding 139 MW to 300 MW of gas
generators. Both companies have signed Build-Own-Operate-Transfer type contracts with
the government, so their assets are to be transferred to the government at the end of their
contracts (Malgas & Gratwick, 2008). Since 2010, Aggreko has been actively generating
power in the country with its rental gas power generators and its contract is now extended
until early 2017 (Aggreko, 2015b).
Figure 55: Breakdown of generation capacity in Côte d’Ivoire (Based on data from:
Aggreko, 2015b; Globeleq, 2015; IFC, 2013; Malgas & Gratwick, 2008)
Extensive study of the development of IPPs in Côte d’Ivoire has revealed that there were
project specific and country specific factors that have positively influenced the outcome of
these projects (Malgas & Gratwick, 2008). For the CIPREL project, the presence of
favourable equity partners such as the Société d’Aménagement Urbain et Rural (SAUR), a

134
company with two decades of experience operating in the country, and Electricité de France
(EDF), a reputable public company, has facilitated the negotiation of the IPP. SAUR’s
parent company Bouygues, a French industrial group, also controls the CIE, the private
company given concession over the ensemble of electricity sector activities, and Foxtrot,
the most important gas producer in Côte d’Ivoire. Such pervasive presence of a single firm
across all major functions of the supply chain may be unique, and it is believed that this
provides the firm with influence over the operational risks, increasing its willingness to
invest. Azito was procured at a time of abundance rather than scarcity (there was no
impending shortage of electricity due to droughts, and the country’s growth was positively
perceived), therefore interest in the sector was at a level that warranted an international
competitive tender, leading to the award of the contract to the lowest bidder.

135
Figure 56: Electricity generation, consumption, and exports in Côte d'Ivoire between
1980 and 2012 (Data source: EIA)
Between 1995 and 2005 electricity demand was stagnant, partly due to civil unrest in the
2000s (Figure 56). Côte d’Ivoire took advantage of its supply and demand mismatch to
become the main electricity exporter in the region, given that it has established transmission
links with Ghana, Togo, Benin, Mali, and Burkina Faso. CIE was able to maintain
incoming revenues, bolstered by exports, even when revenues from serving domestic
demand waned. The neighbouring countries were eager off-takers of electricity from Côte
d’Ivoire, given their experiences of power deficit due to droughts and a general lack of
power generation capacity. In 2002, the peak year for exports, 1,600 GWh or 31 per cent of
total generation were exported.

136
Since 2005, the growth rate of consumption has been growing faster than that of supply
(except for 2010–11, the year of post-election violence). At the same time, interconnections
with Liberia, Sierra Leone, and Guinea have been planned so that these countries can, in the
short term, import electricity from Côte d’Ivoire, which has relatively more favourable
conditions (Sieh, 2015). This means that the Ivoirian authority, still responsible for sector
investment planning, needs to maintain supply growth in order to meet both domestic
demand and export commitments. Given an existing installed capacity of 1,874 MW, CI-
Energies has set targets of reaching 3,290 MW by 2020 and 4,922 MW by 2030, through a
mix of new privately funded thermal generation and publicly funded hydro generation
capacity (Traoré, 2013). A 275 MW hydropower plant owned by the government is
currently under construction by Chinese state-owned Sinohydro, financed by a low-interest
loan from the Chinese Exim bank of $500 million (Reuters, 2013). Songon, a planned gas-
fired project of 375 MW, is a good example of private sector initiatives. The gas-to-power
project, developed by the domestic IPP Starenergie2073, will include the development of
purpose-built LNG import infrastructure and a floating storage regasification unit (FSRU)
(ESI Africa, 2015) .
The sector regulator Autorité Nationale de Régulation (ANARE) is responsible for
proposing electricity tariffs to the State, but it does not have the right to set them. Between
2007 and 2012, the government increased tariffs by 10 per cent for three of the seven
customer classes available. Nevertheless, the tariff hike did not increase at the same rate as
the costs for power generation, leading to a structural deficit of funds in the sector. The
increase in generation costs is due to increases in the cost of natural gas used, since the
price of gas is indexed to West Texas Intermediate (WTI), a benchmark for oil pricing
(ANARE, 2013). CI-Energies allocate the tariff revenues collected by CIE in a particular
order: first, the management fees of CIE are paid; second, the IPPs and gas suppliers are
paid; and finally, what funds are left are then allocated to major maintenance and
refurbishment projects. The accumulated deficit is carried by the Government of Côte
d’Ivoire, by renouncing the portion of gas sales to which it is entitled. It is also carried by
IPPs and gas suppliers in the form of arrears, when governmental measures are insufficient
to account for the deficit. Government subsidy to the sector in 2011 grew to 1.2 per cent of
GDP, up from 0.4 per cent in 2009 (IMF, 2012).

137
In 2012, negotiations with gas producers led to a decrease in the price of gas from more
than $9/MMBtu to $5.5/MMBtu, which considerably lowered the revenue requirement for
power generation (Figure 57). The reduction of commercial and technical losses, about 26
per cent in 2012, is also planned to bring the sector back to financial sustainability.
Currency depreciation is not believed to be a factor in causing the deficit, since the CFA
franc has been pegged to the Euro since 2002, and to the French franc 1994–2002, meaning
that Côte d’Ivoire has not experienced currency devaluation as in the case of other African
countries such as Egypt and Ghana (Malgas & Gratwick, 2008).
Figure 57: Evolution of revenue requirement and tariff collected in Côte d'Ivoire
(Based on data from: ANARE, 2013, 1 USD = 600 FCFA)

138
Figure 58: Evolution of rural electrification measures for Côte d'Ivoire (Base on data
from: Ministry of Petroleum and Energy, 2012)
Several metrics exist to quantify the extent of electrification of Côte d’Ivoire (Figure 58). In
2012, the access rate (the percentage of population living in electrified areas) was 74 per
cent, the coverage rate (the number of population centres electrified over the total number
of population centres) was 34 per cent, and the electrification rate (the number of
households with electricity over the total number of households) was 25 per cent. The
difference between the first and the third measures could be perceived as the ‘under-grid’
population: those who live in regions where electricity services are available but do not
have access to them at home due to high costs. The figures suggest that this is a large
proportion of the total population. Since 1990, the mandate of rural electrification was
passed around multiple state-controlled institutions and has never been made a key priority.
Between 1990 and 1998 it was the mandate of the monopoly Energie Electrique de Côte
d’Ivoire (EECI), which lost the management rights of the electricity sector to CIE. After the
dissolution of EECI in 1998, Société d’Opération Ivoirienne d’Electricité was made
responsible for rural electrification, but it was also dissolved in 2011. Currently, the public
sector company CI-Energies has responsibilities over rural electrification. In consequence,
the electrification rate between 2000 and 2012 has remained static, while the cover rate and
access rate have both improved marginally.

139
Gas sector
Like Tanzania, the use of natural gas in Côte d’Ivoire began with its IPPs. In late 1995,
natural gas from Panthère field was delivered by pipeline to the commercial capital Abidjan,
where the CIPREL generators are located. Companies there produce all of the natural gas
used in Côte d’Ivoire: AFREN, CNR, and Foxtrot, after signing PSAs with the national oil
company, PETROCI. These independents (as opposed to IOCs) are also involved in the
production of oil. By the end of December 2014, 232 MMcf of gas was produced per day
(roughly 85 Bcf per year), of which 70 per cent was used for electricity production
(Ministry of Petroleum and Energy, 2015). Natural gas uses in other sectors include the
production of NGL and the heating of industrial processes. At this rate, the proven reserves
of 1.1 Tcf can only sustain existing power generation for 18 years. This is comparable to
Tanzania’s current reserve production ratio, if only the near-shore reserves are considered.
Current production capacity is below the maximum needs for gas of the power sector by
about 100 MMcf/day. The shortage of gas, more pronounced during peak hours, has led
several gas-fired generation stations with dual-fuel capability to occasionally use liquid fuel
for power generation since 2006 (ANARE, 2013). Increasing mining activities could
further increase the size of this gap (the mines have the option of directly procuring gas to
run their own generators or to connect the mines to the existing power grid).
Although IPPs are the main off-taker of gas, the existing gas supply agreements are
contracts signed by the government and the natural gas producers, therefore the Ivoirian
government takes the lead in securing gas supplies for the power sector. A Technical Gas-
Electricity Committee (headed by ANARE and including all gas producers, all IPPs, CIE,
CI-Energies, PETROCI, and the two ministry directorates responsible for electricity and
petroleum) meets bimonthly for mutual coordination and mediation. In case of
extraordinary events, the committee is responsible for analyzing the incidents, determining
the utilization of gas production, distribution, and consumption equipment in the short term,
and nominating the quantity of gas supplied to the power sector, to PETROCI, and a refiner
(the most important industrial customers). The most important gas producer, Foxtrot, is
active in exploration, but these efforts are believe to be only enough to secure production
for the next 10 years (Reuters, 2014). As for import options, the Ivorian government has
started collaboration with Nigeria to receive LNG deliveries and, eventually, after the

140
extension of the West African Gas Pipeline (WAGP), piped natural gas (Chinonso, 2015).
Given the perceived unreliability of WAGP supply, it is believed Côte d’Ivoire will be
dependent on the more secure LNG supplies. The current LNG supply glut in the global
market means that the importers are likely to have more bargaining power in the
negotiation of gas supply contracts, which is advantageous to Côte d’Ivoire’s current
position.
Learning point for Tanzania
In many ways, Côte d’Ivoire is very similar to Tanzania, especially in the development
timeline of its power and gas sectors. However, the nature of private sector presence, the
growth of power demand, and the natural gas endowment of the two nations are very
different.
The companies controlled by Bouygues span gas production, power production, and power
retail. Their influence has been considered mostly positive, given that this quasi-vertical
integration lowers the companies’ operational risks, which could increase the parent
company’s willingness to invest. The stagnant growth of power demand, partially attributed
to civil unrest and to non-aggressive rural electrification efforts, has been transformed into
a relative advantage for Côte d’Ivoire. The overcapacity available, procured on-time due to
smooth IPP construction and commissioning, has been used for export to neighbouring
countries, which bolstered Côte d’Ivoire’s reputation as a regional powerhouse, further
encouraging investment. As the country’s power demand growth accelerates, it is in a
relatively good position to attract private investment. The Ivoirian experience demonstrates
the critical nature of timing; the pacing of supply growth relative to demand growth. Once
supply (sourced at reasonable prices) is sufficient to cover existing demand with a
comfortable margin, it becomes easier to procure future supply, changing the dynamics of
power system planning from demand-pulled to supply-pushed. Although Côte d’Ivoire has
significantly less natural gas than Tanzania, which might be unfavourable in the long term
for its gas-to-power projects, the current global LNG market is more favourable to
importers than exporters, given the glut of LNG export project commissioned/to be
commissioned within a short period of time. While Tanzania’s plans for off-shore natural

141
gas development might be delayed, Côte d’Ivoire might be able to enjoy more competitive
LNG imports than would otherwise be the case.
However, the Ivorian model also exhibits some major weaknesses. The lack of institutions
dedicated to the cause of rural electrification is believed to be the cause of the stagnant
electrification rate since 2000. Also, high technical and commercial losses (26 per cent) are
experienced despite management of the whole sector by a single private company, since
that company is not incentivized/allowed to invest in power sector infrastructure.

142
Conclusion
In order to fulfill its aspiration to become a middle-income country, Tanzania is working on
improving infrastructure and service delivery in electricity provision, where $40 billion
investment is needed in the sector to meet rising demand and widening electrification
efforts from 2013 to 2035. In order to understand whether these important investments can
be secured in time, the institutional arrangements for investment in Tanzania’s power sector
have been presented. The track record in funnelling investment to the sector has been
surveyed, and possible organizational bottlenecks discussed. The tariff setting methodology
in place in Tanzania, as evidenced through its latest tariff review, has been studied in detail,
and areas of improvement have been suggested. Finally, international experiences from
Bangladesh and Côte d’Ivoire in co-development of their power and gas sectors were
presented in order to provide insights to Tanzanian stakeholders.
Among the five investment vehicles available (TANESCO, IPPs, EPPs, SPPs, PPPs),
investment through TANESCO has remained important throughout the development of the
power sector, but it has rested upon the contribution from government and development
partner grants, despite stated government interest in transitioning to a self-sustained market-
led model. The financial health of TANESCO is central to all investment vehicles, since it
is either directly responsible for investment, or indirectly, as the counter party to the variety
of PPAs available with IPPs, EPPs, SPPs, or PPPs. During 2011–13, the financial position
of TANESCO was negatively impacted by the increase in costs of its purchase electricity,
while the regulated tariff that it charges has not changed. The increase in costs is partially
attributable to non-favourable hydrology, partially attributable to the depreciation of the
Tanzanian shilling against the US dollar, the currency in which PPAs are denominated.
The experiences of channelling private equity and commercial loans via IPPs and EPPs
have had mixed outcomes, where the lack of due diligence during procurement and the
negotiation of the PPA often led to long and controversial legal disputes that incurred
significant indirect costs, as well as blemished the public perception of private investment
in Tanzania. The regulatory framework that Tanzania has set up for SPPs has attracted
international accolades, but the limited equity of domestic investors has led to a
correspondingly limited number of generation projects procured thus far. PPPs have not yet

143
materialized, but they have the possibility of leveraging Tanzania’s newly found gas
reserves into strategic, collaborative investments with China and becoming the most
important investment vehicle among the five. It has been highlighted that, even when the
power sector investments are forthcoming, it should not be forgotten that timely
investments in the gas sector are also required for the gas-to-power transition to be realized.
In the short term, this requires TANESCO to improve its payment records for its existing
gas supply contracts to encourage further development of near-shore reserves. In the long
term, this requires the government to carefully monitor the effect of its PSA terms and the
international gas market on its IOC partners’ willingness to invest in off-shore production.
Upon review of Tanzania’s power tariff setting mechanism, it has been found that the
methodology used by the regulator reflects the rate-making principles upheld by the
Tanzanian legislation in general. However, a core tension within Tanzania’s tariff setting
methodology is the trade-off between efficiency, sufficiency, and stability principles. The
ex ante assessment of TANESCO’s revenue requirement, a typical incentive-based price
cap regulation, is theoretically efficient but not robust: TANESCO’s costs of service are
subject to important external uncertainties like hydrology, currency depreciation, and global
fuel prices. In order to take revenue sufficiency into account, the regulator then needs to
periodically adjust tariffs based on ex post fuel costs and inflation rates. This diminishes the
regulator’s ability to maintain tariff stability, which might impact certain classes of
customers more than others (lifeline rate customers and domestic industries).
The Bangladeshi experience reveals that the availability of a domestic fuel for power
generation and a low tariff for its use in the power sector is not enough to sustain
unconstrained growth of electricity demand. Instead, the same problem encountered in the
power sector – a demand that is growing at a rate that cannot be sustained by local
conditions – could be replicated in the gas sector. Because natural gas is a depletable
resource, the tariff for its consumption needs to be determined especially carefully, so that
it does not incentivize its inefficient use throughout the economy or discourage investors
with the technical and financial resources needed to continue the development of gas within
the country. The case study of Côte d’Ivoire reveals that the pacing of supply growth
relative to demand growth is of critical importance. Experiencing stagnant demand due to
civil unrest and slow rural electrification, the surplus of generation capacity procured in the

144
late 1990s was leveraged by Côte d’Ivoire, which became the most important regional
electricity exporter. Expansion of generation capacity following that has been marked by a
supply-pushed rather than demand-pulled dynamic, and investor interest has been abundant.
Even then, the Ivoirian case has also shown that gas supply development (changes in gas
price and bottlenecks in gas production) could jeopardize a power sector in relatively good
health.

145
Appendix I: Data
Table 11: List of historical and planned generation capacity in Tanzania (Data source: (Greacen, 2014; Kihwele et al., 2012; Lazimah, 2014; Ministry of
Energy and Minerals, 2013a; The United Republic of Tanzania Ministry of Finance, 2014; Tsakhara, 2015) )
Power type Name Owner Grid Type Capacity Year commissioned Year planned
TANESCO Hale TANESCO On-grid Hydro 21 1967
TANESCO Nyumba ya Mungu TANESCO On-grid Hydro 8 1968
TANESCO Kigoma TANESCO Off-grid Oil 12.5 1973
TANESCO Kidatu TANESCO On-grid Hydro 204 1975
TANESCO Liwale TANESCO Off-grid Oil 0.8 1975
TANESCO Mtera TANESCO On-grid Hydro 80 1979
TANESCO Bukoba TANESCO Off-grid Oil 2.4 1984
TANESCO Songea TANESCO Off-grid Oil 8.2 1987
TANESCO Uweba mini hydro TANESCO On-grid Hydro 0.843 1989
TANESCO Biharamulo TANESCO Off-grid Oil 1 1991
TANESCO Mafia TANESCO Off-grid Oil 0.9 1991
TANESCO Mpanda TANESCO Off-grid Oil 2.7 1991
TANESCO Ngara TANESCO Off-grid Oil 0.852 1991
TANESCO Tunduru TANESCO Off-grid Oil 1.98 1992
TANESCO New Pangani Falls TANESCO On-grid Hydro 68 1995
TANESCO Dodoma TANESCO TANESCO On-grid Oil 7.4 2000
TANESCO Kihansi TANESCO On-grid Hydro 180 2000
IPP Tegeta IPTL IPTL On-grid Oil 103 2002
IPP Songas Songas On-grid Gas 189 2004
TANESCO Ubungo I TANESCO On-grid Gas 102 2007
TANESCO Ludewa TANESCO Off-grid Oil 1.27 2008
TANESCO Mbinga TANESCO Off-grid Oil 2 2008
TANESCO Tegeta TANESCO TANESCO On-grid Gas 44 2009
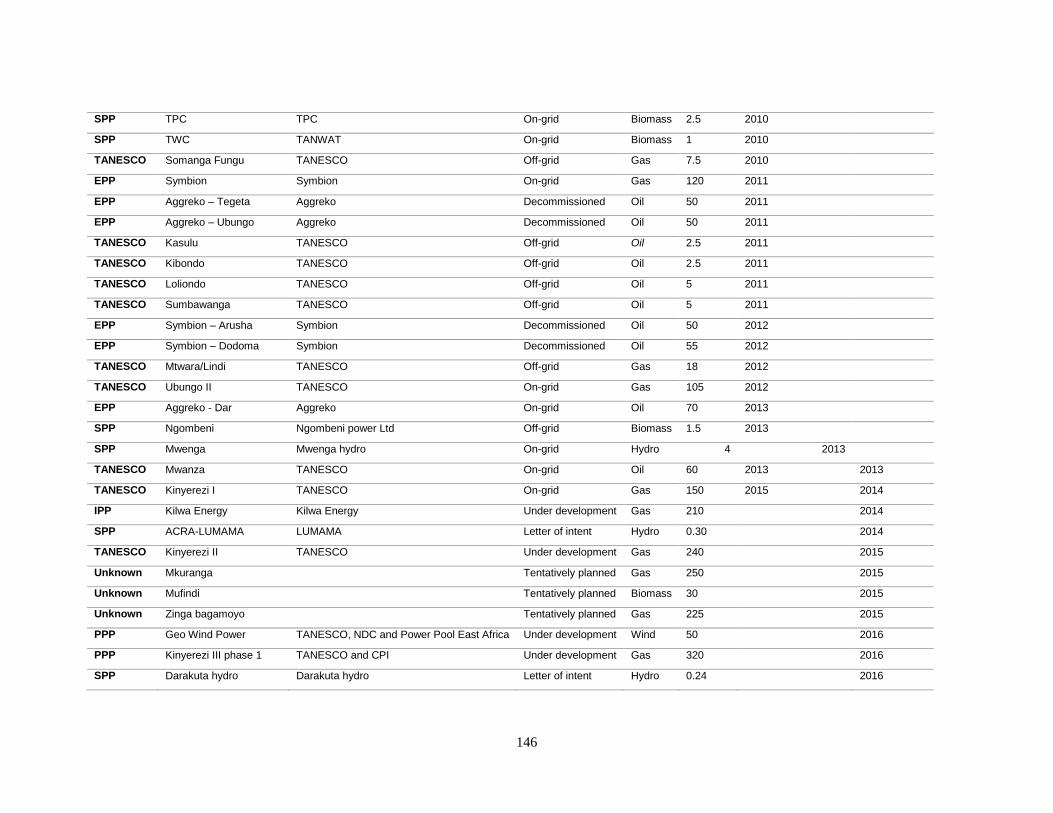
146
SPP TPC TPC On-grid Biomass 2.5 2010
SPP TWC TANWAT On-grid Biomass 1 2010
TANESCO Somanga Fungu TANESCO Off-grid Gas 7.5 2010
EPP Symbion Symbion On-grid Gas 120 2011
EPP Aggreko – Tegeta Aggreko Decommissioned Oil 50 2011
EPP Aggreko – Ubungo Aggreko Decommissioned Oil 50 2011
TANESCO Kasulu TANESCO Off-grid Oil 2.5 2011
TANESCO Kibondo TANESCO Off-grid Oil 2.5 2011
TANESCO Loliondo TANESCO Off-grid Oil 5 2011
TANESCO Sumbawanga TANESCO Off-grid Oil 5 2011
EPP Symbion – Arusha Symbion Decommissioned Oil 50 2012
EPP Symbion – Dodoma Symbion Decommissioned Oil 55 2012
TANESCO Mtwara/Lindi TANESCO Off-grid Gas 18 2012
TANESCO Ubungo II TANESCO On-grid Gas 105 2012
EPP Aggreko - Dar Aggreko On-grid Oil 70 2013
SPP Ngombeni Ngombeni power Ltd Off-grid Biomass 1.5 2013
SPP Mwenga Mwenga hydro On-grid Hydro 4 2013
TANESCO Mwanza TANESCO On-grid Oil 60 2013 2013
TANESCO Kinyerezi I TANESCO On-grid Gas 150 2015 2014
IPP Kilwa Energy Kilwa Energy Under development Gas 210 2014
SPP ACRA-LUMAMA LUMAMA Letter of intent Hydro 0.30 2014
TANESCO Kinyerezi II TANESCO Under development Gas 240 2015
Unknown Mkuranga Tentatively planned Gas 250 2015
Unknown Mufindi Tentatively planned Biomass 30 2015
Unknown Zinga bagamoyo Tentatively planned Gas 225 2015
PPP Geo Wind Power TANESCO, NDC and Power Pool East Africa Under development Wind 50 2016
PPP Kinyerezi III phase 1 TANESCO and CPI Under development Gas 320 2016
SPP Darakuta hydro Darakuta hydro Letter of intent Hydro 0.24 2016
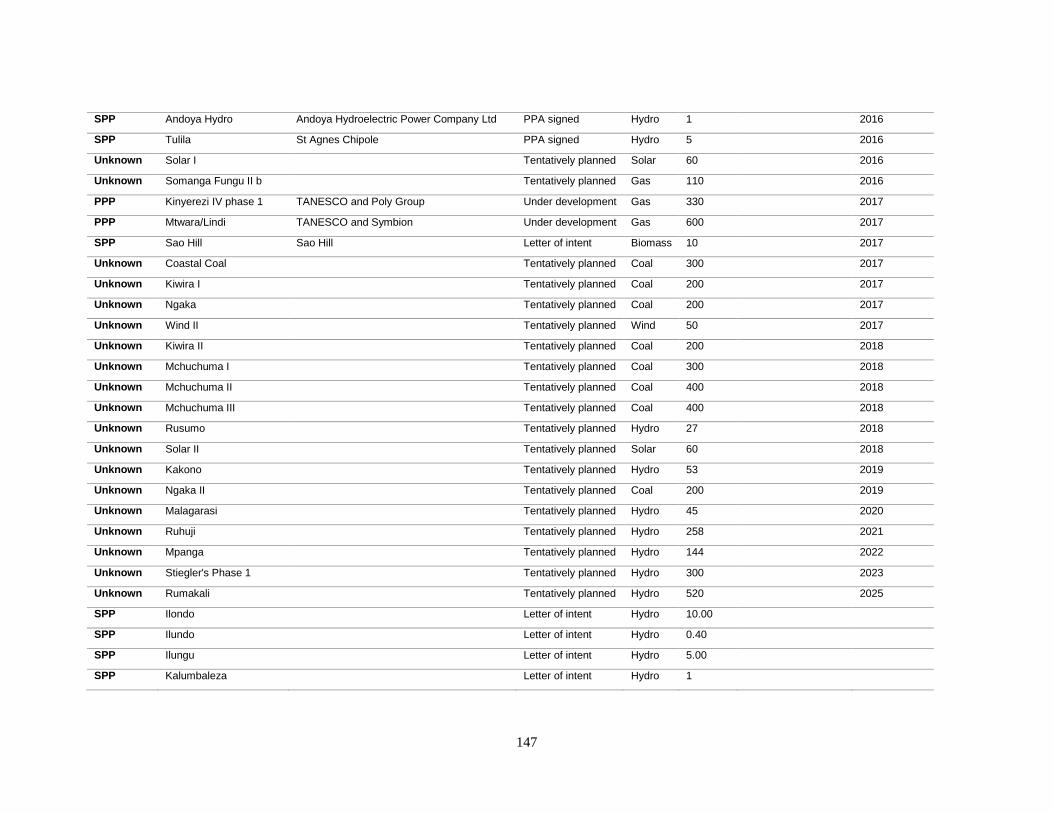
147
SPP Andoya Hydro Andoya Hydroelectric Power Company Ltd PPA signed Hydro 1 2016
SPP Tulila St Agnes Chipole PPA signed Hydro 5 2016
Unknown Solar I Tentatively planned Solar 60 2016
Unknown Somanga Fungu II b Tentatively planned Gas 110 2016
PPP Kinyerezi IV phase 1 TANESCO and Poly Group Under development Gas 330 2017
PPP Mtwara/Lindi TANESCO and Symbion Under development Gas 600 2017
SPP Sao Hill Sao Hill Letter of intent Biomass 10 2017
Unknown Coastal Coal Tentatively planned Coal 300 2017
Unknown Kiwira I Tentatively planned Coal 200 2017
Unknown Ngaka Tentatively planned Coal 200 2017
Unknown Wind II Tentatively planned Wind 50 2017
Unknown Kiwira II Tentatively planned Coal 200 2018
Unknown Mchuchuma I Tentatively planned Coal 300 2018
Unknown Mchuchuma II Tentatively planned Coal 400 2018
Unknown Mchuchuma III Tentatively planned Coal 400 2018
Unknown Rusumo Tentatively planned Hydro 27 2018
Unknown Solar II Tentatively planned Solar 60 2018
Unknown Kakono Tentatively planned Hydro 53 2019
Unknown Ngaka II Tentatively planned Coal 200 2019
Unknown Malagarasi Tentatively planned Hydro 45 2020
Unknown Ruhuji Tentatively planned Hydro 258 2021
Unknown Mpanga Tentatively planned Hydro 144 2022
Unknown Stiegler's Phase 1 Tentatively planned Hydro 300 2023
Unknown Rumakali Tentatively planned Hydro 520 2025
SPP Ilondo Letter of intent Hydro 10.00
SPP Ilundo Letter of intent Hydro 0.40
SPP Ilungu Letter of intent Hydro 5.00
SPP Kalumbaleza Letter of intent Hydro 1

148
SPP Kikuletwa II Hai Letter of intent Hydro 7.5
SPP Kishapu Letter of intent Solar 10.00
SPP Kitewaka Letter of intent Hydro 4.2
SPP KMRI - Symbion Kigoma KMRI-Symbion Letter of intent Biomass 3.30
SPP KMRI-Symbion Tunduru KMRI-Symbion Letter of intent Biomass 0.3
SPP Luganga Letter of intent Hydro 2.80
SPP Lugarawa Letter of intent Hydro 1.7
SPP Luswisi Ileje Letter of intent Hydro 4.70
SPP Lwega Letter of intent Hydro 5
SPP Lyamanji Letter of intent Hydro 2.3
SPP Mabuki Letter of intent Solar 10.00
SPP Mafia Letter of intent Solar 1.00
SPP Maguta Letter of intent Hydro 2.50
SPP Mapembasi hydro Mapembasi hydro Letter of intent Hydro 10.00
SPP Matembwe Letter of intent Hydro 0.5
SPP Mkumbara Letter of intent Biomass 5
SPP Momba Letter of intent Hydro 10.00
SPP Mpanda Letter of intent Solar 1.00
SPP Mpanga Letter of intent Hydro 5.8
SPP Nakatuta Letter of intent Hydro 10
SPP NextGen Solawazi NextGen Letter of intent Solar 2
SPP Nkwilo Letter of intent Hydro 2.90
SPP Sumbawanga Letter of intent Solar 2.00
SPP Tukuya EA Power Letter of intent Hydro 10
SPP Uzia Letter of intent Hydro 1.00
SPP Waste to Energy Letter of intent Biomass 5.00
SPP Yovi Letter of intent Hydro 2.00

149
Table 12: List of historical and requested electricity tariffs in Tanzania (Data source: EWURA, 2012a, 2013; TANESCO, 2013)
Data Date Component D1 0-75 kWh D1 above 75 kWh T1 T2 T3-MV T3-HV
Historical 01/06/2006 Service charge (TZS/month) 0.00 0.00 1785.00 6615.00 6615.00 6615.00
Historical 01/06/2006 Energy charge (TZS/kWh) 38.00 121.00 100.00 66.00 61.00 26.00
Historical 01/06/2006 Capacity charge (TZS/kVa/month) 0.00 0.00 0.00 7245.00 6720.00 3686.00
Historical 01/02/2007 Service charge (TZS/month) 0.00 0.00 1892.00 7012.00 7012.00 7012.00
Historical 01/02/2007 Energy charge (TZS/kWh) 40.00 128.00 106.00 70.00 65.00 28.00
Historical 01/02/2007 Capacity charge (TZS/kVa/month) 0.00 0.00 0.00 7680.00 7123.00 3907.00
Historical 01/01/2008 Service charge (TZS/month) 0.00 0.00 2303.00 8534.00 8534.00 8534.00
Historical 01/01/2008 Energy charge (TZS/kWh) 49.00 156.00 129.00 85.00 79.00 75.00
Historical 01/01/2008 Capacity charge (TZS/kVa/month) 0.00 0.00 0.00 9347.00 8669.00 4755.00
Historical 01/01/2009 Service charge (TZS/month) 0.00 0.00 2303.00 8534.00 8534.00 8534.00
Historical 01/01/2009 Energy charge (TZS/kWh) 49.00 156.00 129.00 85.00 79.00 75.00
Historical 01/01/2009 Capacity charge (TZS/kVa/month) 0.00 0.00 0.00 9347.00 8669.00 4755.00
Historical 01/01/2010 Service charge (TZS/month) 0.00 0.00 2303.00 8534.00 8534.00 8534.00
Historical 01/01/2010 Energy charge (TZS/kWh) 49.00 156.00 129.00 85.00 79.00 75.00
Historical 01/01/2010 Capacity charge (TZS/kVa/month) 0.00 0.00 0.00 9347.00 8669.00 4755.00
Historical 01/01/2011 Service charge (TZS/month) 0.00 0.00 2738.00 10146.00 10146.00 10146.00
Historical 01/01/2011 Energy charge (TZS/kWh) 60.00 195.00 157.00 94.00 84.00 83.00
Historical 01/01/2011 Capacity charge (TZS/kVa/month) 0.00 0.00 0.00 12078.00 10350.00 8610.00
Historical 01/01/2012 Service charge (TZS/month) 0.00 0.00 3841.00 14233.00 14233.00 14233.00
Historical 01/01/2012 Energy charge (TZS/kWh) 60.00 273.00 221.00 132.00 79.00 106.00
Historical 01/01/2012 Capacity charge (TZS/kVa/month) 0.00 0.00 0.00 16944.00 14520.00 12079.00
Historical 01/01/2013 Service charge (TZS/month) 0.00 0.00 3841.00 14233.00 14233.00 14233.00
Historical 01/01/2013 Energy charge (TZS/kWh) 60.00 273.00 221.00 132.00 118.00 106.00
Historical 01/01/2013 Capacity charge (TZS/kVa/month) 0.00 0.00 0.00 16944.00 14520.00 12079.00
Historical 01/01/2014 Service charge (TZS/month) 0.00 0.00 5520.00 14233.00 16769.00 0.00
Historical 01/01/2014 Energy charge (TZS/kWh) 100.00 350.00 306.00 205.00 163.00 159.00

150
Historical 01/01/2014 Capacity charge (TZS/kVa/month) 0.00 0.00 0.00 15004.00 13200.00 16550.00
Proposed 01/10/2013 Service charge (TZS/month) 0.00 0.00 5829.00 27250.00 27250.00 27250.00
Proposed 01/10/2013 Energy charge (TZS/kWh) 60.00 467.00 294.00 252.00 242.00 179.00
Proposed 01/10/2013 Capacity charge (TZS/kVa/month) 0.00 0.00 0.00 22868.00 22174.00 17512.00
Historical 01/01/2015 Service charge (TZS/month) 0.00 0.00 5520.00 14233.00 16769.00 0.00
Historical 01/01/2015 Energy charge (TZS/kWh) 100.00 350.00 306.00 205.00 163.00 159.00
Historical 01/01/2015 Capacity charge (TZS/kVa/month) 0.00 0.00 0.00 15004.00 13200.00 16550.00
Proposed 01/01/2014 Service charge (TZS/month) 0.00 0.00 6506.00 30549.00 30549.00 30549.00
Proposed 01/01/2014 Energy charge (TZS/kWh) 60.00 506.00 352.00 277.00 266.00 186.00
Proposed 01/01/2014 Capacity charge (TZS/kVa/month) 0.00 0.00 0.00 27150.00 23272.00 18380.00
Proposed 01/01/2015 Service charge (TZS/month) 0.00 0.00 6613.00 31507.00 31507.00 31507.00
Proposed 01/01/2015 Energy charge (TZS/kWh) 70.00 552.00 391.00 299.00 284.00 199.00
Proposed 01/01/2015 Capacity charge (TZS/kVa/month) 0.00 0.00 0.00 31798.00 27256.00 21526.00

151
Appendix II: Assumptions used in the comparison of TANESCO proposal with AF-Mercados CoSS
The cost items forecasted for the year 2013 are shown alongside their TANESCO designation and their
new function segment designation in Table 13. Note that the transmission and distribution segments
costs are not distinguished in the following scheme, due to lack of detailed cost breakdown, and the
following assumptions have been used:
Depreciation is attributed to the generation segment, because it is assumed that the value of
generation assets is much larger than that of network assets, therefore the depreciation incurred
in each year is primarily depreciation of generation assets;
The TANESCO CIP is attributed to the network segment, assuming that the CIP consist mostly
of transmission and distribution investment;
It is assumed that the ‘own generation cost’ item include the operating expenses that is
attributable to the generation segment, therefore all staff cost and other expenses are attributed
to the network segment;
Finally, because the CoSS counts network renewal as capital expenditure, repairs and
maintenance (R&M) is counted as T&D CAPEX instead of OPEX.
The comparison below should be read with the limitations of these assumptions in mind, rather than
being taken as absolute and definitive.
Table 13: Assignment functional segment for TANESCO revenue requirement items
Function segment Item TANESCO category Billion TZS
Generation Depreciation Depreciation -86.2
EPP Operating expenses -406.9
Own generation cost Operating expenses -301.6
Purchased electricity Operating expenses -398.6
T&D CAPEX Investment TANESCO CIP -434.8
R&M Operating expenses -44.8
T&D OPEX Other expenses Operating expenses -83.5
Provision for doubtful debts Operating expenses -16.8
Staff Operating expenses -158.2
Other revenue Government subsidy Revenue from other sources 136.6
Late payment penalty collection Revenue from other sources 19.6
Other income Revenue from other sources 28.4
Loan repayment
Loan repayment Financial costs -92.4
Long outstanding creditors Financial costs 0

152
Appendix III: Assumptions to derive revenue requirement based on tariff levels
Different classes of TANESCO customers contribute to demand growth unequally. Only T1 experiences
a share in the number of customers which is aligned with its share in total demand (53 per cent of total
number of customers and 40 per cent of total demand). On one end, D1 < 50kWh class customers
represent 22 per cent of all customers, but only 3 per cent of total demand; on the other end, T3-MV
class customers represent 0.04 per cent of customers, but 33 per cent of total demand. Supposing that all
customer classes contract capacity so that their maximum load factor is 0.7 (the historic system load
factor), then their relative contribution to peak demand is the same as the share of demand.
Figure 59: Demand forecast for different class of customers (Data source: TANESCO, 2013)
The tariff applicable to each class of customer is multiplied by the profile of the average customer
(average energy consumption and average load factor of 0.7) in each class to obtain the average bill. The
total tariff collected annually is obtained by summing the average bills calculated over the number of
customers in each class and multiplying by 12 months. The amount collected is then compared with the
revenue requirement proposed by TANESCO.

153
Table 14: Tariff collection estimation based on average customer profiles (Own analysis based on data from TANESCO, 2013)
31
TANESCO only provided demand estimates for D1 as a whole, so the disaggregation into the two separate classes is based on the authors’ discretion. Average
demand for D1 < 50 kWh customers is assumed to decrease over time due to the aggressive addition of newly electrified customers in this category, while
average demand in the D1 >50 kWh category is assumed to remain constant over time.
Year Category Avg demand (kWh/month)
Avg capacity (kW)
Avg bill (TZS/month)
Number of customers Total charged annually (Billion TZS)
2013 D1 < 50 kWh 50 0 3,000 292,037 11
D1 > 50 kWh 91 0 21,953 312,581 82
T1 263 1 83,013 699,287 697
T2 21,278 42 6,341,535 2,483 189
T3-HV 28,500,000 55,773 6,078,223,923 1 73
T3-MV 326,103 638 93,094,784 461 515
2014 D1 < 50 kWh 32
31 0 1,920 347,521 8
D1 > 50 kWh 91 0 23,820 382,678 109
T1 237 0 89,838 832,145 897
T2 19,177 38 6,361,321 2,955 226
T3-HV 30,583,333 59,850 6,788,572,950 1 81
T3-MV 293,716 575 91,535,393 549 603
2015 D1 < 50 kWh 22 0 1,540 403,005 7
D1 > 50 kWh 92 0 26,754 443,776 142
T1 220 0 92,815 965,004 1,075
T2 17,873 35 6,487,636 3,427 267
T3-HV 33,083,333 64,742 7,977,258,350 1 96
T3-MV 273,847 536 92,410,644 636 705

154
References ADB. (2013). Bangladesh: Tariff Reform and Inter-sectoral Allocation of Natural Gas. Asian Development
Bank Technical Assistance Final Report.
AF-Mercados. (2013). Cost of Service Study Final Report.
Aggreko. (2015a). Reasons to invest in Aggreko. Retrieved January 1, 2015, from
http://ir.aggreko.com/investors/investment-case.aspx
Aggreko. (2015b, January 26). Aggreko extends 200 MW Ivory Coast power project. Abidjan. Retrieved from
http://www.aggreko.com/media-centre/press-releases/aggreko-extends-200mw-ivory-coast-power-
project/
Ahlborg, H., & Hammar, L. (2014). Drivers and barriers to rural electrification in Tanzania and Mozambique
– Grid-extension, off-grid, and renewable energy technologies. Renewable Energy, 61, 117–124.
doi:10.1016/j.renene.2012.09.057
Ahlborg, H., & Sjöstedt, M. (2015). Small-scale hydropower in Africa: Socio-technical designs for renewable
energy in Tanzanian villages. Energy Research & Social Science, 5, 20–33.
doi:10.1016/j.erss.2014.12.017
ANARE. (2013). Rapport d’activités.
BBC. (2016). Ivory Coast Country Profile. Retrieved February 25, 2016, from
http://www.bbc.co.uk/news/world-africa-13287216
BBC News. (2008, February 7). Tanzanian PM to resign over graft. Retrieved from
http://news.bbc.co.uk/1/hi/world/africa/7232141.stm
Bloomberg. (2015, May). Shell to Add Firepower to BG Assets in East Africa LNG Race. Retrieved from
http://www.bloomberg.com/news/articles/2015-05-12/shell-to-add-firepower-to-bg-assets-in-east-
africa-lng-race
BPDB. (2014). Annual Report 2013-2014. Bangladesh Power Development Board. Retrieved from
http://www.bpdb.gov.bd/download/annual_report/Annual Report 2013-2014.pdf
BPDB. (2015a). Commercial: Tariff Description. Retrieved December 20, 2015, from
http://www.bpdb.gov.bd/bpdb/index.php?option=com_content&view=article&id=35&Itemid=125
BPDB. (2015b). Key Statistics: Present Installed Generation Capacity (MW) as on September, 2015.
Retrieved December 19, 2015, from
http://www.bpdb.gov.bd/bpdb/index.php?option=com_content&view=article&id=5&Itemid=6
Bukurura, S. H. (2015). Commercialisation of Natural Gas in Tanzania: Are there any lessons fro the Songo
Songo Gas to Power Project. 20th REPOA Annual Research Worksho[. Retrieved from
http://www.repoa.or.tz/documents_storage/20ARWS1E_ PPT.pdf
Castellano, A., Kendall, A., Nikomarov, M., & Swemmer, T. (2015). Brighter Africa: The growth potential of
the sub-Saharan electricity sector. McKinsey&Company. Retrieved from
http://www.mckinsey.com/~/media/mckinsey/dotcom/insights/energy resources materials/powering
africa/brighter_africa_the_growth_potential_of_the_sub-saharan_electricity_sector.ashx
Chinonso, T. (2015, March 14). Côte d’Ivoire seeks LNG supply from Nigeria. The Vanguard. Retrieved
from http://www.vanguardngr.com/2015/03/cote-divoire-seeks-lng-supply-from-nigeria/
Clyde&Co. (2015). Tanzania Bill establishing the Petroleum Act 2015. Retrieved September 28, 2015, from
http://www.clydeco.com/uploads/Files/CC007807_Clyde_Co_Tanzania_22-06-15_final_(2).pdf
Daily News Reporters. (2015, December 3). Negotiations underway to check Songas switch-off. Daily News.
Dar es Salaam. Retrieved from http://www.dailynews.co.tz/index.php/home-news/44732-negotiations-
underway-to-check-songas-switch-off

155
DESCO. (2014). Annual Report 2014. Dhaka Electric Supply Company Limited. Retrieved from
https://www.desco.org.bd/uploads/attachments/ann_report_14-15.pdf
Diu, J. B. (2011). Determinants of Residential Demand for Electricity in Tanzania (1974-2009). The Open
University of Tanzania.
DPDC. (2014). Annual report 2014. Dhaka Power Distribution Company Limited. Retrieved from
https://www.dpdc.org.bd/assets/ar/anl_rpt13_14.pdf
Economic and Social Research Foundation. (2009). Petroleum Exploration Study: A Baseline Survey Report.
The Norwegian People’s Aid. Retrieved from http://www.policyforum-
tz.org/files/ESRFNPAPetroleumSectorBaselineReport.pdf
EIA. (2014). Mozambique: International energy data and analysis. Retrieved September 29, 2015, from
http://www.eia.gov/beta/international/analysis.cfm?iso=MOZ
ESI Africa. (2015). Gas to power: Texan IPP to develop 375 MW project in Côte d’Ivoire. Retrieved
February 25, 2016, from http://www.esi-africa.com/news/gas-to-power-texan-ipp-to-develop-375mw-
project-in-cote-divoire/
EWURA. (2009). Tariff Application Guidelines for 2009. Energy and Water Utilities Regulatory Authority.
Retrieved from http://www.ewura.com/newsite/attachments/acts/Tariff Application Guidelines 2009.pdf
EWURA. (2012a). Determination of Mult-Year Cost Reflective Electricity Tarifss in Tanzania. EWURA
Discussion paper.
EWURA. (2012b). Licensable Activities - EWURA. Retrieved September 28, 2015, from
http://www.ewura.go.tz/newsite/index.php/2012-03-07-08-18-59/licensing-work/10-licensing-
articles/21-licensable-activities
EWURA. (2013). The Tanzania Electric Supply Company Multi-Year Tariff Adjustment Order, 2013.
EWURA. (2014). The Tanzania Electric Supply Company (Tariff Adjustment) (Amendment) Order, 2014.
Retrieved from http://144.76.33.232/wp-content/uploads/2015/03/2014-028-TANESCO-Tariff-
Adjustment-1ST-2ND-Quarter-ENGLISH.pdf
Gas Strategies. (2014). Long is the way that leds up to Tanzania LNG. Retrieved from
http://web.gasstrategies.com/sites/default/files/gsis_tanzania_lng_oct_2014.pdf
Ghanadan, R. (2009). Connected geographies and struggles over access: Electricity commercialisation in
Tanzania. In Electric Capitalism: Recolonising Africa on the Power Grid. Cape Town: Earthscan.
Globeleq. (2015, July 1). Globeleq celebrates completion of the Azito power plant expansion in Côte d’Ivoire.
London. Retrieved from http://www.globeleq.com/news/press_release/98/Globeleq-celebrates-
completion-of-the-Azito-power-plant-expansion-in-Cte-dIvoire
Gomes, I. (2013). Natural Gas in Pakistan and Bangladesh: current issues and trends. Oxford Institute for
Energy Studies Working Paper. Retrieved from http://www.oxfordenergy.org/wpcms/wp-
content/uploads/2013/06/NG-77.pdf
Gratwick, K., Ghanadan, R., & Eberhard, A. (2007). Generating Power and Controversy: Understanding
Tanzania’s Independent Power Projects. Management Programme in Infrastructure Reform &
Regulation Working Paper: Full version.
Gray, H. (2015). The political economy of grand corruption in Tanzania. African Affairs, 114(456), 382–403.
Greacen, C. (2014). Mini-grid systems on the rise in Tanzania Status of implementation and regulatory
framework conditions. In Workshop Mini-Grid Systems: Reducing risks and costs through the anchor
customer business model. Retrieved from https://www.giz.de/fachexpertise/downloads/2014-en-
greacen-pep-fachworkshop-mini-grids.pdf
Hanauer, L., & Morris, L. J. (2014). Chinese Engagement in Africa: Drivers, Reactions, and Implications for
U.S. Policy. International Security and Defense Policy Center of the RAND National Defense Research

156
Institute.
IAEA. (2013). Bangladesh. Retrieved December 20, 2015, from http://www-
pub.iaea.org/MTCD/Publications/PDF/CNPP2013_CD/countryprofiles/Bangladesh/Bangladesh.htm
IEA. (2013). United Republic of Tanzania. Retrieved December 15, 2015, from
http://www.iea.org/sankey/#?c=United Republic of Tanzania&s=Final consumption
IFC. (2013). Ciprel Power, Cote d’Ivoire. Retrieved February 25, 2016, from
http://www.ifc.org/wps/wcm/connect/industry_ext_content/ifc_external_corporate_site/industries/infras
tructure/power/ciprel+power,+cote+divoire
IMF. (2012). Côte d’Ivoire: First Review Under the Three-Year Arrangement Under the Extended Credit
Facility, Request for Modification of Performance Criteria, and Financing Assurances Review; Press
Release. Retrieved from https://www.imf.org/external/pubs/ft/scr/2012/cr12117.pdf
IMF. (2013). Bangladesh: Poverty Reduction Strategy Paper. Wahington D.C.: IMF Country Report.
Retrieved from https://www.imf.org/external/pubs/ft/scr/2013/cr1363.pdf
Innovation Energie Developpement. (2014). National Electrification Program Prospectus. Retrieved from
http://www.ied-sa.fr/index.php/en/documents-and-links/publications/category/3-reports.html
Janus, H., & Keijzer, N. (2015). Big Results Now? Emerging Lessons from Results-Based Aid in Tanzania.
Germain Development Institute Discussion Paper. Retrieved from https://www.die-
gdi.de/uploads/media/DP_4.2015.pdf
Kabendera, E., & Anderson, M. (2014, December 24). Tanzania energy scandal ousts senior politicians. The
Guardian. Dar es Salaam. Retrieved from http://www.theguardian.com/global-
development/2014/dec/24/tanzania-energy-scandal-ousts-senior-politicians
Kahyoza, N., & Greacen, C. (2011). Tanzania’s Experience in Establishing a Regulatory System for
Promoting Grid and Off-Grid Small Power Producers (SPPs). Dakar: African Electrification Initiative
Workshop.
Kapika, J., & Eberhard, A. (Eds.). (2013). Tanzania: Learning the hard way. In Power-Sector Reform and
Regulation in Africa: Lessons from Kenya, Tanzania, Uganda, Zambia, Namibia and Ghana.
Kichonge, B., John, G. R., Mkilaha, I. S. N., & Hameer, S. (2014). Modelling of Future Energy Demand for
Tanzania. Journal of Energy Technologies and Policy, 4(7), 16–32.
Kihwele, S., Hur, K., & Kyaruzi, A. (2012). Visions, Scenarios and Action Plans Towards Next Generation
Tanzania Power System. Energies, 5(12), 3908–3927. doi:10.3390/en5103908
Lazimah, J. (2014). Energy Sector Initiatives in Tanzania. The Low Carbon Development Worhkshop 22-23
January 2014. Retrieved from http://www.fes-sustainability.org/sites/default/files/u43/lazimah.pdf
Ledesma, D. (2013). East Africa Gas - Potential for Export. Oxford Institute for Energy Studies Working
Paper.
Luhwago, R. (2011, August 14). Govt unveils Sh523b power rescue plan. The Guardian. Retrieved from
http://www.ippmedia.com/frontend/index.php?l=32222
Malgas, I., & Gratwick, K. (2008). Through the Fire: Independent Power Projects and Power Sector Reform
in Côte d’Ivoire. Cape Town: MIR Working Paper.
Manson, K. (2014, November 4). Tanzania natural gas investment threatened by arrest of officials. Financial
Times. Nairobi. Retrieved from http://www.ft.com/cms/s/0/b789caaa-6431-11e4-bac8-
00144feabdc0.html#axzz3n4BnzvjJ
Masih, I., Maskey, S., Mussá, F. E. F., & Trambauer, P. (2014). A review of droughts on the African
continent: a geospatial and long-term perspective. Hydrology and Earth System Sciences, 18(9), 3635–
3649. doi:10.5194/hess-18-3635-2014
157
MEM. (2014). Electricity Supply Industry Reform Strategy and Roadmap 2014-2025. Ministry of Energy and
Minerals. Retrieved from http://www.gst.go.tz/images/TANZANIA ELECTRICITY SUPPLY
INDUSTRY REFORM STRATEGY & ROADMAP.pdf
Ministry of Energy and Minerals. (2012). Power System Master Plan 2012 Update. United Republic of
Tanzania.
Ministry of Energy and Minerals. (2013a). Power System Master Plan 2012 Update. Retrieved from
http://www.tanesco.co.tz/index.php?option=com_docman&task=doc_download&gid=68&Itemid=172
Ministry of Energy and Minerals. (2013b). The National Natural Gas Policy of Tanzania - 2013. Retrieved
from http://www.tanzania.go.tz/egov_uploads/documents/Natural_Gas_Policy_-_Approved_sw.pdf
Ministry of Petroleum and Energy. (2012). Plan d’actions et d'investissements en electrification rurale.
Retrieved from http://www.anare.ci/assets/files/pdf/documents/atel-semin/4MMPE-SNE2012-Rapport-
Com3-Electrification-Rurale.pdf
Ministry of Petroleum and Energy. (2015). Opportunities and Challenges in the Oil and Gas Sectors in Côte
d’Ivoire. New Delhi: 4th India-Africa Hydrocarbons Conference. Retrieved from
http://www.iahc2016.com/Cote-D-Ivoire.pdf
Mtepa, M. (2014). Tanzania Case Study: Achievements and Challenges. Banjul: The 3rd Gambia National
Forum: Policy on Small Scale Renewable Energy Regulation.
Mujeri, M. K., & Chowdhury, T. T. (2013). Quick Rental Power Plants in Bangladesh: An Economic
Appraisal. Bangaldesh Institute of Development Studies. Retrieved from
http://bids.org.bd/publication/dpaper/discussion_paper_01.pdf
Munasinghe, M. (1981). Principles of modern electricity pricing. Proceedings of the IEEE.
doi:10.1109/PROC.1981.11970
Murshid, K. A. S., & Wiig, A. (2001). A review of development trends in the energy sector of Bangladesh.
Chr. Michelsen Institute Report. Retrieved from http://www.cmi.no/publications/file/958-a-review-of-
development-trends-in-the-energy.pdf
Mwamunyange, J. (2013a, April 6). Court deals TANESCO huge blow, orders firm to pay up $77.5 million.
The East African. Retrieved from http://www.theeastafrican.co.ke/news/Court-orders-Tanesco-to-pay-
up-USD77-million-/-/2558/1741356/-/dkc7dy/-/index.html
Mwamunyange, J. (2013b, July 20). TANESCO probe reveals massive power theft. The East African.
Retrieved from http://www.theeastafrican.co.ke/news/Tanesco-probe-reveals-massive-power-theft/-
/2558/1920942/-/d5flthz/-/index.html
Ng’wanakilala, F. (2014, November 13). Tanzania says LNG project could cost up to $30 bln. Reuters. Dar es
Salaam. Retrieved from http://af.reuters.com/article/investingNews/idAFKCN0IX1OD20141113
Ng’wanakilala, F. (2015, June 7). Tanzania lifts gas resources estimate to 55 trillion cubic feet. Dar es Salaam.
Retrieved from http://af.reuters.com/article/tanzaniaNews/idAFL5N0YT0NO20150607
Ngamlagosi, F. (2012). Electricity Pricing in Tanzania. East African Power Industry Convention Presentation.
Retrieved from http://www.esi-africa.com/wp-content/uploads/Felix_Ngamlagosi.pdf
Ngamlagosi, F. (2015). Policy, PPA Framework and Need for Reliable Off-Takers in Tanzania. Nairobi:
Presentation at the 17th East Africa Power Industry Convention.
NKRA Energy. (2015). National Key Result Area Energy 2013/14-2015/16. Tanzania Development Vision
2025 Big Results Now! Roadmap.
Norton Rose Fulbright. (2014a). A snapshot of Tanzanian natural gas. Retrieved September 30, 2015, from
http://www.nortonrosefulbright.com/knowledge/publications/123532/a-snapshot-of-tanzanian-natural-
gas
Norton Rose Fulbright. (2014b). Tanzania natural gas policy. Retrieved September 28, 2015, from

158
http://www.nortonrosefulbright.com/knowledge/publications/110979/tanzania-natural-gas-policy
Orca Exploration Group Inc. (2015). 2014 Annual Report. Retrieved from
http://www.orcaexploration.com/pdfs/2014_OrcaExploration_AR_FULL.pdf
Parmesano, H., Rankin, W., Nieto, A., & Irastorza, V. (2004). Classification and Allocation Methods for
Generation and Transmission in Cost-of-Service Studies. Los Angeles.
Pedersen, R. H., & Bofin, P. (2015). The politics of gas contract negotiations in Tanzania: a review. DIIS
Working Paper 2015.
REB. (2015). Rural Electrification Programme at a Glance. Retrieved December 20, 2015, from
http://www.reb.gov.bd/index.php/abreb/stat
Reneses, J., Rodríguez, M. P., & Pérez-Arriaga, I. J. (2013). Electricity Tariffs. In Regulation of the Power
Sector. Springer.
Reuters. (2013, January 9). Ivory Coast signs $500 mln loan deal with China’s Exim. Retrieved from
http://www.reuters.com/article/ivorycoast-china-power-idUSL5E9C9CPS20130109
Reuters. (2014, September 24). Ivory Coast’s Foxtrot aims to secure gas output for next decade. Retrieved
from http://www.reuters.com/article/ivorycoast-natgas-foxtrot-idUSL6N0RP4XL20140924
Rigzone Staff. (2015, August 21). Mnazi Bay Gas Wells Deliver 1st Gas to Tanzania Pipeline. Retrieved from
http://www.rigzone.com/news/oil_gas/a/140236/Mnazi_Bay_Gas_Wells_Deliver_1st_Gas_to_Tanzania
_Pipeline
Shih, T. H. (2013). China to provide Africa with US$1tr financing. South China Morning Post. Retrieved
from http://www.scmp.com/business/banking-finance/article/1358902/china-provide-africa-us1tr-
financing
Sieh, R. D. (2015, September 28). Liberia: Low Cost Electricity, High Expectations - CLSG Chief Speaks.
Front Page Africa. Monrovia. Retrieved from http://allafrica.com/stories/201509281927.html
Simbeye, F. W. (2015, March 3). Orca Plans 221 bn - Songo Songo Expansion. Tanzania Daily News. Dar es
Salaam. Retrieved from http://allafrica.com/stories/201503031189.html
Straeten, J. van der. (2015). Electrification in Tanzania from a Historical Perspective - Discourses of
Development and the Marginalization of the Rural Poor. In Micro Perspectives for Decentralized
Energy Supply (Martina Sc.). Proceedings of the International Conference.
Sun, Y. (2014). China’s Aid to Africa: Monster or Messiah. The Brookings Institution. Retrieved from
http://www.scmp.com/business/banking-finance/article/1358902/china-provide-africa-us1tr-financing
Sunday News Reporter. (2015, October 4). VIP seeks to recover 1 tr/- over delay to convert plant. Daily News.
Dar es Salaam. Retrieved from http://www.dailynews.co.tz/index.php/features/42798-vip-seeks-to-
recover-1tr-over-delay-to-convert-plant
Sy, A. (2015). Are African countries rebasing GDP in 2014 finding evidence of structural transformation?
Brookings. Retrieved from http://www.brookings.edu/blogs/africa-in-focus/posts/2015/03/04-african-
gdp-structural-transformation-sy-copley
Symbion Power. (2015). Symbion power capabilities Generation. Retrieved September 28, 2015, from
http://symbion-power.com/capabilities/power-plants/
TANESCO. (2013). TANESCO Tariff Review Application. Tanzania Electric Supply Company Ltd.
Tenenbaum, B., Greacen, C., Siyambalapitiya, T., & Knuckles, J. (2014). Introduction. In From the Bottom
Up: How Small Power Producers and Mini-Grids Can Deliver Electrification and Renewable Energy in
Africa. The World Bank.
The Business Year. (2014). High-Tech Show. Retrieved September 29, 2015, from
https://www.thebusinessyear.com/tanzania-2014/high-tech-show/interview

159
The Citizen Investigative Team. (2014, March 3). $210m deal: Story of IPTL, PAP and High Court. Retrieved
from http://www.thecitizen.co.tz/News/-270m-deal--Story-of-IPTL--PAP-and-High-Court/-
/1840392/2228606/-/1bddmgz/-/index.html
The Economist. (2014, September). Sharing the spoils: Tanzania’s troubles over gas revenue. The Economist.
Retrieved from http://www.economist.com/blogs/baobab/2014/09/tanzanias-troubles-over-gas-revenue
The United Republic of Tanzania Ministry of Finance. (2014). The State of the National Economy in 2013 (in
Swahili). Retrieved from http://www.mof.go.tz/mofdocs/macroeconomic/TAARIFA YA HALI YA
UCHUMI WA TAIFA KATIKA MWAKA 2013.pdf
The World Bank. (2014). Project information document concept stage. Retrieved from http://www-
wds.worldbank.org/external/default/WDSContentServer/WDSP/SAR/2014/07/23/090224b0825b02e3/1
_0/Rendered/PDF/Project0Inform0nt0Project000P128012.pdf
Tomnay, N. (2015). Where are all the LNG project postponements? Retrieved September 29, 2015, from
http://blogs.woodmac.com/where-are-all-the-lng-project-postponements/
Traoré, A. (2013). Independent power generation: the Ivoirian model. Retrieved from
http://www.proparco.fr/webdav/site/proparco/shared/PORTAILS/Secteur_prive_developpement/PDF/S
PD18/SPD18_Amidou_traore_UK.pdf
Tsakhara, P. (2015). Presentation on the Tanzanian Solar PV-Hybrid Workshop Held in Berlin, Germany.
TANESCO. Retrieved from https://www.giz.de/fachexpertise/downloads/2015-tanesco-presentation-
tansania.pdf
Vagliasindi, M., & Besant-Jones, J. (2013). Tanzania. In Power Market Structure: Revisiting Policy Options.
The World Bank.
Wentworth Resources Limited. (2015a). Corporate Presentation March 2015. Retrieved from
http://www.wentworthresources.com/pdf/Wentworth-Corporate-Presentation-March-2015-Final.pdf
Wentworth Resources Limited. (2015b). Corporate Presentation October 2015. Retrieved from
http://www.wentworthresources.com/pdf/Wentworth-Corporate-Presentation-October-2015-FINAL.pdf
Wentworth Resources Limited. (2015c). Large-Scale Gas Monetization Projects. Retrieved September 29,
2015, from http://www.wentworthresources.com/large-scale.php
White &Case LLP. (2011). Portfolio Gas Supply Grrement between TPDC, PanAfrican Energy Tanzania
LImited, and TANESCO. Retrieved from http://panafricanenergy.com/pdfs/Portfolio-Gas-Agreement-
17_June_2011.pdf
Wood Mackenzie. (2015). Unlocking East Africa’s upstream potential. Retrieved September 29, 2015, from
http://www.woodmac.com/analysis/east-africa-upstream
Yescombe, E. R. (2007). Public-Private Partnerships: Principles of Policy and Finance. London: Elsevier
Ltd.

Designed by soapbox.co.uk
The International Growth Centre (IGC) aims to promote sustainable growth in developing countries by providing demand-led policy advice based on frontier research.
Find out more about our work on our website www.theigc.org
For media or communications enquiries, please contact [email protected]
Subscribe to our newsletter and topic updates www.theigc.org/newsletter
Follow us on Twitter @the_igc
Contact us International Growth Centre, London School of Economic and Political Science, Houghton Street, London WC2A 2AE