sustainable urban landscapes neighbourhood pattern · pdf fileneighbourhood pattern typology...
TRANSCRIPT

neighbourhoodpattern typology
produced by
The UThe UThe UThe UThe Univnivnivnivnivererererersity of Brsity of Brsity of Brsity of Brsity of British Columbia Jamesitish Columbia Jamesitish Columbia Jamesitish Columbia Jamesitish Columbia JamesTTTTTaaaaayyyyylor Chair in Landscape and Livlor Chair in Landscape and Livlor Chair in Landscape and Livlor Chair in Landscape and Livlor Chair in Landscape and Liveableeableeableeableeable
EnEnEnEnEnvirvirvirvirvironmentsonmentsonmentsonmentsonments
produced for
ttttthe Sushe Sushe Sushe Sushe Sustttttainable Deainable Deainable Deainable Deainable Devvvvvelopment Relopment Relopment Relopment Relopment ResearesearesearesearesearccccchhhhhInsInsInsInsInstituttituttituttituttituteeeee
sustainable urban landscapes
24 hectares
24 hectares
24 hectares
600 hectares
600 hectares
24 hectares
JacJacJacJacJackie Tkie Tkie Tkie Tkie Teed and Peed and Peed and Peed and Peed and Patratratratratricicicicick Condonk Condonk Condonk Condonk Condonwitwitwitwitwith Sarh Sarh Sarh Sarh Sara Muir and Chra Muir and Chra Muir and Chra Muir and Chra Muir and Chris Midgis Midgis Midgis Midgis Midgleleleleleyyyyy

2
Nei
ghbo
urho
od P
atte
rn T
ypol
ogy
Neighbourhood Pattern Typ
ology
3
CONTENTS
SIX NEIGHBOURHOOD PATTERNS56 Sustainabilty Factors
WalkabilityVehicle Kilometres TravelledAffordabilityHousing MixEffective Permeable Area
8 Rural Pattern
10 Village Pattern
12 Auto Oriented Pattern
14 Landscape Oriented Pattern
16 Pedestrian Oriented Pattern
18 Pedestrian & Green Infrastructure Pattern
METHODOLOGY2020 Data Collection
22
ROLE IN GB-QUEST2626 User Inputs
26 Neighbourhood Submodel OutputsImage ScreensHeadlinesNumerical Outputs
APPENDICES2929 1: Data Summary Table
31 2: Neighbourhood Pattern Data Tables
33 3: Component Neighbourhood & Study Site Maps
35 4: Transportation Mode Split by Neighbourhood
37 5: House & Apartment Cost by Neighbourhood
Study SitesComponent Neighbourhoods
Data AnalysisWalkability
272728
2323
22Vehicle Kilometres Travelled
2020
Affordability24 Housing Mix24 Effective Permeable Area25 Land Use Mix25 Density

4
Nei
ghbo
urho
od P
atte
rn T
ypol
ogy

Neighbourhood Pattern Typ
ology
5
24 hectares
24 hectares
24 hectares
600 hectares
600 hectares
24 hectares
neighbourhoodpattern typologySix Neighbourhood Patterns
A growing body of research isilluminating the connection betweenpatterns of neighbourhooddevelopment and the sustainabilityof our region. The mix of land uses,density of development, andarrangement of streets describe aneighbourhood developmentpattern. These three features havebeen jointly implicated in influencingsustainability factors such as: travelbehaviour, home affordability andvalue, the formation of social ties,and permeability to rainwater. Afine-grained land use mix placesamenities and employment close toresidents. Higher densitydevelopments put enough people inthe neighbourhood to support publictransit and local shops. A well-interconnected street arrangementmakes it easier and faster to getwhere you are going. Studies ofneighbourhoods with these featuresshow a general decrease in traveldistance and trip duration and anincrease in the walk/transit modeshare.1 Neighbourhoods wherethere is a reduced dependence onthe car are also more conducive tothe formation of social ties.2 Higherdensities (smaller lots anddwellings, and more people) mayallow the cost of developing suchneighbourhoods to be substantiallylower.3 Yet many residents prefer,and are even willing to pay more,for smaller homes in strongcommunities proximal to goodtransit and amenities. A well-interconnected street pattern alsofacilitates the use of infiltration-based stormwater systems, whichcan reduce downstreamconsequences of development bybetween 80 and 100%.1 Clearly,land use mix, density and street
arrangement are factors influencingneighbourhood sustainability.
Recognition of this connectionchallenges us to re-evaluate theneighbourhood development patternas a fundamental determinant in therealization of sustainablecommunities. Once replicated onmultiple sites, a neighbourhooddevelopment pattern becomes anintegral part of the fabric of theregion. And, just as the health ofeach cell contributes to the overallhealth of the body, the sustainabilityof each neighbourhood helps todetermine the ultimate sustainabilityof the region. Regional sustainabilitybegins with the choices we makeabout the neighbourhoods we build.
This study forms the basis of theNeighbourhood submodel of GeorgiaBasin QUEST (GB-QUEST) – theinteractive web-based game thatallows players to develop “what if?”scenarios for the futuredevelopment of the Georgia Basinregion (www.basinfutures.net). TheNeighbourhood submodel looks atthe neighbourhood as a regionalbuilding block. Rather thanexamining the effects of land usemix, density and street arrangementindependently, possiblecombinations of these threefeatures were explored. Allsequences were attempted, with afinal constellation of sixNeighbourhood Patterns identifiedas representative of our study area,the Georgia Basin. EachNeighbourhood Pattern is describedby a unique combination of streetarrangement, land use mix, anddensity range (see table, oppositepage). Data was collected todetermine the relative sustainability

6
Nei
ghbo
urho
od P
atte
rn T
ypol
ogy
of each pattern. Although almost allof these Neighbourhood Patternsare pre-existing, the purpose of thisstudy is to describe how each wouldfunction as new development in theGeorgia Basin. The results of thisresearch will be applied in the GB-QUEST game, where the user maycombine different patterns toexplore the implications ofNeighbourhood Pattern on thecreation of a sustainable region.
Sustainability FactorsSustainability FactorsSustainability FactorsSustainability FactorsSustainability FactorsThe data collected for the sixNeighbourhood Patterns has beendistilled into five sustainabilityfactors: walkability, vehiclekilometres travelled (“VKT”),affordability, housing mix, andeffective permeability. These factorswere selected to reflect years ofresearch and public policy that haveevolved in response to an increasedconcern about the ecological,economic and human costs ofcontinued unsustainable urbandevelopment. In BC, these policiesgenerally state that all residentshave the right to fresh air, cleanwater and affordable housing. Thismeans communities should bedesigned to reduce dependence onthe automobile; to protect thefunctioning of streams andecologically sensitive areas; and tofoster a high quality of life forpresent and future citizens.4 Thefive sustainability factors help toindicate how successful eachNeighbourhood Pattern is inachieving these goals. A briefdescription of each sustainabilityfactor follows below. A detailedoutline of the methodologicalapproach is found in theMethodology section.
WalkabilityWalkabilityWalkabilityWalkabilityWalkabilityWalkability measures thepercentage of the population withinan average 5-minute walk fromdaily destinations. Daily destinationsinclude: school, recreation, localshopping and, for some, work.Density and land use mix, as well asthe physical street pattern, influence
walkability. A fine-grained anddiverse land use mix puts residentsclose to their daily needs, whilehigher densities provide thepopulation required to support localshops and public transit.5 A well-interconnected street pattern makestrips on foot quick and direct.
Vehicle Kilometres TravelledVehicle Kilometres TravelledVehicle Kilometres TravelledVehicle Kilometres TravelledVehicle Kilometres Travelled(“VKT”)(“VKT”)(“VKT”)(“VKT”)(“VKT”)VKT measures the averagekilometres of vehicle travel perhousehold per day. Density, land usemix and street pattern influenceVKT. Greater land use mix andhigher densities combined with aninterconnected street patterndecrease trip duration, frequencyand distance, and increase thewalk/transit mode share.
AffordabilityAffordabilityAffordabilityAffordabilityAffordabilityAffordability measures whatpercentage of existing Georgia Basinhouseholds could afford to purchasea home in each NeighbourhoodPattern. Affordability is broken downby different housing types, andgiven as an average.
Housing MixHousing MixHousing MixHousing MixHousing MixHousing mix describes housingchoice within the community bymeasuring the percentage deviationfrom a benchmark housingselection. Housing mix is differentfrom affordability in that it describeswhat range of different housingtypes are available to residents, notthe cost of residing there. A goodhousing mix ensures that a widerange of family types can have theirpreferred housing needsaccommodated in theneighbourhood.
Effective Permeable AreaEffective Permeable AreaEffective Permeable AreaEffective Permeable AreaEffective Permeable AreaImpervious areas are surfaces likeroofs, paved streets and sidewalksthat rain water cannot seepthrough. Permeable areas aresurfaces like lawns, gardens andforest floors that rain water canseep through. When rain hitsimpervious surfaces, it runs off andis usually collected in underground
stormwater pipes and channelleddirectly to streams. In other cases,the water may run off onto another,permeable surface, where it canslowly infiltrate into the soil. Theinfiltration of rainwater is importantto recharge groundwater, which inturn recharges streams in times oflow rainfall. Infiltration alsoprevents stream scouring, whichoccurs when large volumes ofrainwater are conveyed to streamsduring storms, usually byunderground stormwater systems.Regular ditches, although they mayallow some infiltration to naturallyoccur, are not designed specificallyfor infiltration and also deliver muchof their collected water directly tostreams.
Permeable area is a measure ofhow much of the land is capable ofinfiltrating water, in situ. Imperviousarea is a measure of how much ofthe land is covered by impervioussurfaces that cannot be infiltrated bywater, in situ. When most of therainwater from an impervioussurface can be directed to andinfiltrated by another permeablesurface, it is considered to beeffectively permeable. This occurswhen a roof delivers its rainwater toa cistern that is used to water theyard; when a driveway delivers itsrainwater to an on site infiltrationpit; or, when a street drains intoroadside swales designed tomaximize infiltration. Effectivepermeable area (EPA) is a measureof how much of the land ispermeable to rain water or deliversrain water to another permeablearea.
In the following pages, the sixNeighbourhood Patterns aredescribed and discussed in relationto the five sustainability factors. Fora table summarizing this discussion,please see Appendix 1. For thedetailed Neighbourhood Pattern datatables that were used to formulatemost of these results, please seeAppendix 2.

Neighbourhood Pattern Typ
ology
7
aboaboaboaboabovvvvveeeeeSix patterns of neighbourhood developmentwere identified and compared for this study.Each Neighbourhood Pattern was derivedfrom a unique combination of streetarrangement, land use mix, and densityrange.
street arrangement density rangeland use mix
rural pattern
village pattern
auto oriented pattern
24 hectares
24 hectares
24 hectares
600 hectares
600 hectares
24 hectares
landscape oriented pattern
pedestrian oriented pattern
pedestrian & green infrastructure pattern
brokennetwork
connectednetwork & green
infrastructure
interconnectednetwork
modifiednetwork
dendritic
interconnectednetwork
low
high
high
medium
low
medium
verylow
medium
medium -high
low -medium
very low -low
verylow
Notes1. See: Reid Ewing, “Alternative Views of Sprawl:Counterpoint - Is Los Angeles-Style SprawlDesirable?” American Planning Association, Vol.63, No. 1, Winter (1997); R. Cervaro and C.Radisch, “Travel Choices in Pedestrian VersusAutomobile Oriented Neighbourhoods,” TransportPolicy, Vol. 3 (1996): 127-141; and L.D. Frank andG. Pivo, Relationships Between Land Use andTravel Behavior in the Puget Sound Region,Washington State Department of Transportation,Seattle (1994): 9-37; Criterion (1996): 12.2. Lance Freeman, “The Effects of Sprawl onNeighbourhood Social Ties,” American PlanningAssociation Journal, Vol. 67, No. 1 (2001): 69-75.3. Patrick M. Condon and Jacqueline TeedAlternative Development Standards for SustainableCommunities: Design Workbook, University ofBritish Columbia, James Taylor Chair in Landscapeand Liveable Environments (1998).4. British Columbia, Growth Strategies Amend-ment Act, 1995 (Part 25 of the Local GovernmentAct, 1995); British Columbia, Bill 26 (otherwiseknown as the Local Government StatuesAmendment Act, 1997).5. Michael Bernick and R. Cervero, Transit Villagesin the 21st Century, McGraw-Hill, New York (1997):75-84.

8
Nei
ghbo
urho
od P
atte
rn T
ypol
ogy
0.0%
10.0%
20.0%
30.0%
40.0%
50.0%
60.0%
70.0%
80.0%
90.0%
100.0%
0
20
40
60
80
100
120
0.0%
10.0%
20.0%
30.0%
40.0%
50.0%
60.0%
70.0%
80.0%
90.0%
0.0%
10.0%
20.0%
30.0%
40.0%
50.0%
60.0%
70.0%
80.0%
90.0%
0.00%
20.00%
40.00%
60.00%
80.00%
100.00%
120.00%
0.00%
10.00%
20.00%
30.00%
40.00%
50.00%
60.00%
70.00%
80.00%
90.00%
100.00%
0
50
100
150
200
250
300
350
rural patternSix Neighbourhood Patterns
housing mix
ped &
green
infras
tructu
rerural
village aut
o
landsc
ape
pedest
rian
ped &
green
infras
tructu
rerural
village aut
o
landsc
ape
pedest
rian
ped &
green
infras
tructu
rerural
village aut
o
landsc
ape
pedest
rian
ped &
green
infras
tructu
rerural
village aut
o
landsc
ape
pedest
rian
The Rural pattern arises whenurban expansion encourages theremoval of land from the edges ofagricultural areas for developmentas acreage homes. A discontinuousnetwork, created through infillingthe existing wide-spaced agriculturalroad grid, characterizes the streetsystem. Shops and services are indistant malls and big-box mallsalong major streets. These streetsmay have sidewalks but often nostreet trees, and have many lanesto move traffic quickly. Residentialstreets are narrow with a crushedstone edge and swale instead ofcurb and gutter, and have no streettrees or sidewalks.
Consisting almost entirely of verylarge single family homes, the RuralPattern has the lowest density of thesix patterns (210.7 people/sq.km)and almost no land use mix. Thisexpansive pattern has implicationsfor mobility, as the broken streetnetwork, a lack of nearby amenities,and infrequent and difficult toaccess transit means nearly all dailyexcursions, including trips to workand school, must be made by car.As a result, only 4.7% of residentsare within an average 5-minutewalk to daily needs, generating thehighest VKT of the six patterns(100.3 VKT/household/day).
Historically, the first families tomove here are usually drawn byprivacy, quiet and low prices.Typically these conditions aretemporary and, built in an urbanarea where land values are higher,
the very large yards and houses ofthis pattern are expensive topurchase and develop. Very largeyards also mean fewer people perhectare to pay for infrastructure.Fewer than 1% of Georgia Basinhouseholds could afford to live inthis pattern. The poor range ofhousing types (29% of benchmark)also means that the needs of only afew family types can be met.
Elementary schools and parks aretypically designed for auto accessand are fronted by a parking lot.Schools are usually large, one-storey buildings. Parks areinfrequent but large and cater toactive recreation, although theyoften include preserved naturalspace.
Stream corridors and natural spacemay also be preserved in individualyards, although some clearingaround streams occurs, whichreduces fish habitat. Roadsidedrainage swales collect stormwaterfrom rooftops, driveways andstreets. Although these swales areintended to deliver rainwater tostreams, some beneficial infiltrationalso occurs. This, combined withlarge, permeable yards means thepattern has a relatively highpermeability to rainwater inresidential areas (87.4%) and in theoverall neighbourhood (93.4%).Very low density, however, meansthere are 313 square metres ofimpervious surface per resident.
affordability
overall patternhouse
VKTwalkability
effective permeable area
EPA sq.m EIA/person

Neighbourhood Pattern Typ
ology
9
rural patternSix Neighbourhood Patterns
600 hectares
○
○
○
○
○
○
○
○
○
○
○
○
○
○
○
○
○
○
○
○
○
○
○
○
○
○
○
○
○
○
○
○
○
○
○
○
○
○
○
○
○
○
○
○
○
○
○
○
○
○
○
○
○
○
○
○
○
○
○
○
○
○
○
○
○
○
○
○
○
○
○
○
○
○
○
○
○
house
recreation
local shopping
major business/commercial
major street
local street
school
10
Nei
ghbo
urho
od P
atte
rn T
ypol
ogy
0.0%
10.0%
20.0%
30.0%
40.0%
50.0%
60.0%
70.0%
80.0%
90.0%
100.0%
0
20
40
60
80
100
120
0.0%
10.0%
20.0%
30.0%
40.0%
50.0%
60.0%
70.0%
80.0%
90.0%
0.0%
10.0%
20.0%
30.0%
40.0%
50.0%
60.0%
70.0%
80.0%
90.0%
0.00%
20.00%
40.00%
60.00%
80.00%
100.00%
120.00%
0.00%
10.00%
20.00%
30.00%
40.00%
50.00%
60.00%
70.00%
80.00%
90.00%
100.00%
0
50
100
150
200
250
300
350
village patternSix Neighbourhood Patterns
housing mix
ped &
green
infras
tructu
rerural
village aut
o
landsc
ape
pedest
rian
ped &
green
infras
tructu
rerural
village aut
o
landsc
ape
pedest
rian
ped &
green
infras
tructu
rerural
village aut
o
landsc
ape
pedest
rian
ped &
green
infras
tructu
rerural
village aut
o
landsc
ape
pedest
rian
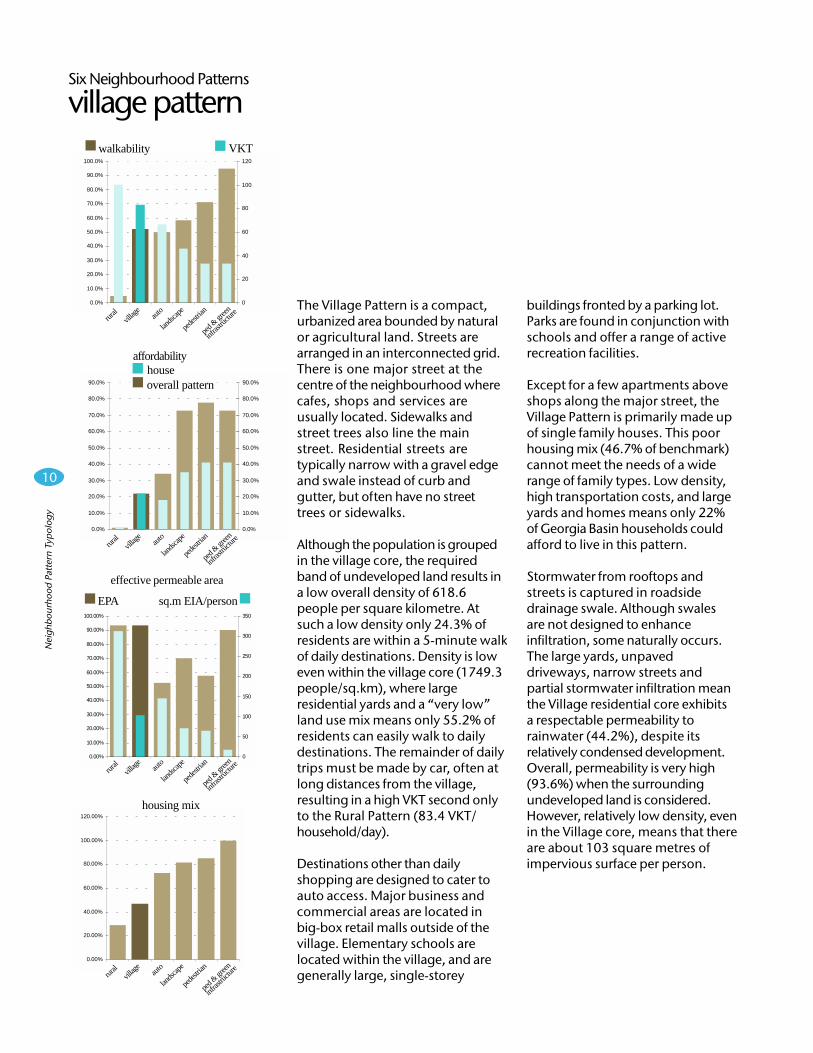
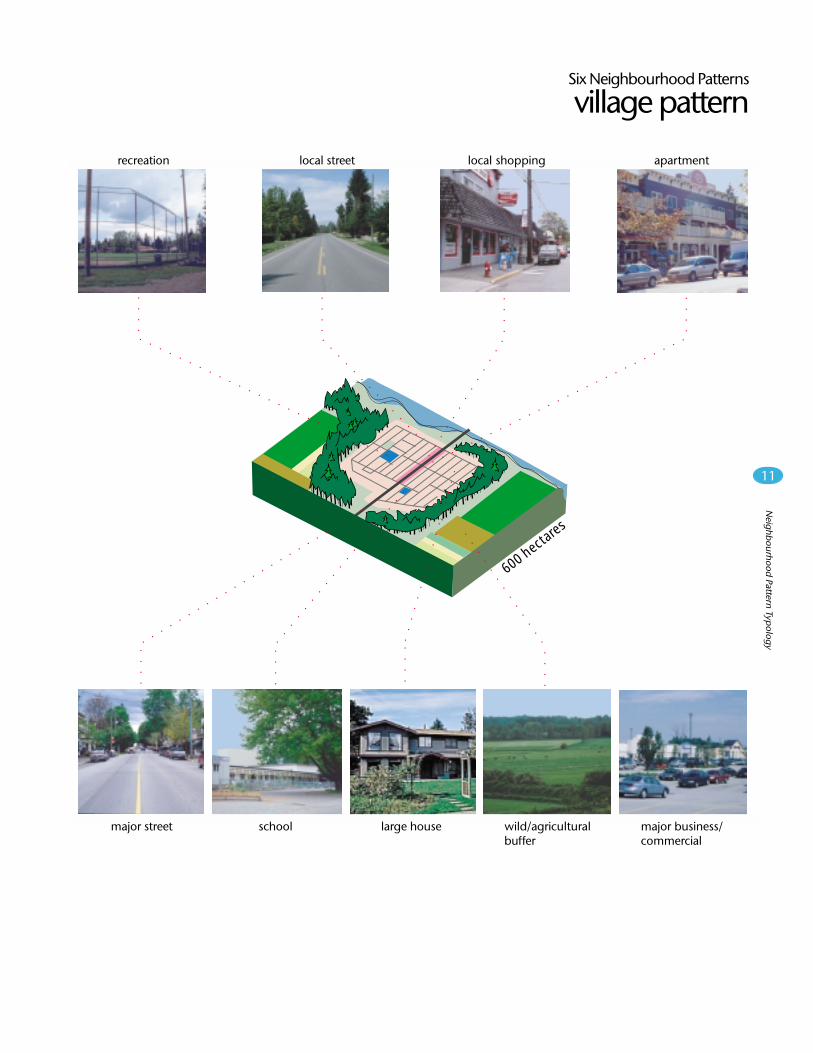
The Village Pattern is a compact,urbanized area bounded by naturalor agricultural land. Streets arearranged in an interconnected grid.There is one major street at thecentre of the neighbourhood wherecafes, shops and services areusually located. Sidewalks andstreet trees also line the mainstreet. Residential streets aretypically narrow with a gravel edgeand swale instead of curb andgutter, but often have no streettrees or sidewalks.
Although the population is groupedin the village core, the requiredband of undeveloped land results ina low overall density of 618.6people per square kilometre. Atsuch a low density only 24.3% ofresidents are within a 5-minute walkof daily destinations. Density is loweven within the village core (1749.3people/sq.km), where largeresidential yards and a “very low”land use mix means only 55.2% ofresidents can easily walk to dailydestinations. The remainder of dailytrips must be made by car, often atlong distances from the village,resulting in a high VKT second onlyto the Rural Pattern (83.4 VKT/household/day).
Destinations other than dailyshopping are designed to cater toauto access. Major business andcommercial areas are located inbig-box retail malls outside of thevillage. Elementary schools arelocated within the village, and aregenerally large, single-storey
buildings fronted by a parking lot.Parks are found in conjunction withschools and offer a range of activerecreation facilities.
Except for a few apartments aboveshops along the major street, theVillage Pattern is primarily made upof single family houses. This poorhousing mix (46.7% of benchmark)cannot meet the needs of a widerange of family types. Low density,high transportation costs, and largeyards and homes means only 22%of Georgia Basin households couldafford to live in this pattern.
Stormwater from rooftops andstreets is captured in roadsidedrainage swale. Although swalesare not designed to enhanceinfiltration, some naturally occurs.The large yards, unpaveddriveways, narrow streets andpartial stormwater infiltration meanthe Village residential core exhibitsa respectable permeability torainwater (44.2%), despite itsrelatively condensed development.Overall, permeability is very high(93.6%) when the surroundingundeveloped land is considered.However, relatively low density, evenin the Village core, means that thereare about 103 square metres ofimpervious surface per person.
affordability
overall patternhouse
VKTwalkability
effective permeable area
EPA sq.m EIA/person
Neighbourhood Pattern Typ
ology
11
village patternSix Neighbourhood Patterns
600 hectares
○
○
○
○
○
○
○
○
○
○
○
○
○
○
○
○
○
○
○
○
○
○
○
○
○
○
○
○
○
○
○
○
○
○
○
○
○
○
○
○
○
○
○
○
○
○
○
○
○
○
○
○
○
○
○
○
○
○
○
○
○
○
○
○
○
○
○
○
○
○
○
○
○
○
○
○
○
○
○
○
○
○
○
○
○
○
○
○
○
○
○
○
○
○
○
○
○
○
○
○
○
○
○
○
○
○
○
○
○
○
○
○
○
○
○
○
○
○
○
○
○
○
○
○
○
○
○
○
○
○
○
○
○
○
○
○
○
○
○
○
○
○
○
○
○
○
○
○
○
○
○
○
○
○
○
○
○
○
○
○
○
○
○
○
○
○
○
○
○
○
○
○
○
○
○
○
○
○
○
○
○
○
○
○
○
○
○
○
○
○
○
○
○
○
large house
recreation local shopping
major business/commercial
apartment
major street
local street
school wild/agriculturalbuffer

12
Nei
ghbo
urho
od P
atte
rn T
ypol
ogy
0.0%
10.0%
20.0%
30.0%
40.0%
50.0%
60.0%
70.0%
80.0%
90.0%
100.0%
0
20
40
60
80
100
120
0.0%
10.0%
20.0%
30.0%
40.0%
50.0%
60.0%
70.0%
80.0%
90.0%
0.0%
10.0%
20.0%
30.0%
40.0%
50.0%
60.0%
70.0%
80.0%
90.0%
0.00%
20.00%
40.00%
60.00%
80.00%
100.00%
120.00%
0.00%
10.00%
20.00%
30.00%
40.00%
50.00%
60.00%
70.00%
80.00%
90.00%
100.00%
0
50
100
150
200
250
300
350
auto oriented patternSix Neighbourhood Patterns
housing mix
ped &
green
infras
tructu
rerural
village aut
o
landsc
ape
pedest
rian
ped &
green
infras
tructu
rerural
village aut
o
landsc
ape
pedest
rian
ped &
green
infras
tructu
rerural
village aut
o
landsc
ape
pedest
rian
ped &
green
infras
tructu
rerural
village aut
o
landsc
ape
pedest
rian
The Auto Oriented Pattern is laid outin a dendritic, or branching, streetsystem. Houses front ontoresidential streets that feed intocollector streets, which feed intomajor streets located at wideintervals. Major streets havesidewalks but often no street treesand are designed to move manylanes of traffic quickly. Local streetsare wide and often have neithersidewalks nor street trees. Manylocal streets are dead-ended, whichminimizes local traffic, but caninterrupt the district wide flow ofauto, foot and bike traffic.
Although much more dense thaneither the Rural or Village Patterns,the Auto Oriented Pattern remainsrelatively low density whencompared with traditional urbancommunities (3264.8 people/sq.km). The relatively low density,coupled with the pattern’s “low”land use mix and dendritic streetarrangement, means only 50% ofresidents can reach their dailydestinations on foot. Infrequent andlimited bus service means theremainder of trips are made by car.These trips are often of a relativelylong duration, given theunconnected street arrangement.VKT in this pattern is 66.6kilometres per household per day.
Most destinations cater toautomobiles, not pedestrians. Shopsand services are generally found inmalls and strip-malls along majorstreets. Schools are very oftenlarge, one-storey buildings fronted
by a parking lot. Parks are oftenfound in conjunction with schoolsand provide for a range of activerecreation activities.
The Auto Oriented Pattern has agreater mix of housing types, whichcan meet the needs of a widerrange of families (72.8% ofbenchmark), but few Georgia Basinhouseholds could afford Auto-Oriented single family homes(18%). The housing alternatives,however, are more equitably priced,making the Auto-Oriented Patternoverall affordable to 34.3% offamilies.
Unlike the previous two patterns,the Auto Oriented Pattern usescurbs and gutters on the street andan underground stormwatermanagement system. Rainwaterfrom roofs, driveways and streets iscollected in catchbasins without anychance of infiltration. Despite widepaved streets and driveways, thelarge yards of the Auto Orientedpattern maintain 46.0% effectivepermeability in residential areas,and 52.5% throughout the overallneighbourhood. Relatively lowresidential densities mean thatimpervious surface per personremains high (146 sq.m/person).
affordability
overall patternhouse
VKTwalkability
effective permeable area
EPA sq.m EIA/person

Neighbourhood Pattern Typ
ology
13
auto oriented patternSix Neighbourhood Patterns
24 hectares○
○
○
○
○
○
○
○
○
○
○
○
○
○
○
○
○
○
○
○
○
○
○
○
○
○
○
○
○
○
○
○
○
○
○
○
○
○
○
○
○
○
○
○
○
○
○
○
○
○
○
○
○
○
○
○
○
○
○
○
○
○
○
○
○
○
○
○
○
○
○
○
○
○
○
○
○
○
○
○
○
○
○
○
○
○
○
○
○
○
○
○
○
○
○
○
○
○
○
○
houserecreation local shopping ground-orientedmulti-family
major business/commercial
apartmentmajor street local streetschool

14
Nei
ghbo
urho
od P
atte
rn T
ypol
ogy
0.0%
10.0%
20.0%
30.0%
40.0%
50.0%
60.0%
70.0%
80.0%
90.0%
100.0%
0
20
40
60
80
100
120
0.0%
10.0%
20.0%
30.0%
40.0%
50.0%
60.0%
70.0%
80.0%
90.0%
0.0%
10.0%
20.0%
30.0%
40.0%
50.0%
60.0%
70.0%
80.0%
90.0%
0.00%
20.00%
40.00%
60.00%
80.00%
100.00%
120.00%
0.00%
10.00%
20.00%
30.00%
40.00%
50.00%
60.00%
70.00%
80.00%
90.00%
100.00%
0
50
100
150
200
250
300
350
housing mix
ped &
green
infras
tructu
rerural
village aut
o
landsc
ape
pedest
rian
rural
village aut
o
landsc
ape
pedest
rian
ped &
green
infras
tructu
re
rural
village aut
o
landsc
ape
pedest
rian
ped &
green
infras
tructu
re
ped &
green
infras
tructu
rerural
village aut
o
landsc
ape
pedest
rian
landscape oriented patternSix Neighbourhood Patterns
This neighbourhood pattern is basedon the interconnected street systemand adapts to fit the shape ofstream corridors, parks, and steepslopes. This modified network ofstreets balances sensitivity tolandscape features with connectivity.Streets in this neighbourhood arepedestrian friendly. Major streetshave a central, tree-lined boulevard.Trees and sidewalks line both sidesof the street. Local streets arenarrow with street trees andsidewalks on both sides. Autoaccess to houses is usually via aback lane rather than a frontdriveway.
By occasionally breaking the grid indeference to landform, the modifiedstreet network creates unusualblock shapes and causesinefficiencies in lot configuration.This results in a less-than-optimumdensity of 4194.5 people per squarekilometre. Moderate density, a“medium” land use mix, and a fairlyinterconnected street system meanover one-half of residents can walkto their daily needs (58.5%).Meandering roads mean longerdistances between destinations andmake driving more attractive;however, frequent and efficienttransit service and relative proximityto major business/commercial areasmeans VKT remains fairly low (45.9VKT/household/day).
Local shopping is situated along themajor street. Shops inhabit theground floor, often with apartmentsabove, and front directly on the
street. On-street parking providesauto access rather than street-frontparking lots. Schools are multiple-storey and small but frequent.Schools also front directly onto thestreet. Parks and preserved localecosystems are an important part ofthe landscape. These areas allowrainwater to seep into the groundnaturally and slowly refillstreamways, maintaining native fishhabitat. Because this patternpreserves undeveloped land ingreenway systems, 70.0% of theoverall pattern remains permeableto rainwater infiltration. Even inresidential areas, permeabilityremains high and, because densitieshere are higher, there are onlyabout 71.5 square metres ofimpermeable surface per person.
About 73% of Georgia Basinhouseholds could afford to live inthis pattern. A relatively highhousing mix (81.5%) would providethem with a wide range of housingchoices, allowing a wide range offamily types to live in theneighbourhood. Due to higherdensities (more people to pay forinfrastructure) and smaller yard andhouse sizes (less expensive topurchase and build), 35% ofGeorgia Basin households couldafford to own a single family home,although only 3.5% could afford thelarge houses that are a componentof this pattern.
The Pedestrian Oriented Pattern islaid out in an interconnected street
VKTwalkability
affordability
overall patternhouse
effective permeable area
EPA sq.m EIA/person

Neighbourhood Pattern Typ
ology
15
24 hectares
landscape oriented patternSix Neighbourhood Patterns
○
○
○
○
○
○
○
○
○
○
○
○
○
○
○
○
○
○
○
○
○
○
○
○
○
○
○
○
○
○
○
○
○
○
○
○
○
○
○
○
○
○
○
○
○
○
○
○
○
○
○
○
○
○
○
○
○
○
○
○
○
○
○
○
○
○
○
○
○
○
○
○
○
○
○
○
○
○
○
○
○
○
○
○
○
○
○
○
○
○
○
○
○
○
○
○
○
○
○
○
○
○
○
○
○
○
○
○
○
○
○
○
○
○
○
○
○
○
○
○
○
○
○
○
○
○
○
○
○
○
○
○
○
○
○
○
○
○
○
○
○
○
○
○
○
○
○
○
○
○
○
○
○
○
○
○
○
○
○
○
○
○
○
○
○
○
○
○
○
○
○
○
○
○
○
○
○
○
○
○
○
○
○
○
○
○
○
○
○
○
○
○
○
○
○
○
○
house
large houserecreation lane
local street
apartment local shopping
major streetground-orientedmulti-family
preserved stream/greenway
major business/commercial
local street
school
16
Nei
ghbo
urho
od P
atte
rn T
ypol
ogy
0.0%
10.0%
20.0%
30.0%
40.0%
50.0%
60.0%
70.0%
80.0%
90.0%
0.0%
10.0%
20.0%
30.0%
40.0%
50.0%
60.0%
70.0%
80.0%
90.0%
0.00%
20.00%
40.00%
60.00%
80.00%
100.00%
120.00%
0.00%
10.00%
20.00%
30.00%
40.00%
50.00%
60.00%
70.00%
80.00%
90.00%
100.00%
0
50
100
150
200
250
300
350
0.0%
10.0%
20.0%
30.0%
40.0%
50.0%
60.0%
70.0%
80.0%
90.0%
100.0%
0
20
40
60
80
100
120
pedestrian oriented patternSix Neighbourhood Patterns
housing mix
ped &
green
infras
tructu
rerural
village aut
o
landsc
ape
pedest
rian
ped &
green
infras
tructu
rerural
village aut
o
landsc
ape
pedest
rian
ped &
green
infras
tructu
rerural
village aut
o
landsc
ape
pedest
rian
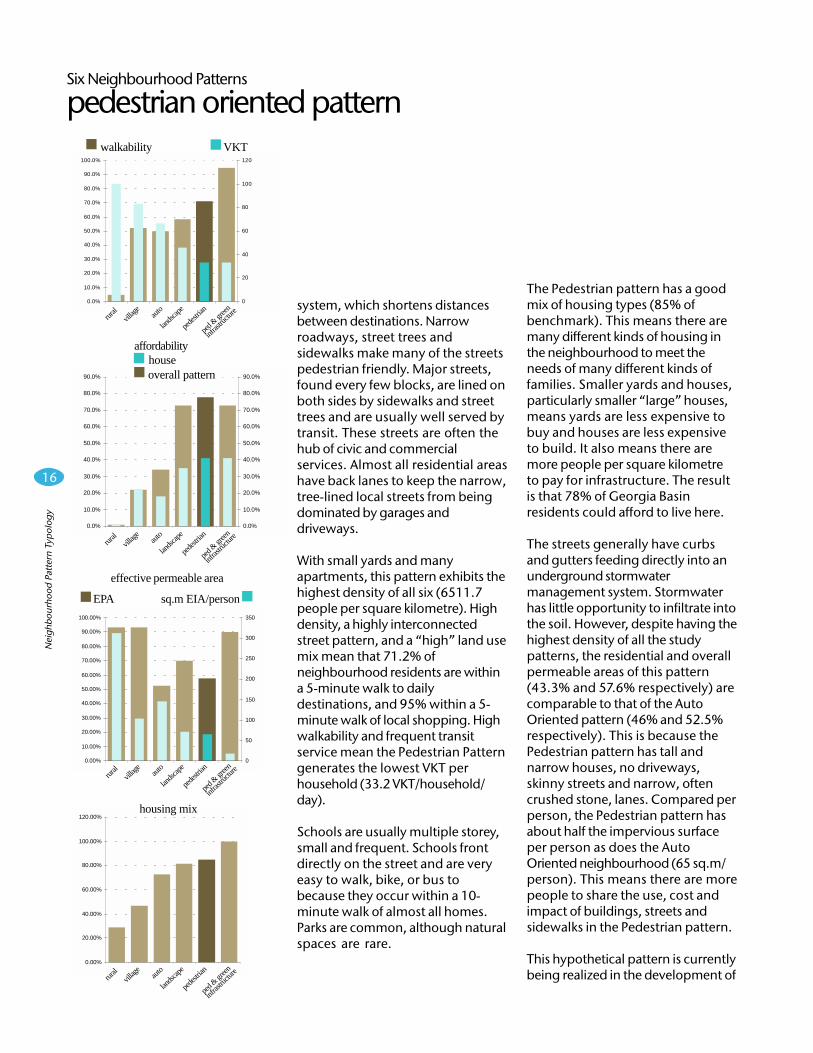
system, which shortens distancesbetween destinations. Narrowroadways, street trees andsidewalks make many of the streetspedestrian friendly. Major streets,found every few blocks, are lined onboth sides by sidewalks and streettrees and are usually well served bytransit. These streets are often thehub of civic and commercialservices. Almost all residential areashave back lanes to keep the narrow,tree-lined local streets from beingdominated by garages anddriveways.
With small yards and manyapartments, this pattern exhibits thehighest density of all six (6511.7people per square kilometre). Highdensity, a highly interconnectedstreet pattern, and a “high” land usemix mean that 71.2% ofneighbourhood residents are withina 5-minute walk to dailydestinations, and 95% within a 5-minute walk of local shopping. Highwalkability and frequent transitservice mean the Pedestrian Patterngenerates the lowest VKT perhousehold (33.2 VKT/household/day).
Schools are usually multiple storey,small and frequent. Schools frontdirectly on the street and are veryeasy to walk, bike, or bus tobecause they occur within a 10-minute walk of almost all homes.Parks are common, although naturalspaces are rare.
The Pedestrian pattern has a goodmix of housing types (85% ofbenchmark). This means there aremany different kinds of housing inthe neighbourhood to meet theneeds of many different kinds offamilies. Smaller yards and houses,particularly smaller “large” houses,means yards are less expensive tobuy and houses are less expensiveto build. It also means there aremore people per square kilometreto pay for infrastructure. The resultis that 78% of Georgia Basinresidents could afford to live here.
The streets generally have curbsand gutters feeding directly into anunderground stormwatermanagement system. Stormwaterhas little opportunity to infiltrate intothe soil. However, despite having thehighest density of all the studypatterns, the residential and overallpermeable areas of this pattern(43.3% and 57.6% respectively) arecomparable to that of the AutoOriented pattern (46% and 52.5%respectively). This is because thePedestrian pattern has tall andnarrow houses, no driveways,skinny streets and narrow, oftencrushed stone, lanes. Compared perperson, the Pedestrian pattern hasabout half the impervious surfaceper person as does the AutoOriented neighbourhood (65 sq.m/person). This means there are morepeople to share the use, cost andimpact of buildings, streets andsidewalks in the Pedestrian pattern.
This hypothetical pattern is currentlybeing realized in the development of
ped &
green
infras
tructu
rerural
village aut
o
landsc
ape
pedest
rian
walkability VKT
affordability
overall patternhouse
effective permeable area
sq.m EIA/personEPA

Neighbourhood Pattern Typ
ology
17
pedestrian patternSix Neighbourhood Patterns
24 hectares
○
○
○
○
○
○
○
○
○
○
○
○
○
○
○
○
○
○
○
○
○
○
○
○
○
○
○
○
○
○
○
○
○
○
○
○
○
○
○
○
○
○
○
○
○
○
○
○
○
○
○
○
○
○
○
○
○
○
○
○
○
○
○
○
○
○
○
○
○
○
○
○
○
○
○
○
○
○
○
○
○
○
○
○
○
○
○
○
○
○
○
○
○
○
○
○
○
○
○
○
○
○
○
○
○
○
○
○
○
○
○
○
○
○
○
○
○
○
○
○
○
○
○
○
○
○
○
○
○
○
○
○
○
○
○
○
○
○
○
○
○
○
○
○
○
○
○
○
○
○
○
○
○
○
○
○
○
○
○
○
○
○
○
○
○
○
○
○
○
○
major street apartmentlocal shoppingground-orientedmulti-family school
large house recreation lanelocal streetmajor business/commercial
18
Nei
ghbo
urho
od P
atte
rn T
ypol
ogy
0.0%
10.0%
20.0%
30.0%
40.0%
50.0%
60.0%
70.0%
80.0%
90.0%
0.0%
10.0%
20.0%
30.0%
40.0%
50.0%
60.0%
70.0%
80.0%
90.0%
0.00%
20.00%
40.00%
60.00%
80.00%
100.00%
120.00%
0.00%
10.00%
20.00%
30.00%
40.00%
50.00%
60.00%
70.00%
80.00%
90.00%
100.00%
0
50
100
150
200
250
300
350
0.0%
10.0%
20.0%
30.0%
40.0%
50.0%
60.0%
70.0%
80.0%
90.0%
100.0%
0
20
40
60
80
100
120
pedestrian & green infrastructure patternSix Neighbourhood Patterns
housing mix
ped &
green
infras
tructu
rerural
village aut
o
landsc
ape
pedest
rian
ped &
green
infras
tructu
rerural
village aut
o
landsc
ape
pedest
rian
ped &
green
infras
tructu
rerural
village aut
o
landsc
ape
pedest
rian
ped &
green
infras
tructu
rerural
village aut
o
landsc
ape
pedest
rian
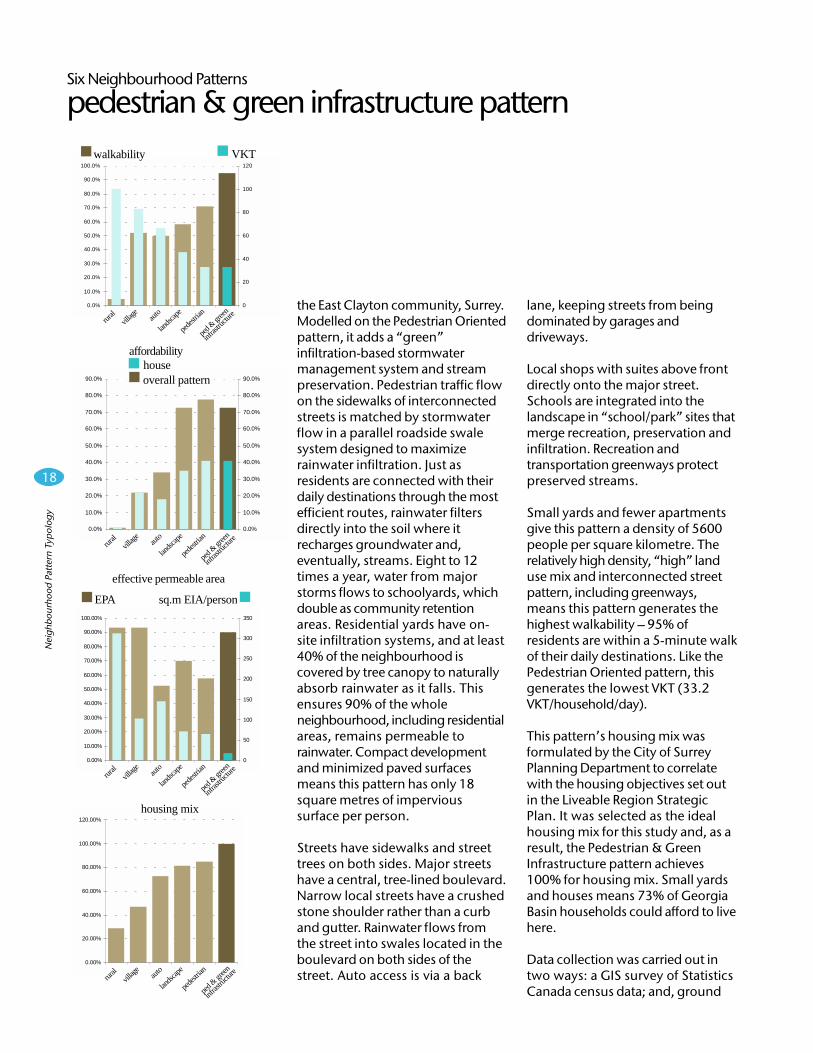
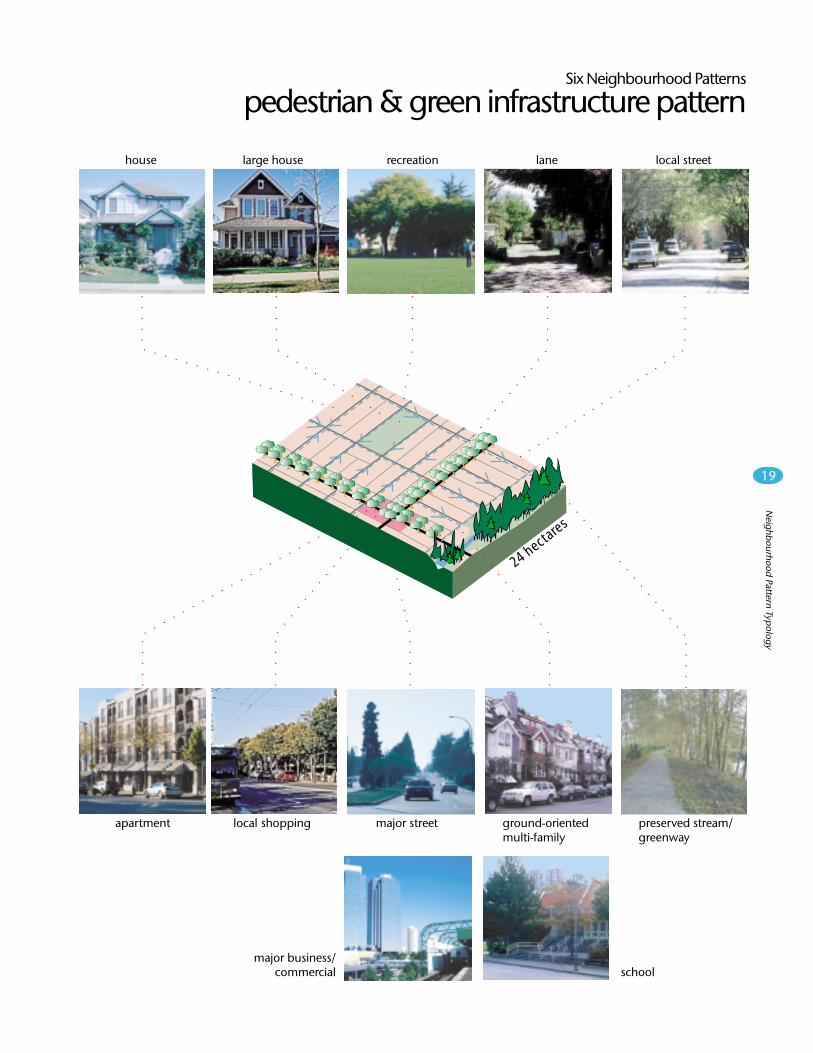
the East Clayton community, Surrey.Modelled on the Pedestrian Orientedpattern, it adds a “green”infiltration-based stormwatermanagement system and streampreservation. Pedestrian traffic flowon the sidewalks of interconnectedstreets is matched by stormwaterflow in a parallel roadside swalesystem designed to maximizerainwater infiltration. Just asresidents are connected with theirdaily destinations through the mostefficient routes, rainwater filtersdirectly into the soil where itrecharges groundwater and,eventually, streams. Eight to 12times a year, water from majorstorms flows to schoolyards, whichdouble as community retentionareas. Residential yards have on-site infiltration systems, and at least40% of the neighbourhood iscovered by tree canopy to naturallyabsorb rainwater as it falls. Thisensures 90% of the wholeneighbourhood, including residentialareas, remains permeable torainwater. Compact developmentand minimized paved surfacesmeans this pattern has only 18square metres of impervioussurface per person.
Streets have sidewalks and streettrees on both sides. Major streetshave a central, tree-lined boulevard.Narrow local streets have a crushedstone shoulder rather than a curband gutter. Rainwater flows fromthe street into swales located in theboulevard on both sides of thestreet. Auto access is via a back
lane, keeping streets from beingdominated by garages anddriveways.
Local shops with suites above frontdirectly onto the major street.Schools are integrated into thelandscape in “school/park” sites thatmerge recreation, preservation andinfiltration. Recreation andtransportation greenways protectpreserved streams.
Small yards and fewer apartmentsgive this pattern a density of 5600people per square kilometre. Therelatively high density, “high” landuse mix and interconnected streetpattern, including greenways,means this pattern generates thehighest walkability – 95% ofresidents are within a 5-minute walkof their daily destinations. Like thePedestrian Oriented pattern, thisgenerates the lowest VKT (33.2VKT/household/day).
This pattern’s housing mix wasformulated by the City of SurreyPlanning Department to correlatewith the housing objectives set outin the Liveable Region StrategicPlan. It was selected as the idealhousing mix for this study and, as aresult, the Pedestrian & GreenInfrastructure pattern achieves100% for housing mix. Small yardsand houses means 73% of GeorgiaBasin households could afford to livehere.
Data collection was carried out intwo ways: a GIS survey of StatisticsCanada census data; and, ground
affordability
overall patternhouse
VKTwalkability
effective permeable area
sq.m EIA/personEPA
Neighbourhood Pattern Typ
ology
19
pedestrian & green infrastructure patternSix Neighbourhood Patterns
24 hectares
○
○
○
○
○
○
○
○
○
○
○
○
○
○
○
○
○
○
○
○
○
○
○
○
○
○
○
○
○
○
○
○
○
○
○
○
○
○
○
○
○
○
○
○
○
○
○
○
○
○
○
○
○
○
○
○
○
○
○
○
○
○
○
○
○
○
○
○
○
○
○
○
○
○
○
○
○
○
○
○
○
○
○
○
○
○
○
○
○
○
○
○
○
○
○
○
○
○
○
○
○
○
○
○
○
○
○
○
○
○
○
○
○
○
○
○
○
○
○
○
○
○
○
○
○
○
○
○
○
○
○
○
○
○
○
○
○
○
○
○
○
○
○
○
○
○
○
○
○
○
○
○
○
○
○
○
○
○
○
○
○
○
○
○
○
○
○
○
○
○
○
○
○
○
○
○
○
○
○
○
○
○
○
○
○
○
○
○
○
○
○
○
○
○
○
○
○
○
○
○
○
house large house recreation lane local street
apartment local shopping major street ground-orientedmulti-family
preserved stream/greenway
schoolmajor business/
commercial

20
Nei
ghbo
urho
od P
atte
rn T
ypol
ogy
neighbourhoodpattern typologyMethodology
aboaboaboaboabovvvvveeeeeEach Neighbourhood Pattern was conceptu-ally divided into between one and four StudySites, based on the kinds of residentialdevelopment inherent to each pattern. EachStudy Site represents one residential typefound within the Neighbourhood Pattern.Generally, four types of residential develop-ment were identified: Large House, House,Ground Oriented Multi-Family, andApartment. Overall, a requirement forseventeen Study Sites was identified.
reconnaissance. The data collectedwas chosen on the basis of the fivesustainability factors: walkability,vehicle kilometres travelled (“VKT”),affordability, housing mix, andeffective permeability. Data wascollected at two scales: 1) fromdetailed Study Sites; and, 2) fromlarger Component Neighbourhoodssurrounding the Study Sites.
Study SitesIn virtually all cases, data on theNeighbourhood Patterns wasgathered by examining actual siteswithin the Greater VancouverRegional District (GVRD). Prior tothe selection of these sites, thekinds of residential developmentinherent to each NeighbourhoodPattern were identified. Four typesof residential development weregenerally identified: Large House(with lots wider than ten metres);House (with lots less-than-or-equal-to ten metres wide); Ground-Oriented Multiple Family (multiplefamily development where eachresidence is accessed directly fromthe street, such as townhouses orduplexes); and, Apartment/Condominium (multiple familydevelopment where each residenceis accessed from an interiorcorridor). Based on these fourresidential types, eachNeighbourhood Pattern wasconceptually divided into betweenone and four Study Sites. EachStudy Site represents oneresidential type found within theNeighbourhood Pattern.
Out of this process, an overallrequirement for seventeen StudySites was realized (see below). Forthirteen of these, a Study Siteconsisting of purely residential landuse was selected from within theGVRD. The remaining four comprisethe Study Sties for the Pedestrian &Green Infrastructure NeighbourhoodPattern, for which no built examplescurrently exist within the GeorgiaBasin. The East Claytonneighbourhood in Surrey wasselected to represent the Pedestrian& Green InfrastructureNeighbourhood Pattern. Currentlyunder construction, the East Claytonneighbourhood is as a prototypical“complete community,” featuring notonly residential, recreational, work,services and amenities, but also anenvironmentally responsibleinfiltration-based stormwatermanagement system. Data wastaken from the East ClaytonNeighbourhood Concept Plan, City ofSurrey, 2000 in lieu of real StudySites (see table, facing page andAppendix 3).
Study Sites were selected followingthree primary criteria: residentialtype; conformance to the streetarrangement of the overarchingNeighbourhood Pattern; and,correlation to a pre-existingStatistics Canada “enumerationarea.” The final criterion wasincluded in the interest of simplifyingthe data collection process; virtuallyall data required for theNeighbourhood Submodel was
available by “enumeration area”through Statistics Canada.
The Study Site was the locus ofresidential type-specificinvestigations, such as calculatingresidential permeability.
Component NeighbourhoodSurrounding each Study Site, thephysical boundaries of the broaderComponent Neighbourhood wereidentified and delineated. While theland use within the Study Site ispurely residential, the ComponentNeighbourhood may consist ofvarious residential types,commercial, recreational andinstitutional (primarily school) areas,which fulfill a variety of daily needsfor residents. The Study Site maybe imagined as being embeddedwithin the urban fabric of thebroader Component Neighbourhood.
The boundaries of ComponentNeighbourhoods were selectedfollowing a number of criteria. Theedges of a neighbourhood vary incharacter, particularly between
Data Collection
24 hectares
24 hectares
24 hectares
24 hectares
600 hectares
600 hectares
Neighbourhood Pattern Typ
ology
21
large house ground-orientedmulti-family
house
rural pattern
village pattern
auto oriented pattern
24 hectares
24 hectares
24 hectares
600 hectares
600 hectares
24 hectares
landscape oriented pattern
pedestrian oriented pattern
pedestrian & green infrastructure pattern
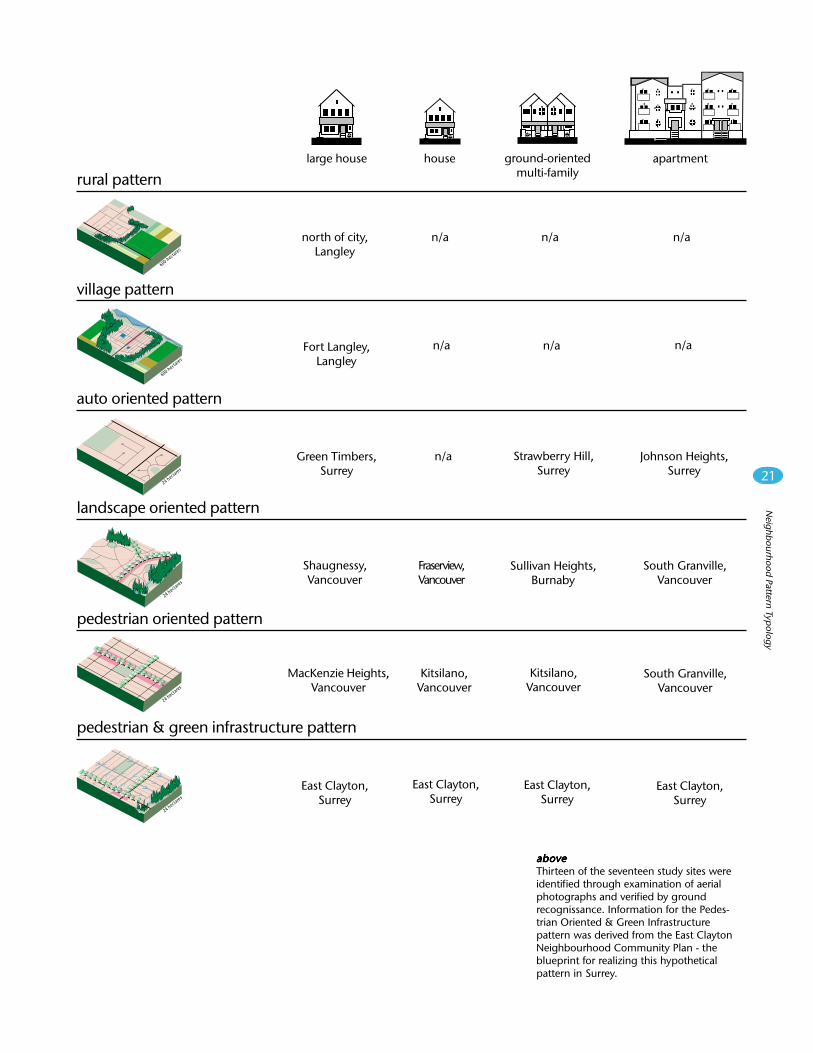
north of city,Langley
East Clayton,Surrey
MacKenzie Heights,Vancouver
Shaugnessy,Vancouver
Green Timbers,Surrey
Fort Langley,Langley
n/a
Kitsilano,Vancouver
Fraserview,Vancouver
n/a
South Granville,Vancouver
South Granville,Vancouver
Johnson Heights,Surrey
apartment
n/a
Kitsilano,Vancouver
Sullivan Heights,Burnaby
Strawberry Hill,Surrey
n/a n/an/a
n/a
East Clayton,Surrey
East Clayton,Surrey
East Clayton,Surrey
aboaboaboaboabovvvvveeeeeThirteen of the seventeen study sites wereidentified through examination of aerialphotographs and verified by groundrecognissance. Information for the Pedes-trian Oriented & Green Infrastructurepattern was derived from the East ClaytonNeighbourhood Community Plan - theblueprint for realizing this hypotheticalpattern in Surrey.

22
Nei
ghbo
urho
od P
atte
rn T
ypol
ogy
aboaboaboaboabovvvvveeeeeUp to four Study Sites and ComponentNeighbourhoods were selected for each ofthe Neighbourhood Patterns. Each Study Sitewas selected to represent one housing typefound within that Neighbourhood Pattern.The physical boundaries of the broaderComponent Neighbourhood were thenidentified surrounding each Study Site. TheStudy Site should be imagined as embeddedwithin the surrounding urban fabric of theComponent Neighbourhood. TheNeighbouhood Pattern should be imaginedas a puzzle, in which the separate Study Site/Component Neighbourhood pieces fittogether to form one complete picture.
different Neighbourhood Patterns.Generally, correlation to acontiguous group of pre-existingStatistics Canada enumerationareas defined the boundaries ofComponent Neighbourhoods.Landform, major transportationroutes, streams and otherwaterways also influenced thelocation of these boundaries.
The Component Neighbourhoodprovided information on broadercontext-based neighbourhoodissues, such as walking distances toneighbourhood amenities.
Data collected from the Study Sitesand Component Neighbourhoodswas used to formulate scores forhousing mix, affordability, vehiclekilometres travelled, permeability,
Data Analysiswalkability, land use mix, anddensity for each of the sixNeighbourhood Patterns.
It is important to note afundamental assumption made forthis study: although almost all ofthese Neighbourhood Patterns arepre-existing, the purpose of thisstudy is to describe how each wouldfunction as new development in theGeorgia Basin. This means certainvariables between existingComponent Neighbourhoods, suchas property value or distance to theCentral Business District, have beenheld constant across allNeigbourhood Patterns.
Walkability“The percentage of population withina 5-minute walk of daily needs.”
Walkability measures thepercentage of the population withina five-minute walk of daily needs,including: local shopping, schools,and recreation. Walkability to workwas not determined. The accepteddistance for a five-minute walk is400 metres, which was measuredradially (as opposed to alongstreets) from the centre point ofparks, school and local shopping. In
24 hectares
NeighbourhoodPattern
data gathered from Study Sites & Component Neighbourhoods

Neighbourhood Pattern Typ
ology
23
cases where daily needs were notlocated at a single point, but along aline, two parallel lines at 400 metresto either side of the amenity wereestablished and the resulting areacontained by the lines wasmeasured. The area of theComponent Neighbourhoodsurrounding each particular type ofamenity was multiplied by thepopulation density of the ComponentNeighbourhood. The product is anapproximation of the number ofpeople that can walk to a particulartype of amenity within 5-minutes.
An overall number of people withina 5-minute walk of daily needs wasproduced for each ComponentNeighbourhood by averaging thenumber of people who could walk tolocal shopping, schools, and parks.A final Walkability score wasproduced for each NeighbourhoodPattern by weighing the ComponentNeighbourhood averages by thepercentage of the population of thatpattern who live in the particularComponent Neighbourhood.
Vehicle Kilometres Travelled“The average number of kilometresdriven per household per day.”
Vehicle Kilometres Travelled, or VKT,for each component neighbourhoodwas calculated using the“Greenhouse Gas Emissions fromUrban Travel: Tool for EvaluatingNeighbourhood Sustainability”,produced by the Canada Mortgageand Housing Corporation. The tooluses an Excel spread sheet tocalculate average daily VKT oncethe user has inputted the following18 variables: street layout;kilometres of road; number ofintersections; kilometres of arterials(3 or more lanes in both directions);kilometres of bike path; total grossland area; total number of housingunits; distance to nearest commuterrail station; housing mix; number ofjobs in a 1 kilometre radius; numberof grocery stores in a 1 kilometreradius; expected household size;expected population under 16 years
old; expected average householdemployment income; distance tocentral business district; number ofjobs in a 5 kilometre radius ofcentre of neighbourhood; transitservice vehicle hours; and, distanceto nearest rapid transit. Thesevariables were established for eachComponent Neighbourhood with theexception of distance to the centralbusiness district (CBD). The distanceto the CBD was made constant at 15kilometres so VKT reflected solelyneighbourhood features, and notproximity of existing ComponentNeighbourhoods to a CBD. Thisprovides a clearer illustration of therelationship between NeighbourhoodPattern and daily driving habits.
The VKT for each NeighbourhoodPattern was determined byweighting the VKT output for eachComponent Neighbourhood by itspercentage of total households forthat pattern.
Affordability“The percentage of Georgia Basinhouseholds who could afford to buy adwelling.”
Affordability measures thepercentage of existing Georgia Basinhouseholds that could afford to livein a particular pattern. Affordability,therefore, is a function of incomedistribution and housing cost. Todetermine the affordability of aPattern, two fundamentalassumptions were made: 1) thecost of construction would be heldconstant at $860.80 per squaremetre ($80.00/sq.ft); and, 2) thecost of land would be held constantat $74.13 per square metre($300,000.00/acre). The purpose ofthese assumptions was to connectaffordability to house and lot size,and to eliminate location as avariable affecting value. As noted,this allows the calculation tocompare the affordability of eachNeighbourhood Pattern as newdevelopment in the Georgia Basin.
Average unit and lot sizes weredetermined. For single family homesin the Rural and the VillagePatterns, aerial photos and GISsoftware were used to determine anaverage lot and house size. For thePedestrian Oriented and LandscapeOriented Patterns, detailedinformation regarding averagehouse and lot sizes for differenthousing types in each of theComponent Neighbourhoods wasavailable in the Housing Price IndexUser’s Guide produced by theGreater Vancouver Real EstateBoard. For the Automobile Pattern,the same information was availablethrough the Fraser Valley RealEstate Board’s Housing Price Index.As the Pedestrian & GreenInfrastructure Pattern is based onthe Pedestrian Oriented Pattern, forthis study it is assumed that lot andhouse sizes will be comparablebetween the two patterns. Averagelot sizes, and in some cases, unitsizes for multi family residences,and apartments were not available,but were calculated using aerialphotos, GIS software, floor arearatios, and the average unitdimensions from the Housing PriceIndex.
For each Neighbourhood Pattern,unit and lot size were thenmultiplied by their respective priceconstants (see above). Thisproduced an average cost for eachtype of dwelling in eachNeighbourhood Pattern.
To create an average Affordabilityscore for each NeighbourhoodPattern, the average cost of eachtype of dwelling was weighed by itsprevalence in the NeighbourhoodPattern (see housing typedistribution in Housing Mix, above)to produce an average dwellingcost. Generally, it was assumed thatan income of no less than one-thirdof the cost of a dwelling is requiredfor that residence to be consideredaffordable for a family. UsingStatistics Canada data, whichidentifies how many households in

24
Nei
ghbo
urho
od P
atte
rn T
ypol
ogy
the Georgia Basin fall in thefollowing income categories: 0-$19,999; $20,000-$39,999;$40,000-$59,999; $60,000-$79,999;and $80,000+, we were then able toestimate how many householdsearned the income required toafford the average dwelling cost ofeach Neighbourhood Pattern. A finalAffordability score, represented bythe percentage of Georgia Basinhouseholds who can afford to live ineach pattern, was produced foreach pattern by dividing the numberof households who could afford theaverage cost of dwelling by the totalnumber of households in theGeorgia Basin.
Housing Mix“The percent similarity to housing mixbenchmark.”
Housing Mix measures how closelythe range of housing types in eachNeighbourhood Pattern match apredetermined ideal mix of housingtypes. Five housing types, identifiedby Statistics Canada, wereidentified: Single Family Detached;Semi Detached; Town/RowHousing; Apartments Less than 5Storeys; and, Apartments 5 Storeysor More. The distribution of housingtypes described by the East ClaytonNeighbourhood Concept Plan wasselected as the ideal benchmarkagainst which the NeighbourhoodPatterns would be compared. Thispattern’s housing mix wasformulated by the City of SurreyPlanning Department to correlatewith the housing objectives set outin the Liveable Region StrategicPlan.
The distribution of housing types foreach of the Neighbourhood Patternswas determined in one of threeways. For the Rural and VillageNeighbourhood Patterns, which arecomprised of a single ComponentNeighbourhood, the distribution ofthese types was taken fromenumeration area data. The sizeand complexity of the Pedestrian,Automobile, and Landscape
Neighbourhood Patterns, which arecomprised of up to four ComponentNeighbourhoods, necessitatedreliance on data provided inDwellings by Structure Type inGreater Vancouver produced by thePolicy and Planning Department ofthe GVRD in 1999. Housingdistribution in the Pedestrian &Green Infrastructure NeighbourhoodPattern was taken from the EastClayton Neighbourhood ConceptPlan, City of Surrey, 2000.
To formulate a Housing Mix score,the standard deviation from thebenchmark was calculated for eachNeighbourhood Pattern. Eachstandard deviation was thensubtracted from 100, and the overallresults were scaled between 1 and100. The resulting Housing Mixscore is represented as thepercentage of the benchmarkhousing mix, with 100% being aperfect score. The Housing Mixscore does not represent an actualpercentage of the benchmarkhousing types. For example, a scoreof 50% would not necessarilycorrelate to that NeighbourhoodPattern having only half of the kindsof housing found in the benchmark.The Housing Mix score should beunderstood instead as representingthe degree of similarity to thebenchmark, relative to allNeighbourhood Patterns. The resultis a Housing Mix score for eachNeighbourhood Pattern that isintuitively understandable by usersof GB-QUEST without comparison toother Neighbourhood Patterns, orthe benchmark.
Effective Permeable Area“The percentage of pattern area thatis permeable to rain.”
As noted, when most of the rainwater from a surface is eitherdirectly infiltrated, or is redirectedto and infiltrated by another surface,it is effectively permeable torainwater (see Effective PermeableArea, Section 1). EffectivePermeable Area, or EPA, measures
the percent of effectively permeablesurface area within aNeighbourhood Pattern.
The EPA for residential areas wasdetermined from the Study Site ofeach Component Neighbourhood.The calculation was divided bystreets and lots. For both, all areasthat rain can infiltrate, or that directmost of their water to anothersurface where rain can infiltratewere considered permeable.Through ground reconnaissance,the kinds of effectively imperviousareas in each Study Site weredetermined.
For Streets, EPA is the percentageof the entire Right-of-Way (ROW)that is effectively permeable. Aerialphotos and GIS were used todetermine the length of roads andROW widths in the Study Site. Thewidths of the paved street surfacesand sidewalks were measuredduring ground reconnaissance, andmultiplied by the road length todetermine impervious area,wherever appropriate. The totalROW area minus the totalimpervious surface area gave totalstreet EPA. Street EPA wasconverted to the percentage of totalROW area effectively permeable towater.
For lots, EPS is the percentage ofthe entire lot that is effectivelypermeable. Permeability wasdetermined using GIS and aerialphotos to establish averagedriveway area, and using the sameaverage lot and building footprint asestablished for the affordabilitycalculation (see Affordability,above). The total lot area minus thetotal effective impervious areawithin the lot gave total lot EPA. LotEPA was converted to thepercentage of total lot areaeffectively permeable to water.
To calculate EPA for the wholeComponent Neighbourhood,including other non-residential uses,total park, commercial, and school
Neighbourhood Pattern Typ
ology
25
areas were determined. Thesewere multiplied by imperviousratings to establish the total EIA foreach of these land uses. The totalarea of each land use minus the EIAof each land use gave EPA for eachland use. These areas were thencombined with residential EPA forthe Component Neighbourhood(derived by multiplying thepercentage of permeable area bythe total area of residentialdevelopment in the ComponentNeighbourhood) and street EPA forthe Component Neighbourhood(derived by multiplying thepercentage of permeable area bythe total area of ROWs in theComponent Neighbourhood).Collectively, the sum of theimpermeable area of the streets,residential areas, parks, schools,and commercial areas, divided bythe entire area measured yieldedthe total EPA for the ComponentNeighbourhood.
Two patterns are served by ditchesrather than by a conventional stormwater system: the Rural and VillagePatterns. Ditches, although they doallow some beneficial infiltration tooccur, are intended to deliverrainwater to streams. This meansthey function largely the same wayas underground stormwatermanagement systems. For thepurpose of this study, the infiltrationeffectiveness of ditches wasassumed to be higher than it likelyis, at 50%. For the Rural and VillagePatterns, all EIA calculations weremultiplied by one half to allow forthe potential infiltration benefits.
To calculate EPA for theNeighbourhood Pattern, the EPA ofeach Component Neighbourhoodwas weighted by its percent of thetotal area of the pattern.
Permeability for East Clayton wastaken from the East ClaytonNeighbourhood Concept Plan.
EIA per person was also calculatedfor each neighbourhood Pattern by
dividing the total EIA in each patternby the total number of peopleresiding in that pattern.
Land Use Mix“The degree of intermingling ofdifferent activities.”
Land use mix is one of the threefactors that were used to generatethe Neighbourhood Patterns (alongwith density and streetarrangement), which were originallycategorized as high, medium, low,very low and almost none. Noadditional data was required in thisarea.
Density“The ratio of people to area.”
Density was also one of the threefactors used to generate theNeighbourhood Patterns, whichwere originally categorized inranges of high, medium, low andvery low. Specific densities for eachNeighbourhood Pattern werecalculated in the course of the study,as these were required as inputs toother calculations.
The density of both people anddwelling units was calculated foreach of the ComponentNeighbourhoods. Population andtotal dwelling units for theenumeration areas that comprisedeach component neighbourhoodwas available from StatisticsCanada.
To determine the density of peopleper square kilometre, thepopulations of the individualenumeration areas that comprised aComponent Neighbourhoods weresummed and divided by the totalarea of the ComponentNeighbourhood as determined usingGIS.
Similarly, to determine the densityof dwelling units per hectare, thetotal number of dwelling units for allof the individual enumeration areas
was summed and divided by theComponent Neighbourhood area.
The Neighbourhood submodeldiffers functionally and qualitativelyfrom most of the other GB-Questsubmodels. The outputs obtainedfrom the Neighbourhood submodelare shaped through inputs providedby the user and do not rely uponinputs from other submodels. Themajor output of the Neighbourhoodsubmodel will be images,descriptions and data related to theselected neighbourhood patterns,although numerical outputs from theNeighbourhood submodel will alsoprovide inputs into the Cost of Livingand Transportation submodels. Mostof the information gathered during

26
Nei
ghbo
urho
od P
atte
rn T
ypol
ogy
neighbourhoodpattern typologyRole in GB-QUEST
choose general residentialdensity from Urban
Development Densityslider
scroll over the neighbourhoodpattern matrix (see image right)to view descriptions of the six
neighbourhood patterns
from the neighbourhoodpattern matrix choose a
neighbourhood pattern for high,medium, low and very low
residential development
USE
R I
NPU
TU
SER
IN
PUT
USE
R I
NPU
TU
SER
IN
PUT
USE
R I
NPU
TN
EIG
HB
NEI
GH
BN
EIG
HB
NEI
GH
BN
EIG
HB
OU
RH
OO
D S
UB
MO
DEL
OU
TPU
TO
UR
HO
OD
SU
BM
OD
EL O
UT
PUT
OU
RH
OO
D S
UB
MO
DEL
OU
TPU
TO
UR
HO
OD
SU
BM
OD
EL O
UT
PUT
OU
RH
OO
D S
UB
MO
DEL
OU
TPU
T
four NeighbourhoodPattern image screens (seeiamge right) visually andtextually illustrating the
kinds of high, medium, lowand very low density
neighbourhoods resultingfrom choices made above
five headlines summarizing:1) land use mix; 2)
walkability; 3) permeabil-ity; 4) affordability; and, 5)
housing mix - for theGeorgia Basin, resultingfrom choices made above
two numerical outputssummarizing house andapartment cost for each
pattern, which will be usedby the Affordability
submodel; and, mode splitfor each pattern, which willbe used by the Transporta-
tion submodel
aboaboaboaboabovvvvveeeeeas show in the above flowchart, theNeighbourhood Submodel is shapedthrough inputs provided by the user andproduces outputs that visually describe theresulting community.
the Site Inventory phase of thestudy will be available to the user asverbal analysis, both in the inputand output stages of play.
User InputsUser InputsUser InputsUser InputsUser InputsThe user is presented with oneslider and one matrix from which tomake choices about the wayneighbourhoods will develop. First,the user selects a position onresidential density from the “UrbanDevelopment Density” slider. Theuser is presented with a continuumof five choices from “High Density”to “Low Density.” Each optionrepresents a preset ratio of high,medium, low and very lowdevelopment densities. The chosenratio will be applied to all newdevelopment within the GeorgiaBasin.
Second, the user selects oneneighbourhood pattern for each ofthe four development densities. Theneighbourhood patterns arepresented to the user as diagramsorganized in a matrix of densityversus auto dependency (see figurefacing page, top). As the userscrolls over each diagram in thematrix, additional information on thequalities of that neighbourhoodpattern appears in the side-bar,including: description and, in somecases, origin of the pattern;walkability versus auto dependence;location of shops, services andschools; ability to accommodatedifferent family types; location andtype of recreation space; and,method of stormwater
management. This information isbased on the data gathered in theSite Inventory phase of this study,and is intended to assist moreinquisitive users in making better-informed choices.
Neighbourhood SubmodelNeighbourhood SubmodelNeighbourhood SubmodelNeighbourhood SubmodelNeighbourhood SubmodelOutputsOutputsOutputsOutputsOutputsThe Neighbourhood submodel willproduce three types of outputs: 1)image screens that visually andtextually illustrate the kinds ofneighbourhoods resulting from theuser’s neighbourhood patternselections; 2) five “Headlines” thathighlight key impacts resulting fromthe user’s neighbourhood patternselections; and, 3) numericaloutputs serving as inputs to theTransportation and Cost of Livingsubmodels.
Image ScreensImage ScreensImage ScreensImage ScreensImage ScreensFor each residential density, theNeighbourhood submodel will outputa detailed image screen of theNeighbourhood Pattern chosen.Each screen will be comprised ofthe Neighbourhood Pattern diagramsurrounded by thumbnailphotographs of that pattern’scomponent parts (see figure bottomright). The diagram is a repeat ofthat found on the input screen. Thediagram depicts the arrangement ofstreets, developed areas and parksor open space typical of theNeighbourhood Pattern. Thecomponent parts that comprise aNeighbourhood Pattern may include:apartment, ground-oriented

Neighbourhood Pattern Typ
ology
27
VillageRural
PedestrianOriented
PedestrianOriented
AutomobileOriented
LandscapeOriented
LandscapeOriented
AutomobileOriented
24 hectares
24 hectares
24 hectares
24 hectares
Pedestrian Oriented &Green Infrastructure
DENSITYAUTO USE
HIGH
HIGH MEDIUM LOW
MEDIUM
LOW
> 8900people/sq km
5600 - 8900people/sq km
2850 - 5600people/sq km
VERY LOW< 2850
people/sq km
600 hectares
Neigbourhood Pattern
Village Neighbourhood PatternA Village is a complete neighbourhood surroundedby agricultural land. the strong centre of a Villageis due to its location at the intersection oftransportation corridors. Generally, one of thesecorridors will develop as a Main Street, wherelimited local commercial and business uses aresituated.Components
Street Pattern: interconnected network.�
Residential Neighbourhoods: almost exclusively� single-family; may include some mixed-use �apartments above commercial on the Main Street.�Daily Shopping: storefronts situated along the Main�Street.�Local Shopping: storefronts situated along the Main�Street.�Major Business/Commercial: distant town centres.�Schools: elementary school located within the Village;�secondary schools shared between communities and �generally located outside the Village.��
24 hectares
24 hectares
24 hectares
600 hectares
600 hectares
Very Low Density
Village Pattern
High Density Medium Density Low Density
Neigbourhood Patterns
Local StreetSchool
Recreation
Maj
or B
usi
nes
s/C
om
mer
cial
Major Street
Ho
me
Local Shopping
Apartment
600 hectares
Local Shopping
Virtually all of residents daily needs are within lessthan a five-minute walk from home. Small, locallyrun shops located along the "Main Street" provideeverything from bread and milk, to cappuccino, tolocally produced arts and crafts. The shops sit closeto the tree-lined street and help to make a morecomfortable pedestrian environment. This meansfewer car trips are made each day.
tttttopopopopopAfter selecting a general position on densityfrom the “Urban Development Density”slider, the user selects one neighbourhoodpattern for each of the four developmentdensities. The Pedestrian Oriented pattern isthe only choice for high density. As the userscrolls over each diagram in the matrix,additional information on the qualities ofthat neighbourhood pattern appears in theside-bar.
bobobobobottttttttttomomomomomOne output of the Neighbourhoodsubmodel is a series of image screens thatvisually and textually describe each of thepatterns selected by the user. The user willbe able to examine image blow-ups of thethumbnail photographs of the pattern’scomponent parts by “clicking” on individualthumbnails. As the user scrolls over eachthumbnail, additional information on thatcomponent part appears in the side-bar. Theuser will be able to move between imagescreens by “clicking on the text.
multiple-family, house, large house,major street, local street, lane,preserved stream/greenway,recreation, school, local shopping,and major business/commercial. Asthe user scrolls over eachthumbnail, additional information onthat component part appears in thesidebar. This information is basedon the data gathered in the SiteInventory phase of this study, and isintended to assist users in modifyingtheir choices for consecutive games.The user will also be able toexamine image blow-ups by“clicking” on individual thumbnails.The user will also be able to movebetween image screens, perhaps,as in the example mock-up, by“clicking” on the text “High Density,”“Medium Density,” “Low Density,”and “Very Low Density.”
HeadlinesHeadlinesHeadlinesHeadlinesHeadlinesFive “Headlines” based on the fivesustainability factors will also beoutput, including: 1) Land Use Mix –“The Georgia Basin has a (very low/low/medium/high) Land Use Mix”;2) Walkability – “X% of thepopulation is within a 5-minute walkof daily needs”; 3) Permeability –“X% of the Georgia Basin ispermeable to rain (Xm2 ofimpervious area per person”; 4)Affordability – “X% of householdscan afford to live in the GeorgiaBasin”; and 5) Housing Mix – “TheGeorgia Basin has X% of thebenchmark housing mix.” Theheadlines will result from the sum ofthe corresponding datum for allneighbourhood patterns selected,weighed according to the ratioselected on the “Urban DevelopmentDensity” slider. One of thesustainability factors, VKT, is notrepresented as a headline, as theTransportation submodel generatesVKT as one of its ouputs. Instead,the Neighbourhood submodel willproduce a Neighbourhood Patternbased transportation mode split,which will be used by theTransportation submodel as aninput. This will capture the influenceof Neighbourhood pattern on VKT(please see “Numerical Outputs”
28
Nei
ghbo
urho
od P
atte
rn T
ypol
ogy
below). In addition to the foursustainability factors represented,one of the three factors used togenerate the NeighbourhoodPatterns – land use mix, isrepresented as a headline. Of theremaining two, density is a userinput, not a submodel output; and,street arrangement is representedvisually in the Image Screens(please see “Image Screens,”previous page).
Numerical OutputsNumerical OutputsNumerical OutputsNumerical OutputsNumerical OutputsNumerical outputs from theNeighbourhood submodel willprovide inputs for the Transportationand Cost of Living submodels. Aswith the headlines, these outputswill result from the sum of thecorresponding datum for allneighbourhood patterns selected,weighed according to the ratioselected on the “Urban DevelopmentDensity” slider. For theTransportation submodel, thetransportation mode split will becalculated.
For the Cost of Living submodel, theaverage cost of a typical single-family home, and a condominiumwill be calculated. These housingcosts are derived from an averagecost to build per square foot, plusan average cost of land per acre.The housing cost arising from thiscalculation is intended to capturehow different sized houses and lotscontribute to the affordability ofeach pattern.
For the breakdown ofTransportation Mode Split byNeighbourhood Pattern, please seeAppendix 4; for the breakdown ofHouse and Apartment cost byNeighbourhood Pattern, please seeAppendix 5.

Neighbourhood Pattern Typ
ology
29
appendix 1Data Summary Table

30
Nei
ghbo
urho
od P
atte
rn T
ypol
ogy

Neighbourhood Pattern Typ
ology
31
appendix 2Neighbourhood Pattern DataTables

32
Nei
ghbo
urho
od P
atte
rn T
ypol
ogy

Neighbourhood Pattern Typ
ology
33
appendix 3Component Neighbourhood &Study Site Maps

34
Nei
ghbo
urho
od P
atte
rn T
ypol
ogy

Neighbourhood Pattern Typ
ology
35
appendix 4Transportation Mode Split byNeighbourhood

36
Nei
ghbo
urho
od P
atte
rn T
ypol
ogy

Neighbourhood Pattern Typ
ology
37
appendix 5House & Apartment Price byNeighbourhood