sustainable water · pdf filesustainable water management ... 49.4 94.8 6.42 6.24 278 213 657...
TRANSCRIPT
Daniel E. Shannon Global Business Development Manager
Halliburton Water Solutions
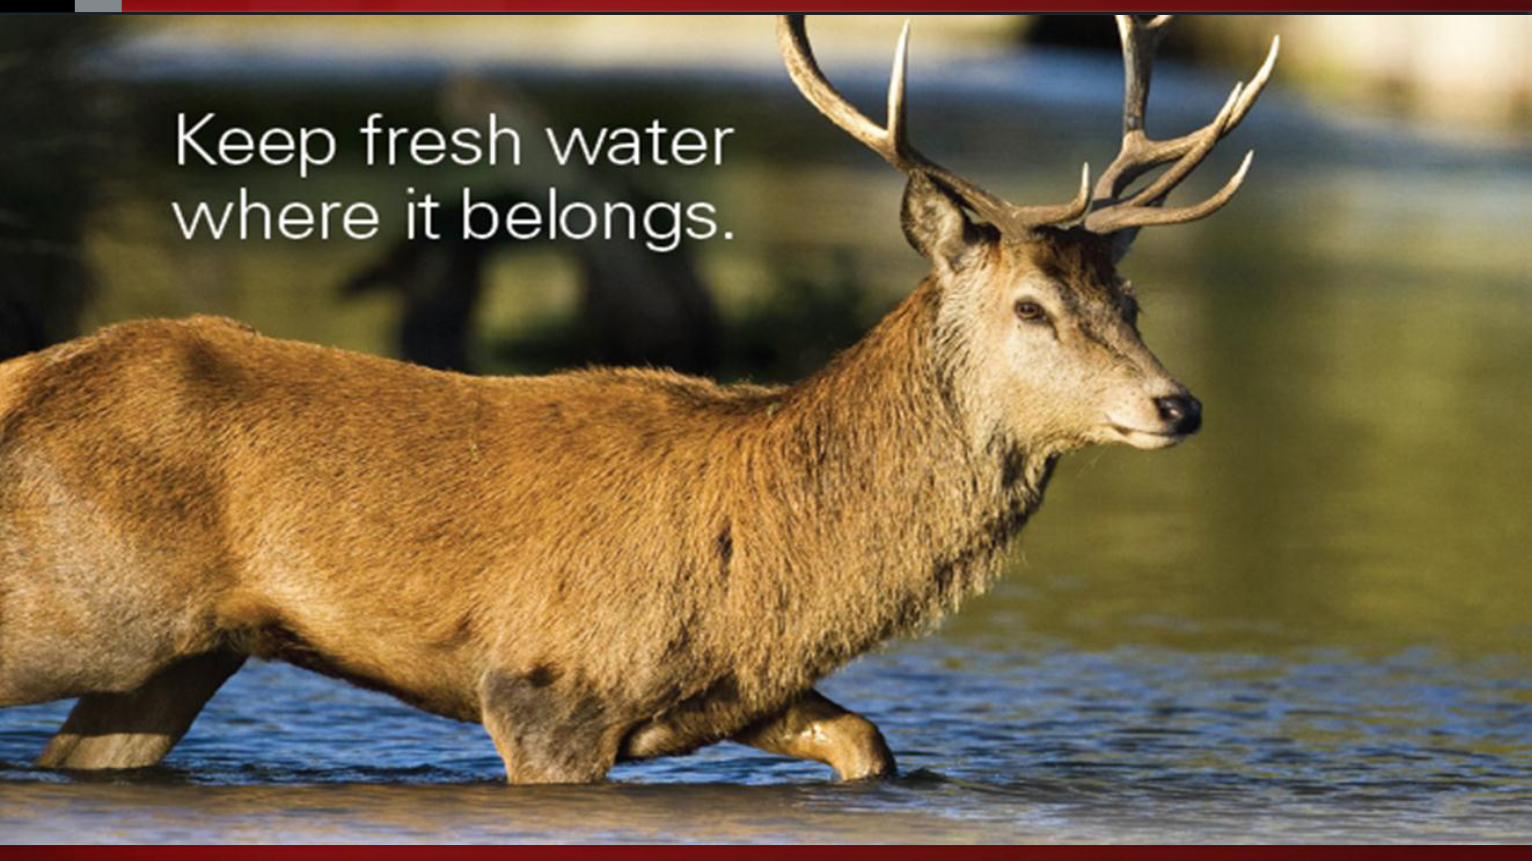
Sustainable Water Management
2 © 2012 HALLIBURTON. ALL RIGHTS RESERVED.
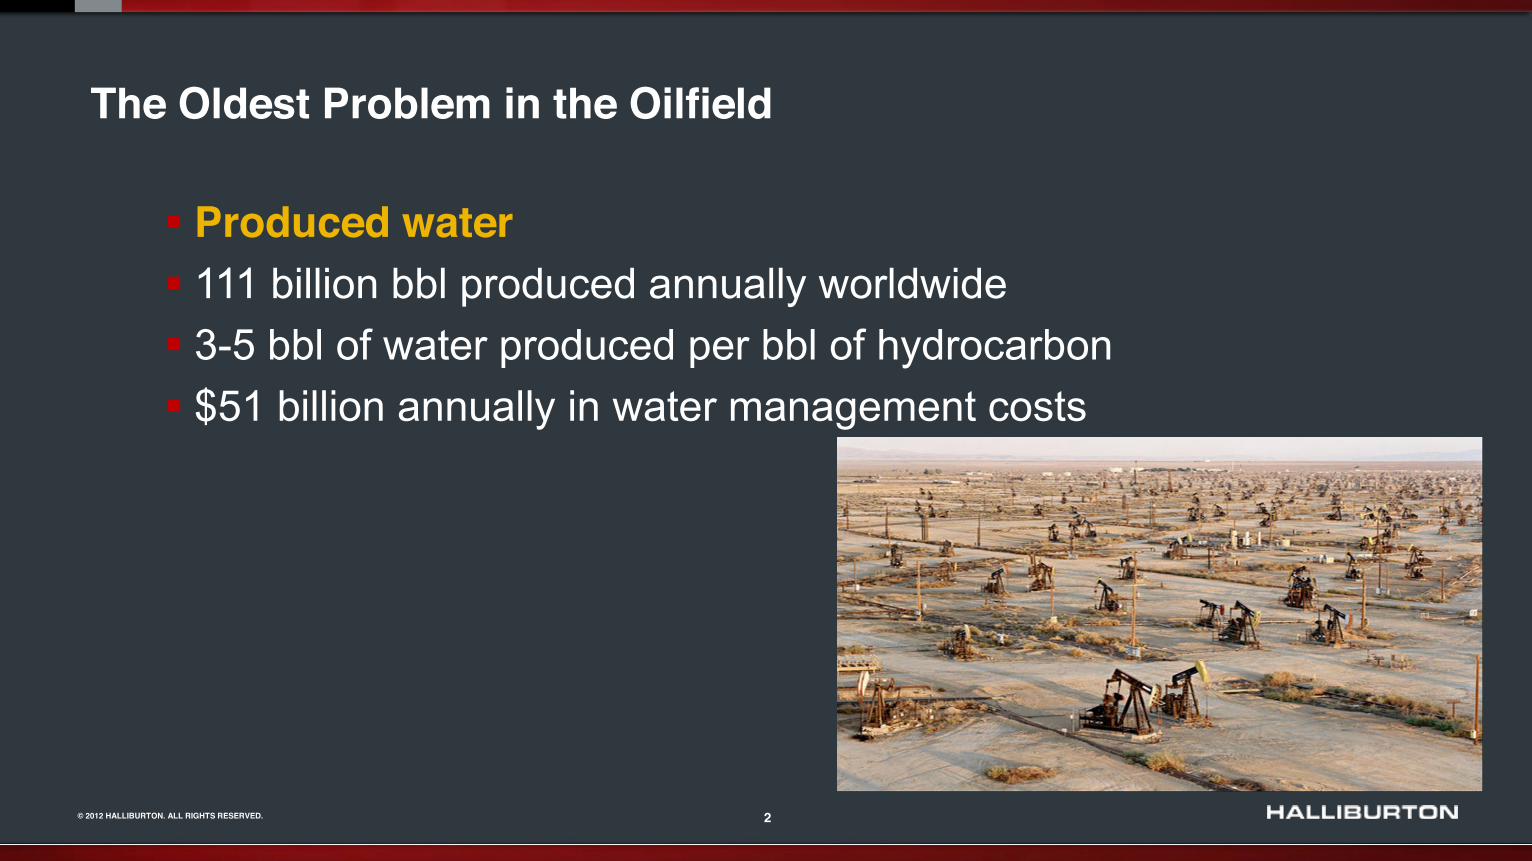
The Oldest Problem in the Oilfield
Produced water 111 billion bbl produced annually worldwide 3-5 bbl of water produced per bbl of hydrocarbon $51 billion annually in water management costs
3 © 2012 HALLIBURTON. ALL RIGHTS RESERVED.
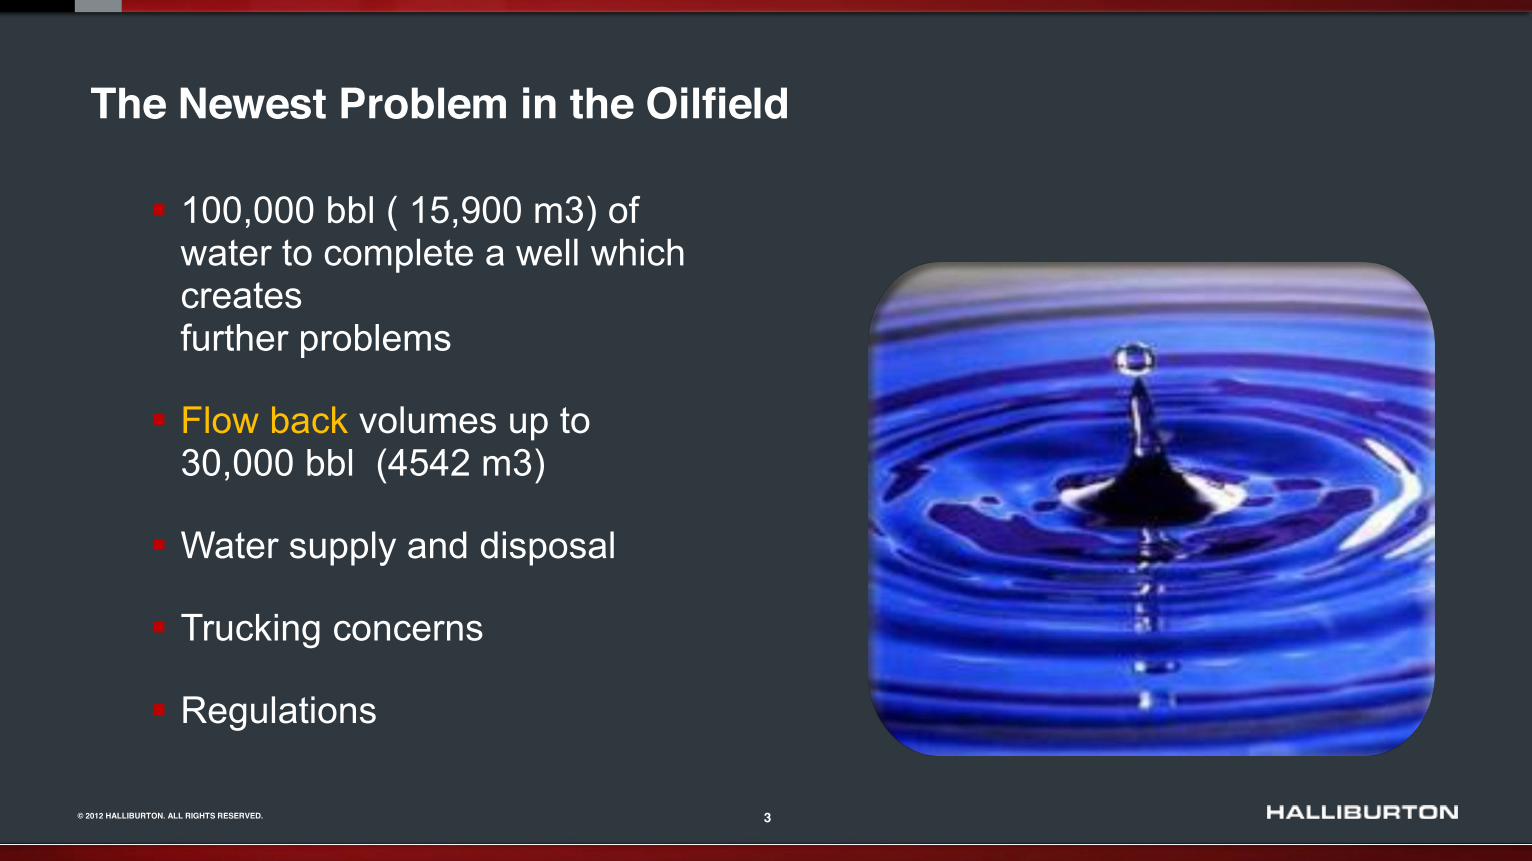
The Newest Problem in the Oilfield
100,000 bbl ( 15,900 m3) of water to complete a well which creates further problems
Flow back volumes up to 30,000 bbl (4542 m3)
Water supply and disposal
Trucking concerns
Regulations
4 © 2012 HALLIBURTON. ALL RIGHTS RESERVED.
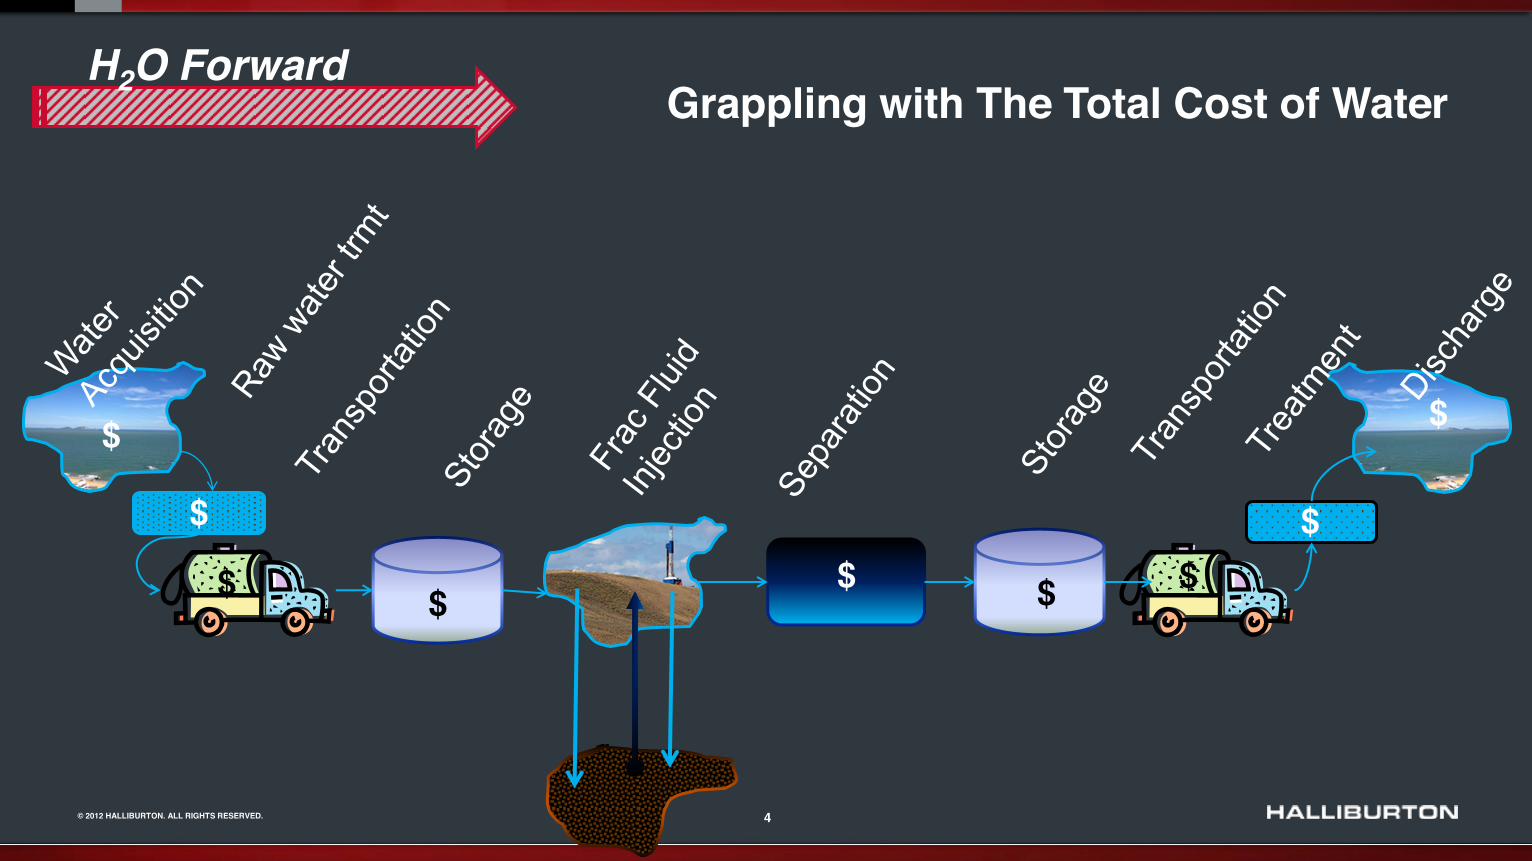
H2O Forward
$
$
$
$ $ $ $
$
$
Grappling with The Total Cost of Water
5 © 2012 HALLIBURTON. ALL RIGHTS RESERVED.
H2O Forward
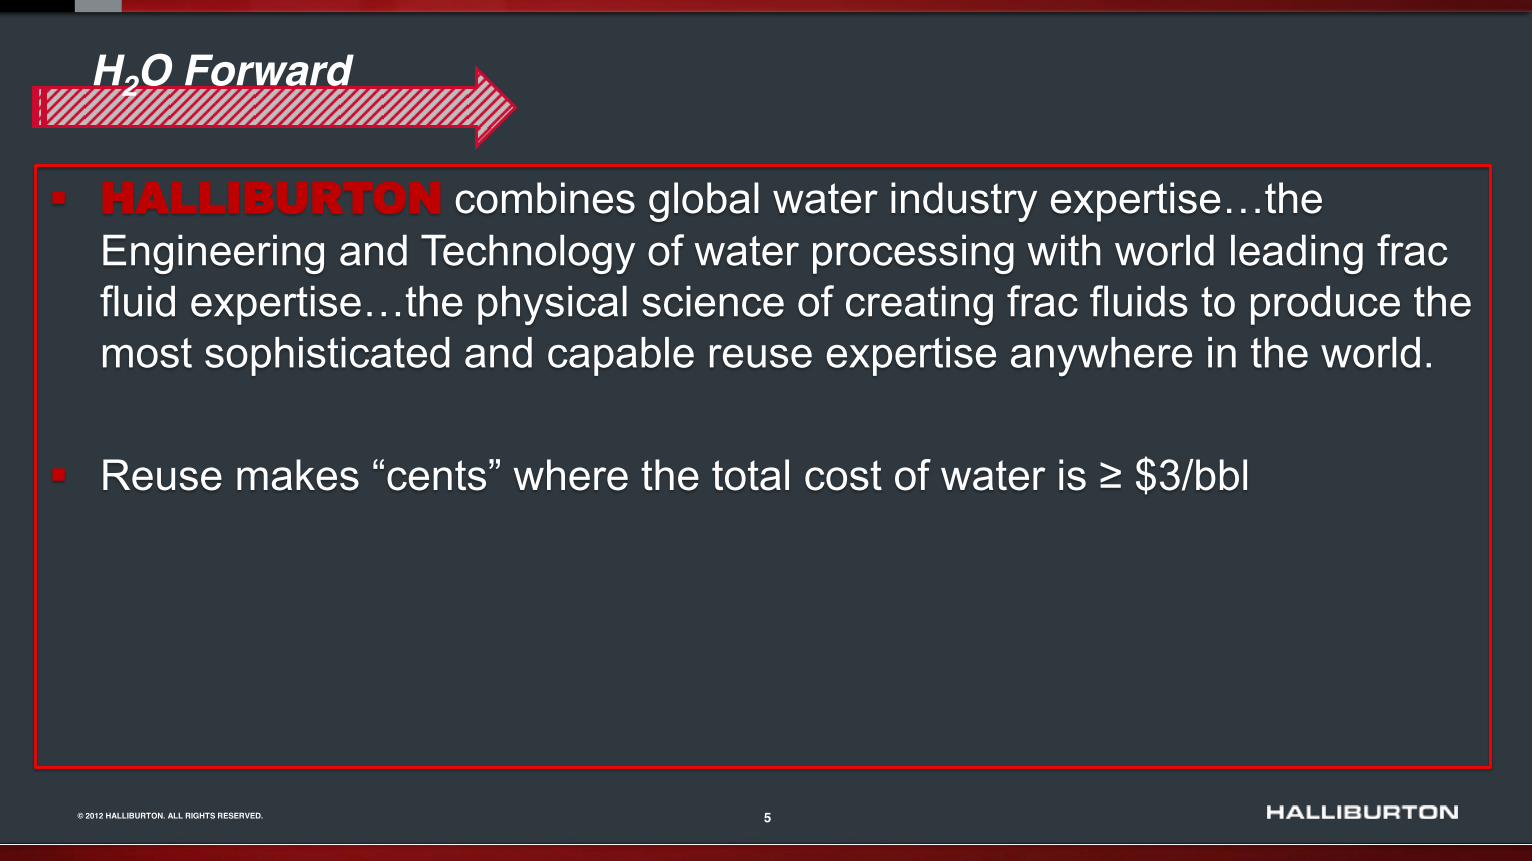
HALLIBURTON combines Engineering and Technology of water processing with world leading frac
most sophisticated and capable reuse expertise anywhere in the world.
bbl
6 © 2012 HALLIBURTON. ALL RIGHTS RESERVED.
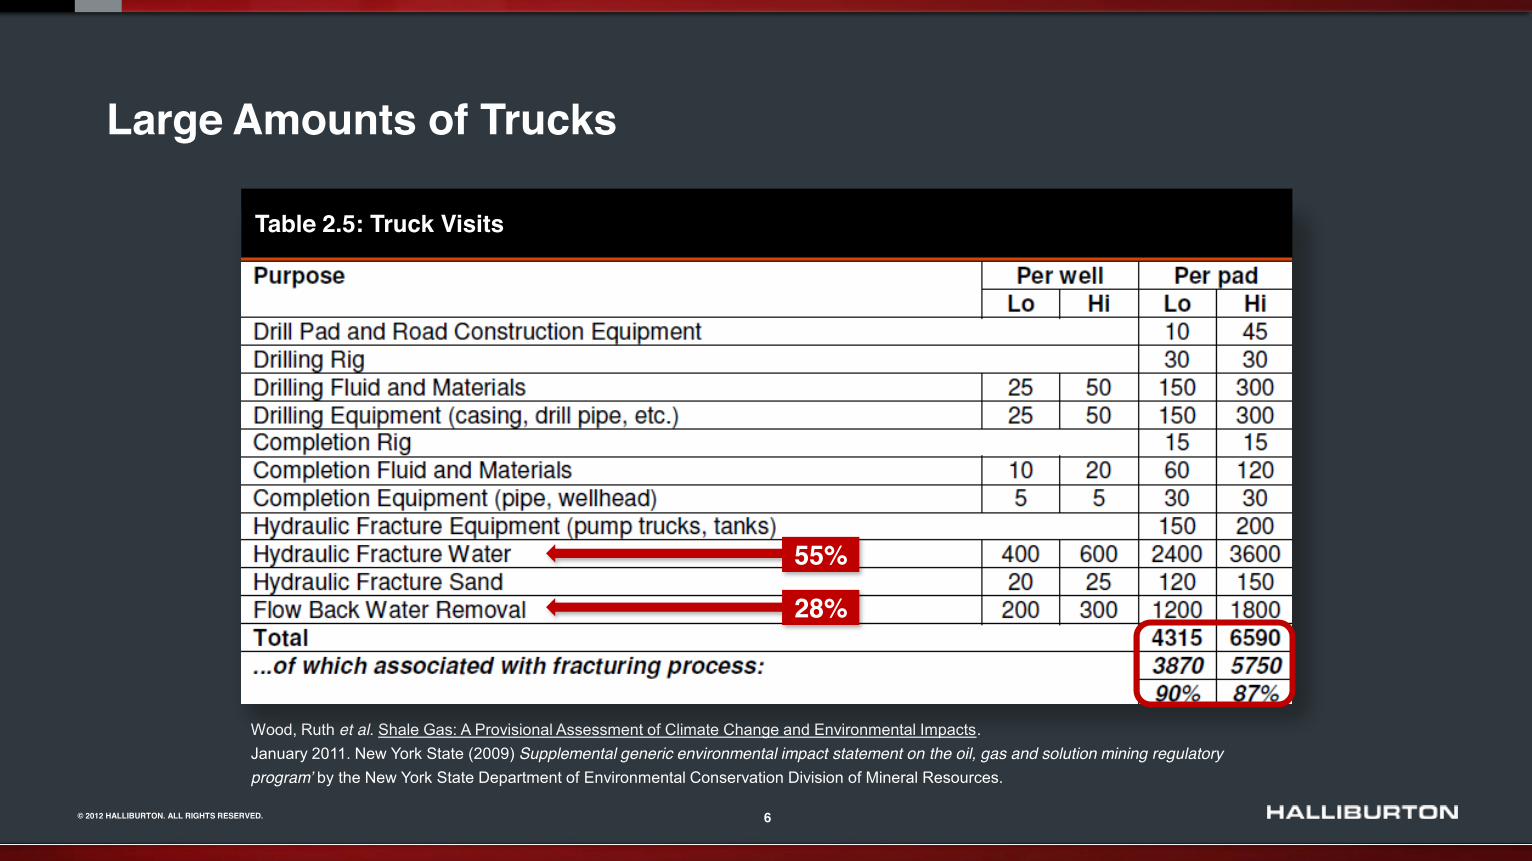
Wood, Ruth et al. Shale Gas: A Provisional Assessment of Climate Change and Environmental Impacts. January 2011. New York State (2009) Supplemental generic environmental impact statement on the oil, gas and solution mining regulatory program by the New York State Department of Environmental Conservation Division of Mineral Resources.
Large Amounts of Trucks
Table 2.5: Truck Visits
55%
28%
7 © 2012 HALLIBURTON. ALL RIGHTS RESERVED.
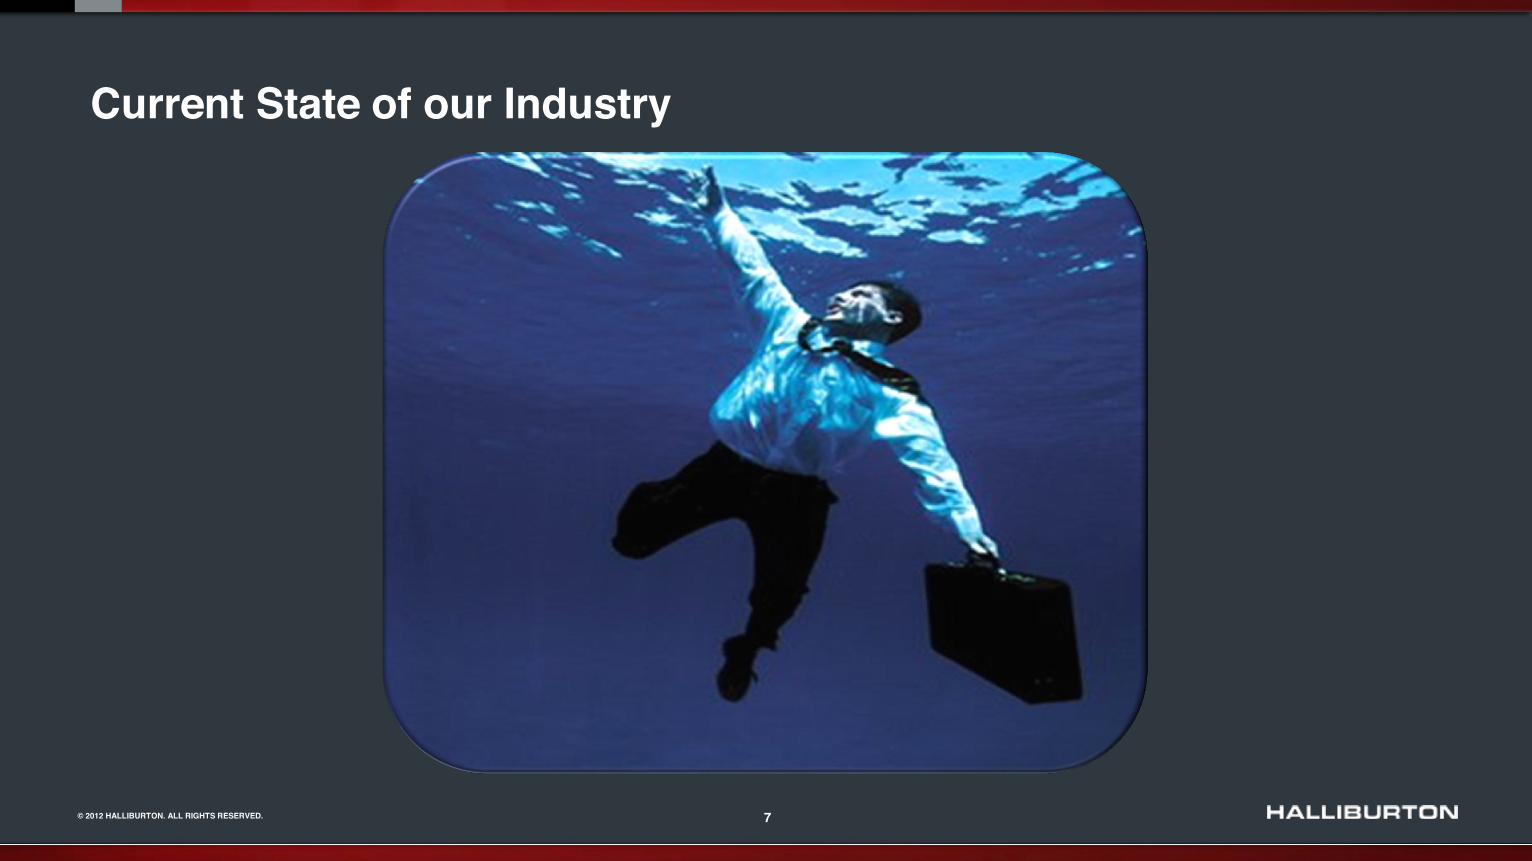
Current State of our Industry
8 © 2012 HALLIBURTON. ALL RIGHTS RESERVED.
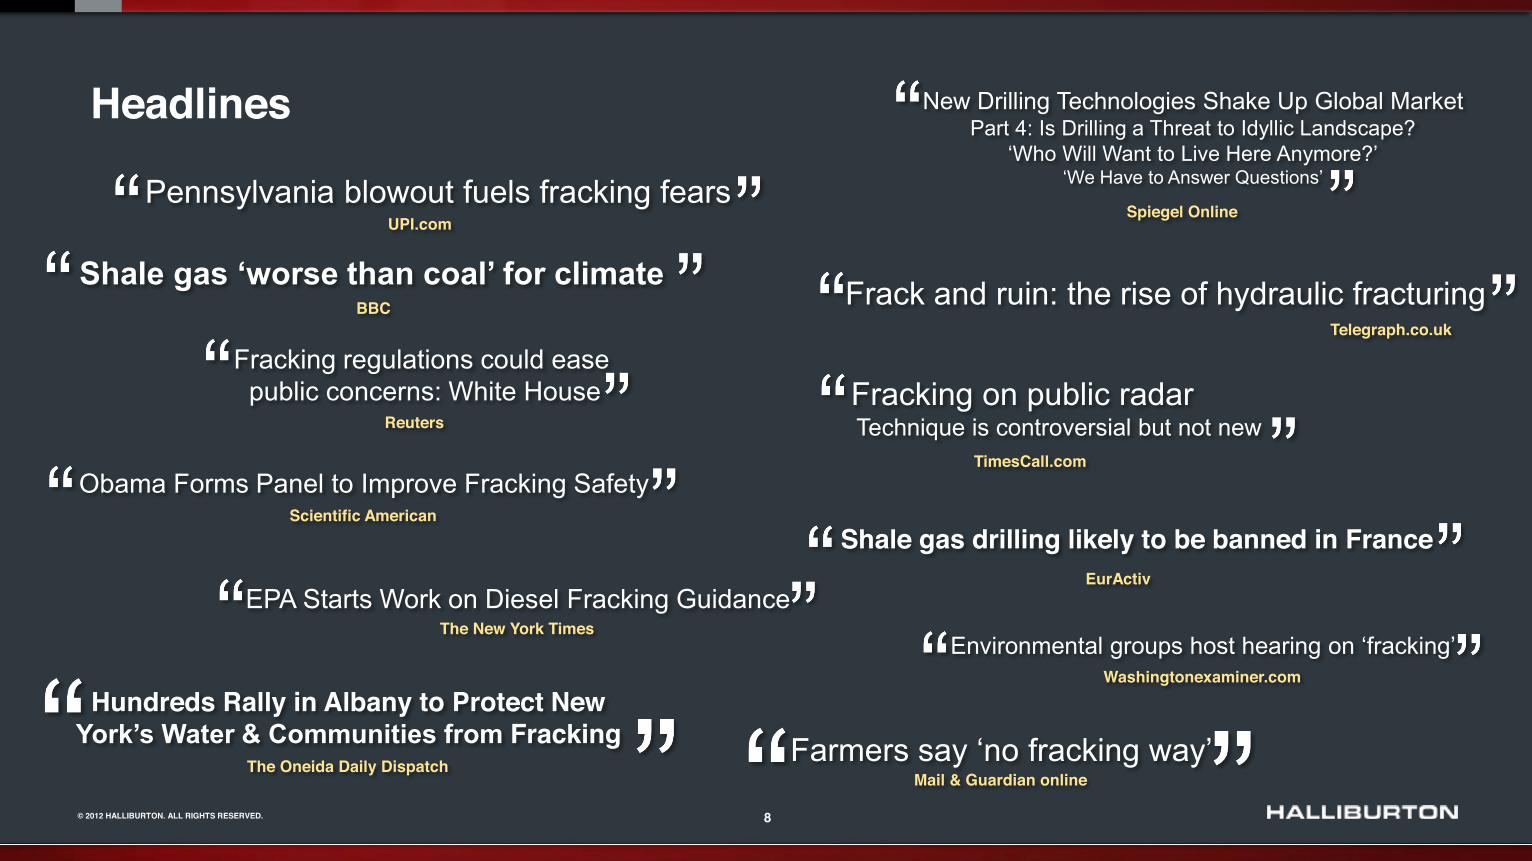
Headlines
Hundreds Rally in Albany to Protect New Fracking
The Oneida Daily Dispatch fracking Mail & Guardian online
Pennsylvania blowout fuels fracking fears UPI.com
BBC
Fracking regulations could ease public concerns: White House
Reuters
Obama Forms Panel to Improve Fracking Safety Scientific American
EPA Starts Work on Diesel Fracking Guidance The New York Times
Spiegel Online
New Drilling Technologies Shake Up Global Market Part 4: Is Drilling a Threat to Idyllic Landscape?
Frack and ruin: the rise of hydraulic fracturing Telegraph.co.uk
Fracking on public radar Technique is controversial but not new
TimesCall.com
Shale gas drilling likely to be banned in France EurActiv
fracking Washingtonexaminer.com
9 © 2012 HALLIBURTON. ALL RIGHTS RESERVED.
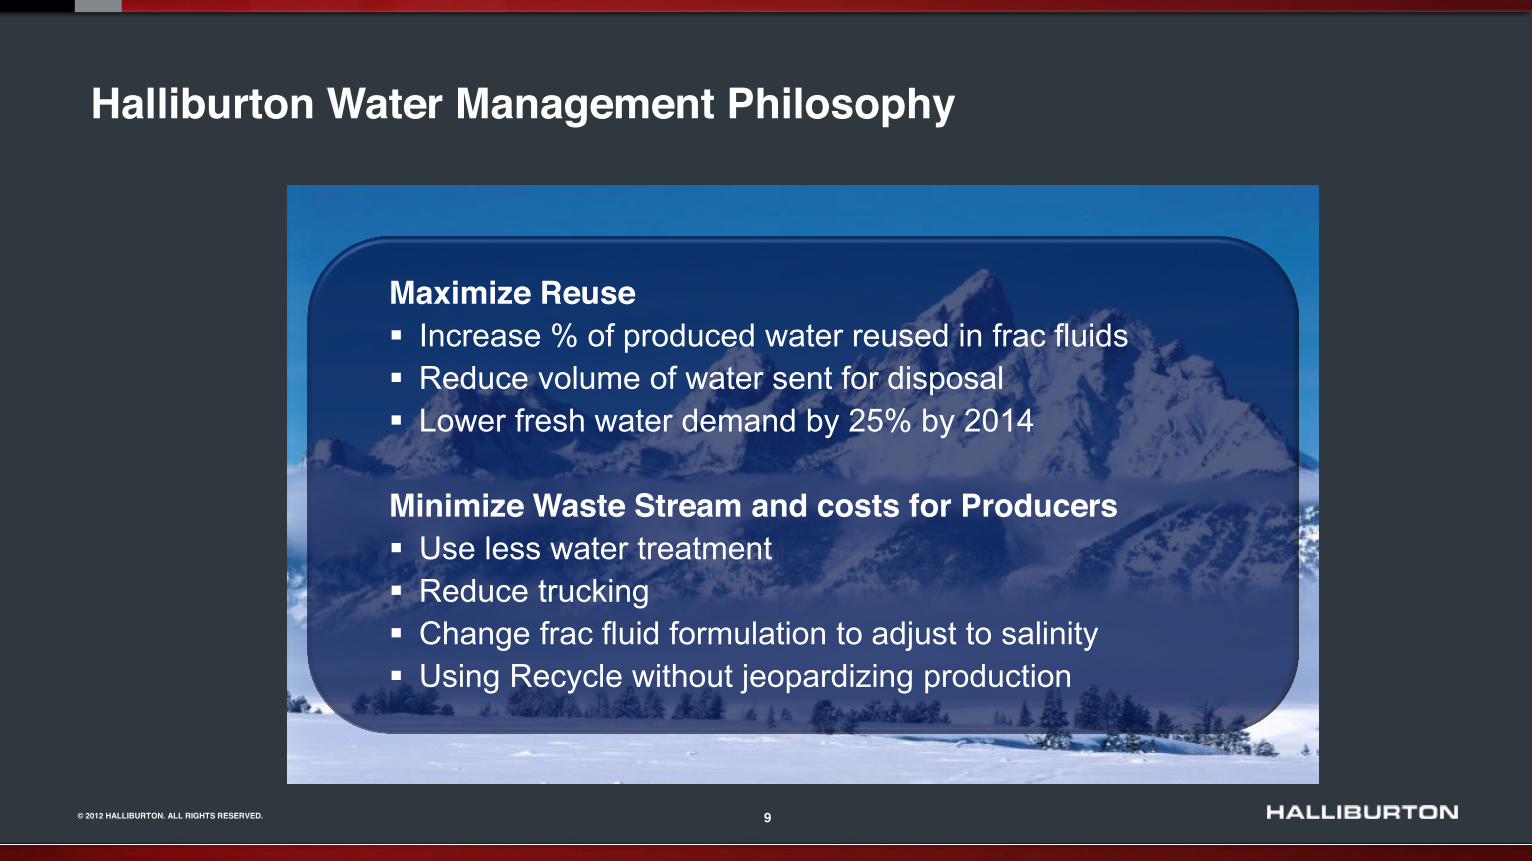
Halliburton Water Management Philosophy
Maximize Reuse Increase % of produced water reused in frac fluids Reduce volume of water sent for disposal Lower fresh water demand by 25% by 2014
Minimize Waste Stream and costs for Producers
Use less water treatment Reduce trucking Change frac fluid formulation to adjust to salinity Using Recycle without jeopardizing production
10 © 2012 HALLIBURTON. ALL RIGHTS RESERVED.
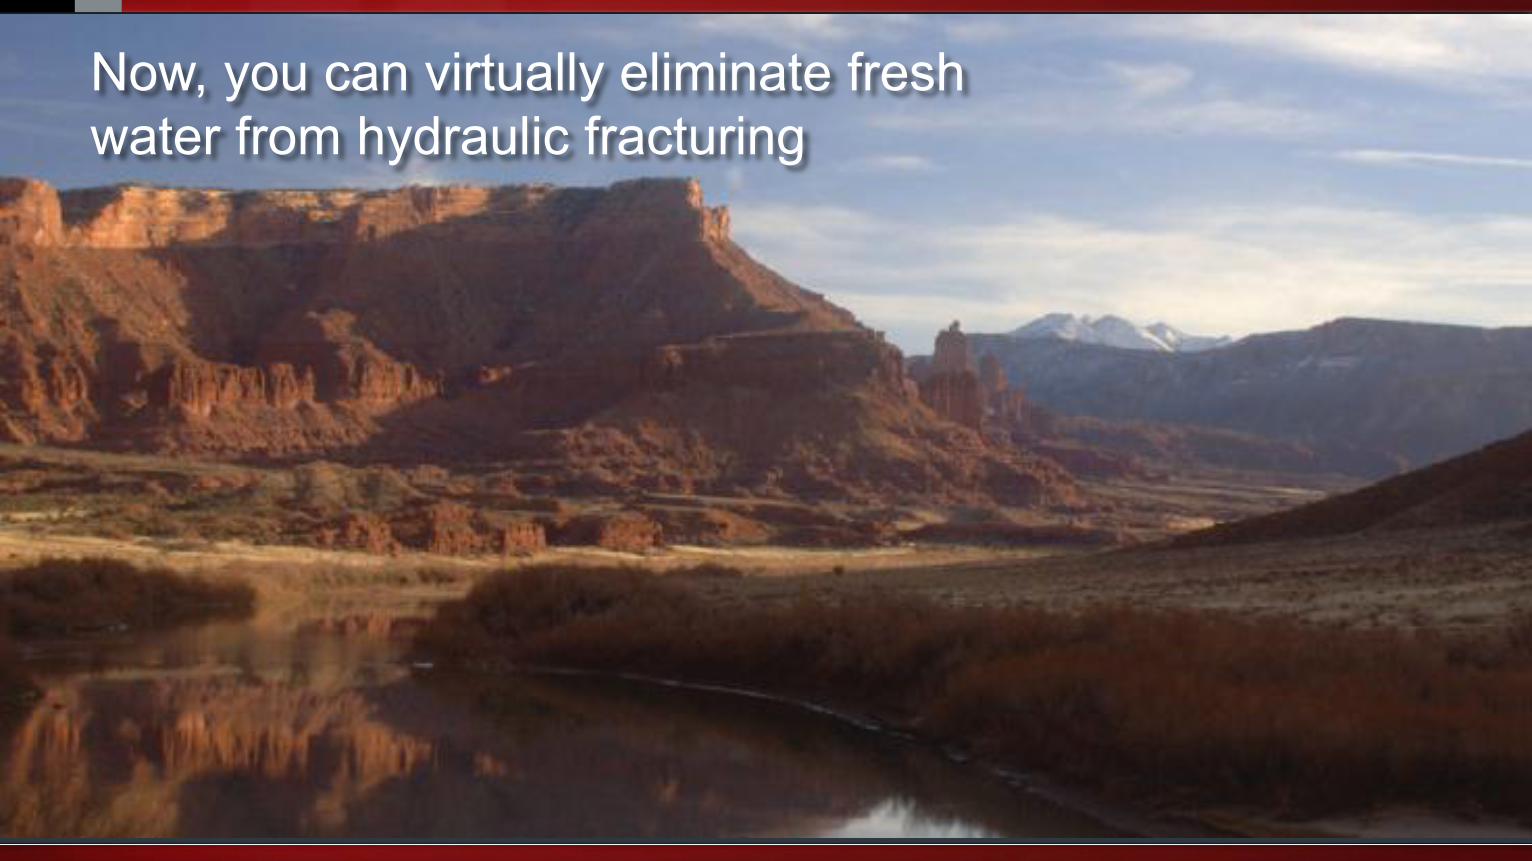
Now, you can virtually eliminate fresh water from hydraulic fracturing
11 © 2012 HALLIBURTON. ALL RIGHTS RESERVED.
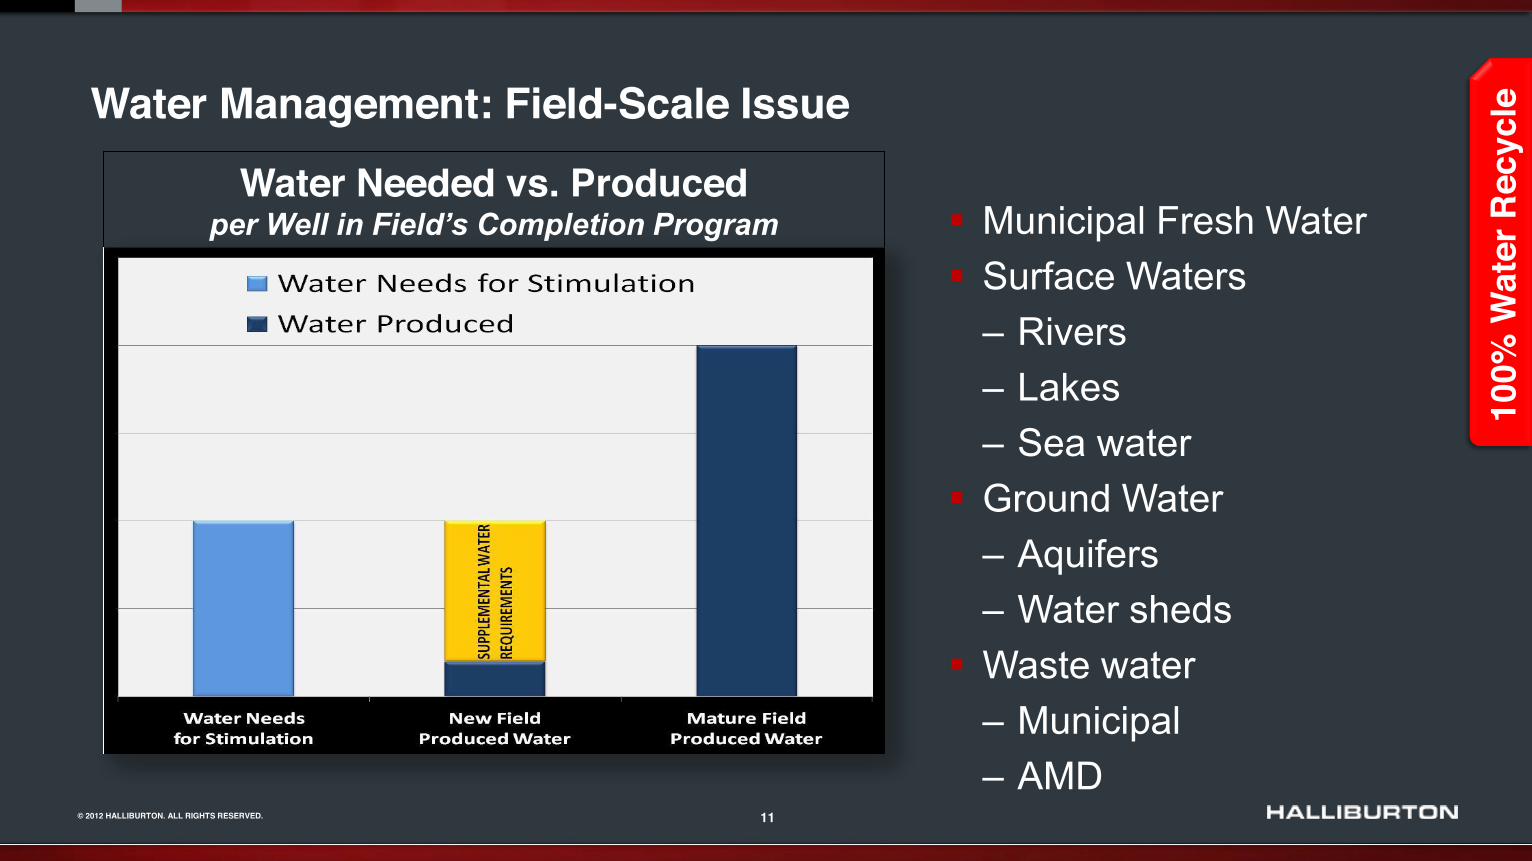
Water Management: Field-Scale Issue
Water Needed vs. Produced Municipal Fresh Water
Surface Waters Rivers Lakes Sea water
Ground Water Aquifers Water sheds
Waste water Municipal AMD
100%
Wat
er R
ecyc
le
12 © 2012 HALLIBURTON. ALL RIGHTS RESERVED.
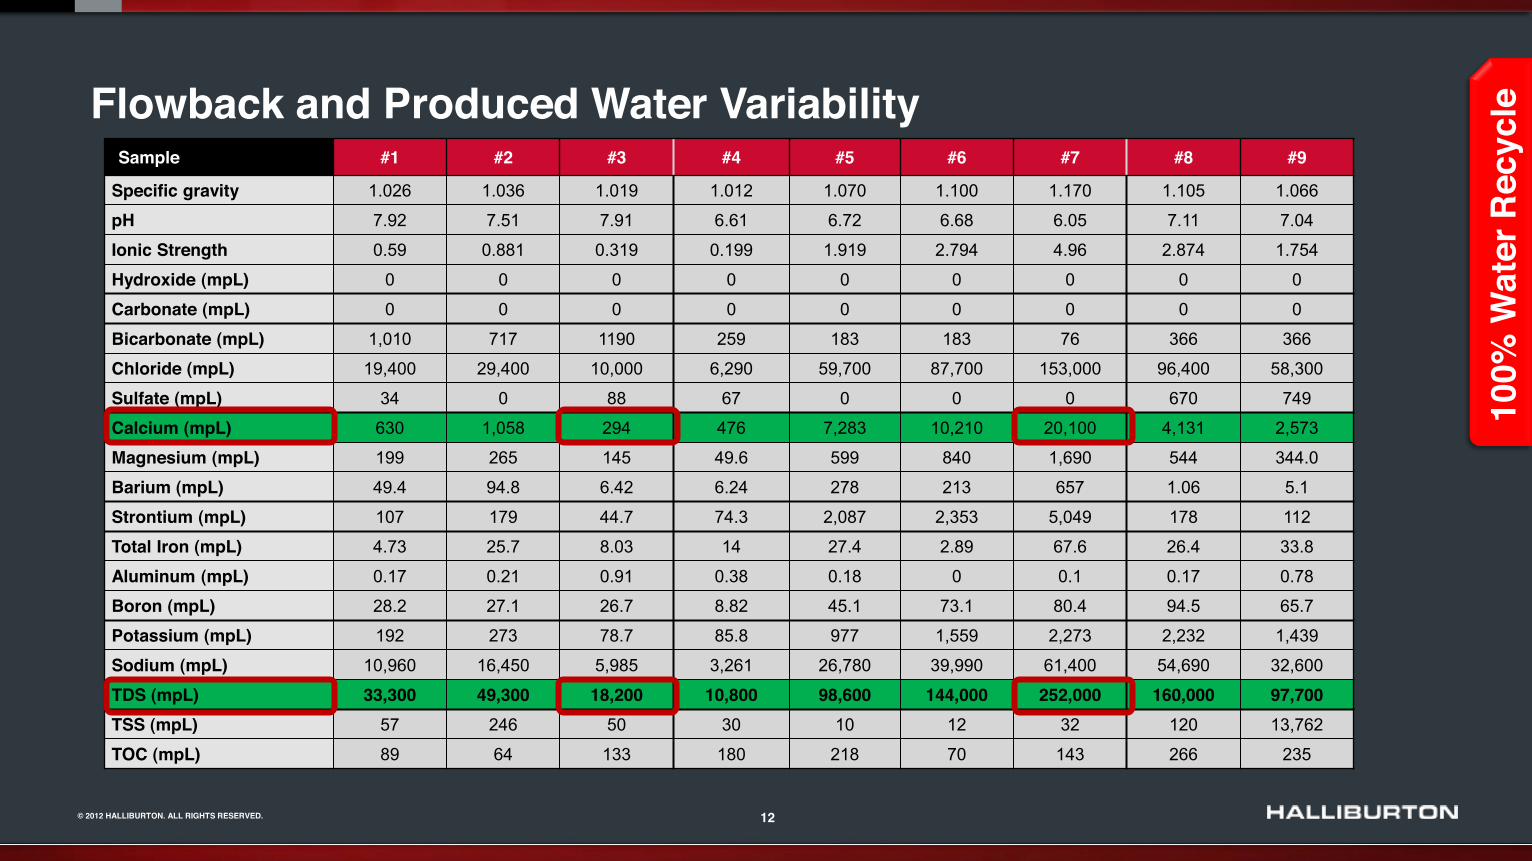
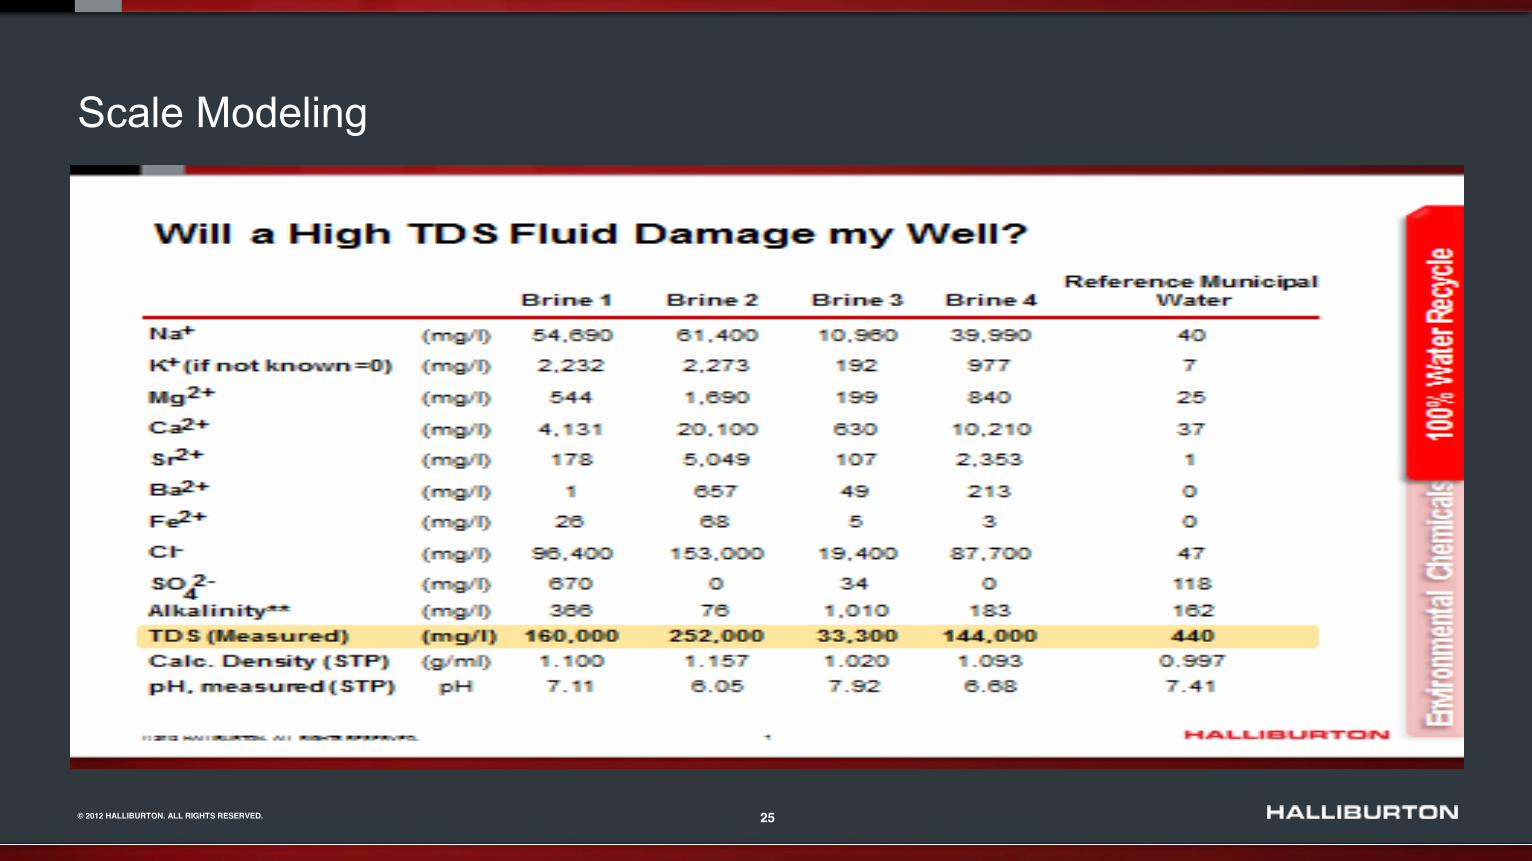
Flowback and Produced Water Variability Sample #1 #2 #3 #4 #5 #6 #7 #8 #9
Specific gravity 1.026 1.036 1.019 1.012 1.070 1.100 1.170 1.105 1.066
pH 7.92 7.51 7.91 6.61 6.72 6.68 6.05 7.11 7.04
Ionic Strength 0.59 0.881 0.319 0.199 1.919 2.794 4.96 2.874 1.754
Hydroxide (mpL) 0 0 0 0 0 0 0 0 0
Carbonate (mpL) 0 0 0 0 0 0 0 0 0
Bicarbonate (mpL) 1,010 717 1190 259 183 183 76 366 366
Chloride (mpL) 19,400 29,400 10,000 6,290 59,700 87,700 153,000 96,400 58,300
Sulfate (mpL) 34 0 88 67 0 0 0 670 749
Calcium (mpL) 630 1,058 294 476 7,283 10,210 20,100 4,131 2,573
Magnesium (mpL) 199 265 145 49.6 599 840 1,690 544 344.0
Barium (mpL) 49.4 94.8 6.42 6.24 278 213 657 1.06 5.1
Strontium (mpL) 107 179 44.7 74.3 2,087 2,353 5,049 178 112
Total Iron (mpL) 4.73 25.7 8.03 14 27.4 2.89 67.6 26.4 33.8
Aluminum (mpL) 0.17 0.21 0.91 0.38 0.18 0 0.1 0.17 0.78
Boron (mpL) 28.2 27.1 26.7 8.82 45.1 73.1 80.4 94.5 65.7
Potassium (mpL) 192 273 78.7 85.8 977 1,559 2,273 2,232 1,439
Sodium (mpL) 10,960 16,450 5,985 3,261 26,780 39,990 61,400 54,690 32,600
TDS (mpL) 33,300 49,300 18,200 10,800 98,600 144,000 252,000 160,000 97,700 TSS (mpL) 57 246 50 30 10 12 32 120 13,762
TOC (mpL) 89 64 133 180 218 70 143 266 235
100%
Wat
er R
ecyc
le
13 © 2012 HALLIBURTON. ALL RIGHTS RESERVED.
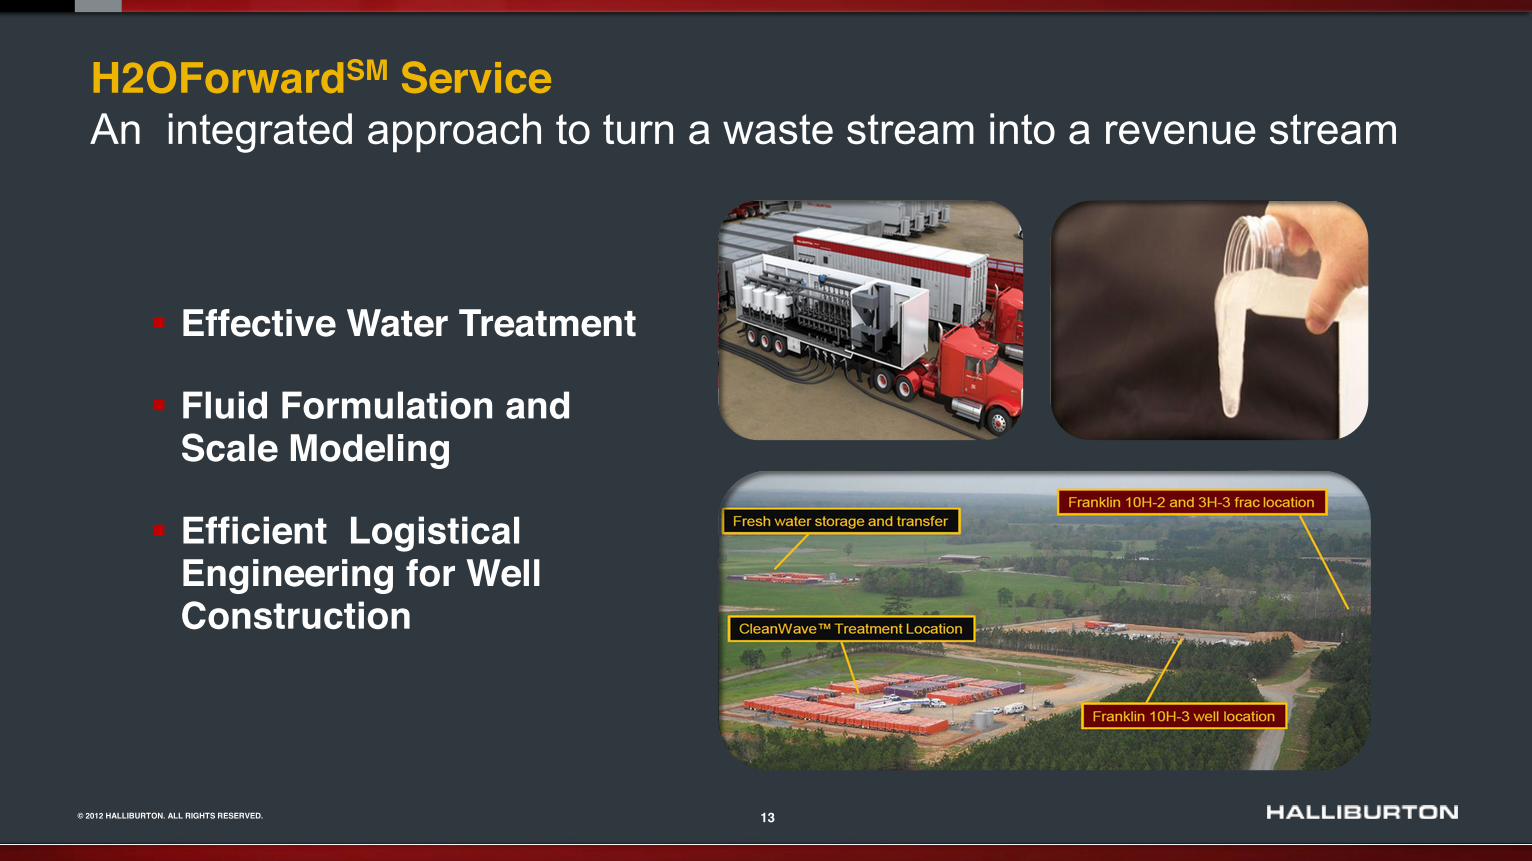
H2OForwardSM Service An integrated approach to turn a waste stream into a revenue stream
Effective Water Treatment
Fluid Formulation and Scale Modeling
Efficient Logistical Engineering for Well Construction
14 © 2012 HALLIBURTON. ALL RIGHTS RESERVED.
The Past - Halliburton Water Quality Limits for Parameters
Bacteria <105/mL pH 6 to 8 Temperature 40 to 100 F Chlorides < 30,000 typical but up to 90,000 ppm Bicarbonates < 300 ppm Calcium and Magnesium < 2,000 ppm Boron < 1 ppm
Iron < 10 ppm typical but up to 20 ppm
Phosphates < 5 ppm
Reducing Agents 0 ppm
Sulfates < 500 ppm
TSS < 50 ppm
TDS < 50,000 ppm
15 © 2012 HALLIBURTON. ALL RIGHTS RESERVED.
Produced H2O for Fracturing Fluids
Because many factors are involved, it is not always possible to set a specific limit on each component.
Always subject source waters to pilot tests before using them in a fluid system.
Customers may have to be open to running a different fluid system based on water analysis and rheology testing.
16 © 2012 HALLIBURTON. ALL RIGHTS RESERVED.
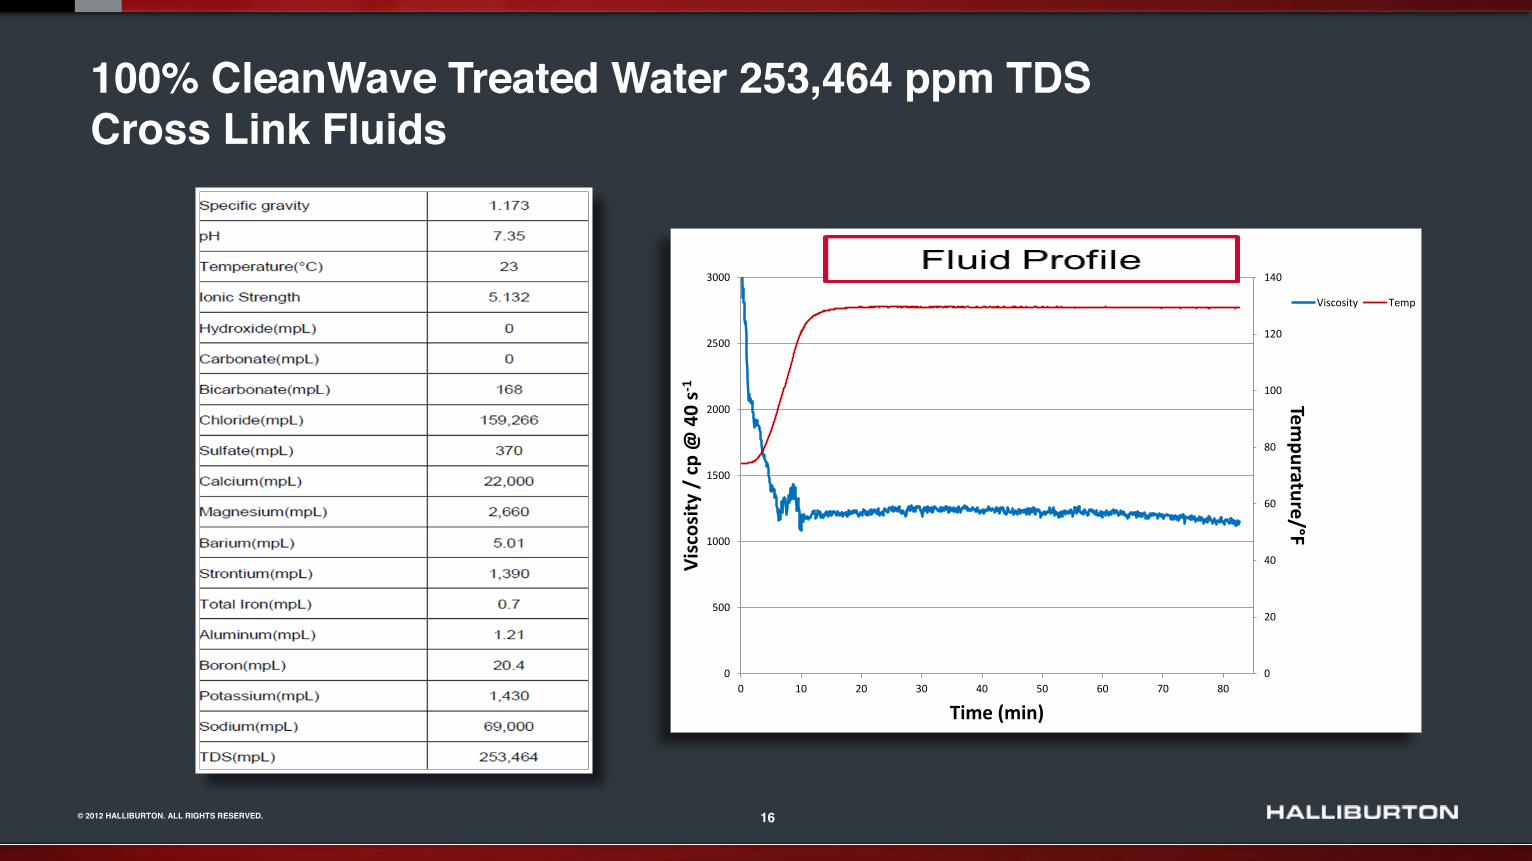
100% CleanWave Treated Water 253,464 ppm TDS Cross Link Fluids
0
20
40
60
80
100
120
140
0
500
1000
1500
2000
2500
3000
0 10 20 30 40 50 60 70 80
Tempurature/°F
Viscosity
/ cp @ 40 s-‐1
Time (min)
BOPCO PLU 100% CleanWave Treated Rerun
Viscosity Temp
17 © 2012 HALLIBURTON. ALL RIGHTS RESERVED.
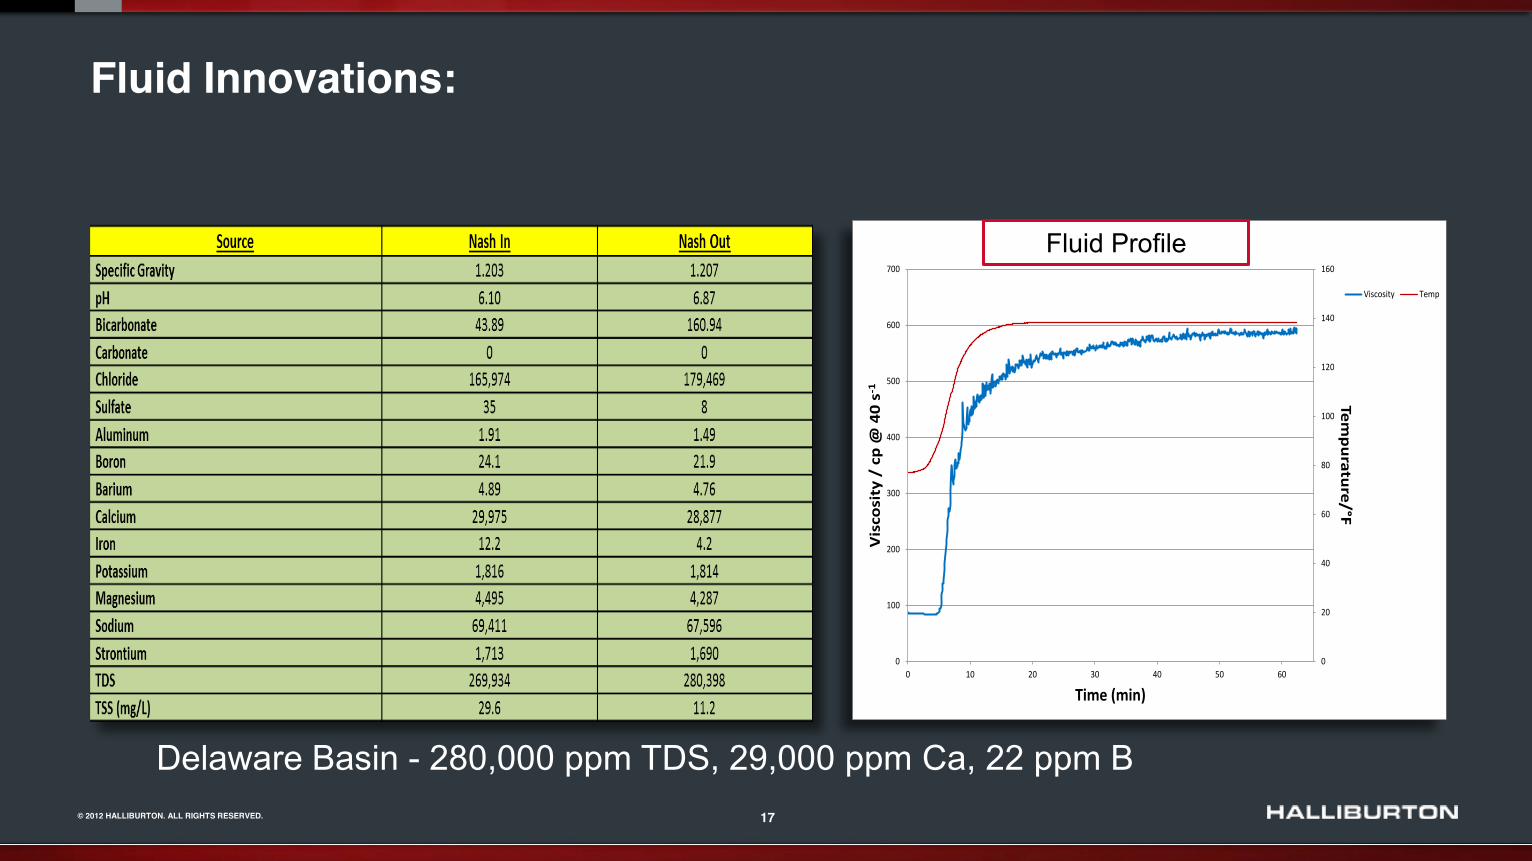
Fluid Innovations:
0
20
40
60
80
100
120
140
160
0
100
200
300
400
500
600
700
0 10 20 30 40 50 60
Tempurature/°F
Viscosity / cp @ 40 s-‐1
Time (min)
XTO pHaser 100% CleanWave Treated
Viscosity Temp
Delaware Basin - 280,000 ppm TDS, 29,000 ppm Ca, 22 ppm B
Fluid Profile
18 © 2012 HALLIBURTON. ALL RIGHTS RESERVED.
2012- Focus on Recycle of 100% Produced Water
17,777,428 gallons( 67,294 m3) of 100% produced water for 59 different wells for a total of 260 stages frac completions. We had success on all 260 stages in water with> 280,000 TDS with no crosslink fluid issues & no scaling issues
No production decrease vs. fresh water
Produced Water for Crosslink- Avg. savings 70-100K per well( others 200K per well)
19 © 2012 HALLIBURTON. ALL RIGHTS RESERVED.
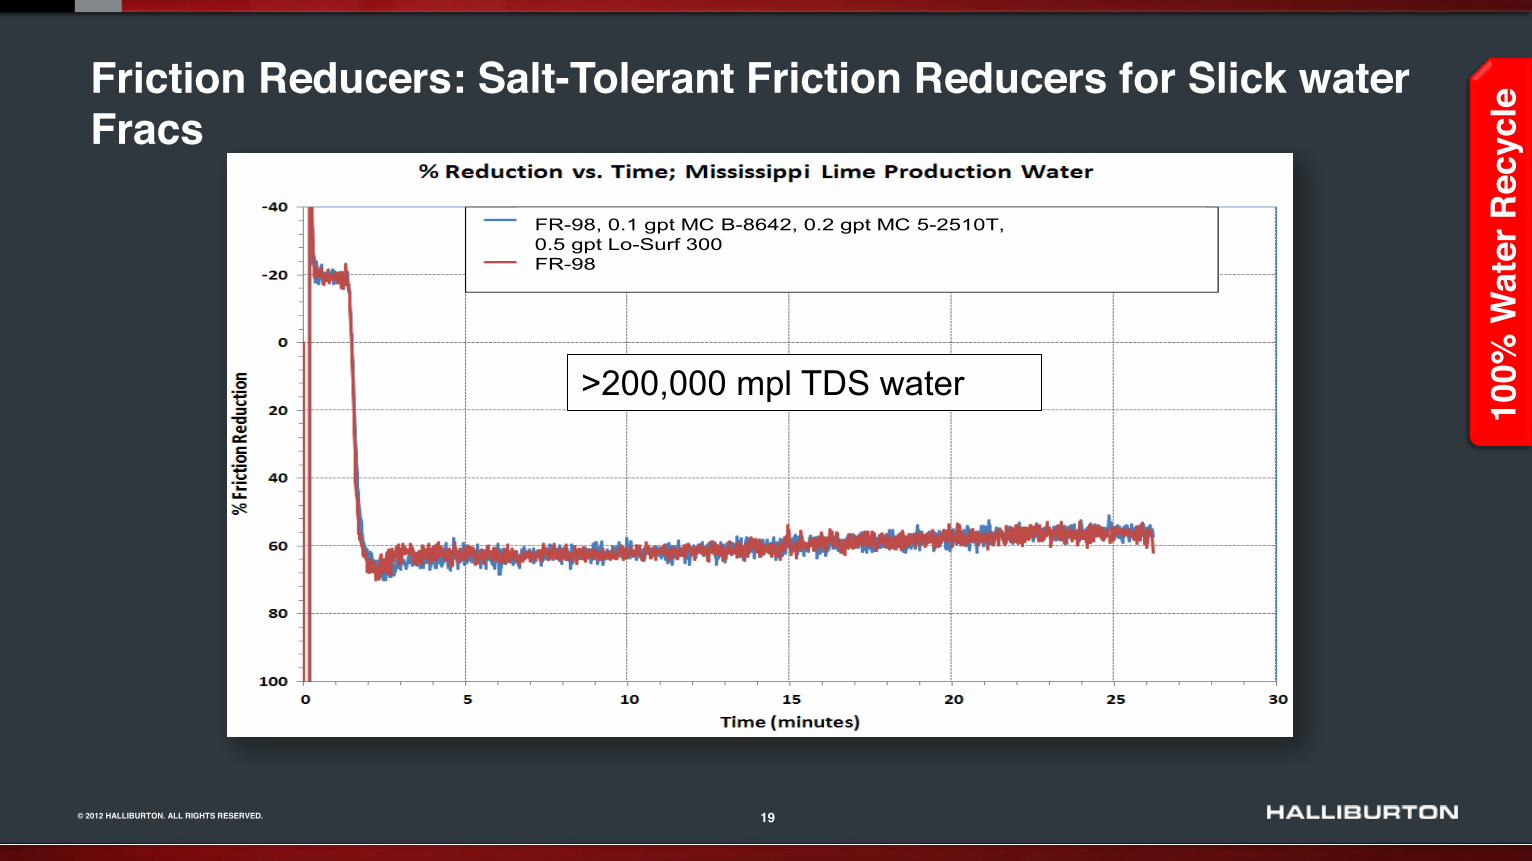
Friction Reducers: Salt-Tolerant Friction Reducers for Slick water Fracs
100%
Wat
er R
ecyc
le
FR-98, 0.1 gpt MC B-8642, 0.2 gpt MC 5-2510T, 0.5 gpt Lo-Surf 300FR-98
>200,000 mpl TDS water
20 © 2012 HALLIBURTON. ALL RIGHTS RESERVED.
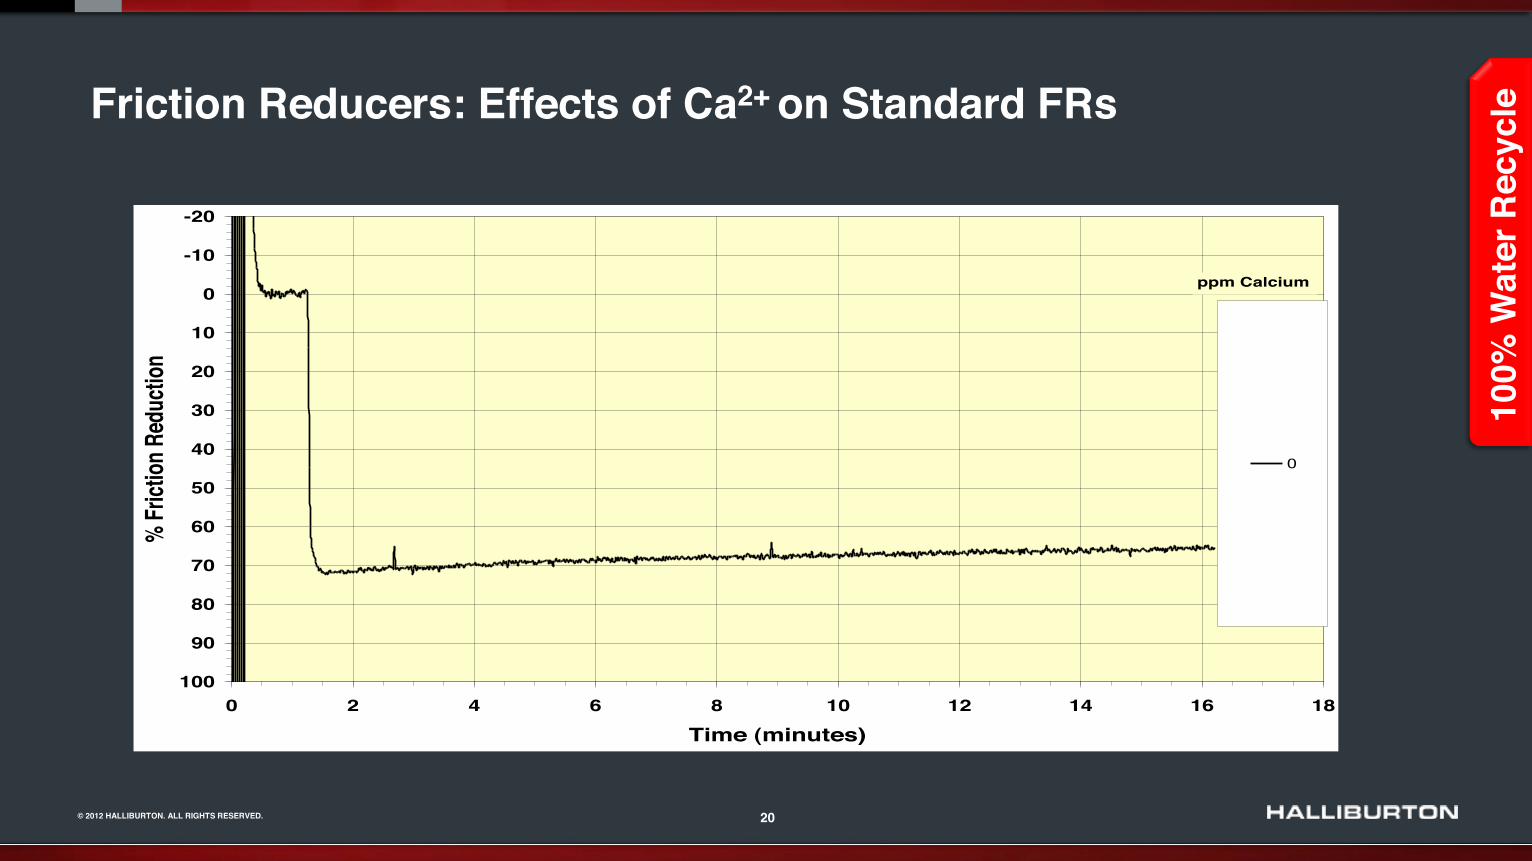
Friction Reducers: Effects of Ca2+ on Standard FRs % Reduction vs. Time in 1/2-in Smooth Pipe
Looking at effects of Ca2+ on 2.5 lb/Mgal of Anionic FR-20
-10
0
10
20
30
40
50
60
70
80
90
1000 2 4 6 8 10 12 14 16 18
Time (minutes)
% Fr
iction
Red
uctio
n
0
ppm Calcium
100%
Wat
er R
ecyc
le
21 © 2012 HALLIBURTON. ALL RIGHTS RESERVED.
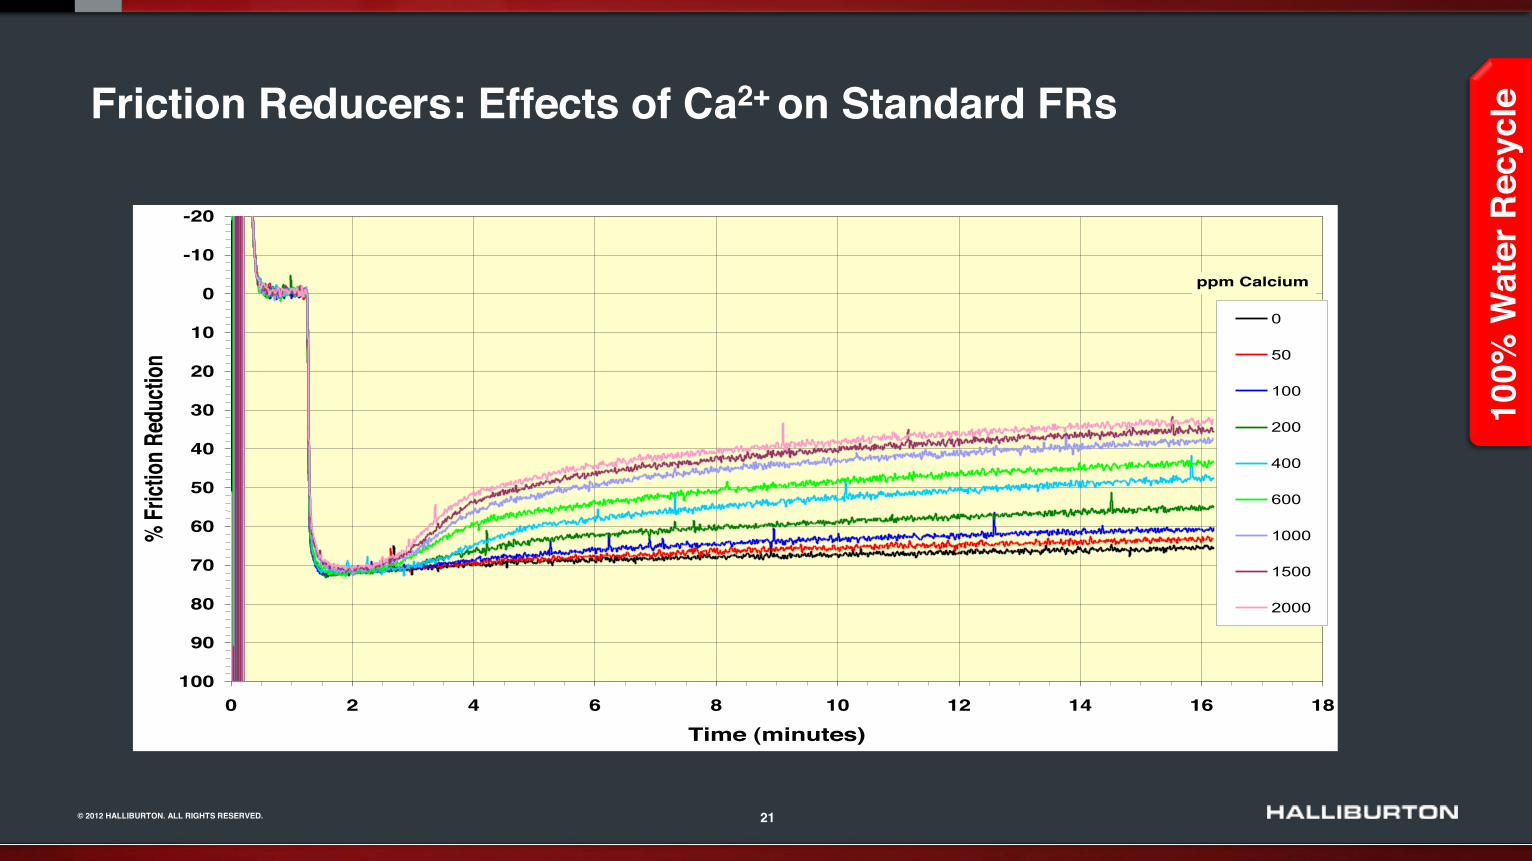
Friction Reducers: Effects of Ca2+ on Standard FRs
% Reduction vs. Time in 1/2-in Smooth PipeLooking at effects of Ca2+ on 2.5 lb/Mgal of Anionic FR
-20
-10
0
10
20
30
40
50
60
70
80
90
1000 2 4 6 8 10 12 14 16 18
Time (minutes)
% Fr
iction
Red
uctio
n
0
50
100
200
400
600
1000
1500
2000
ppm Calcium
100%
Wat
er R
ecyc
le
22 © 2012 HALLIBURTON. ALL RIGHTS RESERVED.
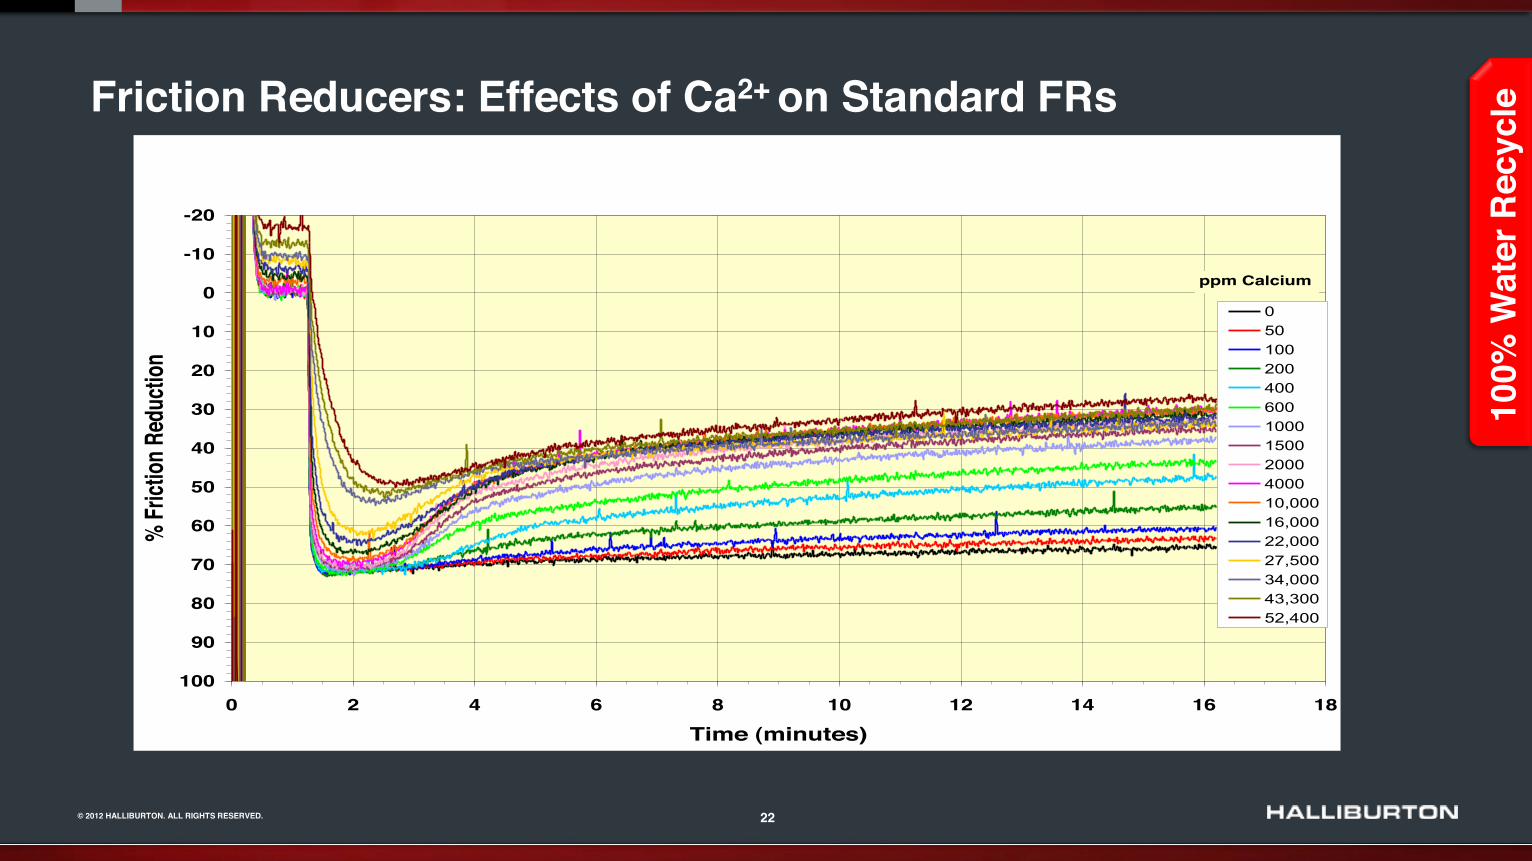
% Reduction vs. Time in 1/2-in Smooth PipeLooking at effects of Ca2+ on 2.5 lb/Mgal of Anionic FR
-20
-10
0
10
20
30
40
50
60
70
80
90
1000 2 4 6 8 10 12 14 16 18
Time (minutes)
% Fr
iction
Red
uctio
n
050100200400600100015002000400010,00016,00022,00027,50034,00043,30052,400
ppm Calcium
Friction Reducers: Effects of Ca2+ on Standard FRs
100%
Wat
er R
ecyc
le
23 © 2012 HALLIBURTON. ALL RIGHTS RESERVED.
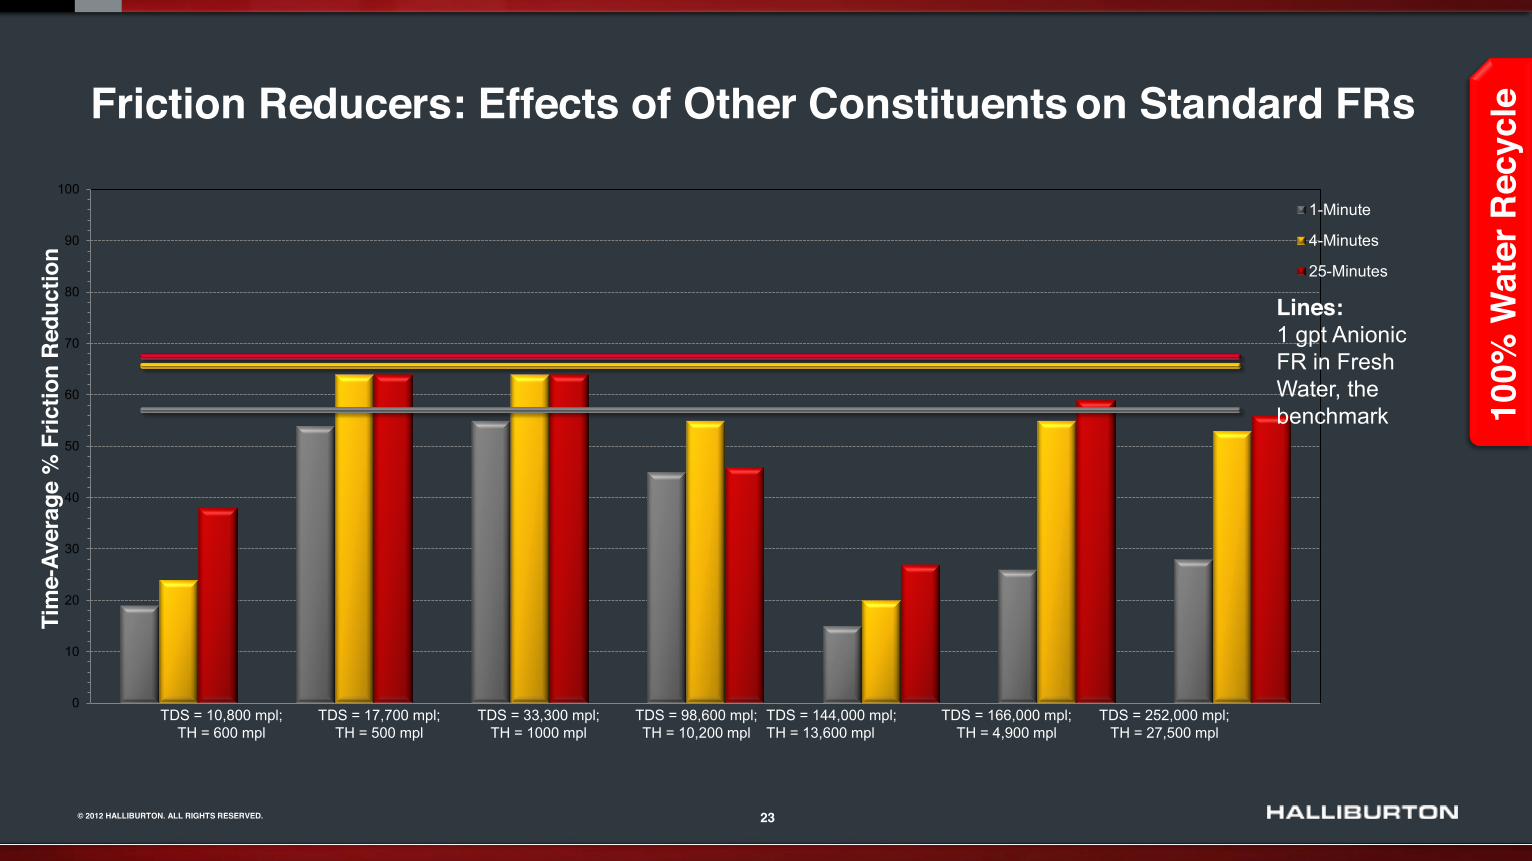
Friction Reducers: Effects of Other Constituents on Standard FRs
100%
Wat
er R
ecyc
le
0
10
20
30
40
50
60
70
80
90
1001-Minute
4-Minutes
25-Minutes
Tim
e-Av
erag
e %
Fric
tion
Red
uctio
n
TDS = 10,800 mpl; TH = 600 mpl
TDS = 17,700 mpl; TH = 500 mpl
TDS = 33,300 mpl; TH = 1000 mpl
TDS = 98,600 mpl; TH = 10,200 mpl
TDS = 144,000 mpl; TH = 13,600 mpl
TDS = 166,000 mpl; TH = 4,900 mpl
TDS = 252,000 mpl; TH = 27,500 mpl
Lines: 1 gpt Anionic FR in Fresh Water, the benchmark

24 © 2012 HALLIBURTON. ALL RIGHTS RESERVED.
Salt Tolerant FRs- New innovations
FR-78 FR-88 FR-98
50-100k TDS
101-200k TDS
>200k TDS
Wide range in TDS
26 © 2012 HALLIBURTON. ALL RIGHTS RESERVED.
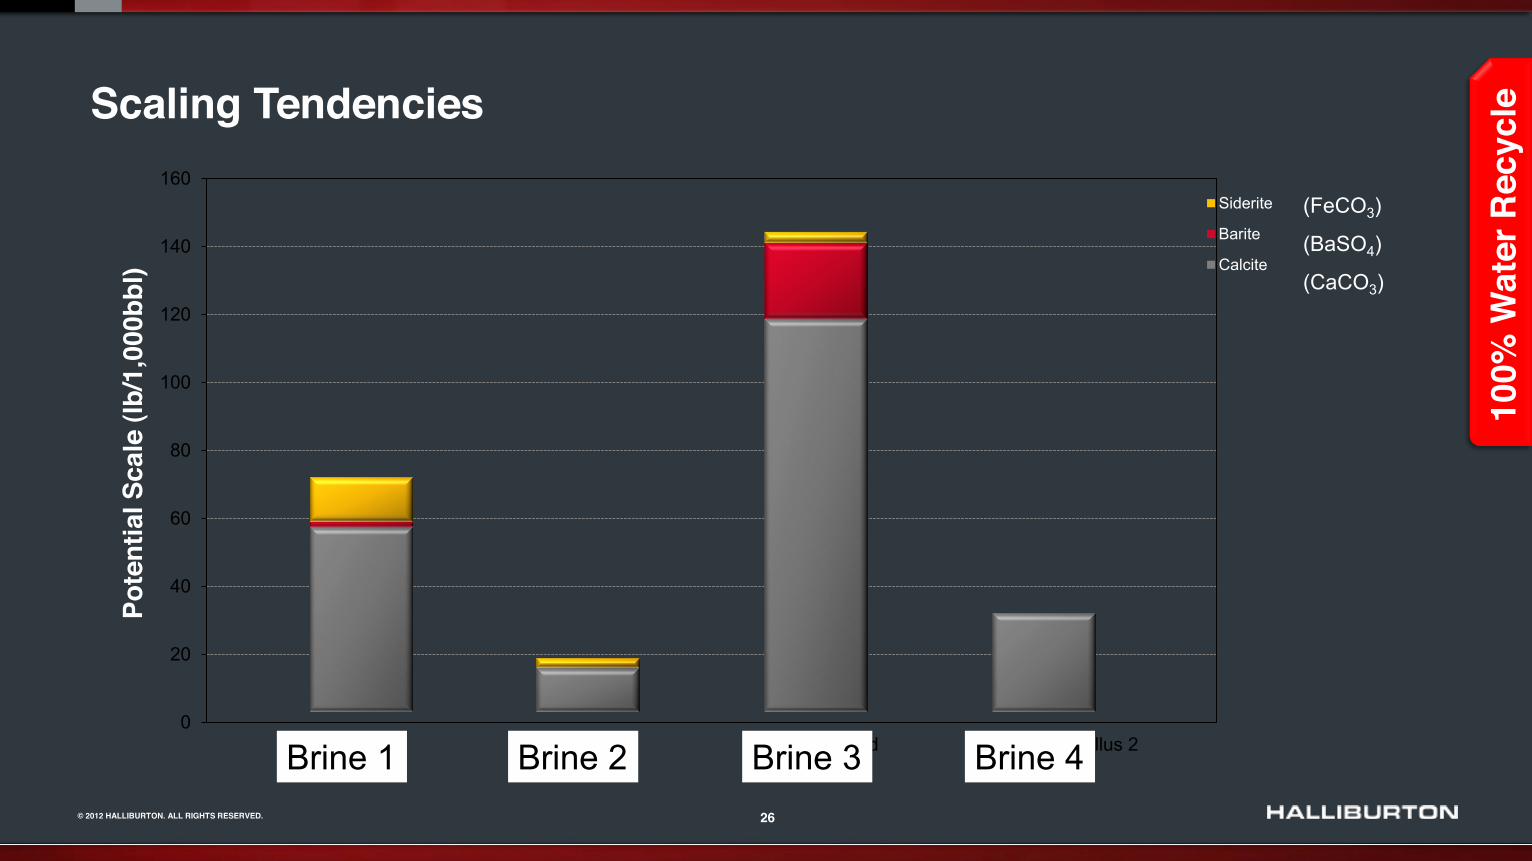
Scaling Tendencies
0
20
40
60
80
100
120
140
160
Bakken Marcellus 1 Woodford Marcellus 2
Siderite
Barite
Calcite
Pote
ntia
l Sca
le (l
b/1,
000b
bl)
(FeCO3)
(BaSO4)
(CaCO3)
Brine 1 Brine 2 Brine 3 Brine 4
100%
Wat
er R
ecyc
le
27 © 2012 HALLIBURTON. ALL RIGHTS RESERVED.
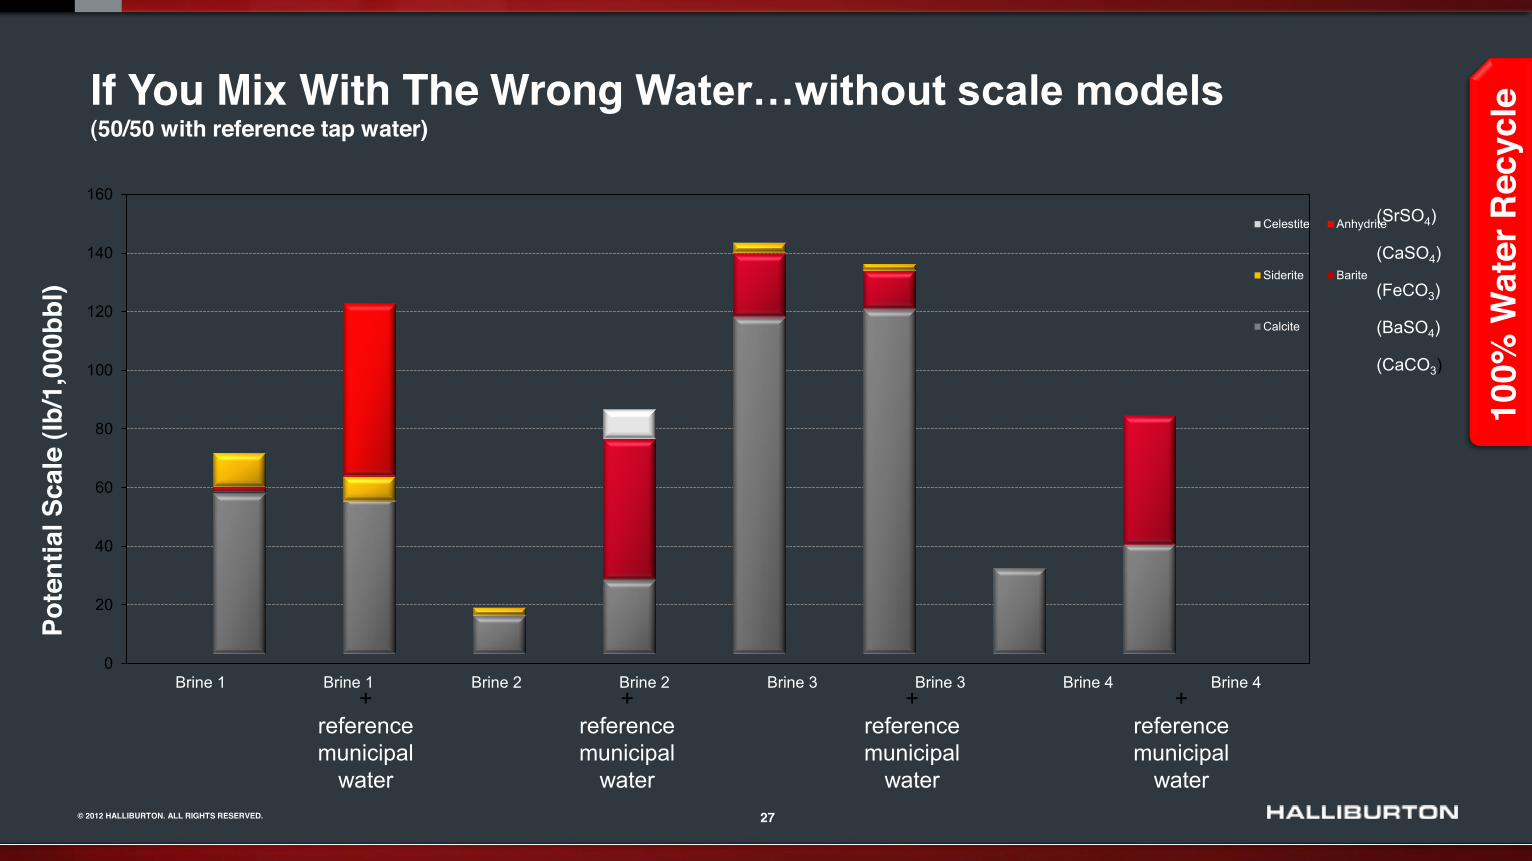
If You Mix With The Wrong (50/50 with reference tap water)
Pote
ntia
l Sca
le (l
b/1,
000b
bl)
0
20
40
60
80
100
120
140
160
Brine 1 Brine 1 Brine 2 Brine 2 Brine 3 Brine 3 Brine 4 Brine 4
Celestite Anhydrite
Siderite Barite
Calcite
+ reference municipal
water
+ reference municipal
water
(SrSO4)
(CaSO4)
(FeCO3)
(BaSO4)
(CaCO3)
100%
Wat
er R
ecyc
le
+ reference municipal
water
+ reference municipal
water
28 © 2012 HALLIBURTON. ALL RIGHTS RESERVED.
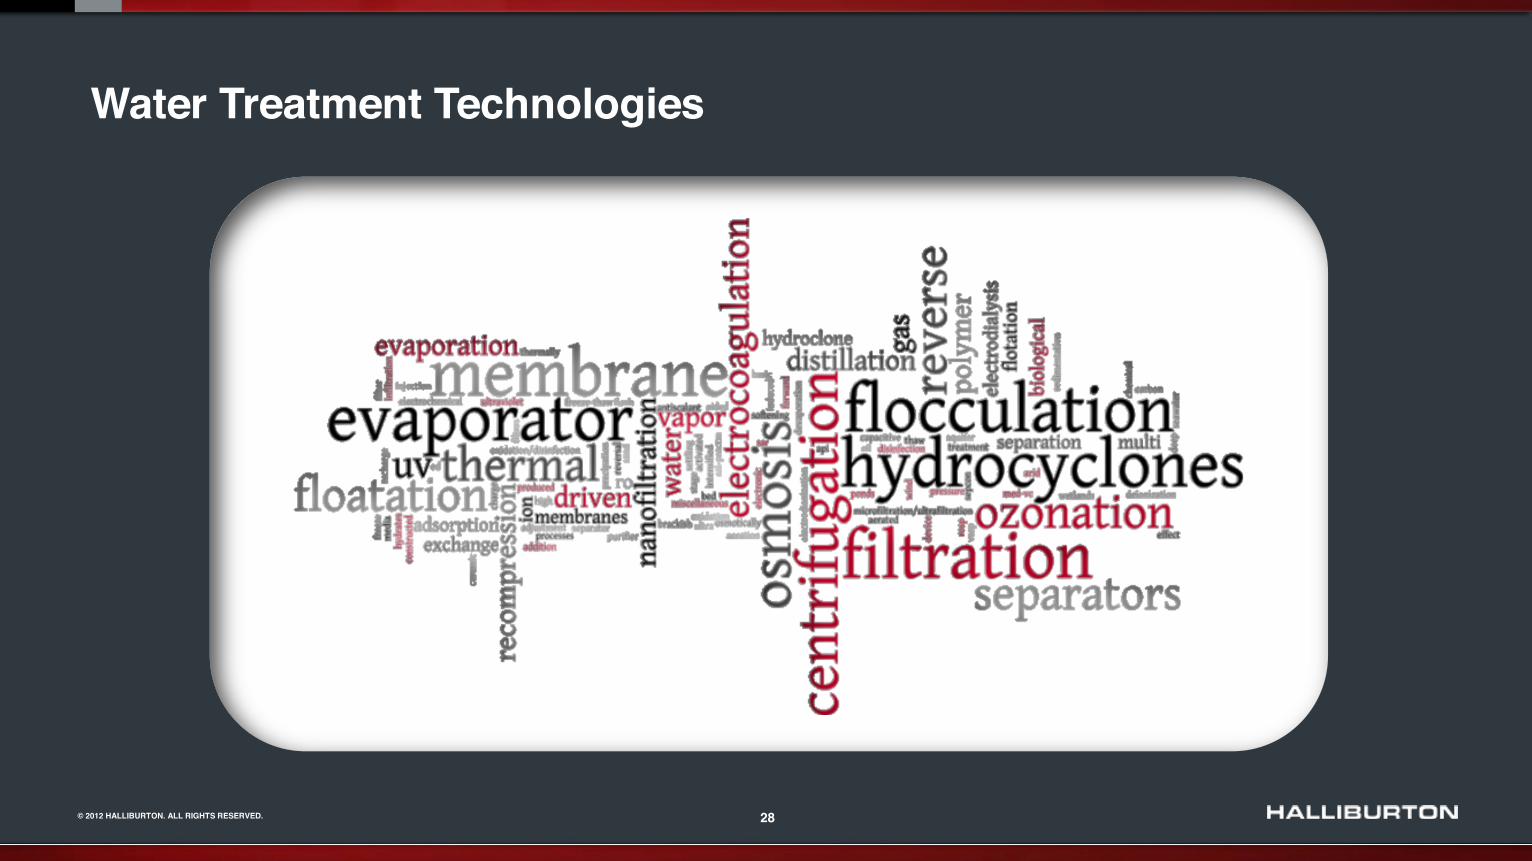
Water Treatment Technologies
29 © 2012 HALLIBURTON. ALL RIGHTS RESERVED.
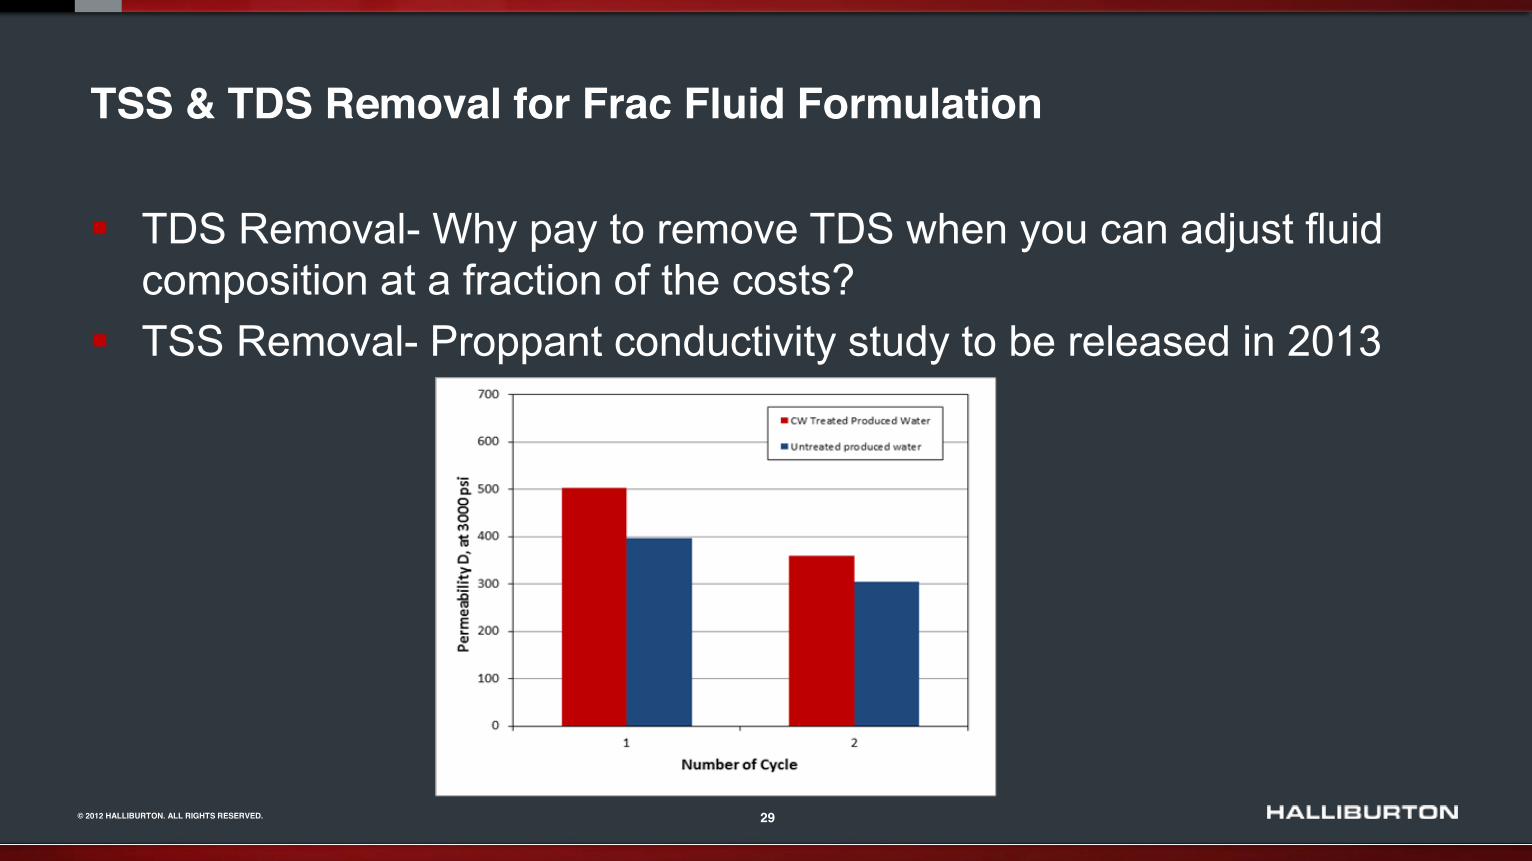
TSS & TDS Removal for Frac Fluid Formulation
TDS Removal- Why pay to remove TDS when you can adjust fluid composition at a fraction of the costs? TSS Removal- Proppant conductivity study to be released in 2013
30 © 2012 HALLIBURTON. ALL RIGHTS RESERVED.
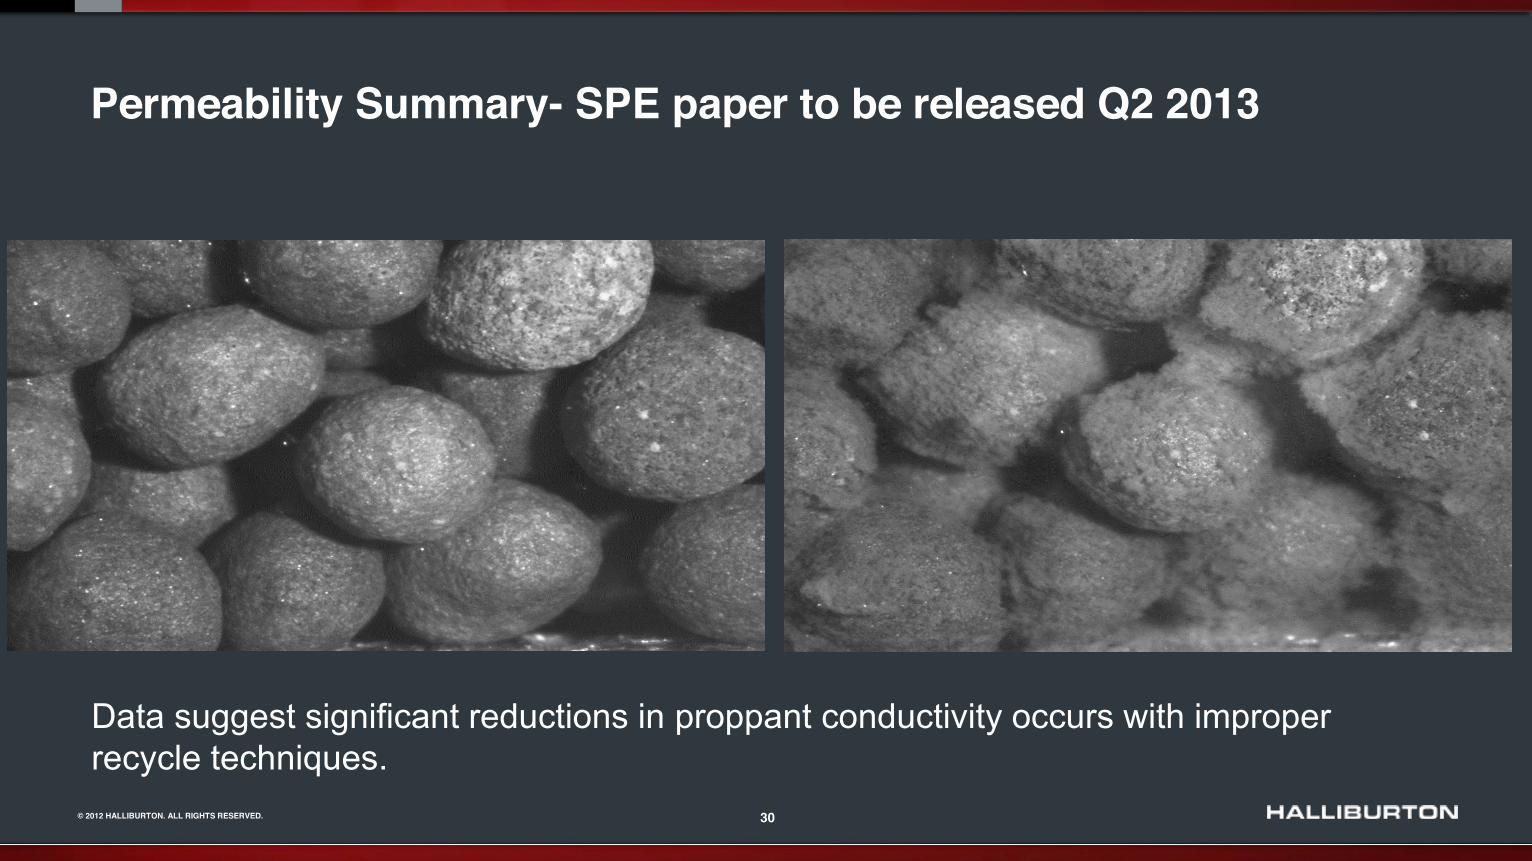
Permeability Summary- SPE paper to be released Q2 2013
Data suggest significant reductions in proppant conductivity occurs with improper recycle techniques.
31 © 2012 HALLIBURTON. ALL RIGHTS RESERVED.
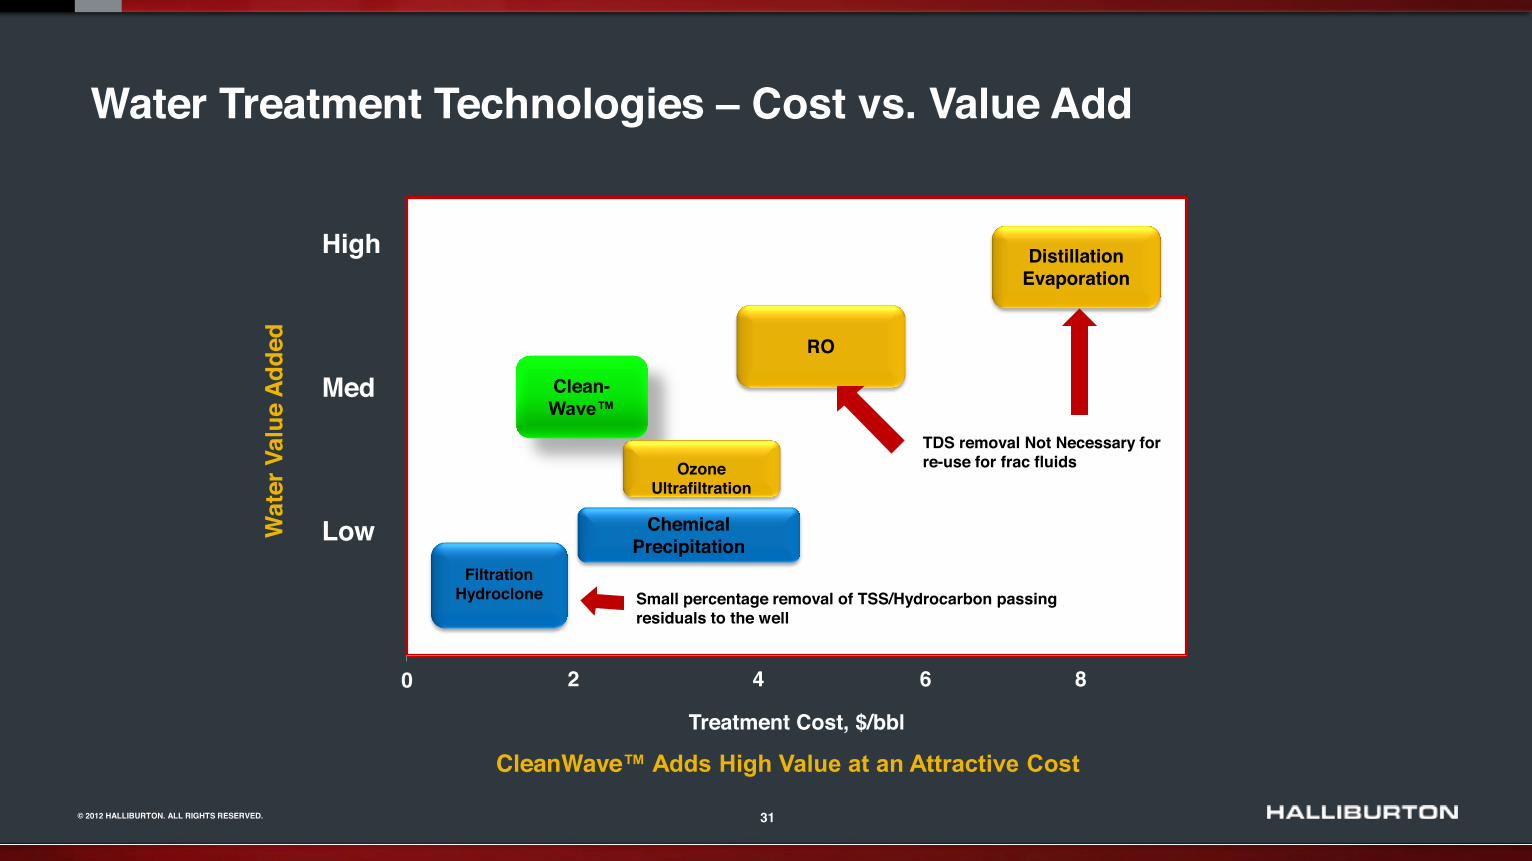
Water Treatment Technologies Cost vs. Value Add
0
Treatment Cost, $/bbl
Clean-
Distillation Evaporation
Ozone Ultrafiltration
RO
Chemical Precipitation
Small percentage removal of TSS/Hydrocarbon passing
residuals to the well
CleanWave
High
Med
Low
Filtration Hydroclone
Wat
er V
alue
Add
ed
TDS removal Not Necessary for re-use for frac fluids
2 4 6 8
32 © 2012 HALLIBURTON. ALL RIGHTS RESERVED.
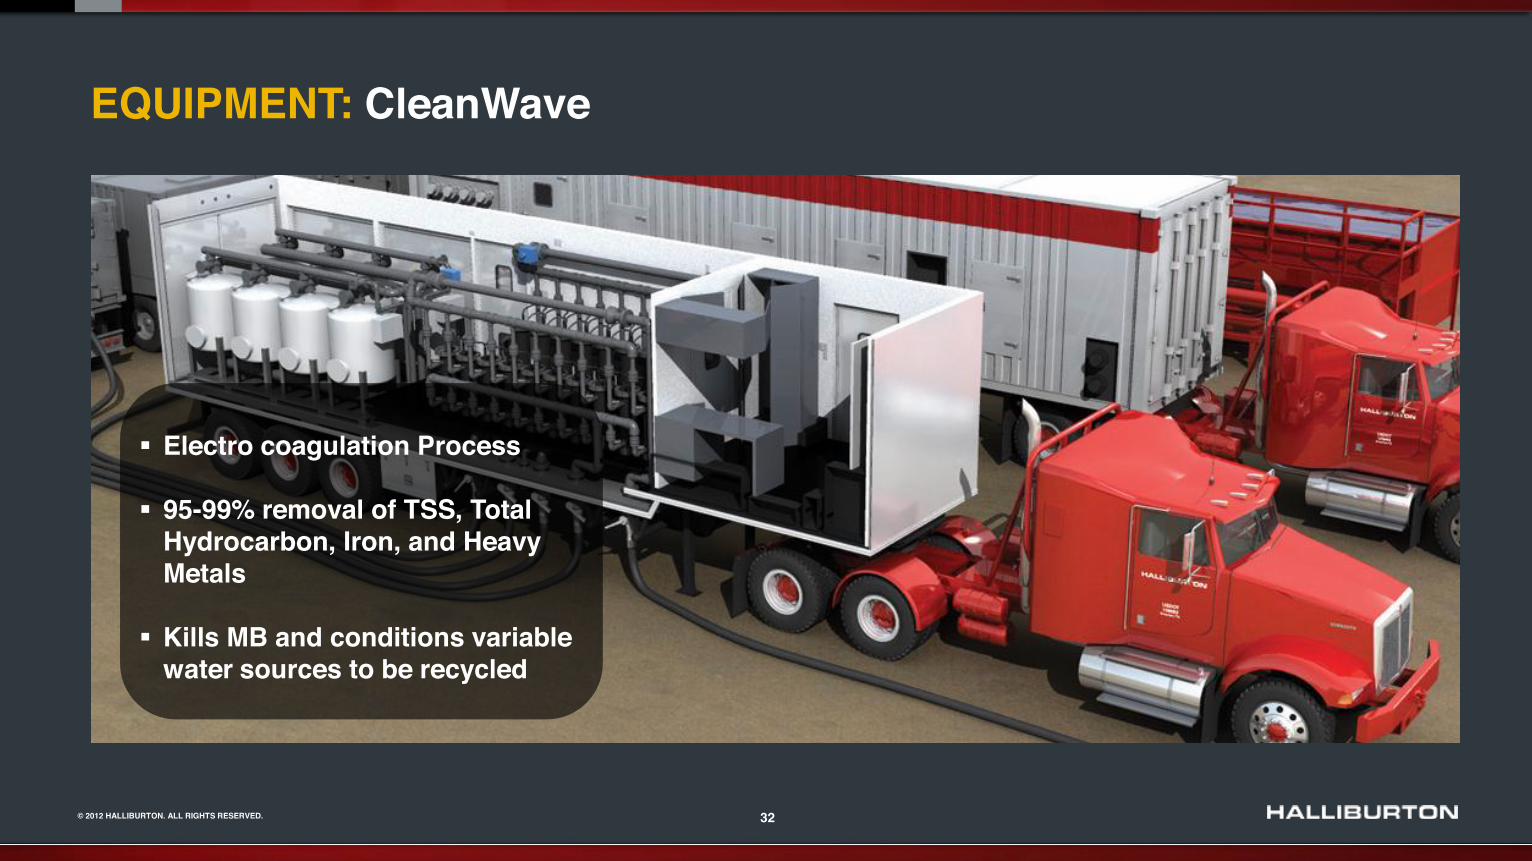
EQUIPMENT: CleanWave
Electro coagulation Process 95-99% removal of TSS, Total Hydrocarbon, Iron, and Heavy Metals Kills MB and conditions variable water sources to be recycled
33 © 2012 HALLIBURTON. ALL RIGHTS RESERVED.
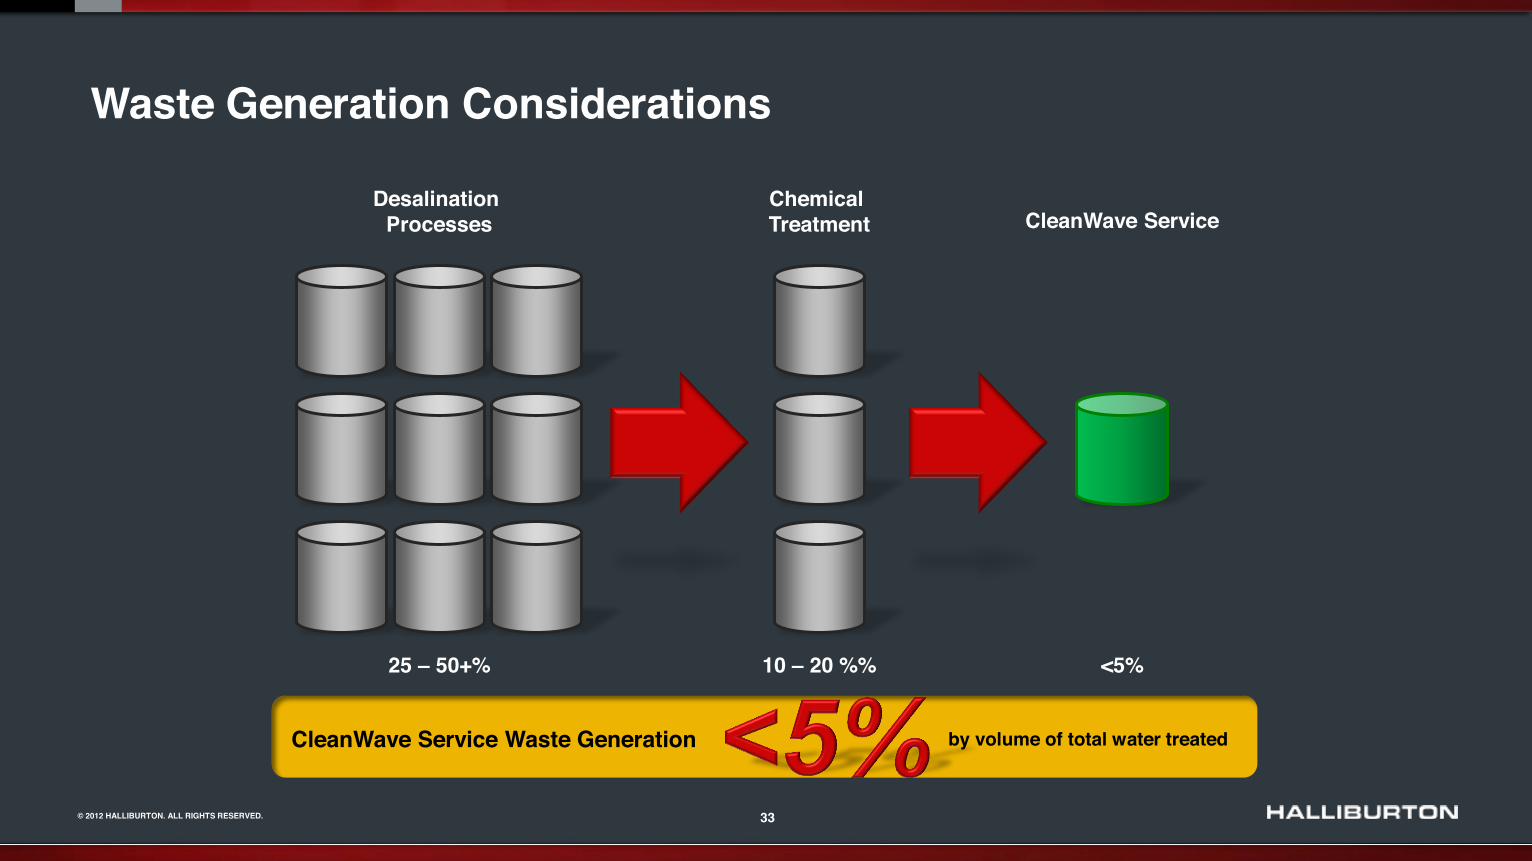
Waste Generation Considerations
CleanWave Service Waste Generation by volume of total water treated
Desalination Processes
Chemical Treatment CleanWave Service
25 50+% 10 20 %% <5%
34 © 2012 HALLIBURTON. ALL RIGHTS RESERVED.
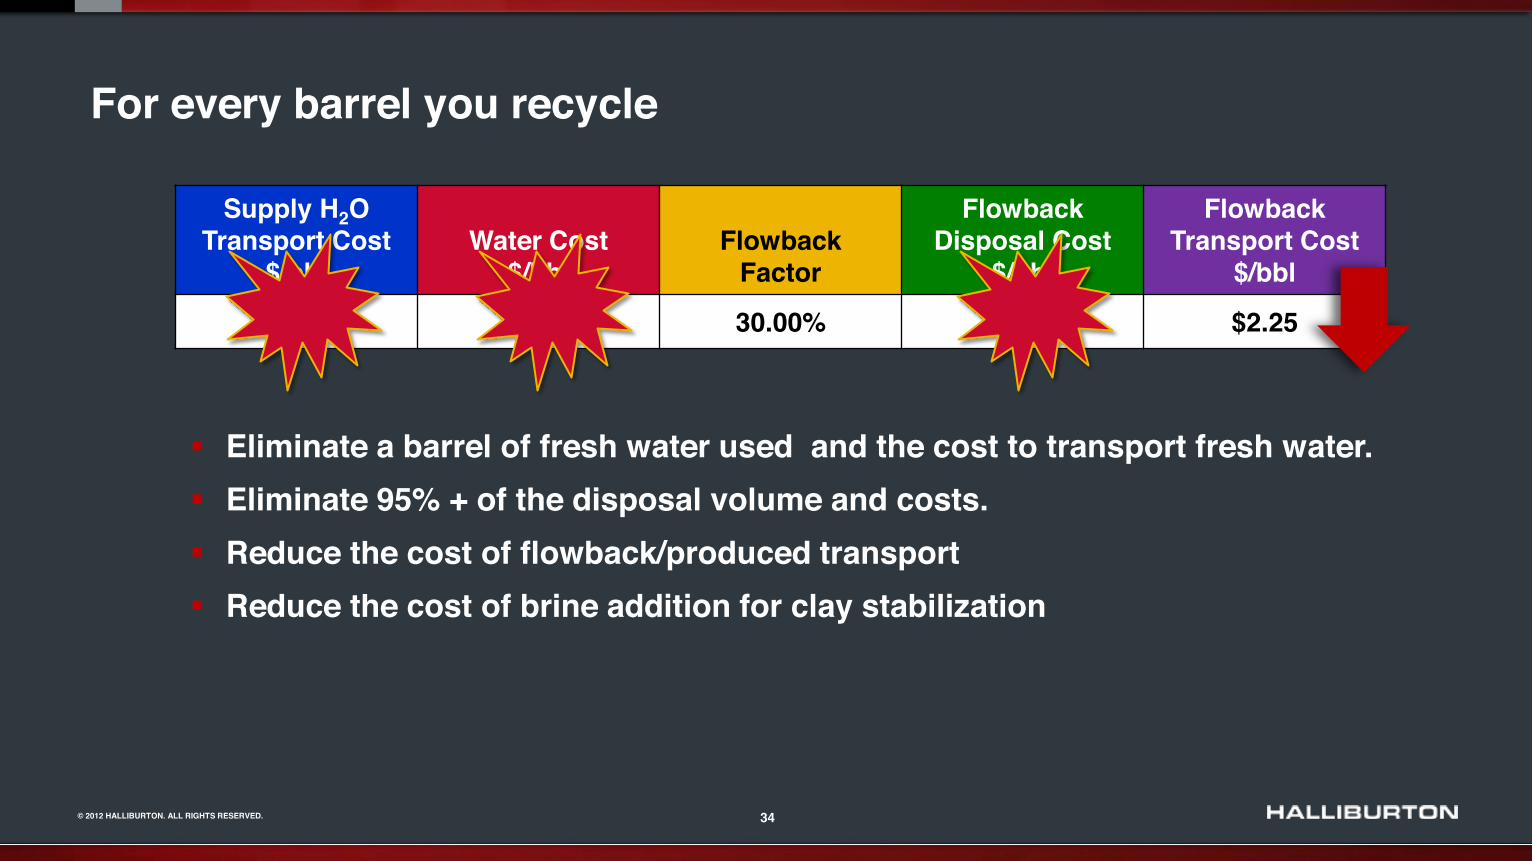
For every barrel you recycle
Supply H2O Transport Cost
$/bbl Water Cost
$/bbl Flowback
Factor
Flowback Disposal Cost
$/bbl
Flowback Transport Cost
$/bbl
$2.00 $0.45 30.00% $1.25 $2.25
Eliminate a barrel of fresh water used and the cost to transport fresh water. Eliminate 95% + of the disposal volume and costs. Reduce the cost of flowback/produced transport Reduce the cost of brine addition for clay stabilization
35 © 2012 HALLIBURTON. ALL RIGHTS RESERVED.
The Value of Brine
CleanWave makes a clean brine from produced and flowback waters Using this brine can avert or significantly reduce costly additions of KCL and other clay stabilization products resulting in large ROI for producers. Why haul valuable brine( and water) away and then pay to add brine to fresh water?
36 © 2012 HALLIBURTON. ALL RIGHTS RESERVED.
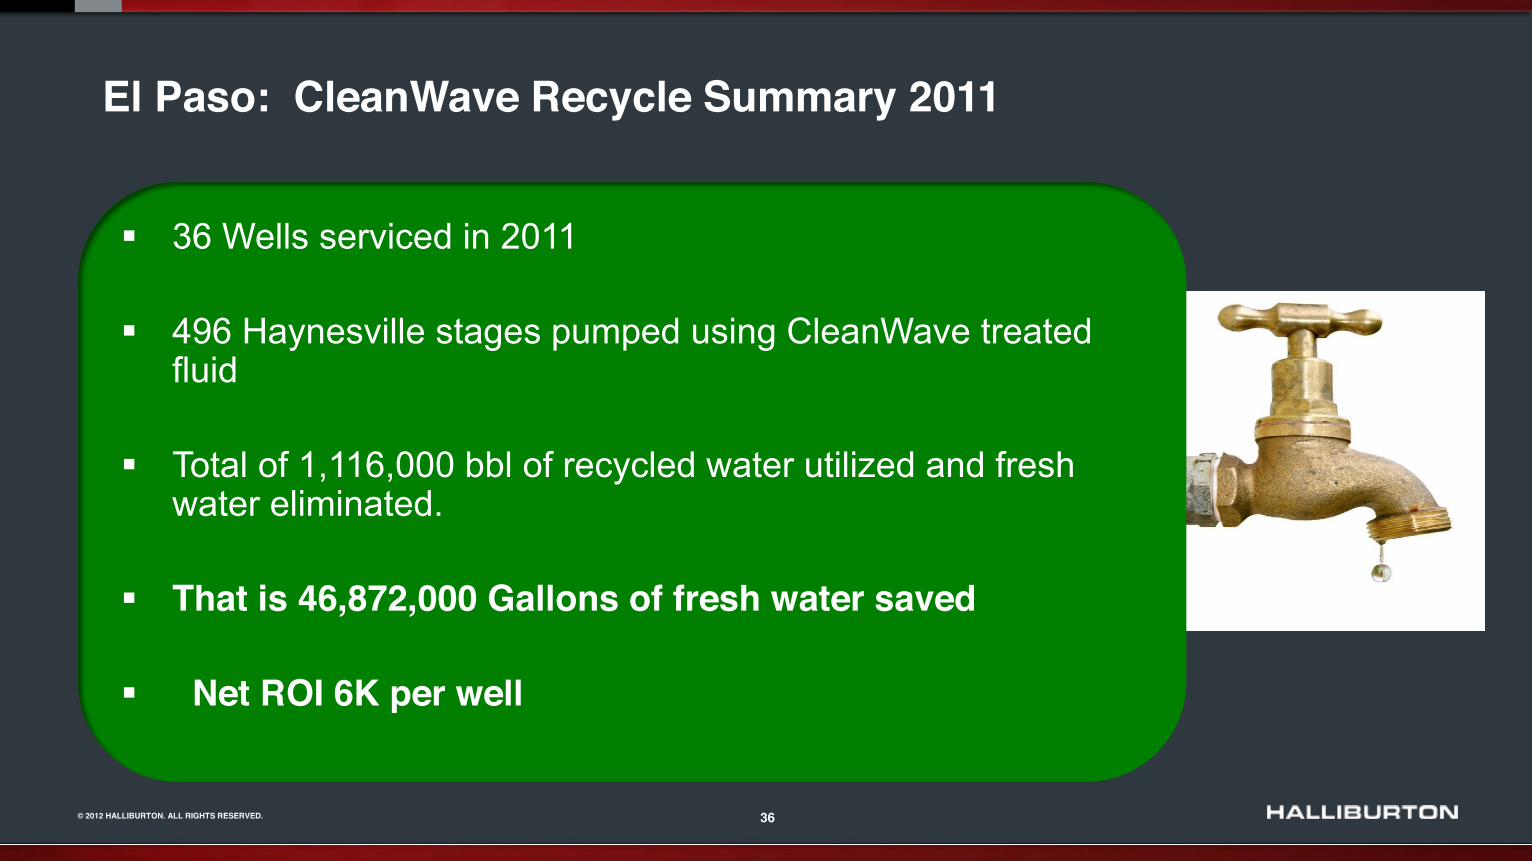
El Paso: CleanWave Recycle Summary 2011
36 Wells serviced in 2011
496 Haynesville stages pumped using CleanWave treated fluid Total of 1,116,000 bbl of recycled water utilized and fresh water eliminated. That is 46,872,000 Gallons of fresh water saved
Net ROI 6K per well
37 © 2012 HALLIBURTON. ALL RIGHTS RESERVED.
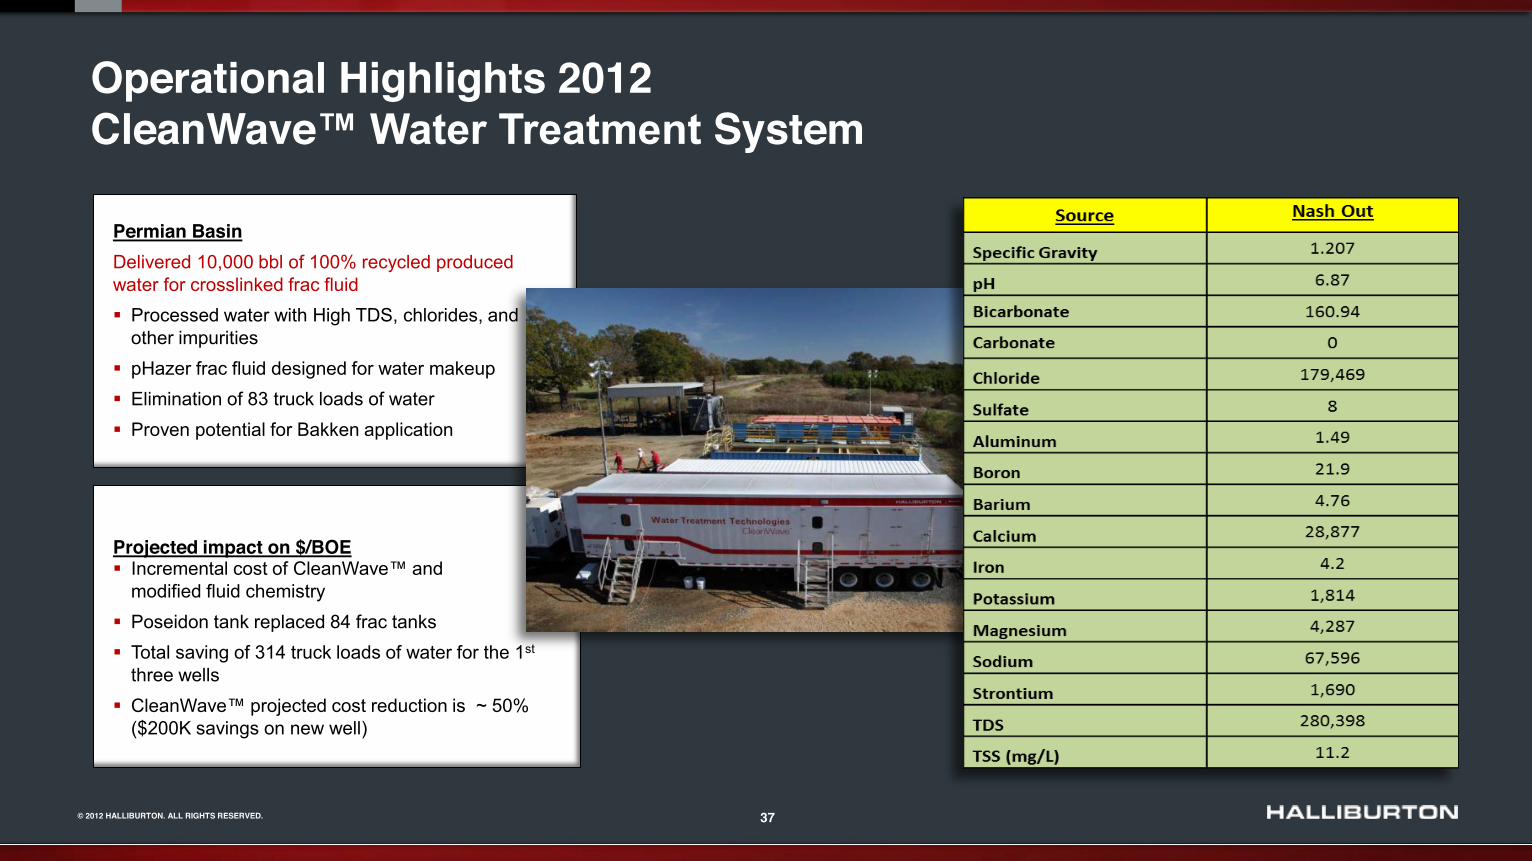
Operational Highlights 2012 CleanWave System
Permian Basin Delivered 10,000 bbl of 100% recycled produced water for crosslinked frac fluid
Processed water with High TDS, chlorides, and other impurities pHazer frac fluid designed for water makeup Elimination of 83 truck loads of water Proven potential for Bakken application
Projected impact on $/BOE
Incremental cost of CleanWave modified fluid chemistry Poseidon tank replaced 84 frac tanks Total saving of 314 truck loads of water for the 1st three wells CleanWave($200K savings on new well)
38 © 2012 HALLIBURTON. ALL RIGHTS RESERVED.
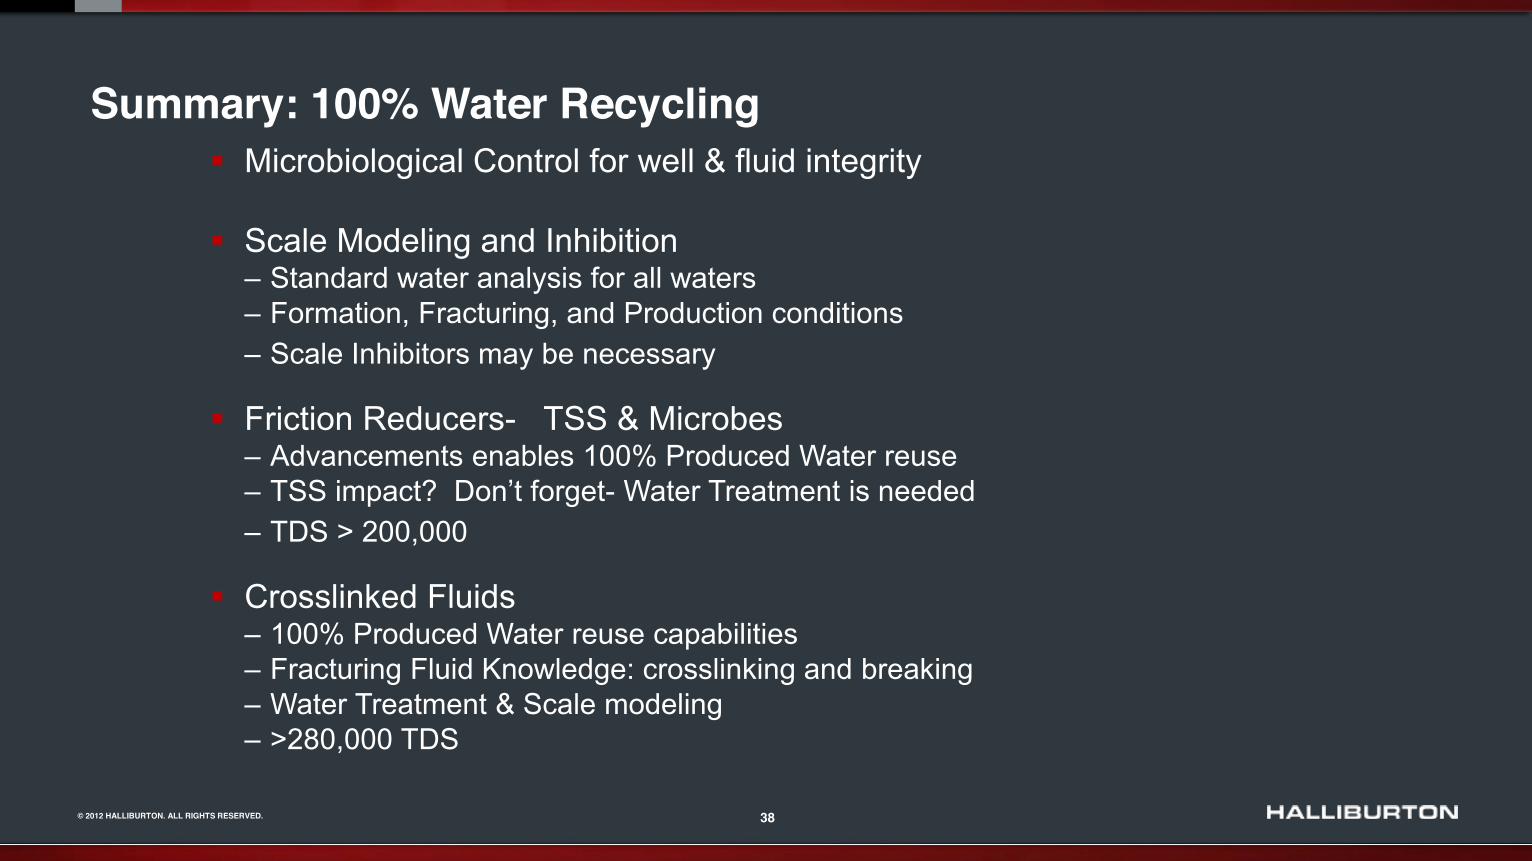
Summary: 100% Water Recycling Microbiological Control for well & fluid integrity Scale Modeling and Inhibition
Standard water analysis for all waters Formation, Fracturing, and Production conditions Scale Inhibitors may be necessary
Friction Reducers- TSS & Microbes Advancements enables 100% Produced Water reuse
- Water Treatment is needed TDS > 200,000
Crosslinked Fluids 100% Produced Water reuse capabilities Fracturing Fluid Knowledge: crosslinking and breaking Water Treatment & Scale modeling >280,000 TDS
39 © 2012 HALLIBURTON. ALL RIGHTS RESERVED.
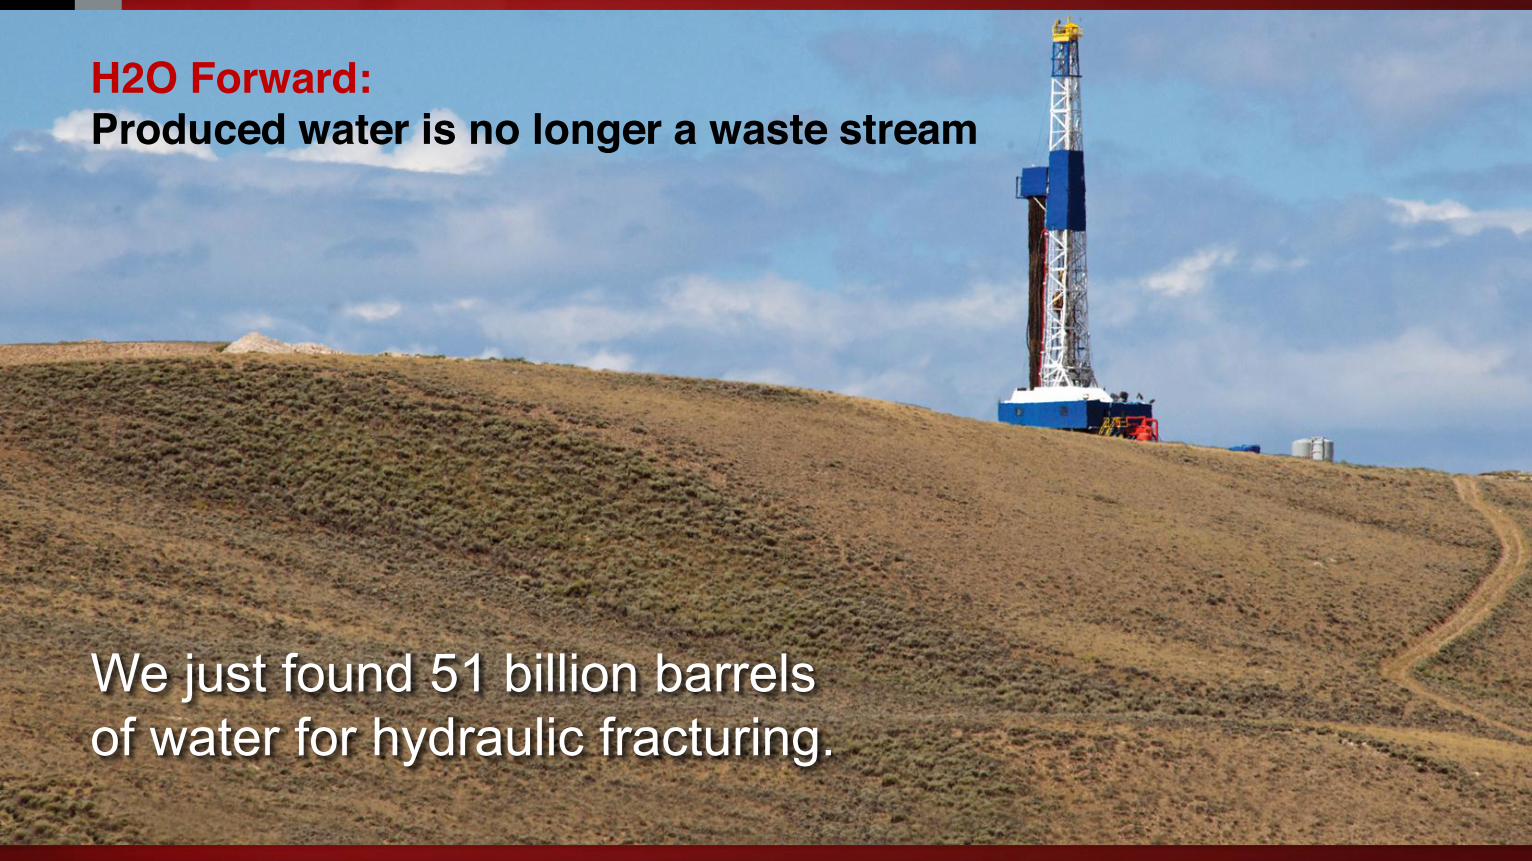
H2O Forward: Produced water is no longer a waste stream
We just found 51 billion barrels of water for hydraulic fracturing.

41 © 2012 HALLIBURTON. ALL RIGHTS RESERVED.
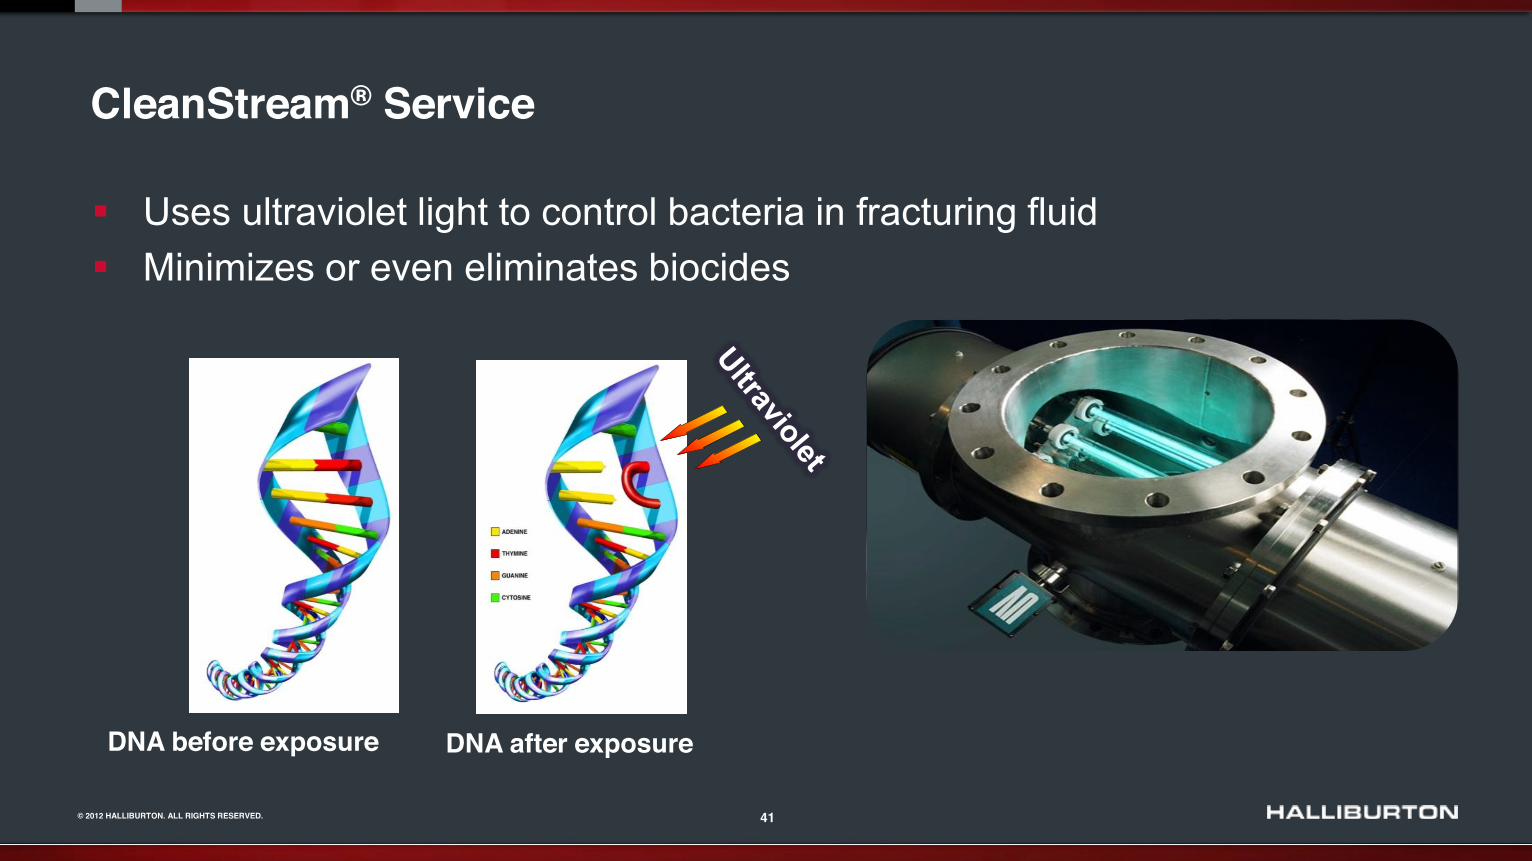
Uses ultraviolet light to control bacteria in fracturing fluid Minimizes or even eliminates biocides
DNA before exposure DNA after exposure
CleanStream® Service
42 © 2012 HALLIBURTON. ALL RIGHTS RESERVED.
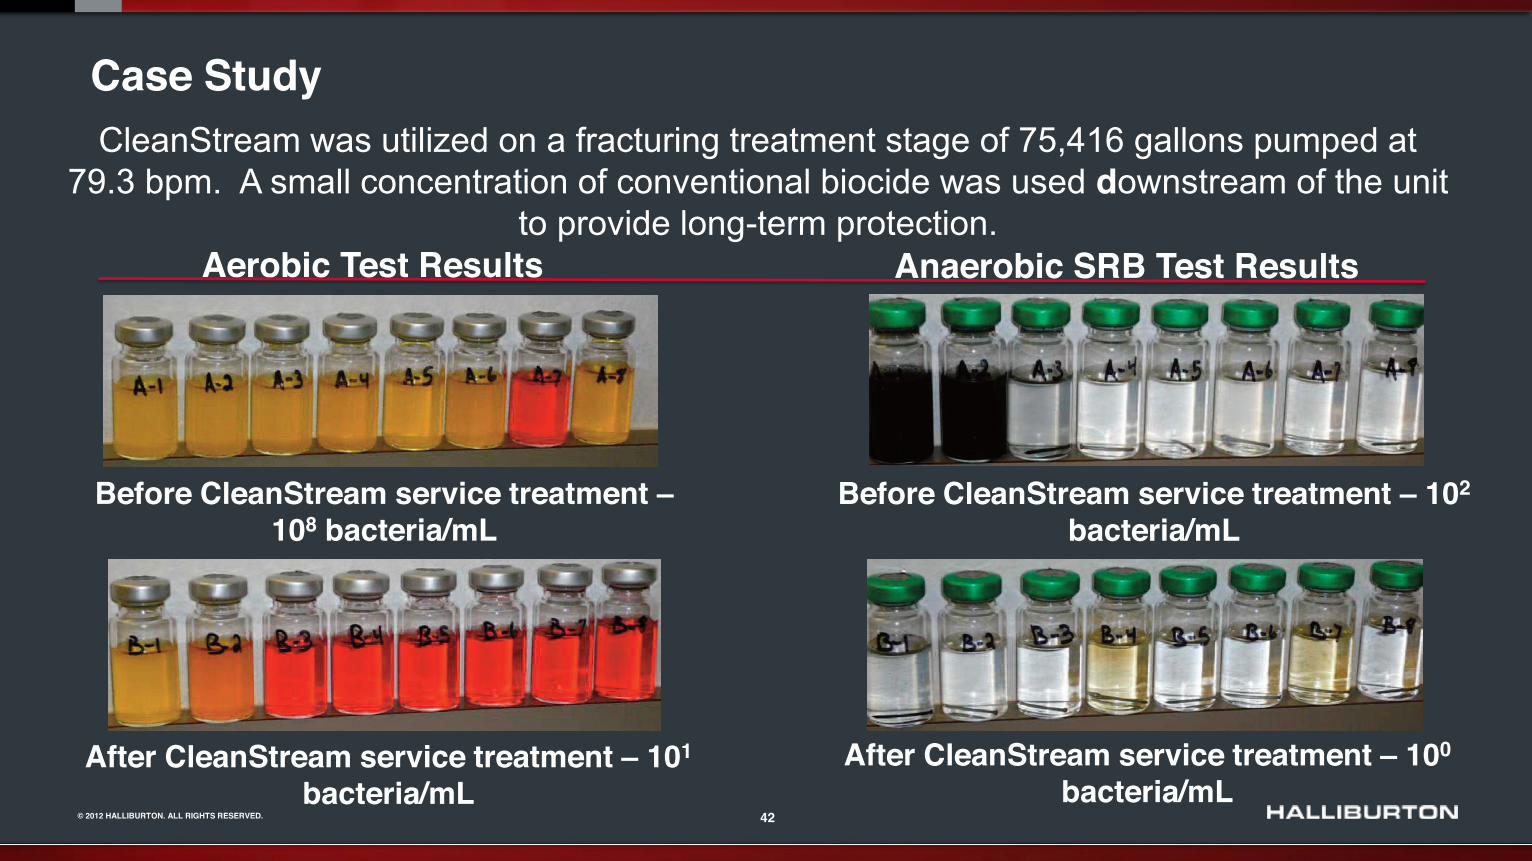
Case Study
Before CleanStream service treatment 108 bacteria/mL
After CleanStream service treatment 101 bacteria/mL
Before CleanStream service treatment 102
bacteria/mL
After CleanStream service treatment 100 bacteria/mL
Aerobic Test Results Anaerobic SRB Test Results
CleanStream was utilized on a fracturing treatment stage of 75,416 gallons pumped at 79.3 bpm. A small concentration of conventional biocide was used downstream of the unit
to provide long-term protection.
43 © 2012 HALLIBURTON. ALL RIGHTS RESERVED.
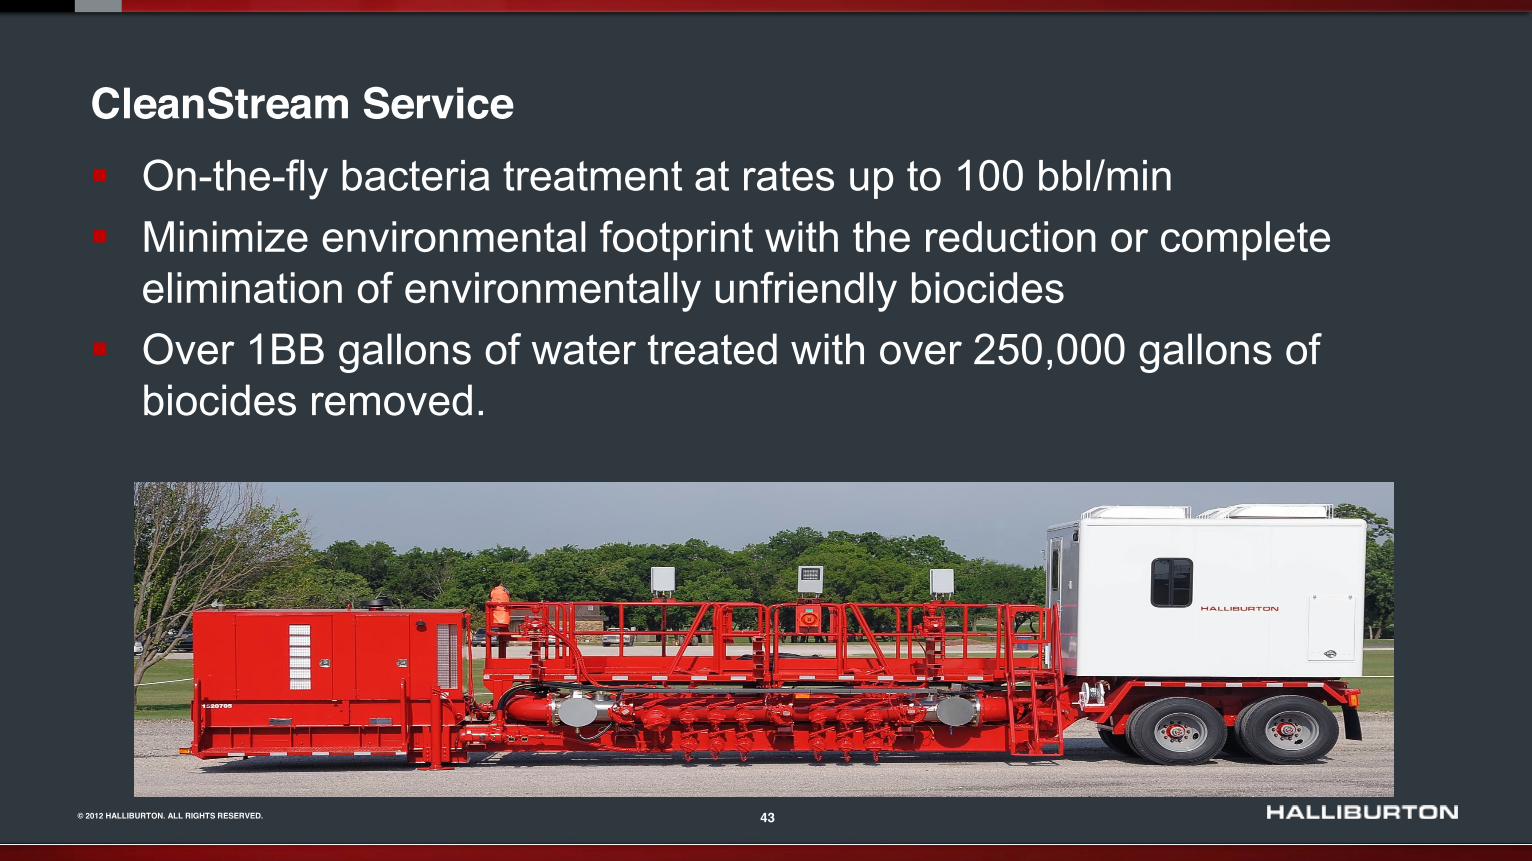
CleanStream Service On-the-fly bacteria treatment at rates up to 100 bbl/min Minimize environmental footprint with the reduction or complete elimination of environmentally unfriendly biocides Over 1BB gallons of water treated with over 250,000 gallons of biocides removed.