sustained sales and earnings growth - air liquide
TRANSCRIPT
H1 2015
Paris, July 30, 2015
Sustained sales and earnings growth
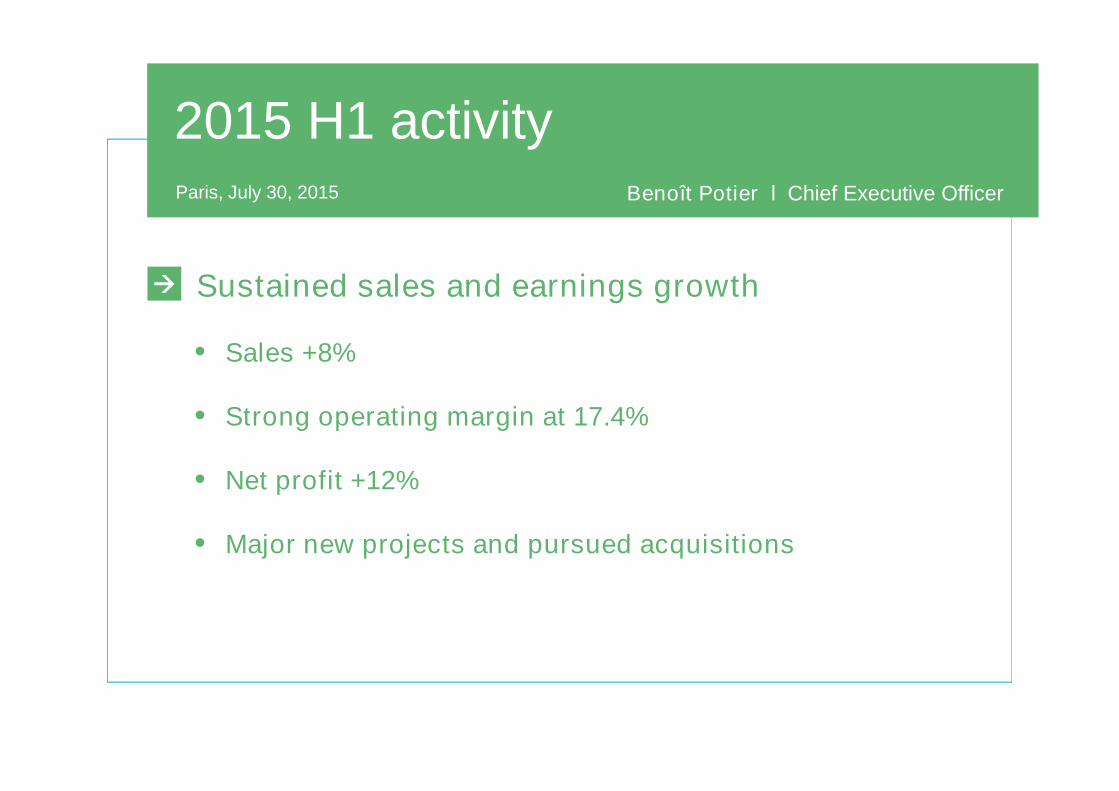
2015 H1 activityBenoît Potier l Chief Executive OfficerParis, July 30, 2015
Sustained sales and earnings growth
• Sales +8%
• Strong operating margin at 17.4%
• Net profit +12%
• Major new projects and pursued acquisitions
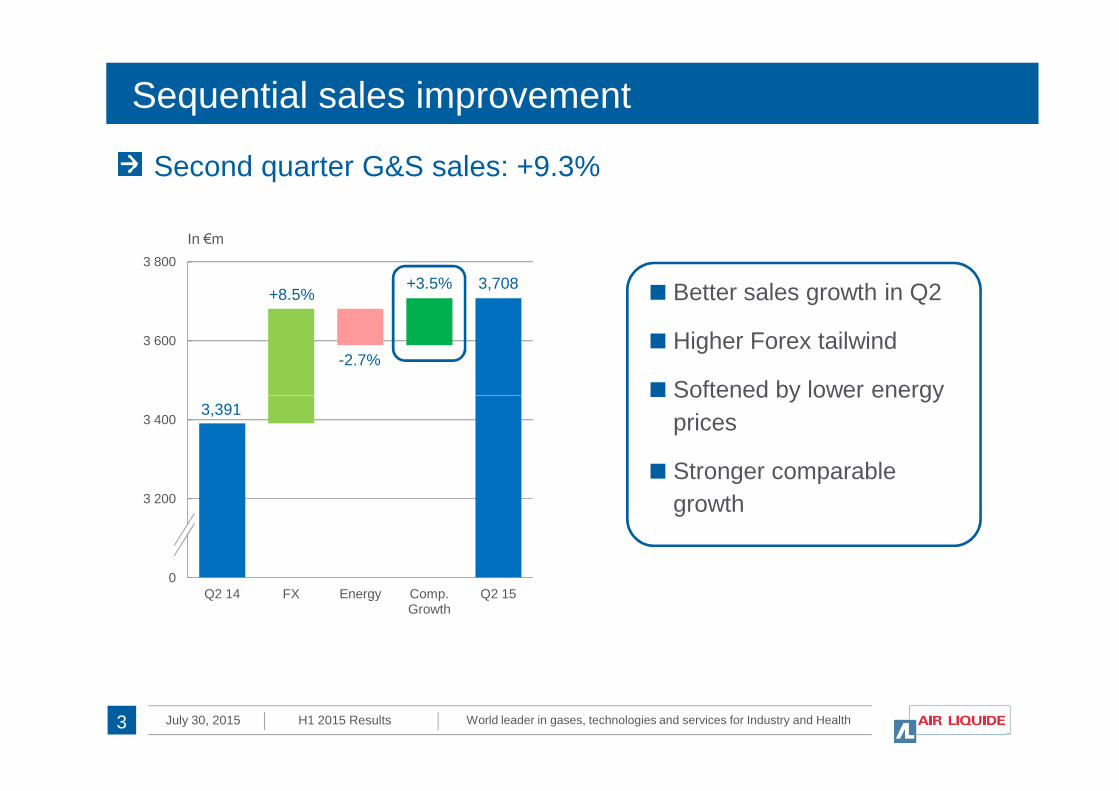
Sequential sales improvement
In €m
3 600
3 800
3,708+8.5%
-2.7%
+3.5%
Second quarter G&S sales: +9.3%
Better sales growth in Q2
Higher Forex tailwind
Softened by lower energy
World leader in gases, technologies and services for Industry and HealthJuly 30, 2015 H1 2015 Results3
3 000
3 200
3 400
Q2 14 FX Energy Comp.Growth
Q2 15
3,391Softened by lower energy
prices
Stronger comparable
growth

An uncertain global economic environment
4
6
8Year on Year in % (3-month rolling average) Softening manufacturing in
China
Low Brazilian economy
Low growth in South East Asia
Industrial Production
World leader in gases, technologies and services for Industry and HealthJuly 30, 2015 H1 2015 Results4
-4
-2
0
2
Source Coe-Rexecode
Low oil price impact in North
America
Weak mining industry in
Australia
Progressive recovery in Europe
World
United States
Euro Zone
Developing Economies
2013 2014 2015
600
800
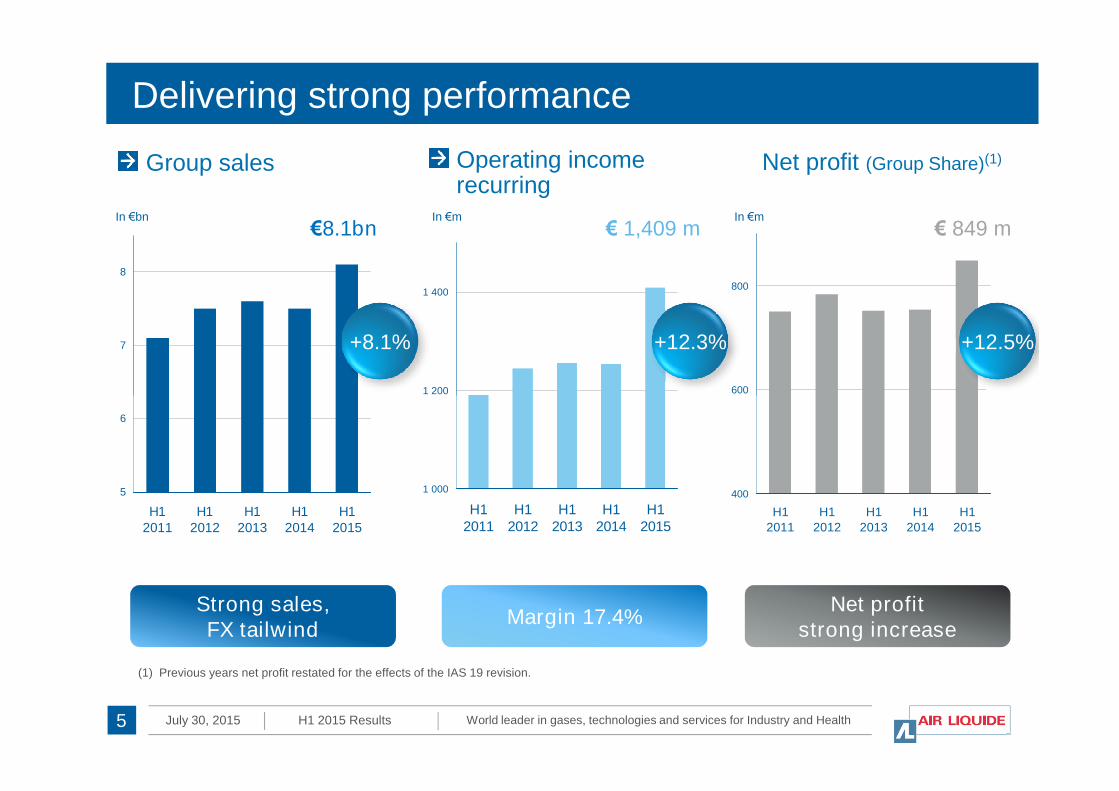
Delivering strong performance
In €mIn €m
Net profit (Group Share)(1)Operating incomerecurring
1 200
1 400
Group sales
7
8
In €bn€8.1bn
+12.5%+8.1% +12.3%
€ 1,409 m € 849 m
World leader in gases, technologies and services for Industry and HealthJuly 30, 2015 H1 2015 Results
400
600
H12011
H12012
H12013
H12014
H12015
(1) Previous years net profit restated for the effects of the IAS 19 revision.
1 000
1 200
H12011
H12012
H12013
H12014
H12015
5
5
6
H12011
H12012
H12013
H12014
H12015
Margin 17.4%Net profit
strong increaseStrong sales,FX tailwind
Fabienne Lecorvaisier l Chief Financial Officer
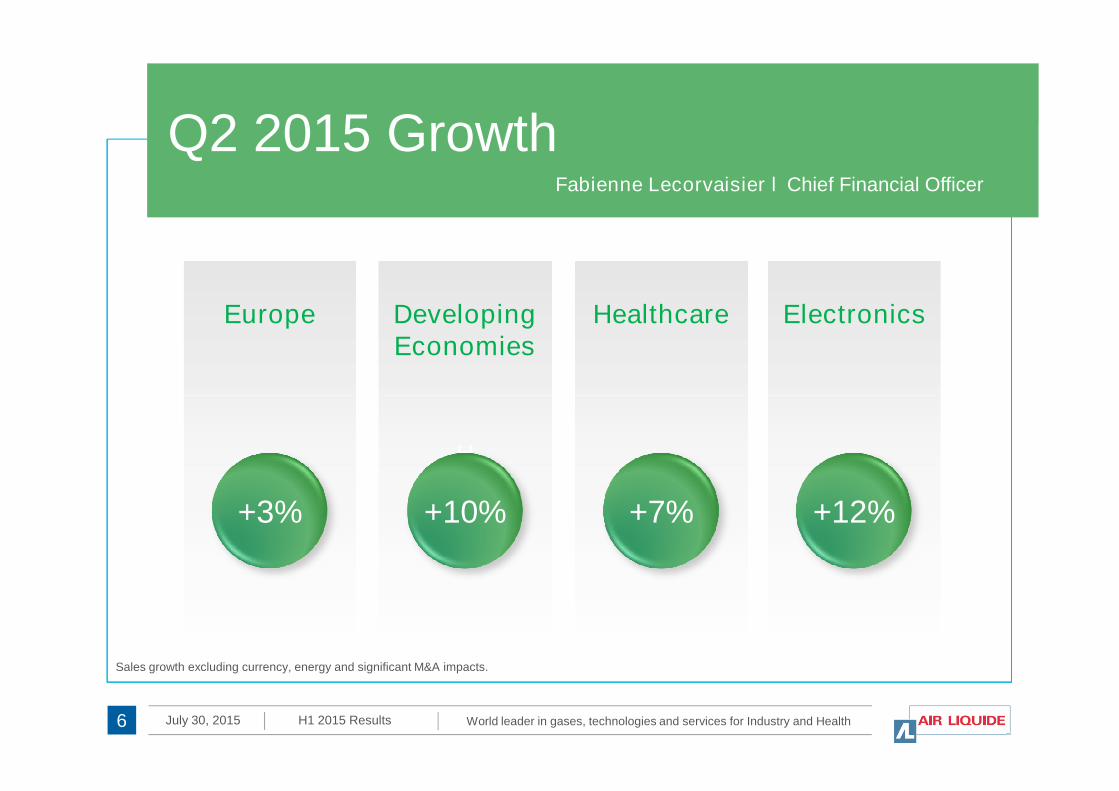
Q2 2015 Growth
Europe DevelopingEconomies
Healthcare Electronics
World leader in gases, technologies and services for Industry and HealthJuly 30, 2015 H1 2015 Results
H
6
+10% +7% +12%
Sales growth excluding currency, energy and significant M&A impacts.
+3%
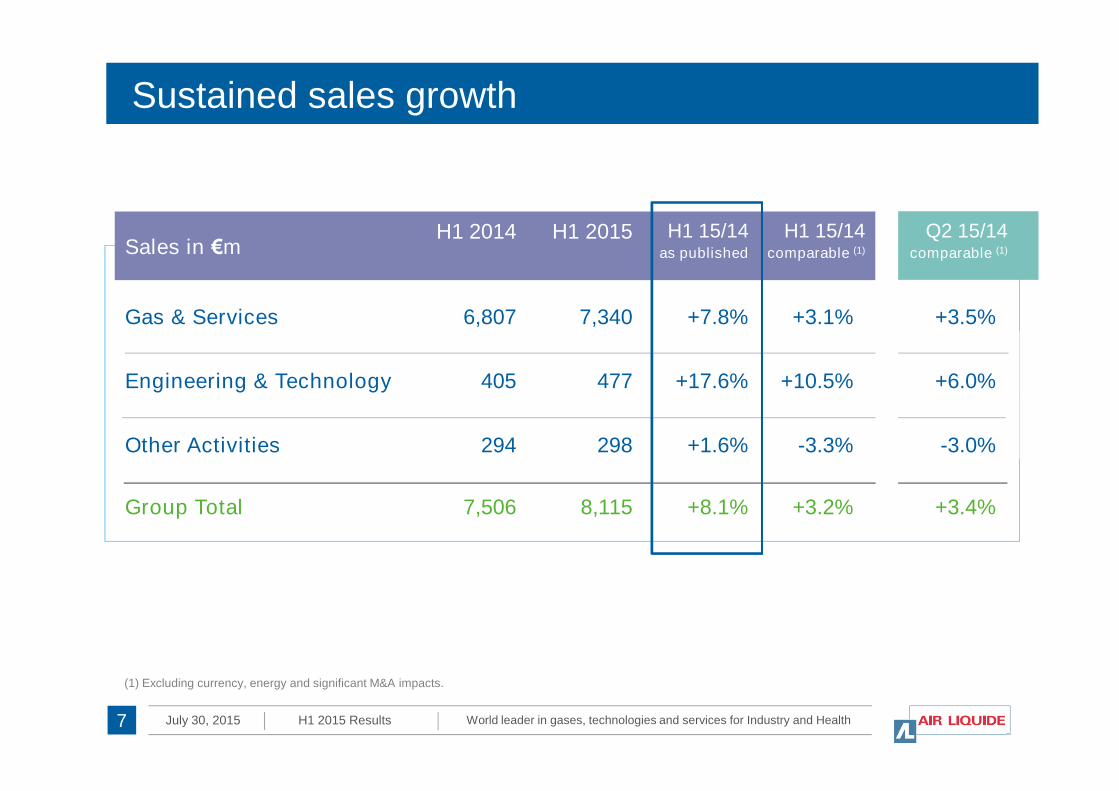
Sustained sales growth
Sales in €mH1 2014 H1 2015 H1 15/14
as published
H1 15/14comparable (1)
Q2 15/14comparable (1)
Gas & Services 6,807 7,340 +7.8% +3.1% +3.5%
Engineering & Technology 405 477 +17.6% +10.5% +6.0%
World leader in gases, technologies and services for Industry and HealthJuly 30, 2015 H1 2015 Results7
Other Activities 294 298 +1.6% -3.3% -3.0%
Group Total 7,506 8,115 +8.1% +3.2% +3.4%
(1) Excluding currency, energy and significant M&A impacts.
3.0%
5.0%
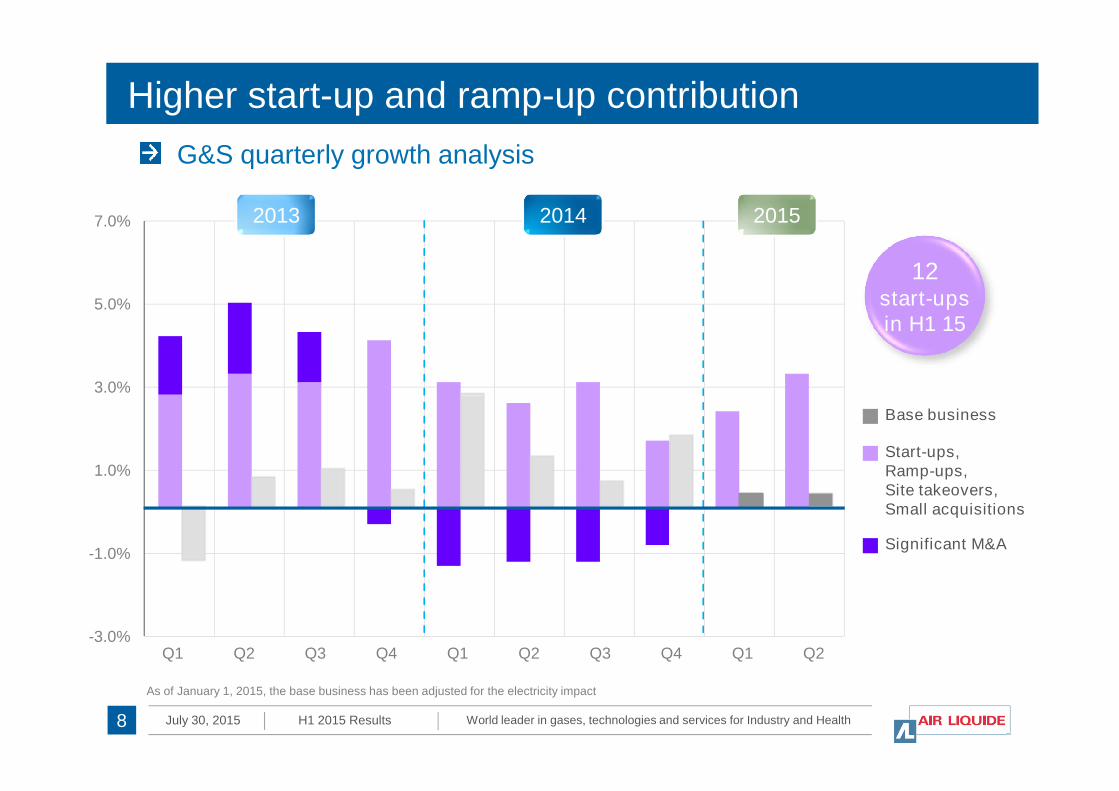
7.0%
G&S quarterly growth analysis
Higher start-up and ramp-up contribution
12start-upsin H1 15
2013 2014 2015
World leader in gases, technologies and services for Industry and HealthJuly 30, 2015 H1 2015 Results
-3.0%
-1.0%
1.0%
3.0%
8
Base business
Start-ups,Ramp-ups,Site takeovers,Small acquisitions
Significant M&A
Q1 Q2 Q3 Q4 Q1 Q2 Q3 Q4 Q1
As of January 1, 2015, the base business has been adjusted for the electricity impact
Q2
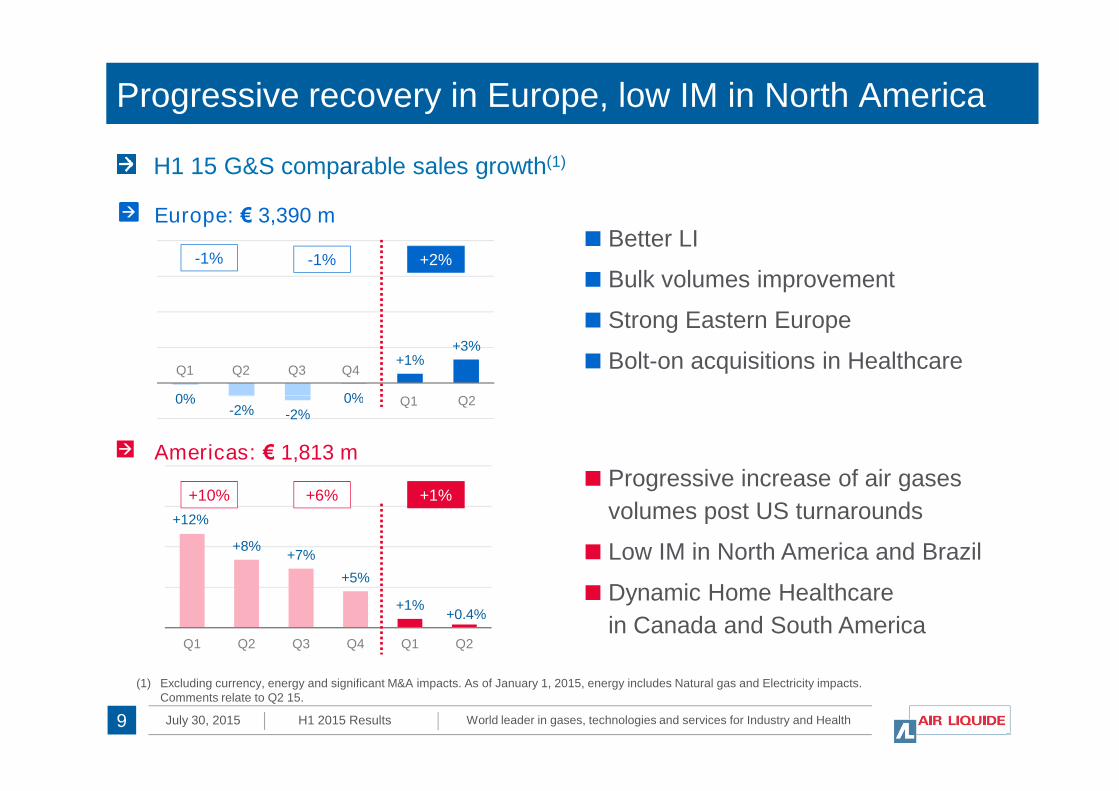
H1 15 G&S comparable sales growth(1)
Progressive recovery in Europe, low IM in North America
Europe: € 3,390 m
0% 0%
+1%+3%
Q2 Q3Q1
Q1
+2%Better LI
Bulk volumes improvement
Strong Eastern Europe
Bolt-on acquisitions in HealthcareQ4
Q2
-1% -1%
World leader in gases, technologies and services for Industry and HealthJuly 30, 2015 H1 2015 Results9
(1) Excluding currency, energy and significant M&A impacts. As of January 1, 2015, energy includes Natural gas and Electricity impacts.Comments relate to Q2 15.
Americas: € 1,813 m
+12%
+8%+7%
+5%
+1%+0.4%
Q1 Q2 Q3 Q4 Q1 Q2
+1%Progressive increase of air gases
volumes post US turnarounds
Low IM in North America and Brazil
Dynamic Home Healthcare
in Canada and South America
0%-2% -2%
0% Q1 Q2
+10% +6%
H1 15 G&S comparable sales growth(1)
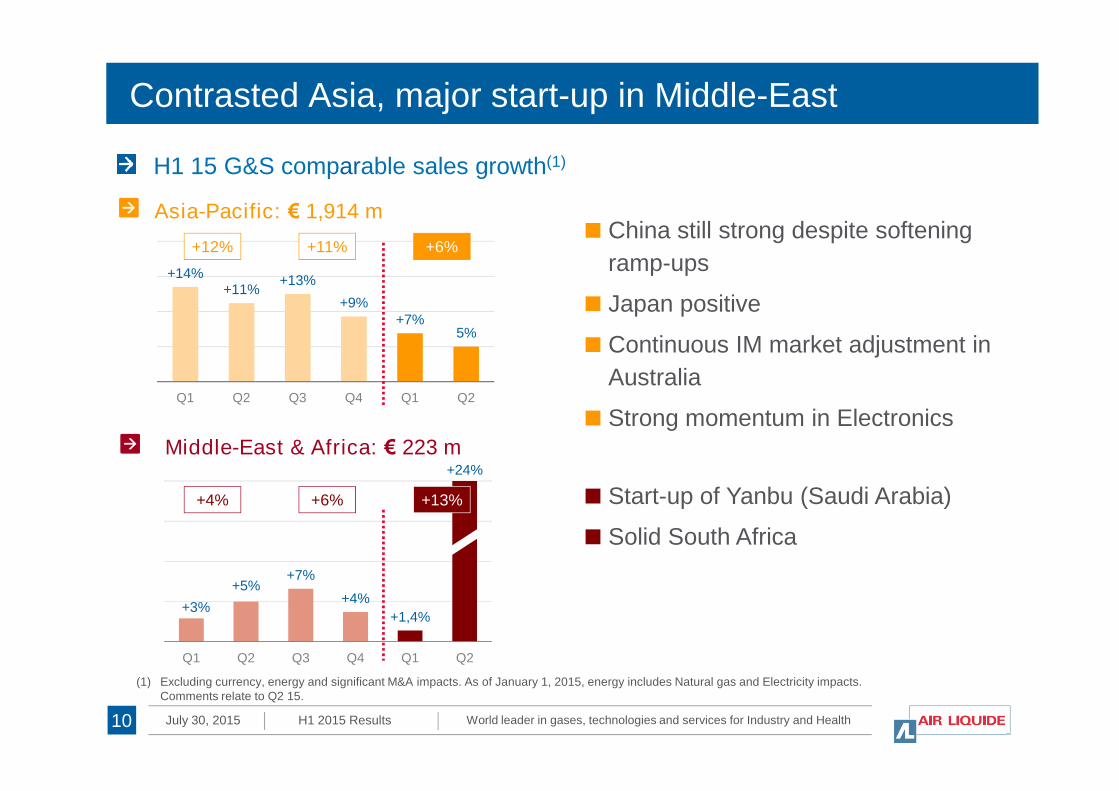
Contrasted Asia, major start-up in Middle-East
Asia-Pacific: € 1,914 m
+14%+11%
+13%
+9%+7%
5%
Q1 Q2 Q3 Q4 Q1 Q2
+6%China still strong despite softening
ramp-ups
Japan positive
Continuous IM market adjustment in
Australia
+12% +11%
World leader in gases, technologies and services for Industry and HealthJuly 30, 2015 H1 2015 Results10
Middle-East & Africa: € 223 m
Q1 Q2 Q3 Q4 Q1 Q2
+3%
+5%+7%
+4%
+1,4%
Q1 Q2 Q3 Q4 Q1 Q2
+13% Start-up of Yanbu (Saudi Arabia)
Solid South Africa
Strong momentum in Electronics
+24%
+4% +6%
(1) Excluding currency, energy and significant M&A impacts. As of January 1, 2015, energy includes Natural gas and Electricity impacts.Comments relate to Q2 15.

19%
10%
H1 15 G&S comparable growth(1)
H1
Strong Healthcare and Electronics
+5%
+3%+4% +3%
+7% +7%
Q1 Q2 Q3 Q4 Q1 Q2
Healthcare: € 1,382 m
Positive impact of bolt-onacquisitions
Strong Home Healthcare andHygiene
Better medical gases
+7%+4% +4%
World leader in gases, technologies and services for Industry and HealthJuly 30, 2015 H1 2015 Results
10%
11
H12015
+10%
+13%+12%
+13%+14%
+12%
Q1 Q2 Q3 Q4 Q1 Q2
Electronics: € 733 m
Continued strong momentum
Ramp-ups in China
Advanced materials: +28%
+13%
Q1 Q2 Q3 Q4 Q1 Q2
+12%+12%
(1) Excluding currency, energy and significant M&A impacts. As of January 1, 2015, energy includes Natural gas and Electricity impacts.Comments relate to Q2 15.
+6%
+3% +4%
+1%0%
+5%
H1 15 G&S comparable sales growth(1)
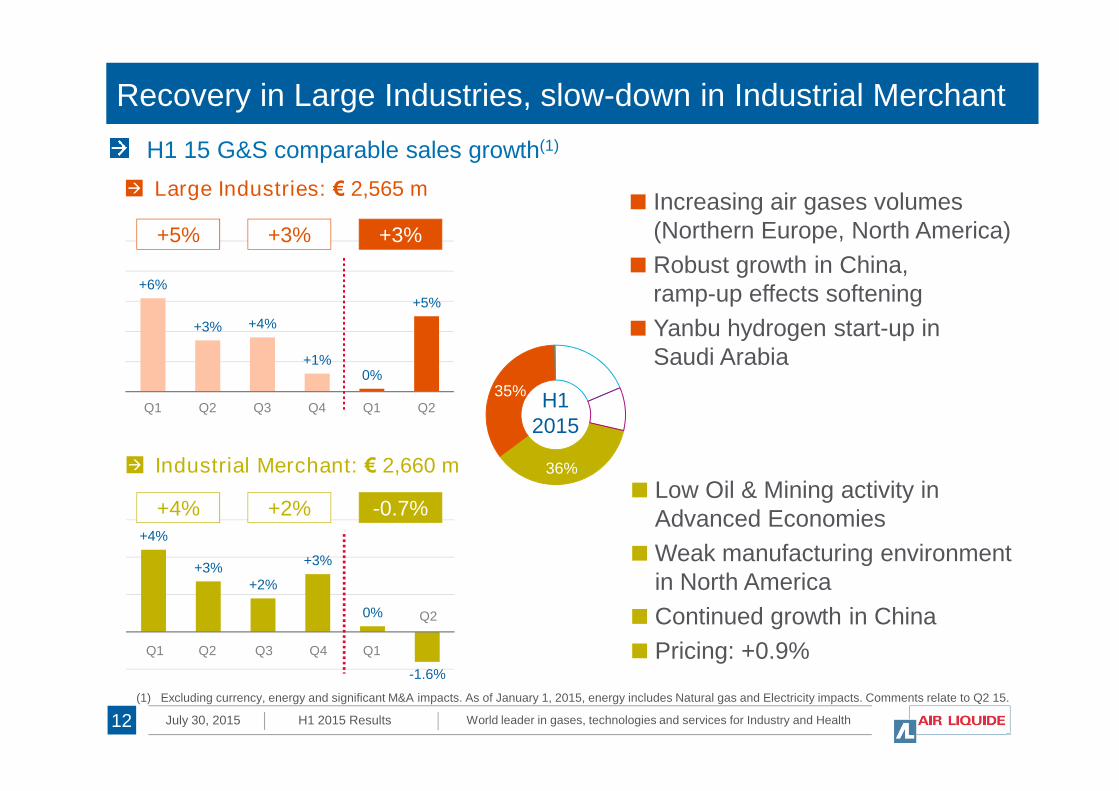
Recovery in Large Industries, slow-down in Industrial Merchant
H135%
Large Industries: € 2,565 m Increasing air gases volumes
(Northern Europe, North America)
Robust growth in China,ramp-up effects softening
Yanbu hydrogen start-up inSaudi Arabia
+3%+3%+5%
World leader in gases, technologies and services for Industry and HealthJuly 30, 2015 H1 2015 Results
Q1 Q2 Q3 Q4 Q1 Q2
12
H12015
35%
36%
+4%
+3%+2%
+3%
0%
-1.6%
Industrial Merchant: € 2,660 m
Low Oil & Mining activity inAdvanced Economies
Weak manufacturing environmentin North America
Continued growth in China
Pricing: +0.9%
-0.7%+2%+4%
Q2 Q3Q1 Q1Q4
Q2
(1) Excluding currency, energy and significant M&A impacts. As of January 1, 2015, energy includes Natural gas and Electricity impacts. Comments relate to Q2 15.
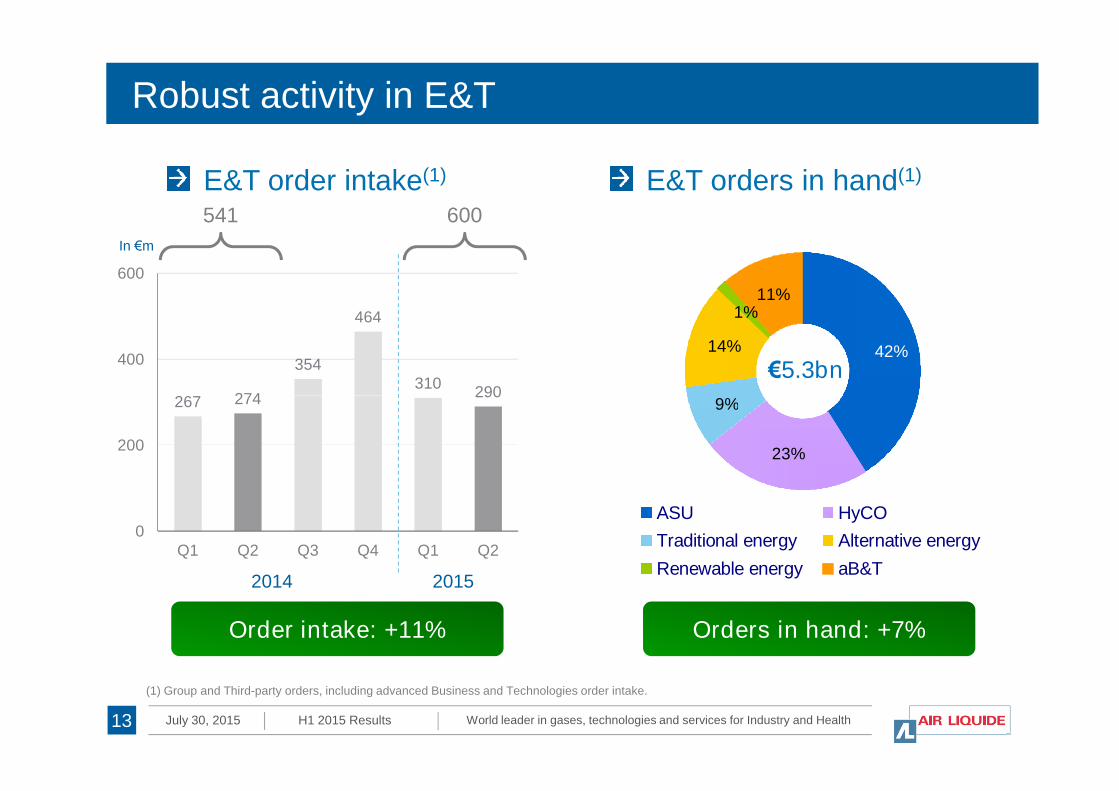
E&T order intake(1) E&T orders in hand(1)
541
In €m
267 274
354
464
310290
400
600
Robust activity in E&T
600
9%
14%
1%11%
42%
€5.3bn
World leader in gases, technologies and services for Industry and HealthJuly 30, 2015 H1 2015 Results
(1) Group and Third-party orders, including advanced Business and Technologies order intake.
Order intake: +11%
267 274 290
0
200
Q1 Q2 Q3 Q4 Q1 Q2
2014 2015
13
23%
9%
ASU HyCO
Traditional energy Alternative energy
Renewable energy aB&T
Orders in hand: +7%
Fabienne Lecorvaisier l Chief Financial Officer
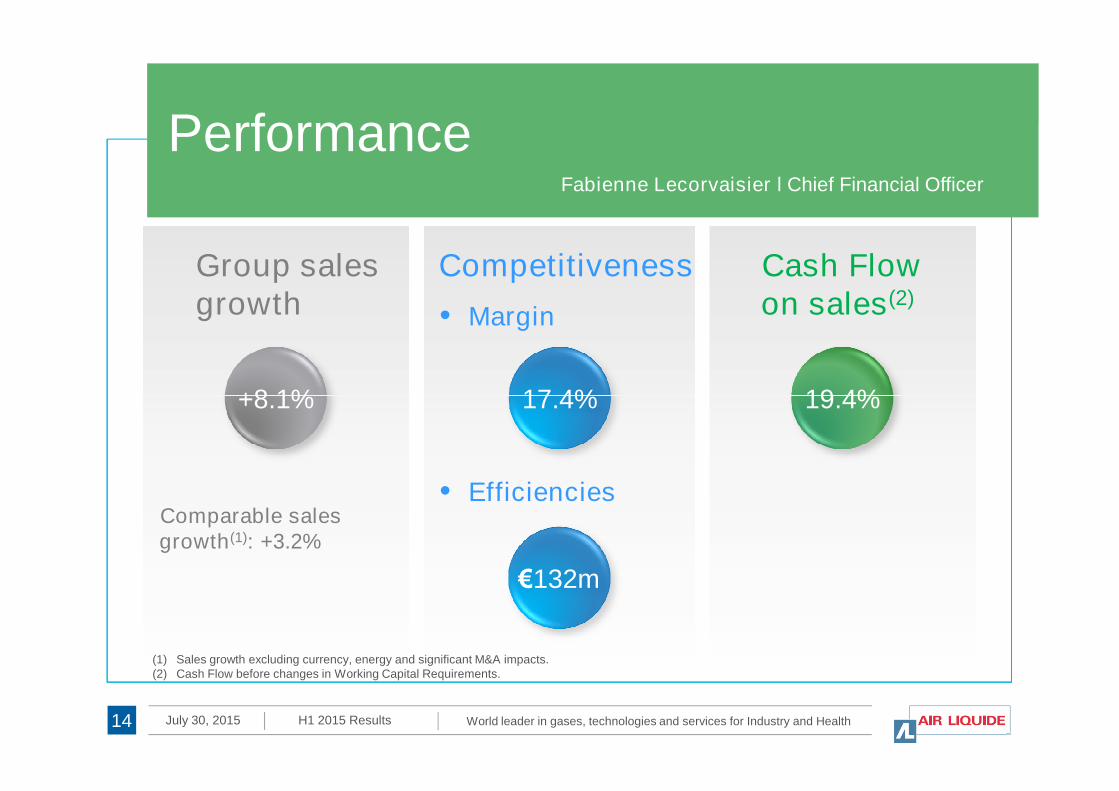
Performance
• Margin
+8.1% 17.4% 19.4%
Group salesgrowth
Competitiveness Cash Flowon sales(2)
World leader in gases, technologies and services for Industry and HealthJuly 30, 2015 H1 2015 Results14
(1) Sales growth excluding currency, energy and significant M&A impacts.(2) Cash Flow before changes in Working Capital Requirements.
Comparable salesgrowth(1): +3.2%
+8.1%
€132m
17.4%
• Efficiencies
19.4%
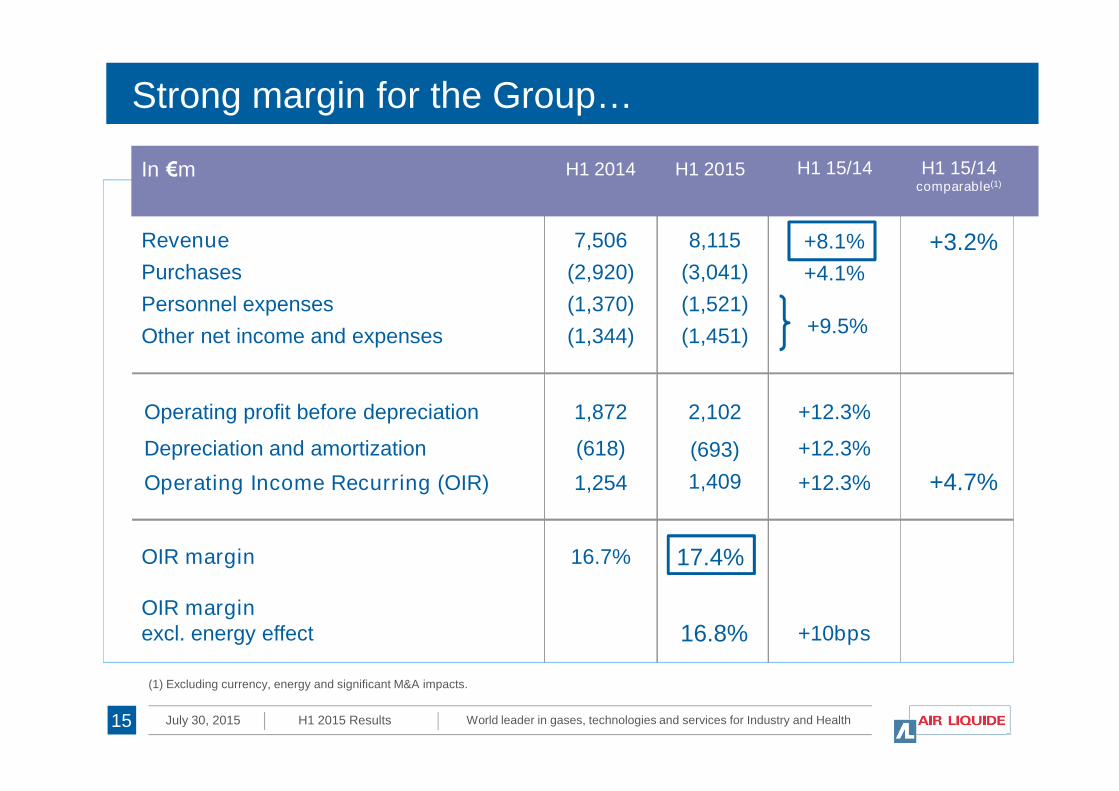
Strong margin for the Group…
In €m H1 2014 H1 2015 H1 15/14
Revenue
Purchases
Personnel expenses
Other net income and expenses
7,506
(2,920)
(1,370)
(1,344)
8,115
(3,041)
(1,521)
(1,451)
+8.1%
+4.1%
+9.5%
H1 15/14comparable(1)
+3.2%
World leader in gases, technologies and services for Industry and HealthJuly 30, 2015 H1 2015 Results15
Operating profit before depreciation 1,872 2,102 +12.3%
Depreciation and amortization
Operating Income Recurring (OIR)
(618)
1,254
(693)
1,409
+12.3%
+12.3%
OIR margin
OIR marginexcl. energy effect
16.7% 17.4%
16.8%
(1) Excluding currency, energy and significant M&A impacts.
+10bps
+4.7%
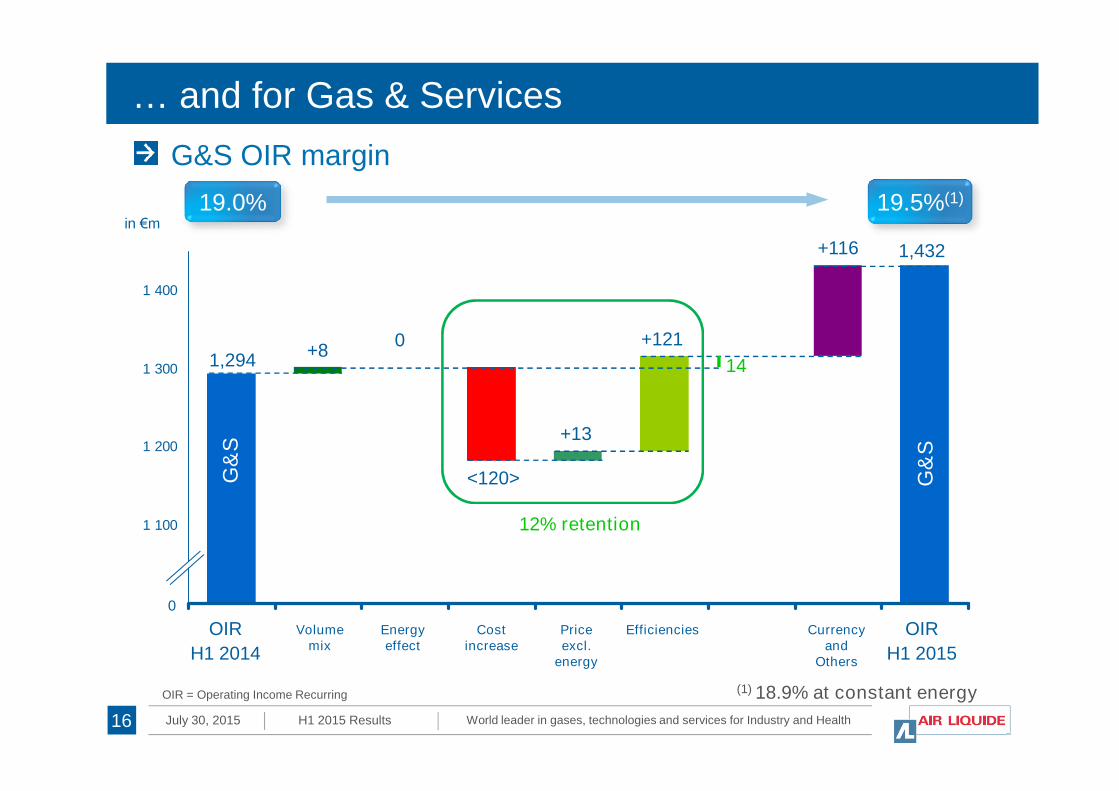
… and for Gas & Services
1 300
1 400
in €m
1,432
+121+8
1,2940
+116
19.5%(1)19.0%
G&S OIR margin
14
World leader in gases, technologies and services for Industry and HealthJuly 30, 2015 H1 2015 Results16
1 000
1 100
1 200
OIR = Operating Income Recurring (1) 18.9% at constant energy
0
OIR
H1 2015
<120>G&
S
G&
S
OIR
H1 2014
Volumemix
Energyeffect
Costincrease
Priceexcl.
energy
+13
Efficiencies Currencyand
Others
12% retention
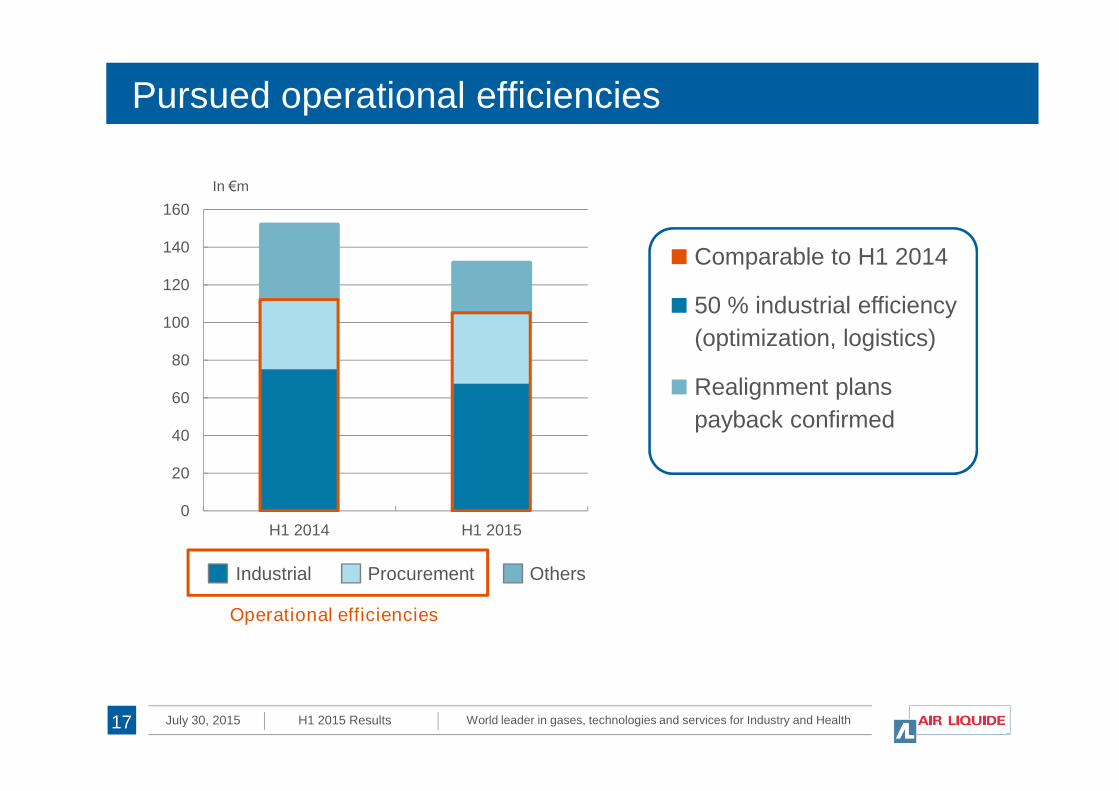
Pursued operational efficiencies
In €m
Comparable to H1 2014
50 % industrial efficiency
(optimization, logistics)
Realignment plans60
80
100
120
140
160
World leader in gases, technologies and services for Industry and HealthJuly 30, 2015 H1 2015 Results17
Realignment plans
payback confirmed
0
20
40
60
H1 2014 H1 2015
Industrial Procurement Others
Operational efficiencies
In €m 2012 2013
Positive leverage
Revenue
Operating Income Recurring
Other non-recurring operating income & expenses
7,506
1,254
(6)
8,115
1,409
(7)
+8.1%
+12.3%
Operating Income 1,248 1,402 +12.3%
Net financial costs
In €m H1 2014 H1 2015 H1 15/14 H1 15/14Comparable(1)
+3.2%
+4.7%
World leader in gases, technologies and services for Industry and HealthJuly 30, 2015 H1 2015 Results18
Net financial costsand other net financial expenses
Income taxes
Net profit (Group share)
Earnings per share (in €) 2.20 2.48
Tax rate 29.3% 29.2%
Share of profit of associates
Minority interests
(146)
(323)
4
(28)
755 849 +12.5%
(157)
(363)
(39)
6
(1) Excluding currency, energy and significant M&A impacts.
+12.7%
In €m
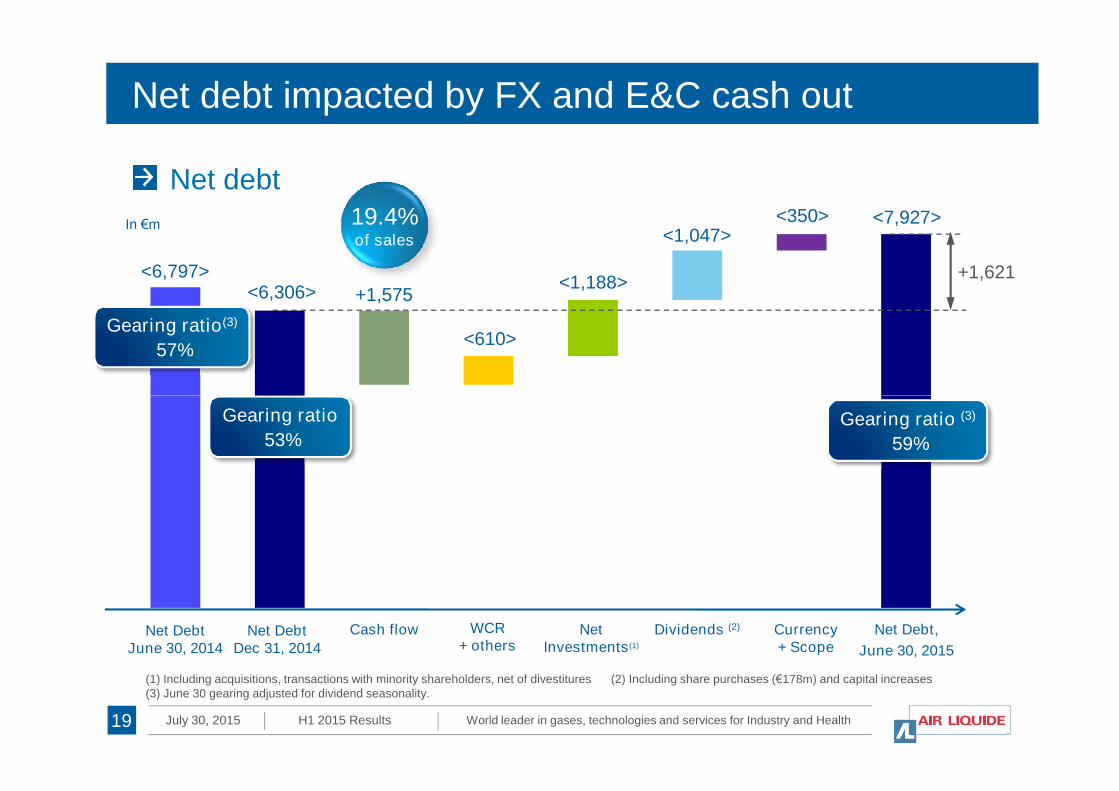
Net debt impacted by FX and E&C cash out
<6,306>
<7,927>
+1,575<1,188>
<1,047><350>
<610>
In €m
Net debt
+1,621<6,797>
Gearing ratio(3)
57%
19.4%of sales
World leader in gases, technologies and services for Industry and HealthJuly 30, 2015 H1 2015 Results19
Net Debt,
June 30, 2015
Cash flow NetInvestments(1)
Currency+ Scope
Net DebtDec 31, 2014
WCR+ others
(1) Including acquisitions, transactions with minority shareholders, net of divestitures (2) Including share purchases (€178m) and capital increases(3) June 30 gearing adjusted for dividend seasonality.
Dividends (2)
Gearing ratio
53%Gearing ratio (3)
59%
Net DebtJune 30, 2014
Major new projects and pursuedacquisitionsParis, July 30, 2015 Benoît Potier l Chief Executive Officer
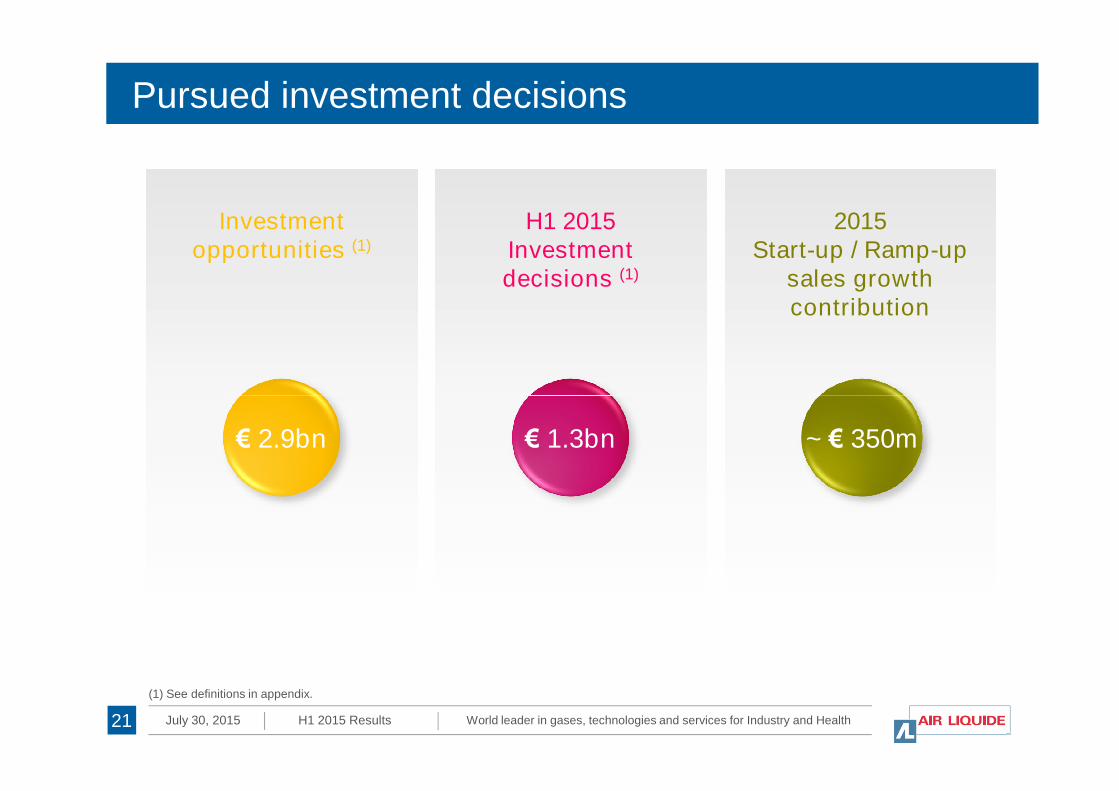
Pursued investment decisions
Investmentopportunities (1)
H1 2015Investmentdecisions (1)
2015Start-up / Ramp-up
sales growthcontribution
World leader in gases, technologies and services for Industry and HealthJuly 30, 2015 H1 2015 Results21
€ 2.9bn € 1.3bn
(1) See definitions in appendix.
~ € 350m
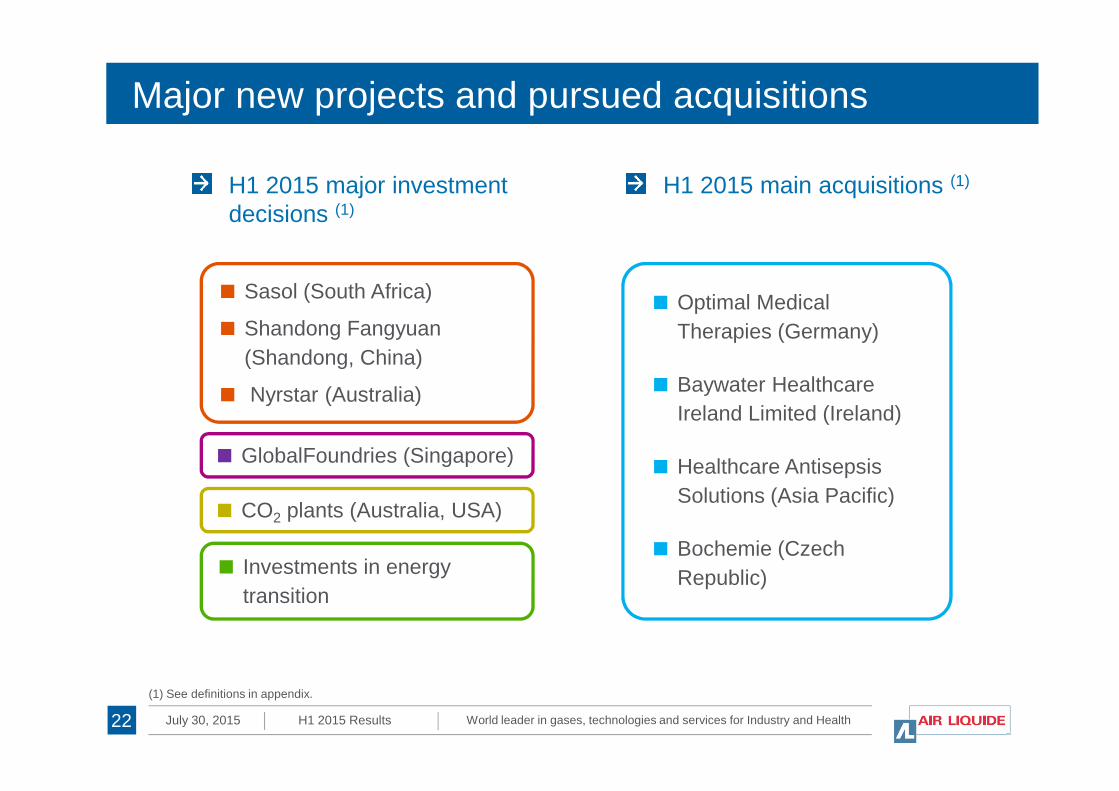
Major new projects and pursued acquisitions
Optimal Medical
Therapies (Germany)
Baywater Healthcare
Sasol (South Africa)
Shandong Fangyuan
(Shandong, China)
Nyrstar (Australia)
H1 2015 major investmentdecisions (1)
H1 2015 main acquisitions (1)
World leader in gases, technologies and services for Industry and HealthJuly 30, 2015 H1 2015 Results22
(1) See definitions in appendix.
Baywater Healthcare
Ireland Limited (Ireland)
Healthcare Antisepsis
Solutions (Asia Pacific)
Bochemie (Czech
Republic)
Nyrstar (Australia)
GlobalFoundries (Singapore)
CO2 plants (Australia, USA)
Investments in energy
transition

Major state-of-the-art syngas plant start-ups in H1 2015
Dormagen (Germany) Yanbu (Saudi Arabia)
World leader in gases, technologies and services for Industry and HealthJuly 30, 2015 H1 2015 Results23
Carbon monoxide for Bayer
Achieved flexibility in line with
customer’s expectations
Hydrogen by-product
exported to pipeline network
Hydrogen for Yasref
Tested feedstock to date:
natural gas, butane and mixture
Ramp-up in line
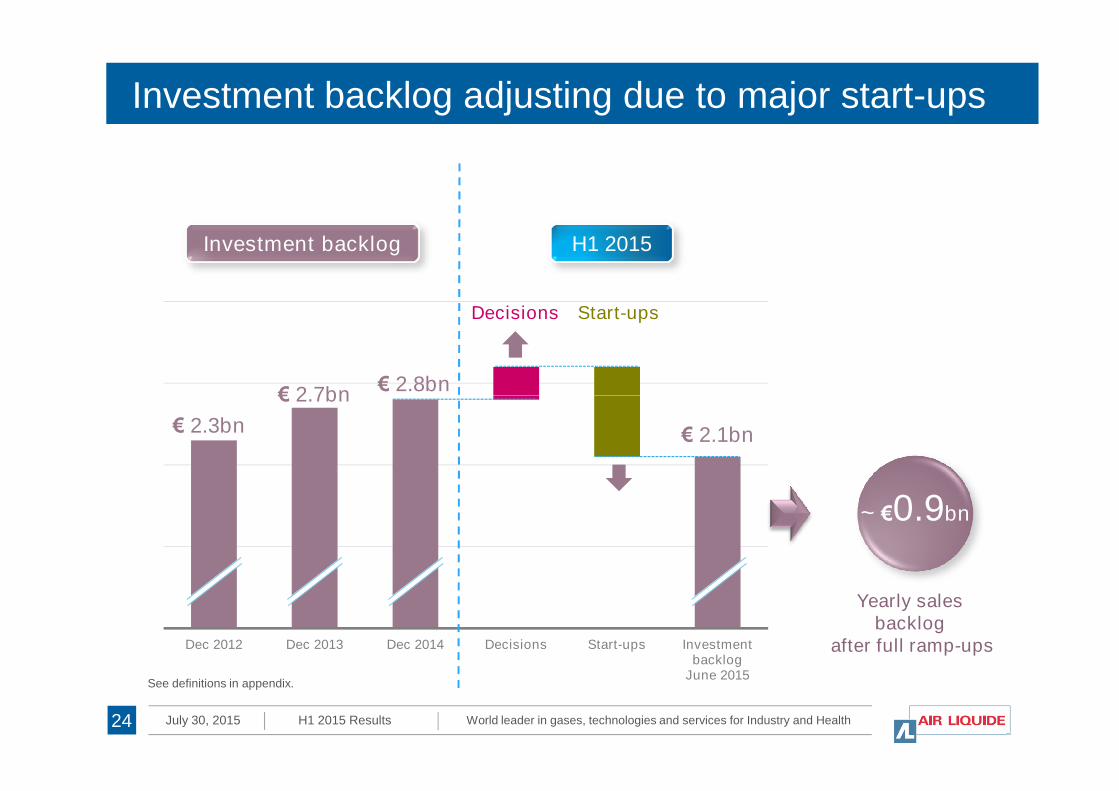
Investment backlog adjusting due to major start-ups
€ 2.8bn
Decisions Start-ups
Investment backlog H1 2015
€ 2.7bn
World leader in gases, technologies and services for Industry and HealthJuly 30, 2015 H1 2015 Results24
Dec 2012 Dec 2013 Dec 2014 Decisions Start-ups Investmentbacklog
June 2015
€ 2.8bn
€ 2.1bn
Yearly salesbacklog
after full ramp-ups
See definitions in appendix.
€ 2.7bn
€ 2.3bn
~ €0.9bn
H1 2015
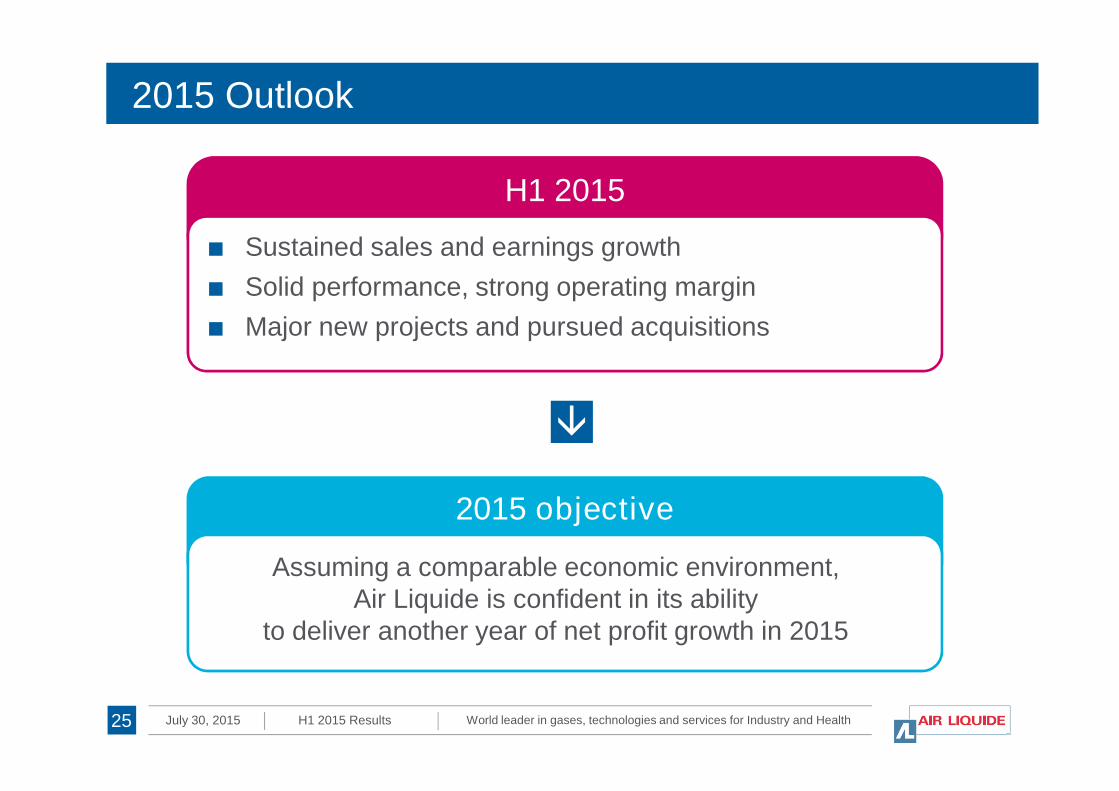
2015 Outlook
■ Sustained sales and earnings growth
■ Solid performance, strong operating margin
■ Major new projects and pursued acquisitions
World leader in gases, technologies and services for Industry and HealthJuly 30, 2015 H1 2015 Results
2015 objective
25
Assuming a comparable economic environment,Air Liquide is confident in its ability
to deliver another year of net profit growth in 2015
AppendixH1 2015
World leader in gases, technologies and services for Industry and HealthJuly 30, 2015 H1 2015 Results27
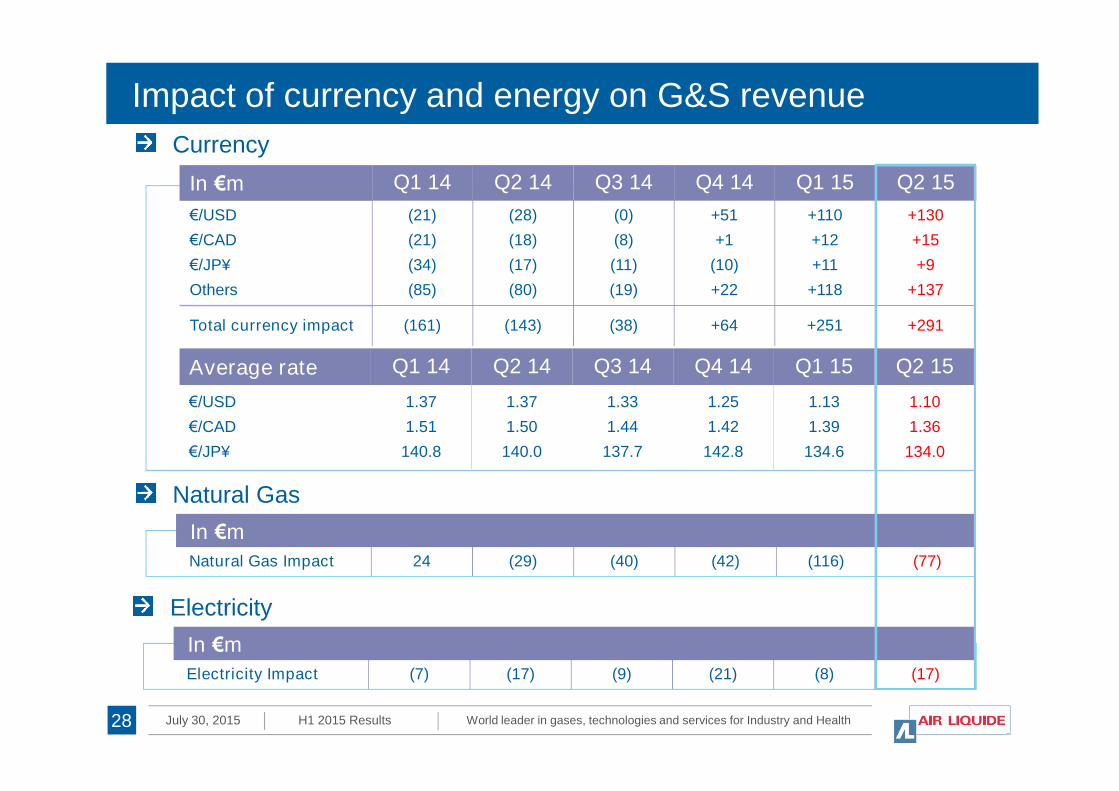
Impact of currency and energy on G&S revenue
In €m Q1 14 Q2 14 Q3 14 Q4 14 Q1 15 Q2 15
€/USD
€/CAD
€/JP¥
Others
(21)
(21)
(34)
(85)
(28)
(18)
(17)
(80)
(0)
(8)
(11)
(19)
+51
+1
(10)
+22
+110
+12
+11
+118
+130
+15
+9
+137
Total currency impact (161) (143) (38) +64 +251 +291
Average rate Q1 14 Q2 14 Q3 14 Q4 14 Q1 15 Q2 15
€/USD 1.37 1.37 1.33 1.25 1.13 1.10
Currency
World leader in gases, technologies and services for Industry and HealthJuly 30, 2015 H1 2015 Results28
Natural Gas Impact 24 (29) (40) (42) (116) (77)
In €m
€/USD
€/CAD
€/JP¥
1.37
1.51
140.8
1.37
1.50
140.0
1.33
1.44
137.7
1.25
1.42
142.8
1.13
1.39
134.6
1.10
1.36
134.0
Natural Gas
Electricity Impact (7) (17) (9) (21) (8) (17)
In €m
Electricity
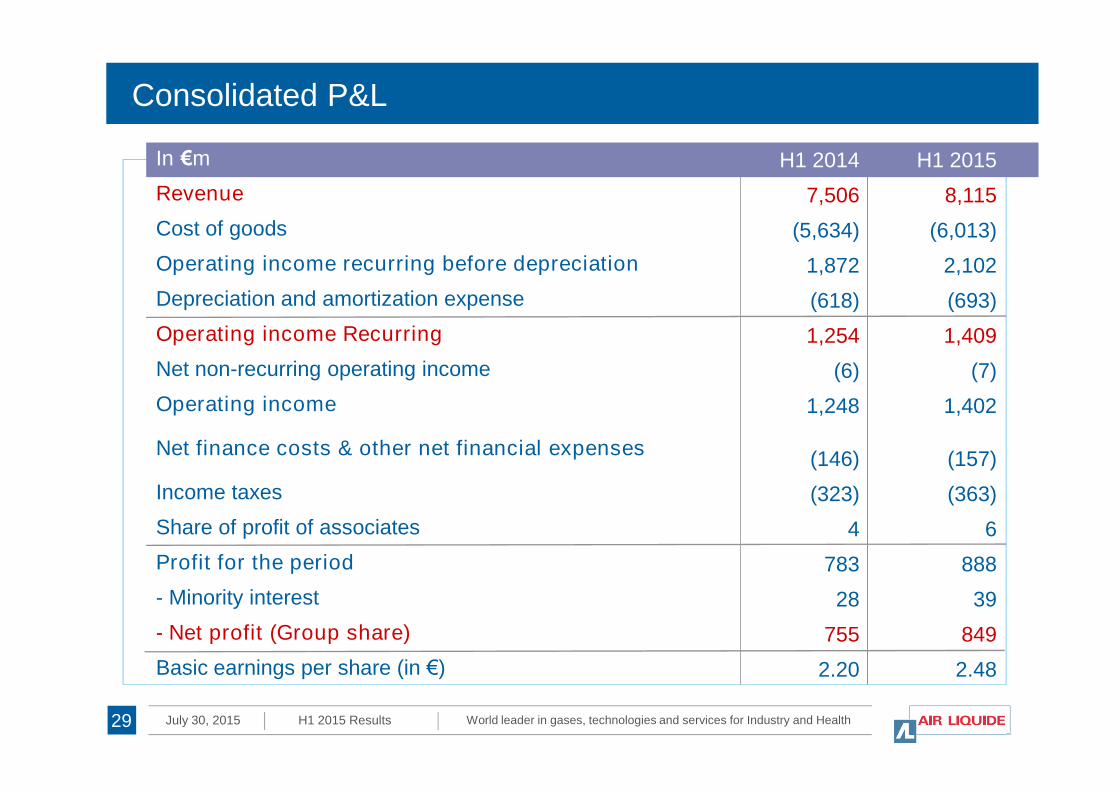
Consolidated P&L
In €m H1 2014 H1 2015
Revenue 7,506 8,115
Cost of goods (5,634) (6,013)
Operating income recurring before depreciation 1,872 2,102
Depreciation and amortization expense (618) (693)
Operating income Recurring 1,254 1,409
Net non-recurring operating income (6) (7)
Operating income 1,248 1,402
World leader in gases, technologies and services for Industry and HealthJuly 30, 2015 H1 2015 Results
Operating income 1,248 1,402
Net finance costs & other net financial expenses(146) (157)
Income taxes (323) (363)
Share of profit of associates 4 6
Profit for the period 783 888
- Minority interest 28 39
- Net profit (Group share) 755 849
Basic earnings per share (in €) 2.20 2.48
29
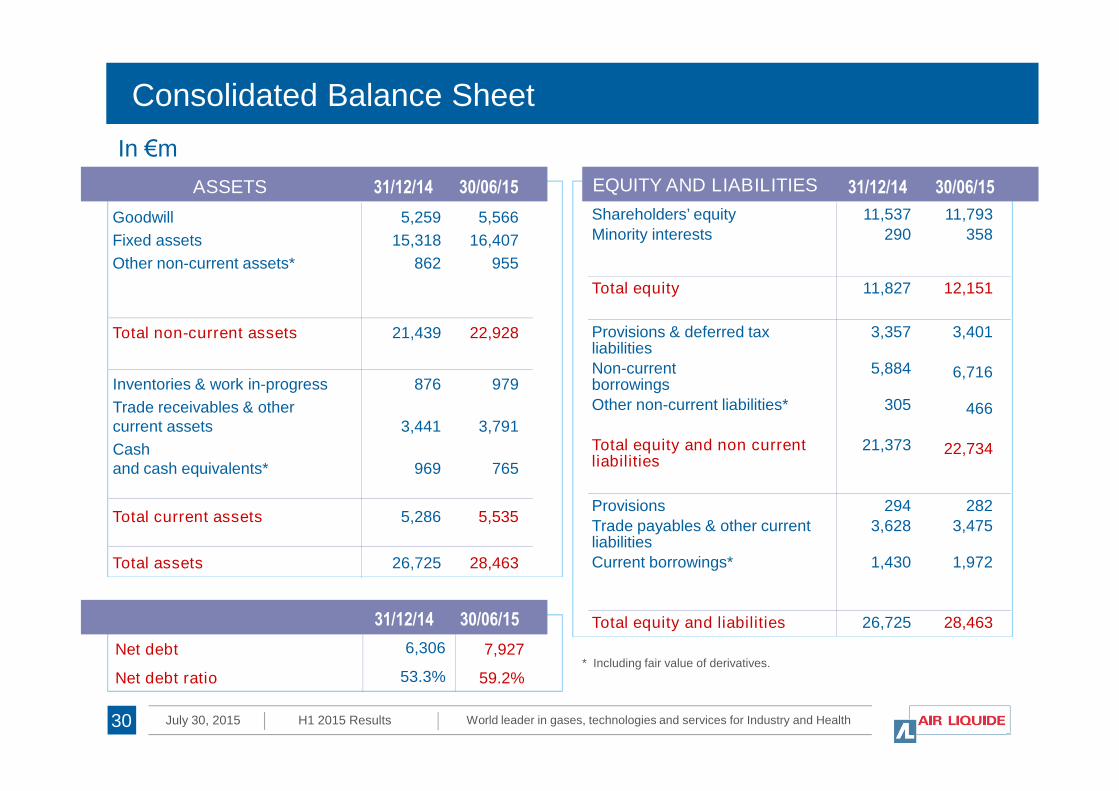
Consolidated Balance Sheet
ASSETS 31/12/14 30/06/15
Goodwill
Fixed assets
Other non-current assets*
5,259
15,318
862
5,566
16,407
955
Total non-current assets 21,439 22,928
Inventories & work in-progress 876 979
EQUITY AND LIABILITIES 31/12/14 30/06/15
Shareholders’ equity
Minority interests
11,537
290
11,793
358
Total equity 11,827 12,151
Provisions & deferred taxliabilities
Non-currentborrowings
3,357
5,884
3,401
6,716
In €m
World leader in gases, technologies and services for Industry and HealthJuly 30, 2015 H1 2015 Results
Trade receivables & othercurrent assets
Cashand cash equivalents*
3,441
969
3,791
765
Total current assets 5,286 5,535
Total assets 26,725 28,463
Other non-current liabilities*
Total equity and non currentliabilities
305
21,373
466
22,734
Provisions
Trade payables & other currentliabilities
Current borrowings*
294
3,628
1,430
282
3,475
1,972
Total equity and liabilities 26,725 28,46331/12/14 30/06/15
Net debt 6,306 7,927
Net debt ratio 53.3% 59.2%
30
* Including fair value of derivatives.
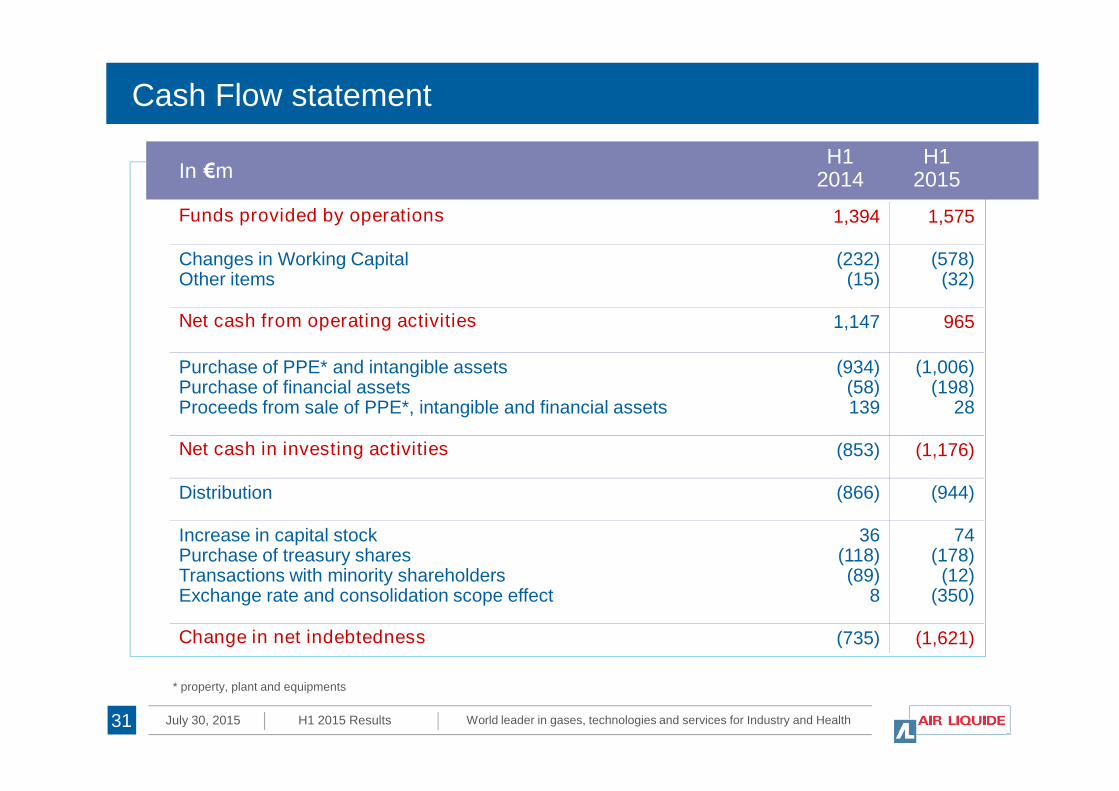
Cash Flow statement
In €mH1
2014H1
2015
Funds provided by operations 1,394 1,575
Changes in Working CapitalOther items
(232)(15)
(578)(32)
Net cash from operating activities 1,147 965
Purchase of PPE* and intangible assetsPurchase of financial assets
(934)(58)
(1,006)(198)
World leader in gases, technologies and services for Industry and HealthJuly 30, 2015 H1 2015 Results
Purchase of financial assetsProceeds from sale of PPE*, intangible and financial assets
(58)139
(198)28
Net cash in investing activities (853) (1,176)
Distribution (866) (944)
Increase in capital stockPurchase of treasury sharesTransactions with minority shareholdersExchange rate and consolidation scope effect
36(118)(89)
8
74(178)(12)
(350)
Change in net indebtedness (735) (1,621)
* property, plant and equipments
31
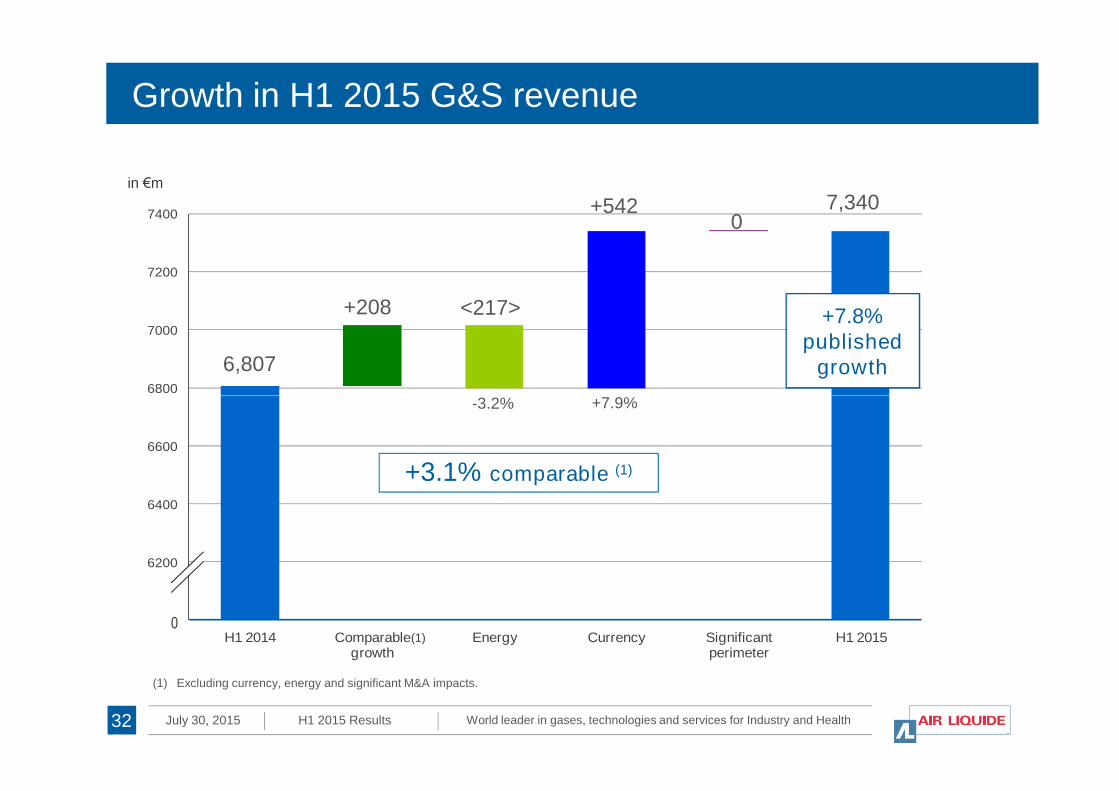
Growth in H1 2015 G&S revenue
6800
7000
7200
7400
in €m
<217>
0
+7.8%published
growth6,807
+208
7,340+542
-3.2% +7.9%
World leader in gases, technologies and services for Industry and HealthJuly 30, 2015 H1 2015 Results
6000
6200
6400
6600
6800
H1 2014 Comparablegrowth
Energy Currency Significantperimeter
H1 20150
32
+3.1% comparable (1)
(1) Excluding currency, energy and significant M&A impacts.
-3.2% +7.9%
(1)
Revenue analysis by quarter and by geography
Sales in €m Q1 14 Q2 14 Q3 14 Q4 14 Q1 15 Q2 15 Q2 15/14Q2 15/14comparable(
1)
Europe 1,701 1,645 1,601 1,693 1,696 1,694 +3.0% +3.3%
Americas 814 833 864 905 895 918 +10.2% +0.4%
Asia-Pacific 816 821 890 917 946 968 +17.9% +5.0%
Middle-East
World leader in gases, technologies and services for Industry and HealthJuly 30, 2015 H1 2015 Results33
Middle-East& Africa
85 92 91 99 95 128 +39.1% +23.7%
Gas & Services 3,416 3,391 3,446 3,614 3,632 3,708 +9.3% +3.5%
Engineering& Technology
175 230 213 294 217 259 +12.8% +6.0%
Other Activities 143 151 142 143 144 154 +2.2% -3.0%
Group Total 3,734 3,772 3,801 4,051 3,993 4,121 +9.3% +3.4%
(1) Excluding currency, energy and significant M&A impacts. As of January 1, 2015, energy includes Natural gas and Electricity impacts.
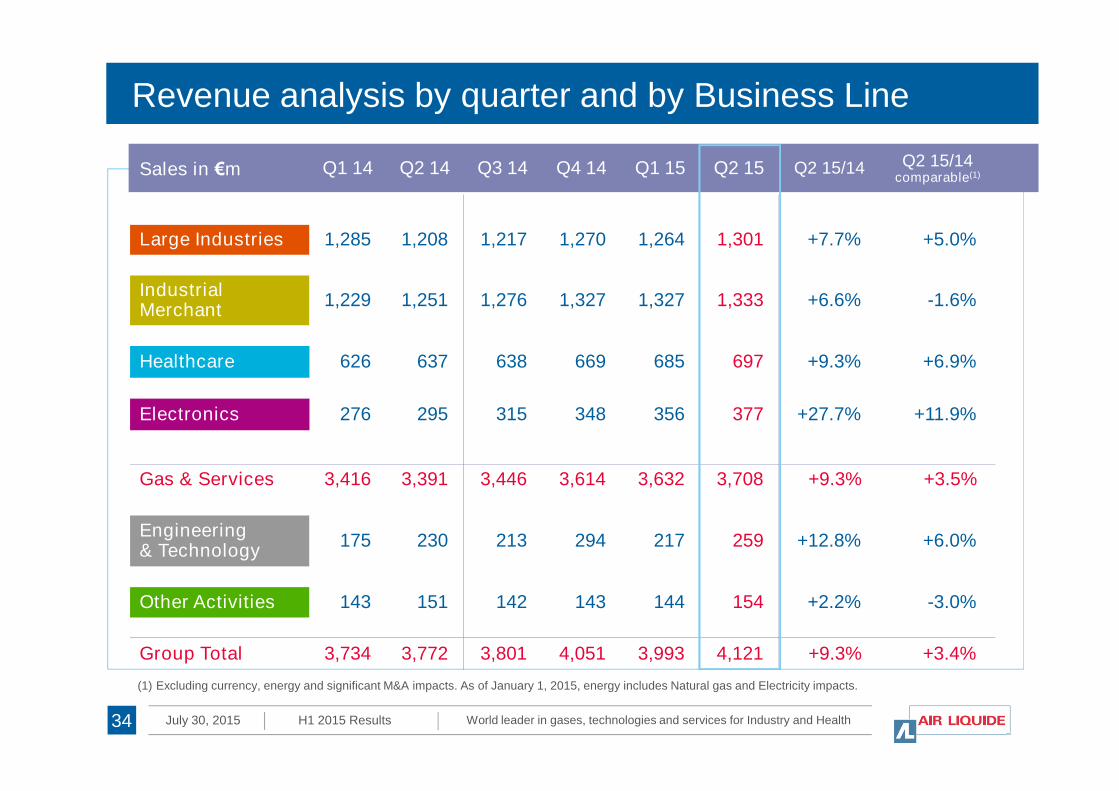
Revenue analysis by quarter and by Business Line
Sales in €m Q1 14 Q2 14 Q3 14 Q4 14 Q1 15 Q2 15 Q2 15/14 Q2 15/14comparable(1)
Large Industries 1,285 1,208 1,217 1,270 1,264 1,301 +7.7% +5.0%
IndustrialMerchant
1,229 1,251 1,276 1,327 1,327 1,333 +6.6% -1.6%
Healthcare 626 637 638 669 685 697 +9.3% +6.9%
World leader in gases, technologies and services for Industry and HealthJuly 30, 2015 H1 2015 Results34
Electronics 276 295 315 348 356 377 +27.7% +11.9%
Gas & Services 3,416 3,391 3,446 3,614 3,632 3,708 +9.3% +3.5%
Engineering& Technology
175 230 213 294 217 259 +12.8% +6.0%
Other Activities 143 151 142 143 144 154 +2.2% -3.0%
Group Total 3,734 3,772 3,801 4,051 3,993 4,121 +9.3% +3.4%
(1) Excluding currency, energy and significant M&A impacts. As of January 1, 2015, energy includes Natural gas and Electricity impacts.

G&S Revenue growth by quarter and by impact
Growth aspublished
NaturalGas
Electricity Currency Significantperimeter
Comparablegrowth(1)
Q3 2013 - 1.3% - 0.6% - 5.8% + 1.2% + 3.9%
Q4 2013 - 2.1 % - 1.0% - 5.2% - 0.4% + 4.4%
Q1 2014 + 0.3% + 0.7% - 4.7% - 1.4% + 5.7%
World leader in gases, technologies and services for Industry and HealthJuly 30, 2015 H1 2015 Results35
Q2 2014 - 2.5% - 0.8% - 4.1% - 1.3% + 3.7%
Q3 2014 + 0.1% - 1.2% - 1.1% - 1.3% + 3.6%
Q4 2014 + 3.0% - 1.2% + 1.8% - 0.9% + 3.3%
Q1 2015 + 6.3% - 3.4% - 0.2% + 7.3% 0,0% + 2.6%
Q2 2015 + 9.3% - 2.2% - 0.5% + 8.5% 0,0% + 3.5%
(1) Excluding currency, energy and significant M&A impacts. As of January 1, 2015, the energy impact includes electricity impact in addition to the natural gas effect.

H1 2015 Revenue breakdown by region
Americas: € 1.8 bn Asia: € 1.9 bnEurope: € 3.4 bn
Middle-East and Africa
AmericasEurope
Asia
Gas & ServicesH1 2015 Revenue: € 7,340 m
3%
26%
25%
46%
World leader in gases, technologies and services for Industry and HealthJuly 30, 2015 H1 2015 Results
24%
33%
4%
39%
Americas: € 1.8 bn Asia: € 1.9 bnEurope: € 3.4 bn
32%
34%31%
3%
36
35%
10%
45%
10%
Large Industries ElectronicsHealthcareIndustrial Merchant
31%
34%
32%
3%
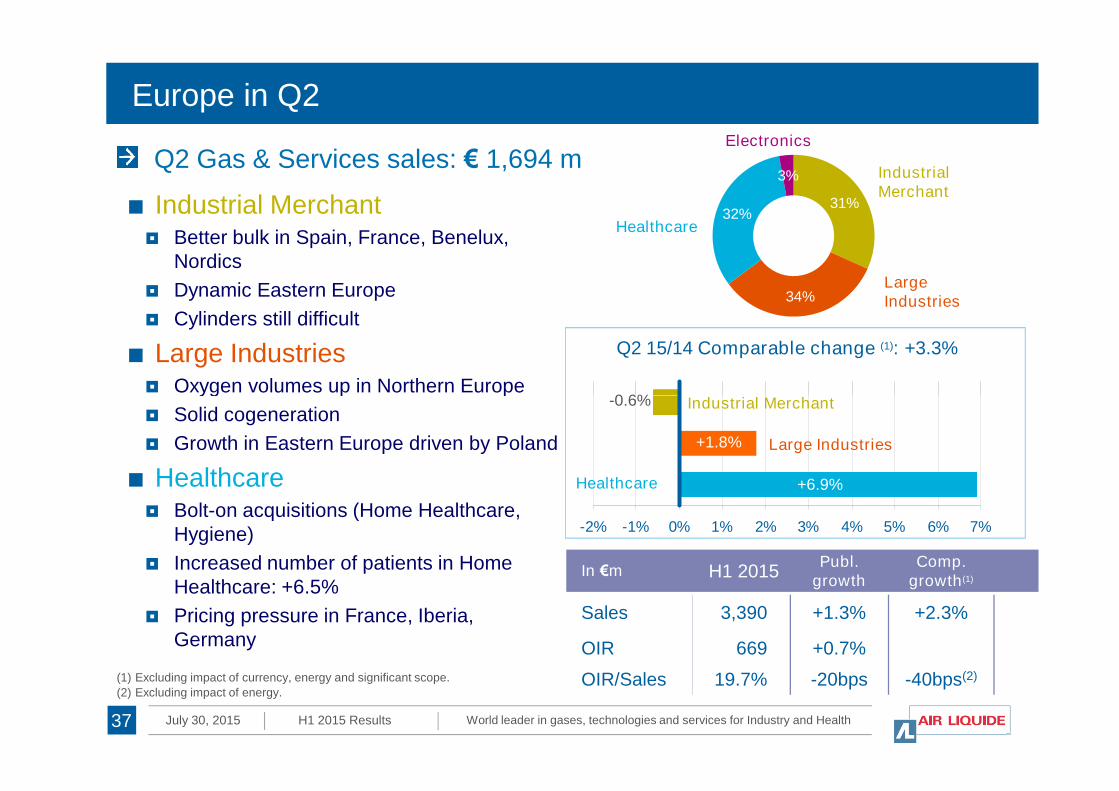
Europe in Q2
Q2 Gas & Services sales: € 1,694 m
Q2 15/14 Comparable change (1): +3.3%
■ Industrial Merchant Better bulk in Spain, France, Benelux,
Nordics
Dynamic Eastern Europe
Cylinders still difficult
■ Large Industries Oxygen volumes up in Northern Europe
IndustrialMerchant
Electronics
LargeIndustries
Healthcare
Industrial Merchant-0.6%
World leader in gases, technologies and services for Industry and HealthJuly 30, 2015 H1 2015 Results
-2% -1% 0% 1% 2% 3% 4% 5% 6% 7%
Oxygen volumes up in Northern Europe
Solid cogeneration
Growth in Eastern Europe driven by Poland
■ Healthcare Bolt-on acquisitions (Home Healthcare,
Hygiene)
Increased number of patients in HomeHealthcare: +6.5%
Pricing pressure in France, Iberia,Germany
In €m H1 2015Publ.
growthComp.
growth(1)
Sales 3,390 +1.3% +2.3%
OIR 669 +0.7%
OIR/Sales 19.7% -20bps -40bps(2)
Industrial Merchant
Large Industries
-0.6%
+1.8%
Healthcare +6.9%
37
(1) Excluding impact of currency, energy and significant scope.
(2) Excluding impact of energy.
45%
35%
10%
10%
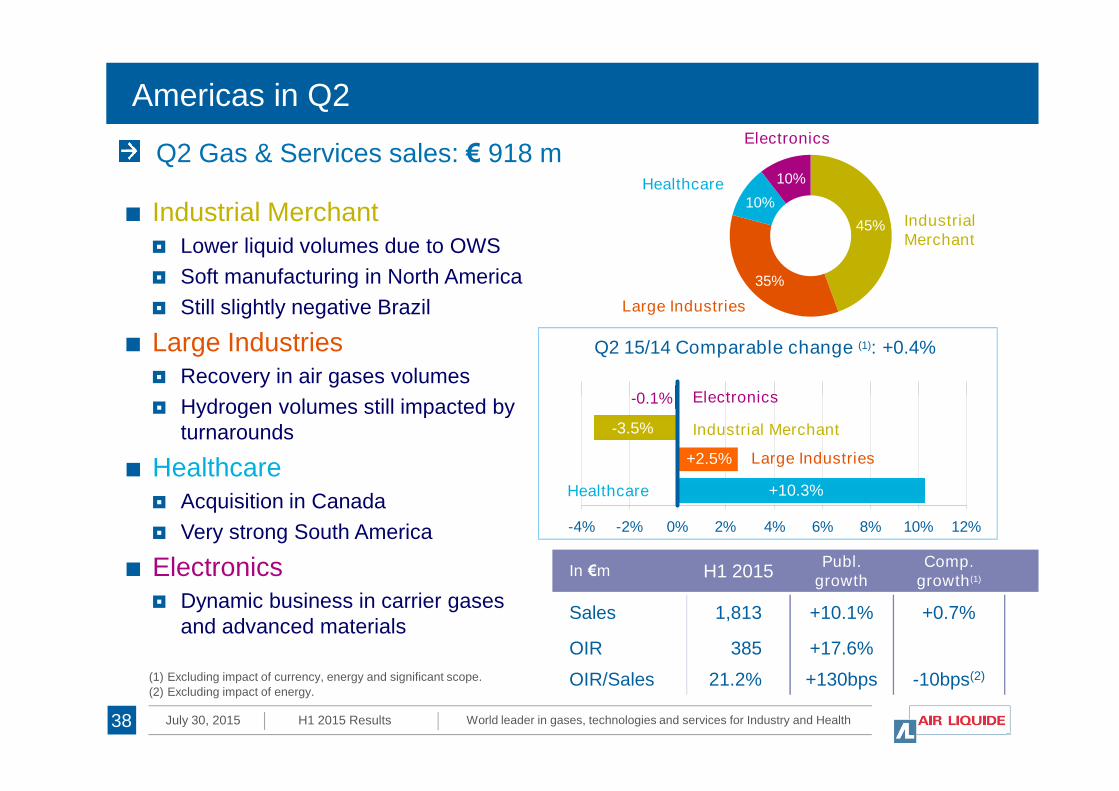
■ Industrial Merchant Lower liquid volumes due to OWS
Soft manufacturing in North America
Still slightly negative Brazil
■ Large Industries Recovery in air gases volumes
Hydrogen volumes still impacted by
Americas in Q2
Q2 Gas & Services sales: € 918 m
Q2 15/14 Comparable change (1): +0.4%
Electronics
Large Industries
Healthcare
Electronics
-0.1%
IndustrialMerchant
World leader in gases, technologies and services for Industry and HealthJuly 30, 2015 H1 2015 Results
-4% -2% 0% 2% 4% 6% 8% 10% 12%
Hydrogen volumes still impacted byturnarounds
■ Healthcare Acquisition in Canada
Very strong South America
■ Electronics Dynamic business in carrier gases
and advanced materials
Industrial Merchant
Large Industries+2.5%
Electronics
Healthcare
In €m H1 2015Publ.
growthComp.
growth(1)
Sales 1,813 +10.1% +0.7%
OIR 385 +17.6%
OIR/Sales 21.2% +130bps -10bps(2)
38
+10.3%
-3.5%
-0.1%
(1) Excluding impact of currency, energy and significant scope.
(2) Excluding impact of energy.
33%
39%
4%
24%
Asia-Pacific in Q2
Industrial Merchant-0.7%
Q2 Gas & Services sales: € 968 m
Q2 15/14 Comparable change (1): +5.0%
■ Industrial Merchant Volumes growth in China and South-
East Asia
Pressure on pricing
Mining and oil industry impacted(Australia, Singapore)
■ Large Industries
IndustrialMerchant
Large Industries
Healthcare
Electronics
World leader in gases, technologies and services for Industry and HealthJuly 30, 2015 H1 2015 Results
-2% 2% 6% 10% 14%
Industrial Merchant
Large Industries
Electronics
-0.7%
+5.8%
+13.3%
■ Continued, though softening,
ramp-ups in China
Oxygen and Hydrogen volumesgrowth
■ Electronics Strong growth in China, Taiwan,
Japan and Singapore
Advanced materials: +60%
Strong E&I activity
In €m H1 2015Publ.
growthComp.
growth(1)
Sales 1,914 +16.9% +6.0%
OIR 335 +21.7%
OIR/Sales 17.5% +70bps +0bps(2)
39
(1) Excluding impact of currency, energy and significant scope.
(2) Excluding impact of energy.
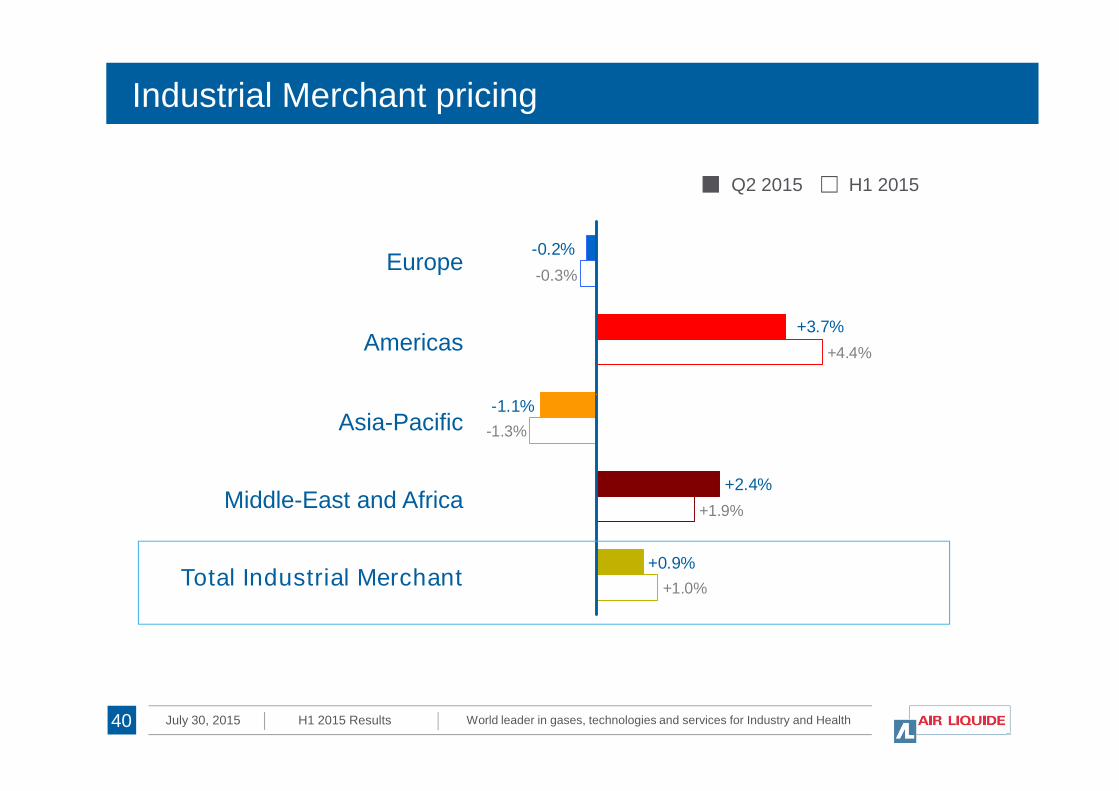
Industrial Merchant pricing
+4.4%
-0.2%
+3.7%
Europe
Americas
Q2 2015 H1 2015
-0.3%
World leader in gases, technologies and services for Industry and HealthJuly 30, 2015 H1 2015 Results
+1.0%
+1.9%
-1.3%
-1.1%
+2.4%
+0.9%
Asia-Pacific
Middle-East and Africa
Total Industrial Merchant
40
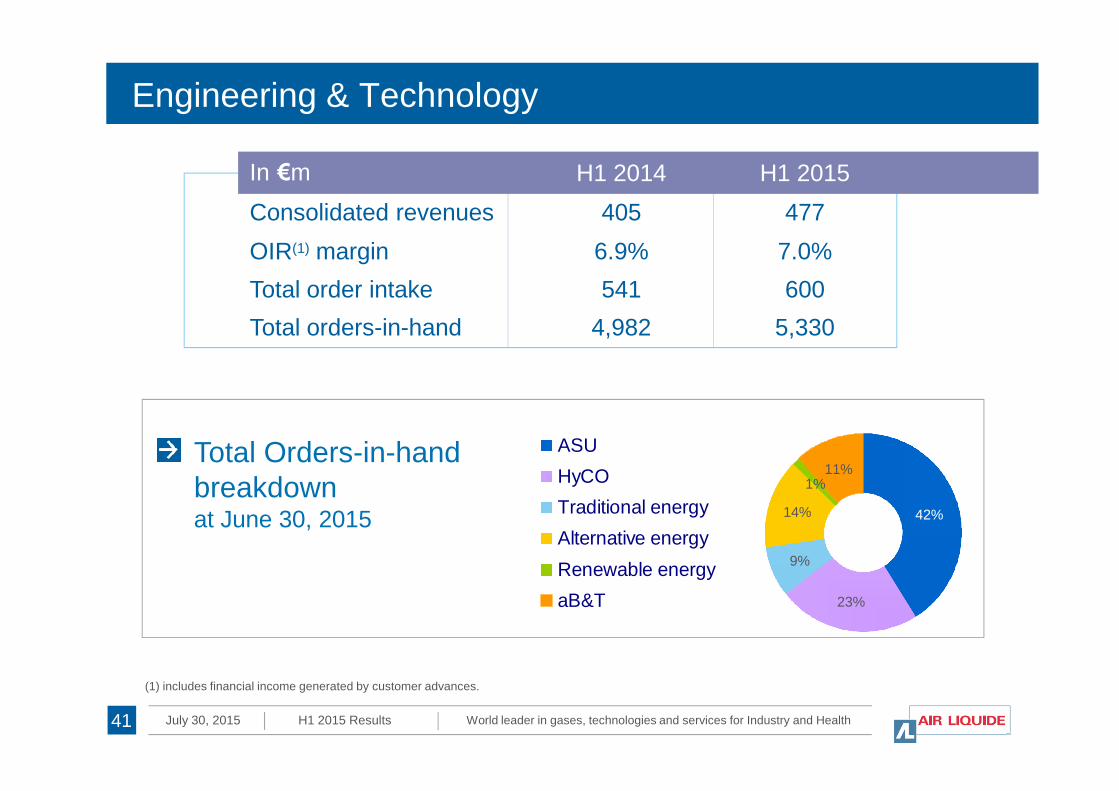
Engineering & Technology
In €m H1 2014 H1 2015
Consolidated revenues 405 477
OIR(1) margin 6.9% 7.0%
Total order intake 541 600
Total orders-in-hand 4,982 5,330
World leader in gases, technologies and services for Industry and HealthJuly 30, 2015 H1 2015 Results
23%
9%
14%
1%11%
42%
ASU
HyCO
Traditional energy
Alternative energy
Renewable energy
aB&T
Total Orders-in-handbreakdownat June 30, 2015
(1) includes financial income generated by customer advances.
41

Operating margin – energy effect
Group, in €m H1 2014 H1 2015
Revenue 7,506 8,115
Incl. energy (217)
Operating income recurring 1,254 1,409
Operating margin 16.7% 17.4%
Operating margin excluding energy 16.8%
World leader in gases, technologies and services for Industry and HealthJuly 30, 2015 H1 2015 Results
Gas and services, in €m H1 2014 H1 2015
Revenue 6,807 7,340
Incl. energy effect (217)
Operating income recurring 1,294 1,432
Operating margin 19.0% 19.5%
Operating margin excluding energy 18.9%
42
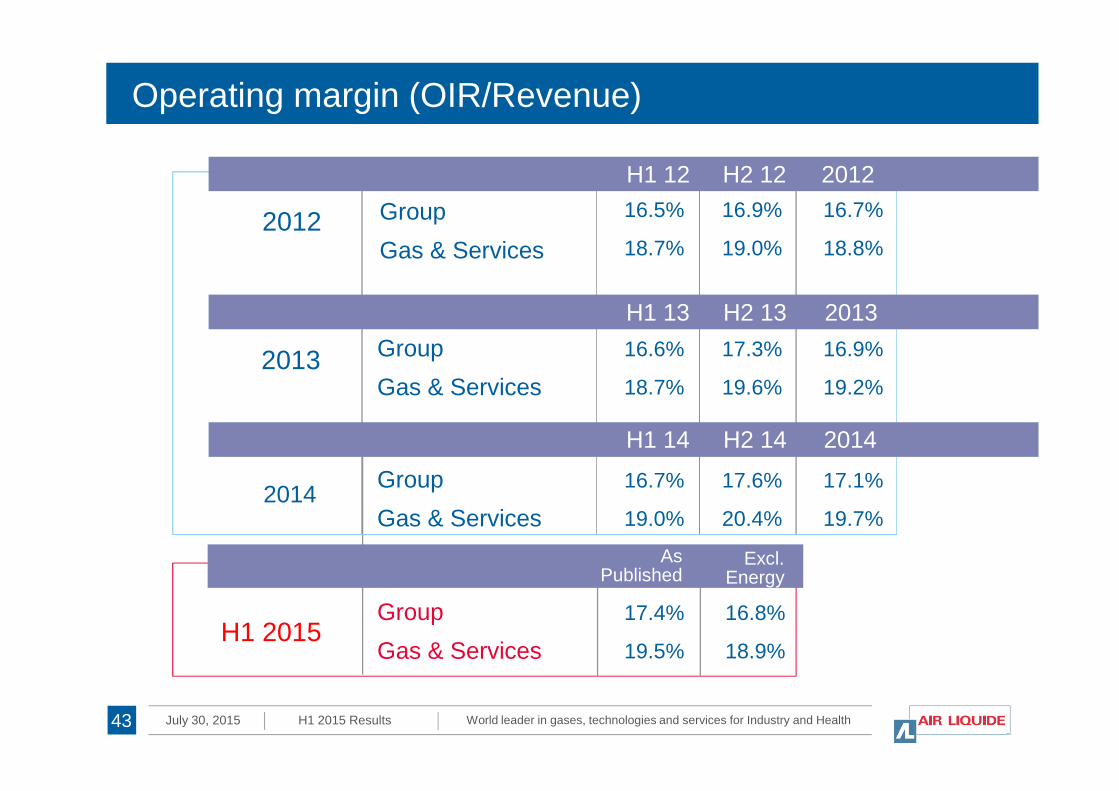
Operating margin (OIR/Revenue)
Group
Gas & Services2012
H1 12 H2 12 2012
16.5%
18.7%
16.7%
18.8%
16.9%
19.0%
Group
Gas & Services
16.6%
18.7%
H1 13 H2 13 2013
17.3%
19.6%
16.9%
19.2%2013
World leader in gases, technologies and services for Industry and HealthJuly 30, 2015 H1 2015 Results
Group
Gas & Services
16.7%
19.0%
H1 14 H2 14 2014
17.6%
20.4%
17.1%
19.7%2014
43
Gas & Services 18.7% 19.6% 19.2%
Group
Gas & Services
17.4%
19.5%
Excl.Energy
16.8%
18.9%H1 2015
AsPublished
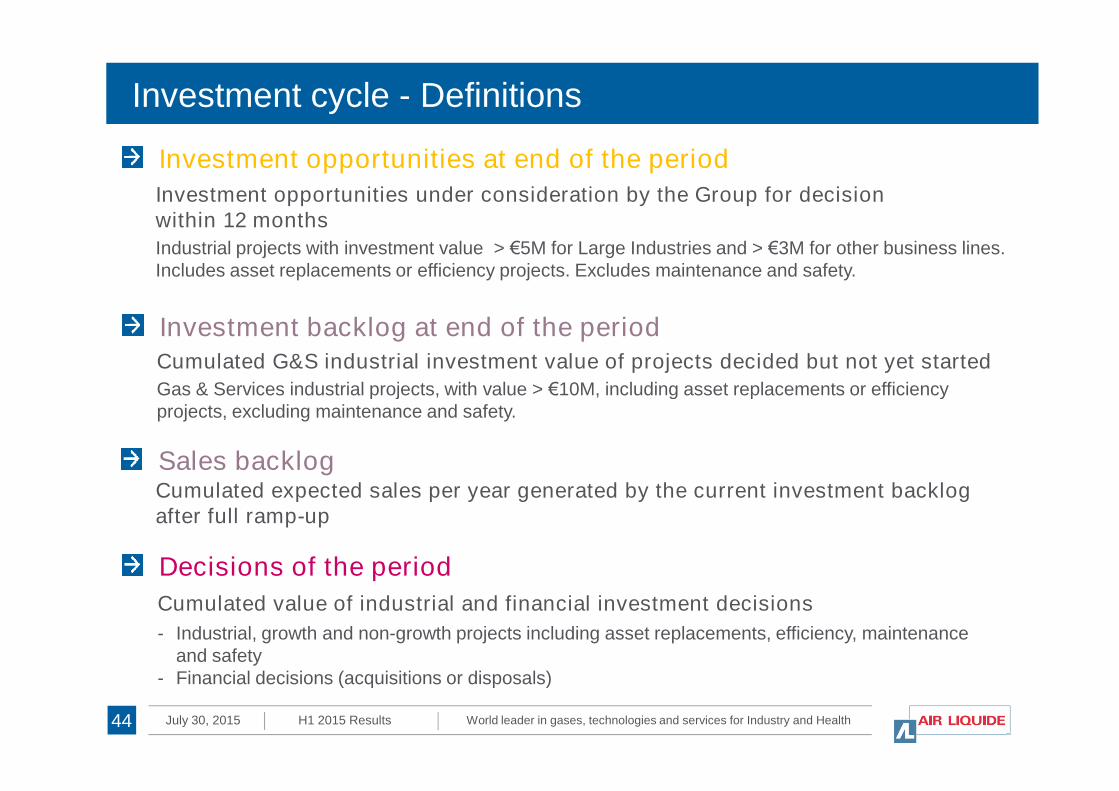
Investment cycle - Definitions
Investment backlog at end of the periodCumulated G&S industrial investment value of projects decided but not yet started
Gas & Services industrial projects, with value > €10M, including asset replacements or efficiency
Investment opportunities at end of the period
Investment opportunities under consideration by the Group for decisionwithin 12 months
Industrial projects with investment value > €5M for Large Industries and > €3M for other business lines.Includes asset replacements or efficiency projects. Excludes maintenance and safety.
World leader in gases, technologies and services for Industry and HealthJuly 30, 2015 H1 2015 Results44
Decisions of the period
Cumulated value of industrial and financial investment decisions
Gas & Services industrial projects, with value > €10M, including asset replacements or efficiencyprojects, excluding maintenance and safety.
- Industrial, growth and non-growth projects including asset replacements, efficiency, maintenanceand safety
- Financial decisions (acquisitions or disposals)
Sales backlogCumulated expected sales per year generated by the current investment backlogafter full ramp-up
5%
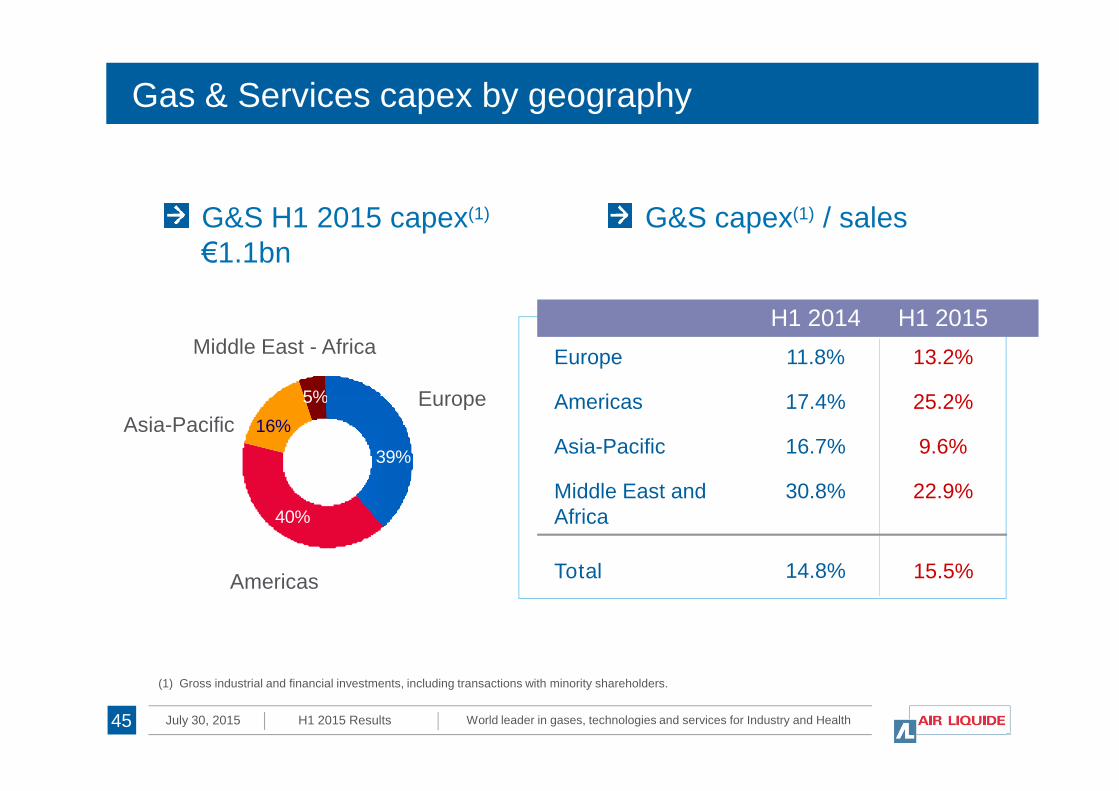
Gas & Services capex by geography
H1 2014 H1 2015
Europe
Americas
11.8%
17.4%
13.2%
25.2%Europe
Middle East - Africa
G&S capex(1) / salesG&S H1 2015 capex(1)
€1.1bn
World leader in gases, technologies and services for Industry and HealthJuly 30, 2015 H1 2015 Results
39%
40%
16%
5% Americas
Asia-Pacific
Middle East andAfrica
17.4%
16.7%
30.8%
25.2%
9.6%
22.9%
Total 14.8% 15.5%
Europe
Americas
Asia-Pacific
(1) Gross industrial and financial investments, including transactions with minority shareholders.
45
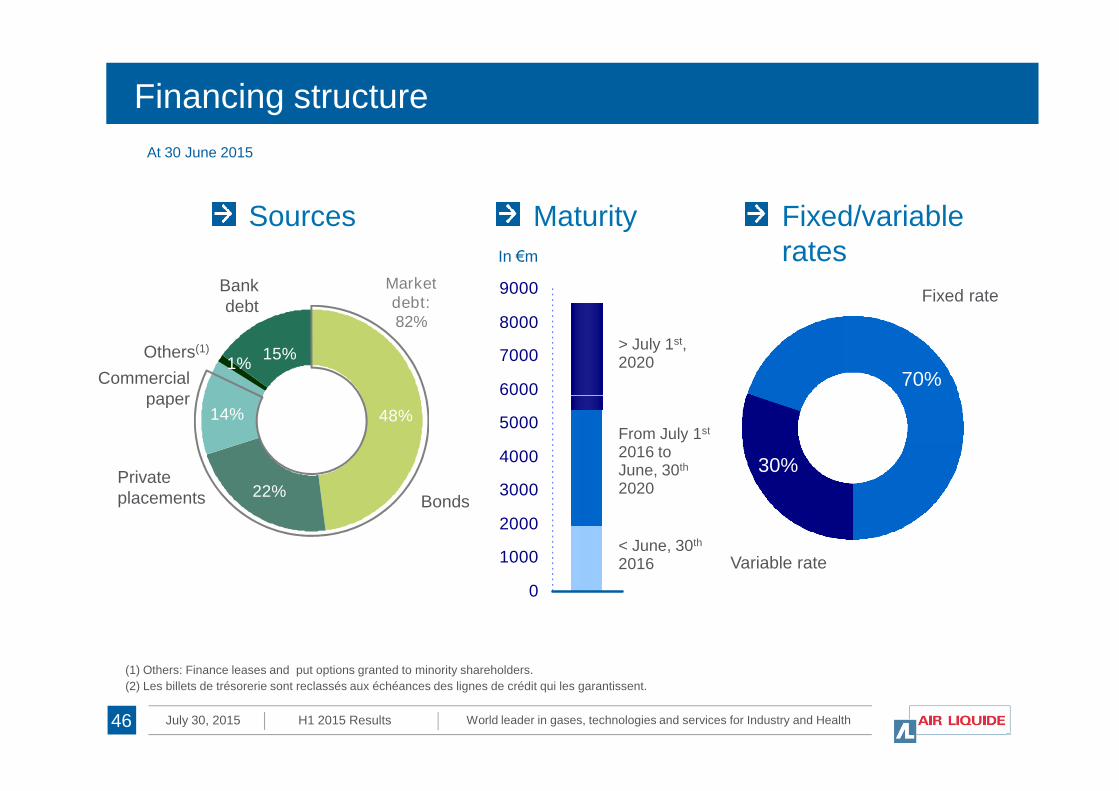
Financing structure
Bankdebt
Others(1)
Commercialpaper
70%
At 30 June 2015
Fixed rate
6000
7000
8000
9000
1%15%
Fixed/variablerates
Sources MaturityIn €m
> July 1st,2020
Marketdebt:82%
World leader in gases, technologies and services for Industry and HealthJuly 30, 2015 H1 2015 Results
Bonds
Privateplacements
paper
30%
Variable rate
0
1000
2000
3000
4000
5000
6000
48%14%
22%
From July 1st
2016 toJune, 30th
2020
< June, 30th
2016
(1) Others: Finance leases and put options granted to minority shareholders.
46
(2) Les billets de trésorerie sont reclassés aux échéances des lignes de crédit qui les garantissent.

Regular and sustained performance
0
2 500
5 000
7 500
10 000
12 500
15 000
19841986198819901992199419961998200020022004200620082010201220140
1
2
3
4
5
6
1984 1986 1988 1990 1992 1994 1996 1998 2000 2002 2004 2006 2008 2010 2012 2014
Revenue (in €m)
+5.6% CAGR over 30 years(2)
EPS (1) (in €)
+7.7% CAGR over 30 years(2)
World leader in gases, technologies and services for Industry and HealthJuly 30, 2015 H1 2015 Results47
0
500
1 000
1 500
2 000
2 500
3 000
1984 1986 1988 1990 1992 1994 1996 1998 2000 2002 2004 2006 2008 2010 2012 20140.00
0.50
1.00
1.50
2.00
2.50
1984 1986 1988 1990 1992 1994 1996 1998 2000 2002 2004 2006 2008 2010 2012 2014
Cashflow (in €m)
+6.9% CAGR over 30 years(2)
Dividend (1) (in € per share)
+9.3% CAGR over 30 years(2)
(1) Adjusted for the 2-for-1 share spilt in 2007 and free share attributions. (2) Calculated according to prevailing accounting rules over 30 years.
For further information, please contact:
Investor Relations
Aude Rodriguez + 33 (0)1 40 62 57 08
Louis Laffont + 33 (0)1 40 62 57 18
Jérôme Zaman + 33 (0)1 40 62 59 38
Communications
Anne Bardot + 33 (0)1 40 62 50 93
Annie Fournier + 33 (0)1 40 62 51 31
www.airliquide.com Follow us on Twitter @AirLiquideGroup
World leader in gases, technologies and services for Industry and HealthJuly 30, 2015 H1 2015 Results
L’Air Liquide S.A.
Corporation for the study and application of processes developed by
Georges Claude with registered capital of 1,897,386,986.00 euros
Corporate headquarters:
75, Quai d’Orsay
75321 Paris Cedex 07
Tel : +33 (0)1 40 62 55 55
RCS Paris 552 096 281
48
