svi 2014 documentation - 3/1/2017 please see data ... 2014 documentation - 3/1/2017 please see data...
TRANSCRIPT
1
SVI 2014 Documentation - 3/1/2017 Please see data dictionary and SVI 2014-2010 crosswalk below.
Introduction
What is Social Vulnerability?
Every community must prepare for and respond to hazardous events, whether a natural disaster like a tornado
or a disease outbreak, or an anthropogenic event such as a harmful chemical spill. The degree to which a
community exhibits certain social conditions, including high poverty, low percentage of vehicle access, or
crowded households, may affect that community’s ability to prevent human suffering and financial loss in the
event of disaster. These factors describe a community’s social vulnerability.
What is the Social Vulnerability Index?
ATSDR’s Geospatial Research, Analysis & Services Program (GRASP) has created a tool to help public health
officials and emergency response planners identify and map the communities that will most likely need support
before, during, and after a hazardous event.
The Social Vulnerability Index (SVI) indicates the relative vulnerability of every U.S. Census tract. Census tracts
are subdivisions of counties for which the Census collects statistical data. The SVI ranks the tracts on 15 social
factors, including unemployment, minority status, and disability, and further groups them into four related
themes. Thus each tract receives a ranking for each Census variable and for each of the four themes, as well as
an overall ranking.
In addition to tract-level rankings, SVI 2010 and SVI 2014 also have corresponding rankings at the county level.
How can the SVI help communities be better prepared for hazardous events?
The SVI provides specific socially and spatially relevant information to help public health officials and local
planners better prepare communities to respond to emergency events such as severe weather, floods, disease
outbreaks, or chemical exposure.
The SVI can be used to:
• Allocate emergency preparedness funding by community need.
• Estimate the amount and type of needed supplies like food, water, medicine, and bedding.
• Decide how many emergency personnel are required to assist people.
• Identify areas in need of emergency shelters.
• Create a plan to evacuate people, accounting for those who have special needs, such as those without
vehicles, the elderly, or people who do not understand English well.
• Identify communities that will need continued support to recover following an emergency or natural
disaster.
Important Notes on the SVI Database
� For SVI 2000 and 2010, keep the data in geodatabase format. Converting to shapefile changes the field
names. SVI 2014 is available for download in shapefile format. The 2014 names have been changed to
accommodate shapefiles. A 2014 to 2010 “crosswalk” is included in this documentation.
� For US-wide or multi-state mapping and analysis, use the US database, in which all tracts/counties are
ranked against one another. For individual state mapping and analysis, use the state-specific database,
in which tracts/counties are ranked only against other tracts/counties in the specified state.
� Starting with SVI 2014, we’ve added a stand-alone, state-specific Commonwealth of Puerto Rico
database. Puerto Rico is not included in the US-wide ranking.

2
� Starting with SVI 2014, we’ve added a database of Tribal Census Tracts
(http://factfinder.census.gov/help/en/tribal_census_tract.htm). Tribal tracts are defined independently
of, and in addition to, standard county-based tracts. The tribal tract database contains only estimates,
percentages, and their respective MOEs, along with the adjunct variables described in the data
dictionary below. Because of geographic separation and cultural diversity, tribal tracts are not ranked
against each other nor against standard census tracts.
� Tracts with zero estimates for total population (N = 404 for U.S.) were removed during the ranking
process. These tracts were added back to the SVI databases after ranking. The TOTPOP field value is 0,
but the percentile ranking fields (RPL_THEME1, RPL_THEME2, RPL_THEME3, RPL_THEME4, and
RPL_THEMES) were set to -999.
� For tracts with > 0 TOTPOP, a value of -999 in any field either means the value was unavailable from the
original census data or we could not calculate a derived value because of unavailable census data.
� Any cells with a -999 were not used for further calculations. For example, total flags do not include fields
with a -999 value.
� ArcGIS preserves leading 0s in the FIPS code fields of csv files. To preserve leading 0s in Excel , follow
these steps:
o Open a blank worksheet in Excel.
o Click the DATA tab and choose to open a file from Text
o Navigate to the csv file and choose to Import
o In the Text Import Wizard, choose the Delimited data type, then Next
o Choose the Comma delimiter, then Next
o One by one, select fields based on FIPS codes (TRACTCE, ST, STCNTY, FIPS), set the Column data
format to Text, then click Finish to open the csv with leading 0s preserved.
� See the Methods section below for further details.
� Questions? Please visit the SVI web site at http://svi.cdc.gov for additional information.
Methods
Variables Used
American Community Survey (ACS), 2010-2014 (5-year) data for the following estimates:
Ov
era
ll V
uln
era
bil
ity
Ov
era
ll V
uln
era
bil
ity
SocioeconomicSocioeconomic
StatusStatus
HouseholdHousehold
Composition &Composition &
DisabilityDisability
Minority StatusMinority Status
& Language& Language
Housing &Housing &
TransportationTransportation
Below Poverty
Unemployed
Income
No High School Diploma
Aged 65 or Older
Aged 17 or Younger
Civilian with a Disability
Single-Parent Households
Multi-Unit Structures
Mobile Homes
Crowding
No Vehicle
Group Quarters
Minority
Speak English "Less than Well"
3
For SVI 2014, we included two adjunct variables, 1) 2010-2014 ACS estimates for persons without health
insurance, and 2) an estimate of daytime population derived from LandScan 2012 estimates. These adjunct
variables are excluded from the SVI rankings.
Raw data estimates and percentages for each variable, for each tract, are included in the database. In addition,
the margins of error (MOEs) for each estimate, at the Census Bureau standard of 90%, are also included.
Confidence intervals can be calculated by subtracting the MOE from the estimate (lower limit) and adding the
MOE to the estimate (upper limit). Because of relatively small sample sizes, some of the MOEs are high. It’s
important to identify the amount of error acceptable in any analysis.
Rankings
We ranked Census tracts within each state and the District of Columbia, to enable mapping and analysis of
relative vulnerability in individual states. We also ranked tracts for the entire United States against one another,
for mapping and analysis of relative vulnerability in multiple states, or across the U.S. as a whole. Tract rankings
are based on percentiles. Percentile ranking values range from 0 to 1, with higher values indicating greater
vulnerability.
For each tract, we generated its percentile rank among all tracts for 1) the fifteen individual variables, 2) the four
themes, and 3) Its overall position.
Theme rankings: For each of the four themes, we summed the percentiles for the variables comprising each
theme. We ordered the summed percentiles for each theme to determine theme-specific percentile rankings.
The four summary theme ranking variables, detailed in the Data Dictionary below, are:
• Socioeconomic theme - RPL_THEME1
• Housing Composition and Disability - RPL_THEME2
• Minority Status & Language - RPL_THEME3
• Housing & Transportation - RPL_THEME4
Overall tract rankings: We summed the sums for each theme, ordered the tracts, and then calculated overall
percentile rankings. Please note; taking the sum of the sums for each theme is the same as summing individual
variable rankings. The overall tract summary ranking variable is RPL_THEMES.
Flags
Tracts in the top 10%, i.e., at the 90th percentile of values, are given a value of 1 to indicate high vulnerability.
Tracts below the 90th percentile are given a value of 0.
For a theme, the flag value is the number of flags for variables comprising the theme. We calculated the overall
flag value for each tract as the number of all variable flags.
For a detailed description of SVI variable selection rationale and methods, see A Social Vulnerability Index for
Disaster Management
(http://gis.cdc.gov/grasp/svi/A%20Social%20Vulnerability%20Index%20for%20Disaster%20Management.pdf).
4
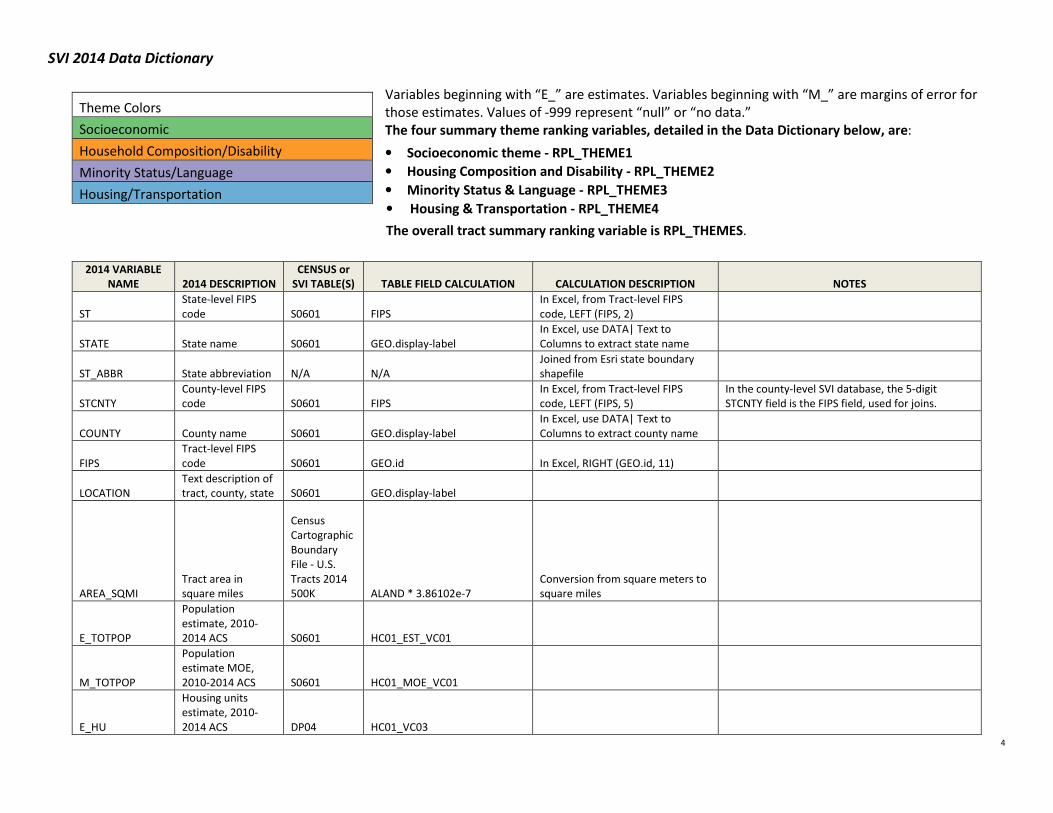
SVI 2014 Data Dictionary
Variables beginning with “E_” are estimates. Variables beginning with “M_” are margins of error for
those estimates. Values of -999 represent “null” or “no data.”
The four summary theme ranking variables, detailed in the Data Dictionary below, are:
• Socioeconomic theme - RPL_THEME1
• Housing Composition and Disability - RPL_THEME2
• Minority Status & Language - RPL_THEME3
• Housing & Transportation - RPL_THEME4
The overall tract summary ranking variable is RPL_THEMES.
2014 VARIABLE
NAME 2014 DESCRIPTION
CENSUS or
SVI TABLE(S) TABLE FIELD CALCULATION CALCULATION DESCRIPTION NOTES
ST
State-level FIPS
code S0601 FIPS
In Excel, from Tract-level FIPS
code, LEFT (FIPS, 2)
STATE State name S0601 GEO.display-label
In Excel, use DATA| Text to
Columns to extract state name
ST_ABBR State abbreviation N/A N/A
Joined from Esri state boundary
shapefile
STCNTY
County-level FIPS
code S0601 FIPS
In Excel, from Tract-level FIPS
code, LEFT (FIPS, 5)
In the county-level SVI database, the 5-digit
STCNTY field is the FIPS field, used for joins.
COUNTY County name S0601 GEO.display-label
In Excel, use DATA| Text to
Columns to extract county name
FIPS
Tract-level FIPS
code S0601 GEO.id In Excel, RIGHT (GEO.id, 11)
LOCATION
Text description of
tract, county, state S0601 GEO.display-label
AREA_SQMI
Tract area in
square miles
Census
Cartographic
Boundary
File - U.S.
Tracts 2014
500K ALAND * 3.86102e-7
Conversion from square meters to
square miles
E_TOTPOP
Population
estimate, 2010-
2014 ACS S0601 HC01_EST_VC01
M_TOTPOP
Population
estimate MOE,
2010-2014 ACS S0601 HC01_MOE_VC01
E_HU
Housing units
estimate, 2010-
2014 ACS DP04 HC01_VC03
Theme Colors
Socioeconomic
Household Composition/Disability
Minority Status/Language
Housing/Transportation

5
2014 VARIABLE
NAME 2014 DESCRIPTION
CENSUS or
SVI TABLE(S) TABLE FIELD CALCULATION CALCULATION DESCRIPTION NOTES
M_HU
Housing units
estimate MOE,
2010-2014 ACS DP04 HC02_VC03
E_HH
Households
estimate, 2010-
2014 ACS DP02 HC01_VC03
M_HH
Households
estimate MOE,
2010-2014 ACS DP02 HC02_VC03
E_POV
Persons below
poverty estimate,
2010-2014 ACS B17001 HD01_VD02
M_POV
Persons below
poverty estimate
MOE, 2010-2014
ACS B17001 HD02_VD02
E_UNEMP
Civilian (age 16+)
unemployed
estimate, 2010-
2014 ACS DP03 HC01_VC07
M_UNEMP
Civilian (age 16+)
unemployed
estimate MOE,
2010-2014 ACS DP03 HC02_VC07
E_PCI
Per capita income
estimate, 2010-
2014 ACS. B19301 HD01_VD01
Fewer rows than other variables - joined to Census
2014 tracts. Contains null cells (i.e. -999).
M_PCI
Per capita income
estimate MOE,
2010-2014 ACS B19301 HD02_VD01
Fewer rows than other variables - joined to Census
2014 tracts
E_NOHSDP
Persons (age 25+)
with no high
school diploma
estimate, 2010-
2014 ACS B06009 HD01_VD03
M_NOHSDP
Persons (age 25+)
with no high
school diploma
estimate MOE,
2010-2014 ACS B06009 HD02_VD03
6
2014 VARIABLE
NAME 2014 DESCRIPTION
CENSUS or
SVI
TABLE(S) TABLE FIELD CALCULATION CALCULATION DESCRIPTION NOTES
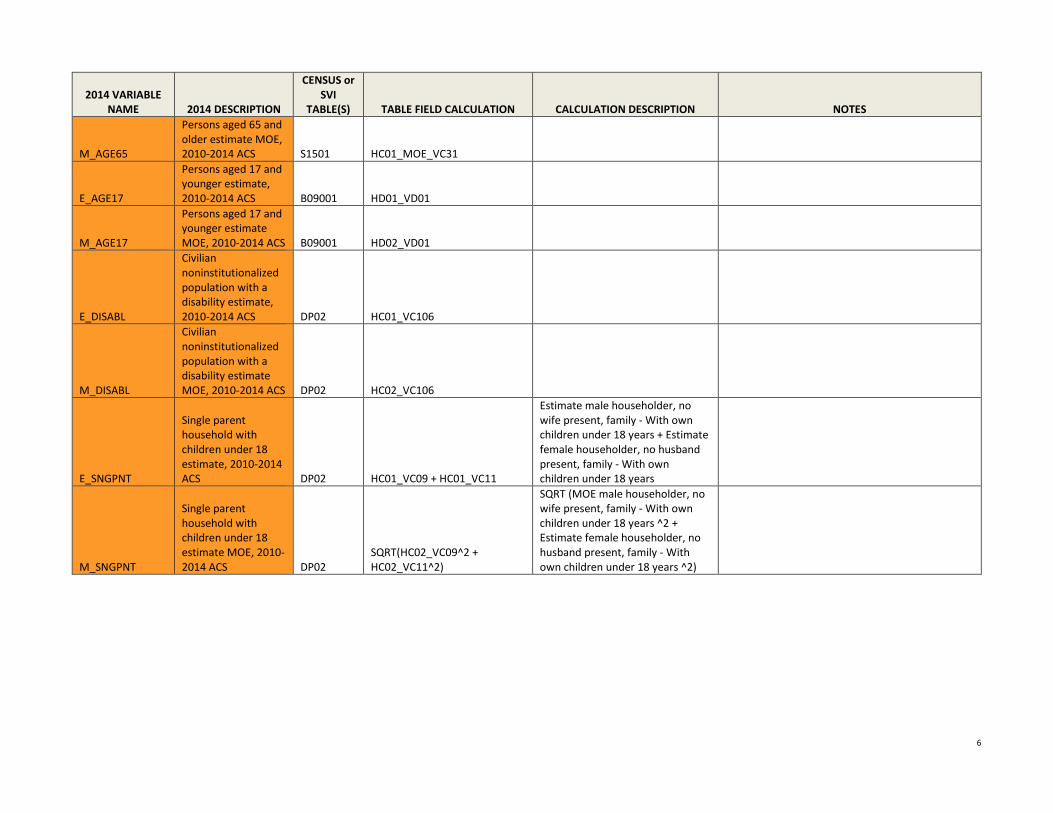
M_AGE65
Persons aged 65 and
older estimate MOE,
2010-2014 ACS S1501 HC01_MOE_VC31
E_AGE17
Persons aged 17 and
younger estimate,
2010-2014 ACS B09001 HD01_VD01
M_AGE17
Persons aged 17 and
younger estimate
MOE, 2010-2014 ACS B09001 HD02_VD01
E_DISABL
Civilian
noninstitutionalized
population with a
disability estimate,
2010-2014 ACS DP02 HC01_VC106
M_DISABL
Civilian
noninstitutionalized
population with a
disability estimate
MOE, 2010-2014 ACS DP02 HC02_VC106
E_SNGPNT
Single parent
household with
children under 18
estimate, 2010-2014
ACS DP02 HC01_VC09 + HC01_VC11
Estimate male householder, no
wife present, family - With own
children under 18 years + Estimate
female householder, no husband
present, family - With own
children under 18 years
M_SNGPNT
Single parent
household with
children under 18
estimate MOE, 2010-
2014 ACS DP02
SQRT(HC02_VC09^2 +
HC02_VC11^2)
SQRT (MOE male householder, no
wife present, family - With own
children under 18 years ^2 +
Estimate female householder, no
husband present, family - With
own children under 18 years ^2)
7
2014 VARIABLE
NAME 2014 DESCRIPTION
CENSUS or
SVI TABLE(S) TABLE FIELD CALCULATION CALCULATION DESCRIPTION NOTES
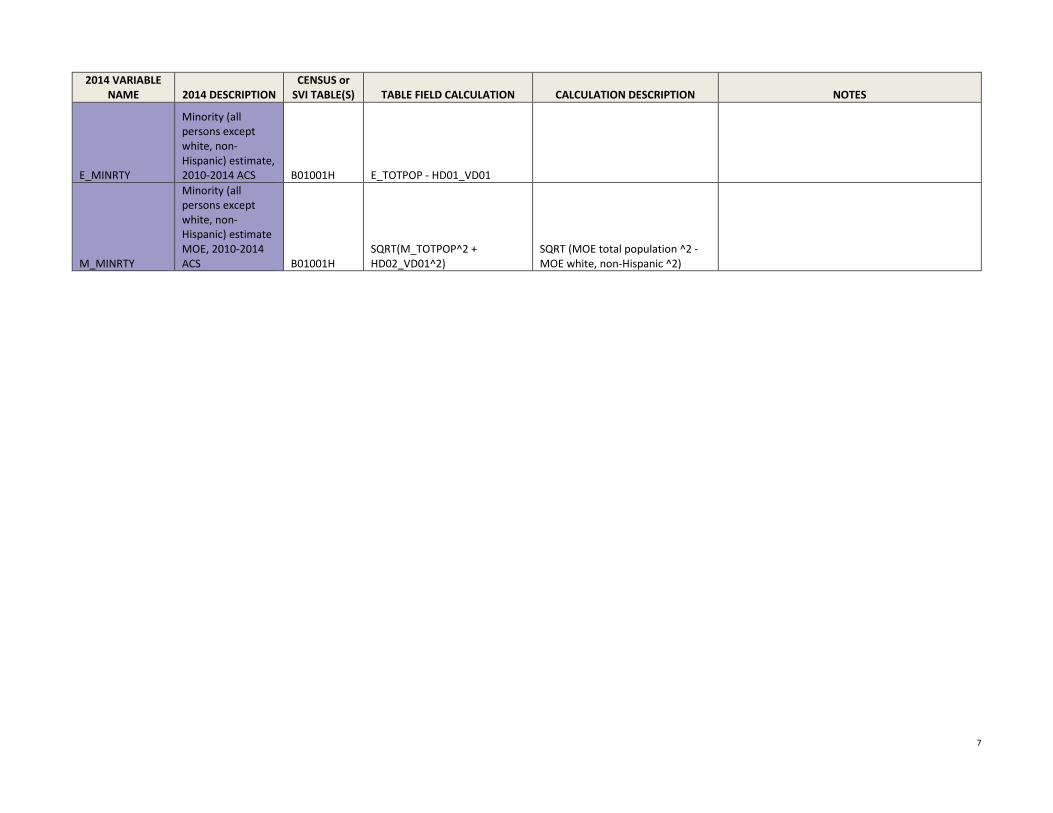
E_MINRTY
Minority (all
persons except
white, non-
Hispanic) estimate,
2010-2014 ACS B01001H E_TOTPOP - HD01_VD01
M_MINRTY
Minority (all
persons except
white, non-
Hispanic) estimate
MOE, 2010-2014
ACS B01001H
SQRT(M_TOTPOP^2 +
HD02_VD01^2)
SQRT (MOE total population ^2 -
MOE white, non-Hispanic ^2)
8
2014 VARIABLE
NAME 2014 DESCRIPTION
CENSUS or
SVI TABLE(S) TABLE FIELD CALCULATION CALCULATION DESCRIPTION NOTES
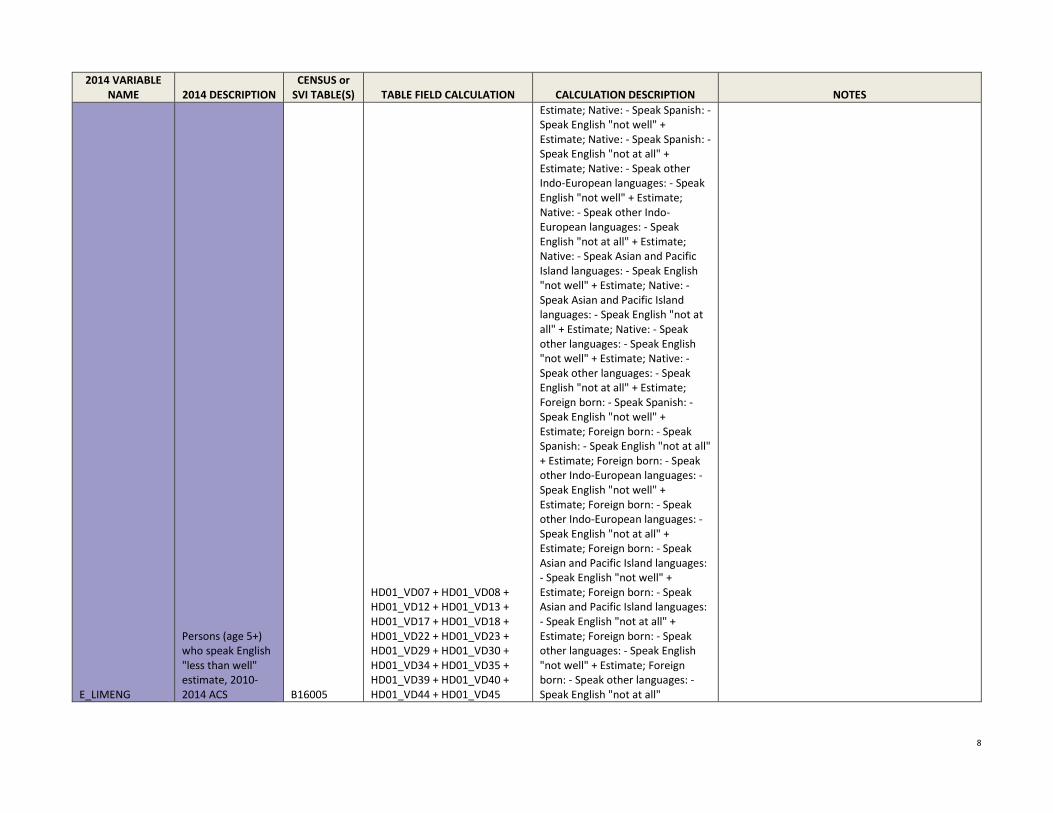
E_LIMENG
Persons (age 5+)
who speak English
"less than well"
estimate, 2010-
2014 ACS B16005
HD01_VD07 + HD01_VD08 +
HD01_VD12 + HD01_VD13 +
HD01_VD17 + HD01_VD18 +
HD01_VD22 + HD01_VD23 +
HD01_VD29 + HD01_VD30 +
HD01_VD34 + HD01_VD35 +
HD01_VD39 + HD01_VD40 +
HD01_VD44 + HD01_VD45
Estimate; Native: - Speak Spanish: -
Speak English "not well" +
Estimate; Native: - Speak Spanish: -
Speak English "not at all" +
Estimate; Native: - Speak other
Indo-European languages: - Speak
English "not well" + Estimate;
Native: - Speak other Indo-
European languages: - Speak
English "not at all" + Estimate;
Native: - Speak Asian and Pacific
Island languages: - Speak English
"not well" + Estimate; Native: -
Speak Asian and Pacific Island
languages: - Speak English "not at
all" + Estimate; Native: - Speak
other languages: - Speak English
"not well" + Estimate; Native: -
Speak other languages: - Speak
English "not at all" + Estimate;
Foreign born: - Speak Spanish: -
Speak English "not well" +
Estimate; Foreign born: - Speak
Spanish: - Speak English "not at all"
+ Estimate; Foreign born: - Speak
other Indo-European languages: -
Speak English "not well" +
Estimate; Foreign born: - Speak
other Indo-European languages: -
Speak English "not at all" +
Estimate; Foreign born: - Speak
Asian and Pacific Island languages:
- Speak English "not well" +
Estimate; Foreign born: - Speak
Asian and Pacific Island languages:
- Speak English "not at all" +
Estimate; Foreign born: - Speak
other languages: - Speak English
"not well" + Estimate; Foreign
born: - Speak other languages: -
Speak English "not at all"

9
2014 VARIABLE
NAME 2014 DESCRIPTION
CENSUS or
SVI TABLE(S) TABLE FIELD CALCULATION CALCULATION DESCRIPTION NOTES
M_LIMENG
Persons (age 5+)
who speak English
"less than well"
estimate MOE,
2010-2014 ACS B16005
SQRT(HD02_VD07^2 +
HD02_VD08^2 + HD02_VD12^2
+ HD02_VD13^2 +
HD02_VD17^2 + HD02_VD18^2
+ HD02_VD22^2 +
HD02_VD23^2 + HD02_VD29^2
+ HD02_VD30^2 +
HD02_VD34^2 + HD02_VD35^2
+ HD02_VD39^2 +
HD02_VD40^2 + HD02_VD44^2
+ HD02_VD45^2)
SQRT (MOE Native: - Speak
Spanish: - Speak English "not
well"^2 + MOE Native: - Speak
Spanish: - Speak English "not at
all"^2 + MOE Native: - Speak other
Indo-European languages: - Speak
English "not well"^2 + MOE
Native: - Speak other Indo-
European languages: - Speak
English "not at all"^2 + MOE
Native: - Speak Asian and Pacific
Island languages: - Speak English
"not well"^2 + MOE Native: -
Speak Asian and Pacific Island
languages: - Speak English "not at
all"^2 + MOE Native: - Speak other
languages: - Speak English "not
well"^2 + MOE Native: - Speak
other languages: - Speak English
"not at all"^2 + MOE Foreign born:
- Speak Spanish: - Speak English
"not well"^2 + MOE Foreign born:
- Speak Spanish: - Speak English
"not at all"^2 + MOE Foreign born:
- Speak other Indo-European
languages: - Speak English "not
well"^2 + MOE Foreign born: -
Speak other Indo-European
languages: - Speak English "not at
all"^2 + MOE Foreign born: -
Speak Asian and Pacific Island
languages: - Speak English "not
well"^2 + MOE Foreign born: -
Speak Asian and Pacific Island
languages: - Speak English "not at
all"^2 + MOE Foreign born: -
Speak other languages: - Speak
English "not well"^2 + MOE
Foreign born: - Speak other
languages: - Speak English "not at
all"^2)

10
2014 VARIABLE
NAME 2014 DESCRIPTION
CENSUS or
SVI TABLE(S) TABLE FIELD CALCULATION CALCULATION DESCRIPTION NOTES
E_MUNIT
Housing in
structures with 10
or more units
estimate, 2010-
2014 ACS DP04 HC01_VC19 + HC01_VC20
Estimate; UNITS IN STRUCTURE -
Total housing units - 10 to 19 units
+ Estimate; UNITS IN STRUCTURE -
Total housing units - 20 or more
units
M_MUNIT
Housing in
structures with 10
or more units
estimate MOE,
2010-2014 ACS DP04
SQRT(HC02_VC19^2 +
HC02_VC20^2)
SQRT (MOE UNITS IN STRUCTURE -
Total housing units - 10 to 19
units^2 + MOE; UNITS IN
STRUCTURE - Total housing units -
20 or more units^2)
E_MOBILE
Mobile homes
estimate, 2010-
2014 ACS DP04 HC01_VC21
M_MOBILE
Mobile homes
estimate MOE,
2010-2014 ACS DP04 HC02_VC21
E_CROWD
At household level
(occupied housing
units), more
people than rooms
estimate, 2010-
2014 ACS DP04 HC01_VC113 + HC01_VC114
Estimate; OCCUPANTS PER ROOM
- Occupied housing units - 1.01 to
1.50 + Estimate; OCCUPANTS PER
ROOM - Occupied housing units -
1.51 or more
M_CROWD
At household level
(occupied housing
units), more
people than rooms
estimate MOE,
2010-2014 ACS DP04
SQRT(HC02_VC113^2 +
HC02_VC114^2)
SQRT(MOE OCCUPANTS PER
ROOM - Occupied housing units -
1.01 to 1.50^2+ MOE OCCUPANTS
PER ROOM - Occupied housing
units - 1.51 or more^2)
E_NOVEH
Households with
no vehicle
available estimate,
2010-2014 ACS DP04 HC01_VC84
M_NOVEH
Households with
no vehicle
available estimate
MOE, 2010-2014
ACS DP04 HC02_VC84
E_GROUPQ
Persons in
institutionalized
group quarters
estimate, 2010-
2014 ACS B26001 HD01_VD01
11
2014 VARIABLE
NAME 2014 DESCRIPTION
CENSUS or
SVI TABLE(S) TABLE FIELD CALCULATION CALCULATION DESCRIPTION NOTES
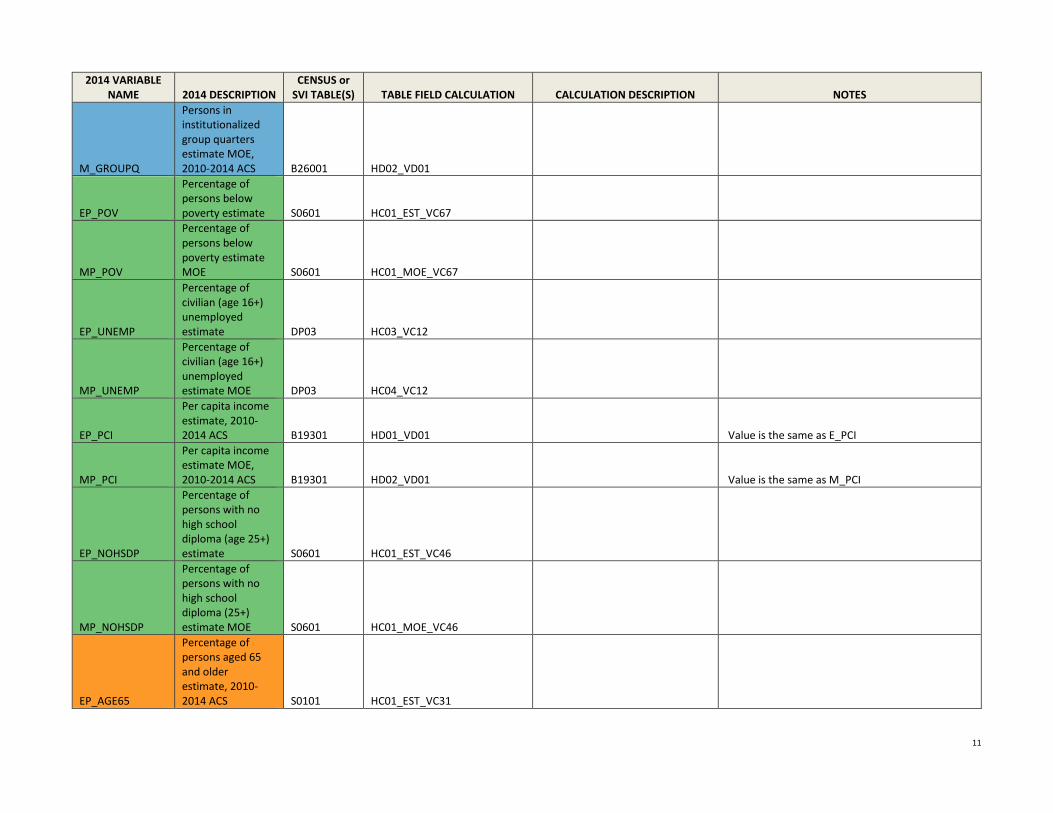
M_GROUPQ
Persons in
institutionalized
group quarters
estimate MOE,
2010-2014 ACS B26001 HD02_VD01
EP_POV
Percentage of
persons below
poverty estimate S0601 HC01_EST_VC67
MP_POV
Percentage of
persons below
poverty estimate
MOE S0601 HC01_MOE_VC67
EP_UNEMP
Percentage of
civilian (age 16+)
unemployed
estimate DP03 HC03_VC12
MP_UNEMP
Percentage of
civilian (age 16+)
unemployed
estimate MOE DP03 HC04_VC12
EP_PCI
Per capita income
estimate, 2010-
2014 ACS B19301 HD01_VD01 Value is the same as E_PCI
MP_PCI
Per capita income
estimate MOE,
2010-2014 ACS B19301 HD02_VD01 Value is the same as M_PCI
EP_NOHSDP
Percentage of
persons with no
high school
diploma (age 25+)
estimate S0601 HC01_EST_VC46
MP_NOHSDP
Percentage of
persons with no
high school
diploma (25+)
estimate MOE S0601 HC01_MOE_VC46
EP_AGE65
Percentage of
persons aged 65
and older
estimate, 2010-
2014 ACS S0101 HC01_EST_VC31

12
2014 VARIABLE
NAME 2014 DESCRIPTION
CENSUS or
SVI TABLE(S) TABLE FIELD CALCULATION CALCULATION DESCRIPTION NOTES
MP_AGE65
Percentage of
persons aged 65
and older estimate
MOE, 2010-2014
ACS S0101 HC01_MOE_VC31
EP_AGE17
Percentage of
persons aged 17
and younger
estimate, 2010-
2014 ACS SVI (E_AGE17 / E_TOTPOP)*100
(Persons aged 17 and younger
estimate / Total population
estimate) * 100
This calculation resulted in some division by 0
errors in cases where E_TOTPOP equals 0. These
rows were revised with the estimated proportions
set to 0 and their corresponding MOEs set to -999.
MP_AGE17
Percentage of
persons aged 17
and younger
estimate MOE,
2010-2014 ACS SVI
((SQRT(M_AGE17^2-
((EP_AGE17/100)^2*M_TOTPO
P^2)))/E_TOTPOP)*100
((SQRT(MOE Population under 18
years^2 - (Estimated proportion of
persons aged 17 and younger^2 *
MOE Total Population^2))) / Total
population estimate) * 100
Two MOE calculations resulted in errors because
the value under the square root was negative. For
these rows, as the Census Bureau suggests, we
used the formula for derived ratios, as opposed to
that for derived proportions. Instead of the
subtraction in the standard formula, we add. See A
Compass for Understanding and Using American
Community Survey Data, page A-15
(https://www.census.gov/content/dam/Census/lib
rary/publications/2008/acs/ACSGeneralHandbook.
pdf).
EP_DISABL
Percentage of
civilian
noninstitutionalize
d population with
a disability
estimate, 2010-
2014 ACS DP02 HC03_VC106
MP_DISABL
Percentage of
civilian
noninstitutionalize
d population with
a disability
estimate MOE,
2010-2014 ACS DP02 HC04_VC106
EP_SNGPNT
Percentage of
single parent
households with
children under 18
estimate, 2010-
2014 ACS SVI (E_SNGPNT / E_HH) * 100
(Single parent household with
children under 18 estimate /
Households estimate) * 100
This calculation resulted in some division by 0
errors in cases where E_HH equals 0. These rows
were revised with the estimated proportions set to
0 and their corresponding MOEs set to -999.

13
2014 VARIABLE
NAME 2014 DESCRIPTION
CENSUS or
SVI TABLE(S) TABLE FIELD CALCULATION CALCULATION DESCRIPTION NOTES
MP_SNGPNT
Percentage of
single parent
households with
children under 18
estimate MOE,
2010-2014 ACS SVI
((SQRT(M_SNGPNT^2-
((EP_SNGPNT/100)^2*M_HH^2
)))/E_HH)*100
((SQRT(MOE Single parent
households^2 - (Estimated
proportion single parent
households^2 * MOE
Households^2))) / Households
estimate) * 100
Two MOE calculations resulted in errors because
the value under the square root was negative. For
these rows, as the Census Bureau suggests, we
used the formula for derived ratios, as opposed to
that for derived proportions. Instead of the
subtraction in the standard formula, we add. See A
Compass for Understanding and Using American
Community Survey Data, page A-15
(https://www.census.gov/content/dam/Census/lib
rary/publications/2008/acs/ACSGeneralHandbook.
pdf).
EP_MINRTY
Percentage
minority (all
persons except
white, non-
Hispanic) estimate,
2010-2014 ACS SVI (E_MINRTY/E_TOTPOP)*100
(Minority estimate / Total
population estimate) * 100
This calculation resulted in some division by 0
errors in cases where E_HH equals 0. These rows
were revised with the estimated proportions set to
0 and their corresponding MOEs set to -999.
MP_MINRTY
Percentage
minority (all
persons except
white, non-
Hispanic) estimate
MOE, 2010-2014
ACS SVI
((SQRT(M_MINRTY^2-
((EP_MINRTY/100)^2*M_TOTP
OP^2)))/E_TOTPOP)*100
((SQRT(MOE Minority^2 -
(Estimated proportion minority^2
* MOE Total population^2))) /
Total population estimate) * 100
EP_LIMENG
Percentage of
persons (age 5+)
who speak English
"less than well"
estimate, 2010-
2014 ACS
SVI and
B16005 (E_LIMENG/HD01_VD01)*100
(Persons who speak English "less
than well" estimate / Population
age 5 and over estimate) * 100
This calculation resulted in some division by 0
errors in cases where total population age 5 and
over equals 0. These rows were revised with the
estimated proportions set to 0 and their
corresponding MOEs set to -999.
14
2014 VARIABLE
NAME 2014 DESCRIPTION
CENSUS or
SVI TABLE(S) TABLE FIELD CALCULATION CALCULATION DESCRIPTION NOTES
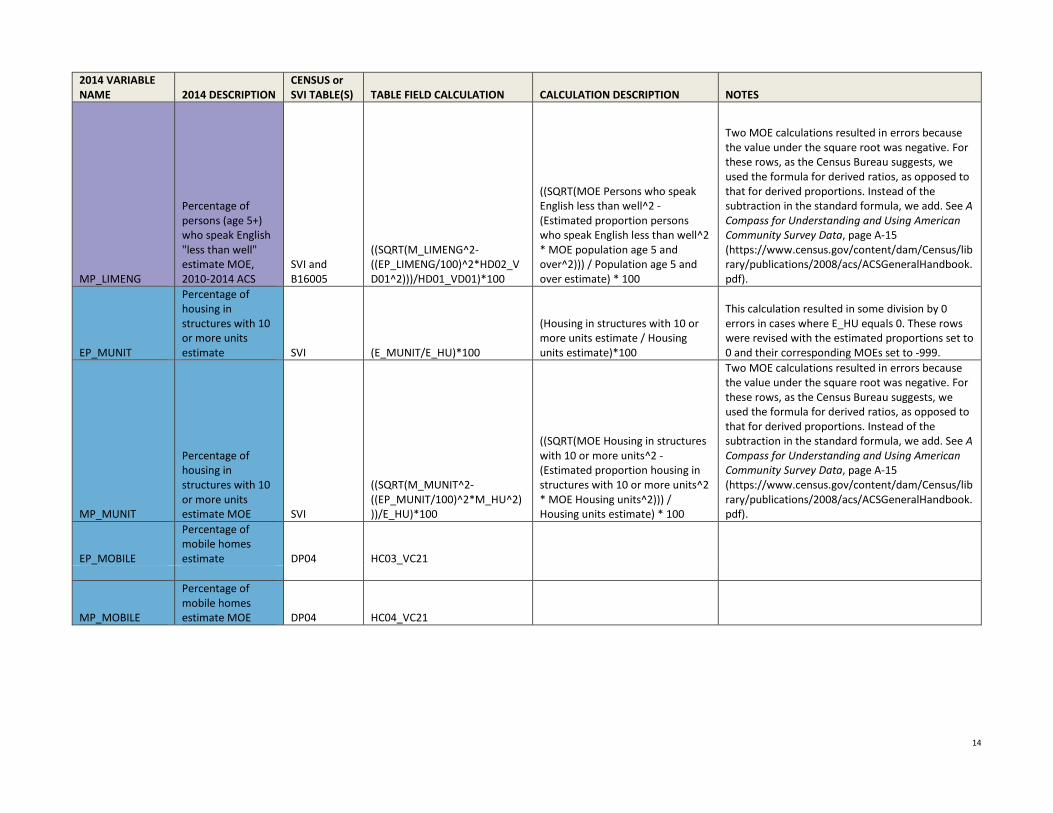
MP_LIMENG
Percentage of
persons (age 5+)
who speak English
"less than well"
estimate MOE,
2010-2014 ACS
SVI and
B16005
((SQRT(M_LIMENG^2-
((EP_LIMENG/100)^2*HD02_V
D01^2)))/HD01_VD01)*100
((SQRT(MOE Persons who speak
English less than well^2 -
(Estimated proportion persons
who speak English less than well^2
* MOE population age 5 and
over^2))) / Population age 5 and
over estimate) * 100
Two MOE calculations resulted in errors because
the value under the square root was negative. For
these rows, as the Census Bureau suggests, we
used the formula for derived ratios, as opposed to
that for derived proportions. Instead of the
subtraction in the standard formula, we add. See A
Compass for Understanding and Using American
Community Survey Data, page A-15
(https://www.census.gov/content/dam/Census/lib
rary/publications/2008/acs/ACSGeneralHandbook.
pdf).
EP_MUNIT
Percentage of
housing in
structures with 10
or more units
estimate SVI (E_MUNIT/E_HU)*100
(Housing in structures with 10 or
more units estimate / Housing
units estimate)*100
This calculation resulted in some division by 0
errors in cases where E_HU equals 0. These rows
were revised with the estimated proportions set to
0 and their corresponding MOEs set to -999.
MP_MUNIT
Percentage of
housing in
structures with 10
or more units
estimate MOE SVI
((SQRT(M_MUNIT^2-
((EP_MUNIT/100)^2*M_HU^2)
))/E_HU)*100
((SQRT(MOE Housing in structures
with 10 or more units^2 -
(Estimated proportion housing in
structures with 10 or more units^2
* MOE Housing units^2))) /
Housing units estimate) * 100
Two MOE calculations resulted in errors because
the value under the square root was negative. For
these rows, as the Census Bureau suggests, we
used the formula for derived ratios, as opposed to
that for derived proportions. Instead of the
subtraction in the standard formula, we add. See A
Compass for Understanding and Using American
Community Survey Data, page A-15
(https://www.census.gov/content/dam/Census/lib
rary/publications/2008/acs/ACSGeneralHandbook.
pdf).
EP_MOBILE
Percentage of
mobile homes
estimate DP04 HC03_VC21
MP_MOBILE
Percentage of
mobile homes
estimate MOE DP04 HC04_VC21
15
2014 VARIABLE
NAME 2014 DESCRIPTION
CENSUS or
SVI TABLE(S) TABLE FIELD CALCULATION CALCULATION DESCRIPTION NOTES
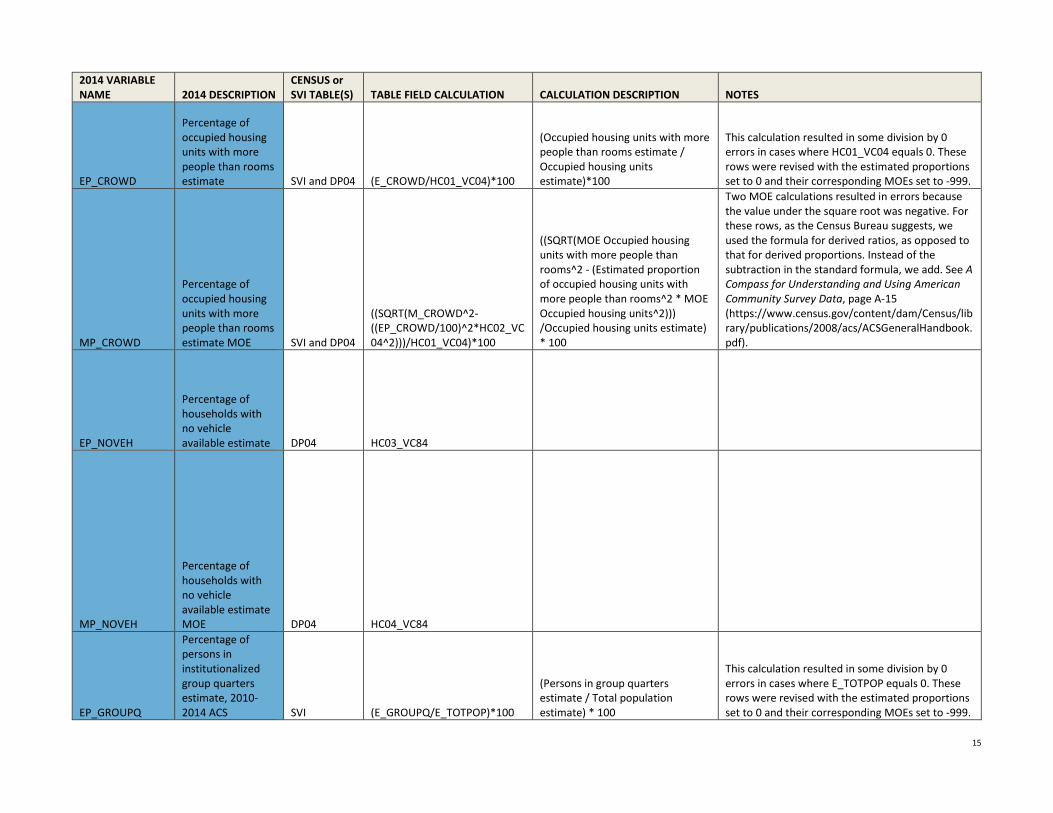
EP_CROWD
Percentage of
occupied housing
units with more
people than rooms
estimate SVI and DP04 (E_CROWD/HC01_VC04)*100
(Occupied housing units with more
people than rooms estimate /
Occupied housing units
estimate)*100
This calculation resulted in some division by 0
errors in cases where HC01_VC04 equals 0. These
rows were revised with the estimated proportions
set to 0 and their corresponding MOEs set to -999.
MP_CROWD
Percentage of
occupied housing
units with more
people than rooms
estimate MOE SVI and DP04
((SQRT(M_CROWD^2-
((EP_CROWD/100)^2*HC02_VC
04^2)))/HC01_VC04)*100
((SQRT(MOE Occupied housing
units with more people than
rooms^2 - (Estimated proportion
of occupied housing units with
more people than rooms^2 * MOE
Occupied housing units^2)))
/Occupied housing units estimate)
* 100
Two MOE calculations resulted in errors because
the value under the square root was negative. For
these rows, as the Census Bureau suggests, we
used the formula for derived ratios, as opposed to
that for derived proportions. Instead of the
subtraction in the standard formula, we add. See A
Compass for Understanding and Using American
Community Survey Data, page A-15
(https://www.census.gov/content/dam/Census/lib
rary/publications/2008/acs/ACSGeneralHandbook.
pdf).
EP_NOVEH
Percentage of
households with
no vehicle
available estimate DP04 HC03_VC84
MP_NOVEH
Percentage of
households with
no vehicle
available estimate
MOE DP04 HC04_VC84
EP_GROUPQ
Percentage of
persons in
institutionalized
group quarters
estimate, 2010-
2014 ACS SVI (E_GROUPQ/E_TOTPOP)*100
(Persons in group quarters
estimate / Total population
estimate) * 100
This calculation resulted in some division by 0
errors in cases where E_TOTPOP equals 0. These
rows were revised with the estimated proportions
set to 0 and their corresponding MOEs set to -999.
16
2014 VARIABLE
NAME 2014 DESCRIPTION
CENSUS or
SVI TABLE(S) TABLE FIELD CALCULATION CALCULATION DESCRIPTION NOTES
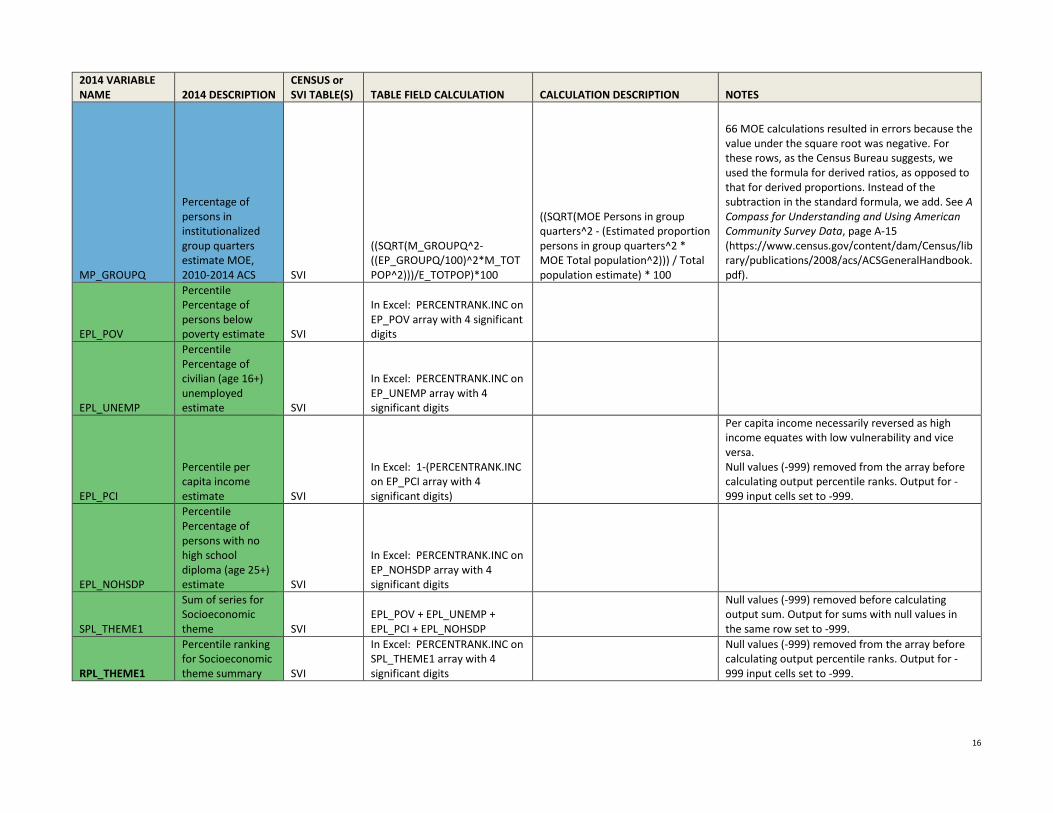
MP_GROUPQ
Percentage of
persons in
institutionalized
group quarters
estimate MOE,
2010-2014 ACS SVI
((SQRT(M_GROUPQ^2-
((EP_GROUPQ/100)^2*M_TOT
POP^2)))/E_TOTPOP)*100
((SQRT(MOE Persons in group
quarters^2 - (Estimated proportion
persons in group quarters^2 *
MOE Total population^2))) / Total
population estimate) * 100
66 MOE calculations resulted in errors because the
value under the square root was negative. For
these rows, as the Census Bureau suggests, we
used the formula for derived ratios, as opposed to
that for derived proportions. Instead of the
subtraction in the standard formula, we add. See A
Compass for Understanding and Using American
Community Survey Data, page A-15
(https://www.census.gov/content/dam/Census/lib
rary/publications/2008/acs/ACSGeneralHandbook.
pdf).
EPL_POV
Percentile
Percentage of
persons below
poverty estimate SVI
In Excel: PERCENTRANK.INC on
EP_POV array with 4 significant
digits
EPL_UNEMP
Percentile
Percentage of
civilian (age 16+)
unemployed
estimate SVI
In Excel: PERCENTRANK.INC on
EP_UNEMP array with 4
significant digits
EPL_PCI
Percentile per
capita income
estimate SVI
In Excel: 1-(PERCENTRANK.INC
on EP_PCI array with 4
significant digits)
Per capita income necessarily reversed as high
income equates with low vulnerability and vice
versa.
Null values (-999) removed from the array before
calculating output percentile ranks. Output for -
999 input cells set to -999.
EPL_NOHSDP
Percentile
Percentage of
persons with no
high school
diploma (age 25+)
estimate SVI
In Excel: PERCENTRANK.INC on
EP_NOHSDP array with 4
significant digits
SPL_THEME1
Sum of series for
Socioeconomic
theme SVI
EPL_POV + EPL_UNEMP +
EPL_PCI + EPL_NOHSDP
Null values (-999) removed before calculating
output sum. Output for sums with null values in
the same row set to -999.
RPL_THEME1
Percentile ranking
for Socioeconomic
theme summary SVI
In Excel: PERCENTRANK.INC on
SPL_THEME1 array with 4
significant digits
Null values (-999) removed from the array before
calculating output percentile ranks. Output for -
999 input cells set to -999.
17
2014 VARIABLE
NAME 2014 DESCRIPTION
CENSUS or
SVI TABLE(S) TABLE FIELD CALCULATION CALCULATION DESCRIPTION NOTES
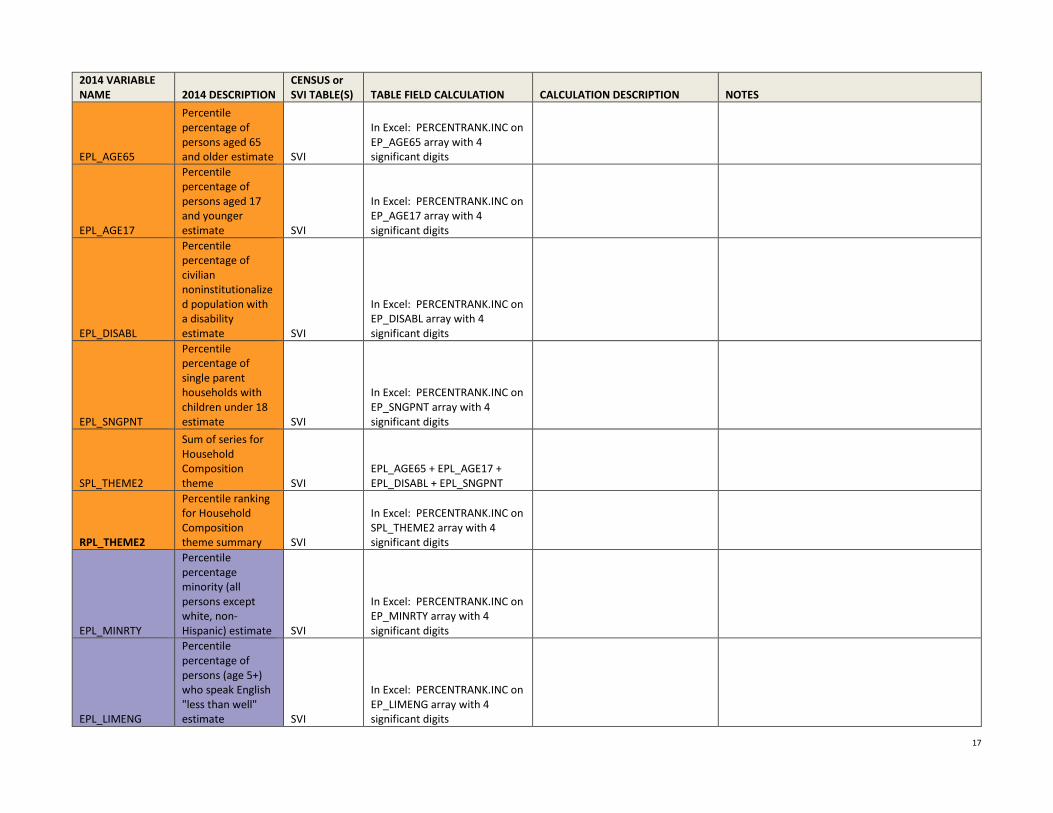
EPL_AGE65
Percentile
percentage of
persons aged 65
and older estimate SVI
In Excel: PERCENTRANK.INC on
EP_AGE65 array with 4
significant digits
EPL_AGE17
Percentile
percentage of
persons aged 17
and younger
estimate SVI
In Excel: PERCENTRANK.INC on
EP_AGE17 array with 4
significant digits
EPL_DISABL
Percentile
percentage of
civilian
noninstitutionalize
d population with
a disability
estimate SVI
In Excel: PERCENTRANK.INC on
EP_DISABL array with 4
significant digits
EPL_SNGPNT
Percentile
percentage of
single parent
households with
children under 18
estimate SVI
In Excel: PERCENTRANK.INC on
EP_SNGPNT array with 4
significant digits
SPL_THEME2
Sum of series for
Household
Composition
theme SVI
EPL_AGE65 + EPL_AGE17 +
EPL_DISABL + EPL_SNGPNT
RPL_THEME2
Percentile ranking
for Household
Composition
theme summary SVI
In Excel: PERCENTRANK.INC on
SPL_THEME2 array with 4
significant digits
EPL_MINRTY
Percentile
percentage
minority (all
persons except
white, non-
Hispanic) estimate SVI
In Excel: PERCENTRANK.INC on
EP_MINRTY array with 4
significant digits
EPL_LIMENG
Percentile
percentage of
persons (age 5+)
who speak English
"less than well"
estimate SVI
In Excel: PERCENTRANK.INC on
EP_LIMENG array with 4
significant digits

18
2014 VARIABLE
NAME 2014 DESCRIPTION
CENSUS or
SVI TABLE(S) TABLE FIELD CALCULATION CALCULATION DESCRIPTION NOTES
SPL_THEME3
Sum of series for
Minority
Status/Language
theme SVI EPL_MINRTY + EPL_LIMENG
RPL_THEME3
Percentile ranking
for Minority
Status/Language
theme SVI
In Excel: PERCENTRANK.INC on
SPL_THEME3 array with 4
significant digits
EPL_MUNIT
Percentile
percentage
housing in
structures with 10
or more units
estimate SVI
In Excel: PERCENTRANK.INC on
EP_MUNIT array with 4
significant digits
EPL_MOBILE
Percentile
percentage mobile
homes estimate SVI
In Excel: PERCENTRANK.INC on
EP_MOBILE array with 4
significant digits
EPL_CROWD
Percentile
percentage
households with
more people than
rooms estimate SVI
In Excel: PERCENTRANK.INC on
EP_CROWD array with 4
significant digits
EPL_NOVEH
Percentile
percentage
households with
no vehicle
available estimate SVI
In Excel: PERCENTRANK.INC on
EP_NOVEH array with 4
significant digits
EPL_GROUPQ
Percentile
percentage of
persons in
institutionalized
group quarters
estimate SVI
In Excel: PERCENTRANK.INC on
EP_GROUPQ array with 4
significant digits
SPL_THEME4
Sum of series for
Housing/Transport
ation theme SVI
EPL_MUNIT + EPL_MOBIL +
EPL_CROWD + EPL_NOVEH +
EPL_GROUPQ
RPL_THEME4
Percentile ranking
for
Housing/Transport
ation theme SVI
In Excel: PERCENTRANK.INC on
SPL_THEME4 array with 4
significant digits
19
2014 VARIABLE
NAME 2014 DESCRIPTION
CENSUS or
SVI TABLE(S) TABLE FIELD CALCULATION CALCULATION DESCRIPTION NOTES
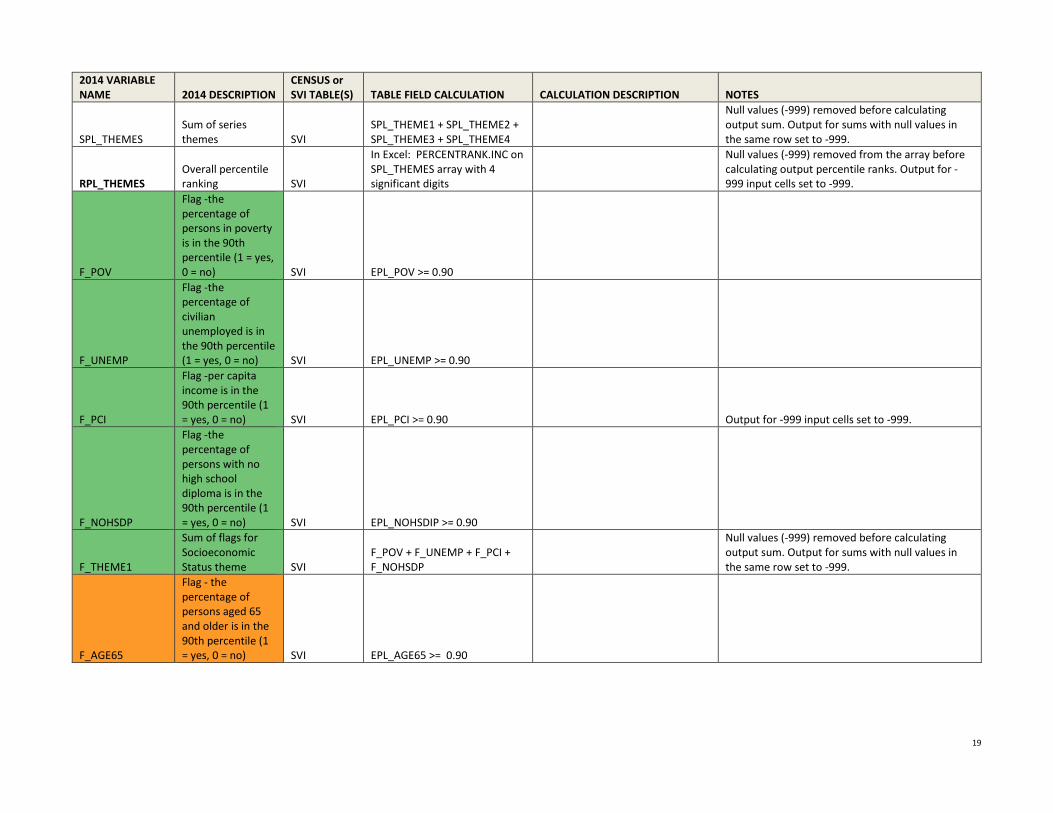
SPL_THEMES
Sum of series
themes SVI
SPL_THEME1 + SPL_THEME2 +
SPL_THEME3 + SPL_THEME4
Null values (-999) removed before calculating
output sum. Output for sums with null values in
the same row set to -999.
RPL_THEMES
Overall percentile
ranking SVI
In Excel: PERCENTRANK.INC on
SPL_THEMES array with 4
significant digits
Null values (-999) removed from the array before
calculating output percentile ranks. Output for -
999 input cells set to -999.
F_POV
Flag -the
percentage of
persons in poverty
is in the 90th
percentile (1 = yes,
0 = no) SVI EPL_POV >= 0.90
F_UNEMP
Flag -the
percentage of
civilian
unemployed is in
the 90th percentile
(1 = yes, 0 = no) SVI EPL_UNEMP >= 0.90
F_PCI
Flag -per capita
income is in the
90th percentile (1
= yes, 0 = no) SVI EPL_PCI >= 0.90 Output for -999 input cells set to -999.
F_NOHSDP
Flag -the
percentage of
persons with no
high school
diploma is in the
90th percentile (1
= yes, 0 = no) SVI EPL_NOHSDIP >= 0.90
F_THEME1
Sum of flags for
Socioeconomic
Status theme SVI
F_POV + F_UNEMP + F_PCI +
F_NOHSDP
Null values (-999) removed before calculating
output sum. Output for sums with null values in
the same row set to -999.
F_AGE65
Flag - the
percentage of
persons aged 65
and older is in the
90th percentile (1
= yes, 0 = no) SVI EPL_AGE65 >= 0.90

20
2014 VARIABLE
NAME 2014 DESCRIPTION
CENSUS or
SVI TABLE(S) TABLE FIELD CALCULATION CALCULATION DESCRIPTION NOTES
F_AGE17
Flag - the
percentage of
persons aged 17
and younger is in
the 90th percentile
(1 = yes, 0 = no) SVI EPL_AGE17 >= 0.90
F_DISABL
Flag - the
percentage of
persons with a
disability is in the
90th percentile (1
= yes, 0 = no) SVI EPL_DISABL >= 0.90
F_SNGPNT
Flag - the
percentage of
single parent
households is in
the 90th percentile
(1 = yes, 0 = no) SVI EPL_SNGPNT >= 0.90
F_THEME2
Sum of flags for
Household
Composition
theme SVI
F_AGE65 + F_AGE17 +
F_DISABL + F_SNGPNT
F_MINRTY
Flag - the
percentage of
minority is in the
90th percentile (1
= yes, 0 = no) SVI EPL_MINRTY >= 0.90
F_LIMENG
Flag - the
percentage those
with limited
English is in the
90th percentile (1
= yes, 0 = no) SVI EPL_LIMENG >= 0.90
F_THEME3
Sum of flags for
Minority
Status/Language
theme SVI F_MINRTY + F_LIMENG
21
2014 VARIABLE
NAME 2014 DESCRIPTION
CENSUS or
SVI TABLE(S) TABLE FIELD CALCULATION CALCULATION DESCRIPTION NOTES
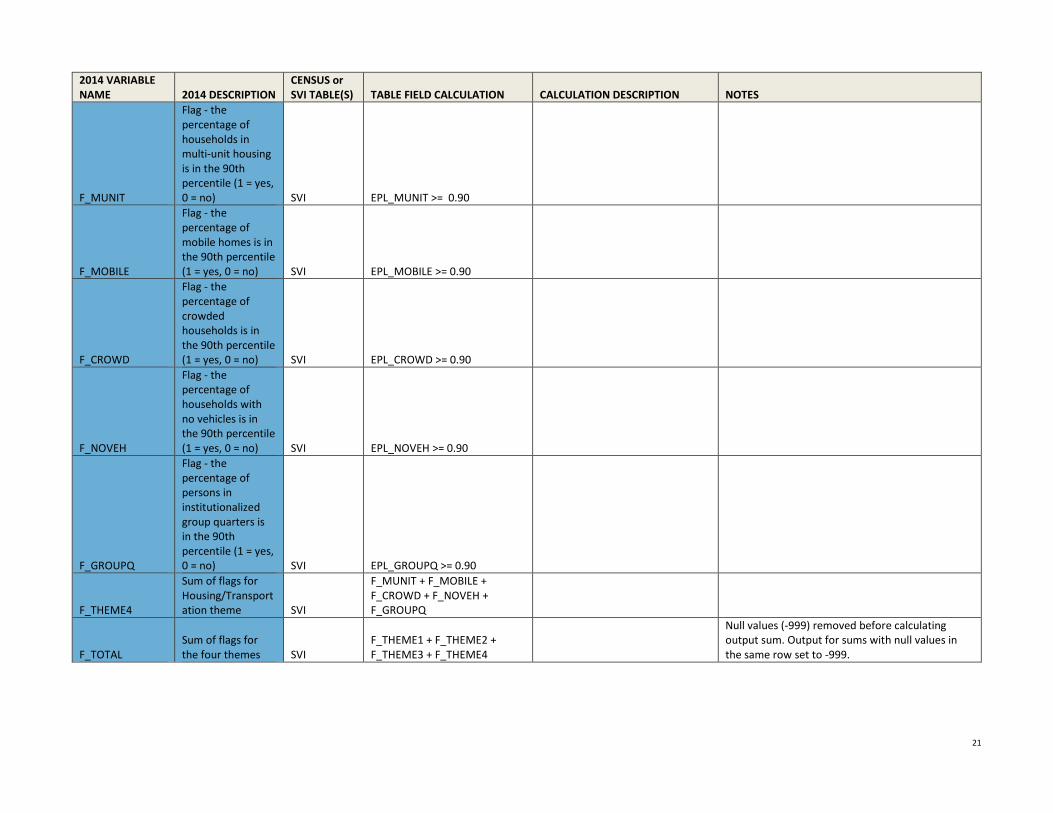
F_MUNIT
Flag - the
percentage of
households in
multi-unit housing
is in the 90th
percentile (1 = yes,
0 = no) SVI EPL_MUNIT >= 0.90
F_MOBILE
Flag - the
percentage of
mobile homes is in
the 90th percentile
(1 = yes, 0 = no) SVI EPL_MOBILE >= 0.90
F_CROWD
Flag - the
percentage of
crowded
households is in
the 90th percentile
(1 = yes, 0 = no) SVI EPL_CROWD >= 0.90
F_NOVEH
Flag - the
percentage of
households with
no vehicles is in
the 90th percentile
(1 = yes, 0 = no) SVI EPL_NOVEH >= 0.90
F_GROUPQ
Flag - the
percentage of
persons in
institutionalized
group quarters is
in the 90th
percentile (1 = yes,
0 = no) SVI EPL_GROUPQ >= 0.90
F_THEME4
Sum of flags for
Housing/Transport
ation theme SVI
F_MUNIT + F_MOBILE +
F_CROWD + F_NOVEH +
F_GROUPQ
F_TOTAL
Sum of flags for
the four themes SVI
F_THEME1 + F_THEME2 +
F_THEME3 + F_THEME4
Null values (-999) removed before calculating
output sum. Output for sums with null values in
the same row set to -999.

22
2014 VARIABLE
NAME 2014 DESCRIPTION
CENSUS or
SVI TABLE(S) TABLE FIELD CALCULATION CALCULATION DESCRIPTION NOTES
E_UNINSUR
Adjunct variable -
Uninsured in the
total civilian
noninstitutionalize
d population
estimate, 2010-
2014 ACS S2701 HC02_EST_VC01
M_UNINSUR
Adjunct variable -
Uninsured in the
total civilian
noninstitutionalize
d population
estimate MOE,
2010-2014 ACS S2701 HC02_MOE_VC01
EP_UNINSUR
Adjunct variable -
Percentage
uninsured in the
total civilian
noninstitutionalize
d population
estimate, 2010-
2014 ACS S2701 HC03_EST_VC01
MP_UNINSUR
Adjunct variable -
Percentage
uninsured in the
total civilian
noninstitutionalize
d population
estimate MOE,
2010-2014 ACS S2701 HC03_MOE_VC01
23
2014 VARIABLE
NAME 2014 DESCRIPTION
CENSUS or
SVI TABLE(S) TABLE FIELD CALCULATION CALCULATION DESCRIPTION NOTES
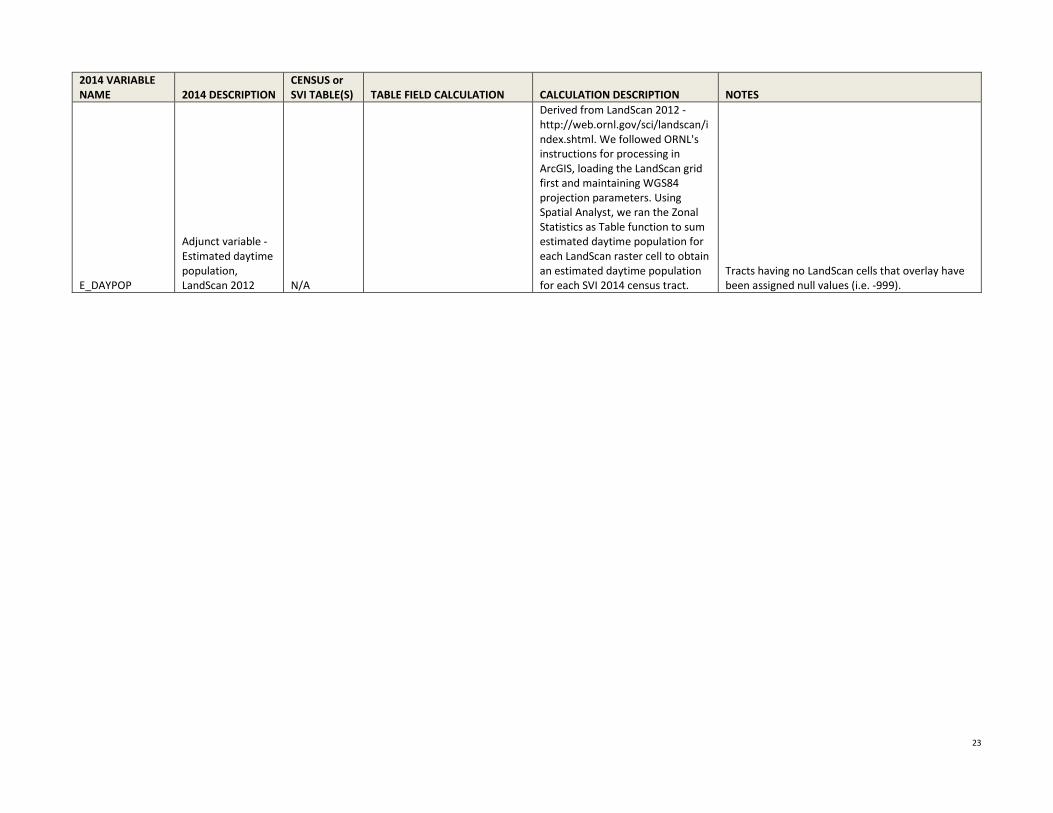
E_DAYPOP
Adjunct variable -
Estimated daytime
population,
LandScan 2012 N/A
Derived from LandScan 2012 -
http://web.ornl.gov/sci/landscan/i
ndex.shtml. We followed ORNL's
instructions for processing in
ArcGIS, loading the LandScan grid
first and maintaining WGS84
projection parameters. Using
Spatial Analyst, we ran the Zonal
Statistics as Table function to sum
estimated daytime population for
each LandScan raster cell to obtain
an estimated daytime population
for each SVI 2014 census tract.
Tracts having no LandScan cells that overlay have
been assigned null values (i.e. -999).
24
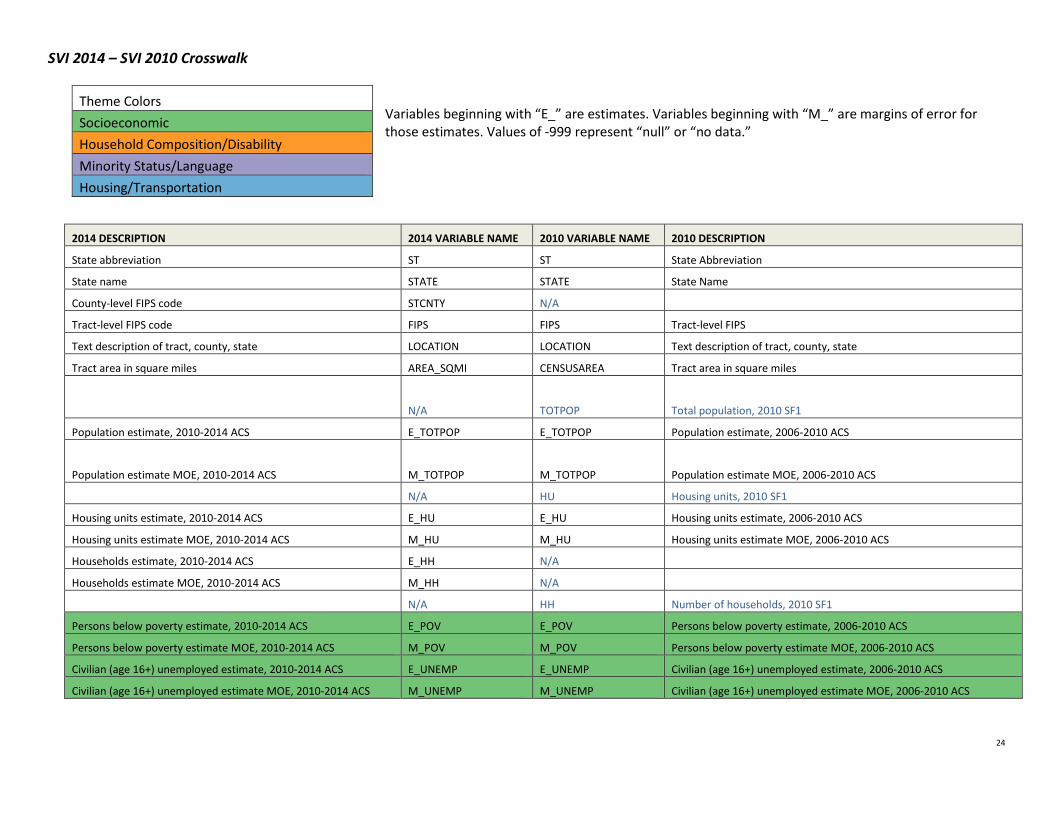
SVI 2014 – SVI 2010 Crosswalk
Variables beginning with “E_” are estimates. Variables beginning with “M_” are margins of error for
those estimates. Values of -999 represent “null” or “no data.”
2014 DESCRIPTION 2014 VARIABLE NAME 2010 VARIABLE NAME 2010 DESCRIPTION
State abbreviation ST ST State Abbreviation
State name STATE STATE State Name
County-level FIPS code STCNTY N/A
Tract-level FIPS code FIPS FIPS Tract-level FIPS
Text description of tract, county, state LOCATION LOCATION Text description of tract, county, state
Tract area in square miles AREA_SQMI CENSUSAREA Tract area in square miles
N/A TOTPOP Total population, 2010 SF1
Population estimate, 2010-2014 ACS E_TOTPOP E_TOTPOP Population estimate, 2006-2010 ACS
Population estimate MOE, 2010-2014 ACS M_TOTPOP M_TOTPOP Population estimate MOE, 2006-2010 ACS
N/A HU Housing units, 2010 SF1
Housing units estimate, 2010-2014 ACS E_HU E_HU Housing units estimate, 2006-2010 ACS
Housing units estimate MOE, 2010-2014 ACS M_HU M_HU Housing units estimate MOE, 2006-2010 ACS
Households estimate, 2010-2014 ACS E_HH N/A
Households estimate MOE, 2010-2014 ACS M_HH N/A
N/A HH Number of households, 2010 SF1
Persons below poverty estimate, 2010-2014 ACS E_POV E_POV Persons below poverty estimate, 2006-2010 ACS
Persons below poverty estimate MOE, 2010-2014 ACS M_POV M_POV Persons below poverty estimate MOE, 2006-2010 ACS
Civilian (age 16+) unemployed estimate, 2010-2014 ACS E_UNEMP E_UNEMP Civilian (age 16+) unemployed estimate, 2006-2010 ACS
Civilian (age 16+) unemployed estimate MOE, 2010-2014 ACS M_UNEMP M_UNEMP Civilian (age 16+) unemployed estimate MOE, 2006-2010 ACS
Theme Colors
Socioeconomic
Household Composition/Disability
Minority Status/Language
Housing/Transportation

25
2014 DESCRIPTION 2014 VARIABLE NAME 2010 VARIABLE NAME 2010 DESCRIPTION
Per capita income estimate, 2010-2014 ACS E_PCI E_PCI Per capita income estimate, 2006-2010 ACS
Per capita income estimate MOE, 2010-2014 ACS M_PCI M_PCI Per capita income estimate MOE, 2006-2010 ACS
Persons (age 25+) with no high school diploma estimate, 2010-
2014 ACS E_NOHSDP E_NOHSDIP
Persons (age 25+) with no high school diploma estimate, 2006-2010
ACS
Persons (age 25+) with no high school diploma estimate MOE,
2010-2014 ACS M_NOHSDP M_NOHSDIP
Persons (age 25+) with no high school diploma estimate MOE, 2006-
2010 ACS
N/A AGE65 Persons aged 65 and older, 2010 SF1
N/A AGE17 Persons aged 17 and younger, 2010 SF1
N/A SNGPRNT Single parent household with children under 18, 2010 SF1
Persons aged 65 and older estimate, 2010-2014 ACS E_AGE65 N/A
Persons aged 65 and older estimate MOE, 2010-2014 ACS M_AGE65 N/A
Persons aged 17 and younger estimate, 2010-2014 ACS E_AGE17 N/A
Persons aged 17 and younger estimate MOE, 2010-2014 ACS M_AGE17 N/A
Civilian noninstitutionalized population with a disability estimate,
2010-2014 ACS E_DISABL N/A
Civilian noninstitutionalized population with a disability estimate
MOE, 2010-2014 ACS M_DISABL N/A
Single parent household with children under 18 estimate, 2010-
2014 ACS E_SNGPNT N/A
Single parent household with children under 18 estimate MOE,
2010-2014 ACS M_SNGPNT N/A
N/A MINORITY Minority (all persons except white, non-Hispanic), 2010 SF1
Minority (all persons except white, non-Hispanic) estimate, 2010-
2014 ACS E_MINRTY N/A
Minority (all persons except white, non-Hispanic) estimate MOE,
2010-2014 ACS E_MINRTY N/A
Persons (age 5+) who speak English "less than well" estimate,
2010-2014 ACS E_LIMENG E_LIMENG
Persons (age 5+) who speak English "less than well" estimate, 2006-
2010 ACS
Persons (age 5+) who speak English "less than well" estimate
MOE, 2010-2014 ACS M_LIMENG M_LIMENG
Persons (age 5+) who speak English "less than well" estimate MOE,
2006-2010 ACS
26
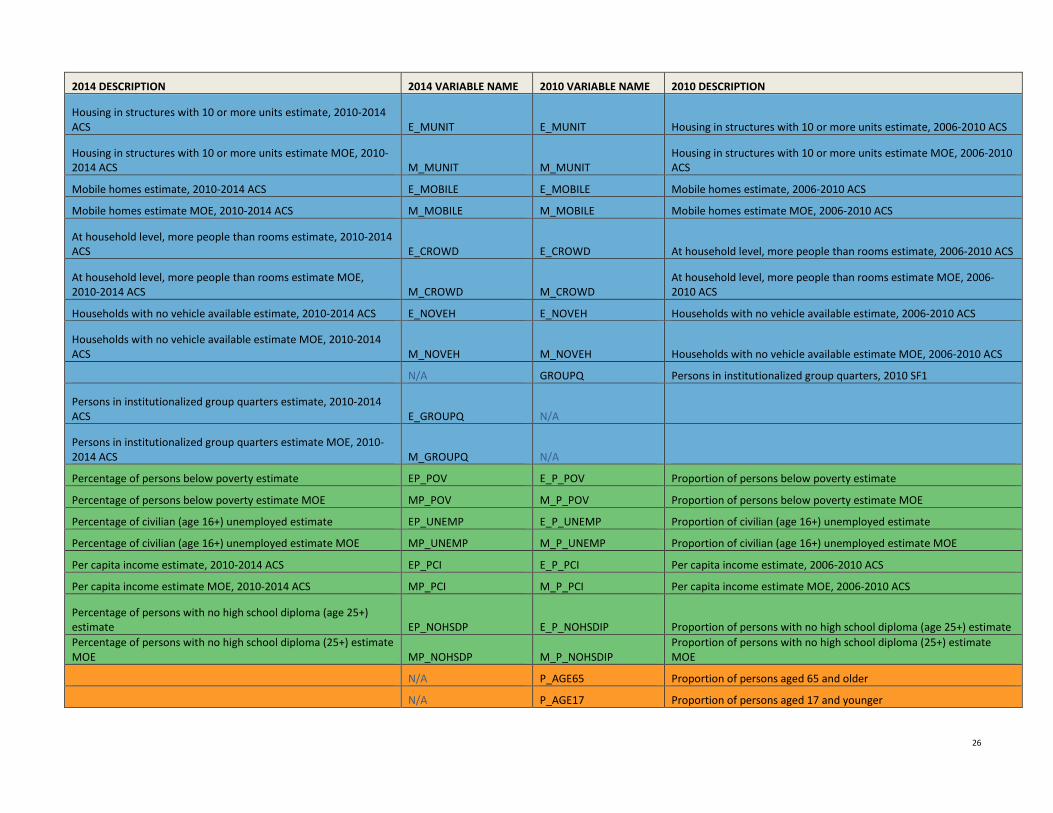
2014 DESCRIPTION 2014 VARIABLE NAME 2010 VARIABLE NAME 2010 DESCRIPTION
Housing in structures with 10 or more units estimate, 2010-2014
ACS E_MUNIT E_MUNIT Housing in structures with 10 or more units estimate, 2006-2010 ACS
Housing in structures with 10 or more units estimate MOE, 2010-
2014 ACS M_MUNIT M_MUNIT
Housing in structures with 10 or more units estimate MOE, 2006-2010
ACS
Mobile homes estimate, 2010-2014 ACS E_MOBILE E_MOBILE Mobile homes estimate, 2006-2010 ACS
Mobile homes estimate MOE, 2010-2014 ACS M_MOBILE M_MOBILE Mobile homes estimate MOE, 2006-2010 ACS
At household level, more people than rooms estimate, 2010-2014
ACS E_CROWD E_CROWD At household level, more people than rooms estimate, 2006-2010 ACS
At household level, more people than rooms estimate MOE,
2010-2014 ACS M_CROWD M_CROWD
At household level, more people than rooms estimate MOE, 2006-
2010 ACS
Households with no vehicle available estimate, 2010-2014 ACS E_NOVEH E_NOVEH Households with no vehicle available estimate, 2006-2010 ACS
Households with no vehicle available estimate MOE, 2010-2014
ACS M_NOVEH M_NOVEH Households with no vehicle available estimate MOE, 2006-2010 ACS
N/A GROUPQ Persons in institutionalized group quarters, 2010 SF1
Persons in institutionalized group quarters estimate, 2010-2014
ACS E_GROUPQ N/A
Persons in institutionalized group quarters estimate MOE, 2010-
2014 ACS M_GROUPQ N/A
Percentage of persons below poverty estimate EP_POV E_P_POV Proportion of persons below poverty estimate
Percentage of persons below poverty estimate MOE MP_POV M_P_POV Proportion of persons below poverty estimate MOE
Percentage of civilian (age 16+) unemployed estimate EP_UNEMP E_P_UNEMP Proportion of civilian (age 16+) unemployed estimate
Percentage of civilian (age 16+) unemployed estimate MOE MP_UNEMP M_P_UNEMP Proportion of civilian (age 16+) unemployed estimate MOE
Per capita income estimate, 2010-2014 ACS EP_PCI E_P_PCI Per capita income estimate, 2006-2010 ACS
Per capita income estimate MOE, 2010-2014 ACS MP_PCI M_P_PCI Per capita income estimate MOE, 2006-2010 ACS
Percentage of persons with no high school diploma (age 25+)
estimate EP_NOHSDP E_P_NOHSDIP Proportion of persons with no high school diploma (age 25+) estimate
Percentage of persons with no high school diploma (25+) estimate
MOE MP_NOHSDP M_P_NOHSDIP
Proportion of persons with no high school diploma (25+) estimate
MOE
N/A P_AGE65 Proportion of persons aged 65 and older
N/A P_AGE17 Proportion of persons aged 17 and younger
27
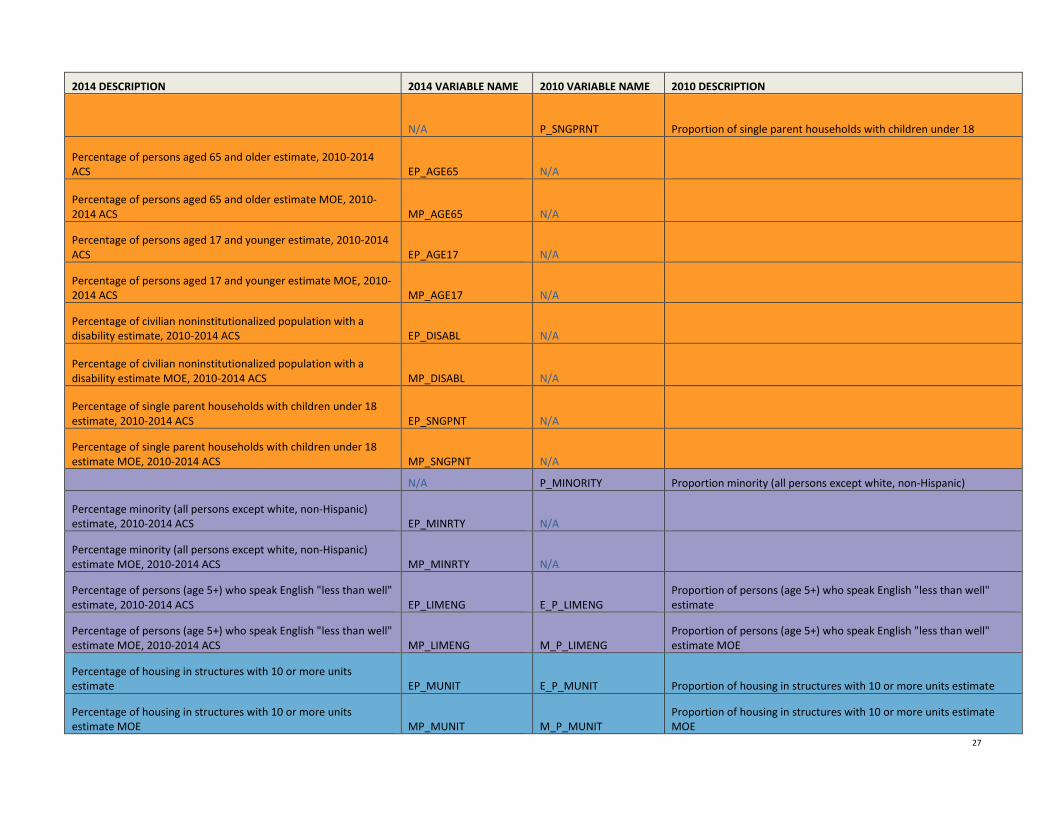
2014 DESCRIPTION 2014 VARIABLE NAME 2010 VARIABLE NAME 2010 DESCRIPTION
N/A P_SNGPRNT Proportion of single parent households with children under 18
Percentage of persons aged 65 and older estimate, 2010-2014
ACS EP_AGE65 N/A
Percentage of persons aged 65 and older estimate MOE, 2010-
2014 ACS MP_AGE65 N/A
Percentage of persons aged 17 and younger estimate, 2010-2014
ACS EP_AGE17 N/A
Percentage of persons aged 17 and younger estimate MOE, 2010-
2014 ACS MP_AGE17 N/A
Percentage of civilian noninstitutionalized population with a
disability estimate, 2010-2014 ACS EP_DISABL N/A
Percentage of civilian noninstitutionalized population with a
disability estimate MOE, 2010-2014 ACS MP_DISABL N/A
Percentage of single parent households with children under 18
estimate, 2010-2014 ACS EP_SNGPNT N/A
Percentage of single parent households with children under 18
estimate MOE, 2010-2014 ACS MP_SNGPNT N/A
N/A P_MINORITY Proportion minority (all persons except white, non-Hispanic)
Percentage minority (all persons except white, non-Hispanic)
estimate, 2010-2014 ACS EP_MINRTY N/A
Percentage minority (all persons except white, non-Hispanic)
estimate MOE, 2010-2014 ACS MP_MINRTY N/A
Percentage of persons (age 5+) who speak English "less than well"
estimate, 2010-2014 ACS EP_LIMENG E_P_LIMENG
Proportion of persons (age 5+) who speak English "less than well"
estimate
Percentage of persons (age 5+) who speak English "less than well"
estimate MOE, 2010-2014 ACS MP_LIMENG M_P_LIMENG
Proportion of persons (age 5+) who speak English "less than well"
estimate MOE
Percentage of housing in structures with 10 or more units
estimate EP_MUNIT E_P_MUNIT Proportion of housing in structures with 10 or more units estimate
Percentage of housing in structures with 10 or more units
estimate MOE MP_MUNIT M_P_MUNIT
Proportion of housing in structures with 10 or more units estimate
MOE

28
2014 DESCRIPTION 2014 VARIABLE NAME 2010 VARIABLE NAME 2010 DESCRIPTION
Percentage of mobile homes estimate EP_MOBILE E_P_MOBILE Proportion of mobile homes estimate
Percentage of mobile homes estimate MOE MP_MOBILE M_P_MOBILE Proportion of mobile homes estimate MOE
Percentage of households with more people than rooms estimate EP_CROWD E_P_CROWD Proportion of households with more people than rooms estimate
Percentage of households with more people than rooms estimate
MOE MP_CROWD M_P_CROWD
Proportion of households with more people than rooms estimate
MOE
Percentage of households with no vehicle available estimate EP_NOVEH E_P_NOVEH Proportion of households with no vehicle available estimate
Percentage of households with no vehicle available estimate MOE MP_NOVEH M_P_NOVEH Proportion of households with no vehicle available estimate MOE
Percentage of persons in institutionalized group quarters N/A P_GROUPQ Proportion of persons in institutionalized group quarters
Percentage of persons in institutionalized group quarters
estimate, 2010-2014 ACS EP_GROUPQ N/A
Percentage of persons in institutionalized group quarters
estimate MOE, 2010-2014 ACS MP_GROUPQ N/A
Percentile percentage of persons below poverty estimate EPL_POV E_PL_POV
Percentile proportion of persons below poverty estimate, no
consideration of MOE
Percentile percentage of civilian (age 16+) unemployed estimate EPL_UNEMP E_PL_UNEMP
Percentile proportion of civilian (age 16+) unemployed estimate, no
consideration of MOE
Percentile per capita income estimate EPL_PCI E_PL_PCI Percentile per capita income estimate, no consideration of MOE
Percentile percentage of persons with no high school diploma
(age 25+) estimate EPL_NOHSDP E_PL_NOHSDIP
Percentile proportion of persons with no high school diploma (age
25+) estimate, no consideration of MOE
Sum of series for Socioeconomic theme SPL_THEME1 S_PL_THEME1 Sum of EPLxxx series for Socioeconomic theme
Percentile ranking for Socioeconomic theme summary RPL_THEME1 R_PL_THEME1 Percentile ranking for Socioeconomic theme summary
N/A PL_AGE65 Percentile proportion of persons aged 65 and older
N/A PL_AGE17 Percentile proportion of persons aged 17 and younger
N/A PL_SNGPRNT
Percentile proportion of single parent households with children under
18
Percentile percentage of persons aged 65 and older estimate EPL_AGE65 N/A
Percentile percentage of persons aged 17 and younger estimate EPL_AGE17 N/A
29
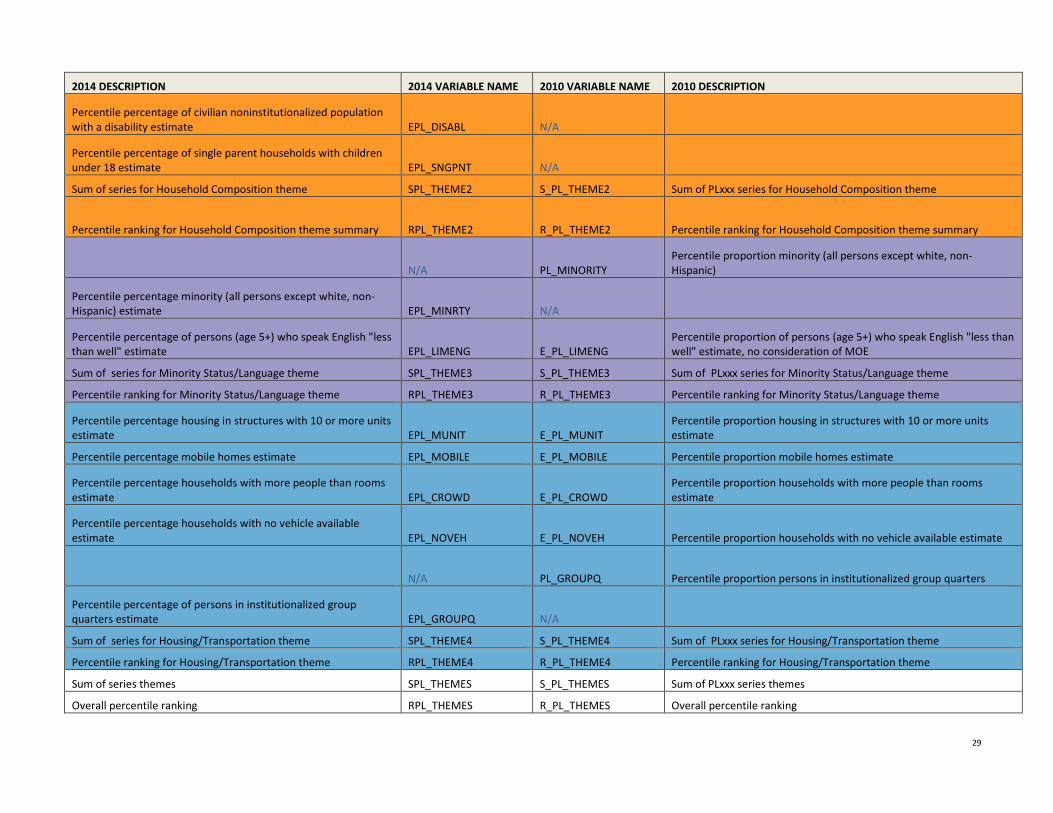
2014 DESCRIPTION 2014 VARIABLE NAME 2010 VARIABLE NAME 2010 DESCRIPTION
Percentile percentage of civilian noninstitutionalized population
with a disability estimate EPL_DISABL N/A
Percentile percentage of single parent households with children
under 18 estimate EPL_SNGPNT N/A
Sum of series for Household Composition theme SPL_THEME2 S_PL_THEME2 Sum of PLxxx series for Household Composition theme
Percentile ranking for Household Composition theme summary RPL_THEME2 R_PL_THEME2 Percentile ranking for Household Composition theme summary
N/A PL_MINORITY
Percentile proportion minority (all persons except white, non-
Hispanic)
Percentile percentage minority (all persons except white, non-
Hispanic) estimate EPL_MINRTY N/A
Percentile percentage of persons (age 5+) who speak English "less
than well" estimate EPL_LIMENG E_PL_LIMENG
Percentile proportion of persons (age 5+) who speak English "less than
well" estimate, no consideration of MOE
Sum of series for Minority Status/Language theme SPL_THEME3 S_PL_THEME3 Sum of PLxxx series for Minority Status/Language theme
Percentile ranking for Minority Status/Language theme RPL_THEME3 R_PL_THEME3 Percentile ranking for Minority Status/Language theme
Percentile percentage housing in structures with 10 or more units
estimate EPL_MUNIT E_PL_MUNIT
Percentile proportion housing in structures with 10 or more units
estimate
Percentile percentage mobile homes estimate EPL_MOBILE E_PL_MOBILE Percentile proportion mobile homes estimate
Percentile percentage households with more people than rooms
estimate EPL_CROWD E_PL_CROWD
Percentile proportion households with more people than rooms
estimate
Percentile percentage households with no vehicle available
estimate EPL_NOVEH E_PL_NOVEH Percentile proportion households with no vehicle available estimate
N/A PL_GROUPQ Percentile proportion persons in institutionalized group quarters
Percentile percentage of persons in institutionalized group
quarters estimate EPL_GROUPQ N/A
Sum of series for Housing/Transportation theme SPL_THEME4 S_PL_THEME4 Sum of PLxxx series for Housing/Transportation theme
Percentile ranking for Housing/Transportation theme RPL_THEME4 R_PL_THEME4 Percentile ranking for Housing/Transportation theme
Sum of series themes SPL_THEMES S_PL_THEMES Sum of PLxxx series themes
Overall percentile ranking RPL_THEMES R_PL_THEMES Overall percentile ranking
30
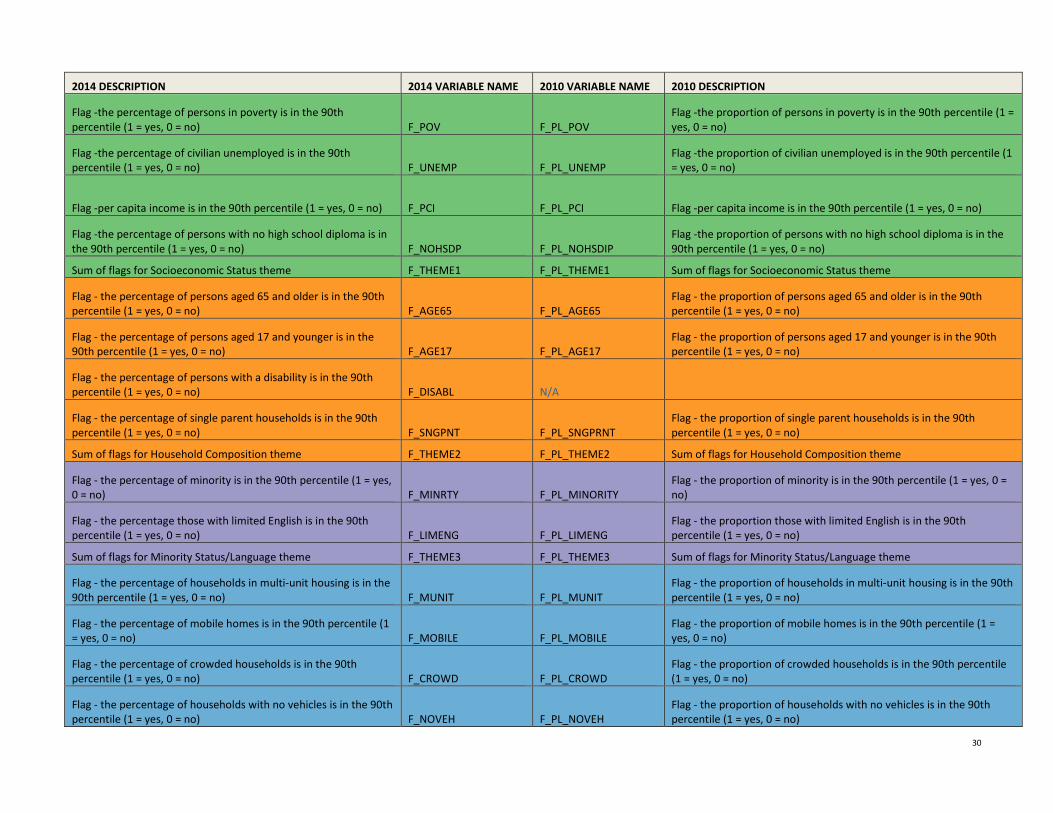
2014 DESCRIPTION 2014 VARIABLE NAME 2010 VARIABLE NAME 2010 DESCRIPTION
Flag -the percentage of persons in poverty is in the 90th
percentile (1 = yes, 0 = no) F_POV F_PL_POV
Flag -the proportion of persons in poverty is in the 90th percentile (1 =
yes, 0 = no)
Flag -the percentage of civilian unemployed is in the 90th
percentile (1 = yes, 0 = no) F_UNEMP F_PL_UNEMP
Flag -the proportion of civilian unemployed is in the 90th percentile (1
= yes, 0 = no)
Flag -per capita income is in the 90th percentile (1 = yes, 0 = no) F_PCI F_PL_PCI Flag -per capita income is in the 90th percentile (1 = yes, 0 = no)
Flag -the percentage of persons with no high school diploma is in
the 90th percentile (1 = yes, 0 = no) F_NOHSDP F_PL_NOHSDIP
Flag -the proportion of persons with no high school diploma is in the
90th percentile (1 = yes, 0 = no)
Sum of flags for Socioeconomic Status theme F_THEME1 F_PL_THEME1 Sum of flags for Socioeconomic Status theme
Flag - the percentage of persons aged 65 and older is in the 90th
percentile (1 = yes, 0 = no) F_AGE65 F_PL_AGE65
Flag - the proportion of persons aged 65 and older is in the 90th
percentile (1 = yes, 0 = no)
Flag - the percentage of persons aged 17 and younger is in the
90th percentile (1 = yes, 0 = no) F_AGE17 F_PL_AGE17
Flag - the proportion of persons aged 17 and younger is in the 90th
percentile (1 = yes, 0 = no)
Flag - the percentage of persons with a disability is in the 90th
percentile (1 = yes, 0 = no) F_DISABL N/A
Flag - the percentage of single parent households is in the 90th
percentile (1 = yes, 0 = no) F_SNGPNT F_PL_SNGPRNT
Flag - the proportion of single parent households is in the 90th
percentile (1 = yes, 0 = no)
Sum of flags for Household Composition theme F_THEME2 F_PL_THEME2 Sum of flags for Household Composition theme
Flag - the percentage of minority is in the 90th percentile (1 = yes,
0 = no) F_MINRTY F_PL_MINORITY
Flag - the proportion of minority is in the 90th percentile (1 = yes, 0 =
no)
Flag - the percentage those with limited English is in the 90th
percentile (1 = yes, 0 = no) F_LIMENG F_PL_LIMENG
Flag - the proportion those with limited English is in the 90th
percentile (1 = yes, 0 = no)
Sum of flags for Minority Status/Language theme F_THEME3 F_PL_THEME3 Sum of flags for Minority Status/Language theme
Flag - the percentage of households in multi-unit housing is in the
90th percentile (1 = yes, 0 = no) F_MUNIT F_PL_MUNIT
Flag - the proportion of households in multi-unit housing is in the 90th
percentile (1 = yes, 0 = no)
Flag - the percentage of mobile homes is in the 90th percentile (1
= yes, 0 = no) F_MOBILE F_PL_MOBILE
Flag - the proportion of mobile homes is in the 90th percentile (1 =
yes, 0 = no)
Flag - the percentage of crowded households is in the 90th
percentile (1 = yes, 0 = no) F_CROWD F_PL_CROWD
Flag - the proportion of crowded households is in the 90th percentile
(1 = yes, 0 = no)
Flag - the percentage of households with no vehicles is in the 90th
percentile (1 = yes, 0 = no) F_NOVEH F_PL_NOVEH
Flag - the proportion of households with no vehicles is in the 90th
percentile (1 = yes, 0 = no)
31
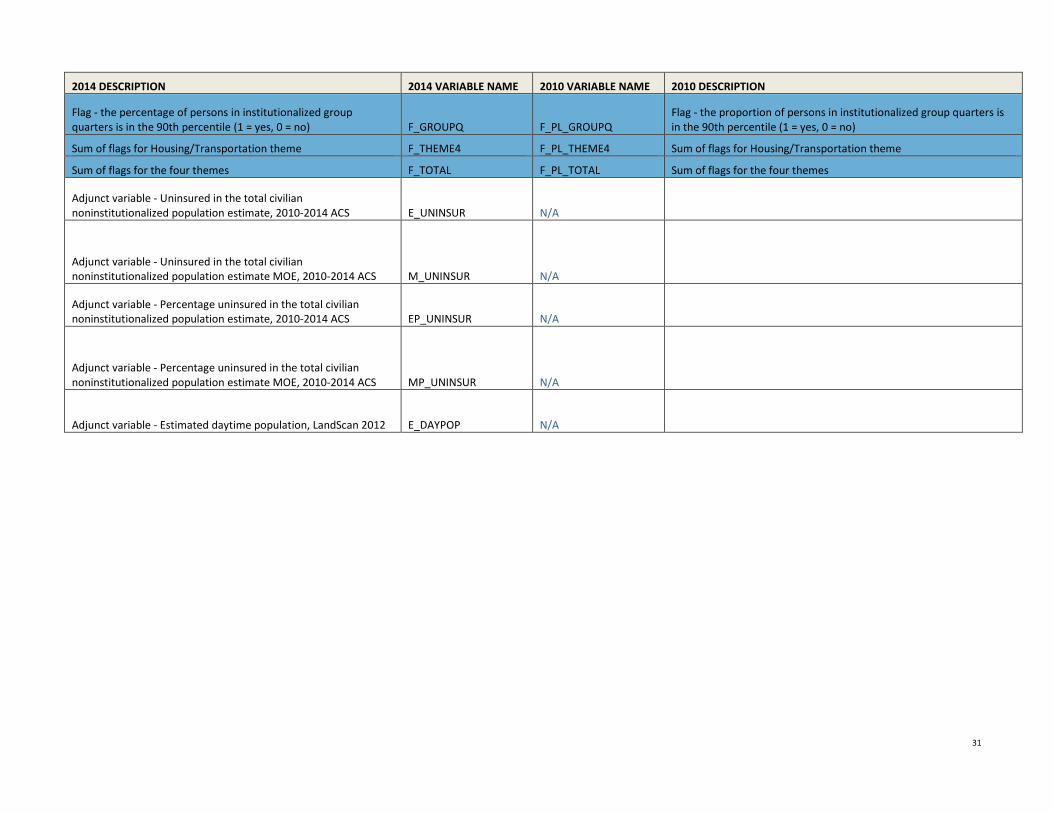
2014 DESCRIPTION 2014 VARIABLE NAME 2010 VARIABLE NAME 2010 DESCRIPTION
Flag - the percentage of persons in institutionalized group
quarters is in the 90th percentile (1 = yes, 0 = no) F_GROUPQ F_PL_GROUPQ
Flag - the proportion of persons in institutionalized group quarters is
in the 90th percentile (1 = yes, 0 = no)
Sum of flags for Housing/Transportation theme F_THEME4 F_PL_THEME4 Sum of flags for Housing/Transportation theme
Sum of flags for the four themes F_TOTAL F_PL_TOTAL Sum of flags for the four themes
Adjunct variable - Uninsured in the total civilian
noninstitutionalized population estimate, 2010-2014 ACS E_UNINSUR N/A
Adjunct variable - Uninsured in the total civilian
noninstitutionalized population estimate MOE, 2010-2014 ACS M_UNINSUR N/A
Adjunct variable - Percentage uninsured in the total civilian
noninstitutionalized population estimate, 2010-2014 ACS EP_UNINSUR N/A
Adjunct variable - Percentage uninsured in the total civilian
noninstitutionalized population estimate MOE, 2010-2014 ACS MP_UNINSUR N/A
Adjunct variable - Estimated daytime population, LandScan 2012 E_DAYPOP N/A