swd 230 vce bench for pdf · prep – 10 vce provision time allocated to each key learning area...
TRANSCRIPT

V C EV I C T O R I A N C E R T I F I C A T E
O F E D U C A T I O N
B E N C H M A R K S
S T A N D A R D S A N D
A C C O U N T A B I L I T Y
Q U A L I T Y A S S U R A N C E I N
V I C T O R I A N S C H O O L S
2000

VCE Benchmarks 2000
Published by the Department of
Education, Employment and Training,
Victoria
© State of Victoria, 2001
ISBN 0 7594 0187 X
Published by the Community
Information Service for Standards and
Accountability, a Division of the Office
of School Education, Department of
Education, Employment and Training,
GPO Box 4367
Melbourne Vic. 3001
Australia.
The Department of Education,
Employment and Training welcomes any
use of this publication within the
constraints of the Copyright Act.
Provided acknowledgment is made to the
source, Victorian government and
nongovernment schools are permitted to
copy material freely for the purpose of
teaching students in schools, or for
communication with parents and others
in the community. When a charge is
authorised for supplying material, such
charge shall be limited to direct costs
only. When the material is sold for
profit, then written authority must first
be obtained.
Address inquiries to:
The Manager
Copyright Services
GPO Box 4367
Melbourne Vic. 3001
Australia.

C O N T E N T S
Introduction 3
School performance benchmarks 2000 4
Student achievement VCE 2000 4
Interpretation of results 5
Making judgements 6
Distribution of all CATs for 2000 VCE results 7
Distribution of 2000 VCE study scores by study area 9
English 9
Further Mathematics 19
Mathematical Methods 29
Highest, average and lowest performing schools in each ‘like’ school group 39
Comparison of study score distribution by school type 45
Comparison of study score distribution by location 49
Comparison of study score distribution by region 53
Comparison of study score distribution by VCE cohort size and school location 57
Comparison of study score distribution for girls in coeducational
and all girl schools 61
Comparison of study score distribution for ‘like’ school group 3
and selected entry schools 65
Apparent Retention and Completion 69
Year 7 – 10 apparent retention by ‘like’ school group 70
Year 7 – 10 apparent retention by region 71
Year 7 – 10 apparent retention by gender 72
Year 11 – 12 apparent retention by ‘like’ school group 73
Year 11 – 12 apparent retention by region 74
Year 11 – 12 apparent retention by gender 75
Year 12 completion by ‘like’ school group 76
Year 12 completion by region 77
Year 12 completion by gender 78
Appendix 1 Apparent retention and completion: definition of terms 79
Appendix 2 ‘Like’ school groups 80
Identifying relevant ‘like’ school groups 84


[ 3 ]
The school annual report and the
triennial school review are the formal
framework for assessment of school
performance. They summarise the data
collected on each school’s achievement in
the delivery of its curriculum, the quality
of its student welfare and management
programs, its organisational health and
its relationships with its community.
They indicate the standards of learning
achieved by its students.
To support schools in monitoring and
improving their effectiveness, Standards
and Accountability publishes school
performance benchmarks each year. These
benchmarks analyse the actual levels of
performance reported by schools in their
annual reports. They do not, as some
commercial benchmarking frameworks
do, concentrate on the characteristics of
specific processes in order to identify
‘best practice’. Rather, they analyse the
results of school processes and help
schools to answer the question: ‘Is what
we have achieved good enough?’
School performance benchmarks address
this question by identifying performance
levels achieved by schools across the state
and presenting them so that individual
schools are able to compare their own
performance with the performance
achieved by their colleagues in other
schools. School performance benchmarks
are presented for all schools across the
state and in groups or categories of ‘like’
schools. The structure of the ‘like’
schools groupings and a method for
calculating which group an individual
school is in are described in Appendix 2.
For the 2000 data, nine ‘like’ school
groups are used. The ‘like’ school groups
are based on a three year average (1998 –
2000) of a school’s Educational
Maintenance Allowance (EMA)/Youth
Allowance (YA) and Language
Background other than English
(LBOTE). A listing of the schools in
each group is on the Standards and
Accountability website;
http://www.sofweb.vic.edu.au/a&d/
likesch.htm
The Victorian accountability
framework, Quality
Assurance in Victorian
Schools, aims to support
schools to improve their
effectiveness. It does this by
providing the framework
through which schools can learn
about the effectiveness of their
programs, their policies, their
processes and procedures.
I N T R O D U C T I O N

[ 4 ]
Staff opinion survey
Staff absence rates
Student accidents by location and
severity
Apparent retention of students from
Year 7 – 10
Apparent retention of students from
Year 11 – 12
Student completion, Year 12
Over time, the performance benchmarks
will develop in sophistication and also be
developed for Aboriginal and Torres
Strait Islander students, students whose
parents qualify for the EMA/YA and
In 2001, Standards and Accountability
are presenting the 2000 school
performance benchmarks in the
following areas:
Student achievement in the Victorian
Certificate of Education (VCE)
Student achievement in the Years
Prep – 10
VCE provision
Time allocated to each Key Learning
Area (KLA) by year level
Student absence rates
Student post school destinations, exit
Years 10, 11 and 12
In February each year Standards and
Accountability provides VCE data
directly to each government school.
The data include VCE results in:
English
Mathematics Methods
Further Mathematics
Performance by gender together with
the average performance of all
students in the State
Performance in each ‘like’ school group
Performance of students in each VCE
study undertaken by the school in
1998, 1999 and 2000 together with
the average performance of all
students in each ‘like’ school group.
The information on student achievement
in the VCE outlined in this publication
relates to Common Assessment Task
(CAT) grades and performance in
English and Mathematics.
CAT grades across all studies for all
Victorian Government school VCE
students are given in both tabular and
graphical form. These representations
show the proportion of A+, A, B+,
and other grades in all studies for all
Government school VCE students
expressed as a percentage of all
grades awarded.
Data is also provided for VCE English,
Mathematical Methods and Further
Mathematics. The performance of all
students in government schools for each
of the three studies is presented, together
with the average performance of all
students in each ‘like’ school group.
In addition to the data provided in 2000
described above, the relative performance
of the average, highest and lowest school
for each ‘like’ school group is provided.
School performance in the VCE is always
considered in the context of student
retention. Data on 2000 apparent
retention rates between Years 7 and 10,
Years 11 to 12 and Year 12 completion
can be found on the Standards and
Accountability website;
http://www.sofweb.vic.edu.au/a&d/
students who speak a language other than
English at home. It is expected that
national and international benchmarks
will also become available.
Schools can also learn about their
effectiveness by comparing their current
performance levels with their own past
performance. The school charter then
enables schools to plan for improved
achievements in key areas of their
operations and to set challenging
performance expectations for themselves.
S C H O O L P E R F O R M A N C E B E N C H M A R K S 2 0 0 0
S T U D E N T A C H I E V E M E N T V C E 2 0 0 0

[ 5 ]
The school’s VCE results can
be interpreted by following a
simple procedure:
1. Compare the school’s distribution of
CAT grades with the state results.
(Note that the statewide CAT grade
distributions were sent to schools
with information about their VCE
results by Standards and
Accountability in February 2001).
Does the school’s distribution of
results fit the state profile or is the
distribution skewed positively or
negatively against the state profile?
What is the proportion of A+, A
and other grades achieved by the
school compared with the state profile?
2. Compare the school’s mean study
scores in English with the state mean.
The state results also give the standard
deviation for all the students in the
state. Sixty eight per cent of students
will score within the range plus and
minus one standard deviation from the
mean (the shaded rectangle). Sixteen
percent of students are in the top
section and the same proportion in
the lower section (see figure below).
3. Compare the school’s mean score and
standard deviation with the mean
score for the ‘like’ school group and
for the best performing school in the
group. The highest and lowest points
refer to the performance of individual
students. These are provided for
interest but have little comparative
value in terms of the performance
of an entire VCE cohort.
4. Note that when the number of
students undertaking a particular
study is small (ie fewer than 15) the
average study score is still reliable.
However, care needs to be taken in
considering the distribution; a few
high or low performing students
can distort the distribution.
5. Note that when comparing the
performance of boys and girls,
it is also the position of the mean
and the standard deviation that
should be considered.
6. Compare the performance of the
school with schools in other ‘like’
school groups with different student
population characteristics.
7. Repeat the procedure for
Mathematical Methods and Further
Mathematics
8. Other data, such as Year 12
completion and Years 11 – 12
apparent retention, VCE provision,
destination of exit students,
geographical location and type of
school will also add value to
judgements of VCE performance
and should also be considered.
I N T E R P R E T A T I O N O F R E S U L T S
Highest score (may be one student only)
68% of all students achieve in thisrange of + or – one standard deviation
Mean
Lowest score (may be one student only)
Figure 1. Distribution of VCE study scores.

[ 6 ]
The key questions to be answered in
consideration of the school’s VCE
results are:
Is the school’s performance
considered satisfactory?
Where is there scope for
improvement?
In developing answers to these questions
any available data on previous VCE
performance, Year 11 – 12 apparent
retention rate, the Year 12 completion
rate, the destination of exit students,
comparisons with ‘like’ schools and with
the state as a whole should all be taken
into account. Although VCE results
compared with schools with similar
student populations represent one
element of achievement, the proportions
of students in Years 10, 11, and 12 who
are able to find employment or places in
technical, further or higher education is
also an important achievement measure.
M A K I N G J U D G E M E N T S

[ 7 ]
D I S T R I B U T I O N O F A L L C A T S F O R
2 0 0 0 V C E R E S U L T S

[ 8 ]
DI
ST
RI
BU
TI
ON
OF
AL
LC
AT
SF
OR
20
00
V
CE
R
ES
UL
TS
TA
BL
E1
Co
unt
of
Gra
ded
and
U
G C
AT
sA
+A
B+
BC
+C
D+
DE
+E
UG
NA
Co
unt
of
all
CA
Ts
incl
udin
g N
A*
404,
694
11.1
%12
.9%
13.1
%13
.8%
13.9
%12
.4%
9.1%
6.2%
3.9%
2.3%
1.1%
7.8%
438,
807
0.0%
1.0%
2.0%
3.0%
4.0%
5.0%
6.0%
7.0%
8.0%
9.0%
10.0
%
11.0
%
12.0
%
13.0
%
14.0
%
15.0
%
A+
AB
+B
C+
CD
+D
E+
EU
GN
A
Lett
er G
rad
e
Percentage of Grades
*Per
cent
ages
for
A+
to
UG
are
bas
ed o
n th
e to
tal e
xclu
din
g N
A;
NA
per
cent
age
is p
erce
ntag
e of
tot
al in
clud
ing
NA
.

[ 9 ]
D I S T R I B U T I O N O F 2 0 0 0 V C E S T U D Y S C O R E S
B Y S T U D Y A R E A
E N G L I S H

[ 1 0 ]
ST
UD
YS
CO
RE
DI
ST
RI
BU
TI
ON
WI
TH
IN
TH
ES
PE
CI
FI
ED
ST
UD
YT
AB
LE
2 Stud
y:E
nglis
h‘L
ike’
scho
ols
grou
p:1
– N
il or
ver
y lo
w p
ropo
rtio
ns o
fLO
TE
spe
aker
s at
hom
e/L
ow p
ropo
rtio
ns o
fE
MA
or Y
outh
Allo
wan
ce r
ecip
ient
s
No
. Stu
den
tsM
axim
umM
ean
+ S
td.
Dev
iatio
nM
ean
Mea
n -
Std
. D
evia
tion
Min
imum
Sta
te r
esul
tsA
ll S
tud
ents
Fem
ales
Mal
es
‘Lik
e’ s
cho
ol r
esul
ts
(ave
rag
e fo
r g
roup
)
All
Stu
den
tsF
emal
esM
ales
‘Lik
e’ s
cho
ol r
esul
ts
(bes
t sc
hoo
l in
gro
up)
All
Stu
den
ts
Fem
ales
Mal
es
Sta
te R
esul
ts
05
101520253035404550
All
Stu
den
tsFe
mal
esM
ales
All
Stu
den
tsFe
mal
esM
ales
All
Stu
den
ts
Fem
ales
Mal
es
‘Lik
e’ S
choo
l Res
ults
(ave
rage
for
grou
p)
05
101520253035404550
‘Lik
e’ S
choo
l Res
ults
(bes
t sc
hool
in g
roup
)
05
101520253035404550
Study score
Study score
Study score
2433
350
35.0
28.3
21.5
513
460
5035
.929
.422
.95
1087
350
33.8
26.9
20.1
5
2194
5035
.129
.022
.99
1205
5036
.330
.424
.513
989
4633
.127
.321
.59
120
4737
.031
.225
.518
5442
37.5
32.5
27.4
2057
4536
.130
.825
.622
Max
imum
+ O
ne s
tand
ard
dev
iatio
n
Mea
n
- O
ne s
tand
ard
dev
iatio
n
Min
imum
KE
Y

[ 1 1 ]
ST
UD
YS
CO
RE
DI
ST
RI
BU
TI
ON
WI
TH
IN
TH
ES
PE
CI
FI
ED
ST
UD
YT
AB
LE
3 Stud
y:E
nglis
h‘L
ike’
scho
ol g
roup
:2
– L
ow p
ropo
rtio
ns o
fLO
TE
spea
kers
at
hom
e/lo
w p
ropo
rtio
ns o
fE
MA
or Y
outh
Allo
wan
ce r
ecip
ient
s
No
. Stu
den
tsM
axim
umM
ean
+ S
td.
Dev
iatio
nM
ean
Mea
n -
Std
. D
evia
tion
Min
imum
Sta
te r
esul
tsA
ll S
tud
ents
Fem
ales
Mal
es
‘Lik
e’ s
cho
ol r
esul
ts
(ave
rag
e fo
r g
roup
)
All
Stu
den
tsF
emal
esM
ales
‘Lik
e’ s
cho
ol r
esul
ts
(bes
t sc
hoo
l in
gro
up)
All
Stu
den
ts
Fem
ales
Mal
es
Sta
te R
esul
ts
05
101520253035404550
All
Stu
den
tsFe
mal
esM
ales
All
Stu
den
tsFe
mal
esM
ales
All
Stu
den
ts
Fem
ales
Mal
es
‘Lik
e’ S
choo
l Res
ults
(ave
rage
for
grou
p)
05
101520253035404550
‘Lik
e’ S
choo
l Res
ults
(bes
t sc
hool
in g
roup
)
05
101520253035404550
Study score
Study score
Study score
2433
350
35.0
28.3
21.5
513
460
5035
.929
.422
.95
1087
350
33.8
26.9
20.1
5
3017
5036
.530
.424
.311
1747
5037
.231
.225
.313
1270
5035
.429
.323
.211
139
5039
.634
.028
.320
7650
40.4
34.8
29.2
2763
4938
.533
.027
.520
Max
imum
+ O
ne s
tand
ard
dev
iatio
n
Mea
n
- O
ne s
tand
ard
dev
iatio
n
Min
imum
KE
Y

[ 1 2 ]
ST
UD
YS
CO
RE
DI
ST
RI
BU
TI
ON
WI
TH
IN
TH
ES
PE
CI
FI
ED
ST
UD
YT
AB
LE
4 Stud
y:E
nglis
h‘L
ike’
scho
ol g
roup
:3
– M
ediu
m t
o hi
gh p
ropo
rtio
ns o
fLO
TE
spea
kers
at
hom
e/L
ow p
ropo
rtio
ns o
fE
MA
or Y
outh
Allo
wan
ce r
ecip
ient
s
No
. Stu
den
tsM
axim
umM
ean
+ S
td.
Dev
iatio
nM
ean
Mea
n -
Std
. D
evia
tion
Min
imum
Sta
te r
esul
tsA
ll S
tud
ents
Fem
ales
Mal
es
‘Lik
e’ s
cho
ol r
esul
ts
(ave
rag
e fo
r g
roup
)
All
Stu
den
tsF
emal
esM
ales
‘Lik
e’ s
cho
ol r
esul
ts
(bes
t sc
hoo
l in
gro
up)
All
Stu
den
ts
Fem
ales
Mal
es
Sta
te R
esul
ts
05
101520253035404550
All
Stu
den
tsFe
mal
esM
ales
All
Stu
den
tsFe
mal
esM
ales
All
Stu
den
ts
Fem
ales
Mal
es
‘Lik
e’ S
choo
l Res
ults
(ave
rage
for
grou
p)
05
101520253035404550
‘Lik
e’ S
choo
l Res
ults
(bes
t sc
hool
in g
roup
)
05
101520253035404550
Study score
Study score
Study score
2433
350
35.0
28.3
21.5
513
460
5035
.929
.422
.95
1087
350
33.8
26.9
20.1
5
1003
5039
.632
.525
.410
525
5040
.433
.626
.711
478
4938
.531
.324
.210
241
5040
.634
.628
.618
9250
42.5
36.0
29.4
1211
749
40.1
34.4
28.6
21
Max
imum
+ O
ne s
tand
ard
dev
iatio
n
Mea
n
- O
ne s
tand
ard
dev
iatio
n
Min
imum
KE
Y

[ 1 3 ]
ST
UD
YS
CO
RE
DI
ST
RI
BU
TI
ON
WI
TH
IN
TH
ES
PE
CI
FI
ED
ST
UD
YT
AB
LE
5 Stud
y:E
nglis
h‘L
ike’
scho
ol g
roup
:4
– N
il or
ver
y lo
w p
ropo
rtio
ns o
fLO
TE
spea
kers
at
hom
e/M
ediu
m p
ropo
rtio
ns o
fE
MA
or Y
outh
Allo
wan
ce r
ecip
ient
s
No
. Stu
den
tsM
axim
umM
ean
+ S
td.
Dev
iatio
nM
ean
Mea
n -
Std
. D
evia
tion
Min
imum
Sta
te r
esul
tsA
ll S
tud
ents
Fem
ales
Mal
es
‘Lik
e’ s
cho
ol r
esul
ts
(ave
rag
e fo
r g
roup
)
All
Stu
den
tsF
emal
esM
ales
‘Lik
e’ s
cho
ol r
esul
ts
(bes
t sc
hoo
l in
gro
up)
All
Stu
den
ts
Fem
ales
Mal
es
Sta
te R
esul
ts
05
101520253035404550
All
Stu
den
tsFe
mal
esM
ales
All
Stu
den
tsFe
mal
esM
ales
All
Stu
den
ts
Fem
ales
Mal
es
‘Lik
e’ S
choo
l Res
ults
(ave
rage
for
grou
p)
05
101520253035404550
‘Lik
e’ S
choo
l Res
ults
(bes
t sc
hool
in g
roup
)
05
101520253035404550
Study score
Study score
Study score
2433
350
35.0
28.3
21.5
513
460
5035
.929
.422
.95
1087
350
33.8
26.9
20.1
5
5999
5034
.228
.121
.98
3345
5035
.229
.223
.29
2654
4732
.726
.620
.68
2245
38.1
33.8
29.4
2713
4038
.235
.132
.029
1339
36.2
32.9
29.7
27
Max
imum
+ O
ne s
tand
ard
dev
iatio
n
Mea
n
- O
ne s
tand
ard
dev
iatio
n
Min
imum
KE
Y

ST
UD
YS
CO
RE
DI
ST
RI
BU
TI
ON
WI
TH
IN
TH
ES
PE
CI
FI
ED
ST
UD
YT
AB
LE
6 Stud
y:E
nglis
h‘L
ike’
scho
ol g
roup
:5
– L
ow p
ropo
rtio
ns o
fLO
TE
spea
kers
at
hom
e/M
ediu
m p
ropo
rtio
ns o
fE
MA
or Y
outh
Allo
wan
ce r
ecip
ient
s
No
. Stu
den
tsM
axim
umM
ean
+ S
td.
Dev
iatio
nM
ean
Mea
n -
Std
. D
evia
tion
Min
imum
Sta
te r
esul
tsA
ll S
tud
ents
Fem
ales
Mal
es
‘Lik
e’ s
cho
ol r
esul
ts
(ave
rag
e fo
r g
roup
)
All
Stu
den
tsF
emal
esM
ales
‘Lik
e’ s
cho
ol r
esul
ts
(bes
t sc
hoo
l in
gro
up)
All
Stu
den
ts
Fem
ales
Mal
es
Sta
te R
esul
ts
05
101520253035404550
All
Stu
den
tsFe
mal
esM
ales
All
Stu
den
tsFe
mal
esM
ales
All
Stu
den
ts
Fem
ales
Mal
es
‘Lik
e’ S
choo
l Res
ults
(ave
rage
for
grou
p)
05
101520253035404550
‘Lik
e’ S
choo
l Res
ults
(bes
t sc
hool
in g
roup
)
05
101520253035404550
Study score
Study score
Study score
2433
350
35.0
28.3
21.5
513
460
5035
.929
.422
.95
1087
350
33.8
26.9
20.1
5
3251
4833
.527
.120
.75
1742
4834
.628
.422
.25
1509
4631
.925
.619
.35
137
4637
.131
.726
.420
5048
38.8
32.1
25.5
1333
4135
.730
.124
.421
Max
imum
+ O
ne s
tand
ard
dev
iatio
n
Mea
n
- O
ne s
tand
ard
dev
iatio
n
Min
imum
KE
Y
[ 1 4 ]

[ 1 5 ]
ST
UD
YS
CO
RE
DI
ST
RI
BU
TI
ON
WI
TH
IN
TH
ES
PE
CI
FI
ED
ST
UD
YT
AB
LE
7 Stud
y:E
nglis
h‘L
ike’
scho
ol g
roup
:6
– M
ediu
m t
o hi
gh p
ropo
rtio
ns o
fLO
TE
spea
kers
at
hom
e/M
ediu
m p
ropo
rtio
ns o
fE
MA
or Y
outh
Allo
wan
ce r
ecip
ient
s
No
. Stu
den
tsM
axim
umM
ean
+ S
td.
Dev
iatio
nM
ean
Mea
n -
Std
. D
evia
tion
Min
imum
Sta
te r
esul
tsA
ll S
tud
ents
Fem
ales
Mal
es
‘Lik
e’ s
cho
ol r
esul
ts
(ave
rag
e fo
r g
roup
)
All
Stu
den
tsF
emal
esM
ales
‘Lik
e’ s
cho
ol r
esul
ts
(bes
t sc
hoo
l in
gro
up)
All
Stu
den
ts
Fem
ales
Mal
es
Sta
te R
esul
ts
05
101520253035404550
All
Stu
den
tsFe
mal
esM
ales
All
Stu
den
tsFe
mal
esM
ales
All
Stu
den
ts
Fem
ales
Mal
es
‘Lik
e’ S
choo
l Res
ults
(ave
rage
for
grou
p)
05
101520253035404550
‘Lik
e’ S
choo
l Res
ults
(bes
t sc
hool
in g
roup
)
05
101520253035404550
Study score
Study score
Study score
2433
350
35.0
28.3
21.5
513
460
5035
.929
.422
.95
1087
350
33.8
26.9
20.1
5
1231
5035
.929
.322
.77
739
5036
.830
.423
.97
492
4834
.427
.821
.29
215
5039
.032
.926
.916
3947
40.8
35.3
29.7
2290
4838
.232
.627
.121
Max
imum
+ O
ne s
tand
ard
dev
iatio
n
Mea
n
- O
ne s
tand
ard
dev
iatio
n
Min
imum
KE
Y

ST
UD
YS
CO
RE
DI
ST
RI
BU
TI
ON
WI
TH
IN
TH
ES
PE
CI
FI
ED
ST
UD
YT
AB
LE
8 Stud
y:E
nglis
h‘L
ike’
scho
ol g
roup
:7
– N
il or
ver
y lo
w p
ropo
rtio
ns o
fLO
TE
spea
kers
at
hom
e/H
igh
prop
ortio
ns o
fE
MA
or Y
outh
Allo
wan
ce r
ecip
ient
s
No
. Stu
den
tsM
axim
umM
ean
+ S
td.
Dev
iatio
nM
ean
Mea
n -
Std
. D
evia
tion
Min
imum
Sta
te r
esul
tsA
ll S
tud
ents
Fem
ales
Mal
es
‘Lik
e’ s
cho
ol r
esul
ts
(ave
rag
e fo
r g
roup
)
All
Stu
den
tsF
emal
esM
ales
‘Lik
e’ s
cho
ol r
esul
ts
(bes
t sc
hoo
l in
gro
up)
All
Stu
den
ts
Fem
ales
Mal
es
Sta
te R
esul
ts
05
101520253035404550
All
Stu
den
tsFe
mal
esM
ales
All
Stu
den
tsFe
mal
esM
ales
All
Stu
den
ts
Fem
ales
Mal
es
‘Lik
e’ S
choo
l Res
ults
(ave
rage
for
grou
p)
05
101520253035404550
‘Lik
e’ S
choo
l Res
ults
(bes
t sc
hool
in g
roup
)
05
101520253035404550
Study score
Study score
Study score
2433
350
35.0
28.3
21.5
513
460
5035
.929
.422
.95
1087
350
33.8
26.9
20.1
5
3301
5034
.127
.621
.07
1856
4835
.228
.922
.78
1445
5032
.325
.819
.27
1950
41.9
34.5
27.1
2119
4540
.434
.628
.823
1050
43.6
35.3
27.0
24
Max
imum
+ O
ne s
tand
ard
dev
iatio
n
Mea
n
- O
ne s
tand
ard
dev
iatio
n
Min
imum
KE
Y
[ 1 6 ]

[ 1 7 ]
ST
UD
YS
CO
RE
DI
ST
RI
BU
TI
ON
WI
TH
IN
TH
ES
PE
CI
FI
ED
ST
UD
YT
AB
LE
9 Stud
y:E
nglis
h‘L
ike’
scho
ol g
roup
:8
– L
ow p
ropo
rtio
ns o
fLO
TE
spea
kers
at
hom
e/H
igh
prop
ortio
ns o
fE
MA
or Y
outh
Allo
wan
ce r
ecip
ient
s
No
. Stu
den
tsM
axim
umM
ean
+ S
td.
Dev
iatio
nM
ean
Mea
n -
Std
. D
evia
tion
Min
imum
Sta
te r
esul
tsA
ll S
tud
ents
Fem
ales
Mal
es
‘Lik
e’ s
cho
ol r
esul
ts
(ave
rag
e fo
r g
roup
)
All
Stu
den
tsF
emal
esM
ales
‘Lik
e’ s
cho
ol r
esul
ts
(bes
t sc
hoo
l in
gro
up)
All
Stu
den
ts
Fem
ales
Mal
es
Sta
te R
esul
ts
05
101520253035404550
All
Stu
den
tsFe
mal
esM
ales
All
Stu
den
tsFe
mal
esM
ales
All
Stu
den
ts
Fem
ales
Mal
es
‘Lik
e’ S
choo
l Res
ults
(ave
rage
for
grou
p)
05
101520253035404550
‘Lik
e’ S
choo
l Res
ults
(bes
t sc
hool
in g
roup
)
05
101520253035404550
Study score
Study score
Study score
2433
350
35.0
28.3
21.5
513
460
5035
.929
.422
.95
1087
350
33.8
26.9
20.1
5
791
4831
.825
.218
.67
416
4732
.226
.220
.310
375
4831
.224
.117
.07
213
4835
.128
.722
.313
117
4735
.229
.724
.213
9648
34.7
27.5
20.3
13
Max
imum
+ O
ne s
tand
ard
dev
iatio
n
Mea
n
- O
ne s
tand
ard
dev
iatio
n
Min
imum
KE
Y

ST
UD
YS
CO
RE
DI
ST
RI
BU
TI
ON
WI
TH
IN
TH
ES
PE
CI
FI
ED
ST
UD
YT
AB
LE
10
Stud
y:E
nglis
h‘L
ike’
scho
ol g
roup
:9
– M
ediu
m t
o hi
gh p
ropo
rtio
ns o
fLO
TE
spea
kers
at
hom
e/H
igh
prop
ortio
ns o
fE
MA
or Y
outh
Allo
wan
ce r
ecip
ient
s
No
. Stu
den
tsM
axim
umM
ean
+ S
td.
Dev
iatio
nM
ean
Mea
n -
Std
. D
evia
tion
Min
imum
Sta
te r
esul
tsA
ll S
tud
ents
Fem
ales
Mal
es
‘Lik
e’ s
cho
ol r
esul
ts
(ave
rag
e fo
r g
roup
)
All
Stu
den
tsF
emal
esM
ales
‘Lik
e’ s
cho
ol r
esul
ts
(bes
t sc
hoo
l in
gro
up)
All
Stu
den
ts
Fem
ales
Mal
es
Sta
te R
esul
ts
05
101520253035404550
All
Stu
den
tsFe
mal
esM
ales
All
Stu
den
tsFe
mal
esM
ales
All
Stu
den
ts
Fem
ales
Mal
es
‘Lik
e’ S
choo
l Res
ults
(ave
rage
for
grou
p)
05
101520253035404550
‘Lik
e’ S
choo
l Res
ults
(bes
t sc
hool
in g
roup
)
05
101520253035404550
Study score
Study score
Study score
2433
350
35.0
28.3
21.5
513
460
5035
.929
.422
.95
1087
350
33.8
26.9
20.1
5
3006
4731
.725
.118
.66
1675
4732
.626
.320
.08
1331
4730
.323
.717
.16
155
4736
.830
.824
.717
3446
38.9
31.5
24.1
1551
4433
.927
.721
.515
Max
imum
+ O
ne s
tand
ard
dev
iatio
n
Mea
n
- O
ne s
tand
ard
dev
iatio
n
Min
imum
KE
Y
[ 1 8 ]

[ 1 9 ]
D I S T R I B U T I O N O F 2 0 0 0 V C E S T U D Y S C O R E S
B Y S T U D Y A R E A
F U R T H E R M A T H E M A T I C S

[ 2 0 ]
ST
UD
YS
CO
RE
DI
ST
RI
BU
TI
ON
WI
TH
IN
TH
ES
PE
CI
FI
ED
ST
UD
YT
AB
LE
11
Stud
y:Fu
rthe
r M
athe
mat
ics
‘Lik
e’sc
hool
gro
up:
1–
Nil
or v
ery
low
pro
port
ions
of
LOT
Esp
eake
rs a
t ho
me/
Low
pro
port
ions
of
EM
A o
r Y. A
. rec
ipie
nts
No
. Stu
den
tsM
axim
umM
ean
+ S
td.
Dev
iatio
nM
ean
Mea
n -
Std
. D
evia
tion
Min
imum
Sta
te r
esul
tsA
ll S
tud
ents
Fem
ales
Mal
es
‘Lik
e’ s
cho
ol r
esul
ts
(ave
rag
e fo
r g
roup
)
All
Stu
den
tsF
emal
esM
ales
‘Lik
e’ s
cho
ol r
esul
ts
(bes
t sc
hoo
l in
gro
up)
All
Stu
den
ts
Fem
ales
Mal
es
Sta
te R
esul
ts
05
101520253035404550
All
Stu
den
tsFe
mal
esM
ales
All
Stu
den
tsFe
mal
esM
ales
All
Stu
den
ts
Fem
ales
Mal
es
‘Lik
e’ S
choo
l Res
ults
(ave
rage
for
grou
p)
05
101520253035404550
‘Lik
e’ S
choo
l Res
ults
(bes
t sc
hool
in g
roup
)
05
101520253035404550
Study score
Study score
Study score
9432
5035
.428
.721
.94
5024
5035
.929
.322
.76
4408
5034
.828
.021
.14
870
5036
.930
.223
.56
425
4836
.730
.524
.313
445
5037
.129
.922
.76
1147
42.9
38.9
35.0
3442
4843
.136
.730
.224
747
43.7
39.3
34.8
34
Max
imum
+ O
ne s
tand
ard
dev
iatio
n
Mea
n
- O
ne s
tand
ard
dev
iatio
n
Min
imum
KE
Y

[ 2 1 ]
ST
UD
YS
CO
RE
DI
ST
RI
BU
TI
ON
WI
TH
IN
TH
ES
PE
CI
FI
ED
ST
UD
YT
AB
LE
12
Stud
y:Fu
rthe
r M
athe
mat
ics
‘Lik
e’sc
hool
gro
up:
2 –
Low
pro
port
ions
of
LOT
Esp
eake
rs a
t ho
me/
Low
pro
port
ions
of
EM
A o
r You
th A
llow
ance
rec
ipie
nts
No
. Stu
den
tsM
axim
umM
ean
+ S
td.
Dev
iatio
nM
ean
Mea
n -
Std
. D
evia
tion
Min
imum
Sta
te r
esul
tsA
ll S
tud
ents
Fem
ales
Mal
es
‘Lik
e’ s
cho
ol r
esul
ts
(ave
rag
e fo
r g
roup
)
All
Stu
den
tsF
emal
esM
ales
‘Lik
e’ s
cho
ol r
esul
ts
(bes
t sc
hoo
l in
gro
up)
All
Stu
den
ts
Fem
ales
Mal
es
Sta
te R
esul
ts
05
101520253035404550
All
Stu
den
tsFe
mal
esM
ales
All
Stu
den
tsFe
mal
esM
ales
All
Stu
den
ts
Fem
ales
Mal
es
‘Lik
e’ S
choo
l Res
ults
(ave
rage
for
grou
p)
05
101520253035404550
‘Lik
e’ S
choo
l Res
ults
(bes
t sc
hool
in g
roup
)
05
101520253035404550
Study score
Study score
Study score
9432
5035
.428
.721
.94
5024
5035
.929
.322
.76
4408
5034
.828
.021
.14
1213
5037
.331
.225
.014
674
5038
.032
.026
.014
539
5036
.330
.224
.014
5350
43.2
35.9
28.7
1430
4642
.635
.628
.614
2350
43.9
36.4
28.9
20
Max
imum
+ O
ne s
tand
ard
dev
iatio
n
Mea
n
- O
ne s
tand
ard
dev
iatio
n
Min
imum
KE
Y

[ 2 2 ]
ST
UD
YS
CO
RE
DI
ST
RI
BU
TI
ON
WI
TH
IN
TH
ES
PE
CI
FI
ED
ST
UD
YT
AB
LE
13
Stud
y:Fu
rthe
r M
athe
mat
ics
‘Lik
e’sc
hool
gro
up:
3 –
Med
ium
to
high
pro
port
ions
of
LOT
Esp
eake
rs a
t ho
me/
low
pro
port
ions
of
EM
A o
r You
th A
llow
ance
rec
ipie
nts
No
. Stu
den
tsM
axim
umM
ean
+ S
td.
Dev
iatio
nM
ean
Mea
n -
Std
. D
evia
tion
Min
imum
Sta
te r
esul
tsA
ll S
tud
ents
Fem
ales
Mal
es
‘Lik
e’ s
cho
ol r
esul
ts
(ave
rag
e fo
r g
roup
)
All
Stu
den
tsF
emal
esM
ales
‘Lik
e’ s
cho
ol r
esul
ts
(bes
t sc
hoo
l in
gro
up)
All
Stu
den
ts
Fem
ales
Mal
es
Sta
te R
esul
ts
05
101520253035404550
All
Stu
den
tsFe
mal
esM
ales
All
Stu
den
tsFe
mal
esM
ales
All
Stu
den
ts
Fem
ales
Mal
es
‘Lik
e’ S
choo
l Res
ults
(ave
rage
for
grou
p)
05
101520253035404550
‘Lik
e’ S
choo
l Res
ults
(bes
t sc
hool
in g
roup
)
05
101520253035404550
Study score
Study score
Study score
9432
5035
.428
.721
.94
5024
5035
.929
.322
.76
4408
5034
.828
.021
.14
274
5038
.031
.825
.615
141
4538
.332
.125
.915
133
5037
.631
.525
.418
6846
41.1
36.0
30.9
2333
4541
.837
.332
.825
3546
40.2
34.8
29.4
23
Max
imum
+ O
ne s
tand
ard
dev
iatio
n
Mea
n
- O
ne s
tand
ard
dev
iatio
n
Min
imum
KE
Y

[ 2 3 ]
ST
UD
YS
CO
RE
DI
ST
RI
BU
TI
ON
WI
TH
IN
TH
ES
PE
CI
FI
ED
ST
UD
YT
AB
LE
14
Stud
y:Fu
rthe
r M
athe
mat
ics
‘Lik
e’sc
hool
gro
up:
4 –
Nil
or v
ery
low
pro
port
ions
of
LOT
Esp
eake
rs a
t ho
me/
Med
ium
pro
port
ions
of
EM
A o
r You
th A
llow
ance
rec
ipie
nts
No
. Stu
den
tsM
axim
umM
ean
+ S
td.
Dev
iatio
nM
ean
Mea
n -
Std
. D
evia
tion
Min
imum
Sta
te r
esul
tsA
ll S
tud
ents
Fem
ales
Mal
es
‘Lik
e’ s
cho
ol r
esul
ts
(ave
rag
e fo
r g
roup
)
All
Stu
den
tsF
emal
esM
ales
‘Lik
e’ s
cho
ol r
esul
ts
(bes
t sc
hoo
l in
gro
up)
All
Stu
den
ts
Fem
ales
Mal
es
Sta
te R
esul
ts
05
101520253035404550
All
Stu
den
tsFe
mal
esM
ales
All
Stu
den
tsFe
mal
esM
ales
All
Stu
den
ts
Fem
ales
Mal
es
‘Lik
e’ S
choo
l Res
ults
(ave
rage
for
grou
p)
05
101520253035404550
‘Lik
e’ S
choo
l Res
ults
(bes
t sc
hool
in g
roup
)
05
101520253035404550
Study score
Study score
Study score
9432
5035
.428
.721
.94
5024
5035
.929
.322
.76
4408
5034
.828
.021
.14
2476
5035
.629
.523
.57
1345
5036
.130
.024
.010
1131
5034
.928
.922
.97
1242
40.7
38.7
36.7
3618
5044
.639
.133
.624
848
43.1
37.6
32.2
29
Max
imum
+ O
ne s
tand
ard
dev
iatio
n
Mea
n
- O
ne s
tand
ard
dev
iatio
n
Min
imum
KE
Y

ST
UD
YS
CO
RE
DI
ST
RI
BU
TI
ON
WI
TH
IN
TH
ES
PE
CI
FI
ED
ST
UD
YT
AB
LE
15
Stud
y:Fu
rthe
r M
athe
mat
ics
‘Lik
e’sc
hool
gro
up:
5 –
Low
pro
port
ions
of
LOT
Esp
eake
rs a
t ho
me/
Med
ium
pro
port
ions
of
EM
A o
r You
th A
llow
ance
rec
ipie
nts
No
. Stu
den
tsM
axim
umM
ean
+ S
td.
Dev
iatio
nM
ean
Mea
n -
Std
. D
evia
tion
Min
imum
Sta
te r
esul
tsA
ll S
tud
ents
Fem
ales
Mal
es
‘Lik
e’ s
cho
ol r
esul
ts
(ave
rag
e fo
r g
roup
)
All
Stu
den
tsF
emal
esM
ales
‘Lik
e’ s
cho
ol r
esul
ts
(bes
t sc
hoo
l in
gro
up)
All
Stu
den
ts
Fem
ales
Mal
es
Sta
te R
esul
ts
05
101520253035404550
All
Stu
den
tsFe
mal
esM
ales
All
Stu
den
tsFe
mal
esM
ales
All
Stu
den
ts
Fem
ales
Mal
es
‘Lik
e’ S
choo
l Res
ults
(ave
rage
for
grou
p)
05
101520253035404550
‘Lik
e’ S
choo
l Res
ults
(bes
t sc
hool
in g
roup
)
05
101520253035404550
Study score
Study score
Study score
9432
5035
.428
.721
.94
5024
5035
.929
.322
.76
4408
5034
.828
.021
.14
1289
4433
.227
.020
.88
663
4333
.627
.621
.511
626
4432
.726
.320
.08
1439
35.9
32.0
28.1
277
3936
.833
.029
.228
1643
37.0
31.1
25.1
23
Max
imum
+ O
ne s
tand
ard
dev
iatio
n
Mea
n
- O
ne s
tand
ard
dev
iatio
n
Min
imum
KE
Y
[ 2 4 ]

[ 2 5 ]
ST
UD
YS
CO
RE
DI
ST
RI
BU
TI
ON
WI
TH
IN
TH
ES
PE
CI
FI
ED
ST
UD
YT
AB
LE
16
Stud
y:Fu
rthe
r M
athe
mat
ics
‘Lik
e’sc
hool
gro
up:
6 –
Med
ium
to
high
pro
port
ions
of
LOT
Esp
eake
rs a
t ho
me/
Med
ium
pro
port
ions
of
EM
A o
r You
th A
llow
ance
rec
ipie
nts
No
. Stu
den
tsM
axim
umM
ean
+ S
td.
Dev
iatio
nM
ean
Mea
n -
Std
. D
evia
tion
Min
imum
Sta
te r
esul
tsA
ll S
tud
ents
Fem
ales
Mal
es
‘Lik
e’ s
cho
ol r
esul
ts
(ave
rag
e fo
r g
roup
)
All
Stu
den
tsF
emal
esM
ales
‘Lik
e’ s
cho
ol r
esul
ts
(bes
t sc
hoo
l in
gro
up)
All
Stu
den
ts
Fem
ales
Mal
es
Sta
te R
esul
ts
05
101520253035404550
All
Stu
den
tsFe
mal
esM
ales
All
Stu
den
tsFe
mal
esM
ales
All
Stu
den
ts
Fem
ales
Mal
es
‘Lik
e’ S
choo
l Res
ults
(ave
rage
for
grou
p)
05
101520253035404550
‘Lik
e’ S
choo
l Res
ults
(bes
t sc
hool
in g
roup
)
05
101520253035404550
Study score
Study score
Study score
9432
5035
.428
.721
.94
5024
5035
.929
.322
.76
4408
5034
.828
.021
.14
431
5036
.129
.422
.612
253
5037
.030
.023
.012
178
4334
.828
.422
.015
7043
39.3
34.5
29.7
2310
4640
.534
.528
.526
2643
39.9
34.8
29.8
23
Max
imum
+ O
ne s
tand
ard
dev
iatio
n
Mea
n
- O
ne s
tand
ard
dev
iatio
n
Min
imum
KE
Y

ST
UD
YS
CO
RE
DI
ST
RI
BU
TI
ON
WI
TH
IN
TH
ES
PE
CI
FI
ED
ST
UD
YT
AB
LE
17
Stud
y:Fu
rthe
r M
athe
mat
ics
‘Lik
e’sc
hool
gro
up:
7 –
Nil
or v
ery
low
pro
port
ions
of
LOT
Esp
eake
rs a
t ho
me/
Hig
h pr
opor
tions
of
EM
A o
r You
th A
llow
ance
rec
ipie
nts
No
. Stu
den
tsM
axim
umM
ean
+ S
td.
Dev
iatio
nM
ean
Mea
n -
Std
. D
evia
tion
Min
imum
Sta
te r
esul
tsA
ll S
tud
ents
Fem
ales
Mal
es
‘Lik
e’ s
cho
ol r
esul
ts
(ave
rag
e fo
r g
roup
)
All
Stu
den
tsF
emal
esM
ales
‘Lik
e’ s
cho
ol r
esul
ts
(bes
t sc
hoo
l in
gro
up)
All
Stu
den
ts
Fem
ales
Mal
es
Sta
te R
esul
ts
05
101520253035404550
All
Stu
den
tsFe
mal
esM
ales
All
Stu
den
tsFe
mal
esM
ales
All
Stu
den
ts
Fem
ales
Mal
es
‘Lik
e’ S
choo
l Res
ults
(ave
rage
for
grou
p)
05
101520253035404550
‘Lik
e’ S
choo
l Res
ults
(bes
t sc
hool
in g
roup
)
05
101520253035404550
Study score
Study score
Study score
9432
5035
.428
.721
.94
5024
5035
.929
.322
.76
4408
5034
.828
.021
.14
1358
4935
.429
.122
.910
744
4935
.829
.723
.512
614
4934
.928
.522
.110
1645
43.5
40.0
36.5
359
4542
.939
.636
.235
745
44.2
40.6
37.0
36
Max
imum
+ O
ne s
tand
ard
dev
iatio
n
Mea
n
- O
ne s
tand
ard
dev
iatio
n
Min
imum
KE
Y
[ 2 6 ]

[ 2 7 ]
ST
UD
YS
CO
RE
DI
ST
RI
BU
TI
ON
WI
TH
IN
TH
ES
PE
CI
FI
ED
ST
UD
YT
AB
LE
18
Stud
y:Fu
rthe
r M
athe
mat
ics
‘Lik
e’sc
hool
gro
up:
8 –
Low
pro
port
ions
of
LOT
Esp
eake
rs a
t ho
me/
Hig
h pr
opor
tions
of
EM
A o
r You
th A
llow
ance
rec
ipie
nts
No
. Stu
den
tsM
axim
umM
ean
+ S
td.
Dev
iatio
nM
ean
Mea
n -
Std
. D
evia
tion
Min
imum
Sta
te r
esul
tsA
ll S
tud
ents
Fem
ales
Mal
es
‘Lik
e’ s
cho
ol r
esul
ts
(ave
rag
e fo
r g
roup
)
All
Stu
den
tsF
emal
esM
ales
‘Lik
e’ s
cho
ol r
esul
ts
(bes
t sc
hoo
l in
gro
up)
All
Stu
den
ts
Fem
ales
Mal
es
Sta
te R
esul
ts
05
101520253035404550
All
Stu
den
tsFe
mal
esM
ales
All
Stu
den
tsFe
mal
esM
ales
All
Stu
den
ts
Fem
ales
Mal
es
‘Lik
e’ S
choo
l Res
ults
(ave
rage
for
grou
p)
05
101520253035404550
‘Lik
e’ S
choo
l Res
ults
(bes
t sc
hool
in g
roup
)
05
101520253035404550
Study score
Study score
Study score
9432
5035
.428
.721
.94
5024
5035
.929
.322
.76
4408
5034
.828
.021
.14
321
4433
.426
.419
.55
153
4133
.927
.521
.06
168
4432
.725
.518
.35
100
4135
.730
.024
.213
5741
35.8
30.6
25.5
1910
4440
.032
.625
.224
Max
imum
+ O
ne s
tand
ard
dev
iatio
n
Mea
n
- O
ne s
tand
ard
dev
iatio
n
Min
imum
KE
Y

ST
UD
YS
CO
RE
DI
ST
RI
BU
TI
ON
WI
TH
IN
TH
ES
PE
CI
FI
ED
ST
UD
YT
AB
LE
19
Stud
y:Fu
rthe
r M
athe
mat
ics
‘Lik
e’sc
hool
gro
up:
9 –
Med
ium
to
high
pro
port
ions
of
LOT
Esp
eake
rs a
t ho
me/
Hig
h pr
opor
tions
of
EM
A o
r You
th A
llow
ance
rec
ipie
nts
No
. Stu
den
tsM
axim
umM
ean
+ S
td.
Dev
iatio
nM
ean
Mea
n -
Std
. D
evia
tion
Min
imum
Sta
te r
esul
tsA
ll S
tud
ents
Fem
ales
Mal
es
‘Lik
e’ s
cho
ol r
esul
ts
(ave
rag
e fo
r g
roup
)
All
Stu
den
tsF
emal
esM
ales
‘Lik
e’ s
cho
ol r
esul
ts
(bes
t sc
hoo
l in
gro
up)
All
Stu
den
ts
Fem
ales
Mal
es
Sta
te R
esul
ts
05
101520253035404550
All
Stu
den
tsFe
mal
esM
ales
All
Stu
den
tsFe
mal
esM
ales
All
Stu
den
ts
Fem
ales
Mal
es
‘Lik
e’ S
choo
l Res
ults
(ave
rage
for
grou
p)
05
101520253035404550
‘Lik
e’ S
choo
l Res
ults
(bes
t sc
hool
in g
roup
)
05
101520253035404550
Study score
Study score
Study score
9432
5035
.428
.721
.94
5024
5035
.929
.322
.76
4408
5034
.828
.021
.14
1162
4630
.823
.816
.84
613
4631
.724
.617
.67
549
4529
.622
.816
.04
3644
36.3
30.7
25.1
1918
4437
.432
.126
.924
2344
35.7
29.3
22.9
19
Max
imum
+ O
ne s
tand
ard
dev
iatio
n
Mea
n
- O
ne s
tand
ard
dev
iatio
n
Min
imum
KE
Y
[ 2 8 ]

[ 2 9 ]
D I S T R I B U T I O N O F 2 0 0 0 V C E S T U D Y S C O R E S
B Y S T U D Y A R E A
M A T H E M A T I C A L M E T H O D S

[ 3 0 ]
ST
UD
YS
CO
RE
DI
ST
RI
BU
TI
ON
WI
TH
IN
TH
ES
PE
CI
FI
ED
ST
UD
YT
AB
LE
20
Stud
y:M
athe
mat
ical
Met
hods
‘Lik
e’sc
hool
gro
up:
1–
Nil
or v
ery
low
pro
port
ions
of
LOT
Esp
eake
rs a
t ho
me/
Low
pro
port
ions
of
EM
A o
r You
th A
llow
ance
rec
ipie
nts
No
. Stu
den
tsM
axim
umM
ean
+ S
td.
Dev
iatio
nM
ean
Mea
n -
Std
. D
evia
tion
Min
imum
Sta
te r
esul
tsA
ll S
tud
ents
Fem
ales
Mal
es
‘Lik
e’ s
cho
ol r
esul
ts
(ave
rag
e fo
r g
roup
)
All
Stu
den
tsF
emal
esM
ales
‘Lik
e’ s
cho
ol r
esul
ts
(bes
t sc
hoo
l in
gro
up)
All
Stu
den
ts
Fem
ales
Mal
es
Sta
te R
esul
ts
05
101520253035404550
All
Stu
den
tsFe
mal
esM
ales
All
Stu
den
tsFe
mal
esM
ales
All
Stu
den
ts
Fem
ales
Mal
es
‘Lik
e’ S
choo
l Res
ults
(ave
rage
for
grou
p)
05
101520253035404550
‘Lik
e’ S
choo
l Res
ults
(bes
t sc
hool
in g
roup
)
05
101520253035404550
Study score
Study score
Study score
8083
5035
.828
.821
.84
3697
5035
.328
.722
.16
4386
5036
.228
.821
.54
577
5034
.828
.922
.912
284
4233
.628
.523
.312
293
5035
.929
.322
.712
2239
37.9
32.8
27.8
2217
3937
.933
.529
.025
2444
37.8
32.4
27.0
22
Max
imum
+ O
ne s
tand
ard
dev
iatio
n
Mea
n
- O
ne s
tand
ard
dev
iatio
n
Min
imum
KE
Y

[ 3 1 ]
ST
UD
YS
CO
RE
DI
ST
RI
BU
TI
ON
WI
TH
IN
TH
ES
PE
CI
FI
ED
ST
UD
YT
AB
LE
21
Stud
y:M
athe
mat
ical
Met
hods
‘Lik
e’sc
hool
gro
up:
2 –
Low
pro
port
ions
of
LOT
Esp
eake
rs a
t ho
me/
Low
pro
port
ions
of
EM
A o
r You
th A
llow
ance
rec
ipie
nts
No
. Stu
den
tsM
axim
umM
ean
+ S
td.
Dev
iatio
nM
ean
Mea
n -
Std
. D
evia
tion
Min
imum
Sta
te r
esul
tsA
ll S
tud
ents
Fem
ales
Mal
es
‘Lik
e’ s
cho
ol r
esul
ts
(ave
rag
e fo
r g
roup
)
All
Stu
den
tsF
emal
esM
ales
‘Lik
e’ s
cho
ol r
esul
ts
(bes
t sc
hoo
l in
gro
up)
All
Stu
den
ts
Fem
ales
Mal
es
Sta
te R
esul
ts
05
101520253035404550
All
Stu
den
tsFe
mal
esM
ales
All
Stu
den
tsFe
mal
esM
ales
All
Stu
den
ts
Fem
ales
Mal
es
‘Lik
e’ S
choo
l Res
ults
(ave
rage
for
grou
p)
05
101520253035404550
‘Lik
e’ S
choo
l Res
ults
(bes
t sc
hool
in g
roup
)
05
101520253035404550
Study score
Study score
Study score
8083
5035
.828
.821
.84
3697
5035
.328
.722
.16
4386
5036
.228
.821
.54
1090
5036
.329
.823
.28
521
4935
.729
.423
.010
569
5036
.930
.123
.48
3646
39.4
34.1
28.7
2413
4539
.334
.229
.225
2346
39.5
34.0
28.4
24
Max
imum
+ O
ne s
tand
ard
dev
iatio
n
Mea
n
- O
ne s
tand
ard
dev
iatio
n
Min
imum
KE
Y

[ 3 2 ]
ST
UD
YS
CO
RE
DI
ST
RI
BU
TI
ON
WI
TH
IN
TH
ES
PE
CI
FI
ED
ST
UD
YT
AB
LE
22
Stud
y:M
athe
mat
ical
Met
hods
‘Lik
e’sc
hool
gro
up:
3 –
Med
ium
to
high
pro
port
ions
of
LOT
Esp
eake
rs a
t ho
me/
Low
pro
port
ions
of
EM
A o
r You
th A
llow
ance
rec
ipie
nts
No
. Stu
den
tsM
axim
umM
ean
+ S
td.
Dev
iatio
nM
ean
Mea
n -
Std
. D
evia
tion
Min
imum
Sta
te r
esul
tsA
ll S
tud
ents
Fem
ales
Mal
es
‘Lik
e’ s
cho
ol r
esul
ts
(ave
rag
e fo
r g
roup
)
All
Stu
den
tsF
emal
esM
ales
‘Lik
e’ s
cho
ol r
esul
ts
(bes
t sc
hoo
l in
gro
up)
All
Stu
den
ts
Fem
ales
Mal
es
Sta
te R
esul
ts
05
101520253035404550
All
Stu
den
tsFe
mal
esM
ales
All
Stu
den
tsFe
mal
esM
ales
All
Stu
den
ts
Fem
ales
Mal
es
‘Lik
e’ S
choo
l Res
ults
(ave
rage
for
grou
p)
05
101520253035404550
‘Lik
e’ S
choo
l Res
ults
(bes
t sc
hool
in g
roup
)
05
101520253035404550
Study score
Study score
Study score
8083
5035
.828
.821
.84
3697
5035
.328
.722
.16
4386
5036
.228
.821
.54
585
4940
.233
.727
.312
271
4940
.033
.927
.817
314
4940
.333
.626
.812
139
4942
.136
.931
.822
6749
42.3
36.7
31.0
2372
4641
.837
.232
.522
Max
imum
+ O
ne s
tand
ard
dev
iatio
n
Mea
n
- O
ne s
tand
ard
dev
iatio
n
Min
imum
KE
Y

[ 3 3 ]
ST
UD
YS
CO
RE
DI
ST
RI
BU
TI
ON
WI
TH
IN
TH
ES
PE
CI
FI
ED
ST
UD
YT
AB
LE
23
Stud
y:M
athe
mat
ical
Met
hods
‘Lik
e’sc
hool
gro
up:
4 –
Nil
or v
ery
low
pro
port
ions
of
LOT
Esp
eake
rs a
t ho
me/
Med
ium
pro
port
ions
of
EM
A o
r You
th A
llow
ance
rec
ipie
nts
No
. Stu
den
tsM
axim
umM
ean
+ S
td.
Dev
iatio
nM
ean
Mea
n -
Std
. D
evia
tion
Min
imum
Sta
te r
esul
tsA
ll S
tud
ents
Fem
ales
Mal
es
‘Lik
e’ s
cho
ol r
esul
ts
(ave
rag
e fo
r g
roup
)
All
Stu
den
tsF
emal
esM
ales
‘Lik
e’ s
cho
ol r
esul
ts
(bes
t sc
hoo
l in
gro
up)
All
Stu
den
ts
Fem
ales
Mal
es
Sta
te R
esul
ts
05
101520253035404550
All
Stu
den
tsFe
mal
esM
ales
All
Stu
den
tsFe
mal
esM
ales
All
Stu
den
ts
Fem
ales
Mal
es
‘Lik
e’ S
choo
l Res
ults
(ave
rage
for
grou
p)
05
101520253035404550
‘Lik
e’ S
choo
l Res
ults
(bes
t sc
hool
in g
roup
)
05
101520253035404550
Study score
Study score
Study score
8083
5035
.828
.821
.84
3697
5035
.328
.722
.16
4386
5036
.228
.821
.54
1597
5034
.127
.921
.79
706
5033
.728
.022
.311
891
5034
.327
.821
.39
850
41.9
36.1
30.4
2910
4741
.935
.829
.729
545
40.7
36.2
31.7
32
Max
imum
+ O
ne s
tand
ard
dev
iatio
n
Mea
n
- O
ne s
tand
ard
dev
iatio
n
Min
imum
KE
Y

ST
UD
YS
CO
RE
DI
ST
RI
BU
TI
ON
WI
TH
IN
TH
ES
PE
CI
FI
ED
ST
UD
YT
AB
LE
24
Stud
y:M
athe
mat
ical
Met
hods
‘Lik
e’sc
hool
gro
up:
5 –
Low
pro
port
ions
of
LOT
Esp
eake
rs a
t ho
me/
Med
ium
pro
port
ions
of
EM
A o
r You
th A
llow
ance
rec
ipie
nts
No
. Stu
den
tsM
axim
umM
ean
+ S
td.
Dev
iatio
nM
ean
Mea
n -
Std
. D
evia
tion
Min
imum
Sta
te r
esul
tsA
ll S
tud
ents
Fem
ales
Mal
es
‘Lik
e’ s
cho
ol r
esul
ts
(ave
rag
e fo
r g
roup
)
All
Stu
den
tsF
emal
esM
ales
‘Lik
e’ s
cho
ol r
esul
ts
(bes
t sc
hoo
l in
gro
up)
All
Stu
den
ts
Fem
ales
Mal
es
Sta
te R
esul
ts
05
101520253035404550
All
Stu
den
tsFe
mal
esM
ales
All
Stu
den
tsFe
mal
esM
ales
All
Stu
den
ts
Fem
ales
Mal
es
‘Lik
e’ S
choo
l Res
ults
(ave
rage
for
grou
p)
05
101520253035404550
‘Lik
e’ S
choo
l Res
ults
(bes
t sc
hool
in g
roup
)
05
101520253035404550
Study score
Study score
Study score
8083
5035
.828
.821
.84
3697
5035
.328
.722
.16
4386
5036
.228
.821
.54
949
4833
.026
.520
.19
415
4633
.427
.120
.812
534
4832
.626
.119
.79
941
37.3
31.8
26.2
2347
4437
.231
.425
.517
841
38.0
32.5
27.0
23
Max
imum
+ O
ne s
tand
ard
dev
iatio
n
Mea
n
- O
ne s
tand
ard
dev
iatio
n
Min
imum
KE
Y
[ 3 4 ]

[ 3 5 ]
ST
UD
YS
CO
RE
DI
ST
RI
BU
TI
ON
WI
TH
IN
TH
ES
PE
CI
FI
ED
ST
UD
YT
AB
LE
25
Stud
y:M
athe
mat
ical
Met
hods
‘Lik
e’sc
hool
gro
up:
6 –
Med
ium
to
high
pro
port
ions
of
LOT
Esp
eake
rs a
t ho
me/
Med
ium
pro
port
ions
of
EM
A o
r You
th A
llow
ance
rec
ipie
nts
No
. Stu
den
tsM
axim
umM
ean
+ S
td.
Dev
iatio
nM
ean
Mea
n -
Std
. D
evia
tion
Min
imum
Sta
te r
esul
tsA
ll S
tud
ents
Fem
ales
Mal
es
‘Lik
e’ s
cho
ol r
esul
ts
(ave
rag
e fo
r g
roup
)
All
Stu
den
tsF
emal
esM
ales
‘Lik
e’ s
cho
ol r
esul
ts
(bes
t sc
hoo
l in
gro
up)
All
Stu
den
ts
Fem
ales
Mal
es
Sta
te R
esul
ts
05
101520253035404550
All
Stu
den
tsFe
mal
esM
ales
All
Stu
den
tsFe
mal
esM
ales
All
Stu
den
ts
Fem
ales
Mal
es
‘Lik
e’ S
choo
l Res
ults
(ave
rage
for
grou
p)
05
101520253035404550
‘Lik
e’ S
choo
l Res
ults
(bes
t sc
hool
in g
roup
)
05
101520253035404550
Study score
Study score
Study score
8083
5035
.828
.821
.84
3697
5035
.328
.722
.16
4386
5036
.228
.821
.54
584
4835
.628
.822
.09
303
4835
.228
.822
.49
281
4736
.028
.821
.613
111
4538
.733
.828
.914
5243
38.0
33.7
29.5
2459
4539
.233
.828
.414
Max
imum
+ O
ne s
tand
ard
dev
iatio
n
Mea
n
- O
ne s
tand
ard
dev
iatio
n
Min
imum
KE
Y

ST
UD
YS
CO
RE
DI
ST
RI
BU
TI
ON
WI
TH
IN
TH
ES
PE
CI
FI
ED
ST
UD
YT
AB
LE
26
Stud
y:M
athe
mat
ical
Met
hods
‘Lik
e’sc
hool
gro
up:
7 –
Nil
or v
ery
low
pro
port
ions
of
LOT
Esp
eake
rs a
t ho
me/
Hig
h pr
opor
tions
of
EM
A o
r You
th A
llow
ance
rec
ipie
nts
No
. Stu
den
tsM
axim
umM
ean
+ S
td.
Dev
iatio
nM
ean
Mea
n -
Std
. D
evia
tion
Min
imum
Sta
te r
esul
tsA
ll S
tud
ents
Fem
ales
Mal
es
‘Lik
e’ s
cho
ol r
esul
ts
(ave
rag
e fo
r g
roup
)
All
Stu
den
tsF
emal
esM
ales
‘Lik
e’ s
cho
ol r
esul
ts
(bes
t sc
hoo
l in
gro
up)
All
Stu
den
ts
Fem
ales
Mal
es
Sta
te R
esul
ts
05
101520253035404550
All
Stu
den
tsFe
mal
esM
ales
All
Stu
den
tsFe
mal
esM
ales
All
Stu
den
ts
Fem
ales
Mal
es
‘Lik
e’ S
choo
l Res
ults
(ave
rage
for
grou
p)
05
101520253035404550
‘Lik
e’ S
choo
l Res
ults
(bes
t sc
hool
in g
roup
)
05
101520253035404550
Study score
Study score
Study score
8083
5035
.828
.821
.84
3697
5035
.328
.722
.16
4386
5036
.228
.821
.54
842
5034
.327
.821
.34
400
4433
.527
.621
.712
442
5035
.028
.021
.14
1639
36.8
32.9
28.9
2766
4236
.832
.427
.923
1239
36.9
33.3
29.8
28
Max
imum
+ O
ne s
tand
ard
dev
iatio
n
Mea
n
- O
ne s
tand
ard
dev
iatio
n
Min
imum
KE
Y
[ 3 6 ]

[ 3 7 ]
ST
UD
YS
CO
RE
DI
ST
RI
BU
TI
ON
WI
TH
IN
TH
ES
PE
CI
FI
ED
ST
UD
YT
AB
LE
27
Stud
y:M
athe
mat
ical
Met
hods
‘Lik
e’sc
hool
gro
up:
8 –
Low
pro
port
ions
of
LOT
Esp
eake
rs a
t ho
me/
Hig
h pr
opor
tions
of
EM
A o
r You
th A
llow
ance
rec
ipie
nts
No
. Stu
den
tsM
axim
umM
ean
+ S
td.
Dev
iatio
nM
ean
Mea
n -
Std
. D
evia
tion
Min
imum
Sta
te r
esul
tsA
ll S
tud
ents
Fem
ales
Mal
es
‘Lik
e’ s
cho
ol r
esul
ts
(ave
rag
e fo
r g
roup
)
All
Stu
den
tsF
emal
esM
ales
‘Lik
e’ s
cho
ol r
esul
ts
(bes
t sc
hoo
l in
gro
up)
All
Stu
den
ts
Fem
ales
Mal
es
Sta
te R
esul
ts
05
101520253035404550
All
Stu
den
tsFe
mal
esM
ales
All
Stu
den
tsFe
mal
esM
ales
All
Stu
den
ts
Fem
ales
Mal
es
‘Lik
e’ S
choo
l Res
ults
(ave
rage
for
grou
p)
05
101520253035404550
‘Lik
e’ S
choo
l Res
ults
(bes
t sc
hool
in g
roup
)
05
101520253035404550
Study score
Study score
Study score
8083
5035
.828
.821
.84
3697
5035
.328
.722
.16
4386
5036
.228
.821
.54
180
4533
.927
.320
.713
6643
32.9
27.3
21.8
1511
445
34.4
27.3
20.1
13
741
38.0
32.4
26.8
2534
3731
.827
.623
.418
4145
35.9
31.0
26.1
21
Max
imum
+ O
ne s
tand
ard
dev
iatio
n
Mea
n
- O
ne s
tand
ard
dev
iatio
n
Min
imum
KE
Y

ST
UD
YS
CO
RE
DI
ST
RI
BU
TI
ON
WI
TH
IN
TH
ES
PE
CI
FI
ED
ST
UD
YT
AB
LE
28
Stud
y:M
athe
mat
ical
Met
hods
‘Lik
e’sc
hool
gro
up:
9 –
Med
ium
to
high
pro
port
ions
of
LOT
Esp
eake
rs a
t ho
me/
Hig
h pr
opor
tions
of
EM
A o
r You
th A
llow
ance
rec
ipie
nts
No
. Stu
den
tsM
axim
umM
ean
+ S
td.
Dev
iatio
nM
ean
Mea
n -
Std
. D
evia
tion
Min
imum
Sta
te r
esul
tsA
ll S
tud
ents
Fem
ales
Mal
es
‘Lik
e’ s
cho
ol r
esul
ts
(ave
rag
e fo
r g
roup
)
All
Stu
den
tsF
emal
esM
ales
‘Lik
e’ s
cho
ol r
esul
ts
(bes
t sc
hoo
l in
gro
up)
All
Stu
den
ts
Fem
ales
Mal
es
Sta
te R
esul
ts
05
101520253035404550
All
Stu
den
tsFe
mal
esM
ales
All
Stu
den
tsFe
mal
esM
ales
All
Stu
den
ts
Fem
ales
Mal
es
‘Lik
e’ S
choo
l Res
ults
(ave
rage
for
grou
p)
05
101520253035404550
‘Lik
e’ S
choo
l Res
ults
(bes
t sc
hool
in g
roup
)
05
101520253035404550
Study score
Study score
Study score
8083
5035
.828
.821
.84
3697
5035
.328
.722
.16
4386
5036
.228
.821
.54
1192
5033
.026
.018
.95
551
4932
.826
.019
.36
641
5033
.225
.918
.65
2441
37.1
31.8
26.5
2024
4137
.131
.826
.520
746
40.0
34.0
28.0
25
Max
imum
+ O
ne s
tand
ard
dev
iatio
n
Mea
n
- O
ne s
tand
ard
dev
iatio
n
Min
imum
KE
Y
[ 3 8 ]

[ 3 9 ]
H I G H E S T , A V E R A G E A N D L O W E S T P E R F O R M I N G
S C H O O L S I N E A C H ‘ L I K E ’ S C H O O L G R O U P

[ 4 0 ]
AL
LS
TU
DI
ES
ST
UD
YS
CO
RE
S:
H
IG
HE
ST
,
AV
ER
AG
EA
ND
LO
WE
ST
SC
HO
OL
IN
GR
OU
PT
AB
LE
29
Stud
y:A
ll st
udie
s
Gro
up
Hig
hest
sch
oo
l ave
rag
eA
vera
ge
for
gro
up*
Low
est
scho
ol a
vera
ge
12
33S
45
67
89
Hig
hest
sch
oo
l, av
erag
e fo
r g
roup
and
low
est
scho
ol f
or
gro
ups
05
101520253035404550
12
33S
45
67
89
Gro
up
Study score
Hig
hest
sch
ool a
vera
ge
Ave
rage
for
grou
p*
Low
est
scho
ol a
vera
ge
31.9
33.1
34.7
34.8
30.8
32.4
34.1
28.7
29.6
29.3
30.3
32.4
37.4
28.8
27.4
29.1
28.6
26.1
25.5
27.4
27.4
28.4
23.3
23.2
25.0
21.5
21.4
21.6
* ‘A
vera
ge fo
r gr
oup
’ is
aver
age
of a
ll st
uden
ts in
gro
up, n
ot a
vera
ge o
f sch
ool r
esul
ts

[ 4 1 ]
SE
LE
CT
ED
ST
UD
IE
SS
TU
DY
SC
OR
ES
:
HI
GH
ES
T,
A
VE
RA
GE
AN
DL
OW
ES
TS
CH
OO
LI
NG
RO
UP
TA
BL
E3
0
Stud
y:E
nglis
h
Gro
up
Hig
hest
sch
oo
l ave
rag
eA
vera
ge
for
gro
up*
Low
est
scho
ol a
vera
ge
12
33S
45
67
89
Hig
hest
sch
oo
l, av
erag
e fo
r g
roup
and
low
est
scho
ol f
or
gro
ups
05
101520253035404550
12
33S
45
67
89
Gro
up
Study score
Hig
hest
sch
ool a
vera
ge
Ave
rage
for
grou
p*
Low
est
scho
ol a
vera
ge
31.2
34.0
34.6
33.8
31.7
32.9
34.5
28.7
30.8
29.0
30.4
32.5
39.0
28.1
27.1
29.3
27.6
25.2
25.1
25.7
27.0
27.5
24.5
22.6
25.2
20.7
20.4
21.2
* ‘A
vera
ge fo
r gr
oup
’ is
aver
age
of a
ll st
uden
ts in
gro
up, n
ot a
vera
ge o
f sch
ool r
esul
ts

[ 4 2 ]
SE
LE
CT
ED
ST
UD
IE
SS
TU
DY
SC
OR
ES
:
HI
GH
ES
T,
A
VE
RA
GE
AN
DL
OW
ES
TS
CH
OO
LI
NG
RO
UP
TA
BL
E3
1
Stud
y:Fu
rthe
r M
athe
mat
ics
Gro
up
Hig
hest
sch
oo
l ave
rag
eA
vera
ge
for
gro
up*
Low
est
scho
ol a
vera
ge
12
33S
45
67
89
Hig
hest
sch
oo
l, av
erag
e fo
r g
roup
and
low
est
scho
ol f
or
gro
ups
05
101520253035404550
12
33S
45
67
89
Gro
up
Study score
Hig
hest
sch
ool a
vera
ge
Ave
rage
for
grou
p*
Low
est
scho
ol a
vera
ge
38.9
35.9
36.0
38.7
32.0
34.5
46.0
30.0
30.7
30.2
31.2
31.8
37.8
29.5
27.0
29.4
29.1
26.4
23.8
25.4
25.0
28.1
22.2
20.5
22.6
21.7
9.4
18.3
* ‘A
vera
ge fo
r gr
oup
’ is
aver
age
of a
ll st
uden
ts in
gro
up, n
ot a
vera
ge o
f sch
ool r
esul
ts

[ 4 3 ]
SE
LE
CT
ED
ST
UD
IE
SS
TU
DY
SC
OR
ES
:
HI
GH
ES
T,
A
VE
RA
GE
AN
DL
OW
ES
TS
CH
OO
LI
NG
RO
UP
TA
BL
E3
2
Stud
y:M
athe
mat
ical
Met
hods
Gro
up
Hig
hest
sch
oo
l ave
rag
eA
vera
ge
for
gro
up*
Low
est
scho
ol a
vera
ge
12
33S
45
67
89
Hig
hest
sch
oo
l, av
erag
e fo
r g
roup
and
low
est
scho
ol f
or
gro
ups
05
101520253035404550
12
33S
45
67
89
Gro
up
Study score
Hig
hest
sch
ool a
vera
ge
Ave
rage
for
grou
p*
Low
est
scho
ol a
vera
ge
34.0
34.1
36.9
36.1
31.8
33.8
33.3
32.4
31.8
28.9
29.8
33.7
36.7
27.9
26.5
28.8
27.8
27.3
26.0
24.5
22.7
30.5
22.1
22.2
20.5
20.2
18.9
17.6
* ‘A
vera
ge fo
r gr
oup
’ is
aver
age
of a
ll st
uden
ts in
gro
up, n
ot a
vera
ge o
f sch
ool r
esul
ts

[ 4 4 ]

[ 4 5 ]
C O M P A R I S O N O F S T U D Y S C O R E D I S T R I B U T I O N
B Y S C H O O L T Y P E

[ 4 6 ]
SE
LE
CT
ED
ST
UD
IE
SS
TU
DY
SC
OR
ES
:
DI
ST
RI
BU
TI
ON
BY
CA
MP
US
TY
PE
TA
BL
E3
3
Stud
y:E
nglis
h
No
. Stu
den
tsM
axim
umM
ean
+ S
td.
Dev
iatio
nM
ean
Mea
n -
Std
. D
evia
tion
Min
imum
Sta
nd a
lone
7 –
12
colle
ges
All
Stu
den
tsF
emal
esM
ales
Mul
ti-ca
mp
us c
olle
ges
All
Stu
den
tsF
emal
esM
ales
Sen
ior
seco
ndar
y co
lleg
esA
ll S
tud
ents
F
emal
esM
ales
Sta
nd a
lone
7 –
12
colle
ges
05
101520253035404550
All
Stu
den
tsFe
mal
esM
ales
All
Stu
den
tsFe
mal
esM
ales
All
Stu
den
ts
Fem
ales
Mal
es
Mul
ti-ca
mp
us c
olle
ges
05
101520253035404550S
enio
r se
cond
ary
colle
ges
05
101520253035404550
Study score
Study score
Study score
1948
450
35.4
28.6
21.9
510
899
5036
.129
.723
.25
8585
5034
.227
.320
.55
3576
4833
.226
.619
.96
1892
4834
.227
.821
.48
1684
4731
.825
.218
.56
1273
5034
.527
.620
.87
669
4835
.929
.423
.010
604
5032
.325
.618
.97
Max
imum
+ O
ne s
tand
ard
dev
iatio
n
Mea
n
- O
ne s
tand
ard
dev
iatio
n
Min
imum
KE
Y

[ 4 7 ]
SE
LE
CT
ED
ST
UD
IE
SS
TU
DY
SC
OR
ES
:
DI
ST
RI
BU
TI
ON
BY
CA
MP
US
TY
PE
TA
BL
E3
4
Stud
y:Fu
rthe
r M
athe
mat
ics
No
. Stu
den
tsM
axim
umM
ean
+ S
td.
Dev
iatio
nM
ean
Mea
n -
Std
. D
evia
tion
Min
imum
Sta
nd a
lone
7 –
12
colle
ges
All
Stu
den
tsF
emal
esM
ales
Mul
ti-ca
mp
us c
olle
ges
All
Stu
den
tsF
emal
esM
ales
Sen
ior
seco
ndar
y co
lleg
esA
ll S
tud
ents
F
emal
esM
ales
Sta
nd a
lone
7 –
12
colle
ges
05
101520253035404550
All
Stu
den
tsFe
mal
esM
ales
All
Stu
den
tsFe
mal
esM
ales
All
Stu
den
ts
Fem
ales
Mal
es
Mul
ti-ca
mp
us c
olle
ges
05
101520253035404550S
enio
r se
cond
ary
colle
ges
05
101520253035404550
Study score
Study score
Study score
7552
5035
.728
.821
.94
4050
5036
.229
.422
.66
3502
5035
.128
.221
.24
1432
4733
.627
.421
.18
728
4434
.128
.222
.311
704
4732
.926
.520
.08
448
4735
.930
.124
.313
246
4736
.530
.825
.215
202
4535
.029
.223
.413
Max
imum
+ O
ne s
tand
ard
dev
iatio
n
Mea
n
- O
ne s
tand
ard
dev
iatio
n
Min
imum
KE
Y

[ 4 8 ]
SE
LE
CT
ED
ST
UD
IE
SS
TU
DY
SC
OR
ES
:
DI
ST
RI
BU
TI
ON
BY
CA
MP
US
TY
PE
TA
BL
E3
5
Stud
y:M
athe
mat
ical
Met
hods
No
. Stu
den
tsM
axim
umM
ean
+ S
td.
Dev
iatio
nM
ean
Mea
n -
Std
. D
evia
tion
Min
imum
Sta
nd a
lone
7 –
12
colle
ges
All
Stu
den
tsF
emal
esM
ales
Mul
ti-ca
mp
us c
olle
ges
All
Stu
den
tsF
emal
esM
ales
Sen
ior
seco
ndar
y co
lleg
esA
ll S
tud
ents
F
emal
esM
ales
Sta
nd a
lone
7 –
12
colle
ges
05
101520253035404550
All
Stu
den
tsFe
mal
esM
ales
All
Stu
den
tsFe
mal
esM
ales
All
Stu
den
ts
Fem
ales
Mal
es
Mul
ti-ca
mp
us c
olle
ges
05
101520253035404550S
enio
r se
cond
ary
colle
ges
05
101520253035404550
Study score
Study score
Study score
6864
5036
.229
.122
.06
3196
5035
.629
.022
.36
3668
5036
.629
.221
.78
954
4832
.426
.119
.74
386
4632
.026
.120
.313
568
4832
.726
.119
.44
265
5035
.930
.525
.012
115
4235
.530
.124
.812
150
5036
.330
.725
.212
Max
imum
+ O
ne s
tand
ard
dev
iatio
n
Mea
n
- O
ne s
tand
ard
dev
iatio
n
Min
imum
KE
Y

[ 4 9 ]
C O M P A R I S O N O F S T U D Y S C O R E D I S T R I B U T I O N
B Y L O C A T I O N

[ 5 0 ]
SE
LE
CT
ED
ST
UD
IE
SS
TU
DY
SC
OR
ES
:
DI
ST
RI
BU
TI
ON
BY
LO
CA
TI
ON
TA
BL
E3
6
Stud
y:E
nglis
h
No
. Stu
den
tsM
axim
umM
ean
+ S
td.
Dev
iatio
nM
ean
Mea
n -
Std
. D
evia
tion
Min
imum
Sta
te r
esul
ts (A
ll st
uden
ts)
Met
rop
olit
an s
cho
ols
Pro
vinc
ial s
cho
ols
Rur
al s
cho
ols
Rem
ote
sch
oo
ls
Stu
dy
sco
re d
istr
ibut
ion
with
in V
CE
: sch
oo
l lo
catio
n b
y ur
ban
isat
ion
05101520253035404550
Sta
te r
esul
ts (A
ll st
uden
ts)
Met
rop
olita
n sc
hool
sP
rovi
ncia
l sch
ools
Rur
al s
choo
ls
Study score
Rem
ote
scho
ols
2433
350
35.0
28.3
21.5
516
188
5035
.428
.421
.55
3241
5034
.327
.821
.37
3458
4934
.027
.721
.38
1446
5035
.529
.222
.99
Max
imum
+ O
ne s
tand
ard
dev
iatio
n
Mea
n
- O
ne s
tand
ard
dev
iatio
n
Min
imum
KE
Y

[ 5 1 ]
SE
LE
CT
ED
ST
UD
IE
SS
TU
DY
SC
OR
ES
:
DI
ST
RI
BU
TI
ON
BY
LO
CA
TI
ON
TA
BL
E3
7
Stud
y:Fu
rthe
r M
athe
mat
ics
No
. Stu
den
tsM
axim
umM
ean
+ S
td.
Dev
iatio
nM
ean
Mea
n -
Std
. D
evia
tion
Min
imum
Sta
te r
esul
ts (A
ll st
uden
ts)
Met
rop
olit
an s
cho
ols
Pro
vinc
ial s
cho
ols
Rur
al s
cho
ols
Rem
ote
sch
oo
ls
Stu
dy
sco
re d
istr
ibut
ion
with
in V
CE
: sch
oo
l lo
catio
n b
y ur
ban
isat
ion
05101520253035404550
Sta
te r
esul
ts (A
ll st
uden
ts)
Met
rop
olita
n sc
hool
sP
rovi
ncia
l sch
ools
Rur
al s
choo
ls
Study score
Rem
ote
scho
ols
9432
5035
.428
.721
.94
6088
5034
.928
.021
.14
1300
5035
.529
.523
.510
1438
5036
.029
.723
.37
606
5038
.031
.224
.49
Max
imum
+ O
ne s
tand
ard
dev
iatio
n
Mea
n
- O
ne s
tand
ard
dev
iatio
n
Min
imum
KE
Y

[ 5 2 ]
SE
LE
CT
ED
ST
UD
IE
SS
TU
DY
SC
OR
ES
:
DI
ST
RI
BU
TI
ON
BY
LO
CA
TI
ON
TA
BL
E3
8
Stud
y:M
athe
mat
ical
Met
hods
No
. Stu
den
tsM
axim
umM
ean
+ S
td.
Dev
iatio
nM
ean
Mea
n -
Std
. D
evia
tion
Min
imum
Stu
dy
sco
re d
istr
ibut
ion
with
in V
CE
: sch
oo
l lo
catio
n b
y ur
ban
isat
ion
05101520253035404550
Sta
te r
esul
ts (A
ll st
uden
ts)
Met
rop
olita
n sc
hool
sP
rovi
ncia
l sch
ools
Rur
al s
choo
ls
Study score
Rem
ote
scho
ols
8083
5035
.828
.821
.84
5807
5036
.228
.921
.65
846
5035
.129
.022
.913
985
5033
.927
.421
.04
445
5035
.029
.123
.212
Sta
te r
esul
ts (A
ll st
uden
ts)
Met
rop
olit
an s
cho
ols
Pro
vinc
ial s
cho
ols
Rur
al s
cho
ols
Rem
ote
sch
oo
ls
Max
imum
+ O
ne s
tand
ard
dev
iatio
n
Mea
n
- O
ne s
tand
ard
dev
iatio
n
Min
imum
KE
Y

[ 5 3 ]
C O M P A R I S O N O F S T U D Y S C O R E D I S T R I B U T I O N
B Y R E G I O N

[ 5 4 ]
SE
LE
CT
ED
ST
UD
IE
SS
TU
DY
SC
OR
ES
:
DI
ST
RI
BU
TI
ON
BY
RE
GI
ON
TA
BL
E3
9
Stud
y:E
nglis
h
No
. Stu
den
tsM
axim
umM
ean
+ S
td.
Dev
Mea
nM
ean
- S
td.
Dev
Min
imum
Sta
te r
esul
t (A
ll st
uden
ts)
Bar
wo
n S
out
h W
este
rnC
entr
al H
ighl
and
s W
imm
era
Lod
do
n C
amp
asp
e M
alle
eG
oul
bur
n N
ort
h E
aste
rnG
ipp
slan
dE
aste
rn M
etro
po
litan
Wes
tern
Met
rop
loita
nS
out
hern
Met
rop
olit
anN
ort
hern
Met
rop
olit
an
Stu
dy
sco
re d
istr
ibut
ion
with
in V
CE
: sch
oo
l lo
catio
n b
y re
gio
n
05
101520253035404550
Sta
te r
esul
t(A
ll st
uden
ts)
Bar
won
Sou
thW
este
rnC
entr
al H
ighl
and
sW
imm
era
Lod
don
Cam
pas
pe
Mal
lee
Gou
lbur
n N
orth
Eas
tern
Gip
psl
and
Eas
tern
Met
rop
olita
nW
este
rnM
etro
plo
itan
Sou
ther
nM
etro
pol
itan
Nor
ther
nM
etro
pol
itan
Study score
2433
350
35.0
28.3
21.5
519
7748
34.6
28.3
22.0
912
1948
33.9
27.5
21.1
918
4850
35.4
28.7
22.0
716
6250
34.1
27.9
21.7
814
3948
33.7
27.2
20.7
852
8250
36.2
29.7
23.2
728
7050
33.4
26.5
19.7
747
5850
36.1
29.0
21.9
532
7850
34.1
27.2
20.4
6
Max
imum
+ O
ne s
tand
ard
dev
iatio
n
Mea
n
- O
ne s
tand
ard
dev
iatio
n
Min
imum
KE
Y

[ 5 5 ]
SE
LE
CT
ED
ST
UD
IE
SS
TU
DY
SC
OR
ES
:
DI
ST
RI
BU
TI
ON
BY
RE
GI
ON
TA
BL
E4
0
Stud
y:Fu
rthe
r M
athe
mat
ics
No
. Stu
den
tsM
axim
umM
ean
+ S
td.
Dev
Mea
nM
ean
- S
td.
Dev
Min
imum
Sta
te r
esul
t (A
ll st
uden
ts)
Bar
wo
n S
out
h W
este
rnC
entr
al H
ighl
and
s W
imm
era
Lod
do
n C
amp
asp
e M
alle
eG
oul
bur
n N
ort
h E
aste
rnG
ipp
slan
dE
aste
rn M
etro
po
litan
Wes
tern
Met
rop
loita
nS
out
hern
Met
rop
olit
anN
ort
hern
Met
rop
olit
an
Stu
dy
sco
re d
istr
ibut
ion
with
in V
CE
: sch
oo
l lo
catio
n b
y re
gio
n
05
101520253035404550
Sta
te r
esul
t(A
ll st
uden
ts)
Bar
won
Sou
thW
este
rnC
entr
al H
ighl
and
sW
imm
era
Lod
don
Cam
pas
pe
Mal
lee
Gou
lbur
n N
orth
Eas
tern
Gip
psl
and
Eas
tern
Met
rop
olita
nW
este
rnM
etro
plo
itan
Sou
ther
nM
etro
pol
itan
Nor
ther
nM
etro
pol
itan
Study score
9432
5035
.428
.721
.94
747
5036
.130
.124
.210
493
4935
.929
.523
.111
763
5037
.831
.124
.39
716
5034
.828
.722
.67
625
5036
.029
.723
.410
2080
5036
.329
.923
.48
1135
5032
.826
.119
.47
1638
5035
.328
.621
.84
1235
4832
.925
.918
.96
Max
imum
+ O
ne s
tand
ard
dev
iatio
n
Mea
n
- O
ne s
tand
ard
dev
iatio
n
Min
imum
KE
Y

[ 5 6 ]
SE
LE
CT
ED
ST
UD
IE
SS
TU
DY
SC
OR
ES
:
DI
ST
RI
BU
TI
ON
BY
RE
GI
ON
TA
BL
E4
1
Stud
y:M
athe
mat
ical
Met
hods
No
. Stu
den
tsM
axim
umM
ean
+ S
td.
Dev
Mea
nM
ean
- S
td.
Dev
Min
imum
Sta
te r
esul
t (A
ll st
uden
ts)
Bar
wo
n S
out
h W
este
rnC
entr
al H
ighl
and
s W
imm
era
Lod
do
n C
amp
asp
e M
alle
eG
oul
bur
n N
ort
h E
aste
rnG
ipp
slan
dE
aste
rn M
etro
po
litan
Wes
tern
Met
rop
loita
nS
out
hern
Met
rop
olit
anN
ort
hern
Met
rop
olit
an
Stu
dy
sco
re d
istr
ibut
ion
with
in V
CE
: sch
oo
l lo
catio
n b
y re
gio
n
05
101520253035404550
Sta
te r
esul
t(A
ll st
uden
ts)
Bar
won
Sou
thW
este
rnC
entr
al H
ighl
and
sW
imm
era
Lod
don
Cam
pas
pe
Mal
lee
Gou
lbur
n N
orth
Eas
tern
Gip
psl
and
Eas
tern
Met
rop
olita
nW
este
rnM
etro
plo
itan
Sou
ther
nM
etro
pol
itan
Nor
ther
nM
etro
pol
itan
Study score
8083
5035
.828
.821
.84
532
4734
.829
.023
.112
285
5035
.229
.022
.913
563
5035
.529
.323
.212
515
5033
.627
.421
.112
381
5033
.326
.820
.44
2010
4936
.930
.323
.76
983
5033
.826
.519
.35
1813
5037
.530
.022
.58
1001
4834
.026
.719
.49
Max
imum
+ O
ne s
tand
ard
dev
iatio
n
Mea
n
- O
ne s
tand
ard
dev
iatio
n
Min
imum
KE
Y

[ 5 7 ]
C O M P A R I S O N O F S T U D Y S C O R E D I S T R I B U T I O N
B Y V C E C O H O R T S I Z E A N D S C H O O L L O C A T I O N

[ 5 8 ]
SE
LE
CT
ED
ST
UD
IE
SS
TU
DY
SC
OR
ES
: D
IS
TR
IB
UT
IO
NB
YE
NR
OL
ME
NT
GR
OU
PA
ND
LO
CA
TI
ON
TA
BL
E4
2
Stud
y:E
nglis
hN
o. S
tud
ents
Max
imum
Mea
n +
Std
. Dev
Mea
nM
ean
- S
td. D
evM
inim
um
All
All
< 4
646
- 7
576
- 1
0510
6 -
145
>14
5A
ll<
46
46 -
75
76 -
105
106
- 14
5
>14
5A
ll<
46
46 -
75
76 -
105
106
- 14
5
>14
5
Met
rop
olit
an
Pro
vinc
ial
Rur
al
05
101520253035404550
All
All
< 46
46 -
75
76 -
105
106
- 14
5>1
45A
ll<
4646
- 7
576
- 1
0510
6 -
145
>145
All
< 46
46 -
75
76 -
105
106
- 14
5>1
45
Sta
teM
etro
pol
itan
Pro
vinc
ial
R
ural
Enr
olm
ent
Gro
up
Stu
dy
sco
re d
istr
ibut
ion
with
in V
CE
: enr
olm
ent
gro
up a
nd lo
catio
n
2433
350
35.0
28.3
21.5
5
1618
850
35.4
28.4
21.5
530
4732
.525
.618
.714
00
0.0
0.0
0.0
029
641
30.9
24.7
18.5
779
546
32.0
25.8
19.6
915
067
5035
.628
.621
.75
3241
5034
.327
.821
.37
00
00
00
00
00
00
00
00
00
4332
27.0
20.7
14.5
931
9850
34.4
27.9
21.4
7
3458
4934
.027
.721
.38
2940
32.1
24.8
17.5
820
3731
.826
.621
.420
7542
36.2
29.7
23.2
1040
243
33.9
28.0
22.1
1129
3249
33.9
27.6
21.2
8
1446
5035
.529
.222
.99
289
5036
.130
.023
.811
388
4535
.229
.123
.09
459
5035
.128
.521
.911
226
4635
.829
.924
.016
8442
34.8
28.2
21.7
10
Rem
ote
All
< 4
646
- 7
576
- 1
0510
6 -
145
>14
5
Study score
Rem
ote
All
< 46
46 -
75
76 -
105
106
- 14
5>1
45
Max
imum
+ O
ne s
tand
ard
dev
iatio
n
Mea
n
- O
ne s
tand
ard
dev
iatio
n
Min
imum
KE
Y

[ 5 9 ]
SE
LE
CT
ED
ST
UD
IE
SS
TU
DY
SC
OR
ES
: D
IS
TR
IB
UT
IO
NB
YE
NR
OL
ME
NT
GR
OU
PA
ND
LO
CA
TI
ON
TA
BL
E4
3
Stud
y:Fu
rthe
r M
athe
mat
ics
No
. Stu
den
tsM
axim
umM
ean
+ S
td. D
evM
ean
Mea
n -
Std
. Dev
Min
imum
All
All
< 4
646
- 7
576
- 1
0510
6 -
145
>14
5A
ll<
46
46 -
75
76 -
105
106
- 14
5
>14
5A
ll<
46
46 -
75
76 -
105
106
- 14
5
>14
5
Met
rop
olit
an
Pro
vinc
ial
Rur
al
05
101520253035404550
All
All
< 46
46 -
75
76 -
105
106
- 14
5>1
45A
ll<
4646
- 7
576
- 1
0510
6 -
145
>145
All
< 46
46 -
75
76 -
105
106
- 14
5>1
45
Sta
teM
etro
pol
itan
Pro
vinc
ial
R
ural
Enr
olm
ent
Gro
up
Stu
dy
sco
re d
istr
ibut
ion
with
in V
CE
: enr
olm
ent
gro
up a
nd lo
catio
n
Rem
ote
All
< 4
646
- 7
576
- 1
0510
6 -
145
>14
5
Study score
Rem
ote
All
< 46
46 -
75
76 -
105
106
- 14
5>1
45
9432
5035
.428
.721
.94
6088
5034
.928
.021
.14
727
26.2
22.0
17.8
140
00.
00.
00.
00
116
4430
.823
.416
.05
336
4531
.624
.918
.27
5629
5035
.128
.321
.54
1300
5035
.529
.523
.510
00
00
00
00
00
00
00
00
00
2630
26.8
21.7
16.7
1012
7450
35.6
29.7
23.7
12
1438
5036
.029
.723
.37
1944
39.1
32.1
25.0
1912
4033
.828
.122
.418
2439
37.2
30.3
23.3
718
449
35.5
29.1
22.8
1411
9950
36.0
29.7
23.4
10
606
5038
.031
.224
.49
104
4937
.930
.823
.713
167
5039
.132
.325
.513
180
4735
.629
.022
.59
9550
40.2
33.5
26.8
1560
5037
.331
.726
.219
Max
imum
+ O
ne s
tand
ard
dev
iatio
n
Mea
n
- O
ne s
tand
ard
dev
iatio
n
Min
imum
KE
Y

No
. Stu
den
tsM
axim
umM
ean
+ S
td. D
evM
ean
Mea
n -
Std
. Dev
Min
imum
All
All
< 4
646
- 7
576
- 1
0510
6 -
145
>14
5A
ll<
46
46 -
75
76 -
105
106
- 14
5
>14
5A
ll<
46
46 -
75
76 -
105
106
- 14
5
>14
5
Met
rop
olit
an
Pro
vinc
ial
Rur
al
05
101520253035404550
All
All
< 46
46 -
75
76 -
105
106
- 14
5>1
45A
ll<
4646
- 7
576
- 1
0510
6 -
145
>145
All
< 46
46 -
75
76 -
105
106
- 14
5>1
45
Sta
teM
etro
pol
itan
Pro
vinc
ial
R
ural
Enr
olm
ent
Gro
up
Stu
dy
sco
re d
istr
ibut
ion
with
in V
CE
: enr
olm
ent
gro
up a
nd lo
catio
n
Rem
ote
All
< 4
646
- 7
576
- 1
0510
6 -
145
>14
5
Study score
Rem
ote
All
< 46
46 -
75
76 -
105
106
- 14
5>1
45
8083
5035
.828
.821
.84
5807
5036
.228
.921
.65
333
32.1
28.0
23.9
230
00.
00.
00.
00
7643
30.8
24.2
17.6
1021
749
31.6
25.2
18.7
955
1150
36.4
29.2
21.9
5
846
5035
.129
.022
.913
00
00
00
00
00
00
00
00
00
1026
23.7
21.2
18.7
1883
650
35.1
29.1
23.1
13
985
5033
.927
.421
.04
636
36.0
28.3
20.3
126
3231
.227
.724
.223
2141
34.8
28.7
22.5
1613
243
32.9
27.1
21.3
1282
050
34.0
27.5
20.9
4
445
5035
.029
.123
.212
9550
34.8
29.0
23.1
1212
945
35.4
29.8
24.1
1512
050
35.2
29.3
23.4
1783
4734
.428
.522
.716
1836
32.0
26.0
20.0
15
[ 6 0 ]
SE
LE
CT
ED
ST
UD
IE
SS
TU
DY
SC
OR
ES
: D
IS
TR
IB
UT
IO
NB
YE
NR
OL
ME
NT
GR
OU
PA
ND
LO
CA
TI
ON
TA
BL
E4
4
Stud
y:M
athe
mat
ical
Met
hods
Max
imum
+ O
ne s
tand
ard
dev
iatio
n
Mea
n
- O
ne s
tand
ard
dev
iatio
n
Min
imum
KE
Y

[ 6 1 ]
C O M P A R I S O N O F S T U D Y S C O R E D I S T R I B U T I O N F O R
G I R L S I N C O E D U C A T I O N A L A N D A L L G I R L S C H O O L S

[ 6 2 ]
SE
LE
CT
ED
ST
UD
IE
SS
TU
DY
SC
OR
ES
:
DI
ST
RI
BU
TI
ON
BY
GI
RL
SS
CH
OO
LT
YP
ET
AB
LE
45
Stud
y:E
nglis
h
No
. Stu
den
tsM
axim
umM
ean
+ S
td.
Dev
Mea
nM
ean
- S
td. D
evM
inim
um
Sta
te r
esul
ts (A
ll st
uden
ts)
Sta
te r
esul
ts (A
ll g
irls
)G
irls
in c
oed
ucat
iona
l sch
oo
lsG
irls
in g
irls
onl
y sc
hoo
ls
Sta
te R
esul
ts (A
ll st
uden
ts),
Sta
te R
esul
ts (A
ll gi
rls),
Girl
s in
coe
duca
tiona
l and
girl
s on
ly s
choo
ls
05
101520253035404550
Sta
te re
sults
(All
stud
ents
)S
tate
resu
lts (A
ll gi
rls)
Girl
s in
coe
duca
tiona
l sch
ools
Girl
s in
girl
s on
ly s
choo
ls
Study score
2433
350
35.0
28.3
21.5
513
460
5035
.929
.422
.95
1246
750
35.5
29.1
22.7
599
350
39.8
33.1
26.5
12
KE
Y Max
imum
+ O
ne s
tand
ard
dev
iatio
n
Mea
n
- O
ne s
tand
ard
dev
iatio
n
Min
imum

[ 6 3 ]
SE
LE
CT
ED
ST
UD
IE
SS
TU
DY
SC
OR
ES
:
DI
ST
RI
BU
TI
ON
BY
GI
RL
SS
CH
OO
LT
YP
ET
AB
LE
46
Stud
y:Fu
rthe
r M
athe
mat
ics
No
. Stu
den
tsM
axim
umM
ean
+ S
td.
Dev
Mea
nM
ean
- S
td. D
evM
inim
um
Sta
te r
esul
ts (A
ll st
uden
ts)
Sta
te r
esul
ts (A
ll g
irls
)G
irls
in c
oed
ucat
iona
l sch
oo
lsG
irls
in g
irls
onl
y sc
hoo
ls
Sta
te R
esul
ts (A
ll st
uden
ts),
Sta
te R
esul
ts (A
ll gi
rls),
Girl
s in
coe
duca
tiona
l and
girl
s on
ly s
choo
ls
05
101520253035404550
Sta
te re
sults
(All
stud
ents
)S
tate
resu
lts (A
ll gi
rls)
Girl
s in
coe
duca
tiona
l sch
ools
Girl
s in
girl
s on
ly s
choo
ls
Study score
9432
5035
.428
.721
.94
5024
5035
.929
.322
.76
4759
5035
.829
.222
.66
265
4838
.131
.224
.310
Max
imum
+ O
ne s
tand
ard
dev
iatio
n
Mea
n
- O
ne s
tand
ard
dev
iatio
n
Min
imum
KE
Y

[ 6 4 ]
SE
LE
CT
ED
ST
UD
IE
SS
TU
DY
SC
OR
ES
:
DI
ST
RI
BU
TI
ON
BY
GI
RL
SS
CH
OO
LT
YP
ET
AB
LE
47
Stud
y:M
A08
Mat
hem
atic
al M
etho
ds
No
. Stu
den
tsM
axim
umM
ean
+ S
td.
Dev
Mea
nM
ean
- S
td. D
evM
inim
um
Sta
te r
esul
ts (A
ll st
uden
ts)
Sta
te r
esul
ts (A
ll g
irls
)G
irls
in c
oed
ucat
iona
l sch
oo
lsG
irls
in g
irls
onl
y sc
hoo
ls
Sta
te R
esul
ts (A
ll st
uden
ts),
Sta
te R
esul
ts (A
ll gi
rls),
Girl
s in
coe
duca
tiona
l and
girl
s on
ly s
choo
ls
05
101520253035404550
Sta
te re
sults
(All
stud
ents
)S
tate
resu
lts (A
ll gi
rls)
Girl
s in
coe
duca
tiona
l sch
ools
Girl
s in
girl
s on
ly s
choo
ls
Study score
8083
5035
.828
.821
.84
3697
5035
.328
.722
.16
3201
5034
.628
.221
.86
496
4939
.032
.325
.59
Max
imum
+ O
ne s
tand
ard
dev
iatio
n
Mea
n
- O
ne s
tand
ard
dev
iatio
n
Min
imum
KE
Y

[ 6 5 ]
C O M P A R I S O N O F S T U D Y S C O R E D I S T R I B U T I O N F O R
‘ L I K E ’ S C H O O L G R O U P 3 A N D S E L E C T E D E N T R Y S C H O O L S

[ 6 6 ]
SE
LE
CT
ED
ST
UD
IE
SS
TU
DY
SC
OR
ES
:
DI
ST
RI
BU
TI
ON
BY
‘L
IK
E’
GR
OU
P3
S
CH
OO
LS
TA
BL
E4
8
Stud
y:E
nglis
h
No
. Stu
den
tsM
axim
umM
ean
+ S
td.
Dev
Mea
nM
ean
- S
td. D
evM
inim
um
Sta
te r
esul
ts (A
ll st
uden
ts)
Gro
up 3
(All
stud
ents
)G
roup
3 (e
xclu
din
g 3
S s
tud
ents
)G
roup
3 (3
S s
tud
ents
onl
y)
Sta
te R
esul
ts, A
ll G
roup
3 s
tude
nts,
Gro
up 3
stu
dent
s (e
xclu
ding
Gro
up 3
S),
and
Gro
up 3
S s
tude
nts
05
101520253035404550
Sta
te re
sults
(All
stud
ents
)G
roup
3 (A
ll st
uden
ts)
Gro
up 3
(exc
ludi
ng 3
S s
tude
nts)
Gro
up 3
(3S
stu
dent
s on
ly)
Study score
2433
350
35.0
28.3
21.5
515
4350
41.8
34.8
27.7
1010
0350
39.6
32.5
25.4
1054
050
43.7
39.0
34.4
21
Max
imum
+ O
ne s
tand
ard
dev
iatio
n
Mea
n
- O
ne s
tand
ard
dev
iatio
n
Min
imum
KE
Y

[ 6 7 ]
SE
LE
CT
ED
ST
UD
IE
SS
TU
DY
SC
OR
ES
:
DI
ST
RI
BU
TI
ON
BY
‘L
IK
E’
GR
OU
P3
S
CH
OO
LS
TA
BL
E4
9
Stud
y:Fu
rthe
r M
athe
mat
ics
No
. Stu
den
tsM
axim
umM
ean
+ S
td.
Dev
Mea
nM
ean
- S
td. D
evM
inim
um
Sta
te r
esul
ts (A
ll st
uden
ts)
Gro
up 3
(All
stud
ents
)G
roup
3 (e
xclu
din
g 3
S s
tud
ents
)G
roup
3 (3
S s
tud
ents
onl
y)
Sta
te R
esul
ts, A
ll G
roup
3 s
tude
nts,
Gro
up 3
stu
dent
s (e
xclu
ding
Gro
up 3
S),
and
Gro
up 3
S s
tude
nts
05
101520253035404550
Sta
te re
sults
(All
stud
ents
)G
roup
3 (A
ll st
uden
ts)
Gro
up 3
(exc
ludi
ng 3
S s
tude
nts)
Gro
up 3
(3S
stu
dent
s on
ly)
Study score
9432
5035
.428
.721
.94
310
5038
.932
.526
.115
274
5038
.031
.825
.615
3650
43.0
37.8
32.5
28
Max
imum
+ O
ne s
tand
ard
dev
iatio
n
Mea
n
- O
ne s
tand
ard
dev
iatio
n
Min
imum
KE
Y

[ 6 8 ]
SE
LE
CT
ED
ST
UD
IE
SS
TU
DY
SC
OR
ES
:
DI
ST
RI
BU
TI
ON
BY
‘L
IK
E’
GR
OU
P3
S
CH
OO
LS
TA
BL
E5
0
Stud
y:M
athe
mat
ical
Met
hods
No
. Stu
den
tsM
axim
umM
ean
+ S
td.
Dev
Mea
nM
ean
- S
td. D
evM
inim
um
Sta
te r
esul
ts (A
ll st
uden
ts)
Gro
up 3
(All
stud
ents
)G
roup
3 (e
xclu
din
g 3
S s
tud
ents
)G
roup
3 (3
S s
tud
ents
onl
y)
Sta
te R
esul
ts, A
ll G
roup
3 s
tude
nts,
Gro
up 3
stu
dent
s (e
xclu
ding
Gro
up 3
S),
and
Gro
up 3
S s
tude
nts
05
101520253035404550
Sta
te re
sults
(All
stud
ents
)G
roup
3 (A
ll st
uden
ts)
Gro
up 3
(exc
ludi
ng 3
S s
tude
nts)
Gro
up 3
(3S
stu
dent
s on
ly)
Study score
8083
5035
.828
.821
.84
1071
5041
.335
.128
.912
585
4940
.233
.727
.312
486
5042
.236
.731
.220
Max
imum
+ O
ne s
tand
ard
dev
iatio
n
Mea
n
- O
ne s
tand
ard
dev
iatio
n
Min
imum
KE
Y

[ 6 9 ]
A P P A R E N T R E T E N T I O N A N D C O M P L E T I O N

[ 7 0 ]
YE
AR
7
–
10
A
PP
AR
EN
TR
ET
EN
TI
ON
BY
‘L
IK
E’
SC
HO
OL
GR
OU
PT
AB
LE
51
Sta
teLi
ke s
cho
ol
gro
up 1
Like
sch
oo
l g
roup
2(e
xclu
din
gse
lect
edsc
hoo
ls*)
Like
sch
oo
l
Like
sch
oo
l g
roup
4Li
ke s
cho
ol
gro
up 5
Like
sch
oo
l g
roup
6Li
ke s
cho
ol
gro
up 7
Like
sch
oo
l g
roup
8Li
ke s
cho
ol
gro
up 9
90th
Per
cent
ile75
th P
erce
ntile
Mea
n25
th P
erce
ntile
10th
Per
cent
ile
Sta
teLi
ke s
choo
lgr
oup
1Li
ke s
choo
lgr
oup
2(e
xclu
din
g s
elec
ted
scho
ols
*)
Like
sch
ool
grou
p 3
(exc
lud
ing
sel
ecte
dsc
hoo
ls**
)
Like
sch
ool
grou
p 4
Like
sch
ool
grou
p 5
Like
sch
ool
grou
p 6
Like
sch
ool
grou
p 7
Like
sch
ool
grou
p 8
Like
sch
ool
grou
p 9
Percentage retention
5060708090100
110
120
130
140
150
160
170
180
190
200
114.
6210
2.17
105.
1010
9.33
106.
6710
2.49
107.
7010
5.73
182.
6113
2.08
100.
4610
0.00
99.3
110
6.30
97.8
298
.09
103.
8797
.20
124.
4911
5.74
96.6
294
.46
97.7
697
.72
92.6
694
.60
96.9
790
.31
97.1
110
3.50
86.3
786
.38
90.7
393
.30
86.4
191
.83
92.7
380
.29
87.4
791
.46
79.2
177
.97
81.4
474
.48
82.0
385
.30
89.4
774
.02
85.4
982
.11
gro
up 3
(exc
lud
ing
sele
cted
scho
ols
**)
*
* ex
clud
e M
alve
rn &
Moo
nee
Pon
ds
Cen
tral
Sch
ools
(onl
y Y
rs. 0
- 8
exi
st)
** e
xclu
de
Mac
Rob
Girl
’s &
Mel
b. H
igh
Sch
ools
(onl
y Y
rs. 9
- 1
2 ex
ist)
90th
Per
cent
ile
75th
Per
cent
ile
Mea
n
25th
Per
cent
ile
10th
Per
cent
ile
KE
Y

[ 7 1 ]
YE
AR
7
–
10
A
PP
AR
EN
TR
ET
EN
TI
ON
BY
RE
GI
ON
TA
BL
E5
2
90th
Per
cent
ile75
th P
erce
ntile
Mea
n25
th P
erce
ntile
10th
Per
cent
ile
Sta
teB
arw
on
So
uth
Wes
tern
Cen
tral
H
ighl
and
s W
imm
era
Lod
do
n C
amp
asp
e M
alle
e
Go
ulb
urn
No
rth
Eas
tern
Gip
psl
and
Eas
tern
Wes
tern
(exc
lud
ing
sel
ecte
dsc
hoo
ls**
)
So
uthe
rn(e
xclu
din
g s
elec
ted
scho
ols
*)N
ort
hern
Sta
teB
arw
on S
outh
Wes
tern
Cen
tral
Hig
hlan
ds
Wim
mer
aLo
dd
on C
amp
asp
eM
alle
eG
oulb
urn
Nor
thE
aste
rnG
ipp
slan
dE
aste
rnW
este
rn(e
xclu
din
g se
lect
edsc
hool
s**)
Sou
ther
n(e
xclu
din
g se
lect
edsc
hool
s*)
Nor
ther
n
5060708090
100
110
120
130
140
150
160
170
180
190
200
Percentage retention
114.
6210
0.00
97.0
511
1.52
105.
1410
5.38
111.
6813
0.00
139.
8012
4.62
100.
4693
.59
93.7
697
.42
98.0
010
1.91
101.
8910
4.31
100.
7210
3.45
96.6
289
.73
89.7
690
.69
90.8
997
.09
95.4
699
.22
97.7
197
.73
86.3
779
.74
81.5
583
.61
85.4
787
.67
90.1
191
.50
89.2
393
.14
79.2
174
.75
77.7
880
.45
79.2
082
.39
79.9
687
.68
83.3
383
.66
* ex
clud
e M
alve
rn C
entr
al S
choo
l (on
ly Y
rs. 0
- 8
exi
st),
Mac
Rob
. Girl
’s &
Mel
b. H
igh
Sch
ools
(onl
y Y
rs. 9
- 1
2 ex
ist)
** e
xclu
de
Moo
nee
Pon
ds
Cen
tral
Sch
ool (
only
Yrs
. 0 -
8 e
xist
)
90th
Per
cent
ile
75th
Per
cent
ile
Mea
n
25th
Per
cent
ile
10th
Per
cent
ile
KE
Y

Percentage of students
Sta
teB
oys
Girl
s
5060708090100
110
120
Sta
teB
oys
Gir
ls
90th
Per
cent
ile75
th P
erce
ntile
Mea
n25
th P
erce
ntile
10th
Per
cent
ile
114.
6211
4.60
119.
7810
0.46
101.
7110
6.30
96.6
292
.85
97.7
186
.37
82.8
986
.79
79.2
174
.92
77.7
5
[ 7 2 ]
YE
AR
7
–
10
A
PP
AR
EN
TR
ET
EN
TI
ON
BY
GE
ND
ER
TA
BL
E5
3
90th
Per
cent
ile
75th
Per
cent
ile
Mea
n
25th
Per
cent
ile
10th
Per
cent
ile
KE
Y

[ 7 3 ]
YE
AR
11
–
12
A
PP
AR
EN
TR
ET
EN
TI
ON
BY
‘L
IK
E’
SC
HO
OL
GR
OU
PT
AB
LE
54
Sta
teLi
ke s
cho
ol
gro
up 1
Like
sch
oo
l g
roup
2Li
ke s
cho
ol
gro
up 3
Like
sch
oo
l g
roup
4Li
ke s
cho
ol
gro
up 5
Like
sch
oo
l g
roup
6Li
ke s
cho
ol
gro
up 7
Like
sch
oo
l g
roup
8Li
ke s
cho
ol
gro
up 9
90th
Per
cent
ile75
th P
erce
ntile
Mea
n25
th P
erce
ntile
10th
Per
cent
ile
0
1020304050607080
Sta
teLi
ke s
choo
lgr
oup
1Li
ke s
choo
lgr
oup
2Li
ke s
choo
lgr
oup
3Li
ke s
choo
lgr
oup
4Li
ke s
choo
lgr
oup
5Li
ke s
choo
lgr
oup
6Li
ke s
choo
lgr
oup
7Li
ke s
choo
lgr
oup
8Li
ke s
choo
lgr
oup
9
Percentage retention
90.4
387
.27
95.8
098
.29
83.7
897
.25
90.2
484
.72
81.3
388
.67
83.1
885
.57
92.2
797
.29
79.5
180
.01
85.0
675
.00
73.4
285
.10
77.9
076
.10
89.7
792
.39
73.1
282
.48
81.5
569
.88
73.1
576
.74
68.4
773
.59
86.4
087
.21
68.0
269
.54
75.7
060
.59
52.2
571
.34
60.1
571
.70
78.4
580
.81
60.2
167
.38
75.4
458
.14
37.3
664
.37
90100
90th
Per
cent
ile
75th
Per
cent
ile
Mea
n
25th
Per
cent
ile
10th
Per
cent
ile
KE
Y

90th
Per
cent
ile75
th P
erce
ntile
Mea
n25
th P
erce
ntile
10th
Per
cent
ile
Sta
teB
arw
on
So
uth
Wes
tern
Cen
tral
H
ighl
and
s W
imm
era
Lod
do
n C
amp
asp
e M
alle
e
Go
ulb
urn
No
rth
Eas
tern
Gip
psl
and
Eas
tern
Wes
tern
So
uthe
rnN
ort
hern
0
1020304050607080
Sta
teB
arw
on S
outh
Wes
tern
Cen
tral
Hig
hlan
ds
Wim
mer
aLo
dd
on C
amp
asp
eM
alle
eG
oulb
urn
Nor
thE
aste
rnG
ipp
slan
dE
aste
rnW
este
rnS
outh
ern
Nor
ther
n
Percentage retention
90.4
386
.95
88.3
178
.67
81.1
275
.79
95.0
490
.15
93.4
689
.59
83.1
884
.18
82.9
276
.64
77.1
974
.23
90.4
078
.10
85.4
386
.28
77.9
076
.35
73.6
974
.44
73.0
370
.36
83.3
277
.87
79.0
478
.27
68.4
766
.17
68.0
566
.93
67.8
766
.31
73.8
669
.92
67.6
468
.28
60.1
559
.96
60.8
955
.73
60.6
960
.54
67.4
367
.24
60.8
659
.82
90100
[ 7 4 ]
YE
AR
11
–
12
A
PP
AR
EN
TR
ET
EN
TI
ON
BY
RE
GI
ON
TA
BL
E5
5
90th
Per
cent
ile
75th
Per
cent
ile
Mea
n
25th
Per
cent
ile
10th
Per
cent
ile
KE
Y

[ 7 5 ]
YE
AR
11
–
12
R
ET
EN
TI
ON
BY
GE
ND
ER
TA
BL
E5
6
Percentage of students
0
102030405060708090100
Sta
teB
oys
Girl
s
Sta
teB
oys
Gir
ls
90th
Per
cent
ile75
th P
erce
ntile
Mea
n25
th P
erce
ntile
10th
Per
cent
ile
90.4
387
.56
98.3
583
.18
79.0
089
.60
77.9
071
.73
84.0
168
.47
59.1
574
.20
60.1
550
.00
65.7
9
90th
Per
cent
ile
75th
Per
cent
ile
Mea
n
25th
Per
cent
ile
10th
Per
cent
ile
KE
Y

[ 7 6 ]
YE
AR
12
C
OM
PL
ET
IO
NB
Y‘
LI
KE
’S
CH
OO
LG
RO
UP
TA
BL
E5
7
Sta
teLi
ke s
cho
ol
gro
up 1
Like
sch
oo
l g
roup
2Li
ke s
cho
ol
gro
up 3
Like
sch
oo
l g
roup
4Li
ke s
cho
ol
gro
up 5
Like
sch
oo
l g
roup
6Li
ke s
cho
ol
gro
up 7
Like
sch
oo
l g
roup
8Li
ke s
cho
ol
gro
up 9
90th
Per
cent
ile75
th P
erce
ntile
Mea
n25
th P
erce
ntile
10th
Per
cent
ile
Sta
teLi
ke s
choo
lgr
oup
1Li
ke s
choo
lgr
oup
2Li
ke s
choo
lgr
oup
3Li
ke s
choo
lgr
oup
4Li
ke s
choo
lgr
oup
5Li
ke s
choo
lgr
oup
6Li
ke s
choo
lgr
oup
7Li
ke s
choo
lgr
oup
8Li
ke s
choo
lgr
oup
9
Percentage retention
100.
0010
0.00
99.0
610
0.00
100.
0098
.63
100.
0010
0.00
96.6
098
.84
97.6
698
.29
98.3
499
.63
96.8
497
.53
99.7
096
.89
95.6
397
.56
94.3
895
.36
95.8
299
.09
93.9
294
.57
97.2
590
.20
92.6
994
.54
92.3
294
.37
95.7
498
.84
92.1
892
.88
96.3
888
.17
82.5
992
.39
87.6
393
.82
93.6
997
.89
89.5
291
.97
94.3
985
.92
75.8
190
.55
90th
Per
cent
ile
75th
Per
cent
ile
Mea
n
25th
Per
cent
ile
10th
Per
cent
ile
KE
Y

[ 7 7 ]
YE
AR
12
C
OM
PL
ET
IO
NB
YR
EG
IO
NT
AB
LE
58
90th
Per
cent
ile75
th P
erce
ntile
Mea
n25
th P
erce
ntile
10th
Per
cent
ile
Sta
teB
arw
on
So
uth
Wes
tern
Cen
tral
H
ighl
and
s W
imm
era
Lod
do
n C
amp
asp
e M
alle
e
Go
ulb
urn
No
rth
Eas
tern
Gip
psl
and
Eas
tern
Wes
tern
So
uthe
rnN
ort
hern
Percentage retention
Sta
teB
arw
on S
outh
Wes
tern
Cen
tral
Hig
hlan
ds
Wim
mer
aLo
dd
on C
amp
asp
eM
alle
eG
oulb
urn
Nor
thE
aste
rnG
ipp
slan
dE
aste
rnW
este
rnS
outh
ern
Nor
ther
n
5060708090
100
100.
0097
.32
100.
0010
0.00
100.
0010
0.00
99.3
098
.51
98.9
098
.44
97.6
696
.59
100.
0010
0.00
97.5
597
.77
98.2
896
.26
97.4
896
.99
94.3
894
.41
92.4
090
.34
94.6
393
.02
96.2
294
.01
94.1
395
.53
92.3
290
.00
92.6
492
.55
92.1
890
.05
94.4
492
.77
91.6
092
.56
87.6
385
.97
91.5
688
.65
91.0
487
.64
90.0
787
.88
87.1
387
.92
90th
Per
cent
ile
75th
Per
cent
ile
Mea
n
25th
Per
cent
ile
10th
Per
cent
ile
KE
Y
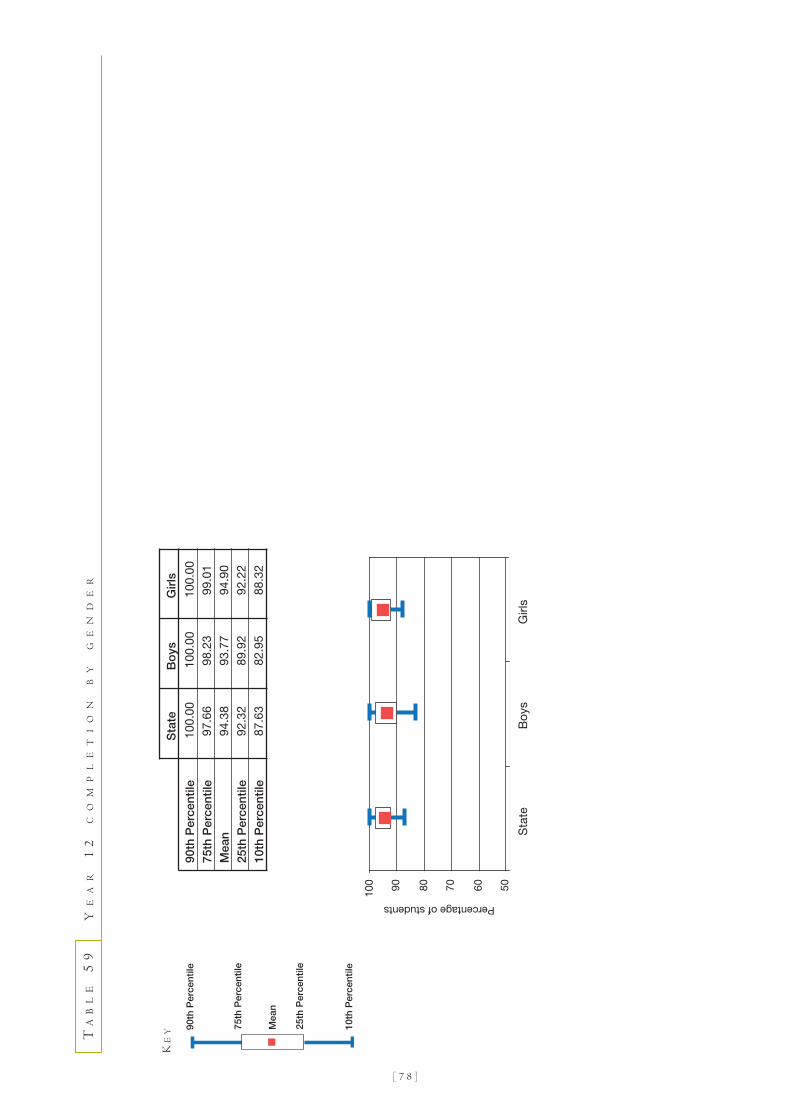
[ 7 8 ]
YE
AR
12
C
OM
PL
ET
IO
NB
YG
EN
DE
RT
AB
LE
59
Percentage of students
Sta
teB
oys
Girl
s
5060708090100
Sta
teB
oys
Gir
ls
90th
Per
cent
ile75
th P
erce
ntile
Mea
n25
th P
erce
ntile
10th
Per
cent
ile
100.
0010
0.00
100.
0097
.66
98.2
399
.01
94.3
893
.77
94.9
092
.32
89.9
292
.22
87.6
382
.95
88.3
2
90th
Per
cent
ile
75th
Per
cent
ile
Mea
n
25th
Per
cent
ile
10th
Per
cent
ile
KE
Y

[ 7 9 ]
A P P E N D I X N O . 1
R E T E N T I O N A N D C O M P L E T I O N : D E F I N I T I O N O F T E R M S
Twice a year each school completes a
census count of students attending the
school. The census occurs in February
and again in August. Data from the
census are used to determine the apparent
retention rates presented in this document.
Note that the apparent retention
calculations are based on students in
secondary and P12 schools only.
It should be noted that data presented in
this booklet refer to apparent retention
rates only. Apparent retention refers to
the difference between a count of students
at time one and again at time two.
During that interval, 100 students may
have left the government school system
and a different 100 came into the system.
This situation would still give rise to a
100% apparent retention rate. DEET does
not collect data on real retention at present.
The following diagram clarifies the
difference between retention rates published
by Standards and Accountability (S&A)
for internal school management purposes
and those used by DEET for National
Reporting purposes.
Year 7 – 10ApparentRetention
2000
Year level Census period
Year 7 February
August
Year 8 February
August
Year 9 February
August
Year 10 2000
2000
2000
1999
2000
2000
1997 1995
February
August
Year 11 February
August
Year 12 February
August
S&A data for internal school management
National reporting data
Year 7 – 12Apparent
Retention Rate2000
Year 11 – 12ApparentRetention
2000
Year 12Completion
2000

[ 8 0 ]
A P P E N D I X N O . 2
‘ L I K E ’ S C H O O L G R O U P S
‘ L I K E ’ S C H O O L G R O U P S
Group Seven
Nil-Low LOTE,High EMA/Youth Allowance
0 to < = 0.04 LOTE> 0.43 EMA/Youth Allowance
Group Four
Nil-Low LOTE,Medium EMA/Youth Allowance
0 to < = 0.04 LOTE> 0.28 to < = 0.43
EMA/Youth Allowance
Group One
Nil-Low LOTE,Low EMA/Youth Allowance
0 to < = 0.04 LOTE0 to < = 0.28
EMA/Youth Allowance
Group Eight
Low LOTE,High EMA/Youth Allowance
0.04 to < = 0.26 LOTE> 0.43 EMA/Youth Allowance
Group Five
Low LOTE,Medium EMA/Youth Allowance
0.04 to < = 0.26 LOTE> 0.28 to < = 0.43
EMA/Youth Allowance
Group Two
Low LOTE,Low EMA/Youth Allowance
> 0.04 to < = 0.26 LOTE0 to < = 0.28
EMA/Youth Allowance
Group Nine
Medium-High LOTEHigh EMA/Youth Allowance
> 0.26 LOTE> 0.43 EMA/Youth Allowance
Group Six
Medium-High LOTEMedium EMA/Youth Allowance
> 0.26 LOTE> 0.28 to < = 0.43
EMA/Youth Allowance
Group Three/Selected Entry (Three S)
Medium/High LOTELow EMA/Youth Allowance
> 0.26 LOTE0 to < = 0.28
EMA/Youth Allowance
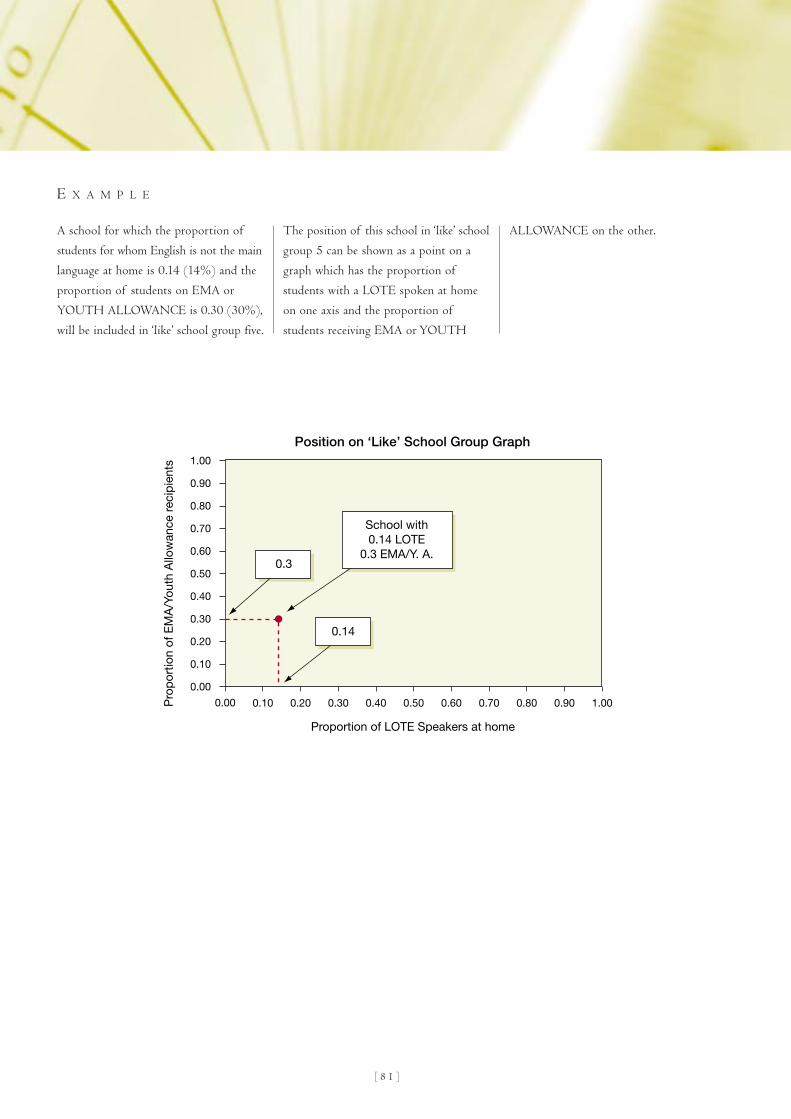
[ 8 1 ]
0.00
0.00 0.10 0.20 0.30 0.40 0.50 0.60 0.70 0.80 0.90 1.00
0.10
0.20
0.30
0.40
0.50
0.60
0.70
0.80
0.90
1.00
Proportion of LOTE Speakers at home
Pro
por
tion
of E
MA
/You
th A
llow
ance
rec
ipie
nts
School with0.14 LOTE
0.3 EMA/Y. A.
0.14
0.3
Position on ‘Like’ School Group Graph
A school for which the proportion of
students for whom English is not the main
language at home is 0.14 (14%) and the
proportion of students on EMA or
YOUTH ALLOWANCE is 0.30 (30%),
will be included in ‘like’ school group five.
The position of this school in ‘like’ school
group 5 can be shown as a point on a
graph which has the proportion of
students with a LOTE spoken at home
on one axis and the proportion of
students receiving EMA or YOUTH
ALLOWANCE on the other.
E X A M P L E

[ 8 2 ]
0.00
0.00 0.10 0.20 0.30 0.40 0.50 0.60 0.70 0.80 0.90 1.00
0.10
0.20
0.30
0.40
0.50
0.60
0.70
0.80
0.90
1.00
Proportion of LOTE Speakers at home
Pro
por
tion
of E
MA
/You
th A
llow
ance
rec
ipie
nts
7
Group 8Group 9
4Group 6
Group 2Group 3
1
‘Like’ School group 5
School with0.14 LOTE
0.3 EMA/Y. A.in Group 5
0.00
0.00 0.10 0.20 0.30 0.40 0.50 0.60 0.70 0.80 0.90 1.00
0.10
0.20
0.30
0.40
0.50
0.60
0.70
0.80
0.90
1.00
Proportion of LOTE Speakers at home
Pro
por
tion
of E
MA
/You
th A
llow
ance
rec
ipie
nts
7
Group 8Low LOTE
HighEMA/YouthAllowance
Group 9Medium-High LOTE. High EMA/Youth Allowance
4 Group 5Group 6
Medium-High LOTE. Medium EMA/Youth Allowance
Group 2Group 3
Medium-High LOTE. Low EMA/Youth Allowance1
‘Like’ School group Boundaries
The boundaries of each of the ‘like’ school groups can also be shown on a graph.
When all the 114 schools in ‘like’ school group 5 are plotted, the position of the example school with a LOTE proportion of 0.14
and EMA/Youth Allowance of 0.3 can be seen in relation to others in the group.

[ 8 3 ]
‘Lik
e’ S
cho
ol G
roup
s 20
00V
CE
Pro
vid
ers
0.0
0.0
0.050.1
0.150.2
0.250.3
0.350.4
0.450.5
0.550.6
0.650.7
0.750.8
0.850.9
0.951.0
0.05
0.1
0.15
0.2
0.25
0.3
0.35
0.4
0.45
0.5
0.55
0.6
0.65
0.7
0.75
0.8
0.85
0.9
0.95
1.0
Proportion of EMA/Youth Allowance recipients
Pro
por
tion
of L
OTE
sp
eake
rs a
t ho
me
2369
87 14
5
The position of the school in relation to all VCE provider schools in the state is shown on the following graph.

[ 8 4 ]
The August census form contains all
information required to calculate the
proportion of students in receipt of
EMA/YOUTH ALLOWANCE and the
proportion of students where a language
other than English is the main language
spoken at home. An example of the
census form is given below.
In order to calculate the proportions for a particular school, three figures from the
census form are required.
the total number of students attending the school,
the number of students at the school for whom English is not the main language
spoken at home and
the number in receipt of either EMA or YOUTH ALLOWANCE.
This information is available from the totals row of the census form, for example:
Proportion of EMA/Youth Allowance = Number of students receiving EMA/Y.A.
total number of students in the school.
= 250/833
= 0.30
Proportion of NESB = Number of students where a LOTE
is the main language at home
total number of students in the school.
= 117/833
= 0.14
This places the school in ‘like’ school group 5.
I D E N T I F Y I N G T H E R E L E V A N T ‘ L I K E ’ S C H O O L G R O U P
Year of EMA/ Not English Total FTEEducation Youth Allowance spoken at home
P
1
etc.
12
Total FTE 250 117 833
A U G U S T C E N S U S F O R M D A T E P R I N T E D : 0 2 / 0 8 / 0 0


D E P A R T M E N T O F E D U C A T I O N , E M P L O Y M E N T A N D T R A I N I N G
ST
AN
DA
RD
SA
ND
AC
CO
UN
TA
BI
LI
TY
• V
CE
B
EN
CH
MA
RK
S0
0