swgdam interpretation guidelines for y-chromosome str typing
TRANSCRIPT
1 | P a g e
SWGDAM Interpretation Guidelines for
Y-Chromosome STR Typing by Forensic
DNA Laboratories
The Scientific Working Group on DNA Analysis
Methods, better known by its acronym of
SWGDAM, is a group of approximately 50
scientists representing Federal, State, and Local
forensic DNA laboratories in the United States and
Canada. During meetings, which are held twice a
year, Committees discuss topics of interest to the
forensic DNA community and often develop
documents to provide direction and guidance for the
community. This document was presented to
SWGDAM and received approval on January 9,
2014.
The guidelines described herein supersede the Scientific Working Group on DNA Analysis
Methods (SWGDAM) Y-chromosome Short Tandem Repeat (STR) Interpretation Guidelines
issued in 2009. In compiling this document, a number of revisions were made to the 2009
Table Of Contents
Introduction ......................................................... 2
Background .......................................................... 3
1. Application of Y-STR Typing ............................. 4
2. Preliminary Evaluation of Data........................ 5
3. Allele Designation ............................................ 5
4. Identification of Non-Allelic Peaks .................. 6
5. Application of the Stochastic Threshold ......... 7
6. Peak Height Ratio ............................................. 7
7. Number of Contributors to a DNA Profile ....... 7
8. Interpretation of DNA Typing Results ............. 8
9. Comparison of DNA Typing Results ................. 9
10. Statistical Analysis of DNA Typing Results .... 9
11. References .................................................... 15
Appendix 1 ......................................................... 18
Scientific Working Group on DNA Analysis Methods
Interpretation Guidelines for Y-Chromosome STR Typing
SWGDAM Y-STR Interpretation Guidelines – Approved 01/09/14
2 | P a g e
Guidelines which are intended to make it reflective of the current state of forensic Y-STR typing.
This document is not intended to invalidate any forensic Y-STR casework testing performed in
accordance with the previous guidelines nor be applied retroactively. SWGDAM’s inclusion of
this “retroactive” statement is intended to convey that the revised guidance be applied
prospectively and not retroactively. With the underlying assumption that work (validation,
training, analysis, interpretation) performed prior to the issuance of the revisions was appropriate
and scientifically valid, revision of the applicable guidelines is not intended to invalidate or call
into question the previous work.
Guidance is provided for forensic casework analyses on the identification and application of
thresholds for allele detection and interpretation, and appropriate statistical approaches to the
interpretation of Y-STR haplotypes including guidance on mixture interpretation. Laboratories
are encouraged to review their standard operating procedures and validation data in light of these
guidelines and to update their procedures as needed. This document is not intended to address
the interpretation of analytical results from Y-STR testing using enhanced low template DNA
techniques [i.e., such techniques are based on a laboratory’s internal validation and entail
conditions used in the analysis of low template DNA samples that result in an increased potential
for stochastic effects (such as allelic drop in or drop out, increased stutter and increased intra-
locus peak imbalance)].
Introduction
The interpretation of DNA typing results, to include the results of Y-STR testing, for human
identification purposes requires professional judgment and expertise. Additionally, laboratories
that analyze DNA samples for forensic casework purposes are required by the Quality Assurance
Standards for Forensic DNA Testing Laboratories to establish and follow documented
procedures for the interpretation of DNA typing results and reporting. Due to the multiplicity of
forensic sample types and the potential complexity of DNA typing results, it is impractical and
infeasible to cover every aspect of DNA interpretation by a preset rule. However, the laboratory
should utilize written procedures for interpretation of analytical results with the understanding
that specificity in the standard operating protocols will enable greater consistency and accuracy
among analysts within a laboratory. It is recommended that standard operating procedures for
SWGDAM Y-STR Interpretation Guidelines – Approved 01/09/14
3 | P a g e
the interpretation of DNA typing results be sufficiently detailed that other forensic DNA analysts
can review, understand in full, and assess the laboratory’s policies and practices. The
laboratory's interpretation guidelines should be based upon validation studies, scientific
literature, and experience.
Background
Please refer to the SWGDAM Interpretation Guidelines for Autosomal STR Typing by Forensic
DNA Testing Laboratories for general background information regarding forensic DNA analysis
and definition of terms.
For the purposes of forensic nuclear DNA testing, the typing of autosomal STR loci should
generally be performed due to their high power of discrimination and their utility for searching
against the National DNA Index System. Y-STR typing is an additional tool that can be used in
concert with autosomal typing for the recovery of male DNA profiles in male:female mixtures.
Y-STR typing is also used in lieu of autosomal typing for the detection of male DNA in mixtures
that contain an overabundance of female DNA. Given that under certain conditions a male
minor contributor in a mixture of female:male DNA may only be detectable by Y-STR typing,
laboratories should pursue Y-STR analysis as the most appropriate means of detecting a male
contributor(s) in some forensic samples.
Due to the transmission of the Y-chromosome within a paternal lineage, Y-STR typing can also
aid in the identification of missing persons.
Subsequent to a match between two samples using Y-STR testing, the Y-STR haplotype is
searched against a database of Y-STR haplotypes to estimate the population frequency of the
profile. It is noted that two specimens that exhibit the same Y-STR haplotype may have
originated from either a common individual source, from any male within the same paternal
lineage or unrelated individuals. A paternal lineage consists of those male relatives to whom the
same Y-chromosome has been transmitted from a common ancestor. Barring mutation, all male
relatives within the same paternal lineage have the same Y-STR profile. Attribution of the Y-
STR typing results to a single individual, to the exclusion of relatives in the paternal lineage, is
SWGDAM Y-STR Interpretation Guidelines – Approved 01/09/14
4 | P a g e
generally not possible based on Y-chromosome loci. However, loci with higher mutation rates
may enhance the ability to distinguish relatives in the same paternal lineage (Ballantyne et al.,
2012). In addition, unrelated individuals may exhibit the same Y-STR haplotype.
1. Application of Y-STR Typing
When the detection of male DNA is relevant in the context of a case, Y-STR typing may be
appropriate under certain conditions (e.g., in a mixture of male and female DNA, the alleles
of male origin are shared or otherwise indistinguishable from those of female origin, or a
relative abundance of female DNA precludes the detection of male alleles). Quantitative
PCR that enables the estimation of the quantities of both male and female DNA is an
important tool for the determination of an amplification strategy that maximizes the potential
for determining the male component(s) of a mixture.
1.1 The laboratory should establish guidelines that define the parameters under which
samples are subjected to Y-STR typing.
1.1.1 The ratio of the total (or female) DNA detected in a sample, relative to male
DNA, can generally be predictive of the ability to detect a male minor
contributor in a mixture of female:male DNA using autosomal typing.
1.1.1.1 Based on the autosomal amplification kit and detection
instrumentation used, the laboratory should establish guidelines (e.g.,
based on total:male DNA quantities) for when detection of a male
minor contributor to a mixture is not expected with autosomal typing.
1.1.2 If a ratio of total (or female) to male DNA is not used to determine the
suitability of autosomal and Y-STR typing, the laboratory should establish
alternative criteria for establishing amplification strategies to maximize the
potential for detecting male DNA.
1.1.3 Samples for which detection of a male minor contributor is not expected with
autosomal typing should be conserved for Y-STR typing
SWGDAM Y-STR Interpretation Guidelines – Approved 01/09/14
5 | P a g e
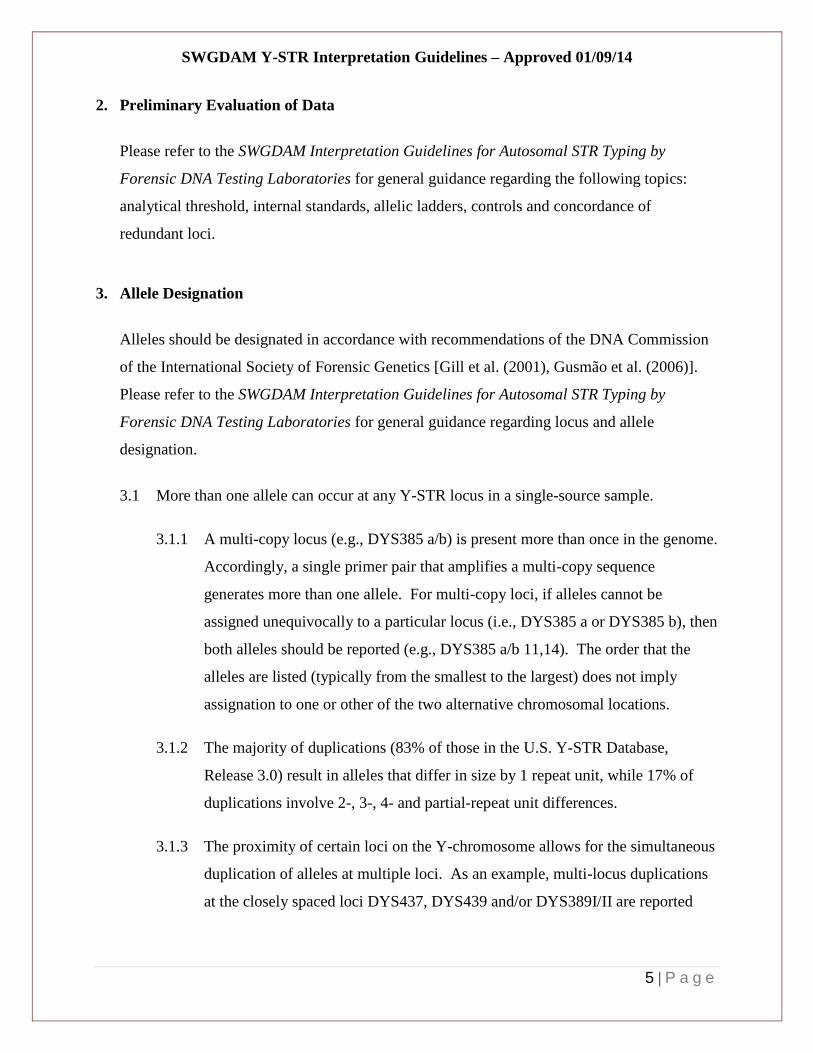
2. Preliminary Evaluation of Data
Please refer to the SWGDAM Interpretation Guidelines for Autosomal STR Typing by
Forensic DNA Testing Laboratories for general guidance regarding the following topics:
analytical threshold, internal standards, allelic ladders, controls and concordance of
redundant loci.
3. Allele Designation
Alleles should be designated in accordance with recommendations of the DNA Commission
of the International Society of Forensic Genetics [Gill et al. (2001), Gusmão et al. (2006)].
Please refer to the SWGDAM Interpretation Guidelines for Autosomal STR Typing by
Forensic DNA Testing Laboratories for general guidance regarding locus and allele
designation.
3.1 More than one allele can occur at any Y-STR locus in a single-source sample.
3.1.1 A multi-copy locus (e.g., DYS385 a/b) is present more than once in the genome.
Accordingly, a single primer pair that amplifies a multi-copy sequence
generates more than one allele. For multi-copy loci, if alleles cannot be
assigned unequivocally to a particular locus (i.e., DYS385 a or DYS385 b), then
both alleles should be reported (e.g., DYS385 a/b 11,14). The order that the
alleles are listed (typically from the smallest to the largest) does not imply
assignation to one or other of the two alternative chromosomal locations.
3.1.2 The majority of duplications (83% of those in the U.S. Y-STR Database,
Release 3.0) result in alleles that differ in size by 1 repeat unit, while 17% of
duplications involve 2-, 3-, 4- and partial-repeat unit differences.
3.1.3 The proximity of certain loci on the Y-chromosome allows for the simultaneous
duplication of alleles at multiple loci. As an example, multi-locus duplications
at the closely spaced loci DYS437, DYS439 and/or DYS389I/II are reported

SWGDAM Y-STR Interpretation Guidelines – Approved 01/09/14
6 | P a g e
within haplotypes in the U.S. Y-STR Database, as are multi-locus duplications
at the closely spaced DYS439 and DYS635.
3.1.4 Tri-alleles have been reported [e.g., in the U.S. Y-STR Database, Release 3.0
(23,419 haplotypes), at DYS385 a/b (24 occurrences) and DYS390 (1
occurrence)].
3.2 Occasionally, deletion of a portion of the Y-chromosome or a primer-binding site
mutation can result in the failure to detect one or more Y-STR loci. The majority of
null alleles occur at a single locus per haplotype. However, multi-locus null alleles can
occur due to deletion of loci that are within close proximity to one another (e.g.,
DYS437, DYS439 and DYS389I/II; and DYS391 and DYS635).
3.2.1 The laboratory should establish guidelines for the identification of such null
alleles. As an example, this guideline may be based on experimental studies
designed to distinguish a null allele from an undetected allele resulting from low
template amounts, DNA degradation or inhibition.
3.2.2 A designated null allele(s) can be used for searching the US Y-STR database.
3.3 Partial Y-STR haplotypes may be used for inclusionary and exclusionary purposes.
The laboratory should establish the minimum number of loci from an evidentiary
profile required to perform a comparison to a reference profile.
4. Identification of Non-Allelic Peaks
Y-STR typing results generated with the current Y-STR typing kits exhibit the same non-
allelic peaks observed in autosomal STR typing results. Please refer to the SWGDAM
Interpretation Guidelines for Autosomal STR Typing by Forensic DNA Testing Laboratories
for general guidance regarding non-allelic peaks and off-scale data.
SWGDAM Y-STR Interpretation Guidelines – Approved 01/09/14
7 | P a g e
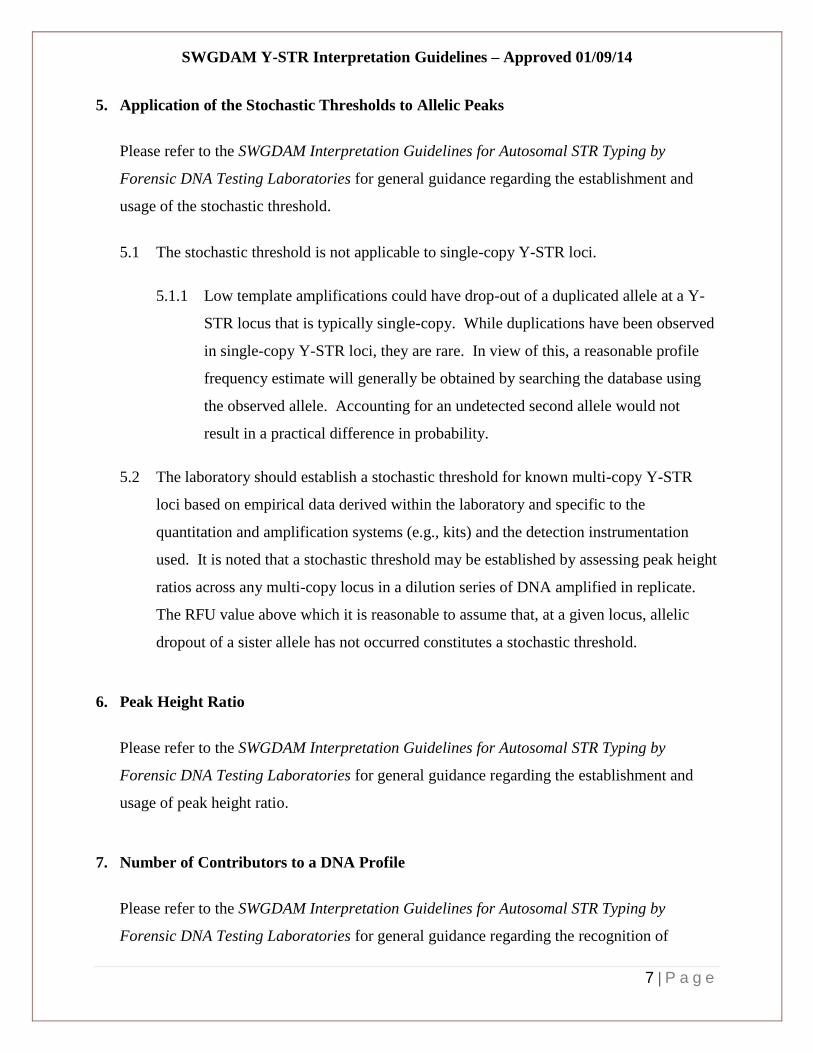
5. Application of the Stochastic Thresholds to Allelic Peaks
Please refer to the SWGDAM Interpretation Guidelines for Autosomal STR Typing by
Forensic DNA Testing Laboratories for general guidance regarding the establishment and
usage of the stochastic threshold.
5.1 The stochastic threshold is not applicable to single-copy Y-STR loci.
5.1.1 Low template amplifications could have drop-out of a duplicated allele at a Y-
STR locus that is typically single-copy. While duplications have been observed
in single-copy Y-STR loci, they are rare. In view of this, a reasonable profile
frequency estimate will generally be obtained by searching the database using
the observed allele. Accounting for an undetected second allele would not
result in a practical difference in probability.
5.2 The laboratory should establish a stochastic threshold for known multi-copy Y-STR
loci based on empirical data derived within the laboratory and specific to the
quantitation and amplification systems (e.g., kits) and the detection instrumentation
used. It is noted that a stochastic threshold may be established by assessing peak height
ratios across any multi-copy locus in a dilution series of DNA amplified in replicate.
The RFU value above which it is reasonable to assume that, at a given locus, allelic
dropout of a sister allele has not occurred constitutes a stochastic threshold.
6. Peak Height Ratio
Please refer to the SWGDAM Interpretation Guidelines for Autosomal STR Typing by
Forensic DNA Testing Laboratories for general guidance regarding the establishment and
usage of peak height ratio.
7. Number of Contributors to a DNA Profile
Please refer to the SWGDAM Interpretation Guidelines for Autosomal STR Typing by
Forensic DNA Testing Laboratories for general guidance regarding the recognition of
SWGDAM Y-STR Interpretation Guidelines – Approved 01/09/14
8 | P a g e
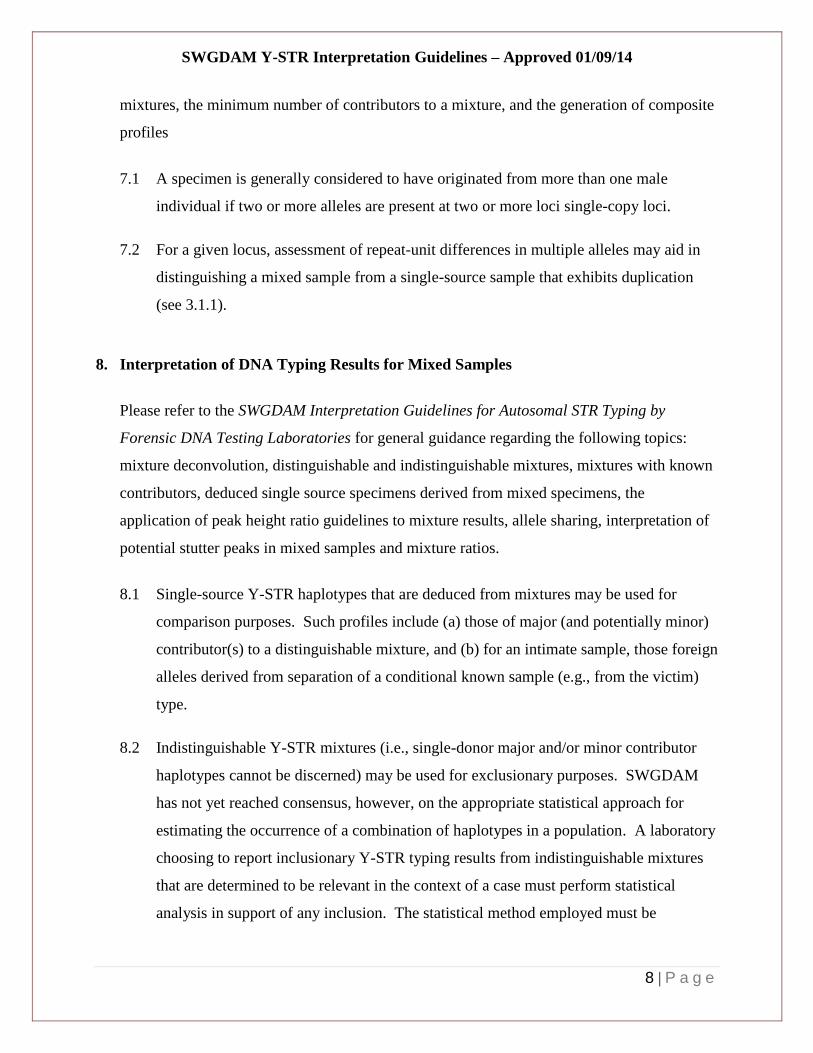
mixtures, the minimum number of contributors to a mixture, and the generation of composite
profiles
7.1 A specimen is generally considered to have originated from more than one male
individual if two or more alleles are present at two or more loci single-copy loci.
7.2 For a given locus, assessment of repeat-unit differences in multiple alleles may aid in
distinguishing a mixed sample from a single-source sample that exhibits duplication
(see 3.1.1).
8. Interpretation of DNA Typing Results for Mixed Samples
Please refer to the SWGDAM Interpretation Guidelines for Autosomal STR Typing by
Forensic DNA Testing Laboratories for general guidance regarding the following topics:
mixture deconvolution, distinguishable and indistinguishable mixtures, mixtures with known
contributors, deduced single source specimens derived from mixed specimens, the
application of peak height ratio guidelines to mixture results, allele sharing, interpretation of
potential stutter peaks in mixed samples and mixture ratios.
8.1 Single-source Y-STR haplotypes that are deduced from mixtures may be used for
comparison purposes. Such profiles include (a) those of major (and potentially minor)
contributor(s) to a distinguishable mixture, and (b) for an intimate sample, those foreign
alleles derived from separation of a conditional known sample (e.g., from the victim)
type.
8.2 Indistinguishable Y-STR mixtures (i.e., single-donor major and/or minor contributor
haplotypes cannot be discerned) may be used for exclusionary purposes. SWGDAM
has not yet reached consensus, however, on the appropriate statistical approach for
estimating the occurrence of a combination of haplotypes in a population. A laboratory
choosing to report inclusionary Y-STR typing results from indistinguishable mixtures
that are determined to be relevant in the context of a case must perform statistical
analysis in support of any inclusion. The statistical method employed must be

SWGDAM Y-STR Interpretation Guidelines – Approved 01/09/14
9 | P a g e
supported by empirical data and internal validation and documented in the laboratory’s
standard operating procedures.
9. Comparison of DNA Typing Results
Please refer to the SWGDAM Interpretation Guidelines for Autosomal STR Typing by
Forensic DNA Testing Laboratories for general guidance regarding the following topics:
interpretation of evidentiary profiles relative to that of known profiles, partial profiles,
possible conclusions, full accounting of mixed results, documentation of assumptions, and
results for which no comparisons will be made.
10. Statistical Analysis of DNA Typing Results
Please refer to the SWGDAM Interpretation Guidelines for Autosomal STR Typing by
Forensic DNA Testing Laboratories for general guidance regarding the following topics:
when to perform statistical analysis, data appropriate for use in statistical analysis, statistical
analysis for major contributors to distinguishable mixtures, reporting of statistical analysis,
and documenting the source of the population database(s) used in statistical analysis.
All Y-STR loci analyzed in commercial kits are physically linked on the Y-chromosome.
Due to the lack of recombination, the entire Y-chromosome haplotype must be treated as a
single locus. Haplotype frequencies are estimated using the counting method. The counting
method involves searching a given haplotype against a database to determine the number of
times the haplotype was observed in that database. The frequency of the haplotype in the
database is then estimated by dividing the count by the number of haplotypes searched.
A Y-STR profile probability can be estimated from the observed haplotype frequency by
attaching a confidence interval (generally 95% or greater) to the haplotype frequency
estimate to capture the effect of database size. The sampling variance of the profile
probability decreases as the database size increases.
SWGDAM Y-STR Interpretation Guidelines – Approved 01/09/14
10 | P a g e
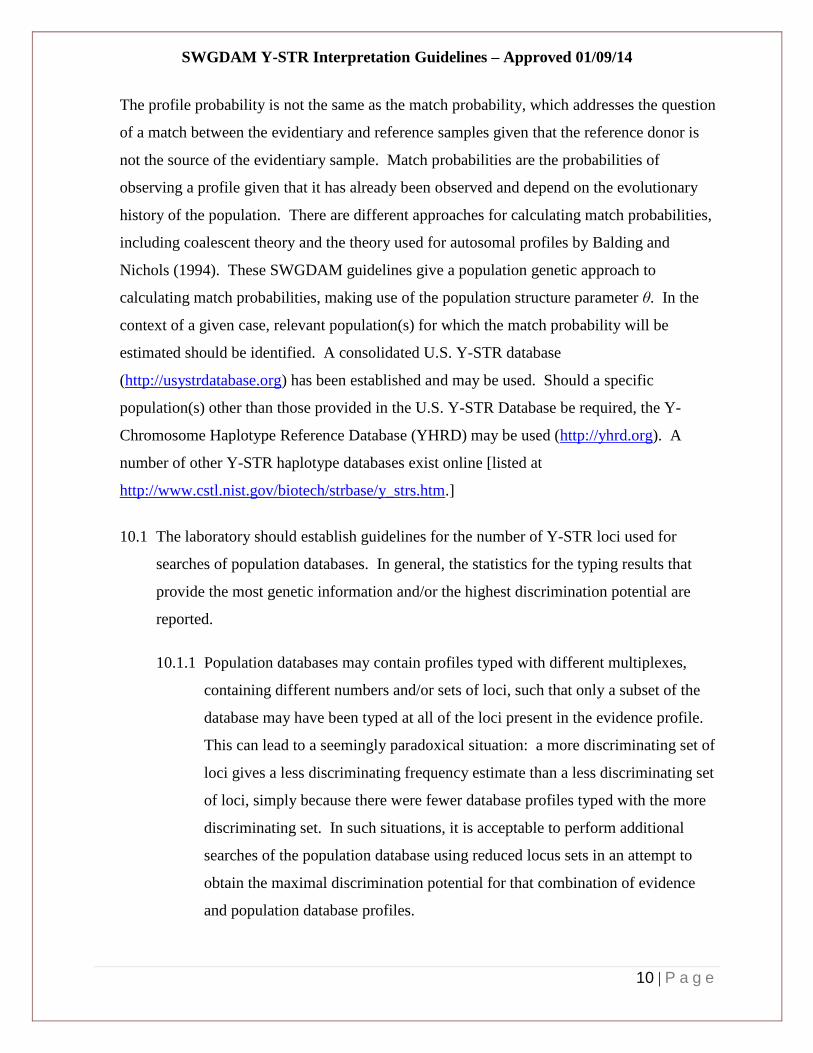
The profile probability is not the same as the match probability, which addresses the question
of a match between the evidentiary and reference samples given that the reference donor is
not the source of the evidentiary sample. Match probabilities are the probabilities of
observing a profile given that it has already been observed and depend on the evolutionary
history of the population. There are different approaches for calculating match probabilities,
including coalescent theory and the theory used for autosomal profiles by Balding and
Nichols (1994). These SWGDAM guidelines give a population genetic approach to
calculating match probabilities, making use of the population structure parameter θ. In the
context of a given case, relevant population(s) for which the match probability will be
estimated should be identified. A consolidated U.S. Y-STR database
(http://usystrdatabase.org) has been established and may be used. Should a specific
population(s) other than those provided in the U.S. Y-STR Database be required, the Y-
Chromosome Haplotype Reference Database (YHRD) may be used (http://yhrd.org). A
number of other Y-STR haplotype databases exist online [listed at
http://www.cstl.nist.gov/biotech/strbase/y_strs.htm.]
10.1 The laboratory should establish guidelines for the number of Y-STR loci used for
searches of population databases. In general, the statistics for the typing results that
provide the most genetic information and/or the highest discrimination potential are
reported.
10.1.1 Population databases may contain profiles typed with different multiplexes,
containing different numbers and/or sets of loci, such that only a subset of the
database may have been typed at all of the loci present in the evidence profile.
This can lead to a seemingly paradoxical situation: a more discriminating set of
loci gives a less discriminating frequency estimate than a less discriminating set
of loci, simply because there were fewer database profiles typed with the more
discriminating set. In such situations, it is acceptable to perform additional
searches of the population database using reduced locus sets in an attempt to
obtain the maximal discrimination potential for that combination of evidence
and population database profiles.
SWGDAM Y-STR Interpretation Guidelines – Approved 01/09/14
11 | P a g e
10.1.1.1 Regardless of the number or selection of loci searched, the most
discriminating search is generally the one which gave the lowest
proportion of matching haplotypes per number of profiles compared.
For example, U.S. Y-STR Database (Release 3.1) contains 1,984
samples with 23-locus profiles. Searching the database with a 23-
locus evidence profile would limit comparisons to just those 1,984
profiles. Searching that same evidence profile a second time using the
11-locus subset common to all profiles in the U.S. Y-STR Database
would increase the number of comparisons to 25,787 profiles.
10.1.1.2 When performing reduced locus-count searches, caution must be taken
to exclude any “matches” that would have been non-matches had more
of the evidence profile been searched. For example, a “match” at the
11 SWGDAM loci between the evidence and a population database
sample would not be included as a match for statistical purposes if the
profiles differed at any additional loci for which they both had
information.
10.2 The basis for the profile probability estimation is the counting method. The application
of a confidence interval accounts for database size and sampling variation.
10.2.1 The Y haplotype frequency (p) is calculated using the p = x/N formula, where x
is equal to the number of times the haplotype is observed in a database
containing N number of haplotypes. For example, if a haplotype has been
observed twice in a database of N = 2000, the frequency of that haplotype will
be: 2/2000 = 0.001.
10.2.2 Reporting a Y haplotype frequency, without a confidence interval, is acceptable
but only provides a factual statement regarding observations of a Y haplotype in
the database.

SWGDAM Y-STR Interpretation Guidelines – Approved 01/09/14
12 | P a g e
10.2.3 An upper confidence limit for the probability of the Y haplotype in the
population should be calculated using the method described by Clopper and
Pearson (1934). This uses the binomial distribution for the probabilities of
counts, including zero or other small numbers that are found for Y haplotypes.
If the database has n haplotypes and x of the haplotype of interest are found,
then the required upper confidence limit p0 is the solution to
Eq. 1
Here α gives the level of confidence: α = 0.05 gives a 95% confidence limit.
The equation finds the value p0 of the population proportion p for which the
cumulative probability 0, 1, . . . x copies of the profile is equal to α. This
equation will require a computer to solve. A special case of the result in
equation 1 is when the haplotype of interest is not seen in the database, and x =
0. The equation now has only one term in the sum on the left hand side: (1−
p0)n = α. The solution is
Eq. 2 p0 = 1 − α1/n
and for a 95% confidence limit this is very close to 3/n. (If n = 2000 the exact
95% upper confidence limit is 0.0014967, whereas 3/2000 is 0.0015.)
10.2.4 Typical Clopper and Pearson (1934) upper confidence interval p0 values at =
0.05 for various n and x are provided below for demonstrative purposes:
n = 500 n = 1,000 n = 5,000 n = 10,000 n = 50,000 n = 100,000
X
0 0.005974 0.002991 0.000599 0.000300 0.000060 0.000030
1 0.009452 0.004735 0.000948 0.000474 0.000095 0.000047
2 0.012538 0.006282 0.001259 0.000629 0.000126 0.000063
3 0.015434 0.007735 0.001550 0.000775 0.000155 0.000078
4 0.018213 0.009130 0.001830 0.000915 0.000183 0.000092
5 0.020910 0.010484 0.002101 0.001051 0.000210 0.000105

SWGDAM Y-STR Interpretation Guidelines – Approved 01/09/14
13 | P a g e
10.3 It is recognized that population substructure exists for Y-STR haplotypes. Studies with
current population databases have shown that multi-locus θ values are very small for
most populations, with the magnitude of the value being inversely proportional to the
number of Y-STR loci. Theta (θ) is used in the following equation for the match
probability:
Eq. 3 Pr(A│A) = θ + (1 – θ) pA
where A is the haplotype of interest and Pr(A│A) is the probability of observing
haplotype A given that it has already been seen once in another individual of the same
subpopulation. pA is the profile probability which can be estimated by the counting
method, with sampling uncertainty being accommodated by using the upper confidence
limit for the estimate of pA.
10.3.1 Equation 3 is a match probability. It is the haplotype analog of the formulae
described in National Research Council (1996) Recommendation 4.2. The
match probability, or a likelihood ratio that incorporates the match probability,
should be reported.
10.3.1.1 For example, a match probability of 0.001 means that there is a 1 in
1000 chance of randomly selecting a second individual with this
profile given that it has already been observed once.
10.3.1.2 When the evidence profile is determined to be single source, the
inverse of the match probability (Eq. 3) is the likelihood ratio. For
example, a match probability of 0.001 means that the DNA match is
1000 times more likely to occur if the reference individual (or a
patrilineal relative) is the contributor than if the source of the evidence
is a randomly selected individual from the same population.
10.3.2 Due to an increase in the overall haplotype mutation rate, the magnitude of
decreases as the number of loci increases. Similarly, for multiplexes with

SWGDAM Y-STR Interpretation Guidelines – Approved 01/09/14
14 | P a g e
identical numbers of loci, the magnitude of theta will be lower for the multiplex
with a higher overall mutation rate.
10.3.3 Estimates of for Equation 3 are provided in Appendix 1. Other estimates of
have been published [Budowle et al. (2009a), Budowle et al. (2009b),
Cockerton et al. (2012), Ge et al. (2010a)].
10.3.3.1 For partial Y-STR profiles, a value from Appendix 1 should be
selected based on the number of loci used.
10.3.4 The advent of new multiplexes (i.e., with additional Y-STR loci, or with a
different set or subset of loci) will necessitate additional studies of which will
be made available through SWGDAM.
10.3.5 Empirical studies of reflect the database used. estimates will change as the
number of profiles in the database change. The changes in estimates are
expected to be small for small proportional changes in the number of profiles.
10.4 While SWGDAM recommends the usage of match probabilities as formulated in
Equation 3, alternate statistical approaches for inclusionary Y-STR typing results have
been described [e.g., Brenner (2014)]. The statistical method employed by the
laboratory must be supported by empirical data and internal validation and documented
in the laboratory’s standard operating procedures.
10.5 The match probabilities for autosomal and Y-STR typing results obtained for a given
sample may be combined. The independent inheritance of these systems suggests
independence of the profile probabilities. However, there are dependencies between
match probabilities among autosomal and Y profiles. These dependencies are low for
populations with low ethnic heterogeneity but they increase as population structure
increases. An approach to accommodate autosomal and Y profile dependencies was
given by Walsh et al. (2008) and developed further by work currently in progress
[preliminary results were reported by Weir et al. (2013).] Such dependencies are

SWGDAM Y-STR Interpretation Guidelines – Approved 01/09/14
15 | P a g e
negligible for match probabilities of the values currently seen when the focus is on
matches to unrelated individuals, or to those more distantly related than first cousins.
10.5.1 Combining autosomal and Y-STR results requires a consistent approach to the
statistical question being addressed. Under the assumption of negligible
dependencies, the match probability formula (Eq. 3) is to be multiplied by the
autosomal match probability as defined by National Research Council (1996)
Recommendation 4.2.
10.6 Prior to reporting combined statistics for mtDNA and Y-STR results, the laboratory
issuing the report should verify that each population used demonstrates independence
between the mtDNA and Y-STR results. If independence cannot be demonstrated
between the mtDNA and Y-STR results for the referenced population(s), combining
these systems is not recommended. Ge et al. (2010b) and Roby et al. (2009) report
evidence of statistical independence between mtDNA and Y-STR profiles in U.S. and
Chilean populations.
10.7 The CODIS software generates a combined likelihood ratio for autosomal, mtDNA and
Y-STR results for missing person searches to rank potential candidates. However, this
value is not intended to be a reporting statistic.
11. References
Balding, D.J. and Nichols, R.A. DNA profile match probability calculations; how to allow for
population stratification, relatedness, database selection and single bands, Forensic Science
International (1994) 64:125-140.
Ballantyne, K.N., Keerl, V., Wollstein, A., Choi, Y., Zuniga, S.B., Ralf, A., Vermeulen, M., de
Knijff, P., and Kayser, M. (2012). A new future of forensic Y-chromosome analysis: Rapidly
mutating Y-STRs for differentiating male relatives and paternal lineages, Forensic Science
International: Genetics 6, 208–218.
Bhatia, G., Patterson, N., Sankararaman, S., and Price, A. Estimating and interpreting FST: The
impact of rare variants, Genome Research (2013) 23:1514-1521.
Brenner, C.H. Understanding Y haplotype matching probability, Forensic Science International:
Genetics (2014) 8:233-243.

SWGDAM Y-STR Interpretation Guidelines – Approved 01/09/14
16 | P a g e
Buckleton, J., Krawczak, M., and Weir, B. The interpretation of lineage markers in forensic
DNA testing, Forensic Science International: Genetics (2011) 5:78-83.
Budowle, B., Ge, J., Aranda, X.G., Planz, J.V., Eisenberg, A.J., and Chakraborty R. Texas
Population Substructure and Its Impact on Estimating the Rarity of Y STR Haplotypes from DNA
Evidence, Journal of Forensic Sciences (2009a) 54:1016-1021.
Budowle, B., Ge, J., Lowe, J., Lai, C., Wong, H.Y., Law, G., Tan, W.F., Chang, Y.M., Perumal,
R., Keat, P.Y., Mizumo, N., Kasai, K., Sekiguchi, K., and Chakraborty, R. The effects of Asian
population substructure on Y STR forensic analysis, Legal Medicine (2009b) 11:64-69.
Butler, J.M., Decker, A.E., Kline, M.C., and Vallone, P.M. Chromosomal duplications along the
Y-Chromosome and their potential impact on Y-STR interpretation, Journal of Forensic Sciences
(2005) 50:853-859.
Butler, J.M. and Schoske, R. Duplication of DYS19 flanking regions in other parts of the Y
chromosome, International Journal of Legal Medicine (2004) 118:178-183.
Cockerton, S., McManus, K., and Buckleton, J. Interpreting lineage markers in view of
subpopulation effects, Forensic Science International: Genetics (2012) 6:393-397.
Clopper, C. and Pearson, E. The use of confidence or fiducial limits illustrated in the case of
binomial, Biometrika (1934) 26:404-413.
Committee on DNA Forensic Science, National Research Council. An Update: The Evaluation
of Forensic DNA Evidence, National Academy Press, Washington, DC, 1996.
Ge, J., Budowle, B., Planz, J.V., Eisenberg, A.J., Ballantyne, J., and Chakraborty R. US forensic
Y-chromosome short tandem repeats database, Legal Medicine (2010a) 12:289-295.
Ge, J., Chakraborty, R., and Budowle, B. Test of independence in contingency tables of large
dimension with ordered categories and its application in population genetics, Abstract Volume
of the American Society of Human Genetics 60th Annual Meeting, Washington DC (November
2-6, 2010b; Abstract # 3045/F).
Ge, J., Budowle, B., and Chakraborty R. Choosing relatives for DNA identification of missing
persons, Journal of Forensic Sciences (2011) 56:S23-S28.
Gill, P., Brenner, C., Brinkmann, B., Budowle, B., Carracedo, Á., Jobling, M.A., de Knijff, P.,
Kayser, M., Krawczak, M., Mayr, W.R., et al. (2001). DNA Commission of the International
Society of Forensic Genetics: recommendations on forensic analysis using Y-chromosome STRs,
Forensic Science International 124, 5–10.
Gusmão, L., Butler, J.M., Carracedo, Á., Gill, P., Kayser, M., Mayr, W.R., Morling, N., Prinz,
M., Roewer, L., Tyler-Smith, C., et al. (2006). DNA Commission of the International Society of

SWGDAM Y-STR Interpretation Guidelines – Approved 01/09/14
17 | P a g e
Forensic Genetics (ISFG): An update of the recommendations on the use of Y-STRs in forensic
analysis, Forensic Science International 157, 187–197.
Kayser, M., Brauer, S., Willuweit, S., Schadlich, H., Batzer, M.A., Zawacki, J., Prinz, M.,
Roewer, L. and Stoneking, M. Online Y-chromosomal short tandem repeat haplotype reference
database (YHRD) for U.S. populations, Journal of Forensic Sciences (2002) 47:513-519.
Mulero, J.J., Chang, C.W., Calandro, L.M., Green, R.L., Li, Y, Johnson, C.L. and Hennessy,
L.K. Development and validation of the AmpFlSTR YFiler PCR amplification kit: a male
specific, single amplification 17 Y-STR multiplex system, Journal of Forensic Sciences (2006)
51:64-75.
Roby, R.K., Gonzalez, S.D., Phillips, N.R., Planz, J.V., Thomas, J.L., Pantoza-Astudillo, J.A.,
Ge, J., Morales, E.A., Eisenberg, A.J., Chakraborty, R., Bustos, P., and Budowle, B. Autosomal
STR allele frequencies and Y-STR and mtDNA haplotypes in Chilean sample populations,
Forensic Science International: Genetics, Supplemental Series (2009) 2:533-534.
Walsh, B., Redd, A.J., and Hammer, M.F. Joint match probabilities for Y chromosomal and
autosomal markers, Forensic Science International (2008) 174:234-238.
Weir, B.S., Ballantyne, J., Bright, J.-A., Buckleton, J., Curran, J., Laurie, C., Moretti, T., and
Myers, S. Y-STR matching: A population-genetic perspective, 25th World Congress of the
International Society for Forensic Genetics (2013). http://isfg2013.org/wp-
content/uploads/2013/09/Thu-P3-1230-B-Weir-Y.pdf
Weir, B.S. and Cockerahm, C.C. Estimating F-statistics for the analysis of population structure,
Evolution (1984) 38:1358-1370.
SWGDAM Y-STR Interpretation Guidelines – Approved 01/09/14
18 | P a g e
Appendix 1
Estimation of (or FST) using African American, Asian, Caucasian, Hispanic, and Native
American population data from the U.S. Y-STR Database release 3.2 follows from methods
described by Weir and Cockerham (1984), recently modified following a suggestion of Bhatia et
al. (2013). describes the chance of haplotypes being the same within populations relative to
the chance of them being the same between populations. The original work of Weir and
Cockerham assumed the same value of applied to all populations, and haplotype frequencies
were weighted by sample sizes in calculating averages. When differs among populations it is
more appropriate to use unweighted averages, and the analyses can be cast in terms of the
proportions of pairs of haplotypes that match, within and between populations. This method was
described by Weir et al. (2013), and a peer-reviewed publication is forthcoming.
To provide values (Table 1) for partial as well as full profiles, was estimated for all possible
subsets of loci for each of three multiplexes (Figures 1 and 2). For convenience, was assumed
to be the same for all haplotypes with the same number of loci. Although there is variability
among single loci, the variability in among sets of larger numbers of loci is small, and the
numerical values shown are good indicators of the effects of changing the number of loci.

SWGDAM Y-STR Interpretation Guidelines – Approved 01/09/14
19 | P a g e
Table 1. estimates1 for all possible subsets of loci
2 for each of three multiplexes
Loci3 For African Americans,
Asians, Caucasians &
Hispanics
For African Americans,
Asians, Caucasians,
Hispanics &
Native Americans
1 0.06 0.06
2 0.04 0.04
3 0.03 0.03
4 0.02 0.02
5 0.008 0.008
6 0.005 0.005
7 0.003 0.003
8 0.002 0.002
9 0.001 0.002
10 0.0006 0.002
11 0.0004 0.0009
12 0.0002 0.0007
13 0.0002 0.0006
14 0.0001 0.0005
15 0.00008 0.0005
16 0.00006 0.0004
17 0.00003 0.0004
18 0.00003 0.0004
19 0.00003 0.0003
20 0.00002 0.0003
21 0.00002 0.0003
22 0.00002 0.0003
1
Theta estimates are based on the maximum value observed among the three multiplexes shown
in Figures 1 and 2.
2 Theta estimates were calculated using average matching proportions across all possible
combinations of loci within each multiplex for the numbers of loci represented above (e.g., the
average matching proportion for all 170,544 15-locus combinations that can occur with the
PowerPlex Y23 multiplex).
3 DYS385a,b was counted as a single locus.

SWGDAM Y-STR Interpretation Guidelines – Approved 01/09/14
20 | P a g e
Figure 1. PowerPlex Y, Yfiler and PowerPlex Y23 estimates excluding Native American
population data
Figure 2. PowerPlex Y, Yfiler and PowerPlex Y23 estimates including Native American
population data
1.E-05
1.E-04
1.E-03
1.E-02
1.E-01
1.E+00
0 5 10 15 20
Loci
PPY Yfiler PPY23 Recommended (Table 1)
1.E-05
1.E-04
1.E-03
1.E-02
1.E-01
1.E+00
0 5 10 15 20
Loci
PPY Yfiler PPY23 Recommended (Table 1)