swoogo.s3.amazonaws.com · slide 1 getting past the bs of marketing productivity measurement ......
TRANSCRIPT
Slide 1
Getting Past the BS of Marketing Productivity MeasurementThe future as suggested by the 60 CMO & marketing leaders of the MMA Boards (and an investment of $3 million)
Mobile Marketing Assoc.Greg Stuart
___________________________________
___________________________________
___________________________________
___________________________________
___________________________________
___________________________________
___________________________________
Slide 2 “The world is not just changing, it is being reshaped, and is starting to operate differently, in many realms, all at once.”
Thank you for Being Late – Thomas Friedman
___________________________________
___________________________________
___________________________________
___________________________________
___________________________________
___________________________________
___________________________________
Slide 3
1. Started to solve a problem for mobile… What is the real, proven ROI of Mobile?
2. …Led the board to discover real problem…and that there is huge opportunity for a complete rethink of marketing productivity measurement
3. …and that MTA is the solution (and the curse)Problem is that MTA is early
4. Finally, what we know now in MTA and what we are doing about it
Our Agenda For Today
___________________________________
___________________________________
___________________________________
___________________________________
___________________________________
___________________________________
___________________________________

Slide 4 First: MMA is Industry Trade Assoc. for Mobile Marketing
Started in 2003; turned around in 2013
Marketer led; plus media sellers, tech and agencies
800+ members worldwide
50+ staff worldwide
Operating in 12 countries
20+ events in 15 countries
MMAAPAC
MMAEMEA
MMALATAM
MMANo. Amer.
4
___________________________________
___________________________________
___________________________________
___________________________________
___________________________________
___________________________________
___________________________________
Slide 5 Governance: MMA Global Board of Directors
Sanjay GuptaChairCMO
Tim MahoneyExec Comm at Large
CMO
Carolyn EversonGlobal Secretary
VP, Global Mktg Solutions
Luis Di ComoExec Comm at Large
SVP, Global Media
Jack PhilbinExec Comm at Large
Co-Founder & CEO
Greg StuartMMA
CEO Mobile Marketing Association
John CostelloGlobal Chair Emeritus
Former Pres., Global Mktg & Innovation
Stephen McCarthyGlobal Treasurer
CFO(xAd)
Susan CanavariChief Brand Officer
Ilonka LavizGlobal Digital Mktg
Dir., Global eBusiness
Peter McGuinness
Chief Mktg & Brand Officer
Marc MathieuCMO
Karin TimponeGlobal Mktg Officer
Allan ThygesenPresident, Americas
Jeff LucasCRO
Matt DerellaGlobal CRO
Peter HamiltonCEO
John TrimbleCRO
David GodsmanCDO
Suzy DeeringCMO
Rebecca MessinaCMO
Ayesha GilardeCMO
Wanda YoungCMO
Tony RogersCMO
Michael DonnellyNA Regional Rep
SVP, Global Digital Marketing
Louis PaskalisNA Regional Rep.SVP Enterprise Media
Executive Bank Of America
Ernesto EcheverriLATAM Regional Rep
Dir. Mktg USA, Canada & Caribbean
Alberto ‘Banano’ PardoLATAM Regional Rep
Founder & CEO
David LowesEMEA Regional Rep
CMO
Cameron ClaytonCEO & General
Manager
David PorterAPAC Regional Rep
VP, Global Media
___________________________________
___________________________________
___________________________________
___________________________________
___________________________________
___________________________________
___________________________________
Slide 6 Governance: MMA North America Board of Directors
Kristi ArgyilanAt Large
SVP,Marketing
Target
6
Louis PaskalisChair
SVP, Enterprise Media Executive, Bank of
America
Amit ShahCMO
1-800-Flowers.comGreg Stuart
MMACEO Mobile Marketing
Association
Jack PhilbinChair Emeritus
Co-Founder & CEO, Vibes
Michael DonnellyChair Emeritus
SVP, Digital Experiences Group
MasterCard
Jay AltschulerVP, Media VP,
MediaSamsung
Kim GnattGlobal Group Director
Digital MarketingThe Coca-Cola Company
Josh WetzelSr. Director
Sales & MarketingeBay
Todd PollakManaging Director
US Product Specialist Team
Gail TiffordVP
Media & Digital Engagement
Unilever
Dave SanabriaConnected Consumer
Experiences Ford
Danielle LeeGlobal Head
of Partner SolutionsSpotify
Brad FeinbergSenior Director Media & Digital
MillerCoors
Elizabeth Herbst-BradyHead of NY Ad
SalesSnap Inc.
Tatyana ZlotskyVice President
Digital AcquisitionAmerican Express
OPEN
Theresa AgnewCMO
North AmericaGlaxoSmithKlin
Carrie (Himelfarb) Seifer
VP, CRO, IBM Watson Advertising(The Weather Company)
Ran Ben-YairCEO & Co-Founder
Ubimo
Jay EmmetGM
Open MarketNorth America
Duncan McCall CEO & Co-Founder
PlaceIQ
Steven RosenblattPresident
Foursquare
Jon Suarez-DavisChief Strategy OfficerSalesforce Marketing
Cloud
Rohit TripathiGM
SAP Mobile Services
SAP
Joe PruszHead of Global Sales
Rubicon Partners
Şekip Can GökalpEVP, Exchange
AdColony
Norman DeGreve CMOCVS
Mike RomoffHead of Global
Agency and Channel Sales,
Mark WrightVP Media Services & Sponsorships,
AT&T
Marissa TarletonCMO, RetailMeNot
JP MaheuVP, Twitter
Client Solutions, Americas
Pamela MoyVP of Marketing
Allstate
James KrecklerSVP Digital Media
NBCU
Carla Hassan EVP, Global CMO
Toys R Us
Kristen D’Arcy, Head of
Performance Digital MarketingAmerican Eagle
Amit ShahAt Large
CMO1-800-Flowers.com
Jack PhilbinChair Emeritus
Co-Founder & CEO, Vibes
Michael DonnellyChair Emeritus
SVP, Digital Experiences Group
MasterCard
___________________________________
___________________________________
___________________________________
___________________________________
___________________________________
___________________________________
___________________________________
Slide 7 In 2011, Mobile Had
a Real Problem
NO measurement company or platform
was able to measure the Value/ROI of Mobile in
the Marketing Mix
7
Mobile is the single greatest revolution in
consumer media habits in our generation
___________________________________
___________________________________
___________________________________
___________________________________
___________________________________
___________________________________
___________________________________
Slide 8 SMoX was Our Answer! What is ?
A research methodology designed to isolate and measure the ROI of TV, Radio, Print, Internet and Mobile• And measure sub-segments Mobile Video, Display, Audio, Social, Plus
• And sub-segments of those in combo of audience and various data
It is real world, in-market, campaign measurement• That looks at the investment value of each dollar
• Therefore factoring placement/channel, creative effectiveness, and cost
Note: The Brands pay for their participation and must agree to let us use their name and release results.
___________________________________
___________________________________
___________________________________
___________________________________
___________________________________
___________________________________
___________________________________
Slide 9 To Date: We’ve Measured 11 In-Market Campaigns
9
Association of National Advertisers
American Association of Advertising Agencies
Partners
2
___________________________________
___________________________________
___________________________________
___________________________________
___________________________________
___________________________________
___________________________________
Slide 10
TV
Internet
FSI
Cinema
Social
Radio
OOH
Mobile DisplayDisplay, video,social
Display, video, native,
location
Display,audio, video social
Display,video, social
Display, video, social
Display, video, social
Display, RM,
Weather targeting,
social, video
Display, Video,
behavioral, retargeting,location,
contextual
Display, Video,
RM, socialContextual, location, daypart10
2014 2015 2015 2015 2016 2016 2016 2016 2017 2017
Each Campaign Measured a Variety of Media Mixes
___________________________________
___________________________________
___________________________________
___________________________________
___________________________________
___________________________________
___________________________________
Slide 11 Mobile has expanded and become more granular
11
Static Display
300x50300x250
StaticDisplay, Video,Mobile social
Static display,video, Mobile social
Static display,video, Mobile social
Static display,video, Mobile social
Static Display,Audio, Mobile Video
Mobile Social
Static Display, Video, Mobile native,
Location (proximity and HLA)
Static Display 300x50
300x250, Rich Media,
Video Mobilesocial,
Weather targeting, Past user targeting
Static Display, Video, :15 :30, Audio,
:15, :30 Pre-roll,
in banner/ auto play, in
banner/ opt-in,
Contextual targeting
Behavioral, Retargeting,
location(proximity, audience)
Static Display, 300x50
300x250InterstitialRich Media
Video, MobileSocial
Contextual, daypart,Location
proximity, conquesting, historic segments
commuters, coupon
users
___________________________________
___________________________________
___________________________________
___________________________________
___________________________________
___________________________________
___________________________________
Slide 12
Offline Sales DataFrom customer
Repository of Person Level Data, with PII
information for automated matching
Anonymized and integrated data at the individual level
across all data sources
Complete Dataset to Marketing Evolution
for analytics
Media ExposureAd Agency/Trading Desk/ DSP
Survey Sample Attitudinal metrics &
Psychographics
$ $ $ $
*Alternate processes are available ig LiveRamp is not an option for the customer specific situation.
SMoX: Brings together Audience Viewing Data, with Survey based Brand Attitudes and Sales Data at the USER LEVEL
12
___________________________________
___________________________________
___________________________________
___________________________________
___________________________________
___________________________________
___________________________________

Slide 13
0%
2%
4%
6%
8%
10%
12%
14%
16%
18%
20%
0 2 4 6 8 10 12
Poin
t Inc
reas
e in
Sho
ppin
g In
tent
Frequency of Exposure
Broadcast
Cable
Digital Display
Social Media
Mobile Social
Mobile Location
Mobile Native
Target: Moms 18-49, with BTS Shopping IntentSource: Walmart BTS Survey; Data Collected from: 7/18 – 9/8
Basically, What SMoX Provides are ROI Performance Curves by MediumBroadcast, Cable and Digital are all far from saturation, indicating that further campaign spend across channels will continue to drive Intent.
Frequency to Lift ResponseIntent to Shop Walmart for BTS Grocery
Average Media Frequency to Date
Display
___________________________________
___________________________________
___________________________________
___________________________________
___________________________________
___________________________________
___________________________________
Slide 14 Which is able to produce Optimal Budget Allocation: In this case to drive “Intent to Shop” Brand for Walmart
In an optimal allocation of media dollars, 9% is allocated to Mobile – primarily shifting budget from FSI and Cable TV.
9%
19%
38%
40%
21%
14%24%
6%
12%6%
7%
2014 Full Campaign Optimized
2014 Full Campaign Budget
3%
Broadcast TVCable TV
DigitalMobile
FSI
Social Media
Target: Moms 18-49, with BTS Shopping IntentSource: Walmart BTS Survey; Data Collected from: 7/18 – 9/8Media Mix: Max 2x planned spend, Min ½ planned Spend
People Impacted: 6.2MM+17.3% of the
W18-49 Population
People Impacted: 10.2MM+28.5% of the
W18-49 Population
+64%
___________________________________
___________________________________
___________________________________
___________________________________
___________________________________
___________________________________
___________________________________
Slide 15 Overall, SMoX Patterns in Optimized Marketing Mixes suggest that Mobile should be 15%-20% of Total Media
15
1%5% 4% 6% 5%
12% 11%16%
26%
20%
15%12%
15% 15%19%
17% 17%
0%
5%
10%
15%
20%
25%
30%
35%
AT&T Gold PeakTea/Coca Cola
MasterCard Walmart 825 Coca ColaChina
Coca ColaBrazil
UnileverMagnum
Allstate Wendys
% of mobile display in the mx (ex search)
Optimal allocations to Mobileas a percentage of total marketing mix
Gap to Optimal
Actual Spend
___________________________________
___________________________________
___________________________________
___________________________________
___________________________________
___________________________________
___________________________________

Slide 16 And when Mobile is Optimized we see Gains of nearly 20% in Brand metrics and 7% to 60% in Sales
16
18%7% 17% 14% 16%
60%
13% 7%0%
25%
50%
75%
100%
125%
150%
175%
AT&T Gold PeakTea/Coca
Cola
MasterCard Walmart 825 Coca ColaChina
Coca ColaBrazil
UnileverMagnum
Allstate Wendys
% of mobile display in the mx (ex search)
Increase in Key Business Outcomes Based Mobile in the Mix versus No Mobile
Increase in KeyBusiness Outcomes
Sales
SalesSalesSalesSalesBrand
Sales
Image
___________________________________
___________________________________
___________________________________
___________________________________
___________________________________
___________________________________
___________________________________
Slide 17 SMoX Informed the Case to Drive MTA
What Did SMoX Tell us about the Opportunity
for MTA and it’s importance
17
Measuring Mobile is not the issue. It is
measuring the whole marketing stack, “in all it’s permutations”
___________________________________
___________________________________
___________________________________
___________________________________
___________________________________
___________________________________
___________________________________
Slide 18
18
Just Looking at Ads, Doesn’t tell us the Whole Story
18
Branding:Aided Awareness/
$ spent*
Sales:ROI
Mobile Displaywith weathertargeting
MobileDisplay
Campaign Average(across all media) 100 100
*Index is based on Number of people who became aware of Magnum per $ spent.
200 147175 ZERO
___________________________________
___________________________________
___________________________________
___________________________________
___________________________________
___________________________________
___________________________________

Slide 19
*Index is based on Number of people who became more likely to consider Allstate / $ spent
We’ve Consistently Seen How Targeting Improves Performance. But how much?
Mobile Video Targeting Consideration / $ Spent
+ Behavioral targeting
+ Contextual targeting
Demographictargeting 100
19
320191
___________________________________
___________________________________
___________________________________
___________________________________
___________________________________
___________________________________
___________________________________
Slide 20
Then Suddenly, Everything Changed
___________________________________
___________________________________
___________________________________
___________________________________
___________________________________
___________________________________
___________________________________
Slide 21
Proprietary & Confidential 21
___________________________________
___________________________________
___________________________________
___________________________________
___________________________________
___________________________________
___________________________________
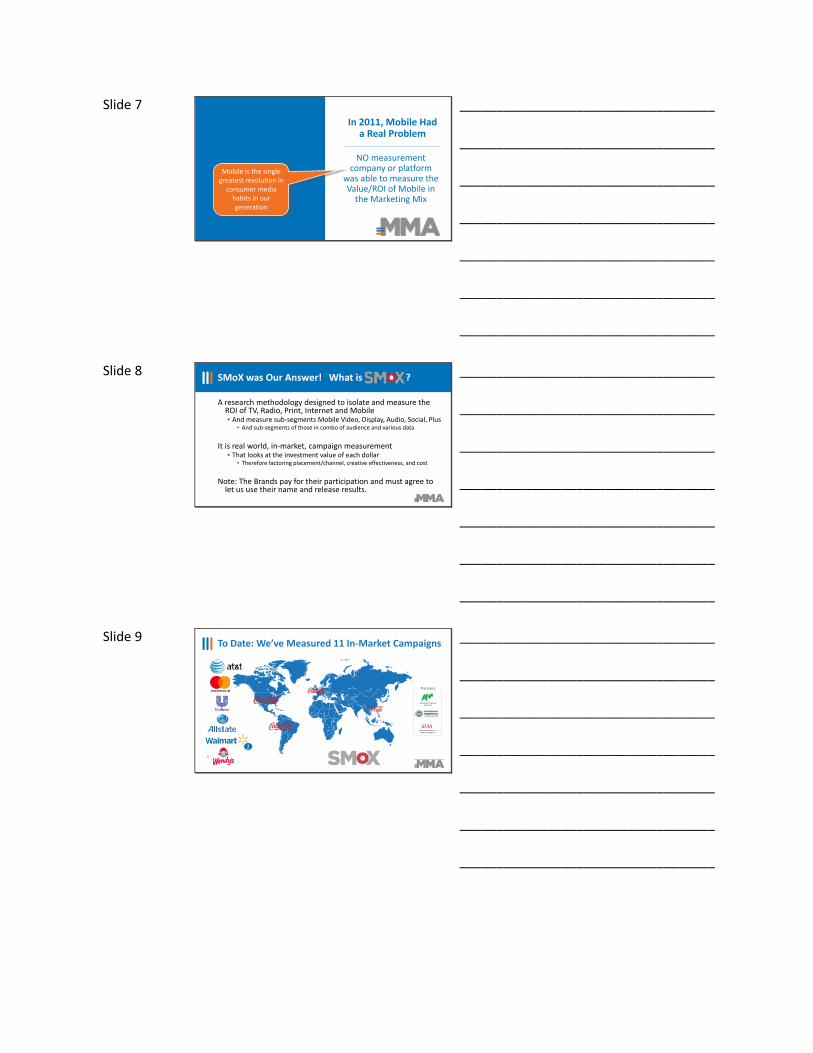
Slide 22 And New Data integrations makes new Opportunities (audience & performance) possible
Foot traffic /$ spent*
Commuter
Coupon User
Campaign Average(across all media) 100
518500
22
___________________________________
___________________________________
___________________________________
___________________________________
___________________________________
___________________________________
___________________________________
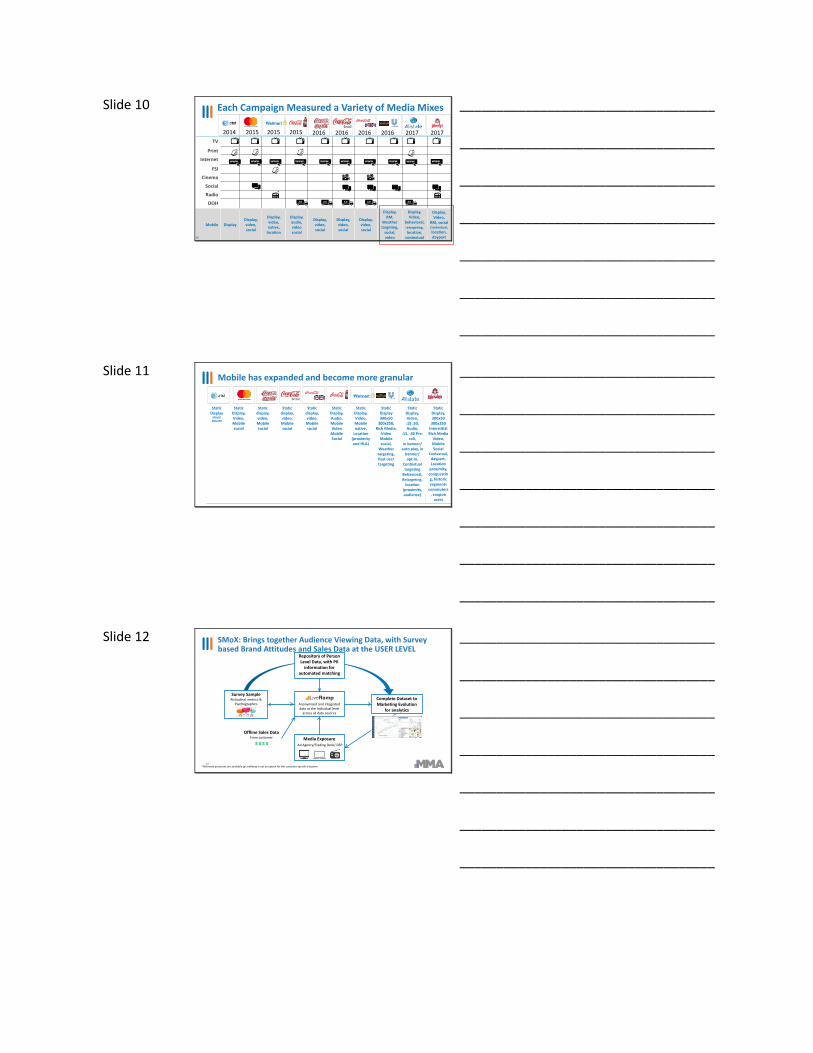
Slide 23 The Impact of getting it RIGHT?
33%Of the mixin mobile
+166%Foot traffic
___________________________________
___________________________________
___________________________________
___________________________________
___________________________________
___________________________________
___________________________________
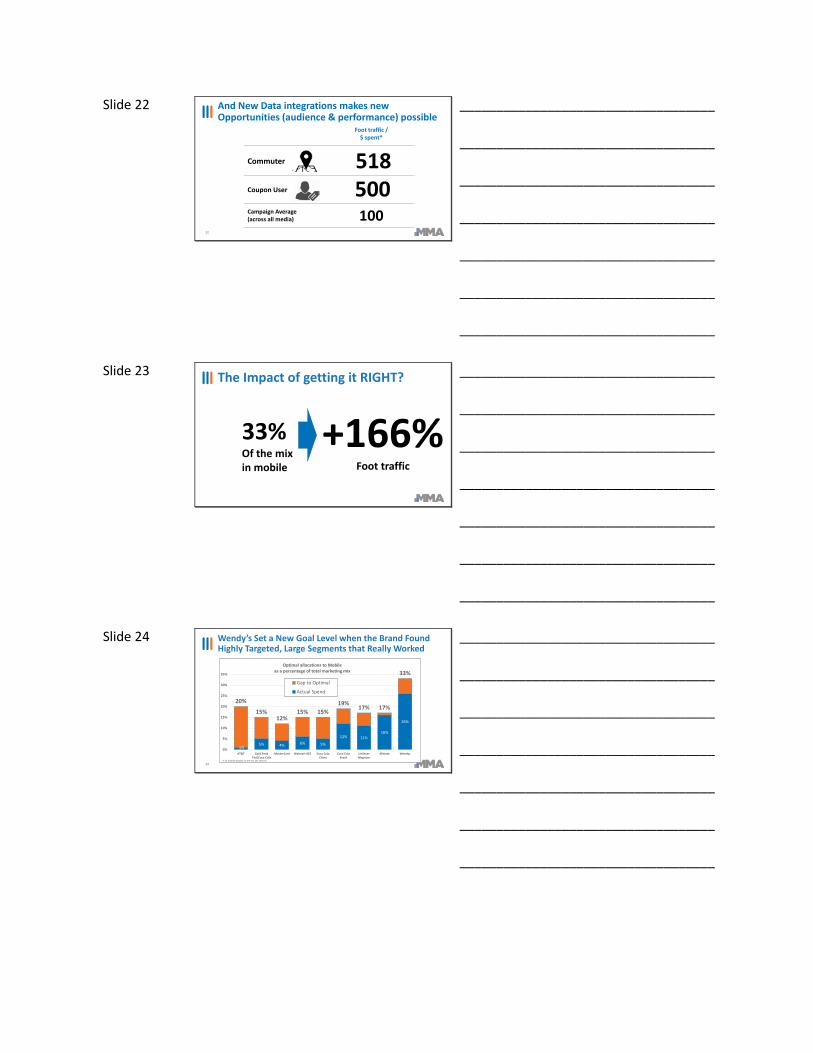
Slide 24 Wendy’s Set a New Goal Level when the Brand Found Highly Targeted, Large Segments that Really Worked
24
1%5% 4% 6% 5%
12% 11%16%
26%
20%
15%12%
15% 15%19%
17% 17%
33%
0%
5%
10%
15%
20%
25%
30%
35%
AT&T Gold PeakTea/Coca Cola
MasterCard Walmart 825 Coca ColaChina
Coca ColaBrazil
UnileverMagnum
Allstate Wendys
% of mobile display in the mx (ex search)
Optimal allocations to Mobileas a percentage of total marketing mix
Gap to Optimal
Actual Spend
___________________________________
___________________________________
___________________________________
___________________________________
___________________________________
___________________________________
___________________________________

Slide 25 Now We have a New Vision for How High, High Could Be
25
18%7% 17% 14% 16%
60%
13% 7%
166%
0%
25%
50%
75%
100%
125%
150%
175%
AT&T Gold PeakTea/Coca
Cola
MasterCard Walmart 825 Coca ColaChina
Coca ColaBrazil
UnileverMagnum
Allstate Wendys
% of mobile display in the mx (ex search)
Increase in Key Business Outcomes Based Mobile in the Mix vs. No Mobile
Increase in KeyBusiness Outcomes
Sales
SalesSalesSalesSalesBrand
Sales
Image
Traffic
___________________________________
___________________________________
___________________________________
___________________________________
___________________________________
___________________________________
___________________________________
Slide 26
…How else do we assess the value of ad unit combination #159:Or, Mobile video channel targeting men who have visited a dealership in the last 7 days
…Or assess the value of ad unit combination #395:Or, Mobile audio channel targeting women who commute by a QSR regularly over last month
…Versus the dozen’s or hundreds of other ad format, data, target, time of day, context, location, etc. combinations
The issue is that ONLY MTA can get Granular
26
___________________________________
___________________________________
___________________________________
___________________________________
___________________________________
___________________________________
___________________________________
Slide 27 And by the Way; Click Thru is Fake Measurement
16
81%of marketers use CTR more than any other
metric
___________________________________
___________________________________
___________________________________
___________________________________
___________________________________
___________________________________
___________________________________
Slide 28 What do We Know
about MTA
Few use it, most are super frustrated,
limited capabilities to assess value; but it’s
important
28
___________________________________
___________________________________
___________________________________
___________________________________
___________________________________
___________________________________
___________________________________
Slide 29 MMA Board Believes MTA is the Measurement Technique and Tool For the Future
29
Multi-Touch Attribution: The science of using advanced analytics, • on user level data,• to allocate proportional credit,• across a granular list of marketing
touchpoints across many, • and hopefully all, online and offline channels,
leading to a desired customer outcome.
Excluded: Traditional MMM, brand tracking and last-touch attribution methods
___________________________________
___________________________________
___________________________________
___________________________________
___________________________________
___________________________________
___________________________________
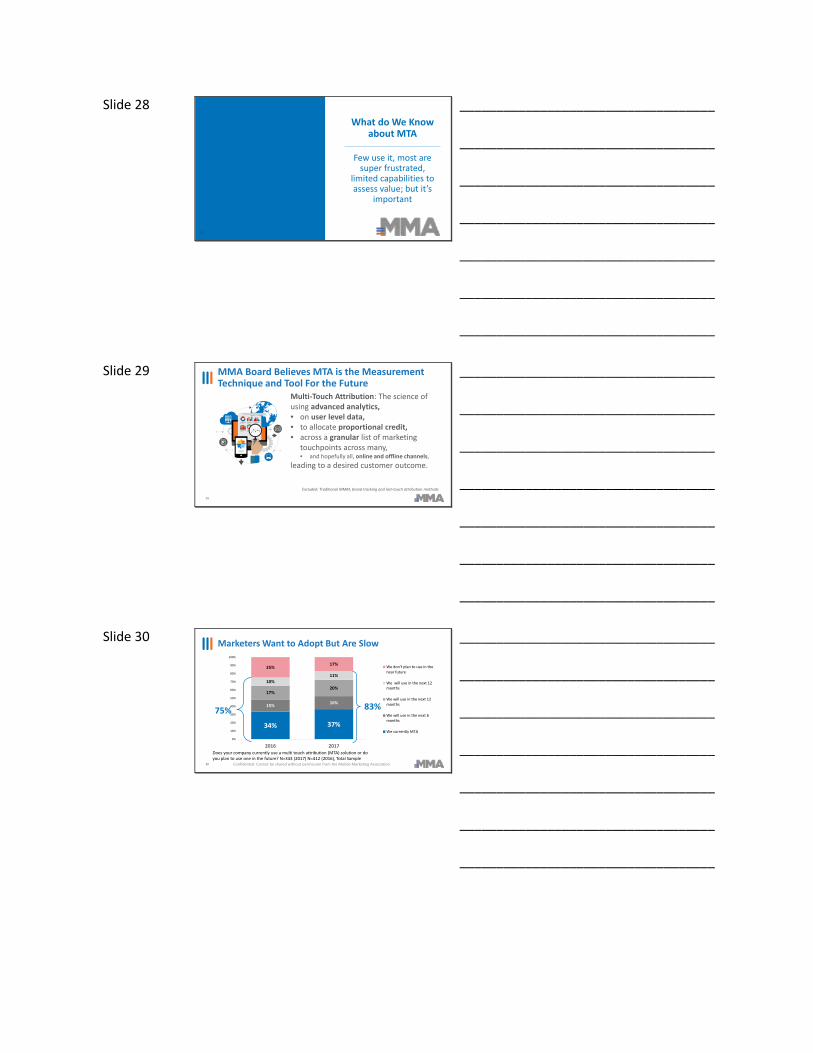
Slide 30 Marketers Want to Adopt But Are Slow
Confidential: Cannot be shared without permission from the Mobile Marketing Association30
Does your company currently use a multi touch attribution (MTA) solution or do you plan to use one in the future? N=343 (2017) N=412 (2016), Total Sample
34% 37%
15% 16%
17%20%
10%11%
25%17%
0%
10%
20%
30%
40%
50%
60%
70%
80%
90%
100%
2016 2017
We don’t plan to use in the near future
We will use in the next 12months
We will use in the next 12months
We will use in the next 6months
We currently MTA
75% 83%
___________________________________
___________________________________
___________________________________
___________________________________
___________________________________
___________________________________
___________________________________
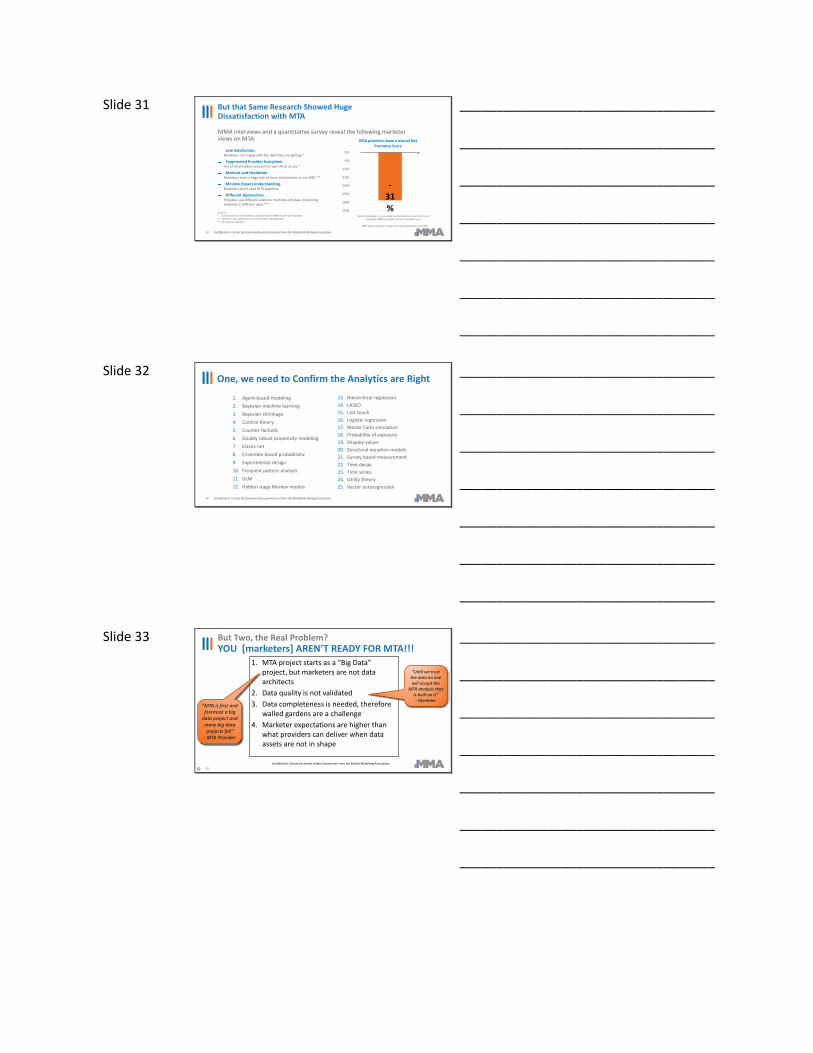
Slide 31 But that Same Research Showed Huge Dissatisfaction with MTA
Confidential: Cannot be shared without permission from the Mobile Marketing Association
MMA interviews and a quantitative survey reveal the following marketer views on MTA:
Low Satisfaction. Marketers not happy with the data they are getting.*
Fragmented Provider Ecosystem. Ten of 30 providers account for two-thirds of use.*
Mistrust and Hesitation. Marketers have a huge lack of trust, and hesitate to use MTA.**
Minimal Expert Understanding.Marketers don’t have MTA expertise.
Different Approaches. Providers use different analytics methods and data, presenting evidence in different ways.***
Sources:* Quant survey of 118 marketers conducted by the MMA as part of this project** Based on 15 in-depth one-on-one interviews with members*** RFI response analysis
-31%-35%
-30%
-25%
-20%
-15%
-10%
-5%
0%
MTA providers have a dismal Net Promoter Score
Overall how likely is it you would recommend your main multi touch attribution (MTA) provider? N=118, Total MTA users
1NPS style calculation created from 10 pt satisfaction question
31
___________________________________
___________________________________
___________________________________
___________________________________
___________________________________
___________________________________
___________________________________
Slide 32 One, we need to Confirm the Analytics are Right
Confidential: Cannot be shared without permission from the Mobile Marketing Association
1. Agent-based modeling2. Bayesian machine learning3. Bayesian shrinkage4. Control theory5. Counter-factuals6. Doubly robust propensity modeling7. Elastic net8. Ensemble based probabilistic9. Experimental design10. Frequent pattern analysis11. GLM12. Hidden stage Markov models
13. Hierarchical regression14. LASSO15. Last touch16. Logistic regression17. Monte Carlo simulation18. Probability of exposure19. Shapley values20. Structural equation models21. Survey based measurement22. Time decay23. Time series24. Utility theory25. Vector autoregression
32
___________________________________
___________________________________
___________________________________
___________________________________
___________________________________
___________________________________
___________________________________
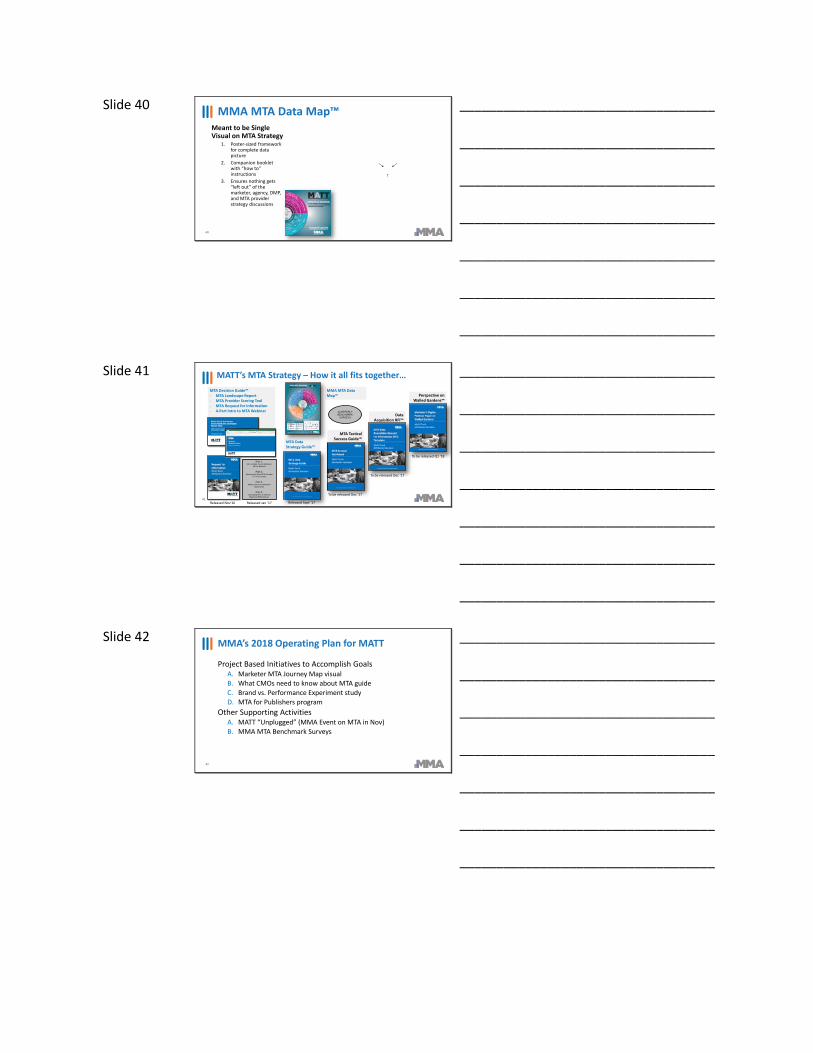
Slide 33
1. MTA project starts as a “Big Data” project, but marketers are not data architects
2. Data quality is not validated3. Data completeness is needed, therefore
walled gardens are a challenge4. Marketer expectations are higher than
what providers can deliver when data assets are not in shape
But Two, the Real Problem?YOU [marketers] AREN’T READY FOR MTA!!!
“MTA is first and foremost a big
data project and many big data projects fail”
- MTA Provider
“Until we trust the data no one will accept the
MTA analysis that is built on it”- Marketer
33Confidential: Cannot be shared without permission from the Mobile Marketing Association
___________________________________
___________________________________
___________________________________
___________________________________
___________________________________
___________________________________
___________________________________

Slide 34
CategoryElements of
Attribution Solutions Educ
atio
n
Def
initi
ons
Nee
ded
Code
of
Cond
uct
Best
Pr
actic
es
Valid
atio
nRe
sear
ch
Stan
dard
s
Audi
ting
Para
met
ers
Data QualityData Quality & Accuracy (and Walled Gardens) X X X X X X
Standardize and Leverage Unified IDs X X X X X
Single Source Linkage to Sales Data X X X X
AnalyticValidity
Experimental Design X X X X
Transparency of Approach X X
Validation of Results and Outcomes X X X
Business Outcomes
Facilitate Agile Marketing X X
Enhance Mobile Readiness X X X X X X X
Prove Lift in Campaign Performance X X X
SolutionCompleteness
Specific Approach for Offline Media X X X X X
Use MTA for Both Brand and Performance Goals X X X
Comprehensive Answers for Planning and Budgeting X X X
34
In Total, There are 12 Elements for Development
___________________________________
___________________________________
___________________________________
___________________________________
___________________________________
___________________________________
___________________________________
Slide 35 What is the Industry
Doing About MTA
MMA Board believes it’s hard but needs to
be done
35
Truth is, much of our current approach
sucks, and the industry needs to get
to better, business impact proving, measurement
___________________________________
___________________________________
___________________________________
___________________________________
___________________________________
___________________________________
___________________________________
Slide 36 In September 2016, we Launched…
36
MATT is a community of industry experts committed to rethinkingthe world of marketing measurement and attribution; seeking togive marketers better measurements, tools and confidence inconnecting marketing to business outcomes.
All MMA members are invited to participate in MATT
___________________________________
___________________________________
___________________________________
___________________________________
___________________________________
___________________________________
___________________________________

Slide 37
Applied to 35% of
Campaigns (on avg.)
38% AlreadyHave an
MTA Solution
MATT’s MTA Mission…This is where we started
-31 NPS!
37 Based on MMA Survey from November 2016.
___________________________________
___________________________________
___________________________________
___________________________________
___________________________________
___________________________________
___________________________________
Slide 38 Started with “Selecting…”
38* The Decision Guide is available for members only at http://www.mmaglobal.com/matt.
The Report:A comprehensive
guide to MTA
MTA RFI Template
Scoring Tool: To help withevaluation
4-Part MATT MTA Webinar Series
Part 1: Intro to Multi-Touch Attribution
(MTA) Methods
Part 2: Selecting the Best MTA
Provider For Your Needs
Part 3: Making Sense of Attribution
Approaches
Part 4: Leveraging MTA to Improve
Marketing Effectiveness
___________________________________
___________________________________
___________________________________
___________________________________
___________________________________
___________________________________
___________________________________
Slide 39 MATT’s MTA Focus on Data – Four Part Series
MTA Tactical Success Guide™
Data Acquisition RFI™
Perspective on Walled Gardens™
MTA Data Strategy Guide™
To be released Q2 ‘18To be released Q1 ‘18Released Dec ‘17Released Sept ‘17
___________________________________
___________________________________
___________________________________
___________________________________
___________________________________
___________________________________
___________________________________
Slide 40
North America
MMA MTA Data Map™
40
Meant to be Single Visual on MTA Strategy
1. Poster-sized framework for complete data picture
2. Companion booklet with “how to” instructions
3. Ensures nothing gets “left out” of the marketer, agency, DMP, and MTA provider strategy discussions
___________________________________
___________________________________
___________________________________
___________________________________
___________________________________
___________________________________
___________________________________
Slide 41 MATT’s MTA Strategy – How it all fits together…
41
MTA Decision Guide™- MTA Landscape Report- MTA Provider Scoring Tool- MTA Request for Information- 4-Part Intro to MTA Webinar
MTA Tactical Success Guide™
MMA MTA Data Map™
Data Acquisition RFI™
Perspective on Walled Gardens™
MTA Data Strategy Guide™
Part 1: Intro to Multi-Touch Attribution
(MTA) Methods
Part 2: Selecting the Best MTA Provider
For Your Needs
Part 3: Making Sense of Attribution
Approaches
Part 4: Leveraging MTA to Improve
Marketing Effectiveness
QUARTERLY BENCHMARK
SURVEYS
To be released Q1 ‘18
To be released Dec ‘17
To be released Dec ‘17
Released Sept ‘17Released Nov‘16 Released Jan ‘17
___________________________________
___________________________________
___________________________________
___________________________________
___________________________________
___________________________________
___________________________________
Slide 42
Project Based Initiatives to Accomplish GoalsA. Marketer MTA Journey Map visualB. What CMOs need to know about MTA guideC. Brand vs. Performance Experiment studyD. MTA for Publishers program
Other Supporting ActivitiesA. MATT “Unplugged” (MMA Event on MTA in Nov) B. MMA MTA Benchmark Surveys
MMA’s 2018 Operating Plan for MATT
42
___________________________________
___________________________________
___________________________________
___________________________________
___________________________________
___________________________________
___________________________________
Slide 43
43
This Overused Phrase Actually Missed the Point
___________________________________
___________________________________
___________________________________
___________________________________
___________________________________
___________________________________
___________________________________
Slide 44
Age of ReShaping Marketing
44
We Are Really In…
___________________________________
___________________________________
___________________________________
___________________________________
___________________________________
___________________________________
___________________________________
Slide 45
45
Thanks Greg StuartCEOMobile Marketing [email protected]
___________________________________
___________________________________
___________________________________
___________________________________
___________________________________
___________________________________
___________________________________

Slide 46 MMA: Leading Marketing Forever
SMoXMobile ROI Research
___________________________________
___________________________________
___________________________________
___________________________________
___________________________________
___________________________________
___________________________________
Slide 47 Upcoming MMA Events:
47
MMA IMPACT: April 10-11 – New York
MMA Cannes Lions Beach Club: Cannes Lions Festival of Creativity: June 18-22 – Cannes
MMA CEO & CMO Summit: July 15-17 – Sonoma, CA
The Smarties – October 1 – New York
MMA INNOVATE: October 1-2 – New York
MMA MATT/Multi-Touch Attribution Unplugged – TBC – New York
Plus: London, Istanbul, Madrid, Dubai, Sao Paulo, Buenos Aries, Mexico City, Singapore, New Delhi, Jakarta, Shanghai
___________________________________
___________________________________
___________________________________
___________________________________
___________________________________
___________________________________
___________________________________
Slide 48 MMA’s Focus to Rethink Marketing (and Mobile)
48
USP & Positioning
Economic Value & ROI
Getting it Right/Best
Creative Exploratory & Effectiveness
Building Measure-ment Tools
Organiza-tion Design
MOSTTMarketing Org Structure Think Tank
Wave II
Wave I
___________________________________
___________________________________
___________________________________
___________________________________
___________________________________
___________________________________
___________________________________

Slide 49
North America
MMA MTA Data Map™
49
Meant to be Single Visual on MTA Strategy1. Poster-sized framework for complete data picture2. Companion booklet with “how to” instructions3. Ensures nothing gets “left out” of the marketer,
agency, DMP, and MTA provider strategy discussions
A version has been sent to your office
___________________________________
___________________________________
___________________________________
___________________________________
___________________________________
___________________________________
___________________________________
Slide 50
50
Questions?Greg StuartGlobal CEOMobile Marketing [email protected]
___________________________________
___________________________________
___________________________________
___________________________________
___________________________________
___________________________________
___________________________________
Slide 51
51
___________________________________
___________________________________
___________________________________
___________________________________
___________________________________
___________________________________
___________________________________
Slide 52 What Else Have We Learned from SMoX
Insights of Note from other SMoX Studies
52
Mobile is not really the challenge or the
issue. It’s what it means to “getting
closer to consumer”
___________________________________
___________________________________
___________________________________
___________________________________
___________________________________
___________________________________
___________________________________
Slide 53 First, let’s be clear: Plus or Minus, half of the media mix should go to TV.
53
70% 38%
Awareness, New product
launch
Image and Sales, Brand
Building
Image and Sales,
National Launch
70% 65% 60%
Image, existing brand
50%
Sales, Promotional,
Education needed
Promotion, no education needed
50% 38%
___________________________________
___________________________________
___________________________________
___________________________________
___________________________________
___________________________________
___________________________________
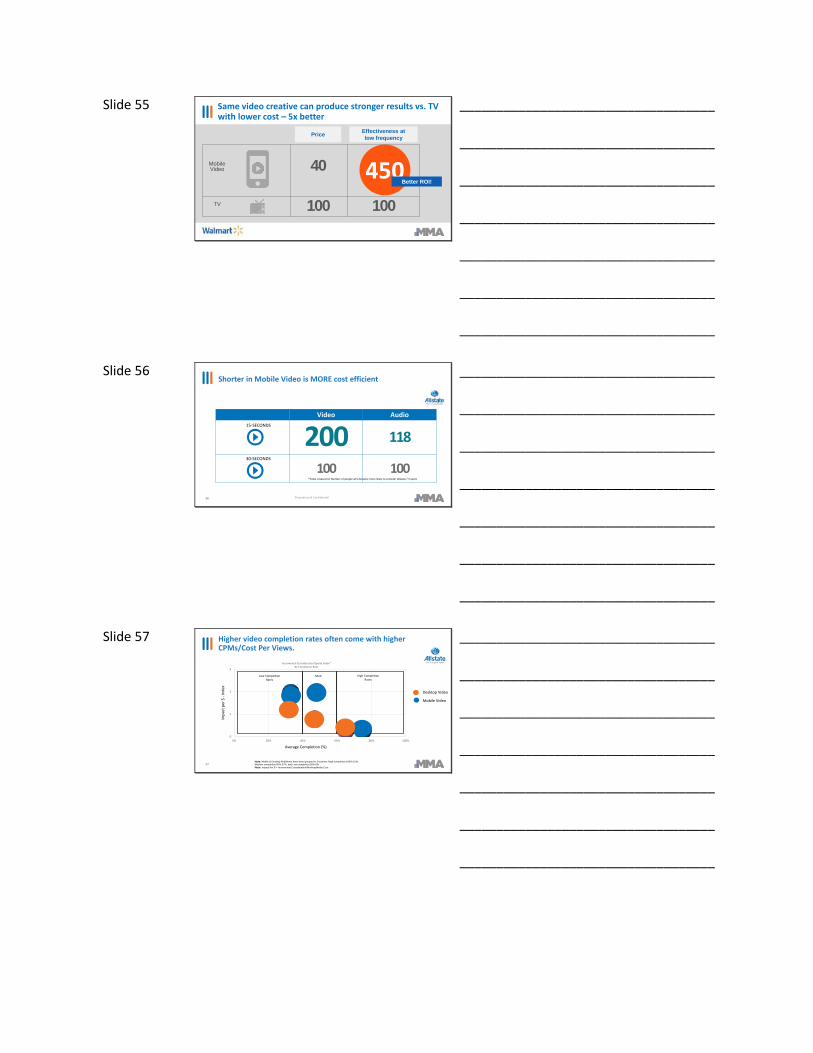
Slide 54 With the same creative, Mobile Video had more impact much more quickly, than video on other platforms
Proprietary & Confidential
0%
2%
4%
6%
8%
10%
12%
Poin
t Inc
reas
e in
Pric
e Pe
rcep
tion
Frequency
Frequency to Lift ResponseMobile Video vs. TV*
Source: Walmart SC Survey; Data Collected from: 8/4-9/28
MOBILE VIDEO
CABLE TV
___________________________________
___________________________________
___________________________________
___________________________________
___________________________________
___________________________________
___________________________________
Slide 55
Mobile Video
TV
40
100 100
450Better ROI!
Effectiveness atlow frequencyPrice
Same video creative can produce stronger results vs. TV with lower cost – 5x better
___________________________________
___________________________________
___________________________________
___________________________________
___________________________________
___________________________________
___________________________________
Slide 56 Shorter in Mobile Video is MORE cost efficient
Proprietary & Confidential56
Video Audio
200 118
100 100*Index is based on Number of people who became more likely to consider Allstate / $ spent
15-SECONDS
30-SECONDS
___________________________________
___________________________________
___________________________________
___________________________________
___________________________________
___________________________________
___________________________________
Slide 57 Higher video completion rates often come with higher CPMs/Cost Per Views.
57
0
1
2
3
0% 20% 40% 60% 80% 100%
Incremental Consideration/Spend Index*By Completion Rate
Low Completion Rates
Mod High Completion Rates
Note: Mobile & Desktop Publishers have been grouped in 3 buckets: High completion 100%-51%, Medium completion 50%-37%, and Low completion 36%-0% Note: Impact Per $ = Incremental Consideration/Working Media Cost.
Average Completion (%)
Impa
ct p
er $
-In
dex
Desktop Video
Mobile Video
___________________________________
___________________________________
___________________________________
___________________________________
___________________________________
___________________________________
___________________________________

Slide 58
* Statistical significance at 95%Sources: Walmart Savings Catcher – Combined Publisher report; Walmart Savings Catcher Sub-Segment PerformanceFindings on in-store purchase behavior to come
Expandable Units
Pencil UnitsA
udie
nce
Prox
imity+40%+10%
No Lift +12%
Closer to my Patterns: Getting Location Just Right, Mattered a Lot
58
___________________________________
___________________________________
___________________________________
___________________________________
___________________________________
___________________________________
___________________________________
Slide 59 Real time LBA, Proximity targeting and location enhanced creative are the key applications, seen as more valuable
593/12/2018
Q12-01) How often do you use each of the following location strategies:Q12a ) How valuable would you say each of the following location strategies is:
30
35
40
45
50
55
60
65
30 35 40 45 50 55
Beacons Footfall
Non precise Geo
Real time LBA
Historic LBA
Geofencing
Polygon
Geoconquesting
Location enhanced creative Proximity
Perceived as Extremely Valuable
Use Every time I use mobile advertising
___________________________________
___________________________________
___________________________________
___________________________________
___________________________________
___________________________________
___________________________________