sxi q4fy10 conference call presentation -...
TRANSCRIPT

Standex InternationalStandex International
Food Service Engraving Engineering Equipment
g g g ee gTechnologies
HydraulicsAir Distribution Products Electronics
Fourth Quarter Fiscal Year 2010Conference CallAugust 26, 2010

Agenda
OverviewRoger Fix – President & Chief Executive Officer
Financial ReviewTom DeByle – Chief Financial Officer
Fourth Quarter 2010 Segment Results and Outlook
Statements in this presentation include, or may be based upon, management's current expectations, estimates and/or
Fourth Quarter 2010 Segment Results and OutlookRoger Fix – President & Chief Executive Officer
p y p g pprojections about Standex's markets and industries. These statements are forward-looking statements within themeaning of The Private Securities Litigation Reform Act of 1995. Actual results may materially differ from thoseindicated by such forward-looking statements as a result of certain risks, uncertainties and assumptions that are difficultto predict. Among the factors that could cause actual results to differ are uncertainty in conditions in the financial andbanking markets, general domestic and international economy including more specifically increases in raw materialcosts, the ability to substitute less expensive alternative raw materials, the heavy construction vehicle market, the newresidential construction market reduced capital spending by customers successful expansion and automation ofresidential construction market, reduced capital spending by customers, successful expansion and automation ofmanufacturing capabilities and diversification efforts in emerging markets, the ability to achieve cost savings throughlean manufacturing and low cost sourcing, effective completion of plant consolidations and the other factors discussedin the Annual Report of Standex on Form 10-K for the fiscal year ending June 30, 2009, which is on file with theSecurities and Exchange Commission, and any subsequent periodic reports filed by the company with the Securitiesand Exchange Commission. In addition, any forward-looking statements represent management's estimates only as ofthe day made and should not be relied upon as representing management's estimates as of any subsequent date.While the company may elect to update forward looking statements at some point in the future the company and
2
While the company may elect to update forward-looking statements at some point in the future, the company andmanagement specifically disclaim any obligation to do so, even if management's estimates change.

Fourth Quarter 2010 Overview
Organic Growth and Cost Focus Drive Bottom-Line Strength
Second consecutive quarter of positive year-over-year organic growthAchieved FY10 non-GAAP EPS of $2.25/share vs. $1.56/share in FY09Delivered 44% increase in FY10 non-GAAP EPS despite 5% sales decline
Q1 FY 10
Q2 FY 10
Q3 FY 10
Q4 FY 10 FY 2010
EPS Continuing Operations 0 67$ 0 51$ 0 37$ 0 67$ 2 20$EPS Continuing Operations 0.67$ 0.51$ 0.37$ 0.67$ 2.20$
Add:Restructuring 0.08$ 0.08$ 0.03$ -$ 0.19$ ADP Supplier Dispute Resolution 0.05$ 0.05$ADP Supplier Dispute Resolution 0.05$ 0.05$
Less:Building Sale (0.07)$ (0.07)$ Discrete Tax Items (0.03)$ (0.08)$ (0.12)$
33
sc ete a te s (0 03)$ (0 08)$ (0 )$
Adjusted EPS Continuing Operations 0.75$ 0.52$ 0.37$ 0.64$ 2.25$

Standex YOY% Revenue Change
8.7% total YOY sales growth; 8.8% organic growth in Q4
Second Consecutive Quarter of Positive Organic Growth
All reporting groups delivered YOY revenue growth
Focus shifted to organic growth from cost reductions
Initiatives centered on capturing market shareInitiatives centered on capturing market shareStandex YOY Revenue Change
8.7%180,000
200,000
10%
15%
($, in thousands)
0.9%
4.5% 5.2% 5.2%2.9% 3.4%
9 7%100,000
120,000
140,000
160,000
-5%
0%
5%
10%
-22.5% -22.6%
-15.8%
-10.7%-9.7%
20,000
40,000
60,000
80,000
-20%
-15%
-10%
4
0FY 08 Q1
FY 08 Q2
FY 08 Q3
FY 08 Q4
FY 09 Q1
FY 09 Q2
FY 09 Q3
FY 09 Q4
FY 10 Q1
FY 10 Q2
FY 10 Q3
FY 10 Q4
-25%
Revenue YOY %4
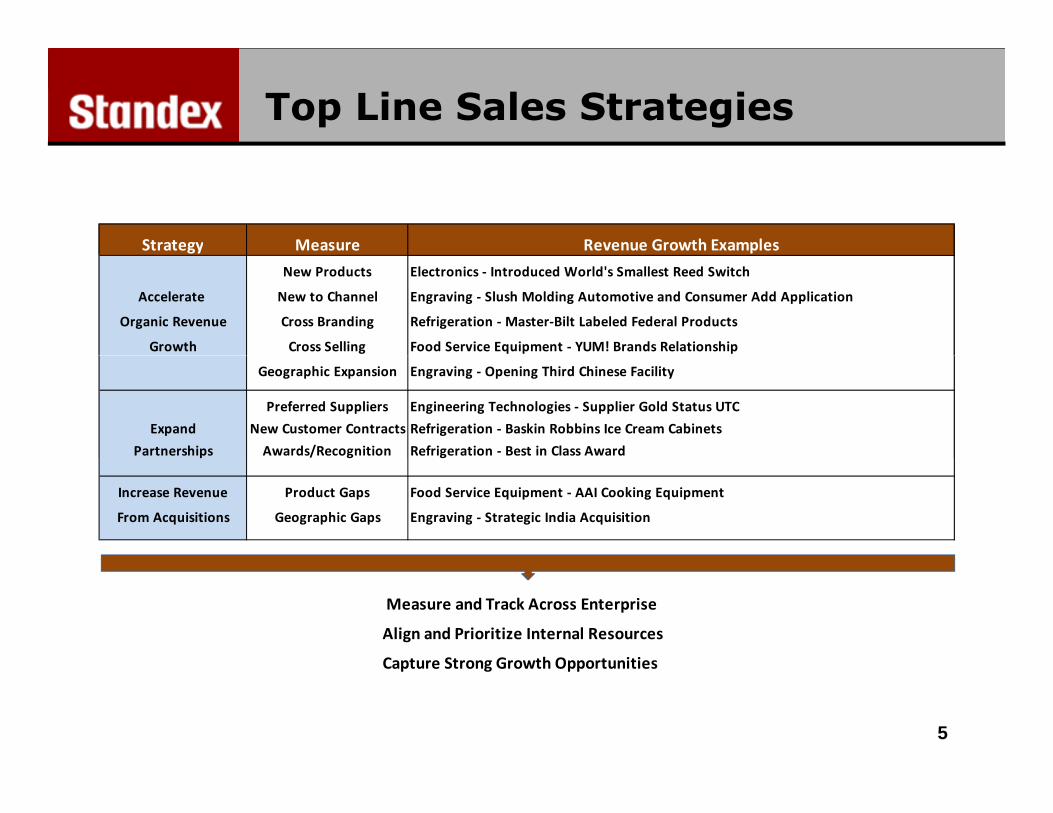
Top Line Sales Strategies
Strategy Measure Revenue Growth Examplesgy p
New Products Electronics ‐ Introduced World's Smallest Reed Switch
Accelerate New to Channel Engraving ‐ Slush Molding Automotive and Consumer Add Application
Organic Revenue Cross Branding Refrigeration ‐ Master‐Bilt Labeled Federal Products
Growth Cross Selling Food Service Equipment ‐ YUM! Brands Relationship
Geographic Expansion Engraving ‐ Opening Third Chinese Facility
Preferred Suppliers Engineering Technologies ‐ Supplier Gold Status UTC
Expand New Customer Contracts Refrigeration ‐ Baskin Robbins Ice Cream Cabinets
Partnerships Awards/Recognition Refrigeration ‐ Best in Class Awardp g g
Increase Revenue Product Gaps Food Service Equipment ‐ AAI Cooking Equipment
From Acquisitions Geographic Gaps Engraving ‐ Strategic India Acquisition
Measure and Track Across Enterprise
Align and Prioritize Internal Resources
Capture Strong Growth Opportunities Capture Strong Growth Opportunities
5

Recent Customer Recognition
APW Wyott brand has been recognized by PRIDE Marketing and Procurement Inc. as “Vendor of the Year” for 2009
Master-Bilt was selected by Baskin-Robbins as its preferred supplier for ice cream cabinets worldwide
Electronics recently ranked among the top component designs according to Electronic Design, an industry-leading electronics trade journal with more than 50,000 subscribers
Nor-Lake received a “2009 Outstanding Sales Achievement” award by Allied Buying Corporation (ABC)
Innovent brand has been recognized by aerospace and defense leader Northrop Grumman as a Platinum Source Preferred supplier for 2009
6
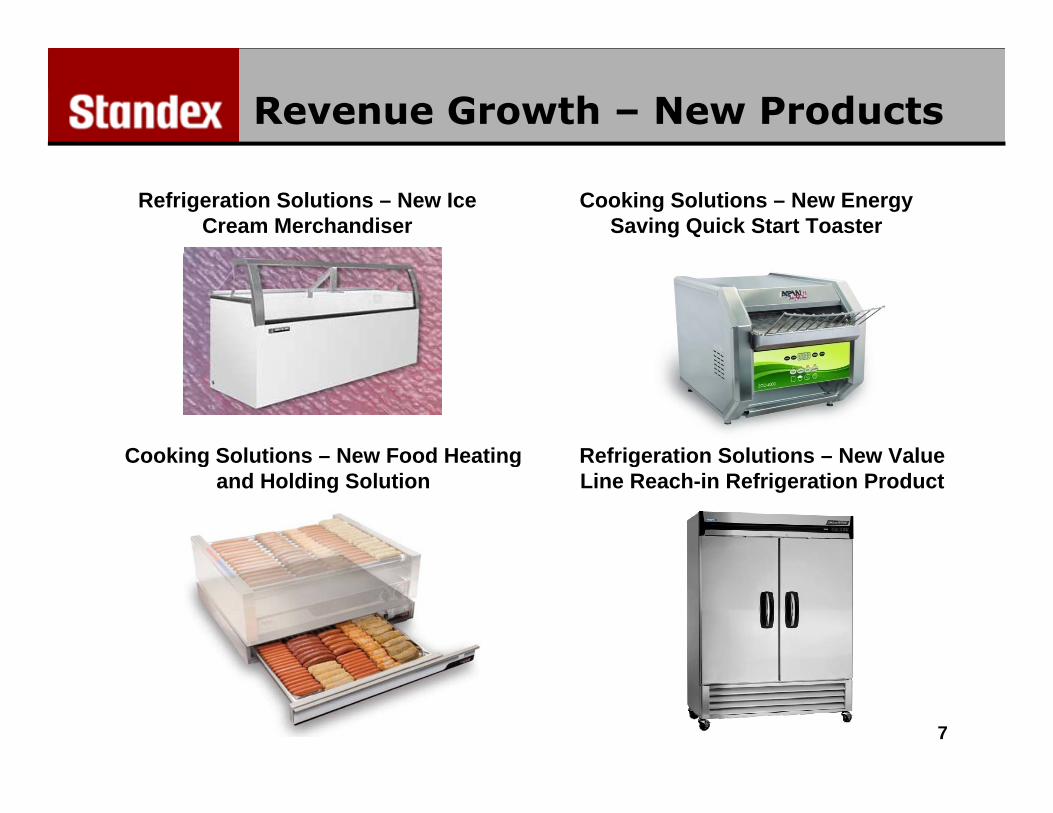
Revenue Growth – New Products
Refrigeration Solutions – New Ice Cream Merchandiser
Cooking Solutions – New Energy Saving Quick Start Toaster
Cooking Solutions – New Food Heating Refrigeration Solutions – New ValueCooking Solutions – New Food Heating and Holding Solution
Refrigeration Solutions – New Value Line Reach-in Refrigeration Product
7

Revenue Growth – New Products
Electronics – New Proximity Switch Engraving – New Mold Texturizing Technology
El t i N Hi h P fEngineering Technologies – Aluminum
Electronics – New High Performance Choke for High Definition Video MRI
Hydrogen Fuel Tank for Boeing’s Next Generation Unmanned Aerial Vehicle
8

Strong Top- and Bottom-Line Performance in Q4
Q4 FY 10 Q4 FY 09 Delta
Sales 152.081$ 139.911 9%
($, in millions, except per share amounts)
Operating Income 12.194$ 9.228$ 2.966$
Operating Income Margin 8.02% 6.60% 142 bps
Operating Income excl Special Items 13.248$ 10.300$ 29%
Operating Income Margin % excl Special Items 8.71% 7.36% 135 bps
EBITDA 15 943$ 12 395$ 3 548$EBITDA 15.943$ 12.395$ 3.548$
EBITDA % 10.48% 8.86% 162 bps
EBITDA w/o Special Items 16.997$ 13.467$ 26%
EBITDA % w/o Special Items 11.18% 9.63% 155 bps
EPS Continue Ops 0.67$ 0.46$ 0.21$
EPS Continue Ops w/o Special Items 0.64$ 0.45$ 42%
99

Strong Bottom-Line Growth on Revenue Decline in FY 2010
FY 10 FY 09 Delta
Sales 578.454$ 607.086 -5%
($, in millions, except per share amounts)
Sales 578.454$ 607.086 5%
Operating Income 42.266$ 6.021$ 36.245$
Operating Income Margin 7.31% 0.99% 631 bps
Operating Income excl Special Items 45.602$ 35.135$ 30%
Operating Income Margin % excl Special Items 7.88% 5.79% 210 bps
EBITDA 57.427$ 21.777$ 35.650$
EBITDA % 9.93% 3.59% 634 bps
EBITDA w/o Special Items 60.763$ 49.807$ 22%EBITDA w/o Special Items 60.763$ 49.807$ 22%
EBITDA % w/o Special Items 10.50% 8.20% 230 bps
EPS Continue Ops 2.20$ (0.15)$ 2.35$
EPS Continue Ops w/o Special Items 2.25$ 1.56$ 44%
1010

FY10 Q4 EPS Performance
Strong Non-GAAP Net Income From Cont Ops Growth
Q4 FY 10 Q4 FY 09 Ch Q4 FY 10 Q4 FY 09 Ch
Net Income Earnings Per Share($, in thousands, except per share amounts)
Q4 FY 10 Q4 FY 09 Change Q4 FY 10 Q4 FY 09 ChangeNet Income Continuing Operations 8,540$ 5,764$ 48% 0.67$ 0.47$ 43%
Non-Recurring (Tax Impacted)Restructuring Charges 56$ 702$ -$ 0.06$ ADP Supplier Dispute Resolution 634$ 0 05$ $ADP Supplier Dispute Resolution 634$ 0.05$ -$ Discrete Tax Items (1,070)$ (824)$ (0.08)$ (0.07)$ Total Non-Recurring (Tax Impacted) (380)$ (122)$ (0.03)$ (0.01)$
Proforma Net Income Continuing Operations 8,160$ 5,642$ 45% 0.64$ 0.46$ 39%
1111

FY10 EPS Performance
Strong Non-GAAP Net Income From Cont Ops Growth
Net Income Earnings Per Share($, in thousands, except per share amounts)
FY 2010 FY 2009 Change FY 2010 FY 2009 ChangeNet Income Continuing Operations 27,960$ (1,890)$ NM 2.20$ (0.15)$ NM
Non-Recurring (Tax Impacted)Reversal of Bonus/LTIP accruals (2 358)$ (0 19)$
( p p )
Reversal of Bonus/LTIP accruals (2,358)$ (0.19)$ LOCM 2,316$ 0.19$ Gain on Sale of Real Estate (920)$ -$ (0.07)$ Restructuring Charges 2,471$ 5,135$ 0.19$ 0.42$ Life Insurance Proceeds (1,084)$ (0.09)$ Goodwill and Asset Impairment 20,043$ 1.63$ p ,$ $ADP Supplier Dispute Resolution 634$ 0.05$ Discrete Tax Items (1,470)$ (3,077)$ (0.12)$ (0.25)$ Total Non-Recurring (Tax Impacted) 715$ 20,975$ 0.05$ 1.71$
Proforma Net Income Continuing Operations 28,675$ 19,085$ 50% 2.25$ 1.56$ 44%
1212
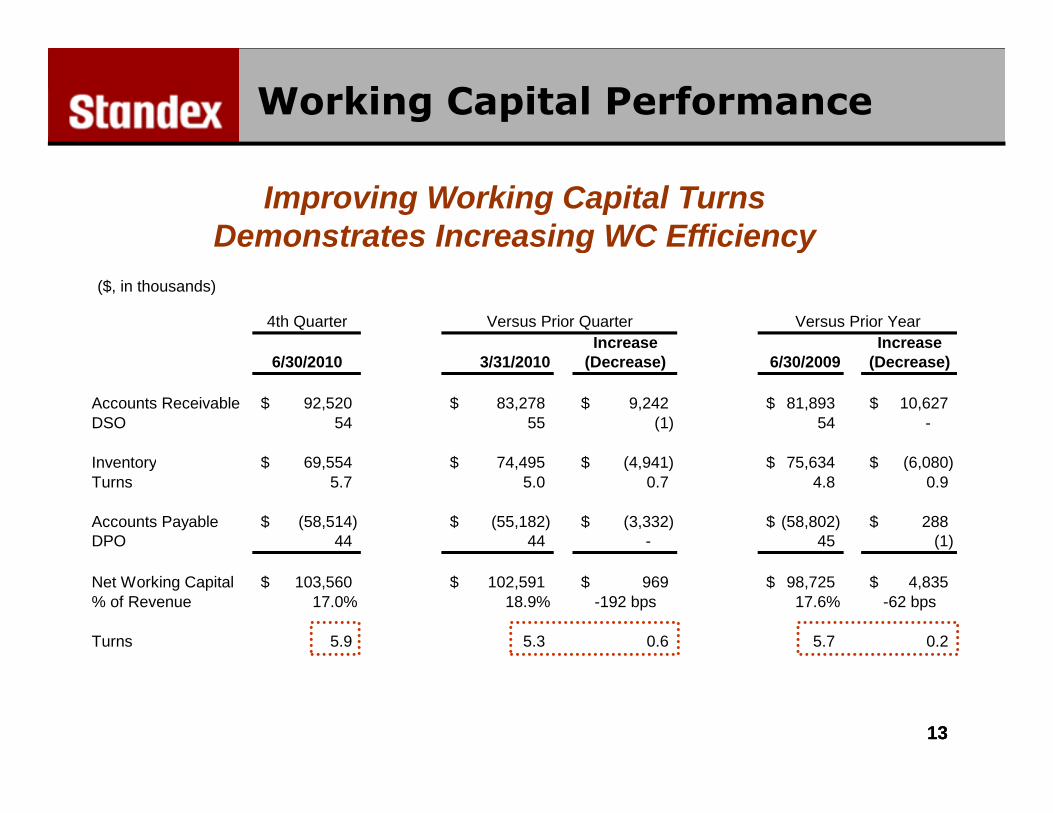
Working Capital Performance
Improving Working Capital Turns Demonstrates Increasing WC Efficiency
4th QuarterIncrease Increase
Versus Prior Quarter Versus Prior Year
($, in thousands)
g y
6/30/2010 3/31/2010 (Decrease) 6/30/2009 (Decrease)
Accounts Receivable 92,520$ 83,278$ 9,242$ 81,893$ 10,627$ DSO 54 55 (1) 54 -
I t 69 554$ 74 495$ (4 941)$ 75 634$ (6 080)$Inventory 69,554$ 74,495$ (4,941)$ 75,634$ (6,080)$ Turns 5.7 5.0 0.7 4.8 0.9
Accounts Payable (58,514)$ (55,182)$ (3,332)$ (58,802)$ 288$ DPO 44 44 - 45 (1)
Net Working Capital 103,560$ 102,591$ 969$ 98,725$ 4,835$ % of Revenue 17.0% 18.9% -192 bps 17.6% -62 bps
Turns 5.9 5.3 0.6 5.7 0.2
1313

Working Capital & WC Turns
5.4
5.4
5
5.7
5.2
5.2
5.1 5.
4
4.9
4.7 5
5.2 5.
4
5.1
5.1
5.8
5.3
4.9 5.
1
5.7
5.6
5.4
5.3
5.9
250,000
300,000
350,000
5.0
6.0
7.0
•Continued focus on managing working capital
3.6
3.4 3.
7
3.4
3.8 4
4.2
4
4.4
3.9
4.3
4.3 4.4 4
100,000
150,000
200,000
,
2.0
3.0
4.0
capital
0
50,000
Q4-
01
Q2-
02
Q4-
02
Q2-
03
Q4-
03
Q2-
04
Q4-
04
Q2-
05
Q4-
05
Q2-
06
Q4-
06
Q2-
07
Q4-
07
Q2-
08
Q4-
08
Q2-
09
Q4-
09
Q2-
10
Q4-
10
0.0
1.0
NWC NWC Turns Linear ( NWC ) Linear ( NWC Turns )($, in thousands) C C u s ea ( C ) ea ( C u s )
3 8
4.4
5.45.7
5.45.2
5.8 5.75.9
250,000
300,000
350,000
5.0
6.0
7.0
( , )
•YOY 4th quarter WC turns trend continues to improve
3.63.8
50,000
100,000
150,000
200,000
1.0
2.0
3.0
4.0
0
Q4-
01
Q4-
02
Q4-
03
Q4-
04
Q4-
05
Q4-
06
Q4-
07
Q4-
08
Q4-
09
Q4-
10
0.0
NWC NWC Turns Linear ( NWC ) Linear ( NWC Turns ) 14($, in thousands)

Net Debt
$87,300$93,300
$90 000$100,000 50.00% FY 10 Q4 Net Debt Analysis
Net Debt 3/31/2010 (52,397)
Routine Cash Items
$79,246
$55,371
$87,300
$67,800$59,670
$52,397
$64,800
29.5%
22.0% 20.7%23.7%
$20 000$30,000$40,000$50,000$60,000$70,000$80,000$90,000
25.00%
30.00%
35.00%
40.00%
45.00% (in ‘000s)
EBITDA 15,944 WC Increase (969) CAPEX (1,050) Cash Interest (713) Cash Taxes (880) Dividends (623)
$0$10,000$20,000
Q1
FY 1
0
Q2
FY 1
0
Q3
FY 1
0
Q4
FY 1
0
15.00%
20.00%
Net Debt Funded Debt Net Debt to Capital Ratio
Dividends (623) Other (935) Total Routine Cash Items 10,774
Non-Routine Cash ItemsVoluntary US Pension Contribution (15,000) Voluntary Foreign Pension Contributions (1 721)
•Net Debt decreased by $25.6M from $85.3M at Q4 FY 2009 Voluntary Foreign Pension Contributions (1,721)
Bartonville Multi Employer Pension (2,750) Life Insurance Proceeds 1,424 Total Non-Routine Cash Items (18,047)
Net Debt increase during the quarter (7,273)
2009•Net Debt to Capital decreased from 32.6% to 23.7% in FY 10•Pension contributions of $ Net Debt 6/30/2010 (59,670) $19.5M impacted net debt in Q4 FY 2010
15

Free Cash Flow Generation
Continued Ability to Generate Free Cash Flow($, in thousands)
Quarter Full YearFree operating cash flow: 06/30/10 06/30/10Free operating cash flow: 06/30/10 06/30/10Net cash provided by operating activities, as reported (7,778)$ 21,401$ Less: Capital Expeditures (1,050) (4,030) Add: Voluntary Pension Contribution 16,721 16,721 Free operating cash flow 7 893$ 34 092$Free operating cash flow 7,893$ 34,092$ Net Income 8,540 27,960 Conversion of free operating cash flow 92.4% 121.9%
1616

Real Estate Transactions
Restructuring and Lean Enterprise Enables Sale of Excess Real Estate and Cash Generation
REAL ESTATE SALES ('000s USD)
Net Cash Proceeds EPS
Completed or Estimated
Completion Bakers Pride - New Rochelle, NY 5,538$ (0.04)$ FY 10 Q1Standex Corporate HQ - Salem, NH 2,331$ 0.07$ FY 10 Q2Standex Engraving - Norway 570$ 0.04$ FY 10 Q3Keller-Dorian - Lyon France 3 607$ 0 21$ FY 11 Q1Keller Dorian Lyon, France 3,607$ 0.21$ FY 11 Q1Sales completed 12,045$ 0.28$
Dornbusch - Sao Paolo, Brazil 2,509$ 0.19$ 6-9 MonthsTotal Projected Land & Building Sales 14 554$ 0 47$
17
Total Projected Land & Building Sales 14,554$ 0.47$

Fourth-Quarter FY10 QOperational Segment Review
1818

Food Service Equipment Group
Q4’10 (‘000s) $ Δ%(yoy)
Revenues $88 266 2 0%
7.6%
11.5%9.9%
8.1%
4.9%2.0% 2.0%
80,000
100,000
120,000
0%
5%
10%
15%
Revenues $88,266 2.0%
Operating Income $10,886 2.8%
-7.3%
-18.2%
-12.4%-9.8%
-6.3%
0
20,000
40,000
60,000
-25%
-20%
-15%
-10%
-5%
Delivered 2% top-line growth, driven by Procon and Cooking Solutions
-20,000
FY 08 Q1
FY 08 Q2
FY 08 Q3
FY 08 Q4
FY 09 Q1
FY 09 Q2
FY 09 Q3
FY 09 Q4
FY 10 Q1
FY 10 Q2
FY 10 Q3
FY 10 Q4-30%
Revenue YOY %
YOY comparison made difficult by $2 million rollout in Q4 2009
Seeing continued Cooking Solutions recovery
Rate of decline on refrigeration side has slowed; appears to be finding a bottom
Procon reports double-digit growth; beverage strong while industrial is improving
19Taking market share by pursuing growth opportunities in strategic sales channels and national accounts across the organization 19

Engraving Group
Q4’10 (‘000s) $ Δ%(yoy)
Revenues $19 670 12 5%
8.7%
16.3%18.1%
5.7%
-0.4%1.5%
12.5%
20,000
25,000
30,000
35,000
0%
5%
10%
15%
20%
25%
Revenues $19,670 12.5%
Operating Income $2,781 135.9%
-4.7%
-15.8%
-24.4%-26.7%
-11.0%
0
5,000
10,000
15,000
30%
-25%
-20%
-15%
-10%
-5%
0%
Strong automotive mold texturizing work in North America and Europe
0
FY 08 Q1
FY 08 Q2
FY 08 Q3
FY 08 Q4
FY 09 Q1
FY 09 Q2
FY 09 Q3
FY 09 Q4
FY 10 Q1
FY 10 Q2
FY 10 Q3
FY 10 Q4
-30%
Revenue YOY %
Innovent seeing greater systems work carrying higher ASPs
Roll, plate and machining still soft
Standex India Private Limited acquisition leverages strong Indian domestic automobile market while improving support for global automotive customers
20
Opening third Chinese facility in 1H2011 to capitalize on opportunities with global and domestic OEMs
20
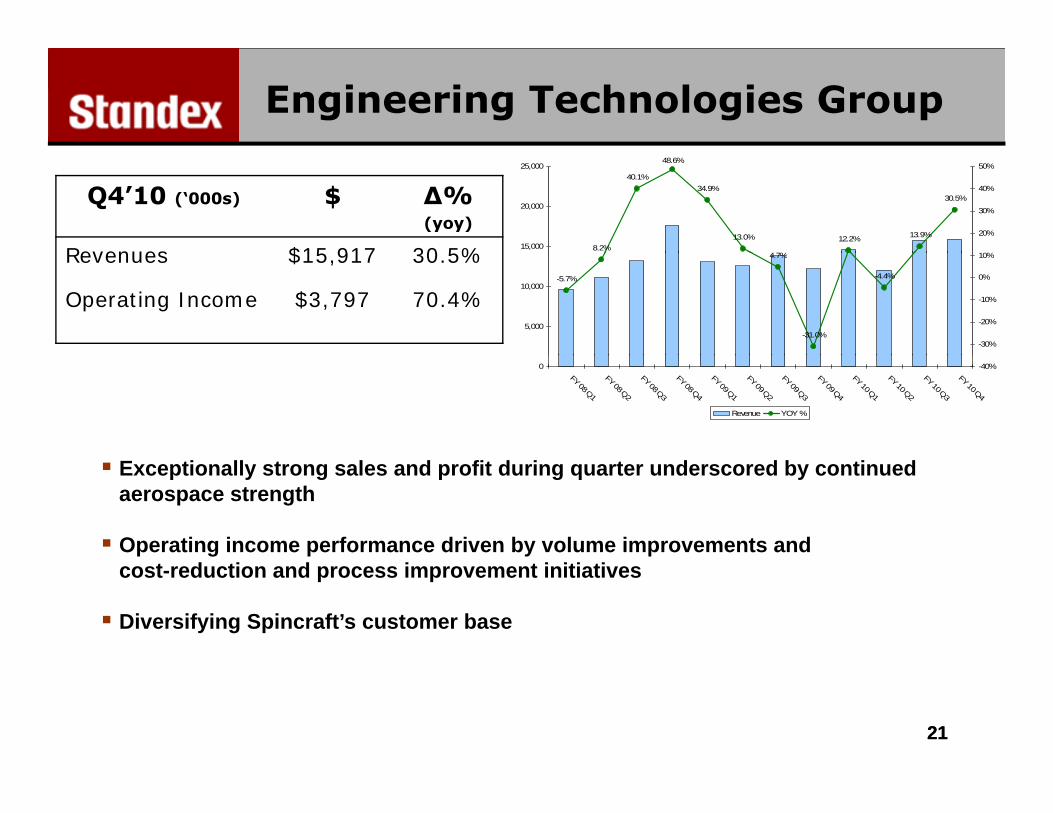
Engineering Technologies Group
Q4’10 (‘000s) $ Δ%(yoy)
Revenues $15 917 30 5% 8.2%
40.1%
48.6%
34.9%
13.0%
4 7%
12.2% 13.9%
30.5%
15,000
20,000
25,000
10%
20%
30%
40%
50%
Revenues $15,917 30.5%
Operating Income $3,797 70.4%-5.7%
4.7%
-31.0%
-4.4%
5,000
10,000
-30%
-20%
-10%
0%
10%
0FY 08 Q1
FY 08 Q2
FY 08 Q3
FY 08 Q4
FY 09 Q1
FY 09 Q2
FY 09 Q3
FY 09 Q4
FY 10 Q1
FY 10 Q2
FY 10 Q3
FY 10 Q4
-40%
Revenue YOY %
Exceptionally strong sales and profit during quarter underscored by continued aerospace strength
Operating income performance driven by volume improvements and cost-reduction and process improvement initiatives
Diversifying Spincraft’s customer base
2121

Electronics & Hydraulics Group
Q4’10 (‘000s) $ Δ%(yoy)
Revenues $15,983 31.4% -1.2% -2 3%0.3%
2 8%
8.1%
31.5%
15,000
20,000
25,000
10.0%
20.0%
30.0%
40.0%
Revenues $15,983 31.4%
Operating Income $1,886 1,340%
-5.6%-2.3% -2.8%
-19.9%
-39.5%
-45.2%-40.6%
-25.6%
5,000
10,000
-40.0%
-30.0%
-20.0%
-10.0%
0.0%
El t i d d bl di it th b d b d
0FY 08 Q1 FY 08 Q2 FY 08 Q3 FY 08 Q4 FY 09 Q1 FY 09 Q2 FY 09 Q3 FY 09 Q4 FY 10 Q1 FY 10 Q2 FY 10 Q3 FY 10 Q4
-50.0%
Revenue YOY %
Electronics records double-digit year-over-year growth on broad-based end-market strength
Operating income underscored by disciplined cost-reduction efforts undertaken d i t tduring past two years
End-market stabilization within Hydraulics
2222

ADP Group
Q4’10 (‘000s) $ Δ%(yoy)
Revenues $12,245 6.3%
-8.2%
-17.3%
-13.0%-15.5%
-2.8%
6.3%
20,000
25,000
30,000
-10%
0%
10%
Revenues $12,245 6.3%
Operating Income ($1,301) NM-25.2%
-30.1%
-40.1%-37.2%
-39.8%
-33.2%
0
5,000
10,000
15,000
50%
-40%
-30%
-20%
OI comparison impacted by $0.6 million of one-time settlement charges in Q4’10
0
FY 08 Q1
FY 08 Q2
FY 08 Q3
FY 08 Q4
FY 09 Q1
FY 09 Q2
FY 09 Q3
FY 09 Q4
FY 10 Q1
FY 10 Q2
FY 10 Q3
FY 10 Q4
-50%
Revenue YOY %
and $0.8 million less worker’s compensation and medical expenses in Q4’09
Strategic Texas location already generating orders
New pull sales strategy selling more products to wholesalers in a one-stop-shop approach; offering new, complementary products
Seeing some price stabilization
2323

Summary
Positive sales momentum in most end marketsPositive sales momentum in most end markets
8.8% year-over-year organic growth
Fi e consec ti e q arters of bottom line impro ement d ring recessionFive consecutive quarters of bottom-line improvement during recession
Achieved FY10 non-GAAP EPS of $2.25/share vs. $1.56/share in FY09
Delivered 44% increase in FY10 non-GAAP EPS despite 5% decline in sales
Shifted focus from cost-reduction to aggressive organic growth initiatives
Well positioned to leverage new cost structure as end user markets recover
2424

Q & A Q & A Q & A Q & A SessionSession
2525