synergistic oxygen evolving activity of a tio rich ... · synergistic oxygen evolving activity of a...
TRANSCRIPT
Synergistic Oxygen Evolving Activity of a TiO2‑Rich ReconstructedSrTiO3(001) SurfaceJohn Mark P. Martirez,†,§ Seungchul Kim,†,§,∥ Erie H. Morales,‡ Benjamin T. Diroll,§ Matteo Cargnello,§
Thomas R. Gordon,§ Christopher B. Murray,§,‡ Dawn A. Bonnell,‡ and Andrew M. Rappe*,†,‡,§
†The Makineni Theoretical Laboratories, Department of Chemistry and §Department of Chemistry, University of Pennsylvania,Philadelphia, Pennsylvania 19104−6323 United States‡Department of Materials Science and Engineering, University of Pennsylvania, Philadelphia, Pennsylvania 19104−6202 United States∥Center for Computational Science, Korea Institute of Science and Technology, Seoul 136-791, Republic of Korea
*S Supporting Information
ABSTRACT: In addition to composition, the structure of acatalyst is another fundamental determinant of its catalyticreactivity. Recently, anomalous Ti oxide-rich surface phases ofternary oxides have been stabilized as nonstoichiometricepitaxial overlayers. These structures give rise to differentmodes of oxygen binding, which may lead to differentoxidative chemistry. Through density functional theoryinvestigations and electrochemical measurements, we predictand subsequently show that such a TiO2 double-layer surfacereconstruction enhances the oxygen evolving activity of theperovskite-type oxide SrTiO3. Our theoretical work suggeststhat the improved activity of the restructured TiO2(001)surface toward oxygen formation stems from (i) having two Tisites with distinct oxidation activity and (ii) being able to form a strong O−O moiety (which reduces overbonding at Ti sites),which is a direct consequence of (iii) having a labile lattice O that is able to directly participate in the reaction. Here, wedemonstrate the improvement of the catalytic performance of a well-known and well-studied oxide catalyst through moremodern methods of materials processing, predicted through first-principles theoretical modeling.
1. INTRODUCTION
Transition-metal-based oxides attract significant attention fortheir ability to catalyze the highly complex four-electronoxidation of water to molecular oxygen, the pair reaction ofwater reduction to hydrogen gas.1 Current works in the fieldseek the elusive water oxidation catalyst that is effective whileonly using earth abundant elements. Recent research hasfocused on a few well-studied transition metals, such as Mn, Fe,Co and Ni, incorporating new synthetic techniques and/orcrystallographic structures.2−9 Through synthetic variations,they have observed different catalytic activities for composi-tionally similar compounds.The ability of SrTiO3 to photocatalyze water splitting to
generate both H2 and O2 upon illumination of ultraviolet lighthas been known for over three decades.10−12 Unfortunately, asa photoanode, it cannot absorb light with photon energy lessthan its large band gap energy of 3.2 eV (UV range).10,11 Thismakes it undesirable in photochemical solar energy conversion,since the UV range is only 9% of the solar energy output. It hasalso been reported that Ti-based oxides, such as SrTiO3, areexpected to perform poorly as water oxidation catalysts becauseTiIV−O is extremely stable and therefore difficult to activate13
and that TiIV is unable to be further oxidized to TiV, which is in
principle required to gather enough oxidizing equivalents tooxidize H2O to O2. The photogenerated hole is therefore thekey source of its reactivity. Much of the effort toward improvingthe performance of TiIV oxides is put into reducing their bandgaps via doping, to provide satisfactory absorption closer to orwithin the visible light range.14−18 Concurrently, significantwork has also been dedicated to studying surface structuralmodification on perovskite-type oxides, SrTiO3 being one ofthe most studied, leading to discovery of diverse and chemicallydistinct surface structures.19−32
Recently, anomalous Ti oxide-rich surface phases of ternaryoxides have been stabilized as nonstoichiometric epitaxialoverlayers with units exhibiting cubane-like motifs.22−25,27−30
Through an ab initio investigation, we predict the enhancementof the oxygen evolving activity of SrTiO3, via the aforemen-tioned surface structure modification, and we confirm theenhancement through electrochemical measurements. Interest-ingly, the reconstruction presents a diversity of Ti-O bondingenvironments, where some bonds are more covalent thanothers. This makes some surface Ti ions more electron-rich
Received: November 4, 2014Published: February 9, 2015
Article
pubs.acs.org/JACS
© 2015 American Chemical Society 2939 DOI: 10.1021/ja511332yJ. Am. Chem. Soc. 2015, 137, 2939−2947
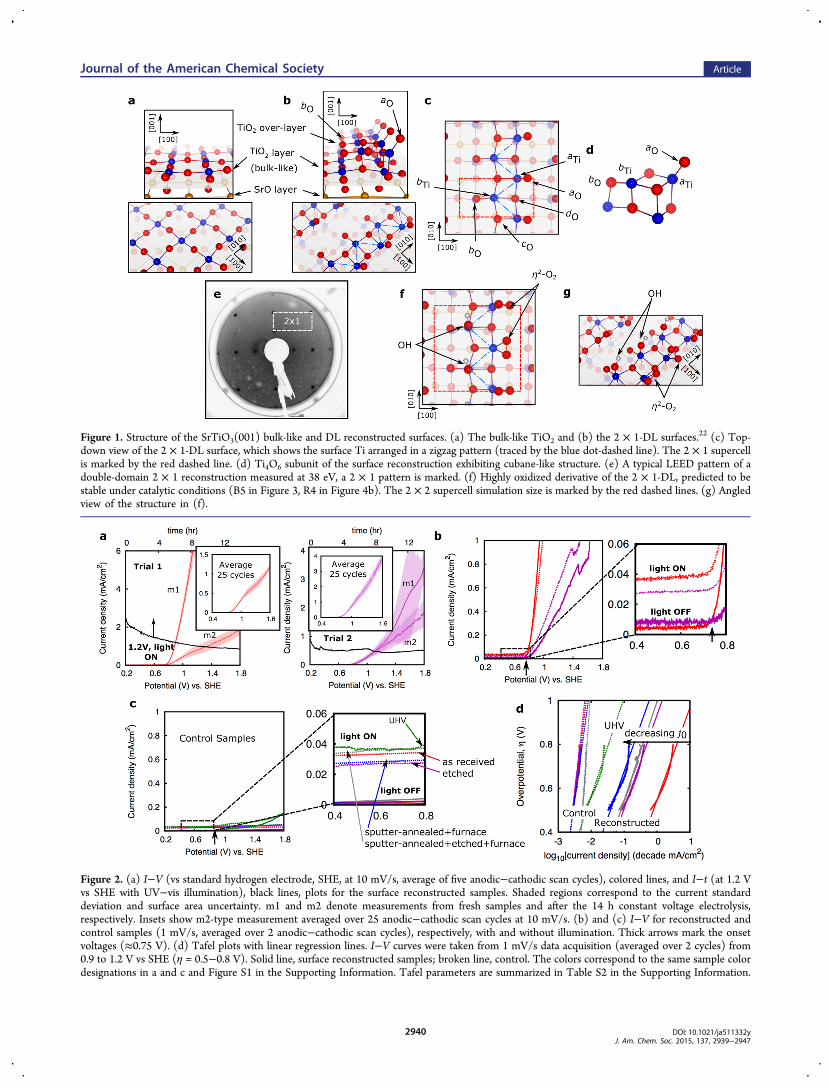
Figure 1. Structure of the SrTiO3(001) bulk-like and DL reconstructed surfaces. (a) The bulk-like TiO2 and (b) the 2 × 1-DL surfaces.22 (c) Top-down view of the 2 × 1-DL surface, which shows the surface Ti arranged in a zigzag pattern (traced by the blue dot-dashed line). The 2 × 1 supercellis marked by the red dashed line. (d) Ti4O6 subunit of the surface reconstruction exhibiting cubane-like structure. (e) A typical LEED pattern of adouble-domain 2 × 1 reconstruction measured at 38 eV, a 2 × 1 pattern is marked. (f) Highly oxidized derivative of the 2 × 1-DL, predicted to bestable under catalytic conditions (B5 in Figure 3, R4 in Figure 4b). The 2 × 2 supercell simulation size is marked by the red dashed lines. (g) Angledview of the structure in (f).
Figure 2. (a) I−V (vs standard hydrogen electrode, SHE, at 10 mV/s, average of five anodic−cathodic scan cycles), colored lines, and I−t (at 1.2 Vvs SHE with UV−vis illumination), black lines, plots for the surface reconstructed samples. Shaded regions correspond to the current standarddeviation and surface area uncertainty. m1 and m2 denote measurements from fresh samples and after the 14 h constant voltage electrolysis,respectively. Insets show m2-type measurement averaged over 25 anodic−cathodic scan cycles at 10 mV/s. (b) and (c) I−V for reconstructed andcontrol samples (1 mV/s, averaged over 2 anodic−cathodic scan cycles), respectively, with and without illumination. Thick arrows mark the onsetvoltages (≈0.75 V). (d) Tafel plots with linear regression lines. I−V curves were taken from 1 mV/s data acquisition (averaged over 2 cycles) from0.9 to 1.2 V vs SHE (η = 0.5−0.8 V). Solid line, surface reconstructed samples; broken line, control. The colors correspond to the same sample colordesignations in a and c and Figure S1 in the Supporting Information. Tafel parameters are summarized in Table S2 in the Supporting Information.
Journal of the American Chemical Society Article
DOI: 10.1021/ja511332yJ. Am. Chem. Soc. 2015, 137, 2939−2947
2940
than others.22,24 As we will show, Ti atoms with differentbonding environments on a nonstoichiometric surface shownovel catalytic behavior; they can interact differently with Ospecies and function as a single catalytic unit by playingcomplementary roles in the reaction, thereby improving theenergetics of the four-step water oxidation. Our work suggeststhat a crucial aspect for the catalytic synthesis of dioxygen onthis surface is the cooperative work between an oxidizableactive site that can accommodate electrophillic O species and aweak Lewis acid site that acts a repository of nucleophilic Ospecies. Furthermore, these two sites must be in electroniccommunication with each other.SrTiO3, a perovskite-type oxide, has alternating layers of SrO
and TiO2 along its [001] crystallographic axis. Figure 1a showsthe TiO2 exposed (001) termination with the corner-sharedsquare planar TiO4 units on the surface layer. It has beenreported that a TiO2-rich surface reconstruction forms whenthe SrTiO3 (001) surface is heated to 900−1100 °C andexposed to a continuous flow of O2, after aggressive Ar+
sputtering,22−25 although other synthetic methods andconditions have found similar surface reconstructions.19,21,29
These reconstructions are generally found to be composed of abulk-like TiO2 layer supporting a TiO2 overlayer or collectivelya double-layer (DL).22−25,27−30 The 2 × 1 TiO2-DLreconstruction (Figure 1b) has an overlayer composed ofedge-shared TiO4 units distributed in a zigzag ladder pattern,and each overlayer Ti sits atop a surface oxygen.22,24,33−36 Thelaterally unshared O atoms are either one- or two-foldcoordinated, aO and bO, respectively, while the laterally sharedO atoms are either three- or four-fold coordinated, cO and dO,respectively (bO and dO sit atop subsurface layer Ti), see Figure1c). The bonding between overlayer aTi and aO is quitecovalent, since O is divalent and aO is singly coordinated.Figure 1d shows the cubane-like Ti4O6 subunit of the surface.The exceptional stability of this reconstruction under
oxidizing conditions23 and its diverse Ti-O bonding characterand O coordination number22 prompt us to evaluate thesesurfaces (such as the 2 × 1-DL) as potential catalysts foroxidative chemistry.
2. RESULTS AND DISCUSSION2.1. Photoelectrochemical Measurements. Four 2 × 1
surface reconstructed Nb-doped (1.4 mol %) SrTiO3 singlecrystals were prepared, and the appearance of the reconstruc-tion was confirmed via low-energy electron diffraction (LEED),as shown in Figure 1e. Heavily doped samples were chosen todecouple variation in the bulk conductivity from surfacereconstruction due to processing. Indeed, resistivity measure-ments indicate that none of the processing required to createthe reconstruction significantly alters the bulk electricalproperties (see Table S1 in the Supporting Information).Photoelectrochemical measurements were performed on thesereconstructed samples. Figure 2a shows the current vs voltage(I−V) curves of the surface reconstructed samples (see alsoFigure S1 in the Supporting Information) with onset voltages of≈0.75 V vs the standard hydrogen electrode (SHE). Along withthe I−V curves, the current vs time (I-t) curves (black lines), atconstant potential and UV−vis illumination, are plotted. Stablecurrent densities of about 0.1−1 mA cm−2 at 1.2 V wereobtained corresponding to turnover numbers of ≈1−10μmolO2 hr
−1 cm−2 assuming Faradaic efficiency of unity. Thecontribution of the photoexcitation to the catalytic activity in allcases is found to be minimal (≈0.02−0.04 mA/cm2 shift in the
current density at low potentials), Figure 2b; this is as expectedfor heavily doped semiconductors, where the free carrierseffectively screen or reflect incident photons. It was previouslydemonstrated that the photocurrent measured under anodicbias may decrease 3-fold when going from 0.07% to 0.69% mol% Nb under UV illumination.16 Ellipsometric measurementsshow that the optical properties of the samples are unperturbedby their history (see Figure S2 in the Supporting Information).I−V curves for control samples (with no reconstruction) withand without UV−vis illumination were also obtained, Figure 2c.Much lower current densities were obtained from these samplesand they are at least an order of magnitude less than thesurface-reconstructed samples at potentials greater than 0.9 V.The anodic current density, j, is known to increase
exponentially with overpotential, the difference between theapplied potential, U, and the equilibrium reduction potential,εeq = 0.40 V vs SHE at pH = 14. This is expressed in the Tafelrelation: j = jo exp(η/A), where jo is the exchange currentdensity and A is the temperature-dependent Tafel slope.37 η isusually plotted against log10(j), η = 2.303A log(j/jo) which areshown in Figure 2d.37 Tafel slopes ≈0.20 V with exchangecurrent densities of 0.003−0.05 mA/cm2 (see Table S2 in theSupporting Information) were obtained from the reconstructedsamples at 0.9−1.2 V potential window. Much higher Tafelslopes (0.5−1 V) and lower exchange current densities (0.001−0.003 mA/cm2) were found for the control samples, althoughthe UHV annealed sample showed a better Tafel slope (0.20 V)but much lower jo (0.0006 mA/cm2). Exclusively annealingSrTiO3 in UHV had been previously shown to produce the 2 ×1 reconstruction,21 however the surface Ti-enrichmentprocesses31,38 (sputtering and chemical etching) and calcinationin furnace in O2 are essential for producing very sharp LEEDimages (indicating large areas of the reconstruction). Thus, theobserved enhancement of slope for the UHV annealed controlsample is likely due to some surface reconstruction that isundetectable in LEED. Samples exhibiting similar Tafel slopeslikely indicate similar catalytic mechanisms; however varyingthe effective catalytic surface area will lead to changes in their jo.In all cases, the activity is observed over prolonged period of
time which eventually decreases (compare curves m1 and m2 inFigure 2a), presumably due to the loss in the long-range orderat the surface, because of, for example, undesirable adsorbatesand the loss of the active surface structure. However, theenhancement of used samples is noticeably better than controls,and simply reannealing them in UHV recovers the catalyticactivity. LEED patterns of reannealed samples confirm theexistence of 2 × 1 reconstruction indicating that recoveringprocedure in UHV restores the long-range surface order (seeFigures S4−S6 in Supporting Information.)We have found that this enhancement may be ascribed to the
acquired efficiency due to the reconstruction, which enablesthermodynamically balanced chemical routes. This is discussedin the following sections.
2.2. Computational Framework. A theoretical frameworkadapted from refs 39−43 is used to evaluate the surface’soxygen evolving activity through a density functional theory(DFT) thermodynamics approach. The method uses a metricthat relies on finding the largest thermodynamic barrierassociated with the elementary steps after breaking the reaction:2H2O → O2 + 4H+ + 4e− down into four proton-coupledelectron-transfer steps, with appropriate intermediates. For areaction consisting of four single-electron steps (as in thereaction above): η =U − εeq = 1/4 ∑i
4[U − ε(i)], where ε(i)
Journal of the American Chemical Society Article
DOI: 10.1021/ja511332yJ. Am. Chem. Soc. 2015, 137, 2939−2947
2941
and εeq are the equilibrium reduction potential of step i and ofthe overall reaction relative to a suitable reference, respectively.Here we use the standard hydrogen electrode as the reference.We can define the minimum η at which all [U − ε(i)] are ≥0 tofavor oxidation, which is ηmin = max[ε(i) − εeq] = Δεmax. Notethat the Gibbs free energy of step i oxidation half-reaction,ΔGox(i), (in eV) is equal to e·ε(i), where e is the electroncharge.A criterion for a good oxygen evolving catalyst, therefore, is
having the maximum ε(i) close to the reversible potential of theO2/H2O half reaction, (εeq; 1.23, 0.40 V vs standard hydrogenelectrode at pH = 1, 14). This method has been shown toaccurately capture experimental oxygen evolving activity trendsof many inorganic metal oxides, metals, and biological cofactorscontaining metal oxides.40−45 Thus, comparing Δεmax fordifferent catalysts calculated by the same method is an excellentpredictor of relative catalytic performance of oxides. Indeedoxides with exceptional oxygen evolving activity have lowpredicted Δεmax.
39,42−45 See Materials and Methods section fordetails.The use of thermodynamic and electronic property-based
descriptors, either experimentally or theoretically determined,has gained popularity in the field because of their success inrelating and predicting the kinetic behavior of transition-metaloxides toward water splitting.6,13,46−49
2.3. Surface Hydration and Oxidation. Prior to thetheoretical activity study described above, the transformation ofthe surfaces in aqueous and oxidizing conditions must beevaluated. This is to determine the most thermodynamically
favorable form of the surfaces that would perform the catalyticreactions. The hydration chemistry of the TiO2 (001)termination of SrTiO3 is very well studied.50−53 Whilenumerous literature for bulk-like termini are available, studyon the water chemistry of surface reconstructions of SrTiO3 isstill emerging. Recent notable works in this field explores thehydration behavior54,55 of the more reactive reconstructed(110) surface,56 while another provides DFT-based partialhydration studies on the TiO2-rich 2 × 1 (001) reconstruc-tion.28,29 In the later work, hydration was found to present apotential explanation for the ubiquity of the 2 × 1reconstruction over the chemically related c(2 × 2) variant,attesting to the propensity of the former toward hydration toacquire seemingly anomalous stability.28,29
DFT-based studies on the water oxidation path for O2synthesis on perovskite oxides has also been well documented.However, in these studies, the bulk-like termini, for example,the TiO2 (001) for Ti-based perovskites, were the only surfacesconsidered.45
The stability of the 1 × 1 TiO2 (denoted as A0 in Figure S7in the Supporting Information) and 2 × 1-DL (denoted as B0in Figure S8 in the Supporting Information and Figure 3) withrespect to their hydrated and more oxidized forms weredetermined. This is done considering operational electro-chemical conditions (298 K, equilibrium with an aqueousenvironment, pH = 14, and subjected to an anodic (oxidizing)potential). To find the most stable surfaces in these conditions,H2O molecules have been added to both A0 and B0, and thenH atoms have been progressively removed from them. This is
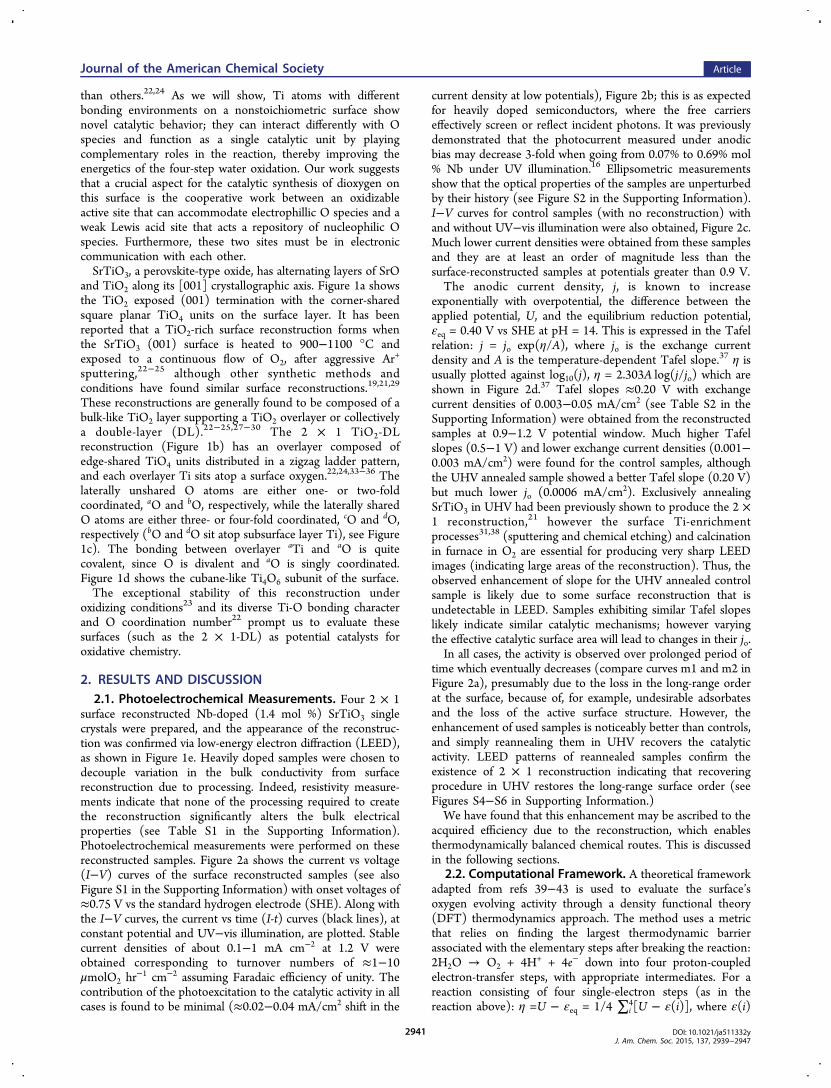
Figure 3. (a) Reverse Latimer (hydration and oxidation) diagram for the 2 × 1 TiO2-DL surface. The diagram shows a series of hydration anddeprotonation reactions leading to O-enrichment of the reconstructed surface. It shows the transformation of the adsorbate-free surface (B0) intothe most oxidized form of the surface (B5), passing through the most stable intermediates (B1, B2, B3, and B4). A single bond between two O atomsindicates a peroxo, while a one-and-a-half bond indicates a superoxo species. The schematics show only the top basis atoms of the 2 × 2 supercell(simulation size). The species experiencing chemical changes are in color. The Gibbs free energies of the reactions are indicated next to the arrows(vs SHE, pH = 14). B4 and B5 are R3 and R4 of Figure 4b, respectively. The corresponding relative surface free energy at pH = 14 as a function ofapplied potential (B0 + 4 H2O is chosen as the zero energy) and the Pourbaix diagram are shown in (b) and (c), respectively.
Journal of the American Chemical Society Article
DOI: 10.1021/ja511332yJ. Am. Chem. Soc. 2015, 137, 2939−2947
2942
because it is expected that the surface becomes more O-rich asthe potential bias becomes increasingly anodic. The completehydration and oxidation diagrams are constructed for the bulk-like TiO2 and the 2 × 1-DL surfaces and are shown in FiguresS7 and S8 in the Supporting Information, respectively. Figure3a shows the most stable path to hydration and oxidation(reverse Latimer diagram) for the 2 × 1-DL surface (2 × 2surface cell). Starting from the pristine 2 × 1-DL (B0), thesurface is hydrated, preferentially on the aTi sites first then on abTi site, leading to B1 (net hydration process is the red path).From this hydrated form, oxidation occurs by taking outelectrons with the release of protons from the surfacehydroxyls: total of 2(H+ + e−) leading to B2 (green path),3(H+ + e−) leading to B3 (yellow), 5(H+ + e−) leading to B4(pink), and finally, 6(H+ + e−) with the addition of waterleading to B5 (blue). The oxidized structures feature side-oncoordinated O2 (η
2−O2) molecules that are linked to the aTiatoms, either horizontally or vertically oriented, whilehydroxide ions are adsorbed on the aTi and bTi atoms. Thesesurface η2−O2 exhibit either peroxo (single bond) or superoxo(one-and-a-half bond) characteristics as demonstrated by theircharges, bond-lengths, and vibrational frequencies, as shown inTable 1. Shown in Figure 1f,g is the highly oxidized form of the2 × 1-DL reconstruction (B5).
The relative stability of the hydrated and oxidized surfacesvary with the applied potential and pH as shown in Figure 3b,c.The Gibbs free energies, ΔGox, therein (in eV) for conversionof surface XN to XN′ are calculated using
Δ = Δ ° + Δ ° − · · − · ·G G G n e U n 0.0592 pHox SHE ox (1)
where ΔGSHE° = 0 eV is the Gibbs free energy change of theSHE, which serves as the reference, ΔGox° is the standard Gibbsfree energy change of the oxidation reaction:
+ → ′ + + ++ −XN m XN n e rH O(l) (H ) O2 2
calculated using energies from DFT simulation and gas-phaseexperimental entropies.58 U is the applied potential against theSHE, and e is the electron charge. See the“Additional
Computational Methods” section in Supporting Informationfor the details of the calculations of ΔGox° .Figure 3b shows that the surface undergoes spontaneous
hydration to B1 (red region), and then is subsequently oxidizedat 0.46 V (= [1.26 + 0.13]eV/3e−) to B3 (orange region). At0.63 V (= [1.55 + 0.33]eV/3e−), the surface is further oxidizedto B5 (blue region). Figure 3c shows the correspondingPourbaix diagram from pH = 7 to 14. It illustrates how thecoexistence potential varies with pH. The water splittingchemistry is done in excess of the equilibrium potential (0.40 Vat pH = 14), and each individual elementary step requires muchlarger potential to be spontaneous, as shown later. And thus, atthese realistic kinetically permissive potentials (≫0.4 V), themost relevant surface would be B5.
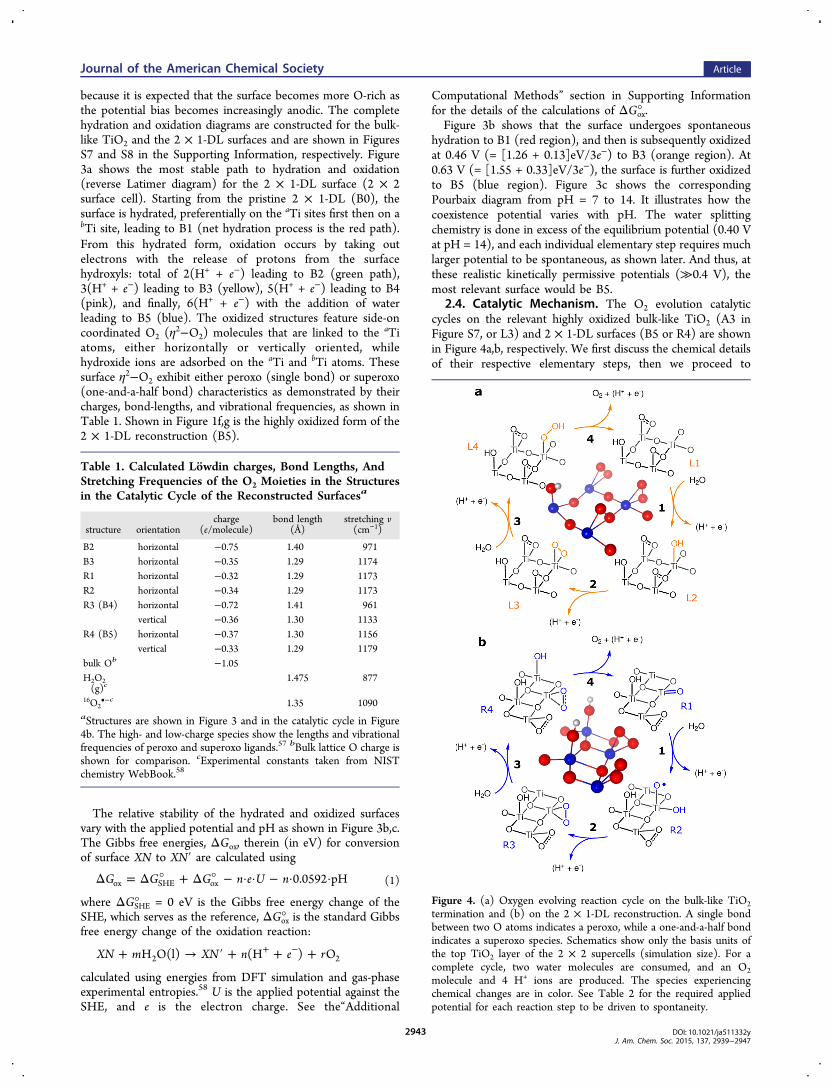
2.4. Catalytic Mechanism. The O2 evolution catalyticcycles on the relevant highly oxidized bulk-like TiO2 (A3 inFigure S7, or L3) and 2 × 1-DL surfaces (B5 or R4) are shownin Figure 4a,b, respectively. We first discuss the chemical detailsof their respective elementary steps, then we proceed to
Table 1. Calculated Lowdin charges, Bond Lengths, AndStretching Frequencies of the O2 Moieties in the Structuresin the Catalytic Cycle of the Reconstructed Surfacesa
structure orientationcharge
(e/molecule)bond length
(Å)stretching v(cm−1)
B2 horizontal −0.75 1.40 971B3 horizontal −0.35 1.29 1174R1 horizontal −0.32 1.29 1173R2 horizontal −0.34 1.29 1173R3 (B4) horizontal −0.72 1.41 961
vertical −0.36 1.30 1133R4 (B5) horizontal −0.37 1.30 1156
vertical −0.33 1.29 1179bulk Ob −1.05H2O2(g)c
1.475 877
16O2•−c 1.35 1090
aStructures are shown in Figure 3 and in the catalytic cycle in Figure4b. The high- and low-charge species show the lengths and vibrationalfrequencies of peroxo and superoxo ligands.57 bBulk lattice O charge isshown for comparison. cExperimental constants taken from NISTchemistry WebBook.58
Figure 4. (a) Oxygen evolving reaction cycle on the bulk-like TiO2termination and (b) on the 2 × 1-DL reconstruction. A single bondbetween two O atoms indicates a peroxo, while a one-and-a-half bondindicates a superoxo species. Schematics show only the basis units ofthe top TiO2 layer of the 2 × 2 supercells (simulation size). For acomplete cycle, two water molecules are consumed, and an O2molecule and 4 H+ ions are produced. The species experiencingchemical changes are in color. See Table 2 for the required appliedpotential for each reaction step to be driven to spontaneity.
Journal of the American Chemical Society Article
DOI: 10.1021/ja511332yJ. Am. Chem. Soc. 2015, 137, 2939−2947
2943

comparing and contrasting the two, both qualitatively andquantitatively. Single-site activity study is performed to be ableto simulate a low-frequency reaction (only a small fraction ofthe sites undergo O2 formation at one time), and thus theneighbor of the “active site” is likely fixed to the equilibriumconfiguration during the reaction. The 2 × 2 simulation size isthe smallest cell in which this can be modeled. Thus, while theneighbor is transiently“inactive”, this site is able to participate inthe chemical reaction as well.The oxidation cycle on the bulk-like TiO2 termination is
shown in Figure 4a. The mechanistic study is similar to the onepresented in ref 45. Figure 4a shows the likely reaction cycleoperative at potentials between 0.50 and 1.5 V. Reaction step(1) produces a OH on a Ti site, followed by (2), production ofO directly coordinated to a lattice O. The coordination of theO adatom to a lattice O removes the necessity to oxidize the Tisite further where instead a surface peroxide O2
2− is formed.Since the lattice O are already bound to two Ti atoms, theyhave to expand their valence to three to be available toaccommodate the extra O. (3), OOH may then form uponanother oxidative attack by water on the same site, and (4),finally releases an O2, freeing the Ti site available to undergoanother cycle.O2 evolution on the 2 × 1-DL surface, on the other hand, is
achieved as follows (shown in Figure 4b): (1) Beginning withsurface R1, aTiaO is oxidized by adding H2O and losing aproton, resulting in an O radical. (2) Further oxidation of theaTi site generates a peroxo-type O2 ligand (see diatomicparameters in Table 1). (3) After another single electronoxidation at the aTi site, coupled with the adsorption of ahydroxo at the bTi site, the R4 (B5) structure (Figure 1g) isgenerated. The O2 bond contracts, its stretching frequencyrises, and the Lowdin charge decreases, consistent with forminga superoxo (Table 1). These changes are accompanied by theremoval of a proton from a water molecule at the bTi site, assummarized by the reactions in Scheme 1. (4) Finally,
deprotonation at the bTi site creates an O2− that replaces thedesorbed dioxygen molecule at the aTi, regenerating R1. Thisstep is suggested by our DFT relaxation studies; when an Oatom is on the bTi site and an O2 is present on the aTi site, theO2 spontaneously desorbs.Projected density of states (PDOS) calculations show that
the states near the Fermi level are mostly derived fromadsorbate O/O2 frontier orbitals (Figure 5). Completely filledand partially empty O−2p states on R1 and R2, respectively,fully filled O2
2−−π*orbitals on R3, and a half-filledO2
−−π*orbital on R4 confirm the transformation from oxo,to oxo radical, to peroxo, and finally, to superoxo after steps(1), (2), and (3), respectively.There are two distinct features in the mechanism proposed
here that are often not explicitly touched on in other proposedmechanisms for O2 production from water on oxides. First, ourmechanism is of the Mars−van Krevelen-type,59 but with H2Oas the O source. A lattice oxygen (aO) participates directly as areactant, which is then replenished by a fully deprotonated
water. Mars−van Krevelen-type mechanisms often operate incatalytic oxidation reactions, but the lattice O is usuallyreplenished through dissociative adsorption of O2. Second,there are two types of active metal sites on the surface, differentin the way they share electrons with their adsorbates, i.e., one isnucleophilic, the more electron-rich: aTi, while the other iselectrophilic, bTi. Usually, the mechanism involving transition-metal oxides assumes that all active metal sites arehomogeneous. In our mechanism, the two types of Ti on thesurface have a synergistic effect on the O2 production process.aTi serves as excellent binding site for electrophilic radicals suchas •OH and •O•, where they undergo a redox reaction with theaTiaO. The presence of a nucleophile, such as OH− and O2−,on bTi then makes it easier to oxidize O2
2−/O2− on aTi, which
leads to the production of O2. Thus, together they perform asone nearly ideal catalytic unit. Another defining characteristic ofthe mechanism is that the positive charge is accumulated on theO species and not on the Ti; the Ti charges remain at +4throughout the cycle.The difference between the mechanism on the 1 × 1 and on
the 2 × 1-DL is that in the 1 × 1, the lattice O is stronglybound to the surface such that an oxygen vacancy would berequired to form between two Ti atoms if the lattice O is toparticipate in the O2 generation. Therefore, in the former case,O2 is produced from incoming water molecules exclusively.This is unlike the singly coordinated aO found on the 2 × 1reconstructed surface. Also, the Ti atoms in the former case areessentially catalytically independent. We note that each Ti inthe unreconstructed surface is connected to another by onlyone O bridging atom and are at least 4 Å away from each other.In the 2 × 1, the Ti ions (aTi and bTi) are connected by twobridging O atoms and are only ≈2.8 Å away from each other.
Scheme 1. Proton-Coupled Electron-Transfer Step Involvingboth aTi and bTi Simultaneously in Step 3 of Figure 4b
Figure 5. Atomic orbital (2s and 2p states) PDOS of the O species inthe catalytic cycle for the 2 × 1 TiO2-DL surface in Figure 4b. Brokenline: majority spin states, solid line: minority spin states. EF is theFermi level, where states are occupied and unoccupied below andabove this line, respectively. The orbital occupation is consistent withoxo, oxo radical, peroxo, and superoxo orbital occupation schemes,from top to bottom. The splitting of the O2−π* orbitals is due to thesigma bonding interaction interaction of one of these orbitals with aTi.
Journal of the American Chemical Society Article
DOI: 10.1021/ja511332yJ. Am. Chem. Soc. 2015, 137, 2939−2947
2944
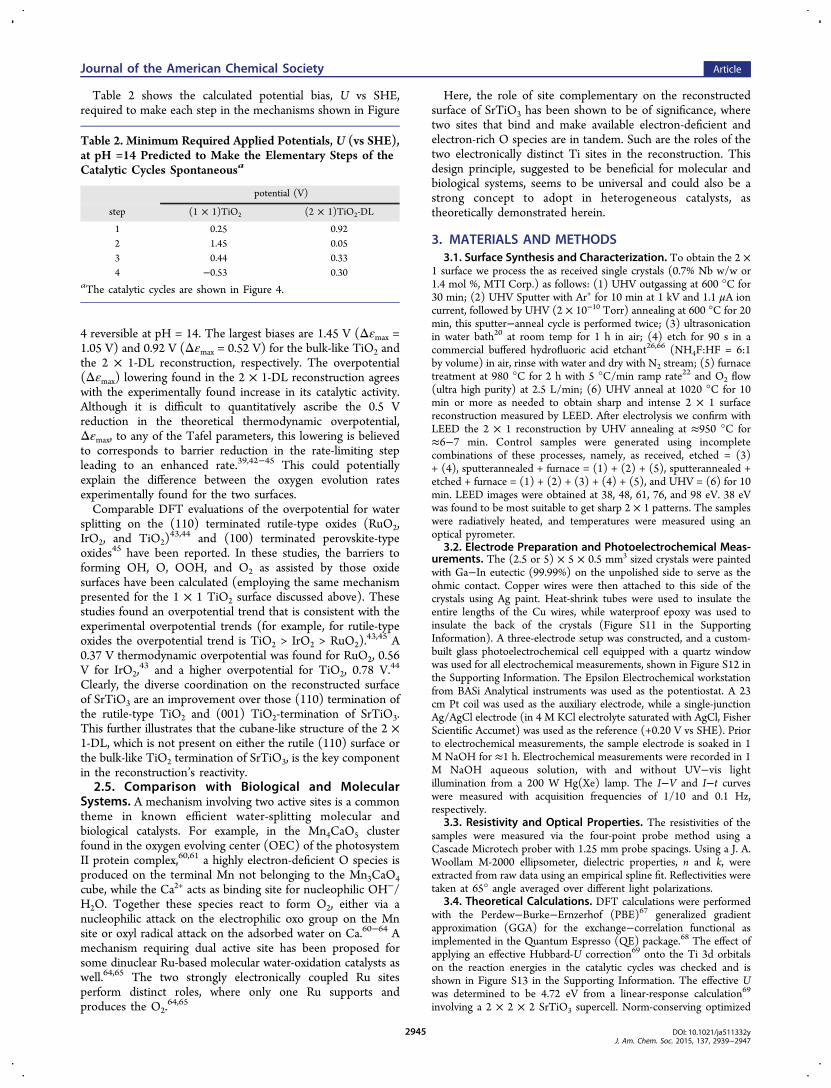
Table 2 shows the calculated potential bias, U vs SHE,required to make each step in the mechanisms shown in Figure
4 reversible at pH = 14. The largest biases are 1.45 V (Δεmax =1.05 V) and 0.92 V (Δεmax = 0.52 V) for the bulk-like TiO2 andthe 2 × 1-DL reconstruction, respectively. The overpotential(Δεmax) lowering found in the 2 × 1-DL reconstruction agreeswith the experimentally found increase in its catalytic activity.Although it is difficult to quantitatively ascribe the 0.5 Vreduction in the theoretical thermodynamic overpotential,Δεmax, to any of the Tafel parameters, this lowering is believedto corresponds to barrier reduction in the rate-limiting stepleading to an enhanced rate.39,42−45 This could potentiallyexplain the difference between the oxygen evolution ratesexperimentally found for the two surfaces.Comparable DFT evaluations of the overpotential for water
splitting on the (110) terminated rutile-type oxides (RuO2,IrO2, and TiO2)
43,44 and (100) terminated perovskite-typeoxides45 have been reported. In these studies, the barriers toforming OH, O, OOH, and O2 as assisted by those oxidesurfaces have been calculated (employing the same mechanismpresented for the 1 × 1 TiO2 surface discussed above). Thesestudies found an overpotential trend that is consistent with theexperimental overpotential trends (for example, for rutile-typeoxides the overpotential trend is TiO2 > IrO2 > RuO2).
43,45 A0.37 V thermodynamic overpotential was found for RuO2, 0.56V for IrO2,
43 and a higher overpotential for TiO2, 0.78 V.44
Clearly, the diverse coordination on the reconstructed surfaceof SrTiO3 are an improvement over those (110) termination ofthe rutile-type TiO2 and (001) TiO2-termination of SrTiO3.This further illustrates that the cubane-like structure of the 2 ×1-DL, which is not present on either the rutile (110) surface orthe bulk-like TiO2 termination of SrTiO3, is the key componentin the reconstruction’s reactivity.2.5. Comparison with Biological and Molecular
Systems. A mechanism involving two active sites is a commontheme in known efficient water-splitting molecular andbiological catalysts. For example, in the Mn4CaO5 clusterfound in the oxygen evolving center (OEC) of the photosystemII protein complex,60,61 a highly electron-deficient O species isproduced on the terminal Mn not belonging to the Mn3CaO4cube, while the Ca2+ acts as binding site for nucleophilic OH−/H2O. Together these species react to form O2, either via anucleophilic attack on the electrophilic oxo group on the Mnsite or oxyl radical attack on the adsorbed water on Ca.60−64 Amechanism requiring dual active site has been proposed forsome dinuclear Ru-based molecular water-oxidation catalysts aswell.64,65 The two strongly electronically coupled Ru sitesperform distinct roles, where only one Ru supports andproduces the O2.
64,65
Here, the role of site complementary on the reconstructedsurface of SrTiO3 has been shown to be of significance, wheretwo sites that bind and make available electron-deficient andelectron-rich O species are in tandem. Such are the roles of thetwo electronically distinct Ti sites in the reconstruction. Thisdesign principle, suggested to be beneficial for molecular andbiological systems, seems to be universal and could also be astrong concept to adopt in heterogeneous catalysts, astheoretically demonstrated herein.
3. MATERIALS AND METHODS3.1. Surface Synthesis and Characterization. To obtain the 2 ×
1 surface we process the as received single crystals (0.7% Nb w/w or1.4 mol %, MTI Corp.) as follows: (1) UHV outgassing at 600 °C for30 min; (2) UHV Sputter with Ar+ for 10 min at 1 kV and 1.1 μA ioncurrent, followed by UHV (2 × 10⁻¹⁰ Torr) annealing at 600 °C for 20min, this sputter−anneal cycle is performed twice; (3) ultrasonicationin water bath20 at room temp for 1 h in air; (4) etch for 90 s in acommercial buffered hydrofluoric acid etchant26,66 (NH4F:HF = 6:1by volume) in air, rinse with water and dry with N2 stream; (5) furnacetreatment at 980 °C for 2 h with 5 °C/min ramp rate22 and O2 flow(ultra high purity) at 2.5 L/min; (6) UHV anneal at 1020 °C for 10min or more as needed to obtain sharp and intense 2 × 1 surfacereconstruction measured by LEED. After electrolysis we confirm withLEED the 2 × 1 reconstruction by UHV annealing at ≈950 °C for≈6−7 min. Control samples were generated using incompletecombinations of these processes, namely, as received, etched = (3)+ (4), sputterannealed + furnace = (1) + (2) + (5), sputterannealed +etched + furnace = (1) + (2) + (3) + (4) + (5), and UHV = (6) for 10min. LEED images were obtained at 38, 48, 61, 76, and 98 eV. 38 eVwas found to be most suitable to get sharp 2 × 1 patterns. The sampleswere radiatively heated, and temperatures were measured using anoptical pyrometer.
3.2. Electrode Preparation and Photoelectrochemical Meas-urements. The (2.5 or 5) × 5 × 0.5 mm3 sized crystals were paintedwith Ga−In eutectic (99.99%) on the unpolished side to serve as theohmic contact. Copper wires were then attached to this side of thecrystals using Ag paint. Heat-shrink tubes were used to insulate theentire lengths of the Cu wires, while waterproof epoxy was used toinsulate the back of the crystals (Figure S11 in the SupportingInformation). A three-electrode setup was constructed, and a custom-built glass photoelectrochemical cell equipped with a quartz windowwas used for all electrochemical measurements, shown in Figure S12 inthe Supporting Information. The Epsilon Electrochemical workstationfrom BASi Analytical instruments was used as the potentiostat. A 23cm Pt coil was used as the auxiliary electrode, while a single-junctionAg/AgCl electrode (in 4 M KCl electrolyte saturated with AgCl, FisherScientific Accumet) was used as the reference (+0.20 V vs SHE). Priorto electrochemical measurements, the sample electrode is soaked in 1M NaOH for ≈1 h. Electrochemical measurements were recorded in 1M NaOH aqueous solution, with and without UV−vis lightillumination from a 200 W Hg(Xe) lamp. The I−V and I−t curveswere measured with acquisition frequencies of 1/10 and 0.1 Hz,respectively.
3.3. Resistivity and Optical Properties. The resistivities of thesamples were measured via the four-point probe method using aCascade Microtech prober with 1.25 mm probe spacings. Using a J. A.Woollam M-2000 ellipsometer, dielectric properties, n and k, wereextracted from raw data using an empirical spline fit. Reflectivities weretaken at 65° angle averaged over different light polarizations.
3.4. Theoretical Calculations. DFT calculations were performedwith the Perdew−Burke−Ernzerhof (PBE)67 generalized gradientapproximation (GGA) for the exchange−correlation functional asimplemented in the Quantum Espresso (QE) package.68 The effect ofapplying an effective Hubbard-U correction69 onto the Ti 3d orbitalson the reaction energies in the catalytic cycles was checked and isshown in Figure S13 in the Supporting Information. The effective Uwas determined to be 4.72 eV from a linear-response calculation69
involving a 2 × 2 × 2 SrTiO3 supercell. Norm-conserving optimized
Table 2. Minimum Required Applied Potentials, U (vs SHE),at pH =14 Predicted to Make the Elementary Steps of theCatalytic Cycles Spontaneousa
potential (V)
step (1 × 1)TiO2 (2 × 1)TiO2-DL
1 0.25 0.922 1.45 0.053 0.44 0.334 −0.53 0.30
aThe catalytic cycles are shown in Figure 4.
Journal of the American Chemical Society Article
DOI: 10.1021/ja511332yJ. Am. Chem. Soc. 2015, 137, 2939−2947
2945

designed nonlocal pseudopotentials70−72 were generated using theOPIUM package.73 Four-unit-cell-thick slabs with 2 × 2 surfacesupercells and in-plane lattice constant of 3.95 Å were used to simulatethe surfaces. A vacuum separation of ≈16 Å in the direction normal tothe slab has been included, with a dipole correction74 in the samedirection to eliminate artificial electrostatic interactions. The Brillouinzone was sampled via the Monkhorst−Pack75 method with a 3 × 3 × 1mesh. As for the molecules (H2 and H2O), the total energy of a gas-phase molecule was approximated by calculating the energy of anisolated molecule that is separated from its repeat image by 12 Å alongthree orthogonal directions. In the H2O case, a dipole correction wasalso employed along the direction of the molecule’s dipole. Weperformed spin-unrestricted calculations when deemed necessary.Structural relaxation has been carried out until the force on each atomis below 0.01 eV/Å. We calculated the Gibbs free energies of thereactions using the DFT energies (T = 0 K) and extrapolated to 298 Kusing the experimental entropies58 of the gas-phase reactants andproducts. Zero point energy corrections to the total energy werecalculated, applying the harmonic approximation, using linear responseΓ-point phonon calculations for the surfaces and molecules asimplemented in the QE package (see “Additional ComputationalMethods” section in the Supporting Information). For the surfacephonon calculations, only motions of the TiO2 overlayer or the topbulk-like layer were considered. This was done because we assume thatthe zero point energy contributions of the bottom layers would simplycancel each other out in the Gibbs free energy change calculations.We used the electrochemical oxide path proposed by J. O.
Bockris47,76 as the initial guess for the mechanism. We then introducedmodifications in the reaction mechanism and intermediate statesguided by the results in the DFT relaxation studies. The slabs remaininsulating even in the presence of adsorbates, indicating that there isno significant long-range electronic reorganization among differentsites on the surface or in the bulk to accommodate the adsorbates.See “Additional Computational Methods” in the Supporting
Information for the thermodynamic framework of the catalyticefficiency analysis.
■ ASSOCIATED CONTENT*S Supporting InformationAdditional LEED, I−V and I−t curves, resistivity and opticalmeasurements, tabulated Tafel parameters, diagrams of theexperimental setup, extended computational methods, otherDFT-predicted thermodynamic diagrams, additional catalyticcycles, and tabulated hydration and oxidation free energies ofthe surfaces. Structure cif files of all the relevant structures. Thismaterial is available free of charge via the Internet at http://pubs.acs.org.
■ AUTHOR INFORMATIONCorresponding Author*[email protected] authors declare no competing financial interest.
■ ACKNOWLEDGMENTSJ.M.P.M. acknowledges the support from the Office of NavalResearch under grant N00014-14-1-0761. S.K. was supportedby US DOE through grant no. DE-FG02-07ER15920. A.M.R.acknowledges support of the Air Force Office of ScientificResearch through grant number FA9550-10-1-0248. Computa-tional support was provided by HPCMO of US DoD andNERSC. E.H.M., D.A.B., M.C., and T.R.G. would like toacknowledge the support by the Nano Bio Interface Center(NBIC), National Science Foundation Grant NSEC DMR-0832802. B.T.D. was supported by the US DOE, Office of BasicEnergy Sciences, Materials Sciences and Engineering Division,
award no. DE-SC0002158. C.B.M. is grateful for the support ofthe Richard Perry University Professorship. VESTA was usedfor the 3D structural models throughout this paper (ref 77).
■ REFERENCES(1) Compton, R. G. Comprehensive Chemical Kinetics; ElsevierScience Publishing Company Inc.: Amsterdam, The Netherlands,1987; Vol. 27.(2) Kanan, M. W.; Nocera, D. G. Science 2008, 321, 1072−5.(3) Yang, H. G.; adh S. Z.Qiao, C. H. S.; Zou, J.; Liu, G.; Smith, S. C.;Cheng, H. M.; Lu, G. Q. Nature 2008, 453, 638.(4) Esswein, A. J.; Surendranath, Y.; Reece, S. Y.; Nocera, D. G.Energy Environ. Sci. 2011, 4, 499.(5) Hocking, R. K.; Brimblecombe, R.; Chang, L.-Y.; Singh, A.;Cheah, M. H.; Glover, C.; Casey, W. H.; Spiccia, L. Nat. Chem. 2011,3, 461.(6) Suntivich, J.; May, K. J.; Gasteiger, H. A.; Goodenough, J. B.;Shao-Horn, Y. Science 2011, 334, 1383−1385.(7) Gardner, G. P.; Go, Y. B.; Robinson, D. M.; Smith, P. F.;Hadermann, J.; Abakumov, A.; Greenblatt, M.; Dismukes, G. C.Angew. Chem., Int. Ed. 2012, 51, 1616−1619.(8) Bediako, D. K.; Lassalle-Kaiser, B.; Surendranath, Y.; Yano, J.;Yachandra, V. K.; Nocera, D. G. J. Am. Chem. Soc. 2012, 134, 6801−6809.(9) Robinson, D. M.; Go, Y. B.; Mui, M.; Gardner, G.; Zhang, Z.;Mastrogiovanni, D.; Garfunkel, E.; Li, J.; Greenblatt, M.; Dismukes, G.C. J. Am. Chem. Soc. 2013, 135, 3494−3501.(10) Wrighton, M. S.; Ellis, A. B.; Wolczanski, P. T.; Morse, D. L.;Abrahamson, H. B.; Ginley, D. S. J. Am. Chem. Soc. 1976, 98, 2774−2779.(11) Bolts, J. M.; Wrighton, M. S. J. Phys. Chem. 1976, 80, 2641−2645.(12) Bocarsly, A. B.; Bolts, J. M.; Cummins, P. G.; Wrighton, M. S.Appl. Phys. Lett. 1977, 31, 568.(13) Betley, T. A.; Wu, Q.; Van Voorhis, T.; Nocera, D. G. Inorg.Chem. 2008, 47, 1849−61.(14) Matsumura, M.; Hiramoto, M.; Tsubomura, H. J. Electrochem.Soc. 1983, 130, 326.(15) Kato, H.; Kudo, A. J. Phys. Chem. B 2002, 106, 5029−5034.(16) Yin, J.; Ye, J.; Zou, Z. Appl. Phys. Lett. 2004, 85, 689.(17) Konta, R.; Ishii, T.; Kato, H.; Kudo, A. J. Phys. Chem. B 2004,108, 8992−8995.(18) Maegli, A.; Yoon, S.; Otal, E.; Karvonen, L.; Mandaliev, P.;Weidenkaff, A. J. Solid State Chem. 2011, 184, 929−936.(19) Jiang, Q.; Zegenhagen, J. Surf. Sci. 1999, 425, 343−354.(20) Koster, G.; Kropman, B. L.; Rijnders, G. J. H. M.; Blank, D. H.A.; Rogalla, H. Appl. Phys. Lett. 1998, 73, 2920.(21) Castell, M. R. Surf. Sci. 2002, 505, 1−13.(22) Erdman, N.; Poeppelmeier, K. R.; Asta, M.; Warschkow, O.;Ellis, D. E.; Marks, L. D. Nature 2002, 419, 55−8.(23) Erdman, N.; Marks, L. Surf. Sci. 2003, 526, 107−114.(24) Erdman, N.; Warschkow, O.; Asta, M.; Peoppelmeier, K. R.;Ellis, D. E.; Marks, L. D. J. Am. Chem. Soc. 2003, 125, 10050.(25) Lanier, C. H.; van der Walle, A.; Erdman, N.; Landree, E.;Warschkow, O.; Kazimirov, A.; Poeppelmeier, K. R.; Zegenhagen, J.;Asta, M.; Marks, L. D. Phys. Rev. B 2007, 76, 045421.(26) Bachelet, R.; Sanchez, F.; Palomares, F. J.; Ocal, C.;Fontcuberta, J. Appl. Phys. Lett. 2009, 95, 141915.(27) Kienzle, D. M.; Becerra-Toledo, A. E.; Marks, L. D. Phys. Rev.Lett. 2011, 106, 176102−1−4.(28) Becerra-Toledo, A.; Castell, M.; Marks, L. Surf. Sci. 2012, 606,762−765.(29) Becerra-Toledo, A.; Enterkin, J.; Kienzle, D.; Marks, L. Surf. Sci.2012, 606, 791−802.(30) Zhu, G.-z.; Radtke, G.; Botton, G. A. Nature 2012, 490, 384−387.(31) Wu, C.; Kruska, K.; Castell, M. R. Surf. Sci. 2013, 618, 94−100.
Journal of the American Chemical Society Article
DOI: 10.1021/ja511332yJ. Am. Chem. Soc. 2015, 137, 2939−2947
2946

(32) Gerhold, S.; Wang, Z.; Schmid, M.; Diebold, U. Surf. Sci. 2014,621, L1−L4.(33) Heifets, E.; Piskunov, S.; Kotomin, E. A.; Zhukovskii, Y. F.; Ellis,D. E. Phys. Rev. B 2007, 75, 115417−1−13.(34) Herger, R.; Willmott, P.; Bunk, O.; Schleptz, C.; Patterson, B.;Delley, B. Phys. Rev. Lett. 2007, 98, 076102.(35) Herger, R.; Willmott, P.; Bunk, O.; Schleptz, C.; Patterson, B.;Delley, B.; Shneerson, V.; Lyman, P.; Saldin, D. Phys. Rev. B 2007, 76,195435.(36) Matsuda, T.; Yoshida, Y.; Mitsuhara, K.; Kido, Y. J. Chem. Phys.2013, 138, 244705.(37) Rieger, P. H. Electrochemistry; 2nd ed.; Chapman & Hall: NewYork,1994.(38) Lin, Y.; Wen, J.; Hu, L.; McCarthy, J. A.; Wang, S.;Poeppelmeier, K. R.; Marks, L. D. Micron 2015, 68, 152−157.(39) Nørskov, J. K.; Rossmeisl, J.; Logadottir, A.; Lindqvist, L.;Kitchin, J. R.; Bligaard, T.; Jonsson, H. J. Phys. Chem. B 2004, 108,17886−17892.(40) Rossmeisl, J.; Logadottir, A.; Nørskov, J. K. Chem. Phys. 2005,319, 178−184.(41) Rossmeisl, J.; Nørskov, J. K.; Taylor, C. D.; Janik, M. J.;Neurock, M. J. Phys. Chem. B 2006, 110, 21833−21839.(42) Rossmeisl, J.; Dimitrievski, K.; Siegbahn, P.; Nørskov, J. K. J.Phys. Chem. C 2007, 111, 18821−18823.(43) Rossmeisl, J.; Qu, Z. W.; Zhu, H.; Kroes, G. J.; Nørskov, J. K. J.Electroanal. Chem. 2007, 607, 83−89.(44) Valdes, A.; Qu, Z.-W.; Kroes, G.-J.; Rossmeisl, J.; Nørskov, J. K.J. Phys. Chem. C 2008, 112, 9872−9879.(45) Man, I. C.; Su, H.-Y.; Calle-Vallejo, F.; Hansen, H. A.; Martínez,J. I.; Inoglu, N. G.; Kitchin, J.; Jaramillo, T. F.; Nørskov, J. K.;Rossmeisl, J. ChemCatChem 2011, 3, 1159−1165.(46) Bockris, J. O.; Otagawa, T. J. Electrochem. Soc. 1984, 131, 290−302.(47) Matsumoto, Y.; Sato, E. Mater. Chem. Phys. 1986, 14, 397−426.(48) Vojvodic, A.; Nørskov, J. K. Science 2011, 334, 1355−1356.(49) Koper, M. T. M. J. Electroanal. Chem. 2011, 660, 254−260.(50) Evarestov, R.; Bandura, A.; Alexandrov, V. Surf. Sci. 2007, 601,18441856.(51) Baniecki, J. D.; Ishii, M.; Kurihara, K.; Yamanaka, K.; Yano, T.;Shinozaki, K.; Imada, T.; Kobayashi, Y. J. Appl. Phys. 2009, 106,054109.(52) Guhl, H.; Miller, W.; Reuter, K. Phys. Rev. B 2010, 81, 155455.(53) Hussain, H.; Torrelles, X.; Rajput, P.; Nicotra, M.; Thornton,G.; Zegenhagen, J. J. Phys. Chem. C 2014, 118, 10980−10988.(54) Wang, Z.; Hao, X.; Gerhold, S.; Novotny, Z.; Franchini, C.;McDermott, E.; Schulte, K.; Schmid, M.; Diebold, U. Phys. Chem. C2013, 117, 26060−26069.(55) Li, W.; Liu, S.; Wang, S.; Guo, Q.; Guo, J. J. Phys. Chem. C 2014,118, 2469−2474.(56) Enterkin, J. A.; Subramanian, A. K.; Russell, B. C.; Castell, M. R.;Poeppelmeier, K. R.; Marks, L. D. Nat. Mater. 2010, 9, 245.(57) Cramer, C.; Tolman, W.; Theopold, K.; Rheingold, A. Proc.Natl. Acad. Sci. U. S. A 2003, 100, 3635−3640.(58) NIST Chemistry WebBook; http://webbook.nist.gov/chemistry/.(59) Doornkamp, C.; Ponec, V. J. Mol. Catal. A: Chem. 2000, 162,19−32.(60) Ferreira, K. N.; Iverson, T. M.; Maghiaoui, K.; Barber, j.; Iwata,S. Science 2004, 303, 1831−1838.(61) Umena, Y.; Kawakami, K.; Shen, J.-R.; Kamiya, N. Nature 2011,473, 55−60.(62) Dau, H.; Limberg, C.; Reier, T.; Risch, M.; Roggan, S.; Strasser,P. ChemCatChem 2010, 2, 724−761.(63) Barber, J. Chem. Soc. Rev. 2009, 38, 185−196.(64) Liu, F.; Concepcion, J. J.; Jurss, J. W.; Cardolaccia, T.;Templeton, J. L.; Meyer, T. J. Inorg. Chem. 2008, 47, 1727−1752.(65) Lopez, I.; Ertem, M. Z.; Maji, S.; Benet-Buchholz, J.; Keidel, A.;Kuhlmann, U.; Hildebrandt, P.; Cramer, C. J.; Batista, V. S.; Llobet, A.Angew. Chem., Int. Ed. 2014, 53, 205−209.
(66) Kawasaki, M.; Takahashi, K.; Maeda, T.; Tsuchiya, R.;Shinohara, M.; Ishiyama, O.; Yonezawa, T.; Yoshimoto, M.;Koinuma, H. Science 1994, 266, 1540−1542.(67) Perdew, J. P.; Burke, K.; Ernzerhof, M. Phys. Rev. Lett. 1996, 77,3865−8.(68) Giannozzi, P.; et al. J. Phys.: Condens. Matter 2009, 21, 395502−20.(69) Cococcioni, M.; de Gironcoli, S. Phys. Rev. B 2005, 71, 035105−1−16.(70) Rappe, A. M.; Rabe, K. M.; Kaxiras, E.; Joannopoulos, J. D. Phys.Rev. B 1990, 41, 1227−30.(71) Ramer, N. J.; Rappe, A. M. Phys. Rev. B 1999, 59, 12471−8.(72) Grinberg, I.; Ramer, N. J.; Rappe, A. M. Phys. Rev. B 2001, 63,201102(R)-1−4.(73) Opium - pseudopotential generation project; http://opium.sourceforge.net.(74) Bengtsson, L. Phys. Rev. B 1999, 59, 12301−4.(75) Monkhorst, H. J.; Pack, J. D. Phys. Rev. B 1976, 13, 5188−5192.(76) Bockris, J. O. J. Chem. Phys. 1956, 24, 817−827.(77) Momma, K.; Izumi, F. J. Appl. Crystallogr. 2008, 41, 653−658.
Journal of the American Chemical Society Article
DOI: 10.1021/ja511332yJ. Am. Chem. Soc. 2015, 137, 2939−2947
2947