syngenta 2015 half year results - media presentation
TRANSCRIPT

Basel July 23, 2015
2015 First half results and strategy outlook

2
Safe harbor
This document contains forward-looking statements, which can be identified by terminology
such as ‘expect’, ‘would’, ‘will’, ‘potential’, ‘plans’, ‘prospects’, ‘estimated’, ‘aiming’, ‘on track’
and similar expressions. Such statements may be subject to risks and uncertainties that could
cause the actual results to differ materially from these statements. We refer you to Syngenta's
publicly available filings with the U.S. Securities and Exchange Commission for information
about these and other risks and uncertainties. Syngenta assumes no obligation to update
forward-looking statements to reflect actual results, changed assumptions or other factors.
This document does not constitute, or form part of, any offer or invitation to sell or issue, or
any solicitation of any offer, to purchase or subscribe for any ordinary shares in Syngenta AG,
or Syngenta ADSs, nor shall it form the basis of, or be relied on in connection with, any
contract there for.

2015 First half results
Mike Mack Chief Executive Officer

4
FIRST HALF 2015 OVERVIEW: INTEGRATED BUSINESS
* At constant exchange rates
Low crop prices and
currency volatility
EBITDA margin up
~140bps to 26.2%
Currency well managed:
CIS depreciation entirely
offset through price
First delivery of AOL savings:
full year target firmly on track
Focus on profitability
across the business
Q2 sales 7%*: growth in all regions H1 sales 3%*
2015 First half results
John Ramsay Chief Financial Officer

6
FIRST HALF 2015 FINANCIAL HIGHLIGHTS STRONG EBITDA MARGIN GROWTH
* At constant exchange rates
** Fully diluted basis, excluding restructuring and impairment
Currency movements reduced
sales by >$1bn: impact on
earnings well managed
EBITDA 5% lower at $2.0bn
Reported margin 26.2%
(H1 2014: 24.8%)
CER margin 29.2%, up >400bps
Net income $1.2bn
EPS**: $14.70
(H1 2014: 15.60)
FCF in line with prior year
Group sales:
$7.6bn 10%
3% CER* Volume -3% / Price +6%

7
EBITDA: SIGNIFICANT MARGIN IMPROVEMENT
* Excluding glyphosate pass through
Excluding restructuring and impairment
1st half
2014
Savings 1st half
2015
Cost
inflation
Price*,
volume, mix
Currency COGS*
Other 1st half 2015
at CER
$m
1'500
1'750
2'000
2'250
2'500
2'750
3'000
2,111
437
30
2,000
(85)
(34) (563)
104
2,563
29.2%
26.2%
24.8%

8
CROP PROTECTION PORTFOLIO: FIRST HALF SALES UP 4 PERCENT
Excludes ‘Other’ (2015: $53m). Growth at constant exchange rates
Selective herbicides +14%: strong growth
in EAME, LATAM and USA offset dry
weather in Canada, lower APAC sales
Non-selective herbicides -31%:
TOUCHDOWN® volume reductions,
GRAMOXONE® phase-out in China
Fungicides +13%: broad-based growth,
supported by new SDHI product SEGURIS®
Insecticides +2%: Low pest pressure in
LATAM, strong DURIVO® growth in other
regions
Seedcare -4%: good performance in
EAME, Asia Pacific, offset by high channel
inventory in Canada
0
2
4
6
2010 2011 2012 2013 2014 2015
1st half reported sales $bn
2010 to 2015 CAGR: 7%

9
CROP PROTECTION: NEW PRODUCTS
Growth at constant exchange rates
Emerging market
sales >3x
Broad-based
growth ex Canada
Pilot offer for sugar beet
cyst nematode in the USA
Strong sales momentum; US
approval expected 2015
Launch in China
planned for Q3 2015
Successful launch in USA:
addresses weed resistance
challenges 0
100
200
300
2011 2012 2013 2014 2015
Sales $m
1st half sales up 49% YoY

10
SEEDS PORTFOLIO: FIRST HALF SALES UP 1 PERCENT
Corn and soybean -6%
Reduced corn acreage in the Americas and EAME
Higher US royalty income, significant
price increases in CIS
Diverse field crops +14%
Sunflower: substantial price gains in Europe
Acreage reduction in sugar beet
Vegetables unchanged
Value capture from high quality hybrids
1st half reported sales
$bn
0
1
2
2010 2011 2012 2013 2014 2015
2010 to 2015 CAGR: 6%
Excludes 2012 Pioneer royalty income $256 million
Growth at constant exchange rates

11
CURRENCY MOVEMENTS: IMPACT CONCENTRATED IN FIRST HALF
* Sales-weighted basket of emerging market currencies excl. BRL, UAH, RUB
Less currency volatility in Q2
Price increases offset ~75% of
emerging market currency depreciation
Full year EBITDA currency impact ex
CIS ~$130m of which ~$100m in first half
EUR, CHF, GBP:
EBITDA protection through hedging
End quarter % change vs. dollar (2015 end month % change vs. dollar)
Indexed to December 31, 2012
-80
-60
-40
-20
0
20
CHF
EUR
RUB
BRL
UAH
GBP
Emerging
Markets*
2014 2015 2013
Russian ruble Brazilian real Ukrainian hryvnia

12
MARGIN IMPROVEMENT SUPPORTED BY AOL
* Includes existing program savings: $75 million in 2015
** Includes AOL and prior programs. Excludes integration related expenditures
Contribution comprises ~60% cost
savings and ~40% leverage
2015: total restructuring and impairment**
Pre-tax charge: ~$300m
Cash outflow: ~$280m
Proportion of savings versus leverage
increased during period of low growth
2015: margin contribution of $265m on track
2016 plans already well advanced
EBITDA contribution
Annual cash outflows
$m
~265*
230
300
200 120
~475
~730
~1,000
~1% ~3% ~4% ~5%
2015 2016 2017 2018
EBITDA margin contribution
Working capital release
R&D Global operations Commercial

13
2015 SECOND HALF OUTLOOK
As reported
2nd half EBITDA as % of FY
0
20
2008 2009 2010 2011 2012 2013 2014
FY sales at constant exchange rates and
reported EBITDA around 2014 level
Substantial free cash flow generation
Majority of 2015 AOL savings to be realized
in H2
2016 benefit ~$125m
H2 currency impact slightly adverse
Positive oil effect ~$50m
Non-recurrence of 2014 pension benefit
more than offset

2015 First half results
Jon Parr Chief Operating Officer

15
REGIONAL PERFORMANCE: EAME, LATIN AMERICA
Operating income and margin exclude restructuring and impairment
Europe, Africa and Middle East North America
Sales Operating income Operating margin
0
1
2
3
4
2014 2015
1st half, $bn
38.9% 40.2%
Volume growth in Crop Protection despite lower
crop prices, dry weather
Seeds volumes impacted by acreage, CIS price increases
Strong performance in high margin Seedcare
Latin America
0
1
2
2014 2015
1st half, $bn
17.4% 22.7%
Change in contractual terms to simplify operations
while maintaining credit control
Underlying performance affected by low pest pressure,
reduced corn acreage
Glyphosate reduction benefiting margin

16
EAME: CIS MITIGATING VOLATILITY
*Sales-weighted basket of emerging market currencies excl. BRL, UAH, RUB
End quarter % change vs. dollar (2015 end month % change vs. dollar)
Indexed to December 31, 2012
-80
-60
-40
-20
0
20
CHF
EUR
RUB
BRL
UAH
GBP
Emerging
Markets*
2014 2015 2013
Russian ruble Brazilian real Ukrainian hryvnia
Dollarization and bold pricing strategy
fully compensated negative currency
variation
Prudent and rigorous approach to credit
management adopted
2015 began in an environment of extreme
geopolitical and economic uncertainty
AOL implementation helped to optimize
cost management across CIS business
CIS highlights ability to manage
business through ongoing volatility

17
RECENT AI LAUNCHES: PEAK SALES POTENTIAL >$2.7BN $640M SALES REALIZED IN 2014
Cereals
and DFC Corn Rice Soybean
Vegetables
and Specialty
Peak
sales
Year of
peak sales
Solatenol™ 2017
2016/17
2015
2016
2018
2015
2015
>$400m
~$500m
>$200m
~$1,000m
>$150m
>$500m
2018
2020
2020
2018
2020
2018
2020
Already launched Years: expected launch
Share of patent protected sales increasing from 30% in 2013 to ~40% in 2015

2015 First half results
Davor Pisk Chief Operating Officer

19
REGIONAL PERFORMANCE: APAC NORTH AMERICA
Asia Pacific
2014 2015
1st half, $bn
28.0% 31.2%
Paraquat phased out in China
New product introductions with higher margins
Strong performance in South Asia
Operating income and margin exclude restructuring and impairment
1
0
North America
0
1
2
3
2014 2015
1st half, $bn
29.2% 33.1%
Increased licensing income
Channel de-stocking in Canada Seedcare
Strong selective herbicides growth underpinned
by ACURONTM
launch

20
ACURON™: OUTPERFORMING COMPETITOR SOLUTIONS IN CORN
>150 herbicide trials with universities
across 35 US states
Outperforms current leading herbicide
solutions
Provides 4 active ingredients and 3
different modes of action to help growers
manage weed resistance
Complements Early Season Weed
Management approach
2015 full year sales >$100m
0
10
20
30
40
50
60
70
80
90
100
Co
ntr
ol
(%)
Competitor products
Giant ragweed 28 days after
pre-emergence application

21
SEEDS: LEADING INNOVATOR IN TRAIT TECHNOLOGY
Complete independent corn trait platform
Comprehensive insect control including Refuge In a Bag
MIR604: Pioneer enabled for dual CRW control in USA
MIR162 licensed to Monsanto, DuPont Pioneer, Dow: most
efficacious broad lep trait, leading in fall armyworm control in Brazil
-
200
400
600
800
1'000
2010 2011 2012 2013 2014 2015 2016 2017 2018 2019 2020
$m
2.5X
Corn trait revenue and royalty income – cash basis
Traits
Revenue stream to double in next 5 years
following China approval of MIR162
GLG licensees
Direct licensees
Access to market
Access
independent seed
companies
Direct licensing to
other majors Branded business
enablement
SYT Brands
Strategy outlook
Mike Mack Chief Executive Officer

23
SYNGENTA’S FUNDAMENTALS ARE ATTRACTIVE AND THE BUSINESS OUTLOOK REMAINS STRONG
Strong financial
outlook
Large and growing
agricultural market
increasingly driven by
Crop Protection
Syngenta is uniquely
positioned: broad
portfolio and
geographic reach
New product
launches driving
market share gains
Strategic value of Crop
Protection pipeline &
leading innovation in
Seeds
Significant scope for
margin expansion
through Seeds
portfolio and AOL

24
OUR PROOF POINTS
Uniquely positioned
Attractive market fundamentals
Strong financial outlook
New product launches driving market share gains
Strategic value of Crop Protection pipeline
& Innovation in Seeds
Significant margin expansion
$103bn Crop Protection and Seeds market;
strong medium and long-term growth prospects
Broad portfolio and geographic reach:
>50% of sales in emerging markets
Recent launches have peak sales
potential of >$2.7bn
>$3.6bn additional peak sales
potential from pipeline products
24-26% EBITDA margin in 2018,
$25bn sales after 2020
Seeds gross margin >50% in 2018;
AOL program on track
25
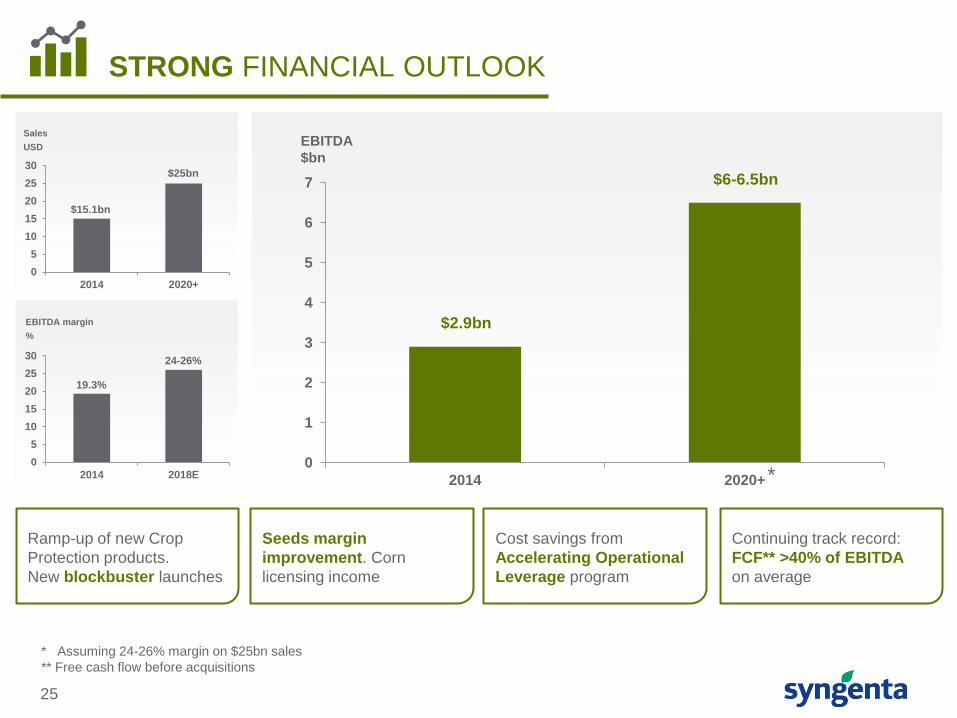
STRONG FINANCIAL OUTLOOK
0
1
2
3
4
5
6
7
2014 2020+*
$2.9bn
$6-6.5bn
EBITDA
$bn
Ramp-up of new Crop
Protection products.
New blockbuster launches
Seeds margin
improvement. Corn
licensing income
Cost savings from
Accelerating Operational
Leverage program
Continuing track record:
FCF** >40% of EBITDA
on average
* Assuming 24-26% margin on $25bn sales
** Free cash flow before acquisitions
Sales
USD
0
5
10
15
20
25
30
2014 2020+
$15.1bn
$25bn
EBITDA margin
%
0
5
10
15
20
25
30
2014 2018E
19.3%
24-26%

26
LARGE AND GROWING AGRICULTURAL MARKET DRIVEN BY CROP PROTECTION
Source: Phillips McDougall. Excluding public seeds
Market size
$bn
0
20
40
60
2001 2002 2003 2004 2005 2006 2007 2008 2009 2010 2011 2012 2013 2014
Th
ou
sa
nd
s
18%
22%
10%
7%
5%
6%
Conventional Seeds GM Seeds 3 year CAGR Crop Protection X%
>$63 billion Crop Protection market
with robust outlook:
Innovation, resistance management
Adoption, intensification
>$40 billion GM and conventional
seeds market:
GM market growth slowing
Recent record levels of production
temporarily driving down commodity prices
Strong medium and long
term growth prospects

27
GM PENETRATION REACHING SATURATION LEVELS
GM penetration rate
USA
Brazil
Argentina
India
Source: ISAAA, Syngenta
Soybean Corn Cotton Canola
94%
93%
100%
93%
82%
80%
96%
66%
100%
95%
94%
Not grown Not grown Not grown
Not grown
Not grown
GM restricted in major markets
Europe Japan Russia Australia

28
SYNGENTA BEST POSITIONED TO ADDRESS EMERGING MARKET OPPORTUNITY
EAME
APAC LATAM
Land
1.6 bn
hectares
Land distribution 2012
CORN
WHEAT
RICE
9t/ha
4t/ha
7t/ha
3t/ha
8t/ha
4t/ha
Emerging market
productivity gap 2012 Two thirds of world’s agricultural land
in emerging markets
Of critical importance for global food security
Additional available land almost
all in emerging markets
Significant yield gaps vs. developed markets
Technology adoption, intensification
Syngenta: unrivalled presence with
>50% of sales in emerging markets
Broad portfolio and tailored offers:
Asia-Pacific: rice, vegetables
Eastern Europe: cereals, sunflower
Latin America: soybean, specialty, sugar cane
2014 Syngenta sales by region
Syngenta track record
in emerging markets
North America
Developed Europe
Emerging Europe
Latin America
Emerging Asia
Developed Asia
0
3
6
9+12%
CAGR
France
Russia
Germany
India
USA
Bangladesh

29
INNOVATION: NEW LAUNCHES* AND LIFECYCLE MANAGEMENT
* Launch defined as new Syngenta products (incl. formulations)
marketed in specific countries
2008 – 2014
Average 1 new AI per year
Focus on blockbuster opportunities
Formulation
and lifecycle
management
excellence
~600 New product
launches per year
Crop Protection
market share 2005 2014
18% 20%
18% 18%
13% 13%
9% 10%
9% 9%
7% 7%
26% 23% Others
Source: Phillips McDougall. Excluding professional products

30
NEW CROP PROTECTION PIPELINE: PEAK SALES >$3.6BN
New blockbusters in large markets
Pydiflumetofen Fungicide Cereals, soybean, vegetables, specialty Stage 3 2016/17 >$750m
Lead 1 Insecticide Multiple crops Stage 2 2021 >$550m
Lead 2 Herbicide Corn Stage 1 (late) 2022 >$600m
Lead 3 Fungicide Cereals, soybean Stage 1 (late) 2022 >$600m
Product Indication Crops Status
Launch
year
Peak
sales
Large products in smaller segments
Fungicide Vegetables, specialty Stage 3 2016 >$150m
Lead 4 Insecticide Vegetables, specialty Stage 3 2020 >$250m
Lead 5 Seedcare Cereals, corn, soybean Stage 1 (late) 2021 >$200m
Lead 6 Seedcare Multiple crops Stage 1 (late) 2022 >$400m
Lead 7 Seedcare Multiple crops Stage 1 (late) 2022 >$100m
Product Indication Crops Status
Launch
year
Peak
sales
Stage 1 = invention, optimization Stage 2 = evaluation Stage 3 = development and launch

31
FUTURE OPPORTUNITY FOR TECHNIFICATION IN CEREALS
Hybrid barley yield benefits
with optimized protocol
* Not yet registered
Solatenol™*
9.1
9.8
10.7
9.7
8
8.5
9
9.5
10
10.5
11
Inbred Hybrid Hybrid Inbred
0.7
1.0
Ba
rley y
ield
t/h
a
Conventional program Hybrid program
First to develop hybrid barley at scale
Sales reach $100m in first 5 years
Strong pull-through of CP sales
Unique capability set established
Proven science
Peak integrated sales potential of $500m
Production expertise, grower network established
Agronomic advice, marketing solutions

32
HYBRID WHEAT: GAME-CHANGING NON-GM TECHNOLOGY WITH PEAK SALES POTENTIAL >$3BN
Wheat area opportunity (in Mha)
Strongest germplasm in the industry,
leading expertise
Hybrids broadly adapted to high
value areas
Yield performance of hybrids
Robustness of sterility system
Seed production capability
R&D production and commercial
partnerships
Technical proof of concept achieved
in 2014 Total area for hybrid
wheat = 220Mha
Addressable area for
Syngenta hybrids
Syngenta hybrid
sales
$bn
20
40
62
82 82 82 82
0
1
2
3
0
50
100
150
2020 2022 2024 2026 2028 2030 2032
2019 2020 2021 2022 2023 2024 2025
US France,
US
India Canada UK,
Germany Poland,
Germany
CIS
Hybrid wheat launch plan

33
SEEDS: BUSINESS SEGMENTATION TO DRIVE PROFITABILITY
Seeds Segmentation Portfolio Management
Maximizing high
margin businesses
GM traits
Sunflower / Oilseed rape
Vegetables
Long term industry
leading investments
Hybrid barley success
Leading wheat germplasm and expertise
Strong rice platform
Driving profitability
improvement
Corn seeds
Sugar beet
Soybean
AOL potential
Critical for chemical
pull through
Business model
Explore JV options
or divestment

34
World leader in the growing
Crop Protection market
Number 3 in Seeds:
realizing value from leading trait technology
Four years experience of integration:
strategy gaining traction
Targeting global market share gain, improved
profitability in seeds
New and pipeline CP products:
peak sales >$6bn, GP margin >50%
Set to deliver leading innovation and high
returns
SYNGENTA: FIRM FUNDAMENTALS AND STRONG BUSINESS OUTLOOK

Discussion

36