synthesis of scleroglucan-smectite composite based on ... · construction, ingénierie et...
TRANSCRIPT
Synthesis of scleroglucan-smectite
composite based on Porto Santo bentonite
Liva Dzene
Thesis submitted to the
Faculty of Graduate and Postdoctoral Studies
in partial fulfillment of the requirements
for the MSc degree in Chemistry
Department of Chemistry
Faculty of Science
University of Ottawa
© Liva Dzene, Ottawa, Canada, 2014

ii
Acknowledgments
My acknowledgments to the University of Ottawa members: Rola Mansa, who was
always ready to help and to explain, as well as to review my work, Gustave Kenne Dedzo,
who engaged me in the discussions about science and life, and finally the professor Christian
Detellier, who guided my way through this research project.
I would like to thank the staff in the University of Aveiro: the researcher Ana Carina
Tavares Quintela dos Santos and Cristiana Costa for introducing with laboratory equipment
and procedures as well as answering thousands of questions, Denise Lara Gomes de Faria
Terroso and Maria Cristina de Estrela Sequeira for the lab support, the professor Fernando
Joaquim Fernandes Tavares Rocha for important explanations to better understanding of clays.
I would like to express my gratitude also to Patricia Patrier and Sophie Levesque, as
well the entire IMACS team and the European Commission for creating and maintaining this
amazing international masters entirely devoted to the clay science.
Finally, my deepest thankfulness to my family and Aniello Apuzzo, who encouraged
me and walked along this journey.

iii
Abstract
In this thesis, a smectite rich bentonite ore deposit was found on Porto Santo Island
(Portugal) and applied to prepare clay-biopolymer nanocomposite material. The highest
content of clay fraction (89%) was found in the deposit near Capela Nossa Senhora Graça
(33.0711 N, 16.3241 W). This sample is mainly composed of Fe rich smectite, having also
feldspar, calcite and magnetite-maghemite minerals. The cation exchange capacity was
determined to be 73 meq/100g. This sample has a low abrasion index (89 g/m2) and the highest
plasticity index (250%) compared to other samples from Porto Santo Island. Both
montmorillonite from the clay source repository (SWy-2) and the Porto Santo bentonite were
used for the nanocomposite synthesis. We have chosen an exocellular polysaccharide -
scleroglucan, as biopolymer. It has applications in various industries, where such properties as
biodegradability and biocompatibility are necessary. The X-ray diffraction and transmission
electron microscopy results show that smectite is well dispersed in the scleroglucan matrix
with partial exfoliation. The study of various experimental parameters reveal that pH and prior
biopolymer solution sonification do not have an effect on the composite organization: only the
scleroglucan/clay mineral mass ratios determine the level of the clay sheets’ dispersion in the
polymer matrix. Compared to SWy-2, the Porto Santo bentonite shows a smaller degree of
dispersion within the polymer matrix, but nevertheless its potential outstanding mechanical
properties could be of interest for further studies. The vast application areas of scleroglucan in
the food industry, cosmetics, construction, engineering, and medicine indicate the need to
elaborate on the knowledge of its interaction with clay minerals and highlight the advantages
that such novel biodegradable and biocompatible nanomaterials can introduce.

iv
Résumé
Dans cette thèse un gisement de bentonite smectique a été caractérisé sur l'île de Porto
Santo (Portugal) afin d’utiliser la smectite pour la préparation d’un matériau nano-composite
avec un biopolymère. Le dépôt avec la fraction argileuse la plus élevée (89%) a été trouvé près
de la Capela Nossa Senhora Graça (33,0711 N, 16,3241 W). L’échantillon est principalement
composé de smectite riche en fer, mais aussi de feldspath, calcite et magnétite - maghémite.
La capacité d'échange cationique a été déterminée à 73 meq/100g. L’échantillon a un faible
indice d'abrasion (89 g/m2) et un indice de plasticité élevé (250%) par rapport aux autres
échantillons de l'île de Porto Santo. Pour la synthèse de nanocomposite, deux minéraux
argileux ont été utilisés: la montmorillonite, provenant de la source de dépôt de l’argile (SWy-
2) et la bentonite de Porto Santo. Le biopolymère choisi est un polysaccharide exocellulaire -
scléroglucane. Son utilisation est répandue dans divers secteurs, et dans lesquels des propriétés
telles que la biodégradabilité et la biocompatibilité sont nécessaires. Les résultats de la
diffraction des rayons X et de la microscopie de transmission d'électrons montrent que la
smectite est bien dispersée dans la matrice de scléroglucane avec une exfoliation partielle.
L'étude des différents paramètres expérimentaux révèle que le pH et la sonification de la
solution de biopolymère n'ont pas d'effet sur l'organisation de composite: seul le rapport de
masse de scléroglucane par rapport à l’argile détermine le niveau de la dispersion des feuillets
de l'argile dans la matrice de polymère. La bentonite Porto Santo montre un degré de dispersion
moins élevé dans la matrice de polymère par rapport à SWy - 2, mais néanmoins ses propriétés
mécaniques exceptionnelles pourraient être intéressantes pour des études ultérieures. Les
domaines d'application de scléroglucane sont vastes: industrie alimentaire, cosmétiques,
construction, ingénierie et médecine… et indiquent la nécessité d'élargir les connaissances de
son interaction avec les minéraux argileux et de mettre en évidence les avantages que ces
nouveaux nanomatériaux biocompatibles et biodégradables peuvent introduire.
v
Table of Contents
Acknowledgments ......................................................................................................... ii
Abstract ........................................................................................................................ iii
Résumé ......................................................................................................................... iv
Table of Contents .......................................................................................................... v
List of Figures ............................................................................................................. vii
List of Tables .............................................................................................................. xiii
Abbreviations ............................................................................................................. xiv
Introduction ................................................................................................................... 1
1. Theoretical Aspects of Biopolymer-clay Nanocomposites ....................................... 3
1.1. Clays and clay minerals .............................................................................. 3
1.2. Polymer - clay nanocomposites .................................................................. 6
1.3. Biopolymer - clay nanocomposites .......................................................... 17
1.4. Conclusion ................................................................................................ 26
2. Principles of Main Characterization Techniques .................................................... 27
2.1. X-ray diffraction ....................................................................................... 27
2.2. X-ray fluorescence .................................................................................... 30
2.3. Transmission Electron Microscopy .......................................................... 31
2.4. Nuclear magnetic resonance spectroscopy ............................................... 33
2.5. Thermogravimetric analysis ..................................................................... 36
2.6. Infrared spectroscopy ............................................................................... 37
2.7. Cation exchange capacity ......................................................................... 39
2.8. Mechanical tests ....................................................................................... 39

vi
2.8.1. Plasticity ................................................................................................. 40
2.8.2. Abrasion ................................................................................................. 41
3. Characterization of Porto Santo Bentonite .............................................................. 43
3.1. General Characterization of Porto Santo Island and a fieldtrip ............... 43
3.2. Experimental procedures .......................................................................... 47
3.3. Results of the Porto Santo bentonite characterization .............................. 50
3.4. Conclusion ................................................................................................ 61
4. Synthesis of Scleroglucan – Smectite Composite ................................................... 62
4.1. Experimental setup for composite synthesis ............................................ 62
4.2. Results of scleroglucan – clay composite synthesis ................................. 68
4.3. Conclusion ................................................................................................ 89
General Conclusion ..................................................................................................... 90
References ................................................................................................................... 91
Appendix ................................................................................................................... 105

vii
List of Figures
Figure 1. Top: an octahedron (A) and an octahedral sheet (B), where single octahedrons share
an edge. Bottom: a silicon tetrahedron (A) and a tetrahedral sheet, where single
tetrahedrons share a corner (Grim, 1968). ................................................................ 4
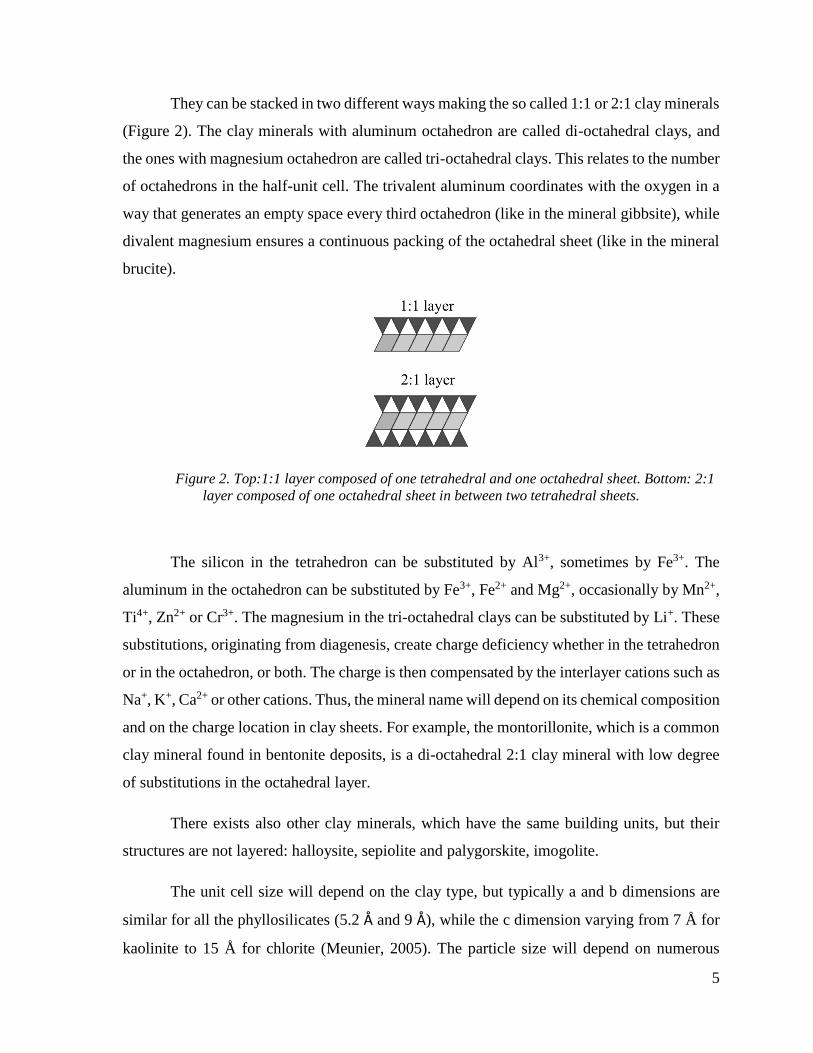
Figure 2. Top:1:1 layer composed of one tetrahedral and one octahedral sheet. Bottom: 2:1
layer composed of one octahedral sheet in between two tetrahedral sheets. ............ 5
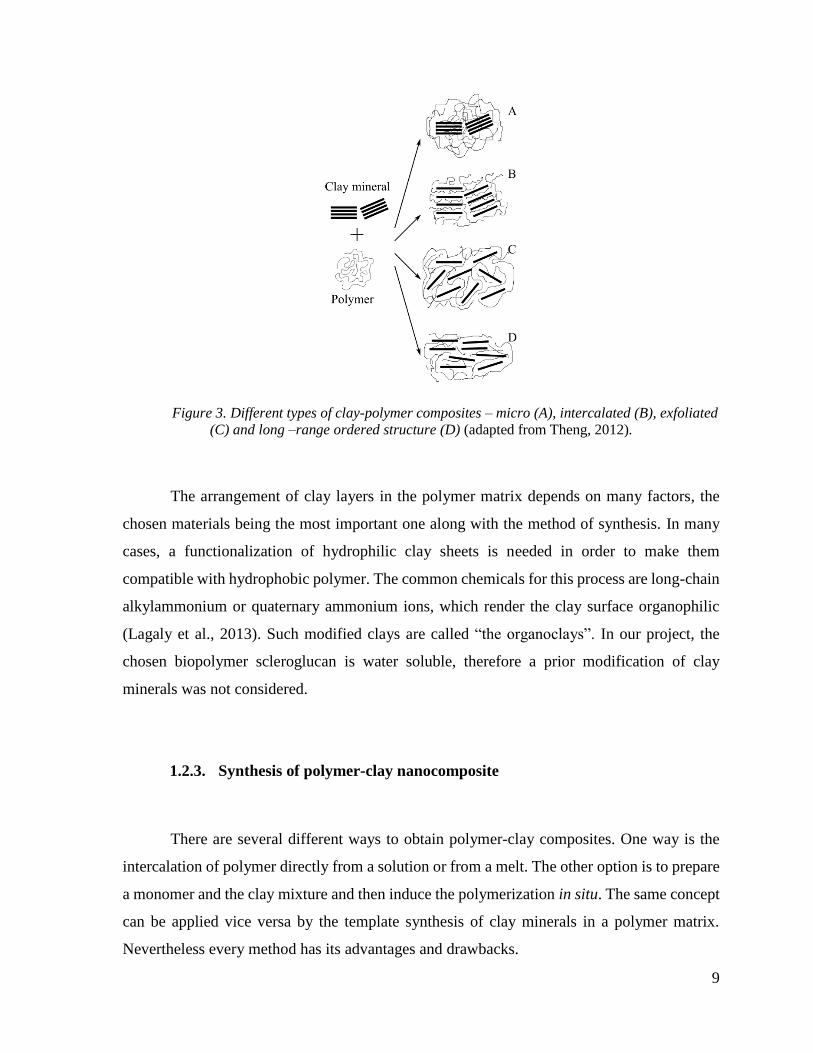
Figure 3. Different types of clay-polymer composites – micro (A), intercalated (B), exfoliated
(C) and long –range ordered structure (D) (adapted from Theng, 2012). ................ 9
Figure 4. Flowchart of direct intercalation from solution processing technique (adapted from
Zeng et al., 2005). The clay is swollen in the solvent in which the polymer is soluble.
Afterwards the polymer is added and the intercalation process takes place. The
solvent is removed through evaporation. ................................................................ 10
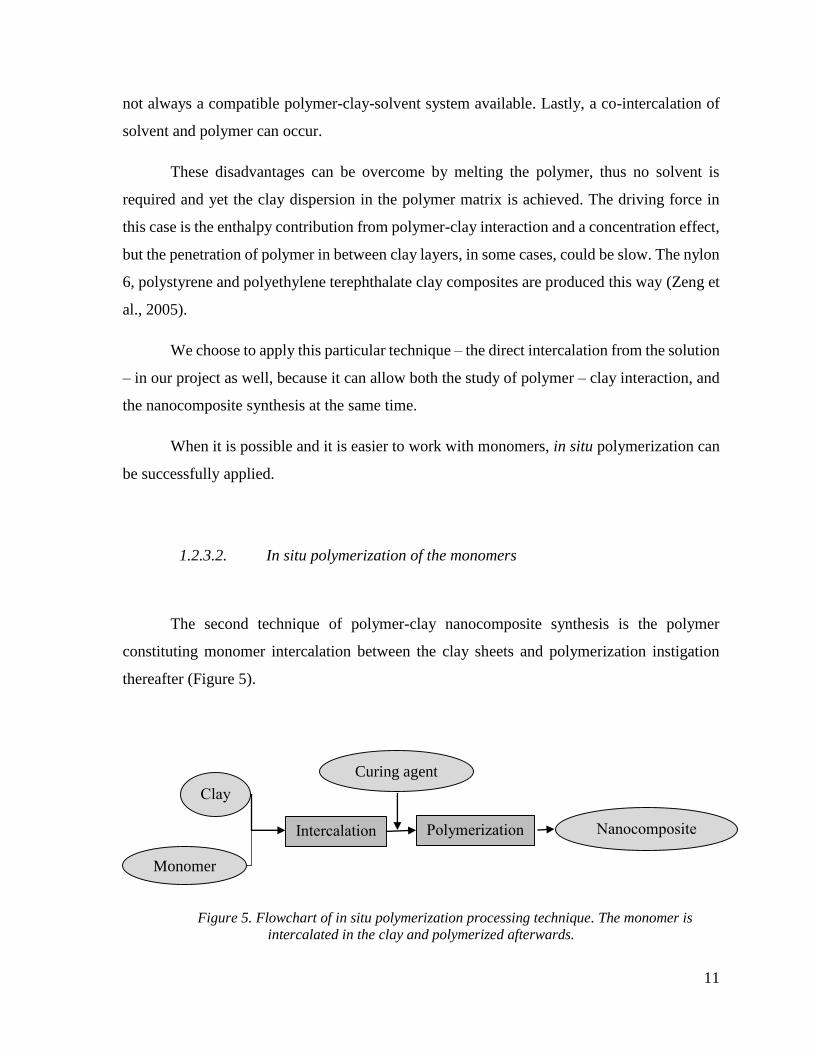
Figure 5. Flowchart of in situ polymerization processing technique. The monomer is
intercalated in the clay and polymerized afterwards. ............................................. 11
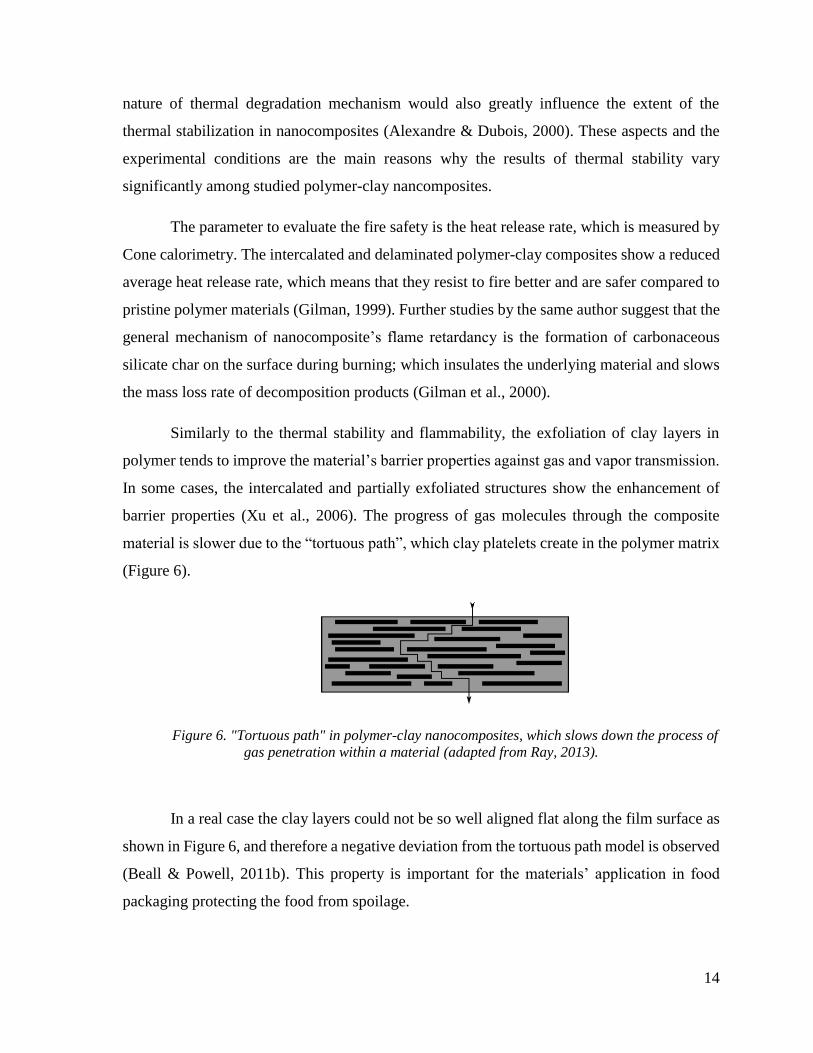
Figure 6. "Tortuous path" in polymer-clay nanocomposites, which slows down the process of
gas penetration within a material (adapted from Ray, 2013). ................................ 14
Figure 7. The structure of scleroglucan in which the repeating unit is composed of three β (1-
3) linked glucose units having β (1-6) linked glucose unit on every third linear
glucose. ................................................................................................................... 18
Figure 8. Structure of amino acid (left), which has two characteristic functional groups, -NH2
and –COOH, and the structure of protein (right), which is composed of the
combination of various amino acids and has primary, secondary, tertiary and
quaternary structure. ............................................................................................... 20
Figure 9. Polysaccharide structure (amylose starch), which is composed of α(1→4) bound
glucose units. .......................................................................................................... 22
Figure 10. Chemical structure of PHAs. R varies from methyl (C1) to tridecyl (C13). ........... 25
Figure 11. Interaction of X-ray with atom planes in a crystal structure. Atoms diffract the X-
ray wave according to the Bragg law. .................................................................... 28
Figure 12. Scheme of an XRD instrument. ............................................................................. 29
viii
Figure 13. Emission of characteristic X-rays (adapted from Amtec Inc.). When an electron
from an upper shell fills an empty space in a lower level, this transition creates
characteristic X-rays. .............................................................................................. 30
Figure 14. XRF instrument principle. ..................................................................................... 31
Figure 15. Electron-matter interaction with a thin sample. The electrons can cross the sample
without being scattered or they scatter with or without energy loss, inelastically or
elastically respectively. ........................................................................................... 32
Figure 16. A scheme of transmission electron microscope (adapted from Ayache et al., 2010).
................................................................................................................................ 33
Figure 17. Spin I=1/2 nucleus in magnetic field is split in two energetic levels (Zeeman
interaction). The energy difference ΔE between these two levels can be expressed
as a Larmor frequency υ. γ is gyromagnetic ratio, ħ=h/2π and Bo is the applied
external magnetic field. .......................................................................................... 34
Figure 18. Schematic representation of the three stages of a simple NMR experiment (adapted
from MacKenzie & Smith, 2002). The sample is placed in a strong magnetic field
(A). Then a short pulse of radio frequency is applied, which shifts the angular
momentum out of its equilibrium (B).Finally, FTIR of free induction decay signal
is recorded (C). ....................................................................................................... 35
Figure 19. Scheme of general TGA apparatus (adapted from Sánchez-Jiménez et al., 2011).
................................................................................................................................ 36
Figure 20. Infrared light interaction with matter. The radiation that matches the energy of a
specific molecular vibration is adsorbed, but the rest of the light is transmitted,
reflected and scattered. ........................................................................................... 38
Figure 21. Attenuated total reflection spectroscopy principle. The incident beam enters the
crystal so that it is totally reflected. Nevertheless the radiation penetrates the first
few microns of the sample, whose refractive index n2 is lower than the crystal
refractive index n1. .................................................................................................. 38
Figure 22. Scheme of Einlehner AT-1000 apparatus (adapted from Klinkenberg et al., 2009).
................................................................................................................................ 42
Figure 23. Location of Madeira archipelago (top) and Porto Santo Island (bottom). (Google
Maps, 2013) ............................................................................................................ 44
ix
Figure 24. Sampling sites on Porto Santo Island. In four of them (I, II, IV and V) we collected
the clay rich samples for this project. The sampling sites I, IV and V are located on
the northern part of the Island, but the site II is in the middle part of the Island. .. 46
Figure 25. General look of sampling site I, Serra de Dentro. Five samples from the different
locations were collected from this deposit. ............................................................ 47
Figure 26. Cylinders used for the sedimentation. ................................................................... 49
Figure 27. Powder XRD pattern of Porto Santo bentonite (sample PSB1). It reveals the
presence of phyllosilicates, feldspars, anatase, calcite and iron rich minerals. ...... 50
Figure 28. Chemical composition of PSB (fraction less than 63 µm).The two samples PSB 6
and PSB 7 differ from other samples with higher content of K2O. ........................ 54
Figure 29. Ratio of exchangeable cations in PSB (fraction less than 63µm). For the majority
of samples the major exchangeable cations are sodium and calcium. Three samples,
PSB1, PSB2 and PSB3 have important amount of magnesium and two samples,
PSB6 and PSB7, have relatively higher amount of potassium. .............................. 57
Figure 30.Cation exchange capacity of PSB (fraction less than 63 µm). Two samples, PSB6
and PSB7, which have mica or illite and kaolinite in their composition exhibit the
lowest CEC. The other samples having smectite type clay minerals in their
composition, show also higher CEC values. .......................................................... 58
Figure 31. Powder XRD of SWy-2 as received from repository showing the presence of quartz
(Q), other peaks belong to Na-montmorillonite. .................................................... 63
Figure 32. Powder XRD of SWy-2 more than 2µm fraction showing other minor impurities
together with quartz like calcite, feldspar and bassanite. ....................................... 64
Figure 33. Powder XRD of purified SWy-2 indicating minor quartz impurity. ..................... 65
Figure 34. Solid state 13C CP-MAS NMR of scleroglucan revealing minor amount of proteins.
The chemical shifts of carbons were attributed according to Jeannin et al. (2000).
................................................................................................................................ 66
Figure 35. A peak shift in XRD patterns from 11.6 to 14.5 Å can be observed comparing
pristine SWy2 and composite (sample 0.5SS13-0-0 after 14 days).This can be
evidence of intercalation. ........................................................................................ 69
Figure 36. Comparison between heated (60˚C, 24h) and air-dried (24h) composite XRD
patterns of 0.5SS13-0-0 sample after 18 days reveal no difference, therefore the d-

x
spacing is not due to the higher hydration degree of montmorillonite in the
composite compared to the pristine clay mineral. .................................................. 70
Figure 37. TGA curve between 20 ˚C and 100 ˚C for sclg and composite shows similar weight
loss of less than 10%. The second important mass loss around 300 ˚C is the
degradation of scleroglucan. ................................................................................... 71
Figure 38. DTG curve of scleroglucan and composite (sample 0.5SS13-0-0 after 36 days)
shows a slight increase of the decomposition temperature from 301 ˚C to 313 ˚C.
The first peaks at 46 ˚C and 53 ˚C indicate the temperature of external water
desorption. .............................................................................................................. 72
Figure 39. TEM images of sclg-mmt composite structure (I, II and IV) compared to pristine
SWy-2 (III). In image I: A - aggregates, B - several layer stack, C - individual clay
layers. In image II separate exfoliated clay layers can be seen. Image IV shows the
dispersion of several intercalated clay layers. ........................................................ 73
Figure 40. Distance between clay layers measured from TEM images for sample 0.5SS13-0-0
after 36 days is from 13 to 16 Å, which could mean that the intercalation of
scleroglucan has occurred. ...................................................................................... 74
Figure 41. A peak shift in XRD patterns from 12.7 to 14.0 Å can be observed comparing
pristine PSB8 and composite (sample 0.5SP13-0-0 after 28 days). It can mean that
a single layer of sclg has been intercalated. ............................................................ 76
Figure 42. Comparison between PSB8 (I) and PSB8-Sclg composite (II) structure, sample
0.5SP13-0-0 after 28 days. The dispersion is not complete, but we can observe
aggregates (A), layer segregation (B) as well as several exfoliated clay layers (C).
................................................................................................................................ 76
Figure 43. TEM image of PSB 8 composite I (sample 0.5SP13-0-0, 28 days) compared to
SWy-2 composite II (sample 0.5SS13-0-0, 36 days). The differences in clay mineral
structure affect the rate of dispersion...................................................................... 77
Figure 44. DTG curve of scleroglucan and composite (sample 0.5SP13-0-0 after 28 days)
shows a decrease of the decomposition temperature from 301 ˚C to 276 ˚C due to
the presence of Fe in PSB8 structure. The first peaks at 53 ˚C and 58 ˚C indicate the
temperature of external water desorption. .............................................................. 78

xi
Figure 45. Solid state 13C CP-MAS NMR of scleroglucan and 0.5SS13-0-0 sample showing
no major changes to the biopolymer structure. For the chemical shift assignments
see Figure 36 in section 4.1.1.2. ............................................................................. 79
Figure 46. Comparison of ATR – FTIR patterns of sclg, SWy-2 and composite 0.5SS13-
36d.The decrease of Al-OH and Si-O peak intensities, at 3606 cm-1 and 972 cm-1
respectively, could indicate a weak interaction or could be due to the small amount
of clay in the composite. All peak assignments are given in Table 10. .................. 80
Figure 47. XRD pattern of sclg and SWy-2 interaction over time for the sample 0.5SS13-0-0.
The equilibrium is established after two weeks, after which the peak position did
not change over the time. The shift of the peak from 11.6 to 13.6 Å during the first
day, could represent the overlapping of both, non-intercalated and intercalated layer
peaks. ...................................................................................................................... 82
Figure 48. XRD pattern of sclg and PSB 8 interaction over time for the sample 0.5SP13-0-0.
The maximum shift of the (001) peak was after three weeks. After this time the d001
value decreased, which could indicate a possible de-intercalation. The weak
intensities of first two week intercalates are due to the different glass slide, which
was used for the film deposition. ............................................................................ 83
Figure 49. XRD pattern of different concentration sclg composite: 1.0SS16 after 1 day and
0.5SS13 after 14 days. A similar shift of the peak approximately compared to 0.5%
sclg concentration can be observed. Such interlayer distance, as we have discussed
before, could mean a single layer of scleroglucan polymer chain intercalation. .... 84
Figure 50. Contact time effect on sclg - SWy-2 composite, when sclg concentration in solution
is 1.0%. With higher sclg concentration an intercalation and possibly partial
exfoliation occurs already during the first day and no further changes in the peak
position are observed for the next days. The slight intensity decrease until day 21
could mean that the dispersion of clay layers in polymer matrix is still increasing as
observed before for 0.5SS13 composite in TEM images. ...................................... 85
Figure 51. XRD pattern of 1.0SP16 sample during 28 days. The peak shift in the case of 1.0%
sclg solution is smaller (13.2 Å) compared to 14.0 Å for 0.5% sclg solution. The
contact time does not affect the peak position. The value of interlayer spacing now
comes to 4 Å, which seems to be too small for the intercalation of a single layer of

xii
scleroglucan. This could mean that incomplete intercalation or layer segregation has
occurred and the contact time was not sufficient for the intercalation to take place.
................................................................................................................................ 86
Figure 52. The relation between clay/sclg ratio and d-spacing. The d001 value for intercalated
composites reaches 14.5 Å after 3 days. The two samples having high amount of
clay over the biopolymer, showed a d001 of 13 Å, a value closer to pristine clay.
After two weeks the tendency was kept, but the sample having a clay-polymer ratio
1:1 did show the increase of d-spacing, which could indicate that the intercalation
has taken place despite the high amount of the clay present. ................................. 87
Figure 53. Various experimental conditions influence on sclg - Swy-2 composite (after 14
days). The d-spacing is similar among samples with various pretreatment having
(001) reflection between 14.0 and 14.6 Å. The peak intensity in this case was
affected by various glass slide supports. It could mean that scleroglucan initial
conformation in water does not seem to affect its interaction with clay minerals
always resulting in single chain polymer intercalate. ............................................. 88
xiii
List of Tables
Table 1. Commercial polymer-clay nanocomposite materials based on montmorillonte
(Carrado & Komadel, 2009). ........................................................................ 15
Table 2. Coordinates of sampling sites on Porto Santo Island. ..................................... 46
Table 3. Mineralogical composition of PSB (fraction less than 63 µm). ...................... 51
Table 4. (001) peak position for the oriented slides of PSB samples (less than 2 µm). 52
Table 5. Minor elements in Porto Santo bentonite (fraction less than 63µm). .............. 55
Table 6. Abrasion index of PSB (fraction less than 63 µm). ......................................... 59
Table 7. Plasticity of PSB (fraction less than 63 µm).................................................... 60
Table 8. Chosen quantities of sclg and clay for the experiment. ................................... 67
Table 9. Material quantities for the second experiment. ............................................... 68
Table 10. ATR – FTIR band position assignment for SWy-2 and sclg. ........................ 80

xiv
Abbreviations
AI abrasion index
AT-IR attenuated total reflection infra-red spectroscopy
CEC cation exchange capacity
EDS energy dispersive X-ray spectroscopy
LL liquid limit
MMT montmorillonite
PI plasticity index
PL plastic limit
PSB Porto Santo bentonite
Sclg scleroglucan
SEM scanning electron microscopy
TGA thermogravimetric analysis
XRD X-ray diffraction
XRF X-ray fluorescence

1
INTRODUCTION
Our world is composed of various types of materials, each of them having their specific
role and importance in the human history. The ages are named after certain material: Stone
Age, Bronze Age and Steel Age. The main classes of materials we know today are wood,
metal, glass, ceramics, concrete and polymers, but not the only ones to mention. There exist
also biomaterials, semiconductors and composite materials. We are surrounded by materials
and they have a direct impact on our daily lives.
In this project we will focus on two materials – clays and polymers. The clay minerals
have been known to civilizations and applied since the beginning, as well as the polymers
existing in nature, e.g., cellulose, silk and natural rubber. The clays nowadays have a wide
variety of applications, but their utilization will depend on the composition and properties of
clay deposits and on the clay mineral type. Therefore the first step to evaluate the perspective
applicability of a given clay deposit is to characterize it. This is the first objective of this master
thesis – characterization of the Porto Santo bentonite deposit.
The second objective is the synthesis of a novel polymer composite material based on
the Porto Santo bentonite. The commercial polymer production was only established during
the first part of the 20th century after the invention of the synthetic polymers neoprene and
nylon (Patterson, 2012). After many years of production of synthetic polymers, humans have
become aware of environmental concerns these materials evoke, for example, the
accumulation of non-degradable waste in the landfill and oceans. One of the possible solutions
is the use of biopolymers, which, in the contrary, are rapidly degradable materials, but they are
expensive and exhibit poor properties compared to conventional polymers. Here comes the
role of clay minerals, which are abundant sediments on the Earth and give improved properties
to the polymer products.
We are looking to understand the interactions between the neutral polysaccharide
scleroglucan and the smectite type clay mineral, and also to obtain composite material
structural organization on the nano level. This study could be useful for material science for

2
the investigation of a novel composite material, as well as for earth sciences because of the
application of the Porto Santo bentonite, for soil science because it provides an insight in the
interaction between neutral polysaccharide and clay minerals, as well as for chemistry and
pharmaceuticals because of a possible application in drug delivery.
The further document is organized in four chapters: a literature review, the principles
of main characterization techniques, the characterization of the Porto Santo bentonite
performed by the author at the University of Aveiro, Portugal and finally the synthesis and
characterization of composite material done at the University of Ottawa.
3
CHAPTER 1
THEORETICAL ASPECTS OF BIOPOLYMER-CLAY
NANOCOMPOSITES
This chapter gives a theoretical summary of biopolymer-clay nanocomposites. It
begins with an introduction about clays and clay minerals. Then follows the explanation of
polymer – clay nanocomposites in general: the development of this research area, the structure
of nanocomposites, methods of synthesis and properties. Afterwards, we discuss biopolymers
and lastly various groups of biopolymer – clay nanocomposites are presented.
1.1. Clays and clay minerals
1.1.1. Definition of clays and clay minerals
At the very beginning, a distinction between two notions “clays” and “clay minerals”
has to be made. Clays are defined as naturally occurring materials whose particles are less than
2 μm in equivalent spherical diameter (Guggenheim & Martin, 1995). They become plastic,
when wet, and harden, when dried or fired. The clay minerals are a class of phyllosilicates
(layered silicates), which are the main constituents of clays and are responsible for their
plasticity. Other fine particles in the clay fraction might be feldspar and quartz or any other
mineral having a particle size smaller than 2 μm. Unlike clay, clay minerals can be synthetic.
Nevertheless, these two terms are frequently used reciprocally and the term “clay” in polymer-
clay composites refers to a clay mineral.

4
1.1.2. Formation of clay minerals
In nature, clay minerals occur on the surface of the Earth’s crust. They are formed by
the weathering of magmatic or metamorphic rocks such as feldspars, pyroxenes, amphiboles
or micas or by the weathering of sedimentary rocks such as glauconites or zeolites. Another
process of clay mineral formation is the hydrothermal alteration. The environmental conditions
of these clay mineral formation processes will determine their structure. A detailed explanation
can be found in Meunier’s book “Clays” (2005); here we present only the main concepts
regarding clay mineral structure, which are important for biopolymer-clay composite study.
1.1.3. Structure of clay minerals
The basic “building” units of all the clay minerals are a silicon tetrahedron and an
aluminum or magnesium octahedron, which form layers (Figure 1).
Figure 1. Top: an octahedron (A) and an octahedral sheet (B), where single octahedrons
share an edge. Bottom: a silicon tetrahedron (A) and a tetrahedral sheet, where single tetrahedrons
share a corner (adapted from Grim, 1968).
5
They can be stacked in two different ways making the so called 1:1 or 2:1 clay minerals
(Figure 2). The clay minerals with aluminum octahedron are called di-octahedral clays, and
the ones with magnesium octahedron are called tri-octahedral clays. This relates to the number
of octahedrons in the half-unit cell. The trivalent aluminum coordinates with the oxygen in a
way that generates an empty space every third octahedron (like in the mineral gibbsite), while
divalent magnesium ensures a continuous packing of the octahedral sheet (like in the mineral
brucite).
Figure 2. Top:1:1 layer composed of one tetrahedral and one octahedral sheet. Bottom: 2:1
layer composed of one octahedral sheet in between two tetrahedral sheets.
The silicon in the tetrahedron can be substituted by Al3+, sometimes by Fe3+. The
aluminum in the octahedron can be substituted by Fe3+, Fe2+ and Mg2+, occasionally by Mn2+,
Ti4+, Zn2+ or Cr3+. The magnesium in the tri-octahedral clays can be substituted by Li+. These
substitutions, originating from diagenesis, create charge deficiency whether in the tetrahedron
or in the octahedron, or both. The charge is then compensated by the interlayer cations such as
Na+, K+, Ca2+ or other cations. Thus, the mineral name will depend on its chemical composition
and on the charge location in clay sheets. For example, the montorillonite, which is a common
clay mineral found in bentonite deposits, is a di-octahedral 2:1 clay mineral with low degree
of substitutions in the octahedral layer.
There exists also other clay minerals, which have the same building units, but their
structures are not layered: halloysite, sepiolite and palygorskite, imogolite.
The unit cell size will depend on the clay type, but typically a and b dimensions are
similar for all the phyllosilicates (5.2 Å and 9 Å), while the c dimension varying from 7 Å for
kaolinite to 15 Å for chlorite (Meunier, 2005). The particle size will depend on numerous
6
factors, but a single clay layer will have approximately 1 nm of thickness and several hundred
μm of length.
1.1.4. Applications of clay minerals and the Porto Santo bentonite
One of the objectives of this master thesis was the characterization of clay deposits.
Since a part of this research project was performed in Portugal, the clay deposits from this
country were considered. The applications of clay minerals are found in such industries as
ceramics, cement, pharmaceuticals, adhesives, paint, catalysts and various composite materials
including plastics. We were interested by the latest: the use of clays to improve polymer
properties. We decided to concentrate our attention on the smectite type clay as it is very
suitable for the intercalation/exfoliation study due to its expandability. A clay rich ore, mostly
composed of these swelling clay minerals is called bentonite.
The bentonite from the Porto Santo Island (PSB) has been previously studied for its
application in cosmetics, pharmaceutical use and in thermal spas (Antunes et al., 1999; Ferreira
et al., 2011; Gomes and Silva, 2012; Gomes and Silva, 2007; Rebelo et al., 2011a, 2011b;
Tateo et al., 2006). It has also been investigated for a possible application in limonene
conversion reaction (Catrinescu et al., 2006; Fernandes et al., 2007) and volatile organic
compounds removal (Nunes et al., 2008). A study by inverse gas chromatography revealed the
specific surface properties of PSB (Cordeiro et al., 2010). Its surface has high hydrophilic
character and high Lewis basic character.
1.2. Polymer - clay nanocomposites
The second important material for this study are polymers. A polymer is a large
molecule composed of repeating structural units: monomers. The polymers, which are
composed of identical monomers are called homopolymers, but the ones composed of different
monomers are called heteropolymers or copolymers. The most basic structure of homopolymer

7
is a linear chain, but many polymer structures involve branching and cross-linking (Semenov
& Nyrkova, 2012).
Now, that we have introduced the two notions “clay mineral” and “polymer”, we can
discuss the composite material thereof. Accordingly to the IUPAC definition, composite is a
“multicomponent material comprising multiple different (non-gaseous) phase domains in
which at least one type of phase domain is a continuous phase”. In our case the polymer is a
continuous phase and the clay represents a nano size phase domain.
1.2.1. Historical development of polymer-clay nanocomposites’ research
The interaction between clays and polymers have been studied in various fields of
science with the first publication dating back to 1874, when Schloesing observed complex
formation between clays and the organic constituents of soils, as it is mentioned in the
foreword of B.K.G. Theng book “Formation and Properties of Clay-Polymer Complexes”
(1979). The organic compounds and the clay were used to model complex processes occurring
in soil. In 1939, Gieseking reported that the amines induce the expansion of the clay layers,
which seems to be the first demonstration of the intercalation of an organic compound in a
clay (Gieseking, 1939). In 1955, Barrer proposed the application of such organoclay as a
sorbent (Barrer & MacLeod, 1955).
For a long time, studies remainded limited to simple organic compounds. Hendricks
(1941) investigated the intercalation of amines and diaminofluorene salts. He has been cited
by MacEwan (1948) who also studied clay-organic complexes. MacEwan is the first one to
propose an ethylene glycol method for an efficient montmorillonite identification with X-ray
diffraction (1944). Bradley (1945) also studied clay - amines and clay - glycol complexes at
the same time as MacEwans and Hendricks. The studies had continued on polyvinyl alchohols
by Emerson (1955, 1960) and Greenland (1963).
It is in late 1980s, the polymer-clay composite research area experienced a huge growth
of interest from the material science domain. The milestone was a synthesis done by the

8
researchers from Toyota Central Research & Development Laboratories, where they obtained
novel nylon-6 clay composite with better mechanical properties compared to pristine nylon-6.
In the review of this research (Okada & Usuki, 2006), they indicate that the synthesis was done
in 1985, although the results were published several years later (Kojima et al., 1993). For the
first time, it was shown that a good dispersion of clay particles in a polymer matrix greatly
improves material properties. New terms to characterize clay mineral interaction with polymer
matrix were introduced such as intercalation, exfoliation and delamination. Since then, the clay
minerals compete with other fillers (e.g., carbon nanotubes), having the advantage of wide
abundance in nature and thus a lower price.
Various types of polymers have been studied with several classes of clay minerals,
including the most used synthetic polymers - polyethylene and polypropylene (Zeng et al.,
2005).
1.2.2. Structure of polymer-clay nanocomposites
Depending on the interaction and dispersion of clay in polymer matrix, there are several
types of composites: microcomposite, intercalated, exfoliated or long-range ordered composite
(Figure 3). In the case of microcomposite (A), there is a dispersion of clay aggregates which
have the size in the range of microns. When polymer chains have penetrated in between clay
layers, but the clay has kept its initial organization, we obtain an intercalated composite (B),.
When the ordering is lost and a complete delamination of clay sheets occurs, we have an
exfoliated composite (C). Recently a new type of composite has been proposed when an
exfoliation has occurred, but clay sheets have kept a long range ordering (D) (LeBaron et al.,
1999).
9
Figure 3. Different types of clay-polymer composites – micro (A), intercalated (B), exfoliated
(C) and long –range ordered structure (D) (adapted from Theng, 2012).
The arrangement of clay layers in the polymer matrix depends on many factors, the
chosen materials being the most important one along with the method of synthesis. In many
cases, a functionalization of hydrophilic clay sheets is needed in order to make them
compatible with hydrophobic polymer. The common chemicals for this process are long-chain
alkylammonium or quaternary ammonium ions, which render the clay surface organophilic
(Lagaly et al., 2013). Such modified clays are called “the organoclays”. In our project, the
chosen biopolymer scleroglucan is water soluble, therefore a prior modification of clay
minerals was not considered.
1.2.3. Synthesis of polymer-clay nanocomposite
There are several different ways to obtain polymer-clay composites. One way is the
intercalation of polymer directly from a solution or from a melt. The other option is to prepare
a monomer and the clay mixture and then induce the polymerization in situ. The same concept
can be applied vice versa by the template synthesis of clay minerals in a polymer matrix.
Nevertheless every method has its advantages and drawbacks.

10
Further, we will give a brief explanation on each of these techniques to show the variety
of processing possibilities, which are important for the development of production process.
1.2.3.1. Direct intercalation from solution or melt
A direct intercalation of polymer in between clay layers, which can result afterwards
in further exfoliation, is the most common and simpler technique.
The role of the solvent or melted polymer in this method is to enhance the dispersion
of the components of the system. In a general procedure, at the beginning, the clay is dispersed
in a solvent in which the polymer is soluble. Then the polymer is added and its adsorption onto
and into the clay platelets (external adsorption and intercalation) occurs. Finally, the solvent
is removed through evaporation (Figure 4).
Figure 4. Flowchart of direct intercalation from solution processing technique (adapted from
Zeng et al., 2005). The clay is swollen in the solvent in which the polymer is soluble. Afterwards the
polymer is added and the intercalation process takes place. The solvent is removed through
evaporation.
The examples of this method include the synthesis of polyvinylpyrrolidone, polyacrylic
acid or polyaniline clay nanocomposites (Lagaly, 1999). The driving force in this process is
the gain of entropy from the desorption of solvent (Beall & Powell, 2011). There are three
disadvantages for this technique. Firstly, large quantities of solvent used. Secondly, there is
Clay
Solvent
Swelling Intercalation Evaporation Nanocomposite
Polymer
11
not always a compatible polymer-clay-solvent system available. Lastly, a co-intercalation of
solvent and polymer can occur.
These disadvantages can be overcome by melting the polymer, thus no solvent is
required and yet the clay dispersion in the polymer matrix is achieved. The driving force in
this case is the enthalpy contribution from polymer-clay interaction and a concentration effect,
but the penetration of polymer in between clay layers, in some cases, could be slow. The nylon
6, polystyrene and polyethylene terephthalate clay composites are produced this way (Zeng et
al., 2005).
We choose to apply this particular technique – the direct intercalation from the solution
– in our project as well, because it can allow both the study of polymer – clay interaction, and
the nanocomposite synthesis at the same time.
When it is possible and it is easier to work with monomers, in situ polymerization can
be successfully applied.
1.2.3.2. In situ polymerization of the monomers
The second technique of polymer-clay nanocomposite synthesis is the polymer
constituting monomer intercalation between the clay sheets and polymerization instigation
thereafter (Figure 5).
Figure 5. Flowchart of in situ polymerization processing technique. The monomer is
intercalated in the clay and polymerized afterwards.
Clay
Monomer
Intercalation Polymerization Nanocomposite
Curing agent
12
The mechanisms of polymerization vary depending on the monomer type. It is
important to note that clay surfaces can also induce the polymerization, acting as Lewis or
Brønsted acids (Pinnavaia & Beall, 2000).
This method is applied for polymers which are not easy to process in solution like
thermoset polymers. The driving force for this reaction is monomer-clay surface reaction as
well as the enthalpy evolvement during the polymerization. The disadvantage of this method
is the exfoliation dependence on the rate of monomer diffusion between clay layers and the
possible formation of oligomers (Zeng et al., 2005).
The in situ polymerization of monomers in this case was not possible, because of the
use of the biopolymer.
1.2.3.3. Template synthesis of clay minerals
Less known is the template synthesis of clay minerals in a polymer matrix. There are
two publications about this topic mentioned by Theng, (2012). Carrado (2000) with co-workers
have synthesized hectorite in various polymer matrices. Their motivation for this study was
the ability to synthetize pure materials with well-defined composition using reproducible
operating conditions. They used LiF, Mg(OH)2, silica gel and monovalent organic salt or
neutral organic molecules as precursors. Yamamoto et al. (2005) have also tried this approach
synthesizing another clay mineral imogolite from aluminum chloride and tetraethoxysilane
aqueous solution in the presence of polyvinyl alcohol solution.
With this technique, partially exfoliated composites were obtained. Yamamoto et al.
(2005) also report the improvement of mechanical and optical properties of the composite
material. Despite the advantages listed by Carrado (2000), the method is limited to water
soluble organic compounds.
It is worth mentioning that the template synthesis of clay minerals can also be observed
in nature. Ueshima and Tazaki (2001) observed the coexistence of Fe rich clay mineral
nontronite and microbes in the surface layers of deep-sea sediments from Iheya Basin in Japan.

13
One hypothesis is that the extracellular polymeric substances produced by bacteria might have
served as a template for clay mineral synthesis. This fact might be interesting regarding
biopolymer-clay composite synthesis.
To conclude, we would like to mention that all various preparation methods – direct
intercalation from solution or melt, in situ polymerization and template synthesis of clay
minerals - have one goal: to obtain materials with better properties by achieving the dispersion
of clay sheets at the nano scale. What constitutes these “better properties”, we shall see in the
next section.
1.2.4. Properties and applications of polymer – clay nanocomposites
These are the macroscopic material properties, which determine the composite material
application: mechanical strength, electrical resistance or conductivity, radiation transmission,
heat capacity and others.
The polymer-clay nanocomposites have higher mechanical strength compared to
pristine polymer; thus, such material broadens the possible application of polymers and their
durability. The first applied polymer-clay nanocomposite made by Toyota Central Research
and Development Laboratory was nylon-6 and organically modified montmorillonite material
for timing belt cover for Toyota cars (Kojima et al., 1993). The tensile strength of such material
(97.2 MPa) was improved by one third compared to pristine nylon-6 (68.2 MPa). The
improvement of mechanical properties is explained by the filler, clay, which is very well
dispersed (exfoliation) in the polymer matrix. The better the exfoliation is, the superior
mechanical properties are achieved.
Other important material properties, which are influenced by the clay addition, are
flame retardancy, gas diffusion and thermal resistance. The thermal resistance is studied by
heating the sample and evaluating its mass loss as a function of temperature. The addition of
clay usually increases the polymer thermal stability, but the nature of clay and polymer will
determine whether intercalated or exfoliated composite would exhibit superior stability. The
14
nature of thermal degradation mechanism would also greatly influence the extent of the
thermal stabilization in nanocomposites (Alexandre & Dubois, 2000). These aspects and the
experimental conditions are the main reasons why the results of thermal stability vary
significantly among studied polymer-clay nancomposites.
The parameter to evaluate the fire safety is the heat release rate, which is measured by
Cone calorimetry. The intercalated and delaminated polymer-clay composites show a reduced
average heat release rate, which means that they resist to fire better and are safer compared to
pristine polymer materials (Gilman, 1999). Further studies by the same author suggest that the
general mechanism of nanocomposite’s flame retardancy is the formation of carbonaceous
silicate char on the surface during burning; which insulates the underlying material and slows
the mass loss rate of decomposition products (Gilman et al., 2000).
Similarly to the thermal stability and flammability, the exfoliation of clay layers in
polymer tends to improve the material’s barrier properties against gas and vapor transmission.
In some cases, the intercalated and partially exfoliated structures show the enhancement of
barrier properties (Xu et al., 2006). The progress of gas molecules through the composite
material is slower due to the “tortuous path”, which clay platelets create in the polymer matrix
(Figure 6).
Figure 6. "Tortuous path" in polymer-clay nanocomposites, which slows down the process of
gas penetration within a material (adapted from Ray, 2013).
In a real case the clay layers could not be so well aligned flat along the film surface as
shown in Figure 6, and therefore a negative deviation from the tortuous path model is observed
(Beall & Powell, 2011b). This property is important for the materials’ application in food
packaging protecting the food from spoilage.
15
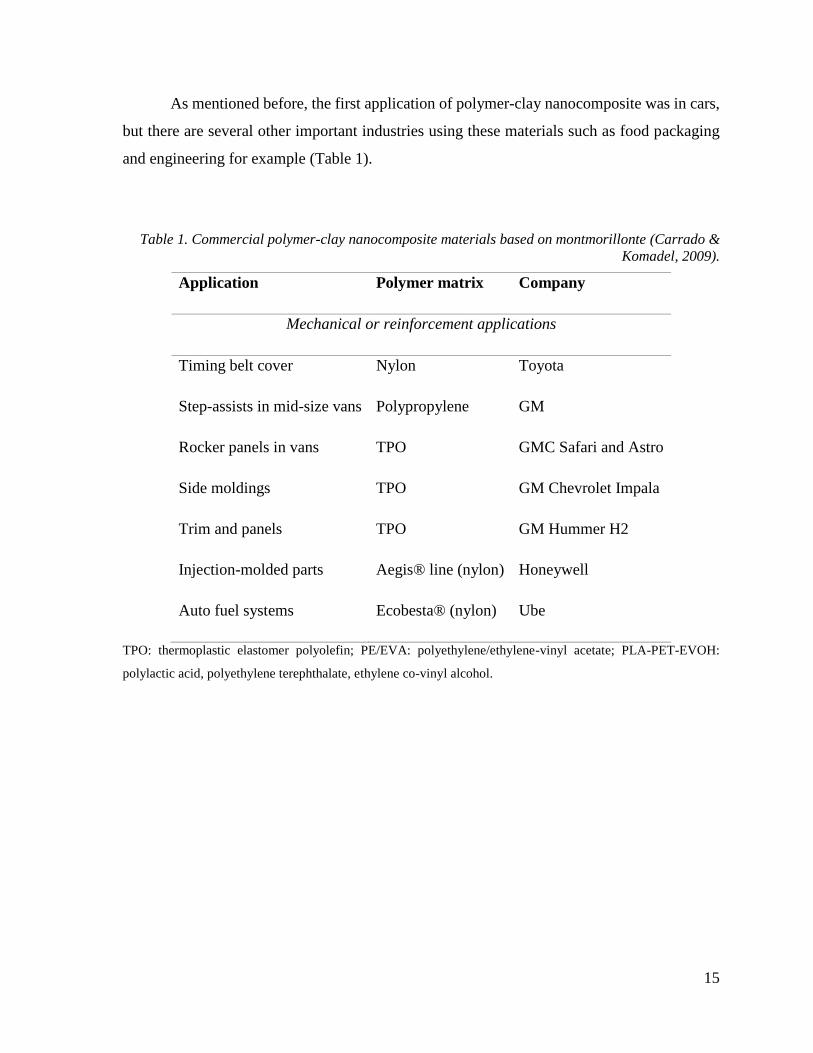
As mentioned before, the first application of polymer-clay nanocomposite was in cars,
but there are several other important industries using these materials such as food packaging
and engineering for example (Table 1).
Table 1. Commercial polymer-clay nanocomposite materials based on montmorillonte (Carrado &
Komadel, 2009).
Application Polymer matrix Company
Mechanical or reinforcement applications
Timing belt cover Nylon Toyota
Step-assists in mid-size vans Polypropylene GM
Rocker panels in vans TPO GMC Safari and Astro
Side moldings TPO GM Chevrolet Impala
Trim and panels TPO GM Hummer H2
Injection-molded parts Aegis® line (nylon) Honeywell
Auto fuel systems Ecobesta® (nylon) Ube
TPO: thermoplastic elastomer polyolefin; PE/EVA: polyethylene/ethylene-vinyl acetate; PLA-PET-EVOH:
polylactic acid, polyethylene terephthalate, ethylene co-vinyl alcohol.
16
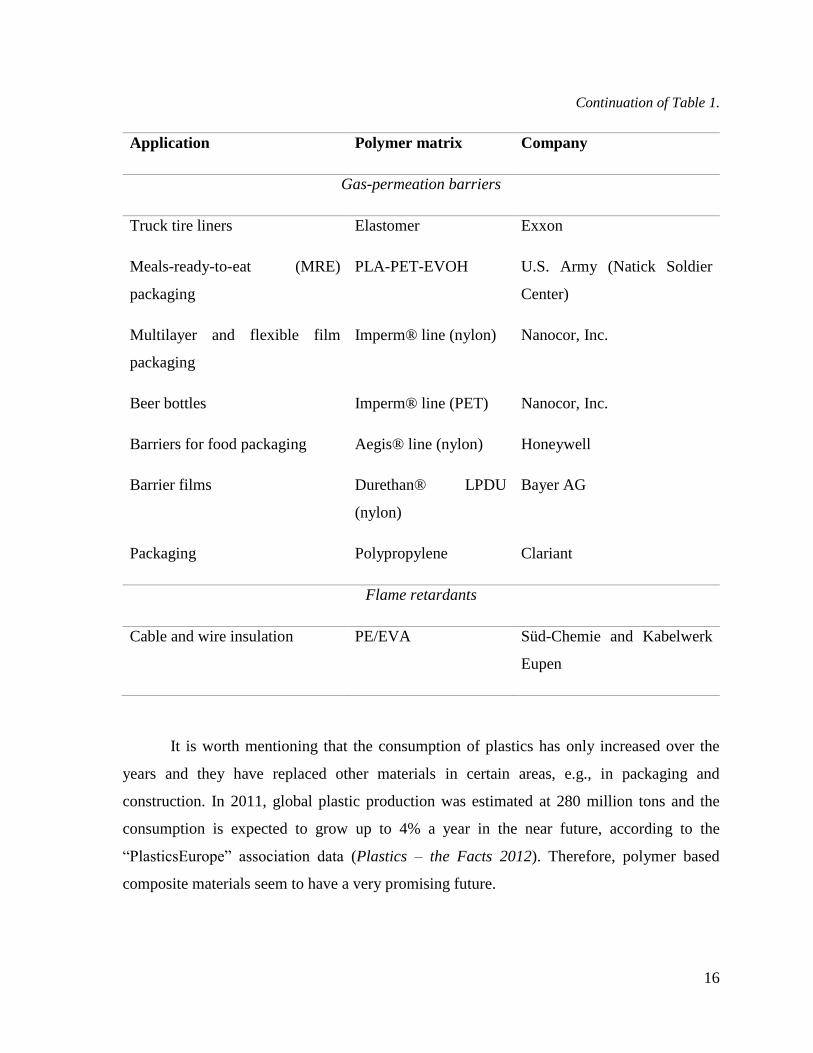
Continuation of Table 1.
Application Polymer matrix Company
Gas-permeation barriers
Truck tire liners Elastomer Exxon
Meals-ready-to-eat (MRE)
packaging
PLA-PET-EVOH U.S. Army (Natick Soldier
Center)
Multilayer and flexible film
packaging
Imperm® line (nylon) Nanocor, Inc.
Beer bottles Imperm® line (PET) Nanocor, Inc.
Barriers for food packaging Aegis® line (nylon) Honeywell
Barrier films Durethan® LPDU
(nylon)
Bayer AG
Packaging Polypropylene Clariant
Flame retardants
Cable and wire insulation PE/EVA Süd-Chemie and Kabelwerk
Eupen
It is worth mentioning that the consumption of plastics has only increased over the
years and they have replaced other materials in certain areas, e.g., in packaging and
construction. In 2011, global plastic production was estimated at 280 million tons and the
consumption is expected to grow up to 4% a year in the near future, according to the
“PlasticsEurope” association data (Plastics – the Facts 2012). Therefore, polymer based
composite materials seem to have a very promising future.

17
Nevertheless, most of these materials are made from petroleum-derived polymers,
which in most cases do not represent “green” chemistry and engineering, which would use
renewable carbon resources and prevent waste and contamination (Höfer & Selig, 2012). It is
following this “green” chemistry concept that scientists have turned their attention on the use
of biopolymers and consequently biopolymer-clay composites, which we shall present in the
next paragraph.
1.3. Biopolymer - clay nanocomposites
1.3.1. Biopolymers – case of scleroglucan
The biopolymers are defined as biodegradable polymer materials made from renewable
resources (Mittal, 2011). Due to these properties, they have attracted the researchers’ interest
as possible substituents of conventional plastics. The compatibility with the human body
makes these materials also attractive for their use in medicine. The most abundant are starch,
sugar, cellulose, and chitin among others.
Our attention was caught by their possible application for drug delivery or human tissue
replacements. Although such materials could also be used for food packaging applications, the
high cost of such polymers until now has been limiting their wide use.
Some of the biopolymers applied for drug delivery are: chondroitin sulphate,
arabinogalactan, dextrans, hyaluronic acid (Jain et al., 2011), Arabic gum, gellan gum, inulin,
karaya gum and scleroglucan (Rajesh et al., 2012). Most of these polymers are anionic
(chondroitin sulphate, hyaluronic acid, inulin) or have a complex and not a well-defined
structure such as arabinogalactans. From all the mentioned biopolymers, scleroglucan is a
relatively simple neutral molecule with a well-established structure and available
commercially (Error! Reference source not found.7).
18
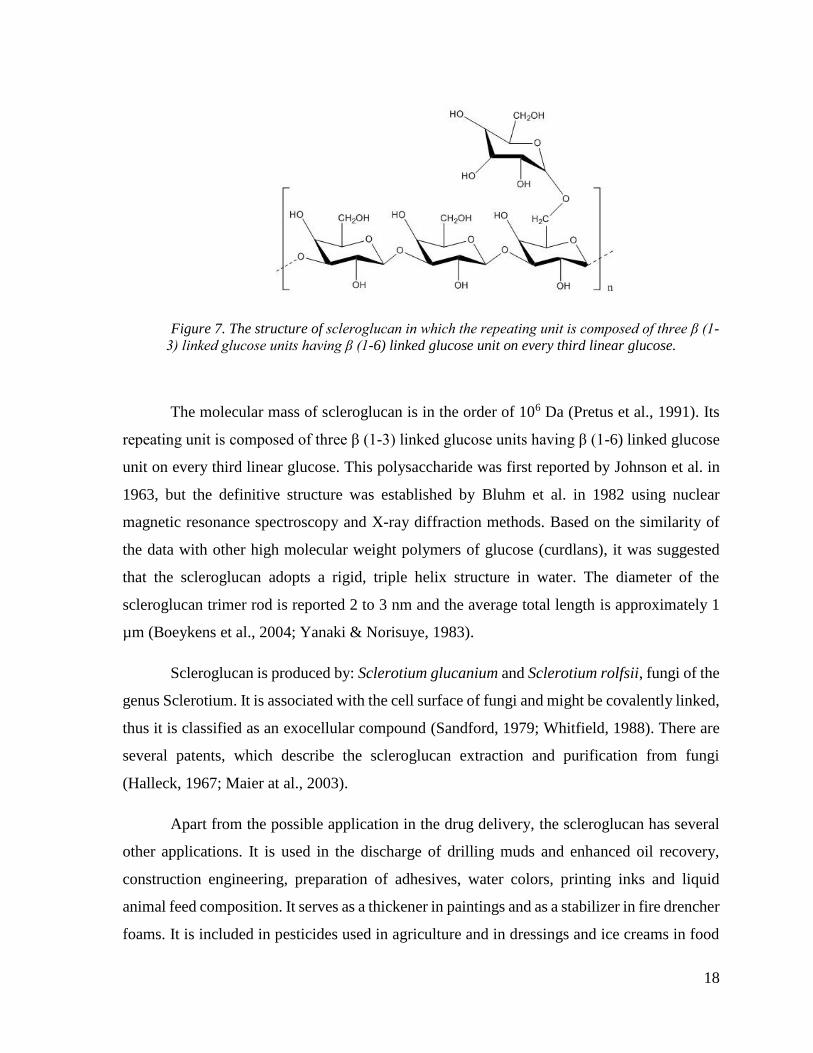
Figure 7. The structure of scleroglucan in which the repeating unit is composed of three β (1-
3) linked glucose units having β (1-6) linked glucose unit on every third linear glucose.
The molecular mass of scleroglucan is in the order of 106 Da (Pretus et al., 1991). Its
repeating unit is composed of three β (1-3) linked glucose units having β (1-6) linked glucose
unit on every third linear glucose. This polysaccharide was first reported by Johnson et al. in
1963, but the definitive structure was established by Bluhm et al. in 1982 using nuclear
magnetic resonance spectroscopy and X-ray diffraction methods. Based on the similarity of
the data with other high molecular weight polymers of glucose (curdlans), it was suggested
that the scleroglucan adopts a rigid, triple helix structure in water. The diameter of the
scleroglucan trimer rod is reported 2 to 3 nm and the average total length is approximately 1
µm (Boeykens et al., 2004; Yanaki & Norisuye, 1983).
Scleroglucan is produced by: Sclerotium glucanium and Sclerotium rolfsii, fungi of the
genus Sclerotium. It is associated with the cell surface of fungi and might be covalently linked,
thus it is classified as an exocellular compound (Sandford, 1979; Whitfield, 1988). There are
several patents, which describe the scleroglucan extraction and purification from fungi
(Halleck, 1967; Maier at al., 2003).
Apart from the possible application in the drug delivery, the scleroglucan has several
other applications. It is used in the discharge of drilling muds and enhanced oil recovery,
construction engineering, preparation of adhesives, water colors, printing inks and liquid
animal feed composition. It serves as a thickener in paintings and as a stabilizer in fire drencher
foams. It is included in pesticides used in agriculture and in dressings and ice creams in food
19
industry. For cosmetics, we can find it in hair control compositions and in various skin care
preparations, creams and protective lotions. In pharmaceutical products, scleroglucan is
applied as a laxative, for tablet coatings, stabilizing suspensions and as a release agent. The
biological activity of scleroglucan as an antitumor, antiviral and antimicrobial compound has
also been investigated (Schmid et al., 2011).
We can find in the literature two references related to scleroglucan-clay mineral
interactions. It is mentioned by Sandford in 1979 that “combinations of scleroglucan with
suspensions of bentonite display marked synergism.”
Also, Chenu et al. (1987) report that the scleroglucan stabilizes the clay suspensions in
water. They have found that the maximum amount of scleroglucan adsorbed on Ca-
montmorillonite is 149 mg/g and on the Na-montmorillonite it is 385 mg/g. Altough the clay
particles and scleroglucan can have some synergism, further studies (Chenu et al., 1989)
concluded that the arrangement of clay particles are mostly unchanged by the adsorption of a
neutral polysaccharide scleroglucan. Theng (2012) discussed that this is more an exception
than a rule, suggesting the influence of the nature of the compounds, because the uncharged
polysaccharides generally have the ability to penetrate the interlayer space of montmorillonite
particles.
1.3.2. Examples of biopolymer-clay composites
The most demanded plastics polyethylene and polypropylene have conquered their
place because of the low-cost and their properties (Plastics – the Facts 2012). Even if the
biopolymers might not beat the price of petroleum-based polymers in the near future, they can
compete in terms of properties. A significant amount of research has already been done in this
area (Darder et al., 2007), but the main focus was on the composite properties (Avérous &
Pollet, 2012). Yet – understanding the interaction between the biopolymers and the clay
minerals and their impact on the material properties would enable the extent of our knowledge
and the design of novel materials.

20
All that being said on the growing interest from the polymer science, the interaction of
biopolymers and clays has long been studied in the field of soil sciences. A recently published
book by Theng (2012), is a good starting point for understanding the clay-biopolymer
interaction and extending this knowledge to explain modern nanocomposite properties.
The proteins, the polysaccharides and the bacterial polymers, together with the lipids
and the natural gums, which are not reviewed here, have their characteristic structure with
different or particular distribution of functional groups. They also have different application;
therefore we will discuss them separately.
1.3.3. Protein-clay nanocomposites
The main proteins used to form the biopolymer-clay nanocomposites are corn zein
(Alcântara et al., 2012; Luecha et al., 2010), wheat gluten (Angellier-Coussy et al., 2008;
Guilherme et al., 2010; Türe et al., 2012; Zhang et al., 2007), gelatin (Aranda et al., 2006; Bae
et al., 2009; Martucci et al., 2007; Rao, 2007; Zheng et al., 2002), soy protein (Kumar et al.,
2010; Shabeer et al., 2007) and whey protein (Sothornvit et al., 2009). Generally speaking, the
proteins are composed of a combination of more than 20 different amino acids and
characterized by primary, secondary, tertiary and quaternary structure (Whitford, 2005).
Schematic representations of an amino acid and a protein structure are given in Figure 8.
O
ON
H
H
HH
H
Figure 8. Structure of amino acid (left), which has two characteristic functional groups, -
NH2 and –COOH, and the structure of protein (right), which is composed of the combination of
various amino acids and has primary, secondary, tertiary and quaternary structure.
(
a)

21
We can see that this structure is nonionic, so the direct association or “water bridging”
with the interlayer cation through the ion-dipole interaction can be predicted. Nevertheless,
these proteins are soluble in water and can be protonated by changing the pH of the system. In
this case, we obtain polycations and then the electrostatic interaction between the positive
cation and the negative clay layer will dominate.
It might be this electrostatic interaction that can explain the increase of the mechanical
properties. Such studies are reported by Alcântara et al. (2012) on the zein adsorption on
sepiolite. Bae et al. (2009), Zheng et al. (2002) and Martucci et al. (2007) have studied gelatin
and Dang et al. (2010) have investigated the silk fibroin/montmorillonite nanocomposites.
With the exception of the case of zein, when the adsorption is reported to occur only on the
external surface of sepiolite, the rest of the studies confirm that at low pH (below the isoelectric
point of the protein), the dispersion of montmorillonite in the polymer matrix is enhanced,
because of the higher electrostatic interaction. However, because of this important interaction,
the protein can lose its conformation and thus its activity.
These studies are important for the novel composite material production, for example,
Mieszawska et al. (2011) presented silk/clay composite system for the possible application for
bone tissue formation. Also, Angellier-Cousy and Gastaldi (Averous & Pollet, 2012) suggest
“that it would be more relevant to develop the ‘‘nano-biocomposite’’ strategy for other
purposes than the improvement of mechanical and barrier properties of protein-based
materials. The introduction of nanoclays in the protein-based matrices could provide new
additional functionalities, such as UV protection or controlled delivery of active agents
(antimicrobial compounds, agrochemicals, fertilizers or drugs).” We tend to agree with this
conclusion, because although protein-based biopolymers could be used to replace the
petroleum sourced plastics in the food packaging (especially if these proteins are by-products
of some other industrial processes, like whey protein (M. Schmid et al., 2012)), the high value
of proteins makes them more attractive for biomaterial (Chen et al., (2012) and controlled drug
delivery study (Chevillard et al., 2012; Patil et al., 2005).
22
1.3.4. Polysaccharide-clay nanocomposites
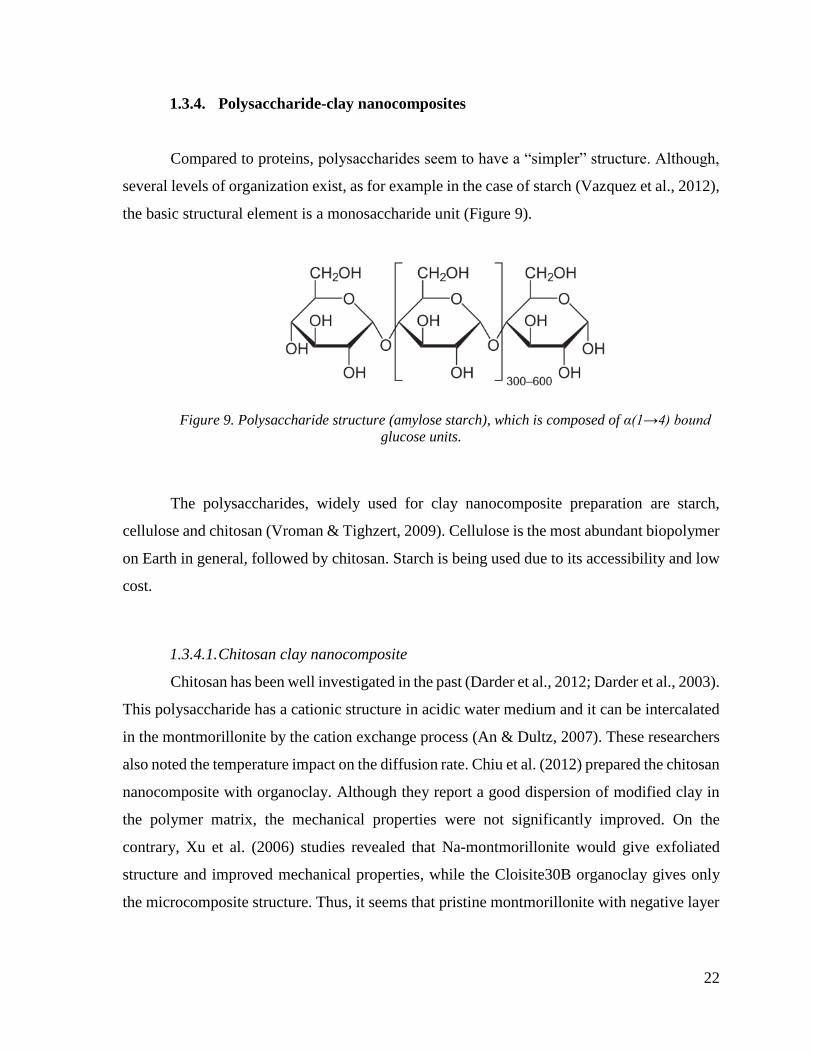
Compared to proteins, polysaccharides seem to have a “simpler” structure. Although,
several levels of organization exist, as for example in the case of starch (Vazquez et al., 2012),
the basic structural element is a monosaccharide unit (Figure 9).
Figure 9. Polysaccharide structure (amylose starch), which is composed of α(1→4) bound
glucose units.
The polysaccharides, widely used for clay nanocomposite preparation are starch,
cellulose and chitosan (Vroman & Tighzert, 2009). Cellulose is the most abundant biopolymer
on Earth in general, followed by chitosan. Starch is being used due to its accessibility and low
cost.
1.3.4.1. Chitosan clay nanocomposite
Chitosan has been well investigated in the past (Darder et al., 2012; Darder et al., 2003).
This polysaccharide has a cationic structure in acidic water medium and it can be intercalated
in the montmorillonite by the cation exchange process (An & Dultz, 2007). These researchers
also noted the temperature impact on the diffusion rate. Chiu et al. (2012) prepared the chitosan
nanocomposite with organoclay. Although they report a good dispersion of modified clay in
the polymer matrix, the mechanical properties were not significantly improved. On the
contrary, Xu et al. (2006) studies revealed that Na-montmorillonite would give exfoliated
structure and improved mechanical properties, while the Cloisite30B organoclay gives only
the microcomposite structure. Thus, it seems that pristine montmorillonite with negative layer

23
surface has better compatibility with cationic chitosan compared to the organically modified
montmorillonite, which exhibits organophilic characteristics.
The chitosan has wide and interesting possible applications. Ruiz-Hitzky’s research
group propose it for electro sensors (Aranda et al., 2006). Also, by making caramel type
composites, it is possible to synthesize graphene-like material and obtain conductive materials
(Gómez-Avilés et al., 2010; Gómez-Avilés et al., 2007; Ruiz-Hitzky et al., 2011). As the
chitosan has a good biocompatibility and an antimicrobial activity, it has the potential of being
used for the body tissues (Hsu et al., 2012).
1.3.4.2. Starch clay nanocomposite
Compared to chitosan, starch is nonionic over a wide pH range, but it is also soluble in
water (Vroman & Tighzert, 2009). In general, for nonionic polymers it is an ion-dipole
interaction and the surface accessibility, which determine the interaction process. This is
confirmed in Zhang et al. (2010) experiments, where they used solid state NMR for the average
clay platelets distance calculation. Nevertheless, the montmorillonite and starch are both
hydrophilic, in most of the cases starch-clay nanocomposites are prepared with organoclay. As
investigated in the Chivrac et al. (2010) study with sepiolite, the organophilicity would create
electrostatic repulsion of clay particles and thus favor the mix within the starch. But the use of
organoclay may decrease the thermal stability of the composite due to NH3 evaporation. In the
case of starch-clay nancomposites, a wide variety of additives are used, which limits the
possibility to compare the different results.
The most promising application seems to be in the food packaging and other plastics,
because these renewable and biodegradable materials are more abundant and cheaper
compared to chitosan.
1.3.4.3. Cellulose clay nano composite
Although cellulose is the most abundant among all of the biopolymers, its use for clay-
nanocomposite preparation is not widely investigated, because it is insoluble in most common

24
solvents and has to be transformed before being processed (Vroman & Tighzert, 2009).
Cellulose itself is used as reinforcement in different polymer matrices (Khalil et al., 2012;
Vilaseca et al., 2010), but even in this case, the addition of clay proves that the interaction
between clay and cellulose gives new properties to the composite (Pandey et al., 2012). As
said before in the case of starch, organoclays are most commonly used for the experiments
(Delhom et al., 2010; Hassan-Nejad et al., 2009; Zhou et al., 2012), but nevertheless, the use
of the pristine clay seems to give better mechanical properties to the nanocomposite (Hassan-
Nejad et al., 2009). Also in this case, careful attention should be brought to the type of clay
(organomodified or pristine), the solvent (water or organic) and the matrix used, because they
vary in every experiment, providing diverse interactions and thus particular resulting
properties.
The possible applications of cellulose-clay nanocomposites are the same as for the
starch – the food packaging and other plastics.
Polysaccharides seem to be the most investigated group of biopolymers due to various
applications, but we would like to mention a few other biopolymers mostly derived from the
bacteria.
1.3.5. Other biopolymer – clay nanocomposites
There are two more commonly used biopolymers we would like to mention: polylactide
acid (PLA) and poly(3-hydroxyalkanoates) (PHAs). PLA is a semi-synthetic polymer
synthesized from lactic acid, which is produced via starch fermentation from bacteria (Vroman
& Tighzert, 2009). The PHAs are synthesized by bacteria and accumulated as a storage
material in the cells.
Both of these groups have similar structure (Figure 10). They are primarily linear
polyesters composed of 3-hydroxy fatty acid monomers. In these polymers, the carboxyl group
of one monomer forms an ester bond with the hydroxyl group of the neighboring monomer
(Madison & Huisman, 1999).

25
Figure 10. Chemical structure of PHAs. R varies from methyl (C1) to tridecyl (C13).
The structure is nonionic and the polymer is insoluble in water. It explains why only
the organoclay has been tested as the nanoreinforcement. The pioneering and most extensive
work on PLA-clay nanocomposites was done by Okamoto’s researcher group (Okamoto,
2012). Exfoliated nanocomposites were confirmed, but the author mentioned that not always
exfoliated means a better composite. The driving force of the process could be the increase of
entropy due to the clay layer exfoliation, which is in competition with the decrease of entropy
due to the confinement of polymer molecules (Vaia & Giannelis, 1997). González et al., (2012)
and Najafi et al. (2012) suggested a hydrogen bond formation between the PLA and the
organomodified clay, which could be the reason for the good dispersion.
The latest advances in the PHAs/clay nanocomposites have been very well summarized
by Plackett (2012). Although these polymers have been known for some time and the
bioplastics have been developed, not much work is done with the clay additives, especially for
the interaction studies. The author states that “the use of plate-like clays as additives can lead
to some enhancement in the mechanical and gas barrier properties of PHAs as well as an
increased thermal stability, although the effects depend significantly on the clay type, the clay
organomodifier and the process conditions”.
Compared to other biopolymer groups, this seems the less investigated area, because
the PHAs are expensive when they are used alone, so they are often blended with other less
expensive polymers having complementary characteristics.
To sum up the section, it can be said that despite the fact that biodegradable plastics
comprise only 1% of the total production (Plastics – the Facts 2012), they have a perspective
in the plastics industry and in medicine due to its “nature friendly” properties – degradability,
renewable raw materials and biocompatibility with human body. Some patents in this area

26
have already been claimed (Berrada et al., 2005; Narayan et al., 2006; White & Delhom, 2005).
Yet, in many cases, the challenges of the cost and the properties still have to be overcome. For
the proteins and one of the polysaccharide – chitosan, the perspective areas of application
could be a body tissue, the artificial bones and a controlled drug delivery, while other
polysaccharides and bacterial polymers would have a potential application in food packaging
and other plastics. Other biopolymer-clay nanocomposite production might open new
perspectives, for example lipids, DNA and various blends.
1.4. Conclusion
To summarize the most important concepts presented in the first chapter, we recall that
it is the smectite type clay, which was investigated during this master thesis and will be
discussed further. It comprises a group of 2:1 layer clay minerals, which have low degree of
substitution in the octahedral sheet and exhibit swelling properties. These clay minerals are
the main constituents of bentonite deposits. Afterwards, we introduced also the notion
“biopolymer” and the polysaccharide scleroglucan, which was also used in this master thesis
project. We have also presented the structure of polymer-clay nanocomposites and three
different concepts for their preparation: direct intercalation from solution (applied in the thesis)
or melt, in situ polymerization and template clay synthesis. The concept of “green” chemistry
has urged us to look at sustainable sources for material production, one of them being
biopolymers: proteins, polysaccharides and esters. They are the class of polymers extracted
from renewable resources and biodegradable. The potential applications could be in body
tissues, artificial bones and controlled drug delivery, as well as in the food packaging and other
plastics.

27
CHAPTER 2
PRINCIPLES OF MAIN CHARACTERIZATION TECHNIQUES
Scientists have mastered the application of radiation to study the material down to the
atom scale. In this chapter we describe the principles of X-ray diffraction, X-ray fluorescence,
transmission electron microscopy, nuclear magnetic resonance spectroscopy,
thermogravimetry and infrared spectroscopy. We also present the techniques for clay
mechanical properties measurements.
2.1. X-ray diffraction
In clay science, X-ray diffraction (XRD) can be applied to detect the clay mineral
presence in various compounds, to study the structure of intercalated species and
nanocomposites. The difficulty for clay samples is their high sensivity to physico-chemical
conditions and the presence of structural defects, coexistence of phases having similar
composition and intimate phase mixing (interstratification). These aspects can be better
understood by performing simulations (Lanson, 2011).
A characteristic feature to identify clay minerals is to prepare oriented slides, which
will give 00l reflections in XRD pattern, as a and b dimensions in many cases are quite similar.
These slides are then treated with ethylene glycol and heated to distinguish between
swelling/non swelling clays (Moore & Reynolds, 1997).
For composite material studies, XRD is a useful tool to track the changes of clay
mineral orientation within the material. The intercalation of a polymer would create an increase
of interlayer distance between clay layers, which is reflected by the shift of (00l) peaks to lower
angle in the diffractogram. In the case of complete exfoliation, clay layers become randomly
oriented in the polymer matrix, which results in the disappearance of (00l) reflections in the
diffractogram (Alexandre & Dubois, 2000).
28
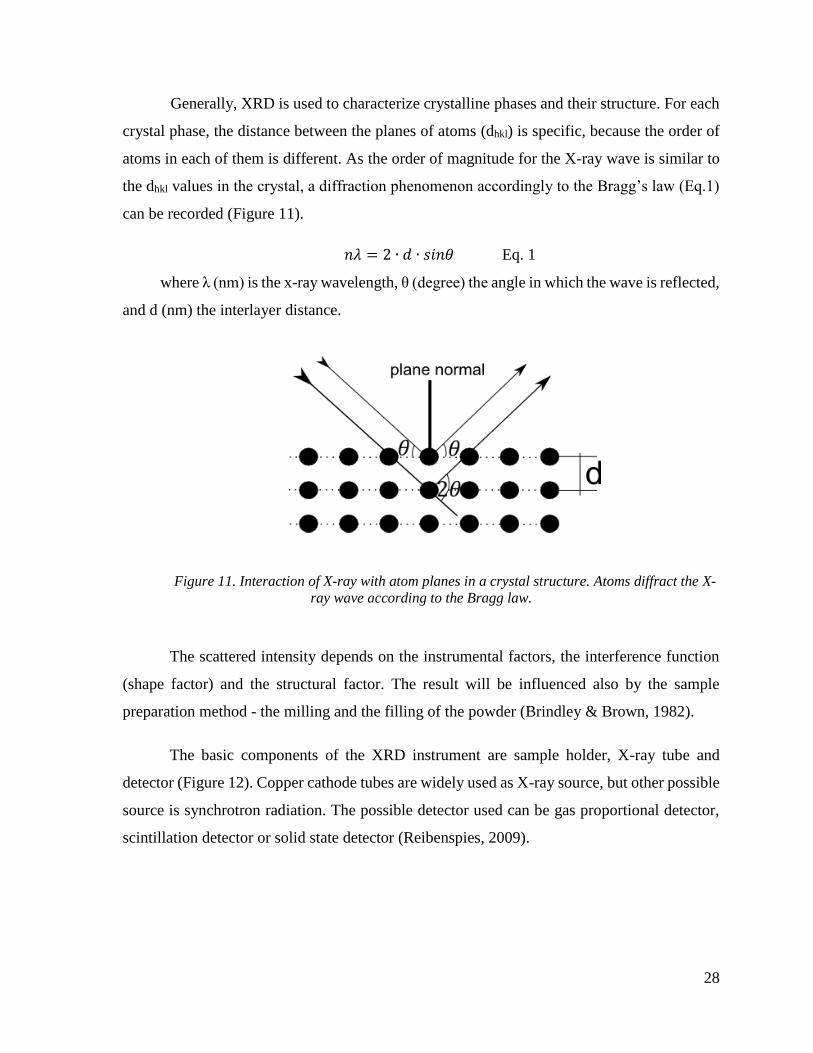
Generally, XRD is used to characterize crystalline phases and their structure. For each
crystal phase, the distance between the planes of atoms (dhkl) is specific, because the order of
atoms in each of them is different. As the order of magnitude for the X-ray wave is similar to
the dhkl values in the crystal, a diffraction phenomenon accordingly to the Bragg’s law (Eq.1)
can be recorded (Figure 11).
𝑛𝜆 = 2 ∙ 𝑑 ∙ 𝑠𝑖𝑛𝜃 Eq. 1
where λ (nm) is the x-ray wavelength, θ (degree) the angle in which the wave is reflected,
and d (nm) the interlayer distance.
Figure 11. Interaction of X-ray with atom planes in a crystal structure. Atoms diffract the X-
ray wave according to the Bragg law.
The scattered intensity depends on the instrumental factors, the interference function
(shape factor) and the structural factor. The result will be influenced also by the sample
preparation method - the milling and the filling of the powder (Brindley & Brown, 1982).
The basic components of the XRD instrument are sample holder, X-ray tube and
detector (Figure 12). Copper cathode tubes are widely used as X-ray source, but other possible
source is synchrotron radiation. The possible detector used can be gas proportional detector,
scintillation detector or solid state detector (Reibenspies, 2009).
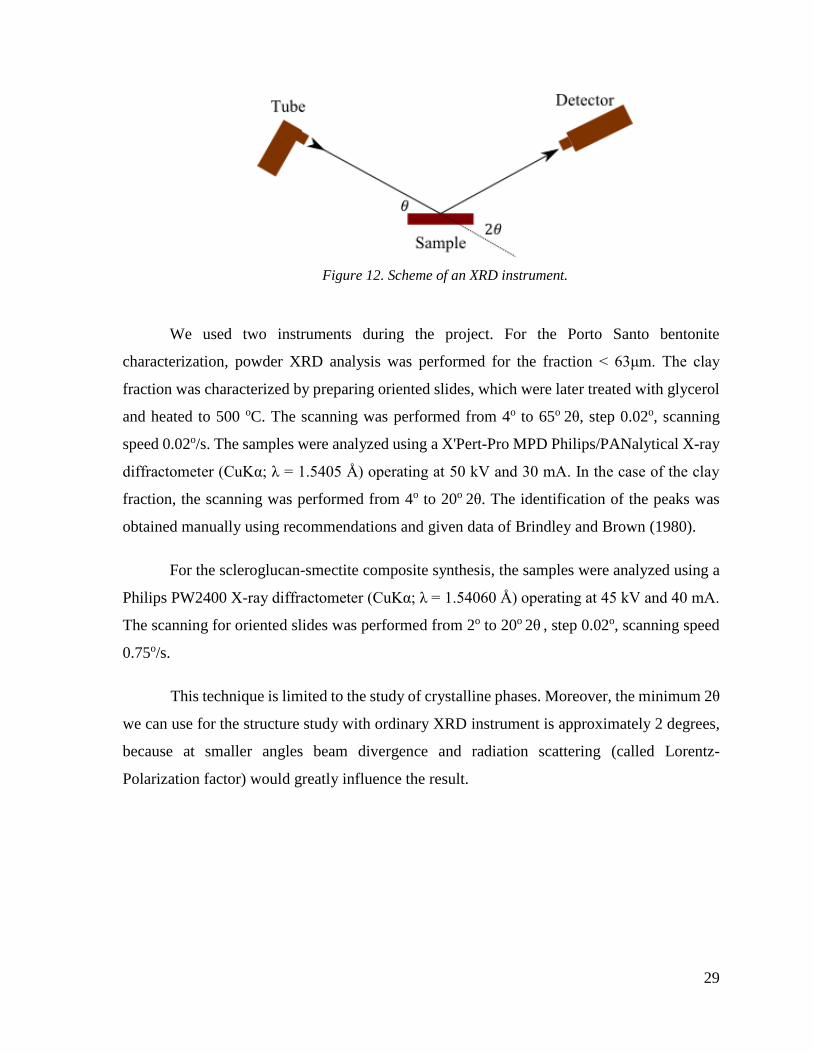
29
Figure 12. Scheme of an XRD instrument.
We used two instruments during the project. For the Porto Santo bentonite
characterization, powder XRD analysis was performed for the fraction < 63μm. The clay
fraction was characterized by preparing oriented slides, which were later treated with glycerol
and heated to 500 oC. The scanning was performed from 4o to 65o 2θ, step 0.02o, scanning
speed 0.02o/s. The samples were analyzed using a X'Pert-Pro MPD Philips/PANalytical X-ray
diffractometer (CuKα; λ = 1.5405 Å) operating at 50 kV and 30 mA. In the case of the clay
fraction, the scanning was performed from 4o to 20o 2θ. The identification of the peaks was
obtained manually using recommendations and given data of Brindley and Brown (1980).
For the scleroglucan-smectite composite synthesis, the samples were analyzed using a
Philips PW2400 X-ray diffractometer (CuKα; λ = 1.54060 Å) operating at 45 kV and 40 mA.
The scanning for oriented slides was performed from 2o to 20o 2θ , step 0.02o, scanning speed
0.75o/s.
This technique is limited to the study of crystalline phases. Moreover, the minimum 2θ
we can use for the structure study with ordinary XRD instrument is approximately 2 degrees,
because at smaller angles beam divergence and radiation scattering (called Lorentz-
Polarization factor) would greatly influence the result.

30
2.2. X-ray fluorescence
X-ray fluorescence (XRF) is one of the techniques to detect the presence of the chemical
elements in the sample. This technique is particularly used by geologists to study rock
composition: major and minor elements. The technique is not widely used in clay science, due
to the large amounts of sample necessary for the analyses and relatively low precision, but it
is applicable for the bulk mineral chemical analysis.
Each atom has a unique structure, thus the adsorption of an X-ray can cause electron
emission from a specific electron shell. The empty space is then filled by an electron from
upper shell (
Figure 13). This transition creates characteristic X-ray, which is particular for each
transition. Analyzing these emitted x-rays we can determine elements and their amount in each
sample.
Figure 13. Emission of characteristic X-rays (adapted from Amtec Inc.). When an electron
from an upper shell fills an empty space in a lower level, this transition creates characteristic X-rays.
Similarly to the X-ray diffraction setup, the XRF instrument will have the X-ray source
– tube or synchrotron radiation and the detector. Only in this case it is not necessary for the
detector to rotate, because we are interested in the energy of all the emitted X-rays, not the
diffraction phenomena (Figure 14).
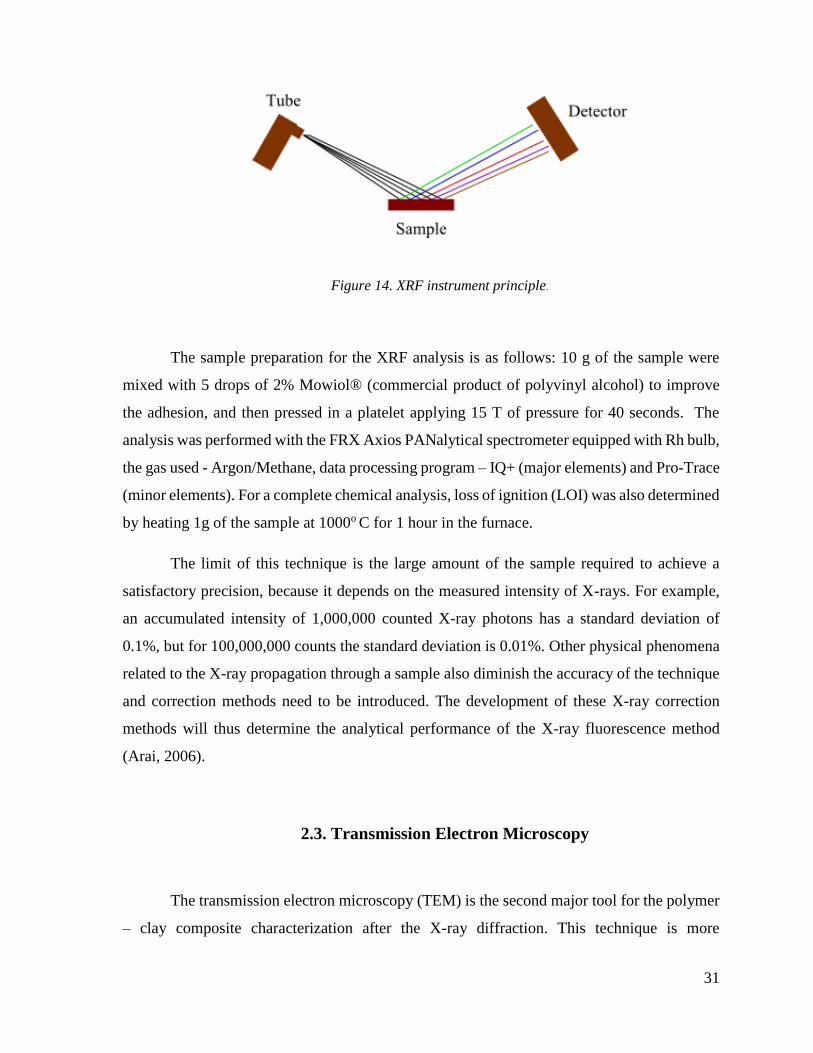
31
Figure 14. XRF instrument principle.
The sample preparation for the XRF analysis is as follows: 10 g of the sample were
mixed with 5 drops of 2% Mowiol® (commercial product of polyvinyl alcohol) to improve
the adhesion, and then pressed in a platelet applying 15 T of pressure for 40 seconds. The
analysis was performed with the FRX Axios PANalytical spectrometer equipped with Rh bulb,
the gas used - Argon/Methane, data processing program – IQ+ (major elements) and Pro-Trace
(minor elements). For a complete chemical analysis, loss of ignition (LOI) was also determined
by heating 1g of the sample at 1000o C for 1 hour in the furnace.
The limit of this technique is the large amount of the sample required to achieve a
satisfactory precision, because it depends on the measured intensity of X-rays. For example,
an accumulated intensity of 1,000,000 counted X-ray photons has a standard deviation of
0.1%, but for 100,000,000 counts the standard deviation is 0.01%. Other physical phenomena
related to the X-ray propagation through a sample also diminish the accuracy of the technique
and correction methods need to be introduced. The development of these X-ray correction
methods will thus determine the analytical performance of the X-ray fluorescence method
(Arai, 2006).
2.3. Transmission Electron Microscopy
The transmission electron microscopy (TEM) is the second major tool for the polymer
– clay composite characterization after the X-ray diffraction. This technique is more
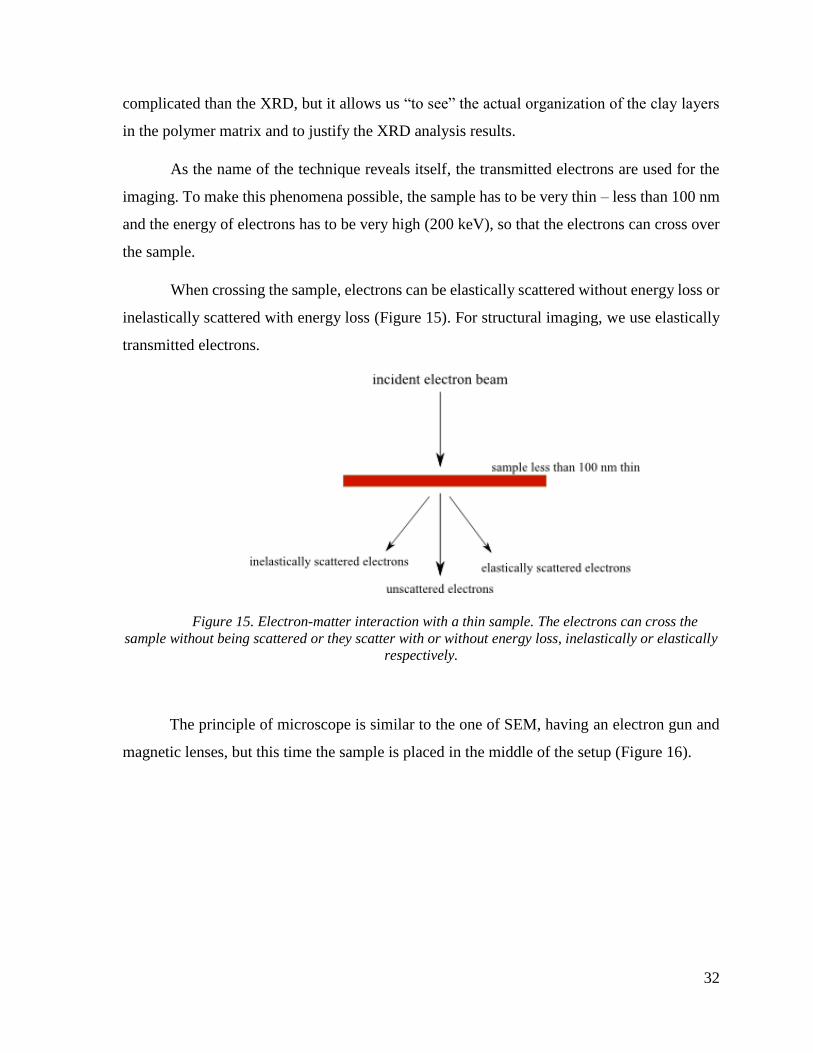
32
complicated than the XRD, but it allows us “to see” the actual organization of the clay layers
in the polymer matrix and to justify the XRD analysis results.
As the name of the technique reveals itself, the transmitted electrons are used for the
imaging. To make this phenomena possible, the sample has to be very thin – less than 100 nm
and the energy of electrons has to be very high (200 keV), so that the electrons can cross over
the sample.
When crossing the sample, electrons can be elastically scattered without energy loss or
inelastically scattered with energy loss (Figure 15). For structural imaging, we use elastically
transmitted electrons.
Figure 15. Electron-matter interaction with a thin sample. The electrons can cross the
sample without being scattered or they scatter with or without energy loss, inelastically or elastically
respectively.
The principle of microscope is similar to the one of SEM, having an electron gun and
magnetic lenses, but this time the sample is placed in the middle of the setup (Figure 16).
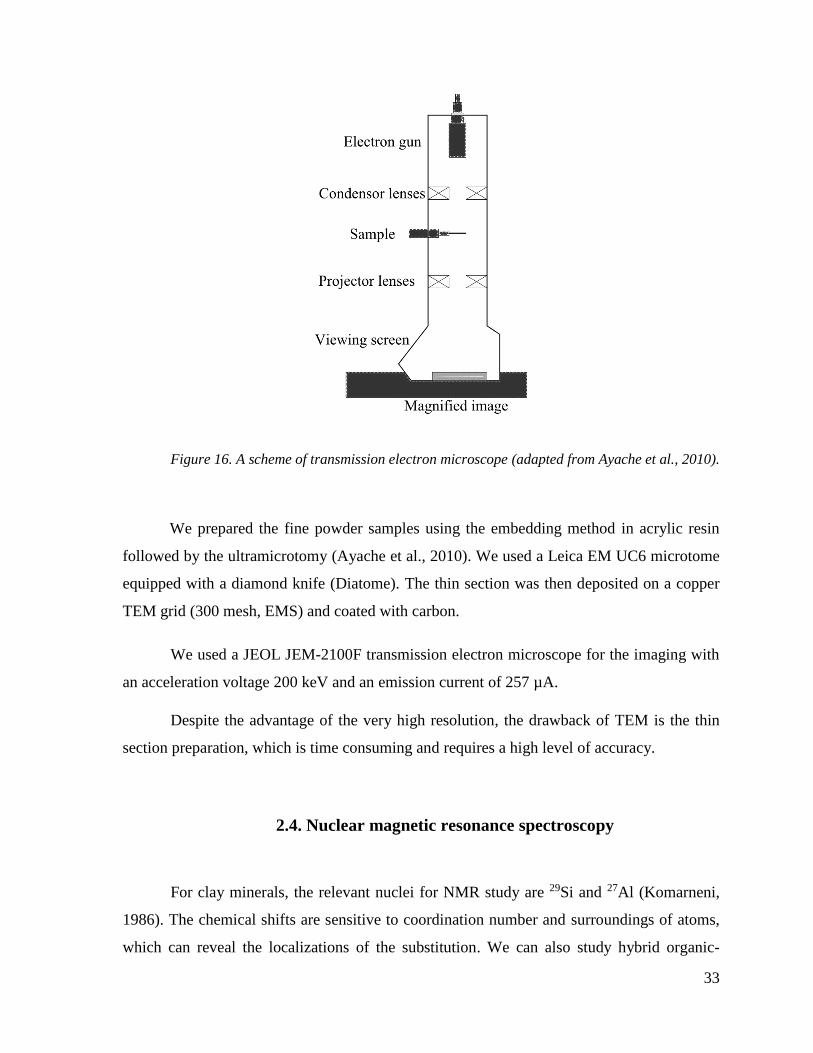
33
Figure 16. A scheme of transmission electron microscope (adapted from Ayache et al., 2010).
We prepared the fine powder samples using the embedding method in acrylic resin
followed by the ultramicrotomy (Ayache et al., 2010). We used a Leica EM UC6 microtome
equipped with a diamond knife (Diatome). The thin section was then deposited on a copper
TEM grid (300 mesh, EMS) and coated with carbon.
We used a JEOL JEM-2100F transmission electron microscope for the imaging with
an acceleration voltage 200 keV and an emission current of 257 µA.
Despite the advantage of the very high resolution, the drawback of TEM is the thin
section preparation, which is time consuming and requires a high level of accuracy.
2.4. Nuclear magnetic resonance spectroscopy
For clay minerals, the relevant nuclei for NMR study are 29Si and 27Al (Komarneni,
1986). The chemical shifts are sensitive to coordination number and surroundings of atoms,
which can reveal the localizations of the substitution. We can also study hybrid organic-

34
inorganic materials (intercalated or grafted) and polymer-clay nanocomposites. In this case,
13C and 1H nuclei are also important providing the information about polymer organization in
between clay layers (Zhang et al., 2010). 129Xe NMR can be applied for the study of porosity
(Keenan et al., 2013). It has to be noted that paramagnetic Fe3+ can give magnetic perturbation
of neighboring atoms (Sanz, 2006).
Generally, NMR is a technique to probe magnetic environment around the nucleus.
Since the nucleus is spinning, it creates a magnetic field, which can be quantified. When an
external magnetic field B0 is applied, the angular momentum is split in several energetic levels,
accordingly to its quantum number (Zeeman interaction). The energy difference between these
levels is called Larmor frequency. It is the energy which is necessary to induce the transition
between energy states and is of magnitude of radio waves (Figure 17).
Figure 17. Spin I=1/2 nucleus in magnetic field is split in two energetic levels
(Zeeman interaction). The energy difference ΔE between these two levels can be expressed as
a Larmor frequency υ. γ is gyromagnetic ratio, ħ=h/2π and Bo is the applied external
magnetic field.
Inducing the transition between the energy states with short pulse of radio frequency
applied perpendicularly to B0, the angular momentum is out of the equilibrium and needs time
to return to its initial state. This signal is called free induction decay and the Fourier transform
of it is the NMR spectrum (Figure 18).

35
Figure 18. Schematic representation of the three stages of a simple NMR experiment
(adapted from MacKenzie & Smith, 2002). The sample is placed in a strong magnetic field
(A). Then a short pulse of radio frequency is applied, which shifts the angular momentum out
of its equilibrium (B).Finally, FTIR of free induction decay signal is recorded (C).
The position of each peak (chemical shift) is given in ppm in relation to the spectra of
standards: tetramethylsilane (TMS) for 29Si NMR and a solution of aluminium chloride for
27Al NMR.
For example, in montmorillonite, there is one type of Si atom, which will give a single
peak in 29Si NMR spectrum. If the nucleus is abundant in nature like 1H, then other effects as
J-coupling and dipolar coupling will influence the spectrum. For nuclei with spin I>1/2, a
quadrupolar effect is present (Jacobsen, 2007).
In the case of liquids, the resolution of the spectrum is high, because of the rapid
random tumbling of molecules, which is not the case in solid state, where all orientations of
crystallites are represented, thus giving a broad band, which is characterized by a chemical
shift anisotropy and shape of the line. This effect can be reduced by spinning the sample at a
magic angle of 54.7˚. If the spinning frequency is high enough, spinning side bands disappear
and we obtain sharp single peaks in NMR spectrum. The field strength also has an effect on
spinning sidebands. The resolution can be improved by heteronuclear decoupling and cross-
polarization (CP), proper Hartman-Hahn match, dipolar dephasing, combined rotation and
multiple phase decoupling (CRAMPS) or even double angle rotation (DOR) and multi
quantum magic angle spinning (MQMAS) in the case of quadrupolar nuclei (MacKenzie &
Smith, 2002).

36
We used a Bruker AVANCE 200 III spectrometer at 50 MHz for solid state NMR
spectroscopy. CP and MAS were applied for 13C NMR, where proton 90π pulse was 3,7 μs
and contact time 10 ms, spinning rate of 2 kHz.
2.5. Thermogravimetric analysis
In clay science, thermal analysis is applied for clay mineral structure analysis (Earnest,
1988), intercalated compounds study and for thermal stability estimation of clay-polymer
nanocomposites. For clay minerals, two main processes occur while heating – desorption of
water and dehydroxylation. At higher temperatures, the formation of new phases may happen
as well, e.g. the transition from kaolin to metakaolin, spinel and mullite. All these changes
occur at specific temperature range for each clay mineral, due to their different structure.
Therefore, TGA curve of each clay specimen will be characteristic.
Thermal analysis gives information about changes occurring in the sample, when it is
subjected to a programmed range of temperatures (Dollimore, 2006). If the change of mass is
measured, then it is called thermogravimetric analysis (TGA). If it is the change of heat flow,
then it is called differential scanning calorimetry (DSC). If it is the variance of temperature,
then the name is differential thermal analysis (DTA). For some instruments TGA and DSC can
be measured simultaneously. It is also possible to study other physical or chemical properties
of the sample, e.g. deformation or sound, by different thermal methods (Haines, 2002).
The general scheme of a thermal analysis apparatus is represented in Figure 19.
Figure 19. Scheme of general TGA apparatus (adapted from Sánchez-Jiménez et al.,
2011).
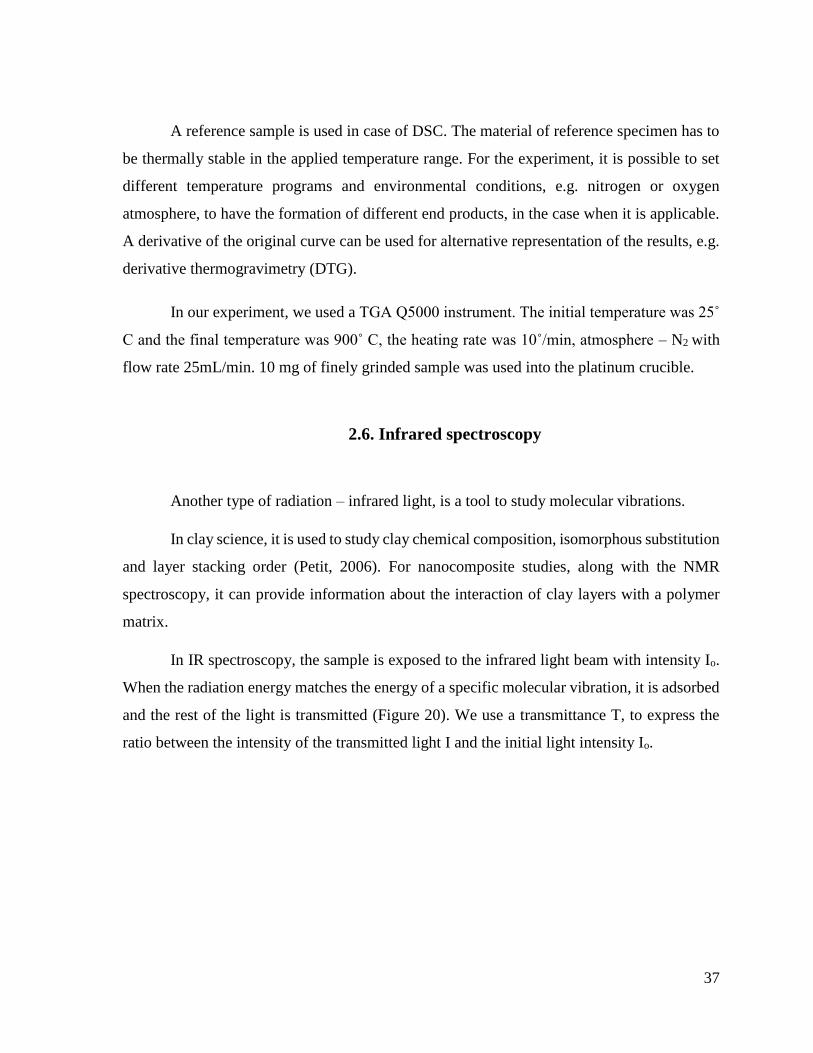
37
A reference sample is used in case of DSC. The material of reference specimen has to
be thermally stable in the applied temperature range. For the experiment, it is possible to set
different temperature programs and environmental conditions, e.g. nitrogen or oxygen
atmosphere, to have the formation of different end products, in the case when it is applicable.
A derivative of the original curve can be used for alternative representation of the results, e.g.
derivative thermogravimetry (DTG).
In our experiment, we used a TGA Q5000 instrument. The initial temperature was 25˚
C and the final temperature was 900˚ C, the heating rate was 10˚/min, atmosphere – N2 with
flow rate 25mL/min. 10 mg of finely grinded sample was used into the platinum crucible.
2.6. Infrared spectroscopy
Another type of radiation – infrared light, is a tool to study molecular vibrations.
In clay science, it is used to study clay chemical composition, isomorphous substitution
and layer stacking order (Petit, 2006). For nanocomposite studies, along with the NMR
spectroscopy, it can provide information about the interaction of clay layers with a polymer
matrix.
In IR spectroscopy, the sample is exposed to the infrared light beam with intensity Io.
When the radiation energy matches the energy of a specific molecular vibration, it is adsorbed
and the rest of the light is transmitted (Figure 20). We use a transmittance T, to express the
ratio between the intensity of the transmitted light I and the initial light intensity Io.
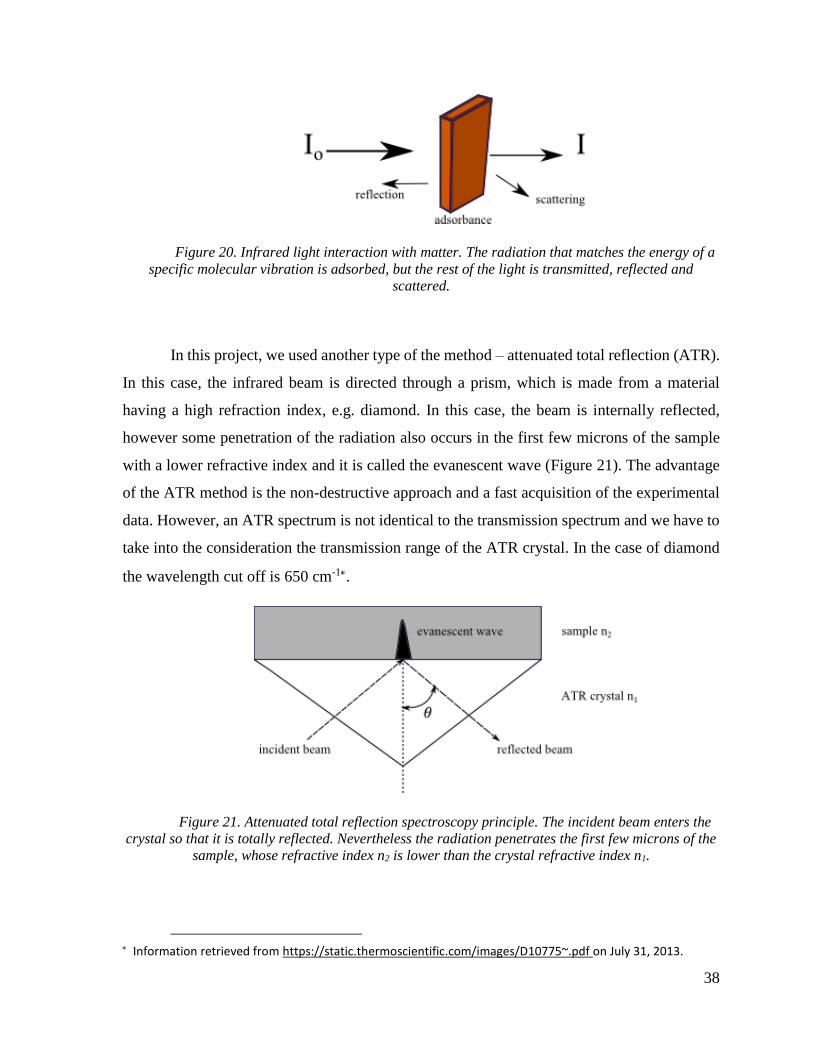
38
Figure 20. Infrared light interaction with matter. The radiation that matches the energy of a
specific molecular vibration is adsorbed, but the rest of the light is transmitted, reflected and
scattered.
In this project, we used another type of the method – attenuated total reflection (ATR).
In this case, the infrared beam is directed through a prism, which is made from a material
having a high refraction index, e.g. diamond. In this case, the beam is internally reflected,
however some penetration of the radiation also occurs in the first few microns of the sample
with a lower refractive index and it is called the evanescent wave (Figure 21). The advantage
of the ATR method is the non-destructive approach and a fast acquisition of the experimental
data. However, an ATR spectrum is not identical to the transmission spectrum and we have to
take into the consideration the transmission range of the ATR crystal. In the case of diamond
the wavelength cut off is 650 cm-1.
Figure 21. Attenuated total reflection spectroscopy principle. The incident beam enters the
crystal so that it is totally reflected. Nevertheless the radiation penetrates the first few microns of the
sample, whose refractive index n2 is lower than the crystal refractive index n1.
Information retrieved from https://static.thermoscientific.com/images/D10775~.pdf on July 31, 2013.

39
The spectra were acquired using a Nicolet 6700 FT-IR instrument with Smart iTR
accessory. The range of the wavelength was from 600 to 4000 cm-1. The background was taken
before every sample measurement.
2.7. Cation exchange capacity
The cation exchange capacity (CEC) is an important clay property which influences
geochemical cycling of cations in soils, their ability to swell and exchange cations. It can be
defined as the quantity of cations available for the exchange at a given pH (Bergaya et al.,
2006) or, more precisely, the total quantity of monocations which can be sorbed by functional
groups located on the “gibbsite” sheet, on the edges of the particles and in the interlayers
(Tertre, E. et al., 2009). 1:1 type clay minerals (e.g., kaolinite, serpentine) have low CEC,
because the adsorption occurs only on the edges, while for 2:1 type clay minerals, depending
on substitution in the structure, CEC have values varying from 20 to 150 meq/100g. There are
several methods for CEC determination – structural CEC calculation from chemical formula,
exchange with protons, organic cations, ammonium acetate, strontium chloride and cesium
chloride (Meunier, 2007).
For the determination of the exchangeable cations, we adapted ammonium acetate
method described by C.S.F. Gomes (1988). The exchangeable cations (Na+, K+, Mg2+ and
Ca2+) were determined with the atomic adsorption spectrophotometer.
The CEC is expressed as the sum of analyzed ions concentrations and reported as
meq/100g. It has to be noted that such CEC represents only the most common exchangeable
ions (Na+, K+, Mg2+ and Ca2+), thus the real value could be higher, because other exchangeable
cations were not analyzed.
2.8. Mechanical tests
Two mechanical properties are important for the evaluation of clay mineral possible
applications: its plasticity and abrasion.
40
2.8.1. Plasticity
The plasticity is an important clay mechanical property for geotechnical studies,
because it will determine the stability of soils. It is also important for any industry processing
clay containing materials, because it will influence the particular aspects of material treatment
such as fluidity and drying.
Plasticity is characterized by Atterberg limits which are plastic, liquid and shrinkage
limits. In our experiment we did not determine shrinkage limit, because it has more application
in technology than in geology. The test was performed accordingly to ISO/TS 17892-12 2004
“Geotechnical investigation and testing — Laboratory testing of soil — Part 12: Determination
of Atterberg limits”.
Liquid limit (LL)
Liquid limit is the water content at which a soil changes from a liquid to a plastic state.
Liquid limit (LL) was determined with "Fall Cone Test" using 80 g/ 30o cone. Other method
of determining LL is the Cassagrande test, but accordingly to the standard “experience has
shown that the results are subject to the performance and judgment of the operator”, thus fall
cone test method is preferred.
Plastic limit (PL)
The plastic limit in the standard is defined as the lowest water content, when the
material is still plastic. It was determined by rolling 10 cm long and 3 mm thick rod on a glass
plate.
The water content in both experiments was determined accordingly to ISO/TS 17892-
1 2004 “Geotechnical investigation and testing — Laboratory testing of soil — Part 1:
Determination of water content” (Eq.2).

41
𝑤 =𝑚1−𝑚2
𝑚2−𝑚𝑐∙ 100 =
𝑚𝑤
𝑚𝑑∙ 100 % Eq. 2
where w (%) is the water (moisture) content, m1 (g) is the mass of container and moist
test specimen, m2 (g) is the mass of container and dried test specimen, mc (g) is the mass of
container, mw (g) is the mass of water, and md (g) is the mass of dried test specimen.
The difference between liquid limit and plastic limit is expressed as plasticity index:
PI=LL-PL.
2.8.2. Abrasion
Einlehner Abrasion Test enables us to characterize the clay “roughness”. This technique
is widely used in paper industry to estimate the kaolin impact on paper slurry abrasiveness
(Neubold, 1982). This property is also important for materials which could be applied as
peloids on the skin.
To perform this test, we used the Apparatus Einlehner AT-1000 (Figure 22). 50 grams
of a dry clay sample was dispersed in 500 ml of distilled water with the ultrasound, then
immediately put in the apparatus and stirred for 174 000 revolutions. Abrasion index is
expressed as a weight difference mf of the bronze net after and mi before the test in grams over
the net area (Eq.3). If the net is broken, then the test is repeated with fewer rotations until the
net stays not damaged until the end of the test and the result is extrapolated for 174 000
revolutions.
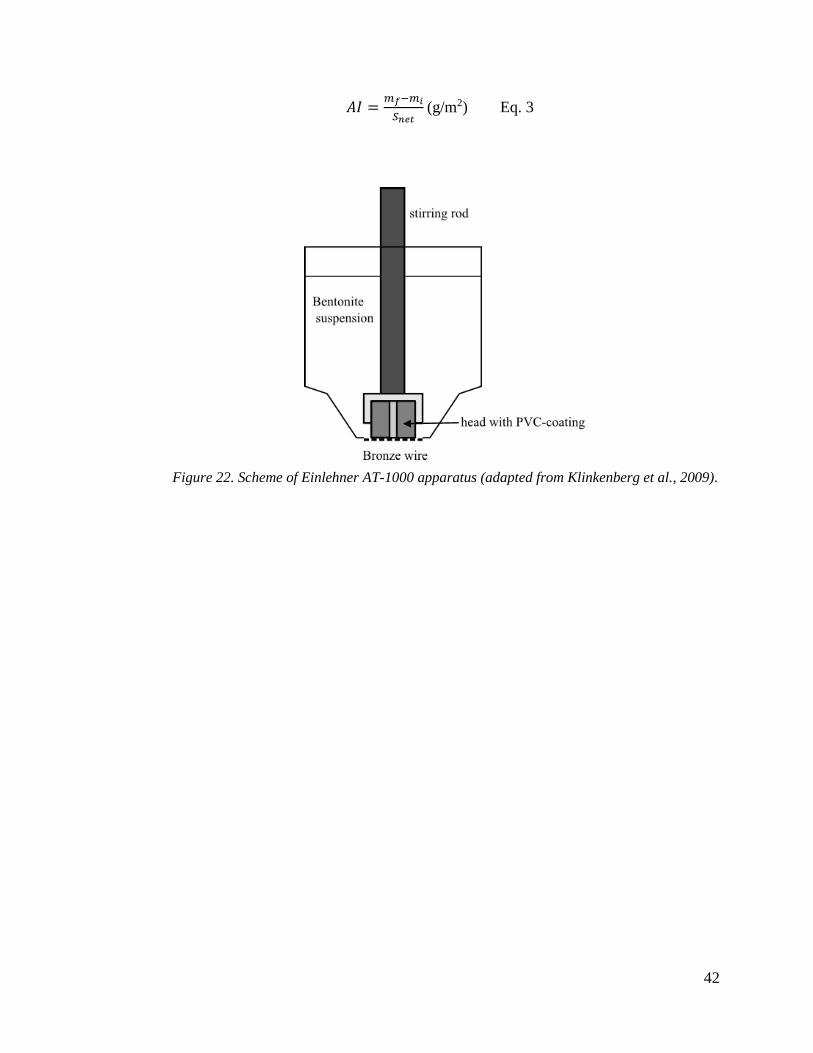
42
𝐴𝐼 =𝑚𝑓−𝑚𝑖
𝑆𝑛𝑒𝑡 (g/m2) Eq. 3
Figure 22. Scheme of Einlehner AT-1000 apparatus (adapted from Klinkenberg et al., 2009).
43
CHAPTER 3
CHARACTERIZATION OF PORTO SANTO BENTONITE
In this chapter, we will present the part of the master thesis project about Porto Santo
bentonite, which was done in the University of Aveiro, Portugal. At the beginning, we will
give an insight in the fieldtrip to the island, which is followed by the description of the
experimental procedures. We will continue then with a discussion of the results and a
summary.
3.1. General Characterization of Porto Santo Island and a fieldtrip
3.1.1. Geographical location
Porto Santo is an island in the Madeira archipelago in the Atlantic Ocean, situated
approximately 900 km southwest of Portugal and 700 km west of the coast of Morocco (Figure
23), between Azores and Canary archipelagos, from 33º 00’ N to 33º 07’ N and from 16º 17’
W to 16º 25’ W. The Madeira archipelago consists of the island of Madeira, island of Porto
Santo and two groups of smaller islands Desertas (3 islands) and Selvagens (3 islands). The
two largest islands – Madeira and Porto Santo are inhabited, but the smallest ones are
uninhabited and are natural reserves. The surface area of Porto Santo is 40,70 km2 (Rocha et
al., 2002).

44
Figure 23. Location of Madeira archipelago (top) and Porto Santo Island (bottom). (Google
Maps, 2013)
3.1.2. Climate
The Madeira archipelago corresponds to the Csa type climate after Köppen-Geiger
classification (Kottek et al., 2006) with mild climate and warm and dry summer. The average
air temperature varies between 16 oC in February and 24 oC in August and September. The sea
water temperature is between 18 oC in February and 24 oC in October. The average monthly
precipitation is from 1.6 mm in July to 115.0 mm in December. This meteorological data given
by Instituto de Meteorologia, IP Portugal for Funchal (main city of Madeira archipelago) for
1981-2010 is very similar to the one presented in the book of Gomes and Silva (2012) from
Meteorological station of Porto Santo’s airport for the period 1961-1990.
45
3.1.3. Geology
All islands in the Madeira archipelago have a volcanic origin, including Porto Santo,
which consists of volcanic and sedimentary rocks. The formation of the island started in the
Miocene, 18 million years ago. The volcanic rocks can be divided into two groups “basalts
and andesites” and “trachytes and rhyolites”. The sedimentary formations, most probably from
Quaternary, are represented by aeolionite calcareous, silt-clay paleosol, beach deposits,
calcareous crusts, fluvial deposits and slope deposits. According to the fauna found in the
bentonite deposits, it can be concluded that the formation of this mineral occurred in shallow
marine waters with constant temperature and water composition (Rocha et al., 2002).
3.1.4. Fieldtrip to Porto Santo Island
The previous studies of the Porto Santo bentonite sample, which were done by the
author in early 2012, indicated a low content of clay fraction, therefore we went for a fieldtrip
to collect more bentonite deposit samples from various locations on the island in order to find
a most suitable ore for the further nanocomposite synthesis.
The sampling was done on December 4, 2012 in five different sites on the island
(Figure 24). In four of them (I, II, IV and V), we collected the clay rich samples for this project.
The sampling sites I, IV and V are located on the northern part of the Island, which have mainly
basic rocks. The site II is in the middle part of the Island, which consists of calcinated sand
deposits, having an underlaying clay layer.

46
Figure 24. Sampling sites on Porto Santo Island. In four of them (I, II, IV and V) we collected
the clay rich samples for this project. The sampling sites I, IV and V are located on the northern part
of the Island, but the site II is in the middle part of the Island.
Figure 25 represents a general look of one of the sampling sites - Serra de Dentro.
Other sampling sites and the exact location of the samples are given in the Appendix. The
coordinates of the sampling sites are given in Table 2.
Table 2. Coordinates of sampling sites on Porto Santo Island.
Sampling site Coordinates Altitude, m above sea level
I Serra de Dentro 16.3077 W
33.0810 N 129 m
II Fonte de Areia 16.3564 W
33.0861 N 123 m
III Ponta 16.3775 W
33.0253 N not available
IV Capela Nossa Senhora
Graça
16.3241 W
33.0711 N 123 m
V Serra de Fora 16.3083 W
33.0690 N 65 m
V
I
II
IV
III

47
Figure 25. General look of sampling site I, Serra de Dentro. Five samples from the different
locations were collected from this deposit.
Approximately 1 to 1.5 kg of each sample was collected. The samples were sealed in
plastic bags and transported to the laboratory for further analysis and processing.
3.2. Experimental procedures
In this paragraph we describe the procedures used for Porto Santo bentonite initial
sample preparation, purification and clay fraction extraction.
3.2.1. Sample preparation
Collected samples from the field were dried at 60˚ C until they reached a constant
weight indicating a removal of moisture. Afterwards, wet sieving was performed in order to
1
2 3
4,5

48
separate the fraction less than 63μm, which was further used for the characterization and a clay
fraction extraction. The 63μm size is of interest to geologists, because it contains the
information not only about the clay minerals, which are mostly concentrated in the less than 2
μm fraction, but also about the other components, which can indicate some complementary
information about the clay deposit. To obtain the fraction less than 2 µm useful for
nanocomposite synthesis, a purification procedure is needed.
3.2.2. Clay purification
A further clay purification was done following the procedure described by Carrado et al.
(2006), without the chemical treatment to remove carbonates and organic matter. The clay
fraction was obtained using sedimentation according to the Stokes law, which is ’’a
mathematical equation that expresses the settling velocities of small spherical particles in a
fluid medium” (Encyclopaedia Britannica). The time for the particle settling is calculated using
equation 4 derived from the Stokes law:
t =18∙η∙h
g∙D2∙(ρp−ρf) Eq. 4
where: t (s) is time,h (m) is the height of water column, g (m/s2) is the gravitational
acceleration, D (m) is the equivalent spherical diameter, ρp (kg/m3) is the mass density of
particle, ρf (kg/m3) is the mass density of fluid, and η (kg/m·s) is the dynamic viscosity.
Distilled water was used as a fluid, g = 9.80665 m/s2, h = 0.10 m or 0.20 m and ρp=2650
kg/m3 (quartz).
Nevertheless, one should take into account that the Stokes law has several assumptions:
particles are spherical and the movement is free. The clay particles are not completely spherical
and they possess an electrical charge, which induce attractive and repulsive forces into the
system, thus the movement is not completely free.
Figure 26 illustrates the cylinders we used, specifically adapted for the clay
sedimentation. 20 grams of the dried material grind to less than 63μm were suspended in 700
ml of distilled water using ultra-sound for 60 s. It was left still for 10 min to see if the

49
flocculation occured. In such case, an antiflocculant (e.g. 1% solution of sodium
hexametaphosphate) has to be added. Then, samples were suspended again using an ultra-
sound for 30 s and passed immediately to the cylinders. The suspension containing < 2 μm
particles was collected after 7 hours and put in the oven to dry at 50o C. The procedure was
performed until the water became clean or the necessary amount of the less than 2μm fraction
was obtained. The dried sample was ground in an agate mortar and stored for future analysis.
Figure 26. Cylinders used for the sedimentation.
Other possible methods for the clay fraction separation is the centrifugation, where the
suspension is put in the centrifuge at a certain rotation speed (LeRoy and Marion, 1958). We
did not apply this method, because of the requirement of a large amount of sample for the
analysis, which is complicated to obtain by this method.
After the initial treatment, the minerals are now ready for a more detailed study about
their composition and properties.
10 cm

50
3.3. Results of the Porto Santo bentonite characterization
Mineralogical, chemical and technological properties were determined for nine
different clay samples labeled PSB 1 to PSB 9 from four different locations on the Porto Santo
Island.
3.3.1. Mineralogical composition
An example of fine fraction (<63µm) powder XRD pattern of sample PSB1 is given in
Figure 27. For convenience, the whole data is summarized in Table 3.
Figure 27. Powder XRD pattern of Porto Santo bentonite (sample PSB1). It reveals the
presence of phyllosilicates, feldspars, anatase, calcite and iron rich minerals.
We found that all the samples contained phyllosilicates, feldspars, calcite and iron rich
minerals. All, except PSB 8, were found to also contain anatase. In two samples – PSB 6 and
PSB 7 we detected quartz. A small amount of bassanite was detected in samples PSB 2 and
PSB 7, which could have been originally the gypsum, but transformed due to the initial drying
of the samples to the bassanite.
0
50
100
150
200
250
300
350
400
4 14 24 34 44 54 64
Inte
nsi
ty (
a.u
.)
2Ɵ (degrees)
Sm
ecti
te
Phyll
osi
lica
tes
Pla
gio
clas
e F
eldsp
ars
Phyll
osi
lica
tes
Anat
ase
Pla
gio
clas
e
Mag
net
ite-
mag
hem
ite
Phyll
osi
lica
tes
Phyll
osi
lica
tes
Cal
cite
P
lagio
clas
e F
eldsp
ars
Anat
ase
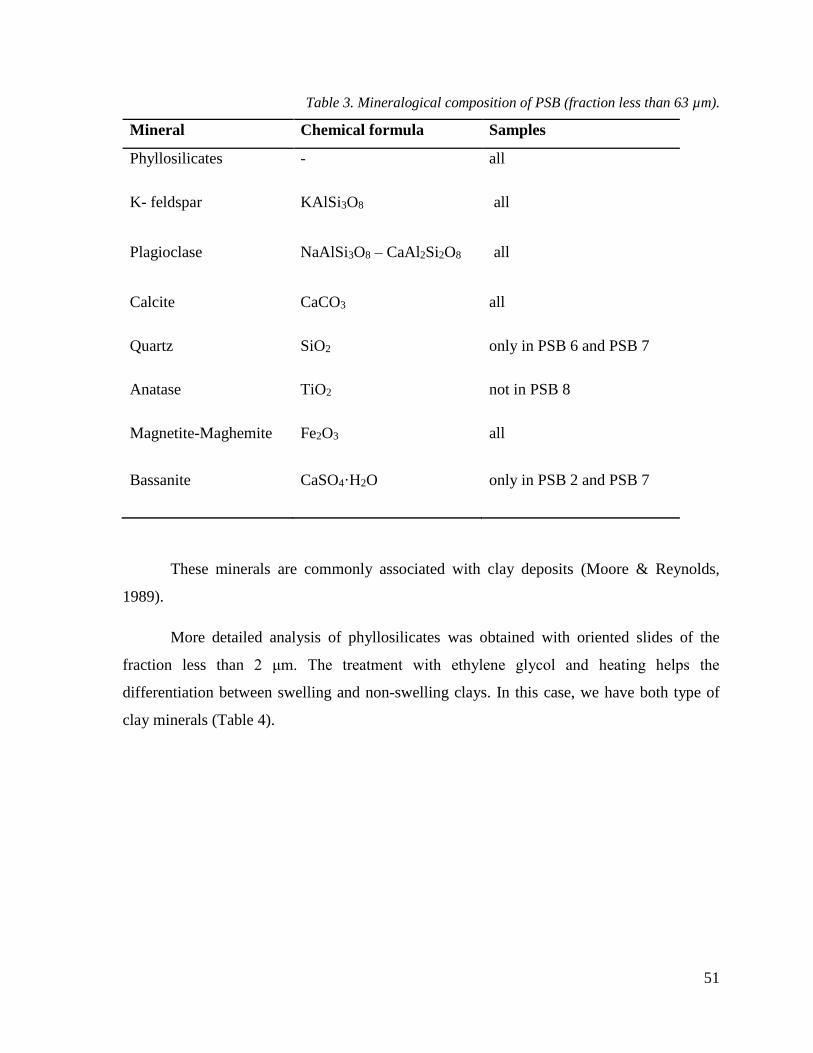
51
Table 3. Mineralogical composition of PSB (fraction less than 63 µm).
Mineral Chemical formula Samples
Phyllosilicates - all
K- feldspar KAlSi3O8 all
Plagioclase NaAlSi3O8 – CaAl2Si2O8 all
Calcite CaCO3 all
Quartz SiO2 only in PSB 6 and PSB 7
Anatase TiO2 not in PSB 8
Magnetite-Maghemite Fe2O3 all
Bassanite CaSO4·H2O only in PSB 2 and PSB 7
These minerals are commonly associated with clay deposits (Moore & Reynolds,
1989).
More detailed analysis of phyllosilicates was obtained with oriented slides of the
fraction less than 2 μm. The treatment with ethylene glycol and heating helps the
differentiation between swelling and non-swelling clays. In this case, we have both type of
clay minerals (Table 4).

52
Table 4. (001) peak position for the oriented slides of PSB samples (fraction less than 2 µm).
d(001), Å
As prepared Treated with EG Heated at 500˚C
PSB 1 12.9 18.5 10.0
PSB 2 12.7 19.0 10.2
PSB 3 13.0 18.4 10.2
PSB 4 12.8 19.5 10.3
PSB 5 12.4 18.8 9.9
PSB 6
10.0 10.4 10.4
7.2 7.3 no peak detected
PSB 7
10.1 no peak detected 10.2
7.1 no peak detected no peak detected
6.5 no peak detected no peak detected
PSB 8 12.3 18.8 -
PSB 9 13.1 18.7 9.9
All samples, except PSB 6 and PSB 7, have (001) reflection around 12-13 Å, which
shifts to 18-19 Å, when reacting with ethylene glycol (EG) and decrease to approximately 10
Å, when heated. Such d001 value and behavior are characteristic for smectite clays (Brindley
& Brown, 1982). In the case of samples PSB 6 and PSB 7, the d-spacing of 10 Å is
characteristic to mica or illite and the one at 7 Å to kaolinite. These were also the only two
samples where we detected the presence of quartz.
We have mentioned previously that the island has a volcanic origin, which means that
the weathering has a tendency to proceed faster and the smectites thus form easily over the
basic rocks under temperate-warm climate (Chamley, 1989). Also, such conditions as shallow

53
marine waters with constant temperature and water composition favor the formation of
smectites (Rocha et al., 2002).
The two samples PSB 6 and PSB 7 from the Fonte de Areia could be the weathering
product of an acidic primary rock such as rhyolites. Under favorable conditions of high rainfall
and rapid drainage, these rocks weather readily to kaolinite and quartz, which was also detected
in the two samples (Murray, 1988).
Keeping in mind that the objective of the master thesis is to synthesize novel
biopolymer-clay composite materials, samples PSB 6 and PSB 7 would not be useful, because
they contain two different non-swelling types of clay minerals.
3.3.2. Chemical composition
To complement the mineralogical information of the less than 63 µm fraction, we
performed the chemical analysis of all the samples using X-ray fluorescence spectroscopy. For
clarity, major and minor elements are discussed separately.
Major elements
These results are in an agreement with the mineralogical data (Figure 28). The high
content of SiO2 50% - 60% corresponds to the feldspars, quartz and phyllosilicates in the
samples. Al2O3 (18% - 12%) accounts for feldspars and phyllosilicates. Magnesium is found
in the structure of phyllosilicates (octahedral sheet and interlayer space). The CaO origin is
mainly from feldspars and calcite. Ca can also be found in the interlayer of phyllosilicates. The
presence of K and Na is related to the feldspars and the phylloslicates. The Fe content (8-10%)
represents maghnetite-maghemite iron rich minerals; it could also be in the structure of
phyllosilicates, as Al substitute in the octahedral sheet. TiO2 (2%) comes from the anatase.
P2O5, SO3 and Cl together with other gases represented by the loss of ignition (LOI) comprise
the anionic part of the minerals.
The two samples, which we already identified to be different (PSB 6 and PSB 7) show
higher amount of K2O (close to 3%), compared to the other samples (less than 1%). It can be

54
explained that K feldspar dominates over plagioclase in these samples or other possible
location of K is the interlayer space of illite and micas.
Figure 28. Chemical composition of PSB (fraction less than 63 µm).The two samples PSB 6
and PSB 7 differ from other samples with higher content of K2O.
Minor elements
The minor element analysis is complementary information, which can help
understanding clay mineral genesis. It is also used, when the targeted application of clay
minerals and their materials is in cosmetics or pharmaceuticals (Gomes & Silva, 2007)
Although there is still discussion between available or accessible elements for the human body
and few approaches have been elaborated for such study (Alloway, 2013), this analysis can
give us some information about the presence of trace elements in clay minerals.
Mostly, each element concentration is similar among the samples, except the Mn
content which varies greatly among the samples from 223 up to 2098 ppm (Table 5). The
lowest Mn content is for the samples which were collected in the rainwater flow bed (PSB 3
and PSB 8), while samples having higher altitude (PSB 1 and PSB 4) contain larger Mn
amount. All of the samples with high Mn were collected at Serra de Dentro sampling site I. If
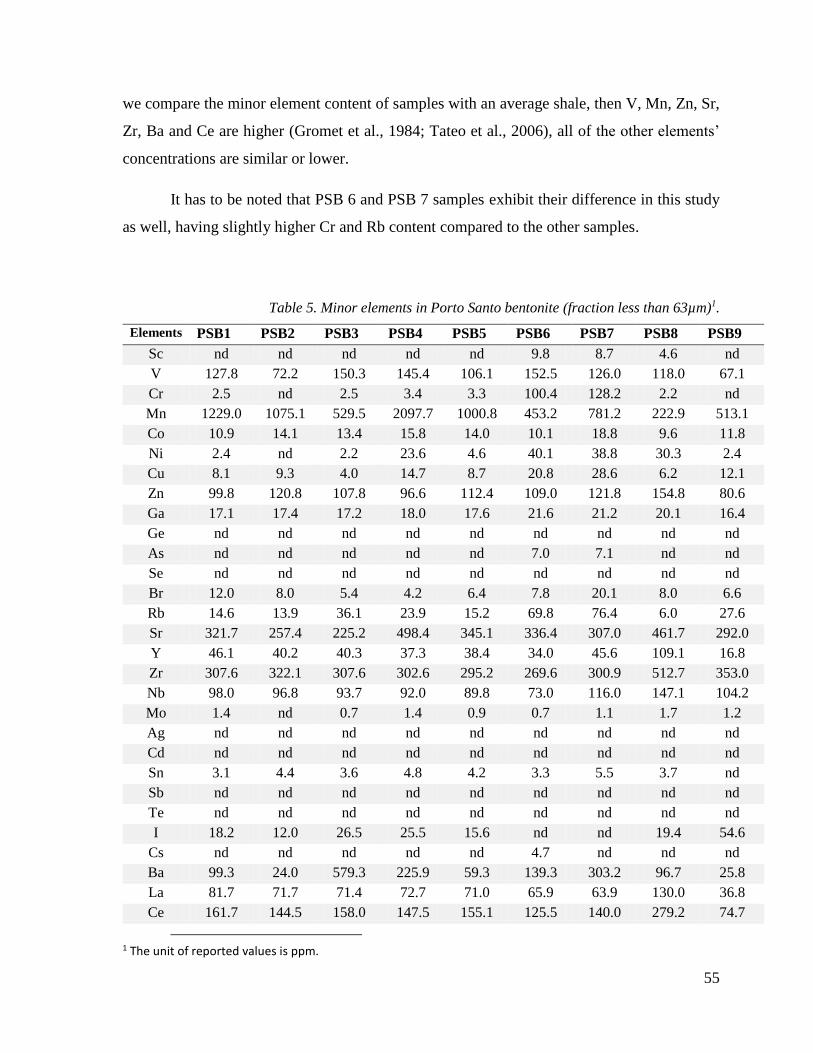
55
we compare the minor element content of samples with an average shale, then V, Mn, Zn, Sr,
Zr, Ba and Ce are higher (Gromet et al., 1984; Tateo et al., 2006), all of the other elements’
concentrations are similar or lower.
It has to be noted that PSB 6 and PSB 7 samples exhibit their difference in this study
as well, having slightly higher Cr and Rb content compared to the other samples.
Table 5. Minor elements in Porto Santo bentonite (fraction less than 63µm)1.
Elements PSB1 PSB2 PSB3 PSB4 PSB5 PSB6 PSB7 PSB8 PSB9
Sc nd nd nd nd nd 9.8 8.7 4.6 nd
V 127.8 72.2 150.3 145.4 106.1 152.5 126.0 118.0 67.1
Cr 2.5 nd 2.5 3.4 3.3 100.4 128.2 2.2 nd
Mn 1229.0 1075.1 529.5 2097.7 1000.8 453.2 781.2 222.9 513.1
Co 10.9 14.1 13.4 15.8 14.0 10.1 18.8 9.6 11.8
Ni 2.4 nd 2.2 23.6 4.6 40.1 38.8 30.3 2.4
Cu 8.1 9.3 4.0 14.7 8.7 20.8 28.6 6.2 12.1
Zn 99.8 120.8 107.8 96.6 112.4 109.0 121.8 154.8 80.6
Ga 17.1 17.4 17.2 18.0 17.6 21.6 21.2 20.1 16.4
Ge nd nd nd nd nd nd nd nd nd
As nd nd nd nd nd 7.0 7.1 nd nd
Se nd nd nd nd nd nd nd nd nd
Br 12.0 8.0 5.4 4.2 6.4 7.8 20.1 8.0 6.6
Rb 14.6 13.9 36.1 23.9 15.2 69.8 76.4 6.0 27.6
Sr 321.7 257.4 225.2 498.4 345.1 336.4 307.0 461.7 292.0
Y 46.1 40.2 40.3 37.3 38.4 34.0 45.6 109.1 16.8
Zr 307.6 322.1 307.6 302.6 295.2 269.6 300.9 512.7 353.0
Nb 98.0 96.8 93.7 92.0 89.8 73.0 116.0 147.1 104.2
Mo 1.4 nd 0.7 1.4 0.9 0.7 1.1 1.7 1.2
Ag nd nd nd nd nd nd nd nd nd
Cd nd nd nd nd nd nd nd nd nd
Sn 3.1 4.4 3.6 4.8 4.2 3.3 5.5 3.7 nd
Sb nd nd nd nd nd nd nd nd nd
Te nd nd nd nd nd nd nd nd nd
I 18.2 12.0 26.5 25.5 15.6 nd nd 19.4 54.6
Cs nd nd nd nd nd 4.7 nd nd nd
Ba 99.3 24.0 579.3 225.9 59.3 139.3 303.2 96.7 25.8
La 81.7 71.7 71.4 72.7 71.0 65.9 63.9 130.0 36.8
Ce 161.7 144.5 158.0 147.5 155.1 125.5 140.0 279.2 74.7
1 The unit of reported values is ppm.
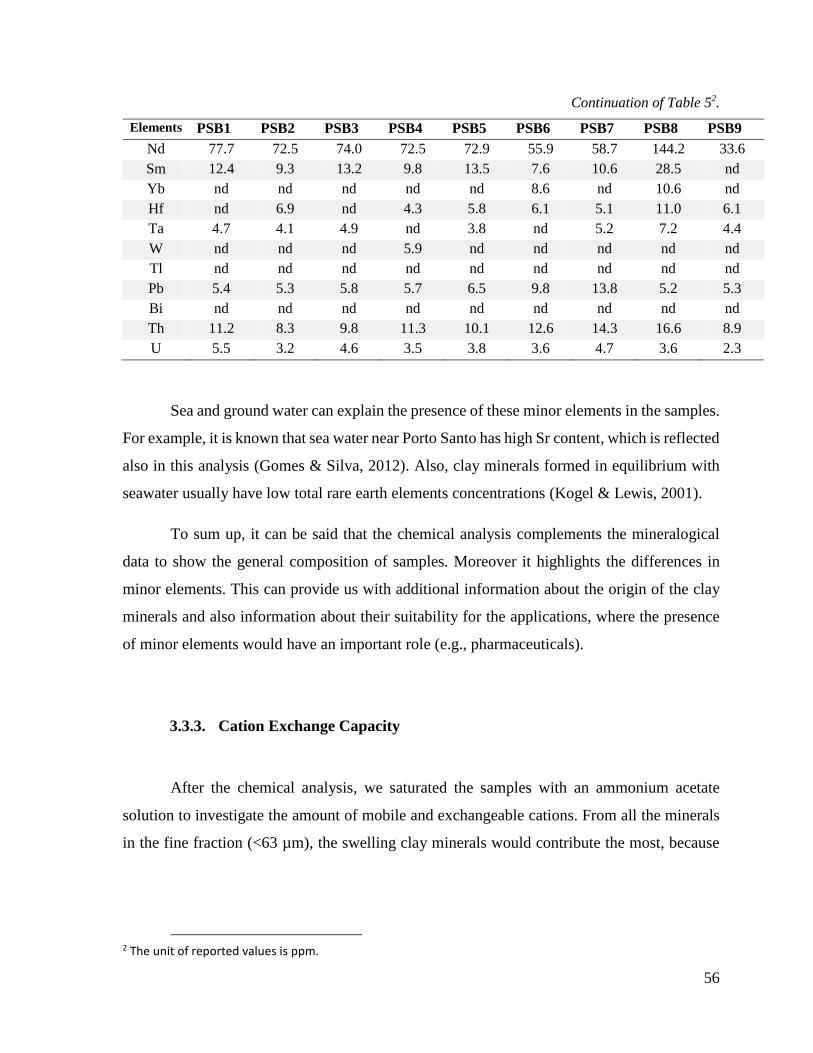
56
Continuation of Table 52.
Elements PSB1 PSB2 PSB3 PSB4 PSB5 PSB6 PSB7 PSB8 PSB9
Nd 77.7 72.5 74.0 72.5 72.9 55.9 58.7 144.2 33.6
Sm 12.4 9.3 13.2 9.8 13.5 7.6 10.6 28.5 nd
Yb nd nd nd nd nd 8.6 nd 10.6 nd
Hf nd 6.9 nd 4.3 5.8 6.1 5.1 11.0 6.1
Ta 4.7 4.1 4.9 nd 3.8 nd 5.2 7.2 4.4
W nd nd nd 5.9 nd nd nd nd nd
Tl nd nd nd nd nd nd nd nd nd
Pb 5.4 5.3 5.8 5.7 6.5 9.8 13.8 5.2 5.3
Bi nd nd nd nd nd nd nd nd nd
Th 11.2 8.3 9.8 11.3 10.1 12.6 14.3 16.6 8.9
U 5.5 3.2 4.6 3.5 3.8 3.6 4.7 3.6 2.3
Sea and ground water can explain the presence of these minor elements in the samples.
For example, it is known that sea water near Porto Santo has high Sr content, which is reflected
also in this analysis (Gomes & Silva, 2012). Also, clay minerals formed in equilibrium with
seawater usually have low total rare earth elements concentrations (Kogel & Lewis, 2001).
To sum up, it can be said that the chemical analysis complements the mineralogical
data to show the general composition of samples. Moreover it highlights the differences in
minor elements. This can provide us with additional information about the origin of the clay
minerals and also information about their suitability for the applications, where the presence
of minor elements would have an important role (e.g., pharmaceuticals).
3.3.3. Cation Exchange Capacity
After the chemical analysis, we saturated the samples with an ammonium acetate
solution to investigate the amount of mobile and exchangeable cations. From all the minerals
in the fine fraction (<63 µm), the swelling clay minerals would contribute the most, because
2 The unit of reported values is ppm.
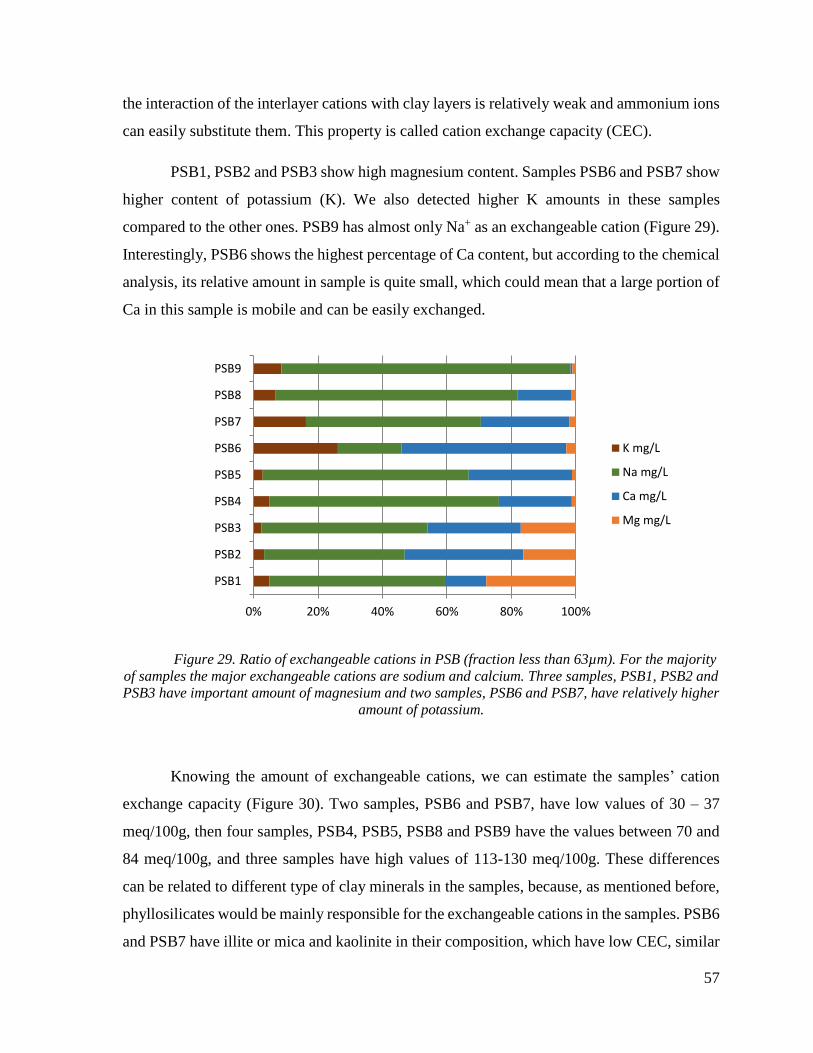
57
the interaction of the interlayer cations with clay layers is relatively weak and ammonium ions
can easily substitute them. This property is called cation exchange capacity (CEC).
PSB1, PSB2 and PSB3 show high magnesium content. Samples PSB6 and PSB7 show
higher content of potassium (K). We also detected higher K amounts in these samples
compared to the other ones. PSB9 has almost only Na+ as an exchangeable cation (Figure 29).
Interestingly, PSB6 shows the highest percentage of Ca content, but according to the chemical
analysis, its relative amount in sample is quite small, which could mean that a large portion of
Ca in this sample is mobile and can be easily exchanged.
Figure 29. Ratio of exchangeable cations in PSB (fraction less than 63µm). For the majority
of samples the major exchangeable cations are sodium and calcium. Three samples, PSB1, PSB2 and
PSB3 have important amount of magnesium and two samples, PSB6 and PSB7, have relatively higher
amount of potassium.
Knowing the amount of exchangeable cations, we can estimate the samples’ cation
exchange capacity (Figure 30). Two samples, PSB6 and PSB7, have low values of 30 – 37
meq/100g, then four samples, PSB4, PSB5, PSB8 and PSB9 have the values between 70 and
84 meq/100g, and three samples have high values of 113-130 meq/100g. These differences
can be related to different type of clay minerals in the samples, because, as mentioned before,
phyllosilicates would be mainly responsible for the exchangeable cations in the samples. PSB6
and PSB7 have illite or mica and kaolinite in their composition, which have low CEC, similar
0% 20% 40% 60% 80% 100%
PSB1
PSB2
PSB3
PSB4
PSB5
PSB6
PSB7
PSB8
PSB9
K mg/L
Na mg/L
Ca mg/L
Mg mg/L

58
to the values we have measured (Borden & Giese, 2001; Meunier, 2005). The rest of the
samples contain smectite type clay, which have higher CEC, close to our measured values.
Figure 30.Cation exchange capacity of PSB (fraction less than 63 µm). Two samples, PSB6
and PSB7, which have mica or illite and kaolinite in their composition exhibit the lowest CEC. The
other samples having smectite type clay minerals in their composition, show also higher CEC values.
For the polymer - clay nanocomposite preparation with the method of direct
intercalation from the solution, clay minerals with higher CEC are preferred, because the
entropy increase in such interaction will be greater compared to those clay minerals with
smaller amount of available exchangeable cations (Beall & Powell, 2011).
3.3.4. Mechanical properties
These are the mechanical properties which will determine the application of clays in
the industry. We investigated two of them, the abrasion and the plasticity. They are important
113120
130
70
84
3037
73 69
0
20
40
60
80
100
120
140
160
0 1 2 3 4 5 6 7 8 9 10
CEC
(m
eq/1
00
g)
Sample number
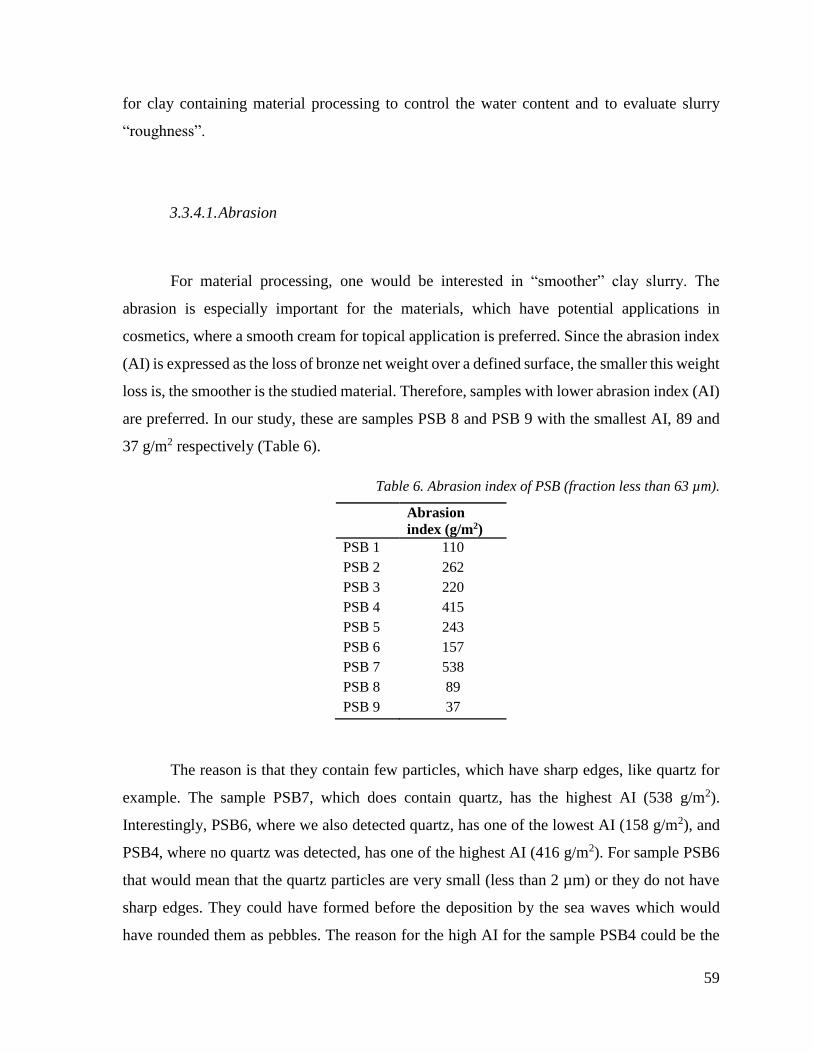
59
for clay containing material processing to control the water content and to evaluate slurry
“roughness”.
3.3.4.1. Abrasion
For material processing, one would be interested in “smoother” clay slurry. The
abrasion is especially important for the materials, which have potential applications in
cosmetics, where a smooth cream for topical application is preferred. Since the abrasion index
(AI) is expressed as the loss of bronze net weight over a defined surface, the smaller this weight
loss is, the smoother is the studied material. Therefore, samples with lower abrasion index (AI)
are preferred. In our study, these are samples PSB 8 and PSB 9 with the smallest AI, 89 and
37 g/m2 respectively (Table 6).
Table 6. Abrasion index of PSB (fraction less than 63 µm).
Abrasion
index (g/m2)
PSB 1 110
PSB 2 262
PSB 3 220
PSB 4 415
PSB 5 243
PSB 6 157
PSB 7 538
PSB 8 89
PSB 9 37
The reason is that they contain few particles, which have sharp edges, like quartz for
example. The sample PSB7, which does contain quartz, has the highest AI (538 g/m2).
Interestingly, PSB6, where we also detected quartz, has one of the lowest AI (158 g/m2), and
PSB4, where no quartz was detected, has one of the highest AI (416 g/m2). For sample PSB6
that would mean that the quartz particles are very small (less than 2 µm) or they do not have
sharp edges. They could have formed before the deposition by the sea waves which would
have rounded them as pebbles. The reason for the high AI for the sample PSB4 could be the
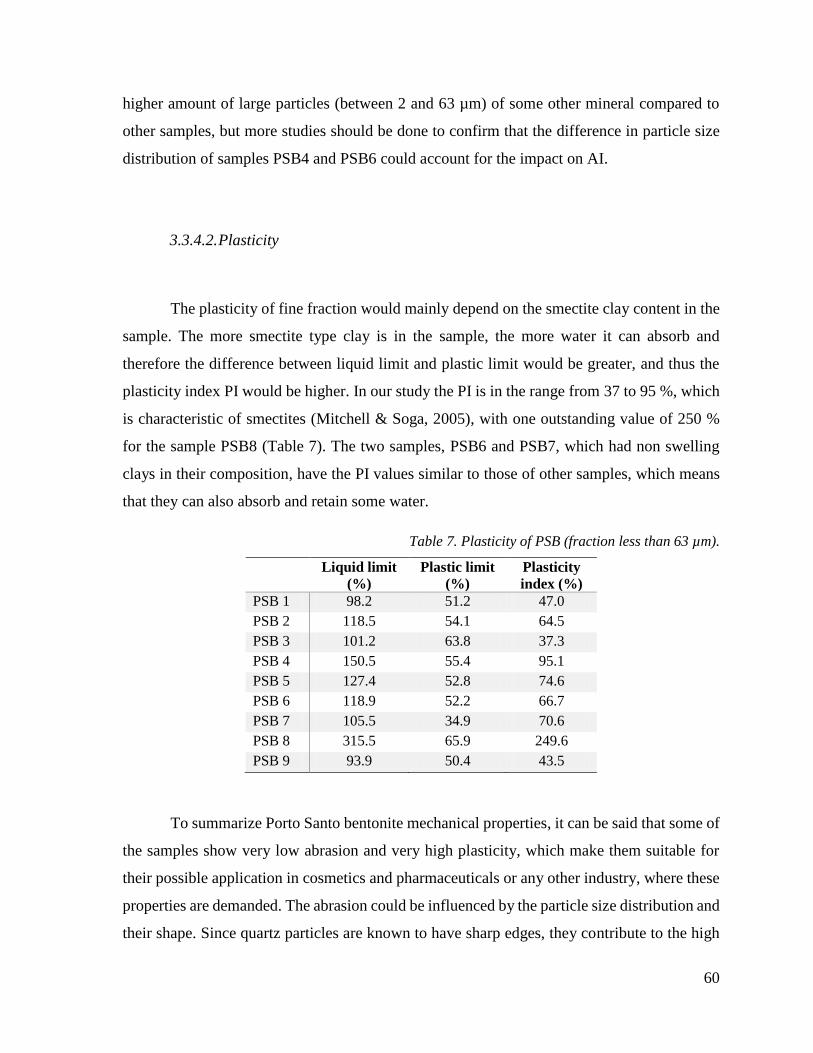
60
higher amount of large particles (between 2 and 63 µm) of some other mineral compared to
other samples, but more studies should be done to confirm that the difference in particle size
distribution of samples PSB4 and PSB6 could account for the impact on AI.
3.3.4.2. Plasticity
The plasticity of fine fraction would mainly depend on the smectite clay content in the
sample. The more smectite type clay is in the sample, the more water it can absorb and
therefore the difference between liquid limit and plastic limit would be greater, and thus the
plasticity index PI would be higher. In our study the PI is in the range from 37 to 95 %, which
is characteristic of smectites (Mitchell & Soga, 2005), with one outstanding value of 250 %
for the sample PSB8 (Table 7). The two samples, PSB6 and PSB7, which had non swelling
clays in their composition, have the PI values similar to those of other samples, which means
that they can also absorb and retain some water.
Table 7. Plasticity of PSB (fraction less than 63 µm).
Liquid limit
(%)
Plastic limit
(%)
Plasticity
index (%)
PSB 1 98.2 51.2 47.0
PSB 2 118.5 54.1 64.5
PSB 3 101.2 63.8 37.3
PSB 4 150.5 55.4 95.1
PSB 5 127.4 52.8 74.6
PSB 6 118.9 52.2 66.7
PSB 7 105.5 34.9 70.6
PSB 8 315.5 65.9 249.6
PSB 9 93.9 50.4 43.5
To summarize Porto Santo bentonite mechanical properties, it can be said that some of
the samples show very low abrasion and very high plasticity, which make them suitable for
their possible application in cosmetics and pharmaceuticals or any other industry, where these
properties are demanded. The abrasion could be influenced by the particle size distribution and
their shape. Since quartz particles are known to have sharp edges, they contribute to the high
61
abrasion index. The clay minerals would influence the materials’ plasticity. Very high
plasticity index can be explained by high amount of smectite clay in the sample.
3.4. Conclusion
We have analyzed nine different samples from the Porto Santo Island. They all contain
phyllosilicates. Most of the samples are mainly composed of smectites having also feldspars,
Fe rich minerals, calcite, anatase and gypsum in their composition. Two samples, taken from
the middle of island, are different, having mainly mica-illite, kaolinite clay minerals and quartz
in their composition. The origin of the smectites can be from the alteration of volcanic ash and
the weathering of basalts and trachytes, while the mica-illite samples could have had an acidic
parent rock - rhyolites. The formation of clay minerals is also influenced by the climatic
conditions. In this case, it is a warm and stable temperature, which has favored the formation
of smectites. The chemical analysis complemented the mineralogical data and confirmed the
difference of two samples from the others. They had an increased content of potassium in their
composition. The analysis of minor elements showed the low content of rare earth elements,
which could indicate that the formation could have happened in equilibrium with the seawater.
As the samples mainly contained smectites and had a low amount of minor elements,
they could be applied in cosmetics and pharmaceuticals, and also used for preparation of
polymer-clay composite materials. Moreover they showed low abrasion and high plasticity,
which are also important for these three applications.
The objective of this study was to find a suitable material for the clay-polymer
nanocomposite synthesis. From all nine samples, the one labelled PSB8 showed the most
promising properties. First of all, we identified that it has very high content of clay fraction,
which is mainly composed of clay minerals; the other minor minerals are feldspar and anatase.
Secondly, the main clay mineral is smectite, which is the targeted clay mineral for the synthesis
of nanocomposite in this project. Finally, this sample shows outstanding mechanical properties
– very low abrasion and very high plasticity.
62
CHAPTER 4
SYNTHESIS OF SCLEROGLUCAN – SMECTITE COMPOSITE
This chapter is devoted to the synthesis of a novel biocomposite material. We will
begin with an introduction of the experimental setup, which includes the work protocols
established for the synthesis. It is followed by the discussion of the results and the summary
of the research.
4.1. Experimental setup for composite synthesis
4.1.1. Materials
4.1.1.1. Clay minerals and their purification
Two clay minerals were chosen for the composite synthesis – Porto Santo bentonite
(PSB) and a clay mineral from the Clay Source repository – Wyoming Na-montmorillonite
(SWy-2). We decided to include the SWy-2 in this master thesis project in order to compare
the results obtained on PSB to this well-known and characterized reference montmorillonite.
The purification of PSB is described in Chapter 3. We followed a similar procedure for
SWy-2 purification, this time including also a saturation with Na+ to obtain the best possible
defined structure. The purification of SWy-2 to obtain the fraction less than 2 µm allowed the
reduction of the high content of quartz (Figure 31) and also increased the concentration of the
clay fraction.
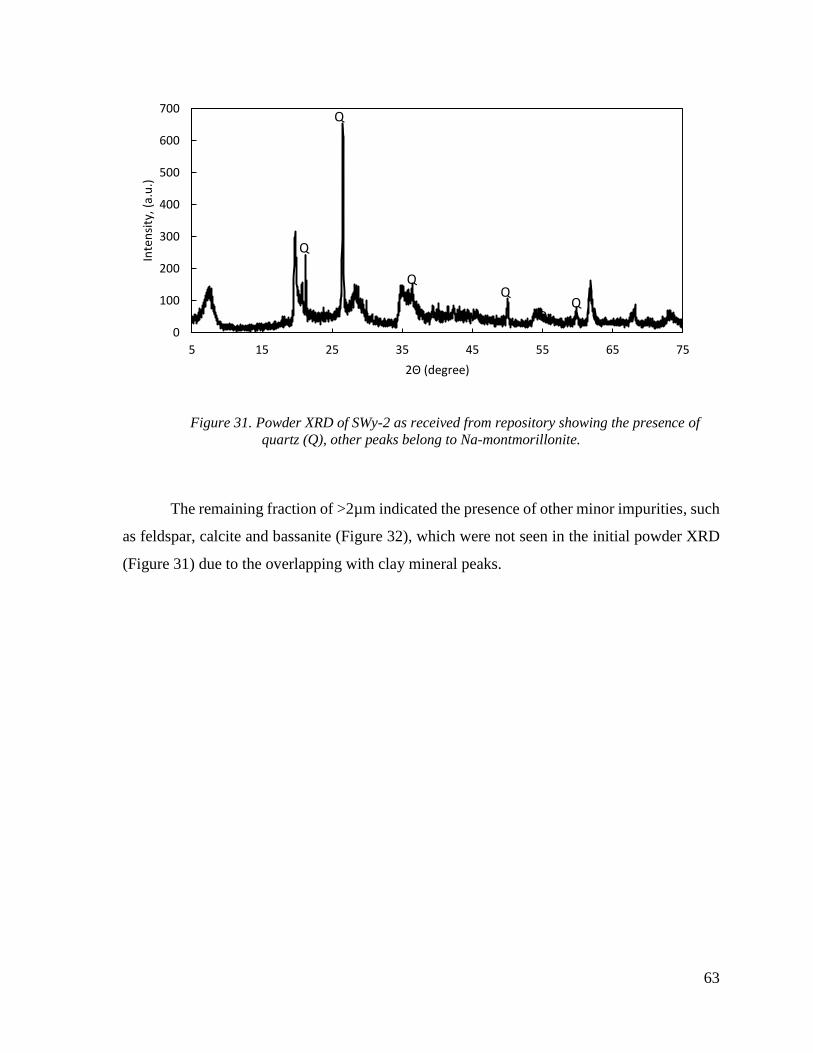
63
Figure 31. Powder XRD of SWy-2 as received from repository showing the presence of
quartz (Q), other peaks belong to Na-montmorillonite.
The remaining fraction of >2µm indicated the presence of other minor impurities, such
as feldspar, calcite and bassanite (Figure 32), which were not seen in the initial powder XRD
(Figure 31) due to the overlapping with clay mineral peaks.
0
100
200
300
400
500
600
700
5 15 25 35 45 55 65 75
Inte
nsi
ty, (
a.u
.)
2Θ (degree)
Q
Q
Q
Q
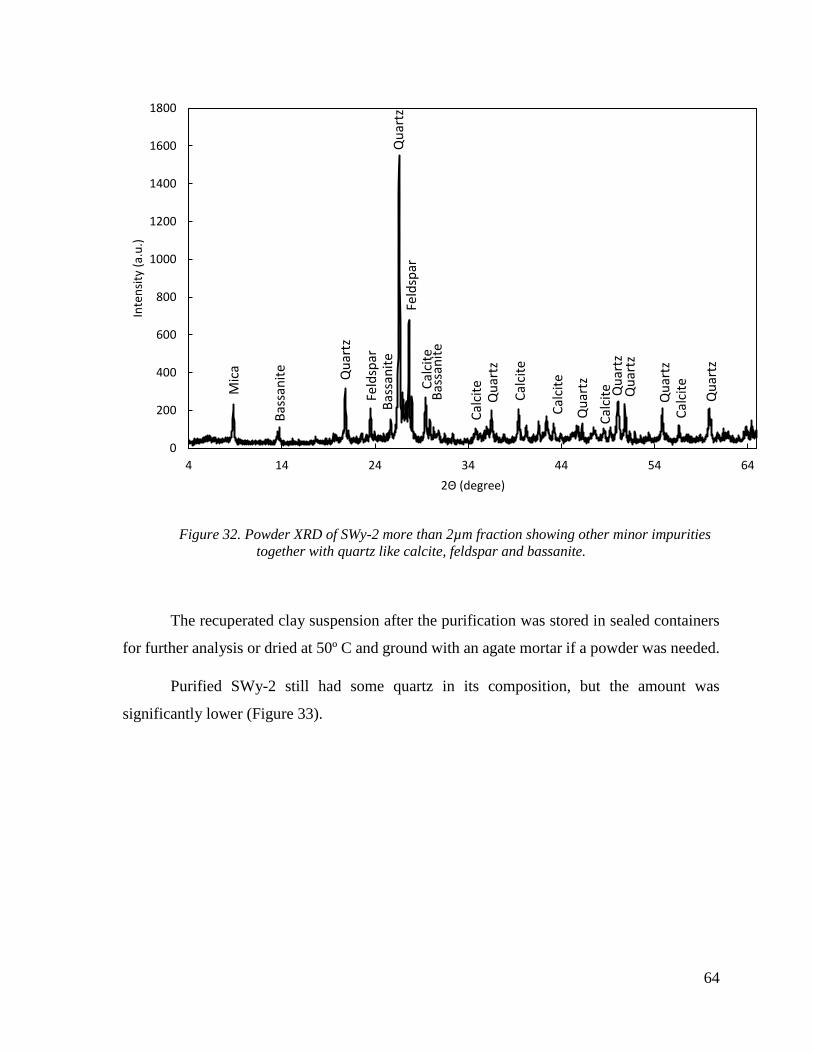
64
Figure 32. Powder XRD of SWy-2 more than 2µm fraction showing other minor impurities
together with quartz like calcite, feldspar and bassanite.
The recuperated clay suspension after the purification was stored in sealed containers
for further analysis or dried at 50º C and ground with an agate mortar if a powder was needed.
Purified SWy-2 still had some quartz in its composition, but the amount was
significantly lower (Figure 33).
0
200
400
600
800
1000
1200
1400
1600
1800
4 14 24 34 44 54 64
Inte
nsi
ty (
a.u
.)
2Θ (degree)
Mic
a
Qu
artz
Bas
san
ite
Feld
spar
Bas
san
ite
Qu
artz
Cal
cite
Feld
spar
Bas
san
ite
Qu
artz
Cal
cite
Cal
cite
Cal
cite
Cal
citeQu
artz
Qu
artz
Qu
artz
Qu
artz
Qu
artz
Cal
cite

65
Figure 33. Powder XRD of purified SWy-2 indicating minor quartz impurity.
4.1.1.2. Scleroglucan
The biopolymer scleroglucan was purchased from “Carbomer” and applied without
any further treatment. It contains a small amount of proteins as revealed by solid state 13C CP-
MAS NMR (Figure 34). The proteins are the by-product of the polysaccharide extraction
(Comte et al., 2006; Donot et al., 2012).
0
50
100
150
200
250
300
350
400
450
2 12 22 32 42 52 62
Inte
nsi
ty (
a.u
.)
2Θ (degree)
Na-
MM
T Qu
artz
Na-
MM
T
Qu
artz
Na-
MM
T
Qu
artz
Na-
MM
T
Na-
MM
T
Qu
artz
Qu
artz
Qu
artz

66
Figure 34. Solid state 13C CP-MAS NMR of scleroglucan revealing minor amount of
proteins. The chemical shifts of carbons were attributed according to Jeannin et al. (2000).
4.1.2. Procedure of composite synthesis
For the scleroglucan – clay composite synthesis, we used a direct intercalation from
the solution (cf 1.3.), because the polymer is water soluble. We chose two scleroglucan (sclg)
concentrations in demineralized water 0.5 % and 1.0 %, and two sclg – clay mass ratios 3:1
and 6:1 (Table 8) following the previously established protocol for guar gum – smectite
composite synthesis by Rola Mansa (Mansa, 2011). The concentrations of sclg were set to
have enough diluted solution in order to maximize the interaction between the components of
the system. Higher concentrations above 2% form a gel, thus it is not possible to mix them.
The quantities of compounds were adjusted after the first trial, which is the reason why the
amount taken in every trial varies.
-1.E+08
-5.E+07
0.E+00
5.E+07
1.E+08
2.E+08
2.E+08
3.E+08
3.E+08
4.E+08
4.E+08
5.E+08
050100150200
Inte
nsi
ty (
a.u
.)
Chemical shift (ppm)
C1
C3
C5
C2
C4
C6
protein protein
1 2 3
4 5
6

67
Table 8. Chosen quantities of sclg and clay for the experiment.
Sample label % Sclg, w/v % Clay, w/v Clay/Sclg, w/w
1 0.5SS13-0-0 0.50 0.17 1/3
2 0.5SP13-0-0 0.50 0.17 1/3
3 1.0SS16-0-0 1.00 0.17 1/6
4 1.0SP16-0-0 1.00 0.17 1/6
For the better understanding of our further discussion we also clarify the set label:
0.5SS13-0-0
Sclg was dissolved in demineralized water using a magnetic stirring bar for 1 hour. The
clay powder was also separately dispersed in water prior to adding to the sclg solution. After
mixing both components, the suspension was kept stirring up for 28 days to evaluate the time
effect on the biopolymer and the clay mineral interaction. The sampling was done after 1, 3,
5, 7, 14, 21 and 28 days. The suspension was deposited on a glass slide and dried at 60º C for
4 hours to obtain oriented film for the XRD analysis. At the end of the experiment, the mixture
was centrifuged at 5000 rpm for 20 min and washed 3 times with water to remove external
adsorbed polymer and also to check if some de-intercalation took place. Afterwards, it was
dried at 60º C until a constant weight was reached, ground in agate mortar and stored for further
analysis of XRD, ATR FTIR, TGA and TEM.
A second set of experiments was prepared in order to evaluate the impact of various
experimental conditions (Table 9), because it can be found in the literature that pH and
sonification can impact the sclg conformation (Ansari et al., 2012; Bluhm et al., 1982). We
studed the impact of various sclg concentrations and various clay/sclg ratios. For these
experiments we used only the purified clay mineral from clay repository SWy-2.
Concentration of Sclg in the solution 0.5 %
Sclg Clay sample used: S
(Swy-2), P (PSB 8)
Clay/Sclg mass ration 1:3

68
Table 9. Material quantities for the second experiment.
Sample label % Sclg,
w/v
% Clay,
w/v
Clay/Sclg,
w/w
pH Sonification,
min
1 0.5SS13-0-10 0.50 0.17 1:3 7-8 10
2 0.5SS13-10-0 0.50 0.17 1:3 >10 0
3 0.5SS13-10-10 0.50 0.17 1:3 >10 10
4 0.5SS16-0-0 0.50 0.08 1:6 7-8 0
5 1.0SS13-0-0 1.00 0.33 1:3 7-8 0
6 1.0SS16-0-0 1.00 0.17 1:6 7-8 0
7 0.17SS11-0-0 0.17 0.17 1:1 7-8 0
8 0.03SS51-0-0 0.03 0.17 5:1 7-8 0
9 1.67SS110-0-0 1.67 0.17 1:10 7-8 0
The sclg and the SWy-2 were weighed into plastic centrifuge tubes and then 30 ml of
demineralized water was added. For two samples (2 and 3) 1M NaOH was used to increase
the pH. For two samples (1 and 3), the ultrasound was applied for 10 min and in this case the
clay mineral was added only after the sonification. The centrifuge tubes were fixed on Innova
2000 platform shaker with a continuous rate of 250 rpm, and sampling was done in the same
way as for the first experiment after 1, 3, 5, 7 and 14 days.
4.2. Results of scleroglucan – clay composite synthesis
We will start our discussion of the results focusing primarily on the structure of the
composite and the type of interaction between the compounds. This will be followed by the
study of various experimental conditions to define the optimum parameters for the synthesis.
4.2.1. Structure of composite
4.2.1.1. Case of SWy-2
The first attempt towards scleroglucan – clay composite synthesis using the SWy-2
clay mineral indicated a possible change in the clay mineral organization, because a peak
broadening and a shift of (001) reflection in the X-ray diffractogram was observed from 11.6
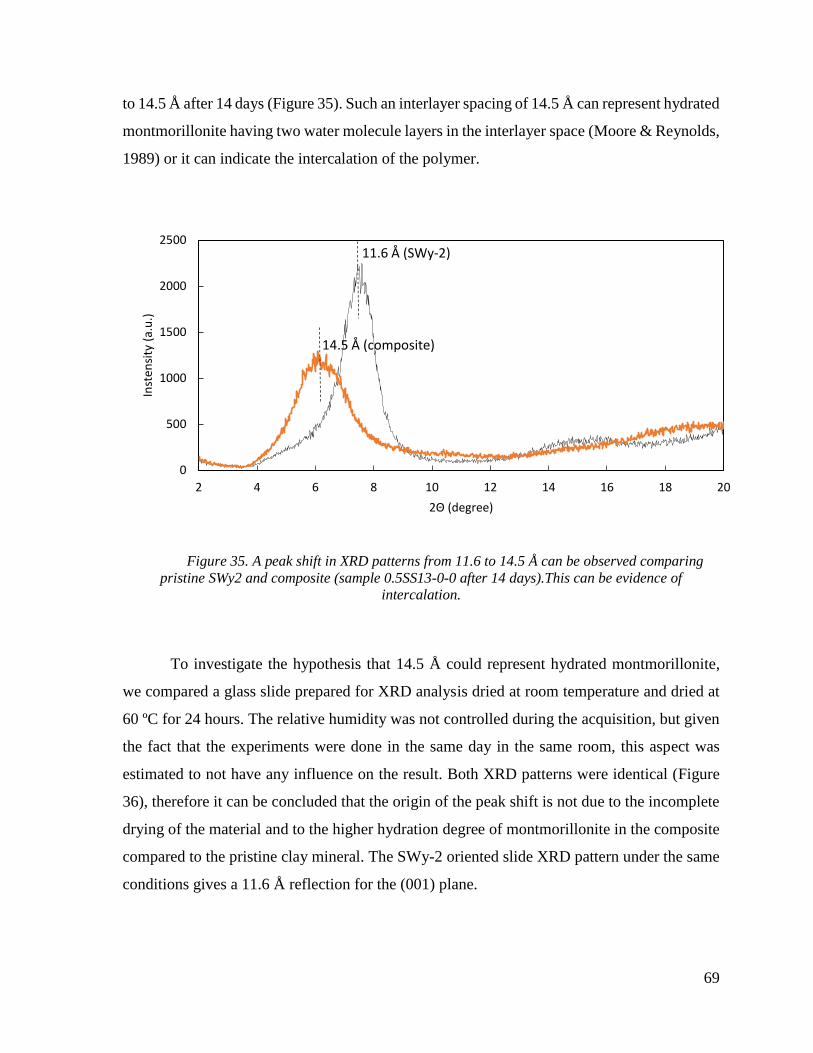
69
to 14.5 Å after 14 days (Figure 35). Such an interlayer spacing of 14.5 Å can represent hydrated
montmorillonite having two water molecule layers in the interlayer space (Moore & Reynolds,
1989) or it can indicate the intercalation of the polymer.
Figure 35. A peak shift in XRD patterns from 11.6 to 14.5 Å can be observed comparing
pristine SWy2 and composite (sample 0.5SS13-0-0 after 14 days).This can be evidence of
intercalation.
To investigate the hypothesis that 14.5 Å could represent hydrated montmorillonite,
we compared a glass slide prepared for XRD analysis dried at room temperature and dried at
60 ºC for 24 hours. The relative humidity was not controlled during the acquisition, but given
the fact that the experiments were done in the same day in the same room, this aspect was
estimated to not have any influence on the result. Both XRD patterns were identical (Figure
36), therefore it can be concluded that the origin of the peak shift is not due to the incomplete
drying of the material and to the higher hydration degree of montmorillonite in the composite
compared to the pristine clay mineral. The SWy-2 oriented slide XRD pattern under the same
conditions gives a 11.6 Å reflection for the (001) plane.
0
500
1000
1500
2000
2500
2 4 6 8 10 12 14 16 18 20
Inst
ensi
ty (
a.u
.)
2Θ (degree)
11.6 Å (SWy-2)
14.5 Å (composite)
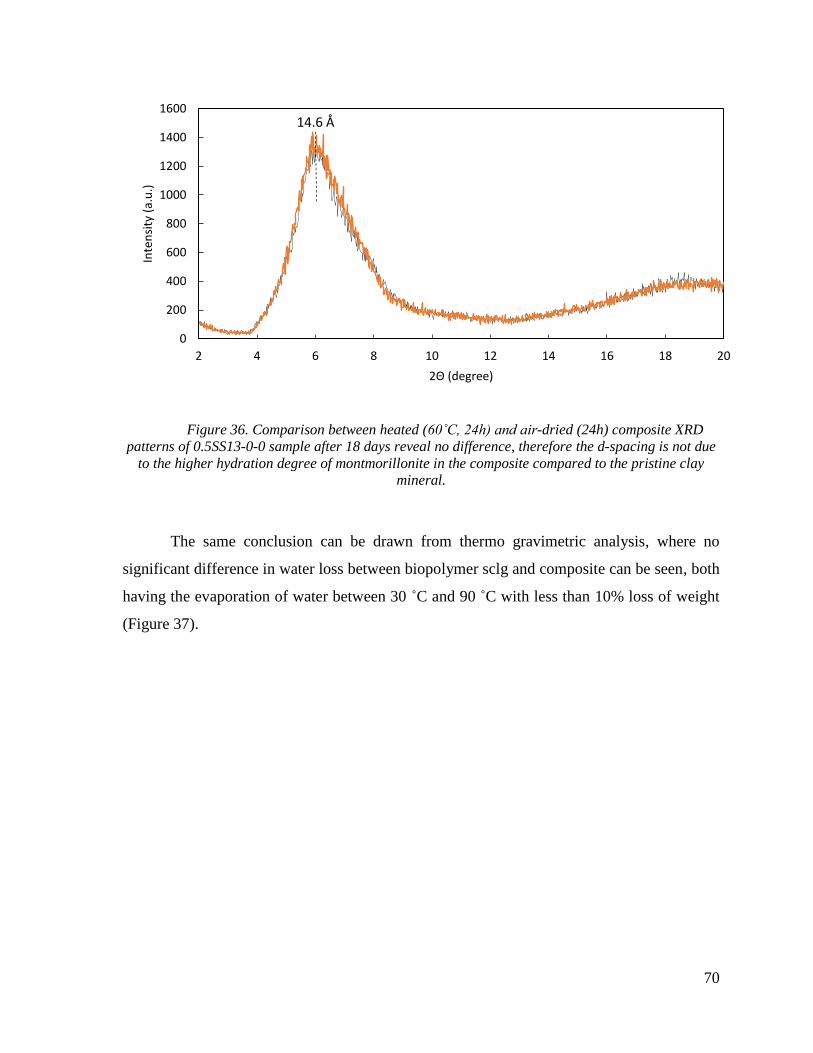
70
Figure 36. Comparison between heated (60˚C, 24h) and air-dried (24h) composite XRD
patterns of 0.5SS13-0-0 sample after 18 days reveal no difference, therefore the d-spacing is not due
to the higher hydration degree of montmorillonite in the composite compared to the pristine clay
mineral.
The same conclusion can be drawn from thermo gravimetric analysis, where no
significant difference in water loss between biopolymer sclg and composite can be seen, both
having the evaporation of water between 30 ˚C and 90 ˚C with less than 10% loss of weight
(Figure 37).
0
200
400
600
800
1000
1200
1400
1600
2 4 6 8 10 12 14 16 18 20
Inte
nsi
ty (
a.u
.)
2Θ (degree)
14.6 Å
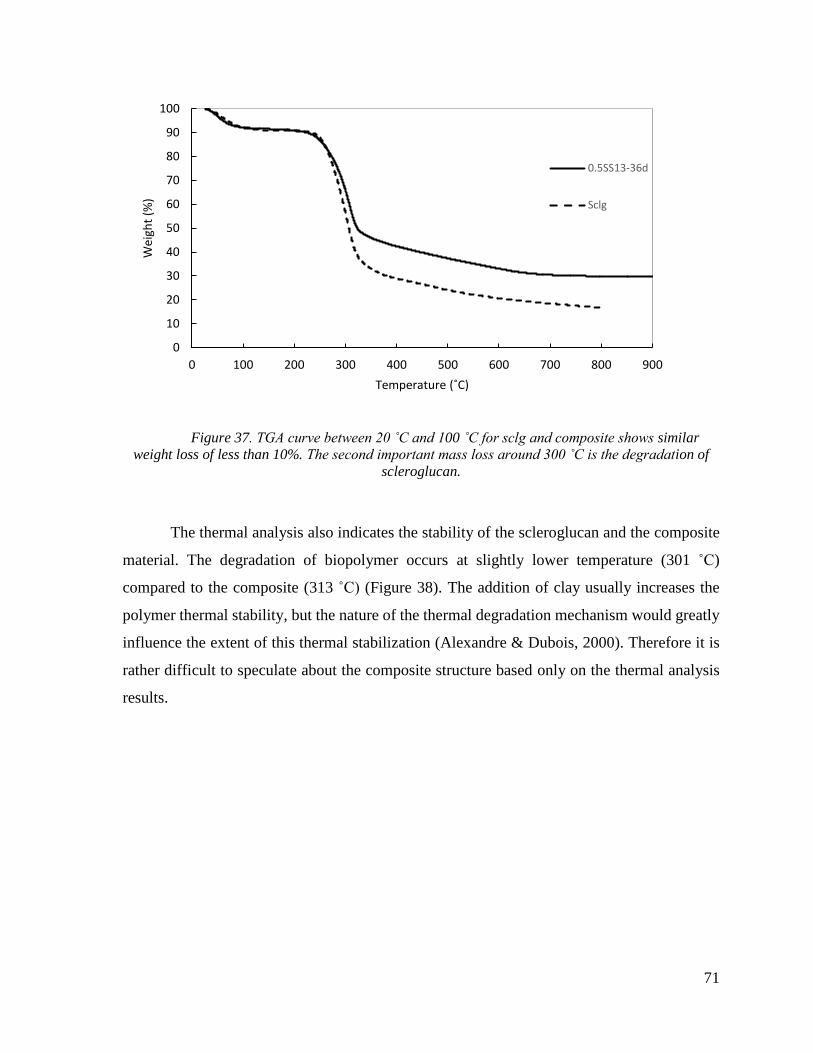
71
Figure 37. TGA curve between 20 ˚C and 100 ˚C for sclg and composite shows similar
weight loss of less than 10%. The second important mass loss around 300 ˚C is the degradation of
scleroglucan.
The thermal analysis also indicates the stability of the scleroglucan and the composite
material. The degradation of biopolymer occurs at slightly lower temperature (301 ˚C)
compared to the composite (313 ˚C) (Figure 38). The addition of clay usually increases the
polymer thermal stability, but the nature of the thermal degradation mechanism would greatly
influence the extent of this thermal stabilization (Alexandre & Dubois, 2000). Therefore it is
rather difficult to speculate about the composite structure based only on the thermal analysis
results.
0
10
20
30
40
50
60
70
80
90
100
0 100 200 300 400 500 600 700 800 900
Wei
ght
(%)
Temperature (˚C)
0.5SS13-36d
Sclg

72
Figure 38. DTG curve of scleroglucan and composite (sample 0.5SS13-0-0 after 36 days)
shows a slight increase of the decomposition temperature from 301 ˚C to 313 ˚C. The first peaks at
46 ˚C and 53 ˚C indicate the temperature of external water desorption.
Another important instrument to assess the composite material structure is transmission
electron microscopy (TEM). TEM images revealed the intercalated composite with partial
exfoliation (Figure 39, I, II and IV). We observed various domains – aggregates (A), several
layers stacks (B) and individual dispersed clay layers (C). The darker lines are the clay layers,
while sclg is a lighter matrix around it. We can see that the dispersion of montmorillonite in
slcg is enhanced, when comparing to pristine SWy-2 (Figure 39, III).
4653
301
313
0
0.1
0.2
0.3
0.4
0.5
0.6
0.7
0.8
0.9
1
20 120 220 320 420 520 620 720 820
Der
iv. w
eigh
t (
%/˚
C)
Temperature (˚C)
0.5SS13-36d
Sclg

73
Figure 39. TEM images of sclg-mmt composite structure (I, II and IV) compared to pristine SWy-2
(III). In image I: A - aggregates, B - several layer stack, C - individual clay layers. In image II
separate exfoliated clay layers can be seen. Image IV shows the dispersion of several intercalated
clay layers.
Such montmorillonite layers organization within the scleroglucan matrix, as revealed
by TEM imaging, is useful for the previously obtained XRD pattern interpretation. The shift
of the peak in the XRD pattern can be due to the intercalation of sclg in between
montmorillonite layers. The peak broadening occurs, because of the increase of the variety of
different interlayer spacing in between clay layers due to the montmorillonite and the sclg
interaction. We can also add that the intensity decrease could be attributed to a certain level of
exfoliated clay sheets making the structure less organized and more amorphous, but the
intensity could also be affected because of a smaller clay amount. Other factors, such as the
sample holder and the quantity of the sample were the same for all the experiments. Finally,
the interlayer distance measured from TEM images varies from 13 to 16 Å, which corresponds
A
B C
I II
III IV

74
to the XRD results (Figure 40). It has to be noted that for the high precision measurements, the
cutting of the samples had to be done perpendicular to the direction of the clay platelets
orientation. Otherwise, the interlayer distance of the clay sheets could be overestimated as it
could be in the case of 16.5 Å.
Figure 40. Distance between clay layers measured from TEM images for sample 0.5SS13-0-0
after 36 days is from 13 to 16 Å, which could mean that the intercalation of scleroglucan has
occurred.
This study shows that the XRD pattern alone is not sufficient to conclude about the
composite material structure on the nano scale, although it can give an average estimation. In
our case the TEM images provided a better insight about the material composition.
We can find several examples in the literature about a neutral polysaccharide
intercalation reporting interlayer distances between 3.2 and 5.3 Å, but the minimum thickness
of the monosaccharide molecules derived from pyranose and furanose rings ranges from 4.7
to 5.3 Å, therefore values less than 5 Å would mean incomplete intercalation or layer
segregation (Theng, 2012). In our case, assuming that most of the interlayer water was
displaced during polymer intercalation, the resultant layer separation is 5.3 Å. The diameter of
the scleroglucan trimer rod is reported to be 20 to 30 Å, which in the case of intercalation
would mean that the triple helix is broken and only a single chain of scleroglucan is
intercalated. Since the polymer is neutral, Na+ still has to be located in the interlayer space to
balance the charge.
13.6 Å
16.5 Å
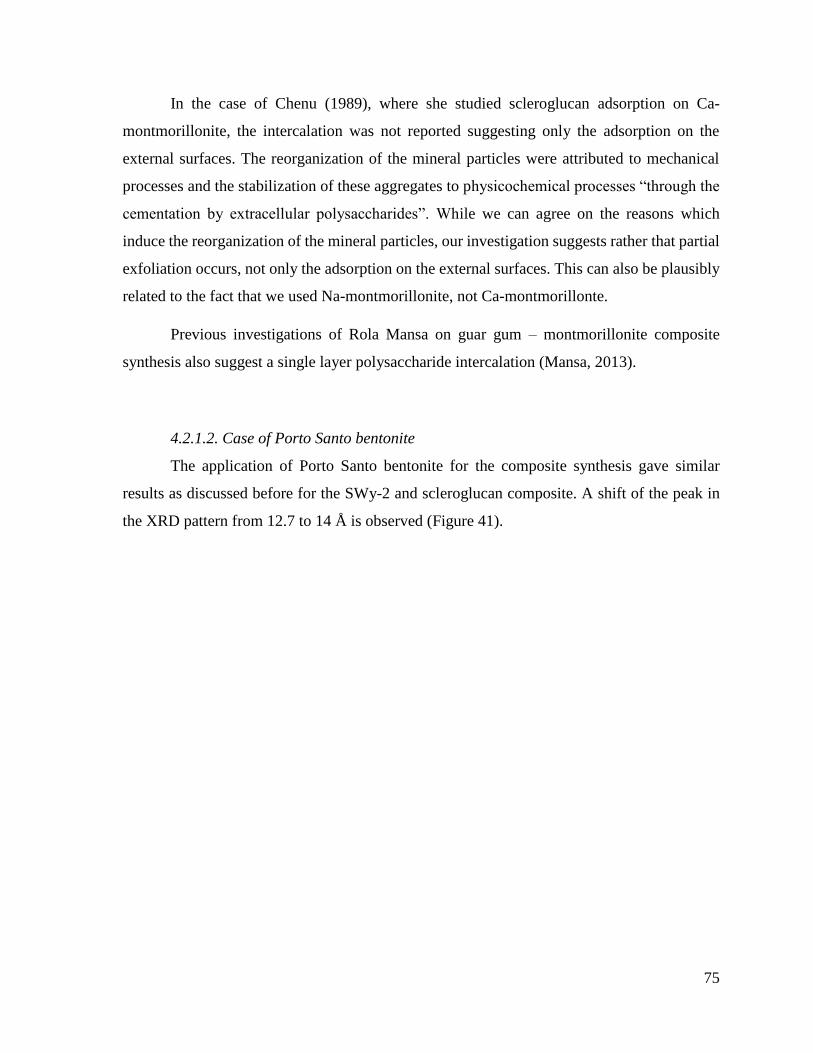
75
In the case of Chenu (1989), where she studied scleroglucan adsorption on Ca-
montmorillonite, the intercalation was not reported suggesting only the adsorption on the
external surfaces. The reorganization of the mineral particles were attributed to mechanical
processes and the stabilization of these aggregates to physicochemical processes “through the
cementation by extracellular polysaccharides”. While we can agree on the reasons which
induce the reorganization of the mineral particles, our investigation suggests rather that partial
exfoliation occurs, not only the adsorption on the external surfaces. This can also be plausibly
related to the fact that we used Na-montmorillonite, not Ca-montmorillonte.
Previous investigations of Rola Mansa on guar gum – montmorillonite composite
synthesis also suggest a single layer polysaccharide intercalation (Mansa, 2013).
4.2.1.2. Case of Porto Santo bentonite
The application of Porto Santo bentonite for the composite synthesis gave similar
results as discussed before for the SWy-2 and scleroglucan composite. A shift of the peak in
the XRD pattern from 12.7 to 14 Å is observed (Figure 41).
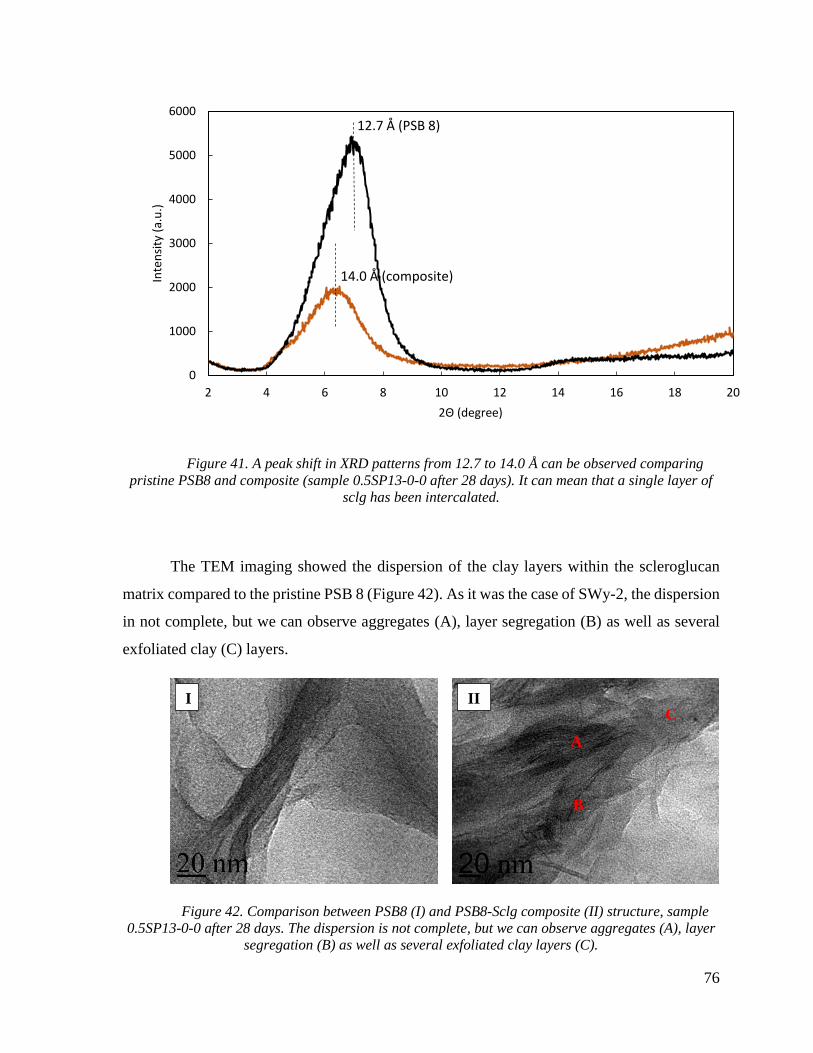
76
Figure 41. A peak shift in XRD patterns from 12.7 to 14.0 Å can be observed comparing
pristine PSB8 and composite (sample 0.5SP13-0-0 after 28 days). It can mean that a single layer of
sclg has been intercalated.
The TEM imaging showed the dispersion of the clay layers within the scleroglucan
matrix compared to the pristine PSB 8 (Figure 42). As it was the case of SWy-2, the dispersion
in not complete, but we can observe aggregates (A), layer segregation (B) as well as several
exfoliated clay (C) layers.
Figure 42. Comparison between PSB8 (I) and PSB8-Sclg composite (II) structure, sample
0.5SP13-0-0 after 28 days. The dispersion is not complete, but we can observe aggregates (A), layer
segregation (B) as well as several exfoliated clay layers (C).
0
1000
2000
3000
4000
5000
6000
2 4 6 8 10 12 14 16 18 20
Inte
nsi
ty (
a.u
.)
2Θ (degree)
14.0 Å (composite)
12.7 Å (PSB 8)
I II
A
B
C

77
We have to note that this clay has a different composition than SWy-2 having more Fe
in its structure, and the layer charge is located in the tetrahedral layer, while for SWy-2 it is in
the octahedral layer:
PSB 8: (Na0.70Mg0.07)[Al1.91Mg0.65Fe(III)1.66] [Si7.18Al0.82]O20(OH)4
SWy-2: (Ca0.12 Na0.32 K0.05)[Al3.01 Fe(III)0.41 Mn0.01 Mg0.54Ti0.02][Si7.98 Al0.02]O20(OH)4
The chemical formula of PSB 8 was calculated from the EDS results, the one for SWy-
2 was obtained from the Clay Mineral Society.
This seems to have a slight impact on the composite structural organization – SWy-2
is better dispersed in the biopolymer compared to PSB 8 (Figure 43). It also influences TEM
image quality inducing more charging, thus we have to act fast to capture the image.
Figure 43. TEM image of PSB 8 composite I (sample 0.5SP13-0-0, 28 days) compared to
SWy-2 composite II (sample 0.5SS13-0-0, 36 days). The differences in clay mineral structure affect
the rate of dispersion.
The presence of Fe in PSB8 structure could also explain the decrease of composite’s
thermal stability compared to single polymer and SWy-2 composite (Figure 44).
I II

78
Figure 44. DTG curve of scleroglucan and composite (sample 0.5SP13-0-0 after 28 days)
shows a decrease of the decomposition temperature from 301 ˚C to 276 ˚C due to the presence of Fe
in PSB8 structure. The first peaks at 53 ˚C and 58 ˚C indicate the temperature of external water
desorption.
It can be seen from this study that both clays can be dispersed in the biopolymer
scleroglucan to a certain extent. The aggregates, several intercalated layer stacks, as well as
single exfoliated domains were observed. The differences in their structure, presence of iron
and the layer charge location can potentially influence the degree of the dispersion and thermal
stability of the composite. A better dispersion was achieved for SWy-2 composites where the
layer charge is located in the octahedral sheet, while the charge for PSB8 is located in the
tetrahedral sheet. The SWy-2 composite also showed higher thermal stability compared to the
polymer, while the PSB8 composite’s thermal resistance decreased probably due to the Fe
content in its structure.
The peak shift in XRD patterns was attributed to the intercalation of scleroglucan in
between clay layers.
301
5358
276
0
0.1
0.2
0.3
0.4
0.5
0.6
0.7
0.8
0.9
1
20 120 220 320 420 520 620 720 820
Der
iv. w
eigh
t (
%/˚
C)
Temperature (˚C)
Sclg
0.5SP13-0-0

79
4.2.2. Type of interaction between scleroglucan and smectite
The fact that scleroglucan could be intercalated in between clay layers implies a change
in its conformation from a triple helix to a single chain, since the resultant clay layer separation
is 5.3 Å.
A routine solid state 13C CP-MAS NMR of the scleroglucan alone and within the
composite does not reveal any major changes (Figure 45). That means that its primary structure
has been kept intact and no chemical modification has taken place.
Figure 45. Solid state 13C CP-MAS NMR of scleroglucan and 0.5SS13-0-0 sample showing
no major changes to the biopolymer structure. For the chemical shift assignments see Figure 36 in
section 4.1.1.2.
ATR infrared spectroscopy results do not reveal differences between pristine materials
and the composite (Figure 46). A decreased light transmittance for Al-OH at 3606 cm-1 and
Si-O at 972 cm-1 could indicate a weak interaction or could be explained by small clay content
in the composite sample. All peak assignments are given in Table 10, data from Halleck (1967)
and Madejova & Komadel (2001) were used for the identification.
-1.E+08
-5.E+07
0.E+00
5.E+07
1.E+08
2.E+08
2.E+08
3.E+08
3.E+08
4.E+08
4.E+08
5.E+08
050100150200
Inte
nsi
ty (
a.u
.)
Chemical shift (ppm)
Sclg
0.5SS13-0-0

80
Figure 46. Comparison of ATR – FTIR patterns of sclg, SWy-2 and composite 0.5SS13-
36d.The decrease of Al-OH and Si-O peak intensities, at 3606 cm-1 and 972 cm-1 respectively, could
indicate a weak interaction or could be due to the small amount of clay in the composite. All peak
assignments are given in Table 10.
Table 10. ATR – FTIR band position assignment for SWy-2 and sclg.
Compound Wavenumber, cm-1
SWy-2 3606 OH stretching of structural
hydroxyl groups
SWy-2 3340 OH stretching of water
Sclg 3260 OH stretching
Sclg 2850-
2900
C-H stretching
SWy-2 1619 OH deformation of water
Sclg 1385 OH deformation
Sclg 1340-
1300
C-H deformation
Sclg 1226-
1132
C-O stretching
SWy-2 1084 Si-O stretching (longitudinal mode)
SWy-2 972 Si-O stretching
Sclg 904 AlAlOH deformation
SWy-2 871 AlFeOH deformation
SWy-2 774-791 Si-O stretching of quartz
SWy-2 687 Si-O
0
10
20
30
40
50
60
70
80
90
100
600110016002100260031003600
Tran
smit
tan
ce(%
)
Wavenumber (cm-1)
Swy-2
sclg
composite-36d
36
06
32
60
29
00
16
20
10
90
97
2 9
04 87
1
78
0
68
7
13
20
12
20
13
85

81
In the literature, the interaction type between nonionic polymers and clay minerals is
said to be the ion – dipole interaction between the interlayer cation and the polymer, but the
major factor governing the interaction is the surface accessibility (Theng, 2012). It could
explain why NMR and FTIR studies did not reveal significant differences between pristine
materials and composite.
The driving force for such interaction processes is the entropy increase, when a large
amount of water molecules from the hydration sphere of the interlayer cation are displaced by
the polymer (Beall & Powell, 2011).
More in-depth studies would be needed to better know the interaction between
scleroglucan and different types of smectite, but these preliminary studies do not show any
significant interactions between the compounds. They show that the primary structure is kept
and most likely the surface accessibility determines the process. Changes in sclg conformation
from triple helix to a single chain during the intercalation in between clay layers would need
more specialized techniques to be demonstrated. Nevertheless, we have seen from XRD and
TEM study that a certain degree of dispersion of smectite in scleroglucan is possible, therefore
we decided to explore various experimental conditions to see if they could have an impact on
composite material organization: the contact time of compounds, their mass ratio, the pH of
the solution and prior sonification of scleroglucan solution.
4.2.3. Contact time influence in composite formation
Researchers usually carry out the experiments in the range of minutes to hours. For
example, Chenu et al. (1985) studied the scleroglucan adsorption on the clay particles in 2
hours, which might not be enough for a large molecular weight polysaccharide to attain the
equilibrium conditions (Theng, 2012). Therefore we ran our experiment for several weeks to
see if it could have an effect on the polysaccharide intercalation.
The results revealed that two weeks were the marking point for the equilibrium to be
established in the case of SWy-2 composites (Figure 47). The peak position in the XRD pattern
did not change after this time. During the first day, we see a shift of the peak from 11.6 to 13.6

82
Å. The broadness of the peak could be explained because of the overlapping of both, non-
intercalated and intercalated layers.
Figure 47. XRD pattern of sclg and SWy-2 interaction over time for the sample 0.5SS13-0-0.
The equilibrium is established after two weeks, after which the peak position did not change over the
time. The shift of the peak from 11.6 to 13.6 Å during the first day, could represent the overlapping of
both, non-intercalated and intercalated layer peaks.
For the PSB8 composite, the maximum shift of the (001) peak in the XRD pattern was
achieved after three weeks (Figure 48). After this time, the d001 value decreased, which could
indicate a possible de-intercalation. The weak intensities of the first two week intercalates are
due to the different glass slides, which were used for the film deposition.
0
500
1000
1500
2000
2500
2 4 6 8 10 12 14 16 18 20
Inte
nsi
ty (
a.u
.)
2Θ (degree)
11.6 Å (SWy-2)
13.6 Å ( day 1)
14.5 Å ( day 14, 18, 21, 36)

83
Figure 48. XRD pattern of sclg and PSB 8 interaction over time for the sample 0.5SP13-0-0.
The maximum shift of the (001) peak was after three weeks. After this time the d001 value decreased,
which could indicate a possible de-intercalation. The weak intensities of first two week intercalates
are due to the different glass slide, which was used for the film deposition.
From a technological point of view, this information is not profitable, because a long
processing time of materials tends to increase the cost of production, but for a fundamental
study, it is an important aspect, proving that the large molecular weight neutral polysaccharide
adsorption is time dependent as reported also by Clapp and Emerson (1972), and it may require
several weeks for the intercalation or exfoliation to take place.
Effect of sclg solution concentration on the contact time
Two and three weeks are a relatively long time for the intercalation to take place.
Therefore we were interested to continue the investigation by increasing the sclg concentration
in water from 0.5 to 1.0 % and decreasing the clay mineral content from 25 to 14 % (w/w) to
see if this can have an effect on the necessary contact time for the intercalation to take place.
0
1000
2000
3000
4000
5000
6000
2 4 6 8 10 12 14 16 18 20
Inte
nsi
ty (
a.u
.)
2Θ (degree)
12.1 Å (day 1 and 3)
12.6 Å (PSB 8)
14.2 Å (day 22)
13.5 Å (day 28)
13.2 Å (day 7 and 14)
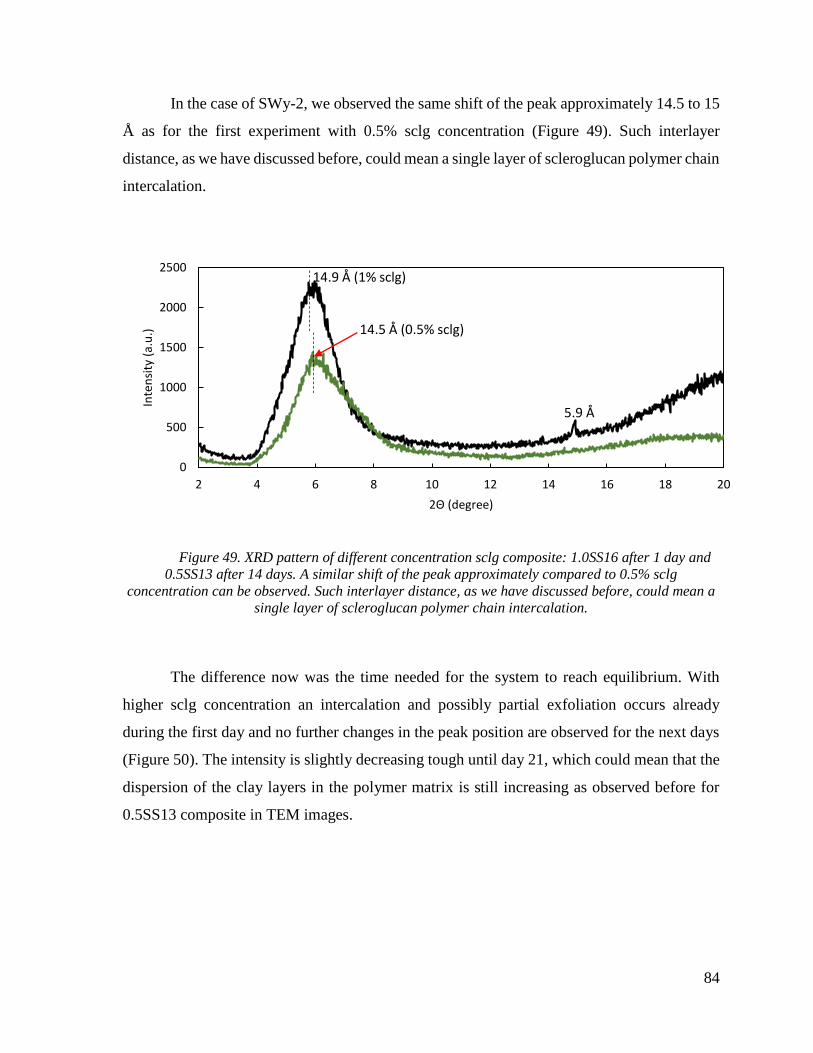
84
In the case of SWy-2, we observed the same shift of the peak approximately 14.5 to 15
Å as for the first experiment with 0.5% sclg concentration (Figure 49). Such interlayer
distance, as we have discussed before, could mean a single layer of scleroglucan polymer chain
intercalation.
Figure 49. XRD pattern of different concentration sclg composite: 1.0SS16 after 1 day and
0.5SS13 after 14 days. A similar shift of the peak approximately compared to 0.5% sclg
concentration can be observed. Such interlayer distance, as we have discussed before, could mean a
single layer of scleroglucan polymer chain intercalation.
The difference now was the time needed for the system to reach equilibrium. With
higher sclg concentration an intercalation and possibly partial exfoliation occurs already
during the first day and no further changes in the peak position are observed for the next days
(Figure 50). The intensity is slightly decreasing tough until day 21, which could mean that the
dispersion of the clay layers in the polymer matrix is still increasing as observed before for
0.5SS13 composite in TEM images.
0
500
1000
1500
2000
2500
2 4 6 8 10 12 14 16 18 20
Inte
nsi
ty (
a.u
.)
2Θ (degree)
14.5 Å (0.5% sclg)
14.9 Å (1% sclg)
5.9 Å
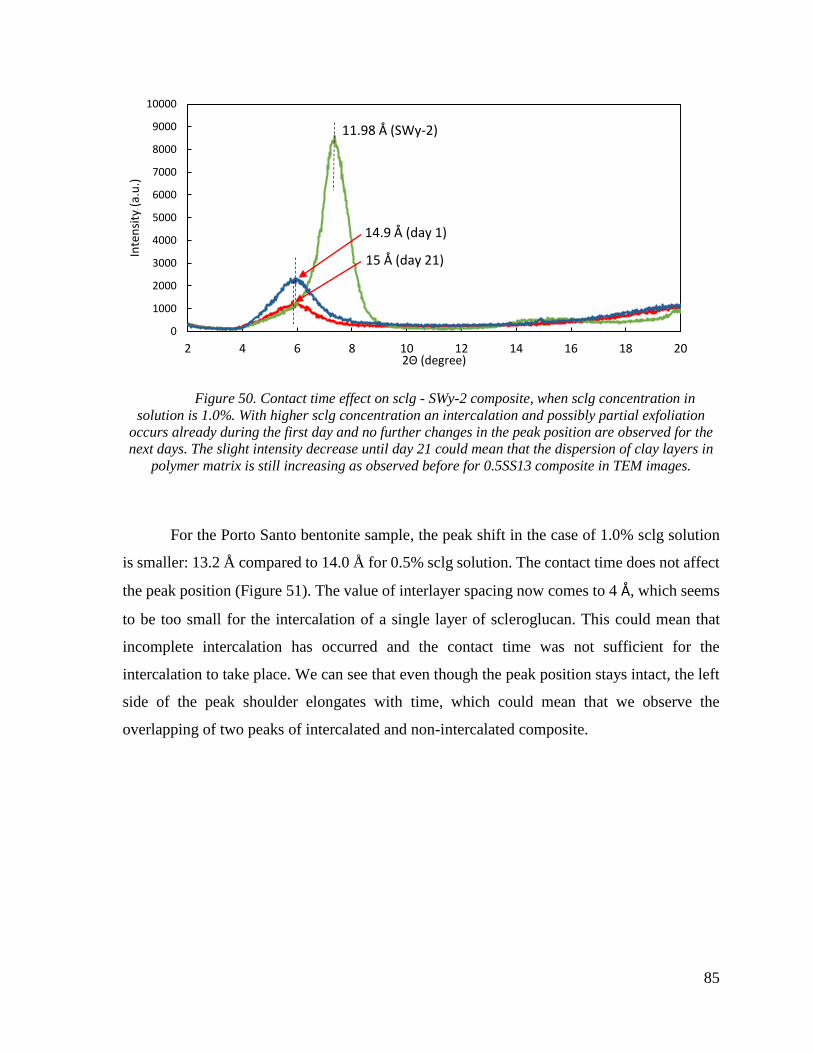
85
Figure 50. Contact time effect on sclg - SWy-2 composite, when sclg concentration in
solution is 1.0%. With higher sclg concentration an intercalation and possibly partial exfoliation
occurs already during the first day and no further changes in the peak position are observed for the
next days. The slight intensity decrease until day 21 could mean that the dispersion of clay layers in
polymer matrix is still increasing as observed before for 0.5SS13 composite in TEM images.
For the Porto Santo bentonite sample, the peak shift in the case of 1.0% sclg solution
is smaller: 13.2 Å compared to 14.0 Å for 0.5% sclg solution. The contact time does not affect
the peak position (Figure 51). The value of interlayer spacing now comes to 4 Å, which seems
to be too small for the intercalation of a single layer of scleroglucan. This could mean that
incomplete intercalation has occurred and the contact time was not sufficient for the
intercalation to take place. We can see that even though the peak position stays intact, the left
side of the peak shoulder elongates with time, which could mean that we observe the
overlapping of two peaks of intercalated and non-intercalated composite.
0
1000
2000
3000
4000
5000
6000
7000
8000
9000
10000
2 4 6 8 10 12 14 16 18 20
Inte
nsi
ty (
a.u
.)
2Θ (degree)
11.98 Å (SWy-2)
14.9 Å (day 1)
15 Å (day 21)
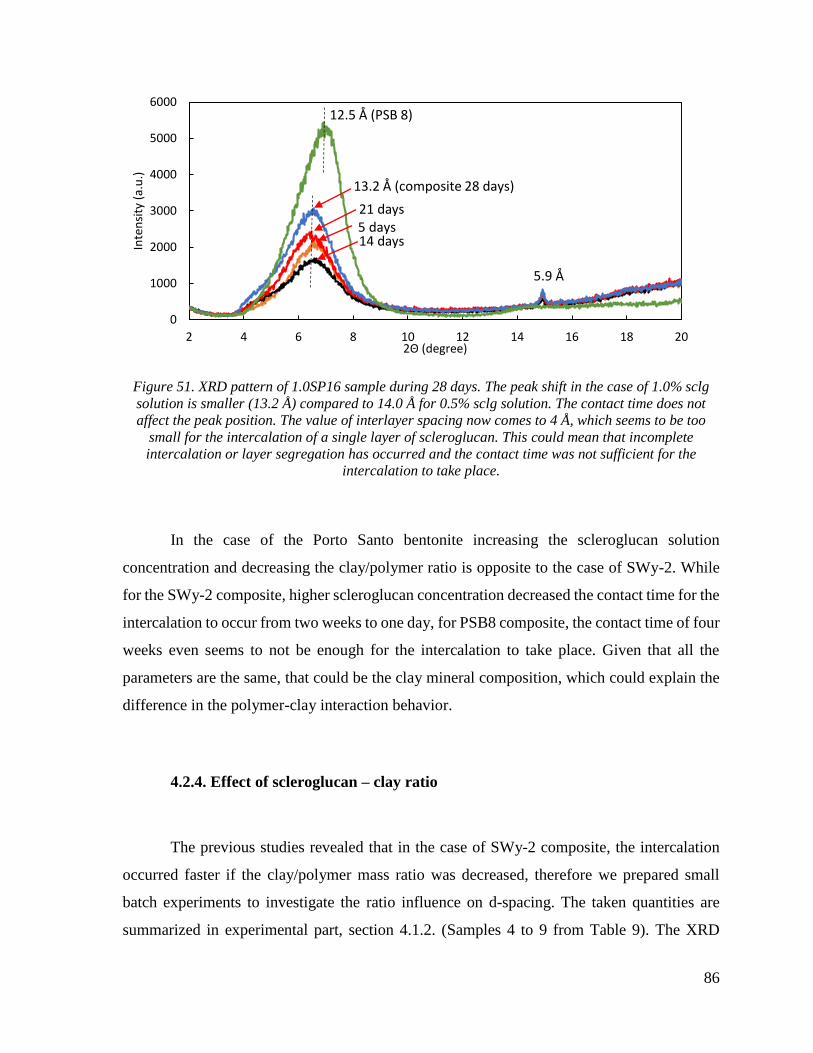
86
Figure 51. XRD pattern of 1.0SP16 sample during 28 days. The peak shift in the case of 1.0% sclg
solution is smaller (13.2 Å) compared to 14.0 Å for 0.5% sclg solution. The contact time does not
affect the peak position. The value of interlayer spacing now comes to 4 Å, which seems to be too
small for the intercalation of a single layer of scleroglucan. This could mean that incomplete
intercalation or layer segregation has occurred and the contact time was not sufficient for the
intercalation to take place.
In the case of the Porto Santo bentonite increasing the scleroglucan solution
concentration and decreasing the clay/polymer ratio is opposite to the case of SWy-2. While
for the SWy-2 composite, higher scleroglucan concentration decreased the contact time for the
intercalation to occur from two weeks to one day, for PSB8 composite, the contact time of four
weeks even seems to not be enough for the intercalation to take place. Given that all the
parameters are the same, that could be the clay mineral composition, which could explain the
difference in the polymer-clay interaction behavior.
4.2.4. Effect of scleroglucan – clay ratio
The previous studies revealed that in the case of SWy-2 composite, the intercalation
occurred faster if the clay/polymer mass ratio was decreased, therefore we prepared small
batch experiments to investigate the ratio influence on d-spacing. The taken quantities are
summarized in experimental part, section 4.1.2. (Samples 4 to 9 from Table 9). The XRD
0
1000
2000
3000
4000
5000
6000
2 4 6 8 10 12 14 16 18 20
Inte
nsi
ty (
a.u
.)
2Θ (degree)
12.5 Å (PSB 8)
13.2 Å (composite 28 days)
5.9 Å
21 days 5 days 14 days

87
patterns revealed that the d001 value for intercalated composites reaches 14.5 Å after 3 days
with two exceptions (Figure 52). The samples having high amount of clay over the biopolymer,
showed a d001 of 13 Å, a value closer to pristine clay. After two weeks, the tendency was kept,
but the sample having a clay-polymer ratio 1:1 did show the increase of d-spacing, which could
indicate that the intercalation has taken place despite the high amount of the clay present. A
general observation for non-ionic polymers states that surface accessibility is the most
important factor determining the interaction process (Theng, 2012). Therefore a smaller
concentration could enhance the clay layer dispersion and the intercalation process, because
more surface is accessible for the interaction.
Figure 52. The relation between clay/sclg ratio and d-spacing. The d001 value for intercalated
composites reaches 14.5 Å after 3 days. The two samples having high amount of clay over the
biopolymer, showed a d001 of 13 Å, a value closer to pristine clay. After two weeks the tendency was
kept, but the sample having a clay-polymer ratio 1:1 did show the increase of d-spacing, which could
indicate that the intercalation has taken place despite the high amount of the clay present.
4.2.5. Other experimental conditions
We have mentioned in the description about scleroglucan (cf 1.3.1.) that in water, it
adopts a certain specific conformation, a triple helix structure. Two experimental parameters,
solution pH and molecular weight, which can be decreased by sonification, have been reported
12.5
13
13.5
14
14.5
15
15.5
0 10 20 30 40 50 60 70 80 90
d-s
pac
ing
(Å)
Clay content (mass %)
after 3 days
after 14 days
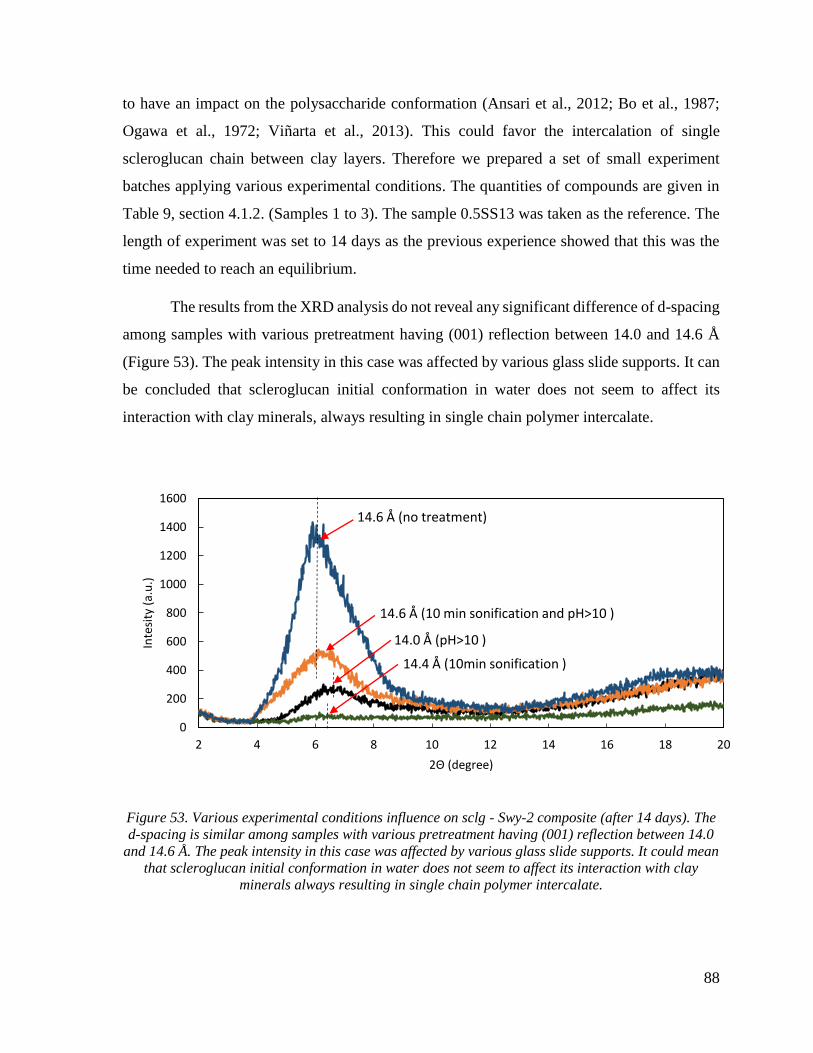
88
to have an impact on the polysaccharide conformation (Ansari et al., 2012; Bo et al., 1987;
Ogawa et al., 1972; Viñarta et al., 2013). This could favor the intercalation of single
scleroglucan chain between clay layers. Therefore we prepared a set of small experiment
batches applying various experimental conditions. The quantities of compounds are given in
Table 9, section 4.1.2. (Samples 1 to 3). The sample 0.5SS13 was taken as the reference. The
length of experiment was set to 14 days as the previous experience showed that this was the
time needed to reach an equilibrium.
The results from the XRD analysis do not reveal any significant difference of d-spacing
among samples with various pretreatment having (001) reflection between 14.0 and 14.6 Å
(Figure 53). The peak intensity in this case was affected by various glass slide supports. It can
be concluded that scleroglucan initial conformation in water does not seem to affect its
interaction with clay minerals, always resulting in single chain polymer intercalate.
Figure 53. Various experimental conditions influence on sclg - Swy-2 composite (after 14 days). The
d-spacing is similar among samples with various pretreatment having (001) reflection between 14.0
and 14.6 Å. The peak intensity in this case was affected by various glass slide supports. It could mean
that scleroglucan initial conformation in water does not seem to affect its interaction with clay
minerals always resulting in single chain polymer intercalate.
0
200
400
600
800
1000
1200
1400
1600
2 4 6 8 10 12 14 16 18 20
Inte
sity
(a.
u.)
2Θ (degree)
14.6 Å (no treatment)
14.6 Å (10 min sonification and pH>10 )
14.0 Å (pH>10 )
14.4 Å (10min sonification )

89
4.3. Conclusion
The studies of scleroglucan – smectite composites have shown that the clay layers can
be dispersed in a scleroglucan matrix with intercalated and exfoliated domains. The distance
between the clay layers in the case of intercalates is approximately 5.3 Å, which indicates that
the intercalation of single chains of scleroglucan has occurred. The type of clay mineral could
have had some effect on the intercalation as well, because comparing PSB8 and SWy-2, the
latter seems to disperse better in the scleroglucan matrix.
Further studies indicated that no significant interaction between the compounds could
be detected and most likely the surface accessibly determines the process, as it was reported
in the case of other neutral polysaccharides. More in-depth studies are needed to establish the
type of interaction between scleroglucan and different smectites.
The investigation of optimum synthesis parameters revealed that the contact time
necessary for the intercalation to take place decreases from two weeks to one day if the
concentration of scleroglucan solution is increased from 0.5% to 1.0% and the clay/polymer
mass ratio is decreased from 1:3 to 1:6. This is true for the composite with SWy-2 clay mineral.
In the case of PSB8, it is the opposite. The intercalation seems to be slower. Given that all the
parameters were the same, it could be the clay mineral composition which could explain the
difference in the polymer-clay interaction behavior.
Other experimental parameters as various clay/polymer mass ratios, solution pH and
prior scleroglucan sonification do not have a notable effect on the scleroglucan and smectite
interactions. The only case the intercalation does not take place is when the amount of polymer
is less than 20%.

90
GENERAL CONCLUSION
This master thesis has followed a path from collecting the clay mineral samples in
Nature to the synthesis of a composite material and its structure investigation.
The clay mineral deposits investigated on Porto Santo Island, Portugal, are mainly from
the smectite family, except the ones in Fonte de Areia having mica-illite and kaolinite type
clay. The reason could be a different primary rock and different climate conditions during the
weathering. Other minerals detected in the fine fraction are feldspars, Fe rich minerals, calcite,
anatase and gypsum, which are all commonly associated with the clay deposits. The possible
applications could be in cosmetics and pharmaceuticals, and also for the preparation of
polymer-clay composite materials. Moreover, they showed low abrasion and high plasticity,
which are also important for these three applications. The sample we chose for the composite
synthesis was the one with the highest clay fraction, small amount of other minerals, having a
smectite type clay mineral, very low abrasion and very high plasticity compared to the other
samples.
The composite synthesis from a biopolymer, scleroglucan, and two clay minerals Na –
montmorillonite (SWy-2) from the Clay Source Repository and previously characterized Porto
Santo bentonite, showed that it is possible to reach a certain level of clay sheets dispersion in
the biopolymer matrix. Some exfoliated areas can be observed by transmission electron
microscopy. Most likely, the interaction between the two compounds is governed by the
surface accessibility, because the study reveals that the slceroglucan – clay mass ratios are the
most important factors, which influence the final structure of the composite and the time of
the interaction. The other factors, such as pH and sonification, do not have such an effect.
The “green” chemistry concept and and the synergism, which both of the composite’s
compounds represent, studied in this master thesis, are promising factors for further studies.
We would need to confirm the best composition of the material with the fast intercalation time.
Then the composite’s film properties (mechanical strength and gas permeability) for a possible
application in food packaging could be tested. Since both compounds are also compatible with
the human body, further investigation of composite’s gel properties and its capability to release
or retain drugs could also be a matter of interest.
91
REFERENCES
Abdul Khalil, H. P. S., Bhat, A. H., & Ireana Yusra, A. F. (2012). Green composites from
sustainable cellulose nanofibrils: A review. Carbohydrate Polymers, 87(2), 963–979.
doi:10.1016/j.carbpol.2011.08.078
Alcântara, A. C. S., Darder, M., Aranda, P., & Ruiz-Hitzky, E. (2012). Zein-Fibrous Clays
Biohybrid Materials. European Journal of Inorganic Chemistry, 0000, 0–0.
doi:10.1002/ejic.201200582
Alexandre, M., & Dubois, P. (2000). Polymer-layered silicate nanocomposites: preparation,
properties and uses of a new class of materials. Materials Science and Engineering: R:
Reports, 28(1–2), 1–63. doi:10.1016/S0927-796X(00)00012-7
Alloway, B. J. (2013). Bioavailability of Elements in Soil. In O. Selinus (Ed.), Essentials of
Medical Geology (pp. 351–373). Dordrecht: Springer Netherlands. doi:10.1007/978-94-
007-4375-5
An, J.-H., & Dultz, S. (2007). Polycation adsorption on montmorillonite: pH and T as
decisive factors for the kinetics and mode of chitosan adsorption. Clay Minerals, 42(3),
329–339. doi:10.1180/claymin.2007.042.3.06
Angellier-Coussy, H., Torres-Giner, S., Morel, M.-H., Gontard, N., & Gastaldi, E. (2008).
Functional Properties of Thermoformed Wheat Gluten / Montmorillonite Materials with
Respect to Formulation and Processing Conditions. Journal of Applied Polymer
Science, 107, 487–496. doi:10.1002/app
Ansari, S. A., Matricardi, P., Meo, C. Di, Alhaique, F., & Coviello, T. (2012). Evaluation of
rheological properties and swelling behaviour of sonicated scleroglucan samples.
Molecules (Basel, Switzerland), 17(3), 2283–97. doi:10.3390/molecules17032283
Arai, T. (2006). Introduction. In B. Beckhoff, B. Kanngießer, N. Langhoff, R. Wedell, & H.
Wolff (Eds.), Handbook of practical X-ray fluorescence analysis (p. 863). Berlin,
Heidelberg: Springer. doi:10.1007/978-3-540-36722-2
Aranda, P., Darder, M., Fernández-Saavedra, R., López-Blanco, M., & Ruiz-Hitzky, E.
(2006). Relevance of polymer– and biopolymer–clay nanocomposites in
electrochemical and electroanalytical applications. Thin Solid Films, 495(1-2), 104–112.
doi:10.1016/j.tsf.2005.08.284
Ayache, J., Beaunier, L., Boumendil, J., Ehret, G., & Laub, D. (2010a). Sample Preparation
Handbook for Transmission Electron Microscopy, 229–256. doi:10.1007/978-1-4419-
5975-1

92
Ayache, J., Beaunier, L., Boumendil, J., Ehret, G., & Laub, D. (2010b). Sample Preparation
Handbook for Transmission Electron Microscopy (pp. 153–228). New York, NY:
Springer New York. doi:10.1007/978-1-4419-5975-1
Bae, H. J., Park, H. J., Hong, S. I., Byun, Y. J., Darby, D. O., Kimmel, R. M., & Whiteside,
W. S. (2009). Effect of clay content, homogenization RPM, pH, and ultrasonication on
mechanical and barrier properties of fish gelatin/montmorillonite nanocomposite films.
LWT - Food Science and Technology, 42(6), 1179–1186. doi:10.1016/j.lwt.2008.12.016
Barrer, R. M., & MacLeod, D. M. (1955). Activation of montmorillonite by ion exchange
and sorption complexes of tetra-alkyl ammonium montmorillonites. Transactions of the
Faraday Society, 51(1290), 1290. doi:10.1039/tf9555101290
Beall, G. W., & Powell, C. E. (2011a). Thermodynamics and kinetics of polymer – clay
nanocomposites. In Fundamentals of Polymer-Clay Nanocomposites (pp. 4–22).
Cambridge: Cambridge University Press.
Beall, G. W., & Powell, C. E. (2011b). Gas diffusion characteristics of polymer – clay
nanocomposites. In Fundamentals of Polymer-Clay Nanocomposites (pp. 35–48).
Cambridge: Cambridge University Press.
Berrada, M., Chevigny, S., & Thibodeau, C. (2005). Polysaccharide phyllosilicate absorbent
or superabsorbent nanocomposite materials. U.S.: United States Patent Application
Publication, US 2005/0214541 A1.
Bluhm, T. L., Deslandes, Y., Marchessault, R. H., Pérez, S., & Rinaudo, M. (1982). Solid-
state and solution conformation of scleroglucan. Carbohydrate Research, 100(1), 117–
130. doi:10.1016/S0008-6215(00)81030-7
Bo, S., Milas, M., & Rinaudo, M. (1987). Behaviour of scleroglucan in aqueous solution
containing sodium hydroxide. International Journal of Biological Macromolecules,
9(3), 153–157. doi:10.1016/0141-8130(87)90043-2
Boeykens, S., Vazquez, C., Temprano, N., & Rosen, M. (2004). Study of a novel labelled
scleroglucan macromolecule. Carbohydrate Polymers, 55(2), 129–137.
doi:10.1016/j.carbpol.2003.08.019
Borden, D., & Giese, R. F. (2001). Baseline Studies of the Clay Minerals Society Source
Clays: Cation Exchange Capacity Measurements by the Ammonia-Electrode Method.
Clays and Clay Minerals, 49(5), 444–445. Retrieved from
http://www.clays.org/SOURCE CLAYS/sc-ccm/444.pdf
Bradley, W. F. (1945). Molecular Associations between Montmorillonite and Some
Polyfunctional Organic Liquids1. Journal of the American Chemical Society, 67(6),
975–981. doi:10.1021/ja01222a028

93
Brigatti, M. F., Galan, E., & Theng, B. K. G. (2006). Chapter 2 Structures and Mineralogy of
Clay Minerals. In B. K. Theng, G. Lagaly and F. Bergaya (Eds.), Handbook of Clay
Science (Vol. 1, pp. 19–86). Elsevier. doi:10.1016/S1572-4352(05)01002-0
Brindley, G. W., & Brown, G. (1982). Crystal Structures of Clay Minerals and their X-ray
Identification (p. 495). Brookfield Pub Co.
Carrado, K. a. (2000). Synthetic organo- and polymer–clays: preparation, characterization,
and materials applications. Applied Clay Science, 17(1-2), 1–23. doi:10.1016/S0169-
1317(00)00005-3
Carrado, K. A., Decarreau, A., Petit, S., Bergaya, F., & Lagaly, G. (2006). Chapter 4
Synthetic Clay Minerals and Purification of Natural Clays. In B. K. Theng, G. Lagaly
and F. Bergaya (Eds.), Handbook of Clay Science (Vol. 1, pp. 115–139). Elsevier.
doi:10.1016/S1572-4352(05)01004-4
Carrado, K. a., & Komadel, P. (2009). Acid Activation of Bentonites and Polymer-Clay
Nanocomposites. Elements, 5(2), 111–116. doi:10.2113/gselements.5.2.111
Catrinescu, C., Fernandes, C., & Castilho, P. (2006). Porto Santo Clays as Environmentally
Friendly Catalysts for the Conversion of Renewable Terpene Feedstocks. Limonene
Aromatization to p-cymene. Environmental Engineering, 5(3), 275–284.
Chamley, H. (1989). Clay Sedimentology (p. 623). Berlin, Heidelberg: Springer-Verlag.
Chen, Q., Liang, S., & Thouas, G. a. (2012). Elastomeric biomaterials for tissue engineering.
Progress in Polymer Science. doi:10.1016/j.progpolymsci.2012.05.003
Chenu, C. (1989). Influence of a fungal polysaccharide, scleroglucan, on clay
microstructures. Soil Biol. Biochem., 21(2), 299–305.
Chenu, C., Pons, C. H., & Robert, M. (1985). Interaction of Kaolinite and Montmorillonite
with Neutral Polysaccharides. In L. G. Schultz, H. van Olphen, & F. A. Mumpton
(Eds.), Proceedings of the International Clay Conference, Denver, 1985 (pp. 375–381).
Bloomington, Indiana: The Clay Minerals Society.
Chevillard, A., Angellier-Coussy, H., Guillard, V., Gontard, N., & Gastaldi, E. (2012).
Investigating the biodegradation pattern of an ecofriendly pesticide delivery system
based on wheat gluten and organically modified montmorillonites. Polymer
Degradation and Stability, 97(10), 2060–2068.
doi:10.1016/j.polymdegradstab.2012.02.017
Chiu, F.-C., Lai, S.-M., Hsieh, I.-C., Don, T.-M., & Huang, C.-Y. (2012). Preparation and
properties of chitosan/clay (nano)composites: a silanol quaternary ammonium
intercalated clay. Journal of Polymer Research, 19(2). doi:10.1007/s10965-011-9781-5
94
Chivrac, F., Pollet, E., Schmutz, M., & Avérous, L. (2010). Starch nano-biocomposites based
on needle-like sepiolite clays. Carbohydrate Polymers, 80(1), 145–153.
doi:10.1016/j.carbpol.2009.11.004
Clapp, C. E., & Emerson, W. W. (1972). Reactions Between Ca-Montmorillonite and
Polysaccharides. Soil Science, 114(3), 210–216.
Comte, S., Guibaud, G., & Baudu, M. (2006). Relations between extraction protocols for
activated sludge extracellular polymeric substances (EPS) and EPS complexation
properties. Enzyme and Microbial Technology, 38(1-2), 237–245.
doi:10.1016/j.enzmictec.2005.06.016
Dang, Q., Lu, S., Yu, S., Sun, P., & Yuan, Z. (2010). Silk fibroin/montmorillonite
nanocomposites: effect of pH on the conformational transition and clay dispersion.
Biomacromolecules, 11(7), 1796–801. doi:10.1021/bm1002398
Darder, M., Aranda, P., & Ruiz-Hitzky, E. (2007). Bionanocomposites: A New Concept of
Ecological, Bioinspired, and Functional Hybrid Materials. Advanced Materials, 19(10),
1309–1319. doi:10.1002/adma.200602328
Darder, Margarita, Aranda, P., & Ruiz-hitzky, E. (2012). Chitosan-Clay Bio-
Nanocomposites. In L. Avérous & E. Pollet (Eds.), Environmental Silicate Nano-
Biocomposites (pp. 365–391). London: Springer. doi:10.1007/978-1-4471-4108-2
Darder, Margarita, Colilla, M., & Ruiz-Hitzky, E. (2003). Biopolymer−Clay
Nanocomposites Based on Chitosan Intercalated in Montmorillonite. Chemistry of
Materials, 15(20), 3774–3780. doi:10.1021/cm0343047
Delhom, C. D., White-Ghoorahoo, L. a., & Pang, S. S. (2010). Development and
characterization of cellulose/clay nanocomposites. Composites Part B: Engineering,
41(6), 475–481. doi:10.1016/j.compositesb.2009.10.007
Dollimore, D. (2006). Thermal Analysis: Introduction. In Encyclopedia of Analytical
Chemistry (pp. 1–3). John Wiley & Sons, Ltd. doi:10.1002/9780470027318.a6601
Donot, F., Fontana, a., Baccou, J. C., & Schorr-Galindo, S. (2012). Microbial
exopolysaccharides: Main examples of synthesis, excretion, genetics and extraction.
Carbohydrate Polymers, 87(2), 951–962. doi:10.1016/j.carbpol.2011.08.083
Earnest, C. M. (1988). Thermogravimetry of Selected Clays and Clay Products. In C. M.
Earnest (Ed.), Compositional Analysis by Thermogravimetry, ASTM STP 997 (pp. 272–
287). Philadelphia: American Society for Testing and Materials.
Emerson, W W. (1955). Complex Formation between Montmorillonite and High Polymers.
Nature, 176(4479), 461. doi: 10.1038/176461a0

95
Emerson, W. W. (1960). Complexes of Calcium-Montmorillonite with Polymers. Nature,
186, 573–574.
Fernandes, C., Catrinescu, C., Castilho, P., Russo, P. a., Carrott, M. R., & Breen, C. (2007).
Catalytic conversion of limonene over acid activated Serra de Dentro (SD) bentonite.
Applied Catalysis A: General, 318, 108–120. doi:10.1016/j.apcata.2006.10.048
Fernando, M., Jorge, C., Vanin, F. M., Carvalho, R. A. De, Cristina, I., Moraes, F., … José,
P. (2011). Mechanical properties of gelatin nanocomposite films prepared by spreading:
effect of montmorillonite concentration. In iCEF11 International Congress on
Engineering and Food. Athens.
Ferreira, M. R. P., Santos, D., Silva, J. B. P., & Amaral, M. H. (2011). Development of Anti-
Cellulite Peliod Containing Bentonite of Porto Santo Island, Madeira Archipelago. In
GeoMed2011 – 4th International Conference on Medical Geology. Bari.
Gieseking, J. (1939). The Mechanism of Cation Exchange in the Montmorillonite-beidellite-
nontronite Type of Clay Minerals. Soil sci. Williams & Wilkins 1939. Illinois
Agricultural Experiment Station.
Gilman, J. W. (1999). Flammability and Thermal Stability Studies of Polymer Layered-
Silicate (Clay) Nanocomposites. Applied Clay Science, 15, 31–49.
Gilman, Jeffrey W, Jackson, C. L., Morgan, A. B., Harris, R., Giannelis, E. P., Wuthenow,
M., … Phillips, S. H. (2000). Flammability Properties of Polymer - Layered-Silicate
Nanocomposites. Polypropylene and Polystyrene Nanocomposites. Chemistry of
Materials, (5), 1866–1873.
Gomes, C., & Silva, J. (2007). Minerals and clay minerals in medical geology. Applied Clay
Science, 36(1-3), 4–21. doi:10.1016/j.clay.2006.08.006
Gomes, C., & Silva, J. (2012). Porto Santo Island: Unique Natural Health Resort. Funchal:
Madeira Rochas.
Gómez-Avilés, a., Darder, M., Aranda, P., & Ruiz-Hitzky, E. (2010). Multifunctional
materials based on graphene-like/sepiolite nanocomposites. Applied Clay Science, 47(3-
4), 203–211. doi:10.1016/j.clay.2009.10.004
Gómez-Avilés, A., Darder, M., Aranda, P., & Ruiz-Hitzky, E. (2007). Functionalized
Carbon–Silicates from Caramel–Sepiolite Nanocomposites. Angewandte Chemie,
119(6), 941–943. doi:10.1002/ange.200603802
González, A., Dasari, A., Herrero, B., Plancher, E., Santarén, J., Esteban, A., & Lim, S.-H.
(2012). Fire retardancy behavior of PLA based nanocomposites. Polymer Degradation
and Stability, 97(3), 248–256. doi:10.1016/j.polymdegradstab.2011.12.021

96
Greenland, D. J. (1963). Adsorption of polyvinyl alcohols by montmorillonite. Journal of
Colloid Science, 18(7), 647–664. doi:10.1016/0095-8522(63)90058-8
Grim, R. E. (1968). Clay Mineralogy (2nd ed., p. 569). New York: McGraw-Hill.
Gromet, L. P., Haskin, L. a., Korotev, R. L., & Dymek, R. F. (1984). The “North American
shale composite”: Its compilation, major and trace element characteristics. Geochimica
et Cosmochimica Acta, 48(12), 2469–2482. doi:10.1016/0016-7037(84)90298-9
Guggenheim, S., & Martin, R. T. (1995). Definition of clay and clay mineral; joint report of
the AIPEA nomenclature and CMS nomenclature committees. Clays and Clay
Minerals, 43(2), 255–256.
Guilherme, M. R., Mattoso, L. H. C., Gontard, N., Guilbert, S., & Gastaldi, E. (2010).
Synthesis of nanocomposite films from wheat gluten matrix and MMT intercalated with
different quaternary ammonium salts by way of hydroalcoholic solvent casting.
Composites Part A: Applied Science and Manufacturing, 41(3), 375–382.
doi:10.1016/j.compositesa.2009.11.004
Haines, P. J. (2002). Principles of Thermal Analysis and Calorimetry (p. 220). Cambridge:
The Royal Society of Chemistry.
Halleck, F. E. (1967). Polysaccharides and methods for production thereof. USA patent
Ser.No. 319,093.
Hassan-Nejad, M., Ganster, J., Bohn, A., Pinnow, M., & Volkert, B. (2009). Bio-Based
Nanocomposites of Cellulose Acetate and Nano-Clay with Superior Mechanical
Properties. Macromolecular Symposia, 280(1), 123–129. doi:10.1002/masy.200950614
Hendricks, S. B. (1941). Base Exchange of the Clay Mineral Montmorillonite for Organic
Cations and its Dependence upon Adsorption due to van der Waals Forces. The Journal
of Physical Chemistry, 45(1), 65–81. doi:10.1021/j150406a006
Höfer, R., & Selig, M. (2012). 10.02 - Green Chemistry and Green Polymer Chemistry. In
M.Molle (Ed.) Polymer Science: A Comprehensive Reference, (pp. 5–14). Amsterdam:
Elsevier. doi:10.1016/B978-0-444-53349-4.00252-1
Hsu, S., Wang, M.-C., & Lin, J.-J. (2012). Biocompatibility and antimicrobial evaluation of
montmorillonite/chitosan nanocomposites. Applied Clay Science, 56, 53–62.
doi:10.1016/j.clay.2011.09.016
Jacobsen, N. (2007). NMR Spectroscopy Explained. Hoboken: John Wiley & Sons, Inc.
97
Jain, J. A. Y. P., Ayen, W. Y., Domb, A. J., & Kumar, N. (2011). Biodegradable Polymers in
Drug Delivery. In A. J. Domb, N. Kumar, & A. Ezra (Eds.), Biodegradable Polymers in
Clinical Use and Clinical Development (pp. 3–58). Hoboken, NJ, USA: John Wiley &
Sons, Inc. doi:10.1002/9781118015810.ch1
Jeannin, M., Rezzoug, S. A., Cohendoz, S., Allaf, K., Rochelle, D. La, Marillac, A., &
Rochelle, L. (2000). Solid-state 13C NMR Study of Scleroglucan Polysaccharide.
Effect of the Drying Process and Hydration on Scleroglucan Structure and Dynamics.
International Journal of Polymer Analysis and Characterization, 6, 177–191.
Johnson, J., Kirkwood, S., Misaki, A., Nelson, T. E., Scaletti, J. V., & Smith, F. (1963). No
Title. Chem.Ind., 820–822.
Keenan, C. D., Herling, M. M., Siegel, R., Petzold, N., Bowers, C. R., Rössler, E. a, …
Senker, J. (2013). Porosity of pillared clays studied by hyperpolarized 129Xe NMR
spectroscopy and Xe adsorption isotherms. Langmuir: the ACS journal of surfaces and
colloids, 29(2), 643–52. doi:10.1021/la304502r
Klinkenberg, M., Rickertsen, N., Kaufhold, S., Dohrmann, R., & Siegesmund, S. (2009).
Abrasivity by bentonite dispersions. Applied Clay Science, 46(1), 37–42.
doi:10.1016/j.clay.2009.07.004
Kogel, J. E., & Lewis, S. A. (2001). Baseline Studies of the Clay Minerals Society Source
Clays: Chemical Analysis by Inductively Coupled Plasma-Mass Spectroscopy ( ICP-
MS ). Clays and Clay Minerals, 49(5), 387–392.
Kojima, Y., Usuki, A., Kawasumi, M., Okada, A., Fukushima, Y., Kurauchi, T., &
Kamigaito, O. (1993). Mechanical properties of nylon 6-clay hybrid. Journal of
Materials Research, 8(5), 1185–1189.
Komarneni, S. (1986). Characterization of Synthetic and Naturally Occurring Clays by 27Al
and 29Si Magic-Angle Spinning NMR Spectroscopy. Journal of American Ceramic
Society, 47(March), 69–71.
Kottek, M., Grieser, J., Beck, C., Rudolf, B., & Rubel, F. (2006). World Map of the Köppen-
Geiger climate classification updated. Meteorologische Zeitschrift, 15(3), 259–263.
doi:10.1127/0941-2948/2006/0130
Kumar, P., Sandeep, K. P., Alavi, S., Truong, V. D., & Gorga, R. E. (2010). Preparation and
characterization of bio-nanocomposite films based on soy protein isolate and
montmorillonite using melt extrusion. Journal of Food Engineering, 100(3), 480–489.
doi:10.1016/j.jfoodeng.2010.04.035
98
Lagaly, G, Ogawa, M., & Dékány, I. (2013). Chapter 10.3 - Clay Mineral–Organic
Interactions. In F. Bergaya. and G. Lagaly (Eds.), Handbook of Clay Science
Fundamentals (Vol. 5, pp. 435–505). Elsevier. doi:10.1016/B978-0-08-098258-
8.00015-8
Lagaly, Gerhard. (1999). Introduction: from clay mineral – polymer interactions to clay
mineral – polymer nanocomposites. Applied Clay Science, 15(1-2), 1–9.
doi:10.1016/S0169-1317(99)00009-5
Lanson, B. (2011). Modelling of X-ray diffraction profiles: Investigation of defective
lamellar structure crystal chemistry. EMU Notes in Mineralogy, 11, 151–201.
doi:10.1180/EMU-notes.11.4
LeBaron, P. C., Wang, Z., & Pinnavaia, T. J. (1999). Polymer-layered silicate
nanocomposites: an overview. Applied Clay Science, 15(1-2), 11–29.
doi:10.1016/S0169-1317(99)00017-4
Luecha, J., Sozer, N., & Kokini, J. L. (2010). Synthesis and properties of corn
zein/montmorillonite nanocomposite films. Journal of Materials Science, 45(13), 3529–
3537. doi:10.1007/s10853-010-4395-6
MacEwan, D M C. (1948). Complexes of clays with organic compounds. I. Complex
formation between montmorillonite and halloysite and certain organic liquids. Trans.
Faraday Soc., 44(0), 349–367. doi:10.1039/TF9484400349
MacEwan, Douglas M.C. (1944). Identification of the Montmorillonite Group of Minerals by
X-Rays. Nature, 154, 577–578. doi:10.1038/154577b0
MacKenzie, K., & Smith, M. (2002). Experimental Approaches. In Multinuclear Solid-State
NMR of Inorganic Materials (pp. 111–197). Elsevier Ltd.
Madeova´, J., & Komadel, P. (2001). Baseline Studies of the Clay Minerals Society Source
Clays: Infrared Methods. Clays and Clay Minerals, 49(5), 410–432.
Madison, L. L., & Huisman, G. W. (1999). Metabolic Engineering of Poly ( 3-
Hydroxyalkanoates ): From DNA to Plastic. Microbiology and Molecular Biology
Reviews, 63(1), 21–53.
Maier, T., Rau, U., & Dieringer, A. (2003). Process for the Production of Scleroglucan.
Patent WO 2003016545 A2
Mansa, R. (2011). Preparation and Characterization of Novel Montmorillonite
Nanocomposites (Master's thesis). Retrieved from https://www.ruor.uottawa.ca/en/
99
Mansa, R. & Detellier, C. (2013). Preparation and Characterization of Guar-Montmorillonite
Nanocomposites. Materials (Special Issue:Nanocomposites of Polymers and Inorganic
Particles 2013) [SUBMITTED]
Martucci, J. F., Vázquez, A., & Ruseckaite, R. A. (2007). Nanocomposites Based on Gelatin
and Montmorillonite. Morphological and thermal studies. Journal of Thermal Analysis
and Calorimetry, 89, 117–122.
McKenzie, K., & Smith, M. (2002). Introduction. In K. MacKenzie & M. Smith (Eds.),
Multinuclear Solid-State NMR of Inorganic Materials (Vol. 7, pp. 3–19).
doi:10.1017/S1744133112000187
Meunier, A. (2005). Clays. (p. 472) Berlin: Springer-Verlag.
Mieszawska, A. J., Llamas, J. G., Vaiana, C. a, Kadakia, M. P., Naik, R. R., & Kaplan, D. L.
(2011). Clay enriched silk biomaterials for bone formation. Acta biomaterialia, 7(8),
3036–41. doi:10.1016/j.actbio.2011.04.016
Mitchell, J. K., & Soga, K. (2005). Soil Composition and Engineering Properties. In
Fundamentals of Soil Behavior (3rd Edition) (pp. 83–108). New Yersey: John Wiley &
Sons.
Moore, D., & Reynolds, R. (1989). Identification of Clay Minerals and Associated Minerals.
In X-ray Diffraction and the Identification and Analysis of Clay Minerals (pp. 202–
240). New York: Oxford University Press.
Moore, D., & Reynolds, R. (1997). Structure, Nomenclature and Occurrences of Individual
Clay Minerals. In X-ray Diffraction and the Identification and Analysis of Clay
Minerals (2nd ed., pp. 138–203). Oxford University Press.
Murray, H. H. (1988). Kaolin minerals; their genesis and occurrences. Reviews in
Mineralogy and Geochemistry, 19(1), 67–89.
Najafi, N., Heuzey, M. C., & Carreau, P. J. (2012). Polylactide (PLA)-clay nanocomposites
prepared by melt compounding in the presence of a chain extender. Composites Science
and Technology, 72(5), 608–615. doi:10.1016/j.compscitech.2012.01.005
Narayan, R., Balakrishnan, S., Nabar, Y., Shin, B.-Y., Dubois, P., & Raquez, J.-M. (2006).
Chemically Modified Plasticized Starch Compositions by Extrusion Processing. USA
Patent, No.: US 7,153,354 B2.
Nunes, C. D., Pires, J., Carvalho, A. P., Calhorda, M. J., & Ferreira, P. (2008). Synthesis and
characterisation of organo-silica hydrophobic clay heterostructures for volatile organic
compounds removal. Microporous and Mesoporous Materials, 111(1-3), 612–619.
doi:10.1016/j.micromeso.2007.09.008

100
Ogawa, K., Wanatabe, T., Tsurugi, J., & Ono, S. (1972). Conformational behavior of a gel-
forming (1→3)-β-D-glucan in alkaline solution. Carbohydrate Research, 23(3), 399–
405. doi:10.1016/S0008-6215(00)82709-3
Okada, A., & Usuki, A. (2006). Twenty Years of Polymer-Clay Nanocomposites.
Macromolecular Materials and Engineering, 291(12), 1449–1476.
doi:10.1002/mame.200600260
Okamoto, M. (2012). Polylactide/Clay Nano-Biocomposites. In L. Avérous & E. Pollet
(Eds.), Environmental Silicate Nano-Biocomposites (pp. 77–118). London: Springer
London. doi:10.1007/978-1-4471-4108-2
Pandey, J. K., Lee, S., Kim, H., Takagi, H., Lee, C. S., & Ahn, S. H. (2012). Preparation and
Properties of Cellulose-Based Nano Composites of Clay and Polypropylene. Journal of
Applied Polymer Science, 125, 651–660. doi:10.1002/app.34546
Patil, A. J., Muthusamy, E., & Mann, S. (2005). Fabrication of functional protein–organoclay
lamellar nanocomposites by biomolecule-induced assembly of exfoliated aminopropyl-
functionalized magnesium phyllosilicates. Journal of Materials Chemistry, 15(35-36),
3838. doi:10.1039/b504288g
Patterson, G. (2012). A prehistory of polymer science (p. 49). New York: Springer.
Petit, S. (2006). Chapter 12.6 Fourier Transform Infrared Spectroscopy. In B. K. Theng, G.
Lagaly and F. Bergaya (Eds.), Handbook of Clay Science (Vol. 1, pp. 909–918).
Elsevier. doi:10.1016/S1572-4352(05)01032-9
Pinnavaia, T. J., & Beall, G. W. (Eds.). (2000). Polymer - Clay Nanocomposites (p. 349).
Chichester, UK: John Wiley & Sons, Ltd.
Plackett, D. (2012). PHA/Clay Nano-Biocomposites. In L. Avérous & E. Pollet (Eds.),
Environmental Silicate Nano-Biocomposites (pp. 143–163). London: Springer London.
doi:10.1007/978-1-4471-4108-2
Plastics – the Facts 2012 An analysis of European plastics production , demand and waste
data for 2011. (2012) (p. 40).
Pretus, H. a, Ensley, H. E., McNamee, R. B., Jones, E. L., Browder, I. W., & Williams, D. L.
(1991). Isolation, physicochemical characterization and preclinical efficacy evaluation
of soluble scleroglucan. The Journal of pharmacology and experimental therapeutics,
257(1), 500–10.
Rajesh, N., Uma, N., & Valluru, R. (2012). Natural Polymers-A Boon for Drug Delivery. In
V. Mittal (Ed.), Renewable Polymers - Synthesis, Processing, and Technology. (pp.
429–472). Wiley - Scrivener.
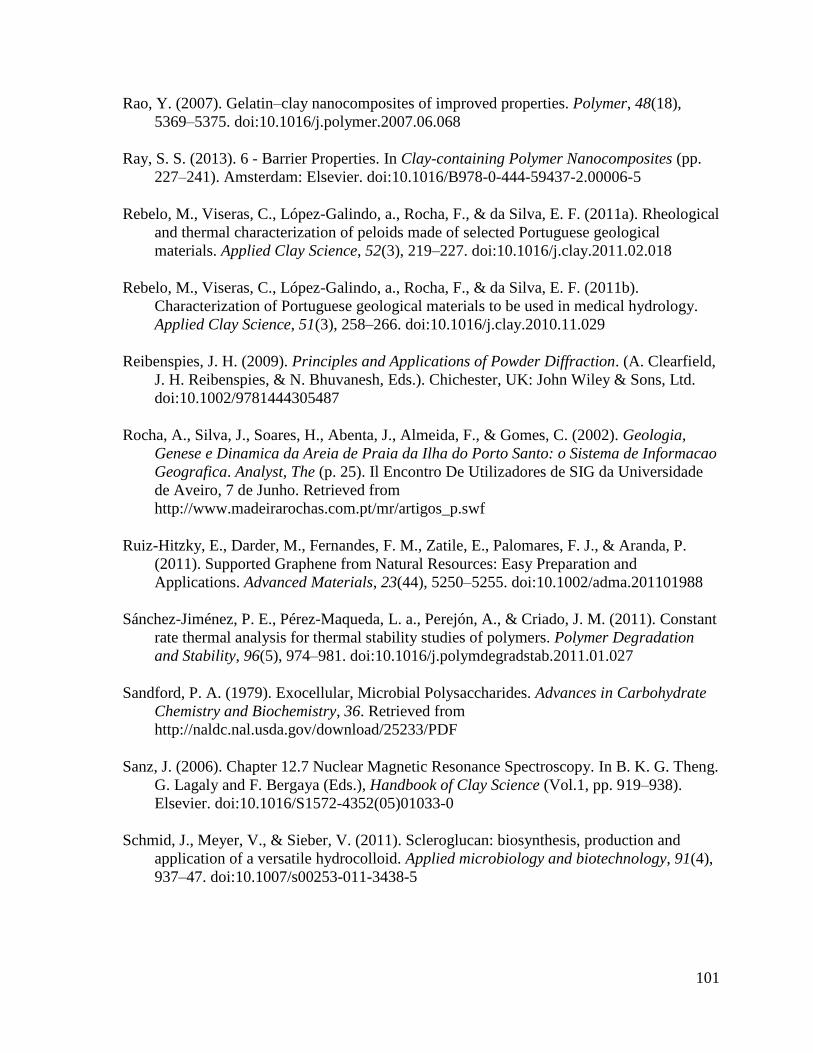
101
Rao, Y. (2007). Gelatin–clay nanocomposites of improved properties. Polymer, 48(18),
5369–5375. doi:10.1016/j.polymer.2007.06.068
Ray, S. S. (2013). 6 - Barrier Properties. In Clay-containing Polymer Nanocomposites (pp.
227–241). Amsterdam: Elsevier. doi:10.1016/B978-0-444-59437-2.00006-5
Rebelo, M., Viseras, C., López-Galindo, a., Rocha, F., & da Silva, E. F. (2011a). Rheological
and thermal characterization of peloids made of selected Portuguese geological
materials. Applied Clay Science, 52(3), 219–227. doi:10.1016/j.clay.2011.02.018
Rebelo, M., Viseras, C., López-Galindo, a., Rocha, F., & da Silva, E. F. (2011b).
Characterization of Portuguese geological materials to be used in medical hydrology.
Applied Clay Science, 51(3), 258–266. doi:10.1016/j.clay.2010.11.029
Reibenspies, J. H. (2009). Principles and Applications of Powder Diffraction. (A. Clearfield,
J. H. Reibenspies, & N. Bhuvanesh, Eds.). Chichester, UK: John Wiley & Sons, Ltd.
doi:10.1002/9781444305487
Rocha, A., Silva, J., Soares, H., Abenta, J., Almeida, F., & Gomes, C. (2002). Geologia,
Genese e Dinamica da Areia de Praia da Ilha do Porto Santo: o Sistema de Informacao
Geografica. Analyst, The (p. 25). Il Encontro De Utilizadores de SIG da Universidade
de Aveiro, 7 de Junho. Retrieved from
http://www.madeirarochas.com.pt/mr/artigos_p.swf
Ruiz-Hitzky, E., Darder, M., Fernandes, F. M., Zatile, E., Palomares, F. J., & Aranda, P.
(2011). Supported Graphene from Natural Resources: Easy Preparation and
Applications. Advanced Materials, 23(44), 5250–5255. doi:10.1002/adma.201101988
Sánchez-Jiménez, P. E., Pérez-Maqueda, L. a., Perejón, A., & Criado, J. M. (2011). Constant
rate thermal analysis for thermal stability studies of polymers. Polymer Degradation
and Stability, 96(5), 974–981. doi:10.1016/j.polymdegradstab.2011.01.027
Sandford, P. A. (1979). Exocellular, Microbial Polysaccharides. Advances in Carbohydrate
Chemistry and Biochemistry, 36. Retrieved from
http://naldc.nal.usda.gov/download/25233/PDF
Sanz, J. (2006). Chapter 12.7 Nuclear Magnetic Resonance Spectroscopy. In B. K. G. Theng.
G. Lagaly and F. Bergaya (Eds.), Handbook of Clay Science (Vol.1, pp. 919–938).
Elsevier. doi:10.1016/S1572-4352(05)01033-0
Schmid, J., Meyer, V., & Sieber, V. (2011). Scleroglucan: biosynthesis, production and
application of a versatile hydrocolloid. Applied microbiology and biotechnology, 91(4),
937–47. doi:10.1007/s00253-011-3438-5
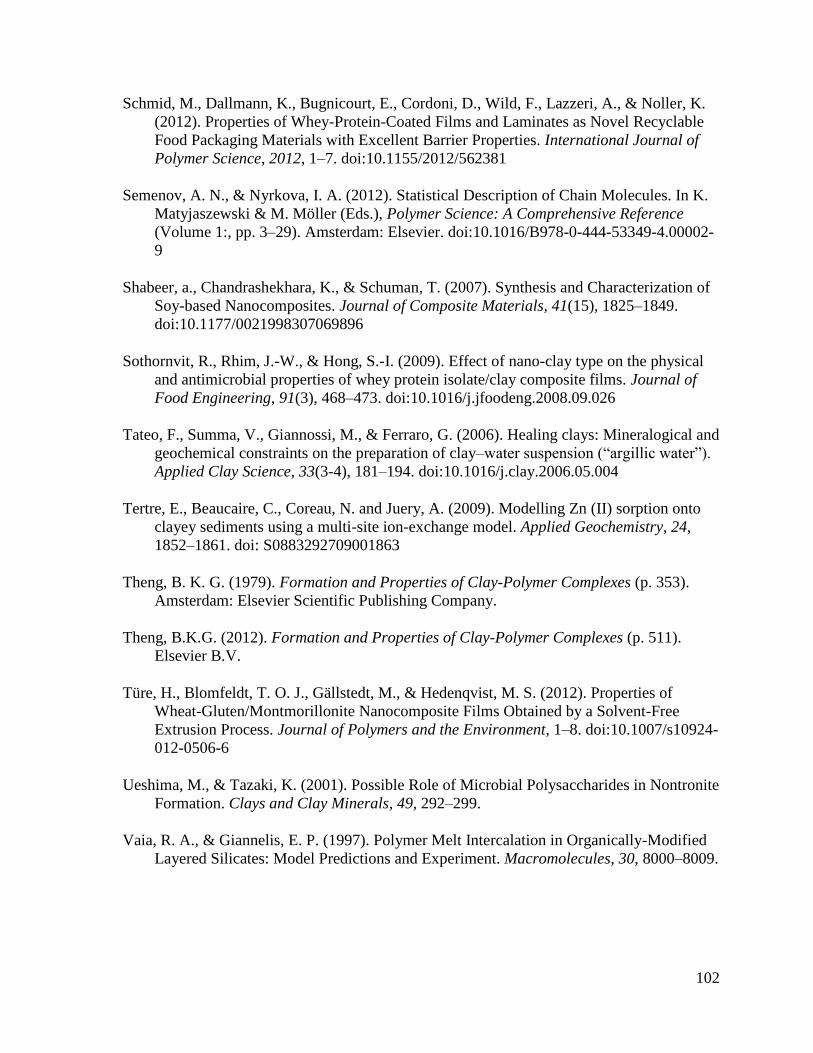
102
Schmid, M., Dallmann, K., Bugnicourt, E., Cordoni, D., Wild, F., Lazzeri, A., & Noller, K.
(2012). Properties of Whey-Protein-Coated Films and Laminates as Novel Recyclable
Food Packaging Materials with Excellent Barrier Properties. International Journal of
Polymer Science, 2012, 1–7. doi:10.1155/2012/562381
Semenov, A. N., & Nyrkova, I. A. (2012). Statistical Description of Chain Molecules. In K.
Matyjaszewski & M. Möller (Eds.), Polymer Science: A Comprehensive Reference
(Volume 1:, pp. 3–29). Amsterdam: Elsevier. doi:10.1016/B978-0-444-53349-4.00002-
9
Shabeer, a., Chandrashekhara, K., & Schuman, T. (2007). Synthesis and Characterization of
Soy-based Nanocomposites. Journal of Composite Materials, 41(15), 1825–1849.
doi:10.1177/0021998307069896
Sothornvit, R., Rhim, J.-W., & Hong, S.-I. (2009). Effect of nano-clay type on the physical
and antimicrobial properties of whey protein isolate/clay composite films. Journal of
Food Engineering, 91(3), 468–473. doi:10.1016/j.jfoodeng.2008.09.026
Tateo, F., Summa, V., Giannossi, M., & Ferraro, G. (2006). Healing clays: Mineralogical and
geochemical constraints on the preparation of clay–water suspension (“argillic water”).
Applied Clay Science, 33(3-4), 181–194. doi:10.1016/j.clay.2006.05.004
Tertre, E., Beaucaire, C., Coreau, N. and Juery, A. (2009). Modelling Zn (II) sorption onto
clayey sediments using a multi-site ion-exchange model. Applied Geochemistry, 24,
1852–1861. doi: S0883292709001863
Theng, B. K. G. (1979). Formation and Properties of Clay-Polymer Complexes (p. 353).
Amsterdam: Elsevier Scientific Publishing Company.
Theng, B.K.G. (2012). Formation and Properties of Clay-Polymer Complexes (p. 511).
Elsevier B.V.
Türe, H., Blomfeldt, T. O. J., Gällstedt, M., & Hedenqvist, M. S. (2012). Properties of
Wheat-Gluten/Montmorillonite Nanocomposite Films Obtained by a Solvent-Free
Extrusion Process. Journal of Polymers and the Environment, 1–8. doi:10.1007/s10924-
012-0506-6
Ueshima, M., & Tazaki, K. (2001). Possible Role of Microbial Polysaccharides in Nontronite
Formation. Clays and Clay Minerals, 49, 292–299.
Vaia, R. A., & Giannelis, E. P. (1997). Polymer Melt Intercalation in Organically-Modified
Layered Silicates: Model Predictions and Experiment. Macromolecules, 30, 8000–8009.

103
Vazquez, A., Cyras, V. P., Alvarez, V. A., & Moran, J. I. (2012). Starch/Clay Nano-
Biocomposites. In L. Avérous & E. Pollet (Eds.), Environmental Silicate Nano-
Biocomposites (pp. 287–321). London: Springer London. doi:10.1007/978-1-4471-
4108-2
Vilaseca, F., Mutje, P., & Peijs, T. (2010). Research and Development on Cellulose-Based
Nanocomposites. In A. Tiwari (Ed.), Polysaccharides: Development, properties and
applications (pp. 449–476). New York: Nova Science Publishers, Inc.
Viñarta, S. C., Delgado, O. D., Figueroa, L. I. C., & Fariña, J. I. (2013). Effects of thermal,
alkaline and ultrasonic treatments on scleroglucan stability and flow behavior.
Carbohydrate Polymers, 94(1), 496–504. doi:10.1016/j.carbpol.2013.01.063
Vroman, I., & Tighzert, L. (2009). Biodegradable Polymers. Materials, 2, 307–344.
doi:10.3390/ma2020307
White, L., & Delhom, C. (2005). Nanocomposites of cellulose and clay. United States:
United States Patent Application Publication.
Whitfield, C. (1988). Bacterial extracellular polysaccharides. Canadian Journal of
Microbiology, 34, 415–420. doi:10.1007/978-94-007-0940-9_13
Xu, B., Zheng, Q., Song, Y., & Shangguan, Y. (2006). Calculating barrier properties of
polymer/clay nanocomposites: Effects of clay layers. Polymer, 47(8), 2904–2910.
doi:10.1016/j.polymer.2006.02.069
Xu, Y., Ren, X., & Hanna, M. a. (2006). Chitosan/clay nanocomposite film preparation and
characterization. Journal of Applied Polymer Science, 99(4), 1684–1691.
doi:10.1002/app.22664
Yamamoto, K., Otsuka, H., Wada, S.-I., Sohn, D., & Takahara, A. (2005). Transparent
polymer nanohybrid prepared by in situ synthesis of aluminosilicate nanofibers in
poly(vinyl alcohol) solution. Soft Matter, 1(5), 372–377. doi:10.1039/B508669H
Yanaki, T., & Norisuye, T. (1983). Triple Helix and Random Coil of Scleroglucan in Dilute
Solution. Polymer Journal, 15(5), 389 – 396.
Zeng, Q., Yu, A., Lu, G., & Paul, D. (2005). Clay-based polymer nanocomposites: research
and commercial development. Journal of Nanoscience and Nanotechnology, 5(10),
1574 – 1592. doi:10.1166/jnn.2005.411
Zhang, X., Dean, K., & Burgar, I. M. (2010). A high-resolution solid-state NMR study on
starch–clay nanocomposites and the effect of aging on clay dispersion. Polymer
Journal, 42(8), 689–695. doi:10.1038/pj.2010.48

104
Zhang, X., Do, M. D., Dean, K., Hoobin, P., & Burgar, I. M. (2007). Wheat-gluten-based
natural polymer nanoparticle composites. Biomacromolecules, 8(2), 345–53.
doi:10.1021/bm060929x
Zheng, J. P., Li, P., Ma, Y. L., & Yao, K. De. (2002). Gelatin/montmorillonite hybrid
nanocomposite. I. Preparation and properties. Journal of Applied Polymer Science,
86(5), 1189–1194. doi:10.1002/app.11062
Zhou, C.-H., Zhang, D., Tong, D.-S., Wu, L.-M., Yu, W.-H., & Ismadji, S. (2012). Paper-
like composites of cellulose acetate–organo-montmorillonite for removal of hazardous
anionic dye in water. Chemical Engineering Journal, 209, 223–234.
doi:10.1016/j.cej.2012.07.107

105
APPENDIX

106
View of the sampling sites on Porto Santo Island
Figure 54. Sampling sites on Porto Santo Island.
Figure 55. General look of sampling site I, Serra de Dentro.
V
I
II
IV
III
1
2 3
4,5
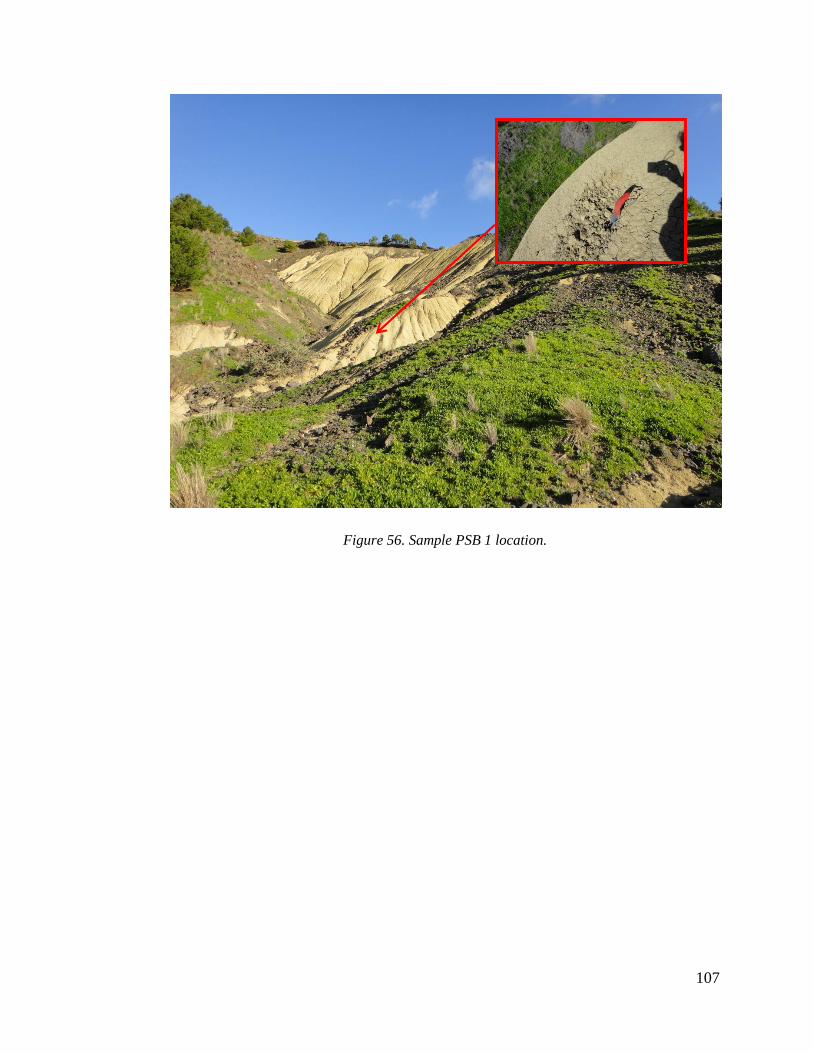
107
Figure 56. Sample PSB 1 location.
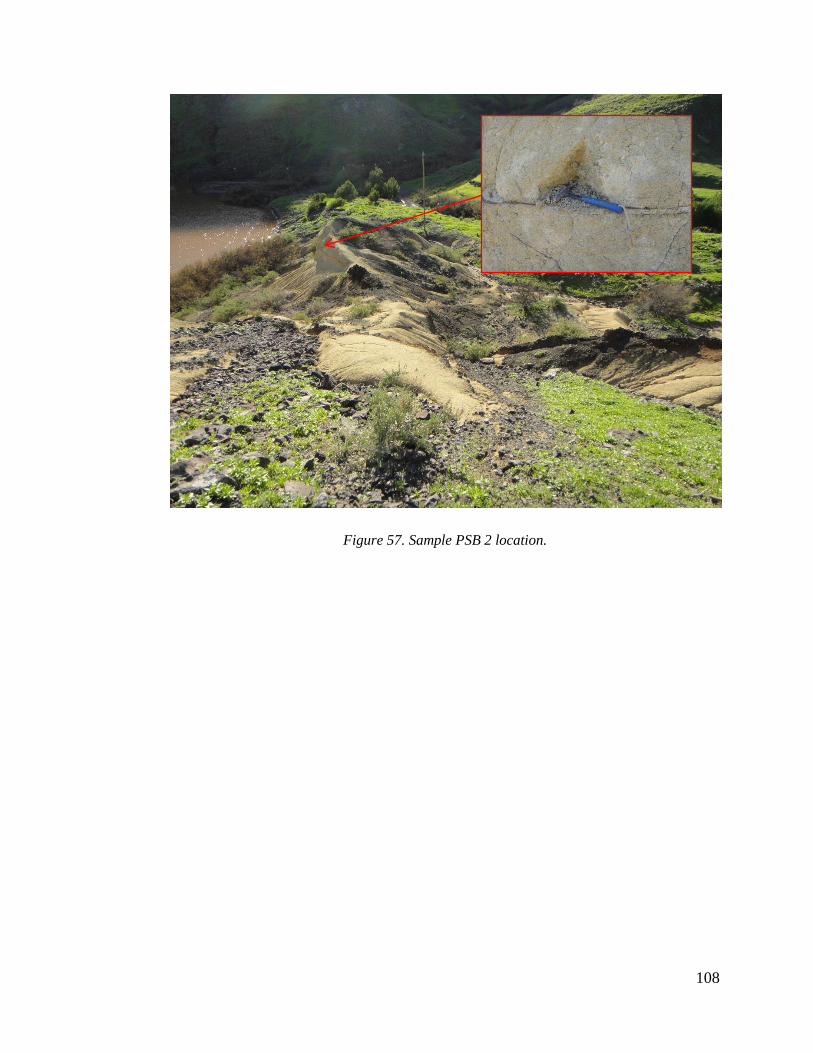
108
Figure 57. Sample PSB 2 location.
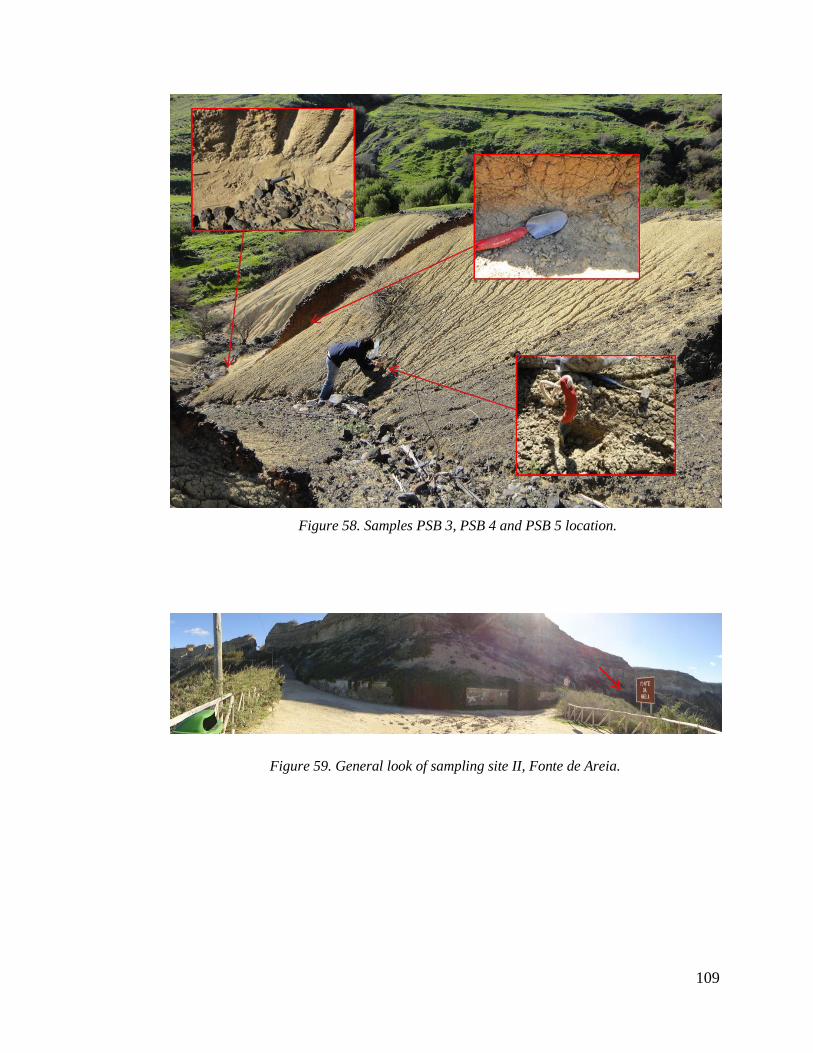
109
Figure 59. General look of sampling site II, Fonte de Areia.
Figure 58. Samples PSB 3, PSB 4 and PSB 5 location.
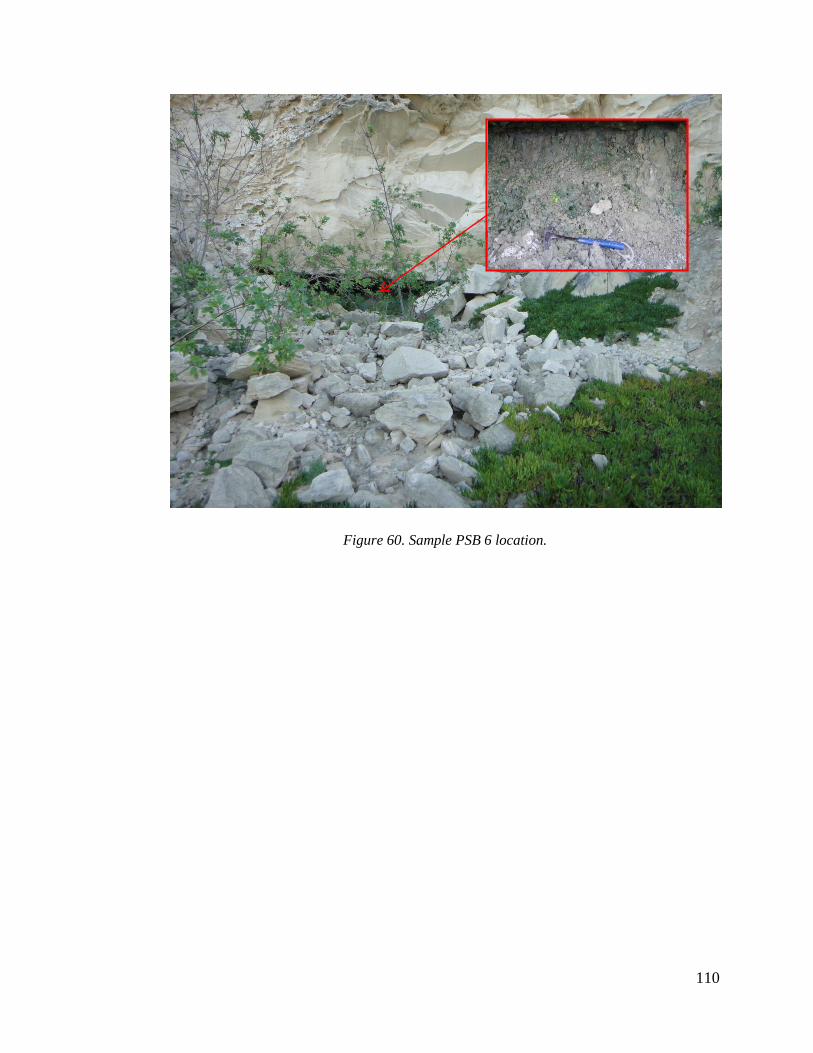
110
Figure 60. Sample PSB 6 location.

111
Figure 61. Sample PSB 7 location.
Figure 62. General view of sampling site III, Ponta.
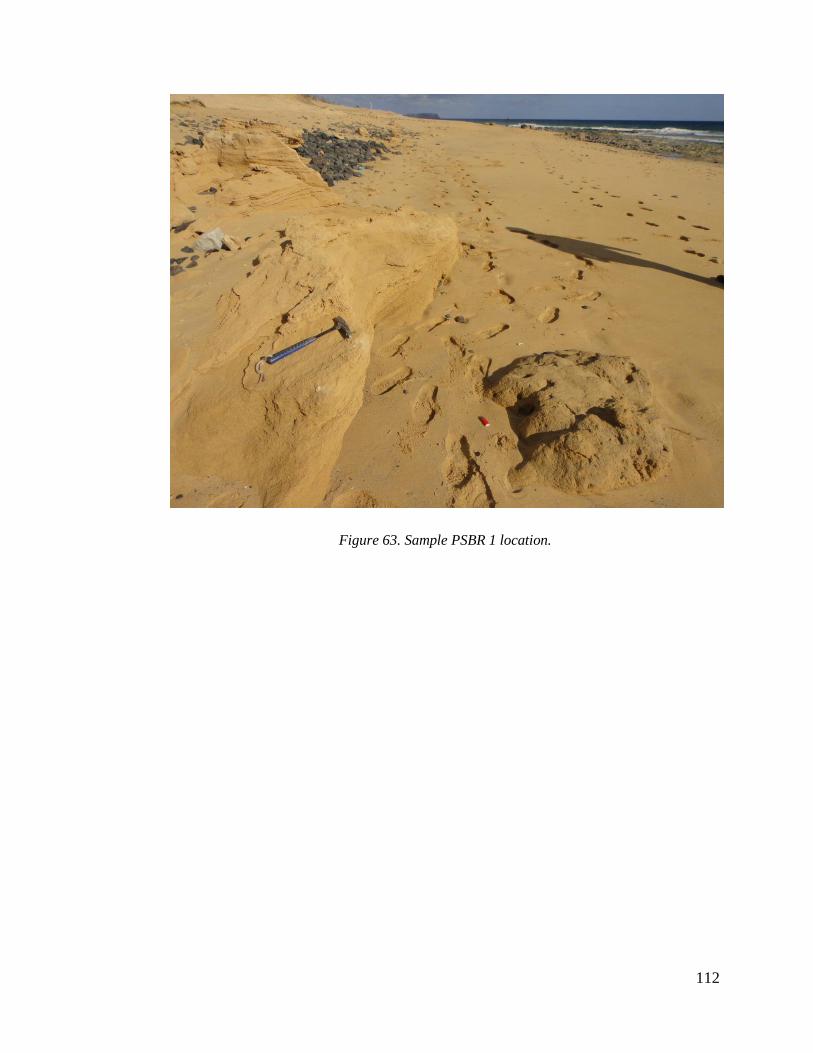
112
Figure 63. Sample PSBR 1 location.

113
Figure 64. Samples PSBR 2 and PSBR 3 location.
Figure 65. General view of sampling site IV, Capela Nossa Senhora Graça.
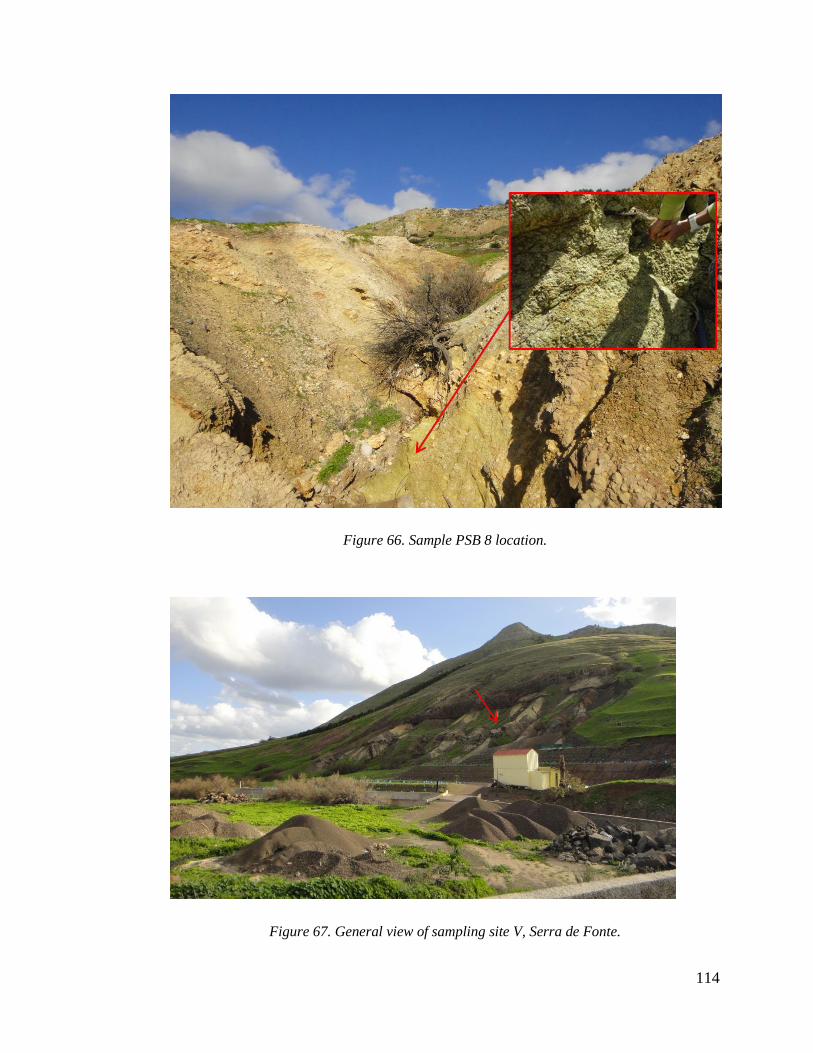
114
Figure 66. Sample PSB 8 location.
Figure 67. General view of sampling site V, Serra de Fonte.

115
Figure 68. Sample PSB 9 location.