synthesis of solid acid catalyst from biomass waste...
TRANSCRIPT

SYNTHESIS OF SOLID ACID CATALYST FROM BIOMASS WASTE FOR
GLYCEROL-FREE BIODIESEL PRODUCTION
WONG WAN YING
A project report submitted in partial fulfilment of the
requirements for the award of Bachelor of Engineering
(Hons.) Chemical Engineering
Lee Kong Chian Faculty of Engineering and Science
Universiti Tunku Abdul Rahman
September 2018

ii
DECLARATION
I hereby declare that this project report is based on my original work except for
citations and quotations which have been duly acknowledged. I also declare that it has
not been previously and concurrently submitted for any other degree or award at
UTAR or other institutions.
Signature :
Name : Wong Wan Ying
ID No. : 14UEB06865
Date : 18th September 2018

iii
APPROVAL FOR SUBMISSION
I certify that this project report entitled “SYNTHESIS OF SOLID ACID
CATALYST FROM BIOMASS WASTE FOR GLYCEROL-FREE BIODIESEL
PRODUCTION” was prepared by WONG WAN YING has met the required
standard for submission in partial fulfilment of the requirements for the award of
Bachelor of Engineering (Hons.) Chemical Engineering at Universiti Tunku Abdul
Rahman.
Approved by,
Signature :
Supervisor : Dr. Steven Lim
Date : 18th September 2018
Signature :
Co-Supervisor : Dr. Pang Yean Ling
Date : 18th September 2018

iv
The copyright of this report belongs to the author under the terms of the
copyright Act 1987 as qualified by Intellectual Property Policy of Universiti Tunku
Abdul Rahman. Due acknowledgement shall always be made of the use of any material
contained in, or derived from, this report.
© 2018, Wong Wan Ying. All right reserved.

v
ACKNOWLEDGEMENTS
The completion of this research project would not have been a success if it was not for
the participation, assistance and support of many individuals. First and foremost, I
would like to express my utmost gratitude to my research supervisors, Dr. Steven Lim
and Dr. Pang Yean Ling for bestowing such precious chance in allowing me to conduct
my final year project under their supervisions. I am indebted to them for their
invaluable advice, guidance and enormous patience throughout the development of the
research.
Next, my deepest thanks to Universiti Tunku Abdul Rahman (UTAR) for
providing me a great platform and learning ground to complete my final year project.
Throughout the project, I was very fortunate to be blessed with the technical supports
from all Assistant Laboratory Managers of Department of Chemical Engineering in
Lee Kong Chian Faculty of Engineering and Science.
Last but not least, I would also like to express my greatest gratitude to my
loving parents who had given me consistent support and encouragement during my
venture. Not to forget all postgraduate students and course mates who had offered
invaluable suggestions and assistance unconditionally.

vi
ABSTRACT
Nowadays, homogeneous alkali-catalysed transesterification is the typical process
used in biodiesel production, complicating the downstream separation processes and
causing oversupply of glycerol as by-product. In the present study, glycerol-free
biodiesel production via interesterification by using biomass waste derived solid acid
catalyst was investigated for the first time. Triacetin, a beneficial fuel additive, was
produced as by-product instead of glycerol. The aim of this study was to elucidate on
the potential applicability of waste banana peels in deriving a heterogenous catalyst.
The solid acid catalyst was prepared by direct sulfonation via thermal treatment with
sulfuric acid and its catalytic activity was investigated for the interesterification
between oleic acid and methyl acetate. Concentration of the sulfuric acid which was
the sulfonating agent was varied from 2 to 13 mol/L to evaluate its effects on the
resulting biodiesel yield. Catalyst characterisation was also carried out using Scanning
Electron Microscopy equipped Energy-Dispersive X-ray (SEM-EDX), X-ray
Diffractometer (XRD) and Fourier Transform Infrared Spectroscopy (FTIR). The
interesterification of oleic acid with methyl acetate was catalysed using the synthesised
catalyst under reaction conditions of methyl acetate to oleic acid molar ratio of 50:1
and catalyst loading of 12 wt.% at 60 °C for 8 h. The biodiesel yield increased with
the concentration of sulfuric acid used to synthesise catalysts. It was found out that a
yield of 43.81 % with a high acid value conversion of 83.14 % was obtained. This
study proved that the biomass waste derived heterogeneous catalyst catalysed
interesterification of oleic acid with methyl acetate is a promising and environmentally
benign approach for production of green fuel.

vii
TABLE OF CONTENTS
DECLARATION ii
APPROVAL FOR SUBMISSION iii
ACKNOWLEDGEMENTS v
ABSTRACT vi
TABLE OF CONTENTS vii
LIST OF TABLES x
LIST OF FIGURES xii
LIST OF SYMBOLS / ABBREVIATIONS xiv
LIST OF APPENDICES xvi
CHAPTER
1 INTRODUCTION 1
1.1 Energy Consumption and Demand 1
1.2 Biodiesel 4
1.3 Problem Statement 6
1.4 Aims and Objectives 7
1.5 Scope and Limitation of the Study 8
1.6 Contribution of the Study 8
1.7 Outline of the Report 9
2 LITERATURE REVIEW 10
2.1 Reaction Mechanisms of Biodiesel Production 10
2.1.1 Transesterification 11
2.1.2 Interesterification 12
2.2 Conventional Homogeneous and Heterogeneous Catalyst
in Biodiesel Production 13
2.2.1 Alkaline Catalyst 14

viii
2.2.2 Acidic Catalyst 16
2.2.3 Enzymatic Catalyst 18
2.2.4 Non-Catalytic Supercritical Process 20
2.3 Biomass Derived Carbon-Based Solid Acid Catalyst 22
2.4 Carbonisation and Pre-Treatment of Biomass 24
2.5 Sulfonation of Activated Carbon 25
2.6 Characterisation and Screening of Synthesised Catalyst 27
2.7 Characterisation of Feedstock and Products 29
2.8 Interesterification for Biodiesel Production 31
2.8.1 Optimisation Study 32
2.8.2 Stability and Regeneration Test 33
3 METHODOLOGY AND WORK PLAN 37
3.1 Prerequisite Requirements 37
3.1.1 Raw Materials 37
3.1.2 Chemicals 37
3.1.3 Apparatus, Instruments and Equipment 39
3.2 Overall Research Methodology and Flow Diagram 41
3.3 Experimental Procedures 41
3.3.1 Catalyst Preparation 41
3.3.2 Calcination of Biomass and Sulfonation 43
3.3.3 Biodiesel Production 43
3.4 Feedstock Characterisation: Acid Value 44
3.5 Catalyst Characterisation and Screening 45
3.5.1 Scanning Electron Microscopy Equipped with
Energy Dispersive X-ray (SEM-EDX) 45
3.5.2 X-ray Diffractometer (XRD) 46
3.5.3 Fourier Transform Infrared Spectroscopy (FTIR) 46
3.5.4 Acid Density 46
3.6 Biodiesel Characterisation 47
3.6.1 Gas Chromatography (GC) 47
3.6.2 Acid Value 49

ix
4 RESULTS AND DISCUSSION 50
4.1 Catalyst Characterisation 50
4.1.1 Scanning Electron Microscope (SEM) 50
4.1.2 Energy Dispersive X-ray Spectrometer (EDX) 52
4.1.3 X-ray Diffractometer (XRD) 55
4.1.4 Fourier Transform Infrared Spectroscopy (FTIR) 59
4.1.5 Total Acid Density 61
4.2 Feedstock Characterisation: Acid Value 63
4.3 Biodiesel Characterisation 64
4.3.1 Gas Chromatography (GC) 64
4.3.2 Acid Value Conversion 68
4.4 Comparison with Conventional Transesterification Method 69
4.5 Interesterification with Different Types of Feedstocks 70
5 CONCLUSIONS AND RECOMMENDATIONS 72
5.1 Conclusions 72
5.2 Recommendations for Future Work 73
REFERENCES 75
APPENDICES 84

x
LIST OF TABLES
Table 1.1 : Global Primary Energy Consumption in 2016 (BP, 2017) 1
Table 1.2 : Primary Energy Supply from Year 1996 to 2015 (Energy
Commission, n.d.) 3
Table 2.1 : Transesterification Reaction with Alkaline Catalysts 15
Table 2.2 : Transesterification Reaction with Acidic Catalysts 17
Table 2.3 : Transesterification Reaction with Enzymatic Catalysts 19
Table 2.4 : Supercritical Transesterification Reaction 21
Table 2.5 : Literature Survey on Biomass-Derived Solid Acid Catalyst
for Biodiesel Production 23
Table 2.6 : Carbonisation Conditions for Various Biomass Wastes 24
Table 2.7 : Examples of Fatty Acids 29
Table 2.8 : Interesterification of Biodiesel Production 32
Table 3.1 : List of Chemicals Required 37
Table 3.2 : List of Apparatus and Equipment 39
Table 3.3 : List of Instruments 40
Table 3.4 : Catalyst Synthesis Parameter and Nomenclature 43
Table 3.5 : Gas Chromatography Specifications for Biodiesel Samples 48
Table 4.1 : Surface Elemental Composition in Atomic Percentage 53
Table 4.2 : Data of Diffraction Peaks at 2Ɵ of 23.16° 59
Table 4.3 : Infrared Stretching Frequencies (Thushari and Babel,
2018; Coates, 2006; Niu, et al., 2018) 59

xi
Table 4.4 : Total Acid Densities of Synthesised Catalysts at Different
Concentrations of Sulfonating Agent 62
Table 4.5 : Acid Values of Feedstocks 64
Table 4.6 : Methyl Oleate Yields with Different Catalysts Used 66
Table 4.7 : Acid Values of Biodiesel Products 68
Table 4.8 : Biodiesel Yields and Acid Values of Different Feedstocks 70

xii
LIST OF FIGURES
Figure 1.1 : Percentage of Energy Consumption by Sectors in 2014
(Energy Commission, 2016) 4
Figure 1.2 : Statistics of Malaysia Biodiesel Production and
Expenditure and Diesel Consumption (Johari, et al.,
2015) 6
Figure 2.1 : Biodiesel Production Pathways (Calero, et al., 2015) 10
Figure 2.2 : Catalytic Transesterification (Pereira, et al., 2014) 11
Figure 2.3 : Interesterification of TG and MA 12
Figure 2.4 : Biodiesel Production Classification (Nomanbhay and
Ong, 2017) 14
Figure 2.5 : Preparation of Sulfonated Carbon-Based Catalyst
(SCBC) (Abdullah, et al., 2017) 22
Figure 2.6 : Specific Surface Area of Ca/Al Composite Oxide
Catalysts at Different Calcination Temperatures (Meng,
et al., 2013) 33
Figure 2.7 : Reusability of Carbon-Based Acid Catalysts (Reaction
conditions: methanol/oil ratio 12:1, catalyst amount 7.5
wt.%, reaction temperature 60 °C, reaction time 1h and
stirring rate 350 rpm) (Mardhiah, et al., 2017) 34
Figure 2.8 : Sulfur Content of SZTF-3-1 catalyst (Reaction
conditions: methyl acetate/seed ratio 13.8 mL/g,
catalyst amount 21.3 wt.%, reaction temperature 50 °C
and reaction time 10.8 h) (Wu, et al., 2014) 36
Figure 3.1 : Flow Diagram of Research Methodology 42

xiii
Figure 4.1 : SEM Images of Waste Banana Peels, Chemically
Activated Banana Peels, WBPAC and Synthesised
Catalyst Cat-13 at the Magnification of 1000X, (a)
Waste Banana Peels, (b) Chemically Activated Banana
Peels, (c) WBPAC and (d) Cat-13 51
Figure 4.2 : SEM Images of Synthesised Catalysts at the
Magnification of 700X, (a) Cat-2, (b) Cat-3, (c) Cat-8
and (d) Cat-13 52
Figure 4.3 : Sulfur Content of Synthesised Catalysts 55
Figure 4.4 : EDX Analysis Spectrum of Cat-13 55
Figure 4.5 : XRD Patterns of Waste Banana Peels, Chemically
Activated Banana Peels, WBPAC and Synthesised
Catalyst Cat-13 57
Figure 4.6 : XRD Patterns of Synthesised Catalysts 58
Figure 4.7 : Comparison of FTIR Spectra of WBPAC and Cat-13 60
Figure 4.8 : Comparison of FTIR Spectra of All Catalysts 61
Figure 4.9 : Total Acid Density of Synthesised Catalysts at
Different Concentrations of Sulfonating Agent 62
Figure 4.10 : Methyl Oleate Standard Calibration Curve 65
Figure 4.11 : Chromatogram of Interesterification of Oleic Acid with
Methyl Acetate 65
Figure 4.12 : Effect of Concentration of Sulfonating Agent on the
Methyl Oleate Yield 66
Figure 4.13 : Effect of Concentration of Sulfonating Agent on the
Acid Value Conversion 69

xiv
LIST OF SYMBOLS / ABBREVIATIONS
Y yield, %
C conversion, %
V volume of KOH solution used, L
B volume of KOH solution used in blank titration, L
M molarity of KOH solution, mol/L
MWKOH molecular weight of KOH, g/gmol
W Weight of oleic acid, g
Tc critical temperature, °C
Pc critical pressure, Pa
ai initial acid value of the feedstock, mg KOH/g
af final acid value of the mixture after the reaction, mg KOH/g
4-BDS 4-benzenediazoniumsulfonate
BET Brunauer-Emmett-Teller
BP British Petroleum
CI compression ignition
CPO crude palm oil
DAG diacetylglyceride
DMC dimethyl carbonate
DMCMG dimethyl carbonate monoglyceride
EE energy efficiency
FAAE fatty acid alkyl ester
FAME fatty acid methyl ester
FFA free fatty acid
FID flame ionisation detector
FTIR Fourier Transform Infrared Spectroscopy
GC Gas Chromatography
GHG greenhouse gases
ktoe kilo tonnes of oil equivalent
MA methyl acetate
MAG monoacetylglyceride
MCDG methyl carbonate diglyceride

xv
mtoe million tonnes of oil equivalent
RE renewable energy
SCBC sulfonated carbon-based catalysts
SEM-EDX Scanning Electron Microscopy equipped with Energy Dispersive X-
ray
TG triglycerides
TGA thermogravimetric analysis
TPDRO Temperature Programmed Desorption, Reduction and Oxidation
UN United Nations
WBPAC waste banana peel based activated carbon
XPS X-ray Photoelectron Spectroscopy
XRD X-ray Diffractometer

xvi
LIST OF APPENDICES
APPENDIX A: Experimental Progress 84
APPENDIX B: EDX Reports 88
APPENDIX C: FTIR Reports 95
APPENDIX D: GC Reports 100
APPENDIX E: Sample Calculations 110

1
CHAPTER 1
1 INTRODUCTION
1.1 Energy Consumption and Demand
Global demographic problem started to reveal recently with uncontrollable growth of
population as the main concern. From the report titled World Population 2017 in 2017
by Department of Economic and Social Affairs of United Nations (UN), there would
be 7.6 billion people worldwide in mid-2017. It is estimated that there is an increment
of 83 million people annually. This has contributed more demand to the access of
energy over the past decade. Economic growth and global industrialisation further
worsen the situation.
Energy is an indispensable criterion which supports human daily lives.
According to the report in 2017 by U.S. Energy Information Administration, global
energy expenditure will gain 28 % between 2015 and 2040. This shocking number
manifests that energy will be one of the major issues in the world. Table 1.1 shows the
sources of global primary energy consumption in 2016 from the report by British
Petroleum (BP) in 2017. The energy consumption is mostly dependent on fossil fuels
which account for 85.52 % whereby 33.28, 24.13 and 28.11 % are contributed by crude
oil, natural gas and coal, respectively whereas nuclear energy, hydroelectricity and
renewable sources give rise to the remaining share of 14.48 %.
Table 1.1: Global Primary Energy Consumption in 2016 (BP, 2017)
Million Tonnes of Oil Equivalent (mtoe) Share (%)
Oil 4418.2 33.28
Natural Gas 3204.1 24.13
Coal 3732.0 28.11
Nuclear Energy 592.1 4.46
Hydroelectricity 910.3 6.86
Renewables 419.6 3.16
Total 13276.3 100.00

2
In Malaysia, thermal and hydro power plants are the two main types of power
generating plants used to generate electricity from primary energy sources. In the
aspect of thermal power plant, three major fossil fuels which are coal, natural gas and
fuel oil contribute the most to the power generation, leading to unfavourable
consequences for the environment. Despite their relatively easy accessibility,
affordability and compatibility, they cannot be replenished after depleted, thus inviable
for future generations. The burning of fossil fuels also leads to emission of greenhouse
gases (GHG), triggering anthropogenic climate change issue. Over dependency on
non-renewable resources for national electricity generation will jeopardise a reliable
and affordable energy supply. This is due to the fact that excessive exploitation of
fossil fuels can cause their reserves to deplete drastically and affect the energy security
in the near future.
Malaysia is in the progress of achieving the status of developed country by
2020 via sustainable development (Mohamed, Md. and Mazlan, 2016). Sustainable
energy which consists of renewable energy (RE) and energy efficiency (EE) is the
major requirement for sustainable development. Malaysia is a country furnished with
a variety of renewable energy resources such as solar, hydro power, biomass and ocean.
To conquer the problem of environmental conservation and energy security, Malaysia
started to opt for renewable energy in 2001 (Oh, et al., 2018). This had encouraged the
research on alternative and renewable fuels to cater to unrelenting demand. Several
new energy policies and programs have been established to support energy efficiency
and provide energy sustainability.
In addition, Malaysia is well known for its agricultural production and
endowed with continual supply of sunshine and rainfall all the year round. Therefore,
biomass, biogas and solar are the examples of viable RE resources besides
hydroelectricity. Table 1.2 shows the primary energy supply in the unit of kilo tonnes
of oil equivalent (ktoe). It can be seen that, as the years go by, the roles of renewable
sources are getting more important in supplying energy and as a complementary source
to fossil fuels. RE is considered as environmental friendly with negligible GHG
emission. For instance, biomass in RE utilises valuable organic wastes while reducing
the problem of pollution and landfills. Furthermore, biogas is a mixture of gas
produced from the decomposition of organic waste and it is combustible.

3
Table 1.2: Primary Energy Supply from Year 1996 to 2015 (Energy Commission, n.d.)
Year
Primary Energy Supply (ktoe)
Crude Oil Petroleum Products Natural Gas Coal and Coke Hydropower Biodiesel Solar Biomass Biogas
1996 18255 1099 15567 1677 1243
1997 17916 3802 19041 1622 790
1998 17133 1920 19101 1731 1113
1999 17643 1807 21476 1940 1668
2000 21673 -1431 26370 2486 1560
2001 23590 -1917 25649 2970 1687
2002 22647 -521 26101 3642 1329
2003 25344 -1391 27257 5316 1056
2004 25335 -37 29145 6631 1329
2005 24339 -75 33913 6889 1313
2006 24909 -1474 35776 7299 1568
2007 26571 -995 36639 8848 1510
2008 26776 -2282 39289 9782 1964
2009 26386 96 35851 10623 1627
2010 22487 2521 36936 14777 1577
2011 24679 2224 35740 14772 1850 24
2012 28053 1449 38648 15882 2150 115 11 183 4
2013 27154 5320 39973 15067 2688 188 38 297 6
2014 26765 6699 40113 15357 3038 300 63 181 12
2015 24945 4218 39365 17406 3582 389 75 189 18

4
1.2 Biodiesel
Biodiesel is a renewable and eco-friendly combustion fuel that composed of long chain
methyl or ethyl ester of fatty acids. It is commonly derived from virgin or used
agricultural oils such as vegetable oils and animal fats via a process known as
transesterification (Ouda, et al., 2016). According to Malaysia Energy Statistics
Handbook 2016 by Energy Commission, transportation sector occupied the largest
portion of energy consumption as compared to other sectors such as agriculture and
commercial. The statistical results are illustrated in Figure 1.1. Since biodiesel can be
blended with petroleum-derived diesel in any proportion for compression ignition (CI)
engine with little or no engine modifications, it is a potential substitute of fossil oil that
can be used in its pure form in the transportation sector. The application of biodiesel
in conventional diesel engines helps to remediate the global warming effect by
reducing significantly the emission of carbon dioxide, CO2 on a life cycle basis, carbon
monoxide, CO, unburned hydrocarbons and particulate matters by 78, 46.7, 45.2 and
66.7 %, respectively (Ezebor, et al., 2014).
Figure 1.1: Percentage of Energy Consumption by Sectors in 2014 (Energy
Commission, 2016)
Transport
47%
Residential and
Commercial
14%
Non-Energy
Use
12%
Agriculture
2%
Industrial
25%

5
There are several types of potential feedstocks for production of biodiesel
which can be categorised into edible and non-edible vegetable oils or recycled oils and
animal fats. For instance, the typical examples of edible oils used in the production of
biodiesel are palm oil, sunflower oil and soybean oil. However, the usage of edible
vegetable oils which is also known as first-generation feedstocks has created concern
regarding food security. A large region of arable land is needed to grow crops for
biodiesel production. Thus, second-generation feedstocks from non-edible vegetable
oils has become more popular since it offers sustainable production for biodiesel. It
provides a solution for the land problem since it can be grown in waste and marginal
land areas. Jatropha curcas seed oil and waste cooking oil are the common non-edible
vegetable oils. Waste cooking vegetable oils can become the feedstock for biodiesel
production due to its cheaper price and the absence of disposal problem. Furthermore,
with the advancement of technology, microalgae-based oils is the third-generation
feedstock which provides unlimited supply at relatively lower cost as well as improved
yields (Atabani, et al., 2013). As compared to petroleum, algae has remarkable energy
content up to 80 %. (Chisti, 2013). They can be grown on a large scale within a short
period, making them suitable to become energy crops.
Malaysia can be considered as one of the major contributors of global oil palm
production and supply owing to its favourable soil conditions. To be exact, Malaysia
is the second largest palm oil producer worldwide, accounting for 40 % of total
international market for crude palm oil (CPO) (Johari, et al., 2015). This huge biomass
feedstock is a main component used for biodiesel production. Table 1.3 shows the
production of biodiesel in Malaysia over the years. From 2012 to 2014, the production
amount and the consumption quantity had increased gradually. Nonetheless, biodiesel
had been almost negligible in this nation compared to diesel. For instance, in year 2014,
the consumption of biodiesel was 456,540 tonnes whereas the amount of diesel
required was 10,161,000 tonnes of oil equivalent. Biodiesel accounted only a small
portion of around 4 % of the total diesel requirement.

6
Figure 1.2: Statistics of Malaysia Biodiesel Production and Expenditure and Diesel
Consumption (Johari, et al., 2015)
1.3 Problem Statement
It is vital to improve the production yield of biodiesel while keeping low cost. Thus,
biodiesel is possible to substitute petroleum based diesel in the future to reduce fossil
fuel dependency. Large quantity of biodiesel is needed to satisfy the present demand.
The cost of biodiesel production was 1.5-3 times higher as compared to conventional
diesel (Domingues, et al., 2013). Rehan, et al. (2018) reported that selection of raw
material contributed up to 75 % of the overall biodiesel production cost. For example,
first generation biodiesel produced from edible vegetable oils were very costly. For
biodiesel to be competitive with petroleum based diesel, low costs feedstock such as
used cooking oil, animal fat and algae can be used. By considering the previous
literatures on interesterification involving methyl acetate, the feedstock used consists
of large proportion of oleic acid, following by linoleic acid. For instance, waste
cooking oil was composed of 91 % unsaturated fatty acids which were linoleic acid
and oleic acids. (Maddikeri, Pandit and Gogate, 2013).
Catalytic transesterification using methanol is the typical method employed for
the production of biodiesel due to the fact that methanol is relatively cheap and easily
accessible. This results in huge production of glycerol as by-product, creating the
problem of oversupply and declining their market price (Marx, 2016). The mixture of
0
2
4
6
8
10
12
2006 2007 2008 2009 2010 2011 2012 2013 2014
Tonnes
(x
10
6)
Year
Biodiesel Production Biodiesel Consumption
Diesel Consumption

7
unreacted methanol and glycerol exacerbates the situation since the purification of
glycerol to fit the consumer market requires high temperature and low pressure
distillation which is energy intensive and not cost effective. Therefore, manufacturing
biodiesel via a novel glycerol-free method can be more favourable to improve the
processing economics and avoid the by-production of glycerol. For instance, methyl
acetate can replace the alcohol reactant in transesterification reaction and form
triacetin, a higher added value by-product as compared to glycerol.
Catalyst is a crucial element in speeding up the interesterification reaction for
biodiesel production. Nowadays, the commercial production of biodiesel makes use of
homogeneous catalysts (Domingues, et al., 2013). This increases the overall operating
cost due to downstream processes to recover the catalysts. Thus, heterogeneous
catalyst is preferable. However, although heterogeneous alkaline catalyst offers high
catalytic performance, its activity is affected by feedstock with high free fatty acid
(FFA) content due to soap formation (Chakraborty, et al., 2016). Heterogeneous acidic
catalyst is suitable to be used under the conditions of high FFA content and water
without soap formation (Ezebor, et al., 2014; Konwar, Boro and Deka, 2014).
Nevertheless, their synthesising process is quite complex and expensive.
However, not all biomass is suitable to be used as a support for catalyst. Study
of sulfonation method and different synthesising conditions should be carried out for
synthesising an effective catalyst.
1.4 Aims and Objectives
The general aim of this research project is to devise and discover potential catalyst
from biomass waste for synthesis of biodiesel. Biodiesel will be produced in an
alternative pathway, without the typical production of glycerol as by-product.
Specifically, the objectives of the research project are:
• To synthesise solid acid catalysts from waste banana peels through direct
sulfonation via thermal treatment by sulfuric acid, H2SO4 for biodiesel
production.
• To investigate the effects of operating parameter such as concentration of
sulfonating agent in the preparation of solid acid catalysts.
• To produce biodiesel through catalytic interesterification process with methyl
acetate.

8
1.5 Scope and Limitation of the Study
The scope of the investigation focuses on the approach of synthesising solid acid
catalyst. There are a wide variety of biomass suitable to be used as catalyst support
after carbonisation. Therefore, it is essential to study the efficacy of different biomass
supported catalysts in biodiesel synthesis in order to choose the appropriate one.
Furthermore, sulfonation method plays a crucial role in determining the performance
of the catalyst. In this study, banana peels are selected as the biomass candidate to go
through sulfonation process involving sulfuric acid. The prepared catalyst is then
applied to the production of biodiesel.
During the preparation of catalyst, the parameter to be examined is
concentration of sulfuric acid. The performances and activities of catalysts will be
observed and their effectiveness is measured in terms of biodiesel yield and the
resulting acid value conversion. The optimum operating condition for the synthesis of
catalyst is also identified. For catalyst characterisation, the physicochemical properties
of the prepared catalysts such as structure and porosity are determined. The biodiesel
production process is carried out via interesterification reaction with the replacement
of alcohol with methyl acetate. Triacetin, instead of glycerol, is produced as by-
product.
However, there are several limitations which need to be considered and can be
improved in the near future. The scope of this study only covers the synthesis
parameter of the catalyst. Other parameters regarding the biodiesel production such as
catalyst loading, reaction time, reaction temperature and methyl acetate to oleic acid
molar ratio are not being investigated.
1.6 Contribution of the Study
Majority of the related journals had discussed about the biomass-derived
heterogeneous catalyst for biodiesel production. Thermal decomposition of
ammonium sulfate, (NH4)2SO4 and sulfonation by arylation using 4-
benzenediazoniumsulfonate (4-BDS) are the typical sulfonation approaches. However,
direct sulfonation via thermal treatment with sulfuric acid is going to be implemented
in this research study.
9
Other than that, biodiesel is commonly produced via transesterification in the
presence of alcohol with the production of glycerol as side product. Nevertheless, in
this study, interesterification will be conducted to synthesise biodiesel. Methyl acetate
is involved to produce triacetin as by-product. Thus, the outcome of this study may
bring forward an effective production mechanism for biodiesel with the combination
of interesterification and utilisation of biomass supported catalysts.
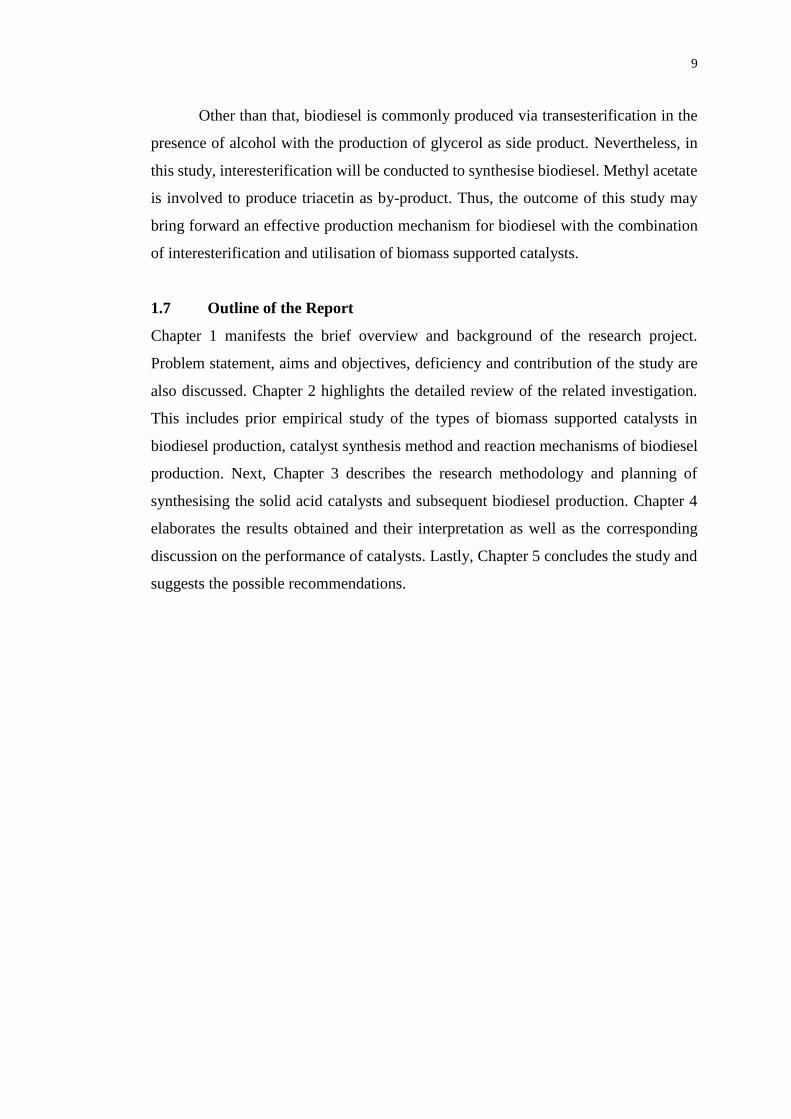
1.7 Outline of the Report
Chapter 1 manifests the brief overview and background of the research project.
Problem statement, aims and objectives, deficiency and contribution of the study are
also discussed. Chapter 2 highlights the detailed review of the related investigation.
This includes prior empirical study of the types of biomass supported catalysts in
biodiesel production, catalyst synthesis method and reaction mechanisms of biodiesel
production. Next, Chapter 3 describes the research methodology and planning of
synthesising the solid acid catalysts and subsequent biodiesel production. Chapter 4
elaborates the results obtained and their interpretation as well as the corresponding
discussion on the performance of catalysts. Lastly, Chapter 5 concludes the study and
suggests the possible recommendations.

10
CHAPTER 2
2 LITERATURE REVIEW
2.1 Reaction Mechanisms of Biodiesel Production
Vegetable oils and animal fats have high viscosities and low volatilities which hinder
their direct applications in diesel engine due to the difficulties in atomization.
Formation of carbon deposits and thickening are the common resulting problems.
Therefore, as shown in Figure 2.1, numerous methodologies of biodiesel production
can help to lower the feedstock’s viscosity. However, each reaction mechanism is
accompanied with their own distinct strengths and weaknesses.
Figure 2.1: Biodiesel Production Pathways (Calero, et al., 2015)
Blending with diesel fuels helps to improve the overall fuel quality and lower
fossil fuel consumption. Next, microemulsion refers to colloidal dispersion of fluid
microstructures with the size ranges from 0.001 μm to 0.15 μm in solvent such as
Vegetable oils or animal fats
Direct use
Blending with diesel
Microemulsions with short chain alcohols
Transformation
Diesel-like biofuels (green diesel)
Pyrolysis, cracking
Hydrotreating, hydrocracking
Biodiesel-like biofuels
(transesterifications)
Alcoholysis
Interesterification

11
methanol and ethanol, creating two immiscible phases. This will reduce the viscosity
of oils and enhance the atomization of fuel. Eliezer, et al. (2015) claimed that the flash
point, fire point and heating value of emulsified biofuels were lower as compared to
diesel fuels after addition of alcohols as a co-surfactant. Furthermore, pyrolysis or
thermal cracking in the absence of oxygen derives triglycerides (TG) along with other
organic compounds from biomass. The complex and long molecular chain oils can
then be converted into hydrocarbons with simpler structures and lower molecular
weights which are suitable to be used as fuel (Rajalingam, et al., 2016). Catalysts are
commonly involved to increase the rate of reaction and the process is known as
catalytic cracking. Nevertheless, transesterification reaction with methanol is the most
popular reaction pathway employed to obtain biodiesel that resembles petrodiesel.
2.1.1 Transesterification
Transesterification is a conventional technique employed for the production of
biodiesel. It is a catalysed reversible reaction which involves a homogeneous or
heterogeneous catalyst to produce biodiesel from oleaginous feedstocks with the aid
of short-chain alcohol. The TG from the feedstocks are converted into fatty acid alkyl
esters (FAAEs), producing glycerol as the by-product which can be separated in a
decantation funnel overnight or by centrifuge (Kirubakaran and Arul Mozhi Selvan,
2018). The overall chemical equation is shown in Figure 2.2. Since this process occurs
in a liquid-liquid two-phase system, its rate is constrained by the mass transfer
contributed by immiscibility of oil and alcohol. Other factors such as high operating
cost and energy requirements further limit its performance (Tiwari, Rajesh and Yadav,
2018).
Figure 2.2: Catalytic Transesterification (Pereira, et al., 2014)

12
2.1.2 Interesterification
The usage of short-chain alcohol poses problems such as undesirable combination of
water and FFAs. Interesterification process can be considered as a modified version of
transesterification reaction with an alternative acyl acceptor to replace alcohol. It
involves an interchange of acyl groups between two different ester compounds and
during transesterification between fatty acid and alcohol (Ang, Tan and Lee, 2014).
The potential acyl acceptors are methyl acetate (MA), ethyl acetate and dimethyl
carbonate (DMC).
Interesterification with MA involves three reversible sequential reactions
which is summarised as shown in Figure 2.3. TG from the feedstock reacts with one
molecule of MA, yielding one molecule of monoacetylglyceride (MAG) and fatty acid
methyl esters (FAMEs). Likewise, the resulting MAG then undergo the same pathway
and produce diacetylglyceride (DAG). FAME is generated eventually from DAG by
consuming another molecule of MA. In the presence of MA, triacetin which has a
higher value will be produced instead of glycerol. For instance, triacetin can be applied
as perfumery fixative (Kirubakaran and Arul Mozhi Selvan, 2018). It can also be used
as a food addictive for flavouring. Triacetin can be added into diesel directly as an
antiknock agent in engine as well as to improve the combustion properties of biodiesel.
However, MA is considered as a weakly polar aprotic solvent, thus it offers lower
reactivity as compared to methanol and DMC. Since longer reaction time is needed to
complete the reaction, there is a possibility of FAME decomposition which could
further decrease the yield (Ang, Tan and Lee, 2014).
Figure 2.3: Interesterification of TG and MA

13
Other carboxylate esters such as ethyl acetate are promising candidates in the
production of FAAEs via the reaction with TG. Producing ethyl esters is of
considerable interest due to its characteristics which include safety in handling and
higher flash and combustion points. Fatty acid ethyl ester biodiesel exhibits lower
cloud points as compared to FAME (Leggieri, Senra and Soh, 2018). The extra carbon
atom in biodiesel increases its heat content and cetane number. Nevertheless, the yield
is comparatively lower due to the presence of longer alkyl chains that reduces the
reactivity between TG and esters.
Furthermore, Lee, et al. (2017) reported that interesterification with DMC was
more reactive as compared to conventional transesterification with methanol. The
interesterification which involves DMC goes through three stages. Firstly, TG reacts
with DMC to generate methyl carbonate diglyceride (MCDG) which will then react
with another molecule of DMC, producing dimethyl carbonate monoglyceride
(DMCMG). For the last step, DMCMG reacts with one molecule of DMC and
produces FAME, glycerol carbonate and citramalic acid as the final products. This
process starts with versatile and biodegradable DMC which can be easily synthesised
from carbon dioxide and methanol to produce value-added by-products. Glycerol
carbonate can be used to substitute petroleum derivative in the synthesis of polymers,
surfactants and lubricating oils. It can also be used to produce glycidol, an epoxy
compound with wide applications in plastics and textile industries. On the other hands,
citramalic acid is a weak acid that has high value in pharmaceutical and cosmetic
industries due to its functions in reversing the aging effects on human face, provided
that high purity citramalic acid can be obtained.
2.2 Conventional Homogeneous and Heterogeneous Catalyst in Biodiesel
Production
For transesterification and interesterification reactions, homogeneous or
heterogeneous catalysts are generally involved to enhance the manufacturing process
of biodiesel. Homogeneous catalysts are mainly found in the technology of biodiesel
production due to their characteristics of higher solubility in oil, more reactive and
lower costs. However, the cost of biodiesel production increases due to non-reusability
of catalyst and lower FAME recovery (Boon-anuwat, et al., 2015). Large amount of
waste water is also produced due to the downstream neutralisation and purification
procedures.

14
Heterogeneous catalytic system poses a solution for the aforementioned
problem. Their relatively easy recovery, using filtration or centrifugation, makes them
favourable to be utilised. Several heterogeneous catalysts are capable to undergo
reaction for several cycles without regeneration. However, due to heterogeneous phase
reaction, the mass transfer between oils, acyl acceptor and catalyst phases is the main
limiting step which must be improved. Korkut and Bayramoglu (2018) suggested that
intense mixing and agitation could be carried out to increase the resulting biodiesel
yield.
As shown in Figure 2.4, these catalysts can be further categorised into acidic
or basic types. Moreover, enzyme-catalysed reaction and non-catalytic supercritical
reaction conditions are also the feasible alternatives for biodiesel production.
Figure 2.4: Biodiesel Production Classification (Nomanbhay and Ong, 2017)
2.2.1 Alkaline Catalyst
Transesterification reaction between TG and methanol with the aid of homogeneous
alkaline catalysts such as potassium hydroxide, KOH, sodium hydroxide, NaOH and
methoxide, CH3O- is the typical pathway employed in industrial-scale biodiesel
production (Ehsan and Chowdhury, 2015). This is because alkaline catalyst offers
higher reaction rate, around 4000 times faster as compared to acidic catalysts
(Nomanbhay and Ong, 2017). Hence, the reaction can be performed at milder
condition with high biodiesel yield as supported by the data shown in Table 2.1. These
alkaline catalysts can be obtained at low cost since they are widely available.
Biodiesel Production
Catalytic
Homogeneous
Acid
Base
Heterogeneous
Acid
Base
Enzyme
Non-Catalytic

15
Table 2.1: Transesterification Reaction with Alkaline Catalysts
Catalyst
Catalyst
Reusability
(no. of
cycles)
Feedstock
Reaction Conditions
References Temperature
(˚C)
Time
(h)
Methanol to
Oil Molar
Ratio
Yield [Y] /
Conversion [C]
(%)
Catalyst
Homogeneous
Sodium
hydroxide -
Citrullus
vulgaris
(watermelon)
60 2 5:1 Y= 70 0.13 g (Efavi, et al.,
2018)
Tetramethyl
ammonium
hydroxide
- Sunflower oil 60 2 6:1 Y= 97.33 1.76 wt.% (Sánchez, et
al., 2013)
Potassium
hydroxide -
Refined
cotton seed
oil
55 1 6:1 Y= 96
0.6 % in
concentration
basis
(Onukwuli, et
al., 2017)
Heterogeneous
Calcium Oxide - Vegetable oil 65 1.25 6:1 C= 100 3 wt.%
(Colombo,
Ender and
Barros, 2017)
CaO·MgO
mixed oxide 3
Jatropha
curcas oil - 0.067 18:1 C= 95 4 wt.%
(Buasri, et
al., 2015)

16
The bottleneck of alkaline process is its high sensitivity to FFA level (>0.5
wt.%) and water content (>0.06 wt.%) in oils, leading to soap formation via
saponification which complicates the downstream separation, neutralisation and
purification processes (Ashton Acton, 2013). The catalyst efficiency and overall
biodiesel yield are thus reduced. Therefore, extra pre-treatment step is necessary to be
carried out to lower the FFA level in feedstock. The production plant must also possess
facilities to treat the alkaline waste water before releasing it to the environment (Ang,
Tan and Lee, 2014). Despite all the beneficial properties of alkaline catalysts,
additional problems such as catalyst deactivation due to exposure to the surrounding
air and contamination of product due to catalyst active sites arise when heterogeneous
phase catalyst is employed.
2.2.2 Acidic Catalyst
The application of acidic catalysts diminishes inherent problems associated with FFA
level and moisture in substrates as the catalysts’ performance is not severely affected.
They can catalyse both transesterification and FFA esterification simultaneously with
no soap formation (Atadashi, et al., 2013). Nevertheless, they have comparatively
lower reaction rate, thus requiring longer reaction times (≤ 96 h) and higher alcohol to
oil molar ratios (≤ 150:1) as shown in Table 2.2. In the occasion where higher reaction
temperature is needed, the biodiesel production process becomes energy intensive.
Corrosive feature of acidic catalyst can damage the reaction vessels, thus restricting
their industrial applications (Meher, et al., 2013). Heterogeneous acidic catalysts
likewise encounter the problem of active sites leaching.

17
Table 2.2: Transesterification Reaction with Acidic Catalysts
Catalyst
Catalyst
Reusability
(no. of
cycles)
Feedstock
Reaction Conditions
References Temperature
(˚C)
Time
(h)
Alcohol to
Oil Molar
Ratio
Yield [Y] /
Conversion [C]
(%)
Catalyst
Homogeneous
Hydrochloric
acid - Highly wet
microalgae 95 2
10 ml/g
Y > 90 0.1-1.5 ml
(Kim, Im and
Lee, 2015)
Sulfuric acid - Soybean oil 65 51 30:1 (1-
butanol) C= 99 1 mol%
(Bharathiraja, et
al., 2014)
Heterogeneous
Tungstated
zirconia
WO3/ZrO2 3
Microalgal
lipids 100 3
12:1
(methanol) C= 94.58 15 wt.%
(Guldhe, et al.,
2017)
Sulfonic acid-
functionalized
platelet SBA-
15 mesoporous
silica
1 Crude
Jatropha oil 150 75
23:1
(methanol) Y= 75-78 15 wt.%
(Chen, et al.,
2014)

18
2.2.3 Enzymatic Catalyst
The application of enzymes such as lipases as biocatalyst offers several environmental
and economic advantages over conventional chemical catalysts. Enzymatic catalysts
provide good selectivity and biodiesel production can be conducted under more gentle
conditions, thus more energy efficient. From Table 2.3, the operating temperature of
enzyme catalysed transesterification varies from 35-40 °C which is considerably
moderate. The ease of enzyme recycling and separation simplifies the production
process. Enzymatic catalysts are appropriate for biodiesel synthesis from a variety of
TG substrates which comprise fats and waste oils with high levels of FFA. Biodiesel
production using enzymatic catalysts can be considered as environmentally benign
since there is no requirement of waste water treatment facilities (Nomanbhay and Ong,
2017).
Nevertheless, their implementation is restricted owing to the high costs of
enzymes, low reaction rate and large reaction volumes (Calero, et al., 2015). Other
than that, the utilisation of short-chain alcohols deactivates the lipase and inhibits its
activity, causing the enzymes to have short lifespan. More enzymes are needed to
achieve the desired biodiesel yield and eventually raising the costs. Other acyl
acceptors like MA, DMC and ethyl acetate may act as a promising substitute to replace
alcohol.

19
Table 2.3: Transesterification Reaction with Enzymatic Catalysts
Catalyst Feedstock
Reaction Conditions
References Temperature
(˚C)
Time
(h)
Methanol
to Oil
Molar
Ratio
Yield
(%)
Enzyme
(wt.%)
Eversa
Transform (L) Castor oil 35 8 6:1 94.2 5
(Andrade, Errico
and Christensen,
2017)
Candida
rugosa lipase
(l)
Tallow kernel
oil 40 24 4:1 95.4 10 (Su, et al., 2016)
Candida
antarctica
lipase B
Waste tallow - 0.333 4:1 85.6 6
(Adewale,
Dumont and
Ngadi, 2015)
Callera Trans
L Rapeseed oils 35 24 4.5:1 95.3 0.5
(Nordblad, et
al., 2014)

20
2.2.4 Non-Catalytic Supercritical Process
Non-catalytic supercritical transesterification process offers high conversion and
reaction rate which produces large yield in a short period of time. Simpler separation
and purification procedures are involved since there is no catalyst present.
Supercritical biodiesel production is not affected by the presence of FFA and water
content in oils or fats. Pre-treatment step to reduce the water content in oils is not
needed.
However, according to Sakdasri, Sawangkeaw and Ngamprasertsith (2018),
supercritical transesterification demanded high alcohol to oil molar ratio up to 42:1.
Despite faster reaction and promising yield, the installation costs for industrial plant
are very expensive. Furthermore, the operating temperature and pressure of
supercritical reaction typically varies in the range of 200-400 °C and 10-25 MPa,
respectively. This is because the temperature and pressure must be above the critical
values of alcohol for it to be more soluble in oils (Nomanbhay and Ong, 2017). Several
examples of transesterification in supercritical methanol are listed in Table 2.4. It can
be seen that the operating temperatures and pressures of the reaction are higher than
the critical temperature (Tc) and pressure (Pc) of methanol which are 239 °C and 8.09
MPa, respectively (Micic, et al., 2016). These operating conditions consume large
amount of energy, thus making biodiesel production economically unfavourable and
restraining it from striding into industrial level. (Pourzolfaghar, et al., 2016).

21
Table 2.4: Supercritical Transesterification Reaction
Feedstock
Reaction Conditions
References Temperature
(˚C)
Pressure
(MPa)
Time
(h)
Methanol to
Oil Molar
Ratio
Yield [Y] /
Conversion [C]
(%)
Waste
vegetable oil 271.1 23.1 0.34 33.8:1 Y= 95.27
(Ghoreishi and Moein,
2013)
Refined and
used palm
olein oil
400 15 0.333 12:1 C= 99
(Sakdasri,
Sawangkeaw and
Ngamprasertsith,
2015)
Krating oil 260 16 0.167 40:1 Y= 90.4
(Samniang, Tipachan
and Kajorncheappun-
ngam, 2014)
Jatropha oil 320 15 0.083
3 40:1 Y= 84.6
(Samniang, Tipachan
and Kajorncheappun-
ngam, 2014)
Karanja oil 300 26 1.5 43:1 Y= 81.15 (Ortiz-Martínez, et al.,
2016)
Jatropha oil 325 35 1.5 42:1 C= 100
Y= 99.5
(Salar-García, et al.,
2016)

22
2.3 Biomass Derived Carbon-Based Solid Acid Catalyst
Despite the benefits of commercial heterogeneous acid catalysts, their derivation
procedure involves high-priced chemical reagents, raising the overall production costs.
It is very essential that the catalysts can be prepared at lower cost with satisfactory
activity, stability and reusability. Therefore, reutilisation of various biomass waste as
support material in synthesising effective catalysts is a promising pathway for
biodiesel production. Nowadays, biomass has gained its popularity in catalysis other
than becoming feedstock for biofuel manufacturing. One of the major components of
transesterification is the oil content in feedstock. After extraction, the biomass residue
will form waste which is made up mainly by large organic hydrocarbon compound,
creating disposal problem.
Application of biomass residue as carbon precursor for solid acid catalyst is
favourable since it is readily available from many sources and environmentally benign.
The biomass residue must be first cleaned and gone through the calcination process to
produce biochar which will be discussed particularly in the Section 2.4. Next, the
biochar will undergo sulfonation process. A flowchart of the catalyst synthesis
procedure is depicted in Figure 2.5. The sulfonated carbon-based catalysts (SCBC)
carry three functional groups, namely sulfonic acid, -SO3H, carboxylic acid, -COOH
and phenolic acid, -OH after appropriate sulfonation process to alter the surface
chemical properties (Abdullah, et al., 2017). As comparison, the conventional solid
acid catalysts have only one functional group. These acid sites contribute to the
catalytic activity of the catalysts collaboratively. For instance, sulfonic acid sites play
the main role in catalysis with the other two acid sites help to enhance the accessibility
of reactants to the catalyst surface by raising its hydrophilic properties. Table 2.5
outlines the application of different types of biomass waste as the solid acid catalyst
for producing biodiesel.
Figure 2.5: Preparation of Sulfonated Carbon-Based Catalyst (SCBC) (Abdullah, et al.,
2017)

23
Table 2.5: Literature Survey on Biomass-Derived Solid Acid Catalyst for Biodiesel Production
Biomass Surface Area
(m2/g)
Strength
(mmol/g)
Catalyst
Reusability
(no. of
batches)
Feedstock
for
Biodiesel
Production
Reaction Conditions
Yield [Y]/
Conversion
[C] (%)
References Methanol
to Oil
Molar
Ratio
Time
(h)
Calophyllum
inophyllum 0.2-3.4 0.6-4.2 4
Non-edible
oil 30:1 5 C= 99
(Dawodu,
et al.,
2014)
Douglas fir wood
chips 3.51 1.37 10
Fast-refined
microalgal
oil
5:1–30:1 0.167-
1.5 Y= 99
(Dong, et
al., 2015)
Corn straw - 2.64 - Oleic Acid 7:1 4 Y= 98 (Liu, et al.,
2013)
Bagasse - - 8 Waste
cooking oil 18:1 5-6 C= 94.4
(Zhang, et
al., 2014)
Rice husk char 4 2.46 5 Waste
cooking oil 20:1 15 Y= 87.57
(Li, et al.,
2014)

24
2.4 Carbonisation and Pre-Treatment of Biomass
To prepare a biomass-derived catalyst, several pre-treatment steps must be carried out
in order to ease the subsequent carbonisation process. Firstly, the biomass must be
cleaned and washed with distilled water to remove any impurity. It will then undergo
size reduction with grinder and dry with oven to remove all moisture. The carbon
precursor is carbonised in a muffle furnace at a specific temperature for a certain period
of time to convert the organic biomass into carbon residue. Continuous flow of
nitrogen gas is used to create an inert environment in the furnace, maintaining the
homogeneity (Bora, et al., 2018). Touhami, et al. (2017) suggested that carbonisation
could also be done by pyrolysis using a tube furnace with continuous flow of nitrogen.
Calcination is a process similar to carbonisation where it focuses to eliminate volatile
compounds and oxidise the biomass. During combustion, calcium carbonate, CaCO3
in the organic compound decomposes into calcium oxide, CaO and liberates a portion
of carbon dioxide, CO2 gas. Both processes are typically carried out in the temperature
range of 300-1000 °C, depending on the types of feedstock (Abdullah, et al., 2017).
Table 2.6 summarises the carbonisation temperature and time for different biomass
wastes.
Table 2.6: Carbonisation Conditions for Various Biomass Wastes
Biomass Waste Calcination Conditions
References Temperature (°C) Time (h)
Coconut shell 422 4 (Endut, et al., 2017)
Waste shell of
Mesua ferrea Linn
seeds
500 1.5 (Bora, et al., 2018)
Rice husk 400 4 (Touhami, et al.,
2017)
De-oiled Jatropha
curcas seeds 350 4
(Mardhiah, et al.,
2017)
Pomelo peel 600 2 (Zhao, et al., 2018)
Carbonisation and calcination temperatures play a significant role in
controlling the performance of the fabricated catalyst by manipulating its surface
morphology. It affects the formation of calcium oxide as the presence of calcium oxide

25
provides extra void on the carbon structure, resulting in larger total pore volume and
pore diameter. Excessive temperature will cause the disintegration of carbon skeleton
and breakdown of macromolecules. The organic portions might be removed too.
Micropores may grow to reduce the pore volume, leading to low amount of accessible
active site on the catalyst surface.
Other than that, calcination time is another important factor to be considered
as it affects the development of calcium oxide. Inadequate holding time might cause
the calcium oxide to be underdeveloped, thus the resulting catalytic activity is not
promising. On the other hand, prolonged calcination time will result in sintering which
causes the catalyst grains to shrink and decreases the total effective surface area.
Therefore, it is essential to synthesise the catalyst with optimum calcination time so
that to ensure complete conversion of calcium carbonate.
Last but not least, grounding of the carbonised sample can be conducted
eventually to produce fine powder of about 0.5 to 1 mm in particle size (Endut, et al.,
2017).
2.5 Sulfonation of Activated Carbon
Sulfonation is the major process for synthesising a carbon acid catalyst where the
carbon precursor is equipped with active sulfonic acid group, -SO3H. There are various
sulfonation techniques available to graft the active site onto the structural support,
providing catalysts with different catalytic activities. Sulfonated carbon catalyst was
stated to be the most proficient and cost-effective catalyst for the biodiesel production
from high FFA content feedstock (Bora, et al., 2018). It is important to utilise a suitable
sulfonation method, so that it can perform well in a reaction.
Endut, et al., (2017) conducted the sulfonation of activated carbon by using
sulfuric acid, H2SO4. 10 g of carbon catalyst was mixed with 100 ml sulfuric acid in a
250 ml conical flask. Excess acid was discarded after 15 minutes. Next, the wet solids
residual was transferred to a ceramic crucible and heated in a muffle furnace. The
optimum sulfonation time and temperature were found out to be 15 h and 100 °C,
respectively. The sulfonated carbon catalyst was cleaned with excess distilled water
after it was cooled to room temperature. The washing process continued until the wash
water achieved neutral pH. The synthesised catalyst was then dried with air-drying

26
oven at 105 °C for 10 h, followed by storing in a sealed container to avoid
contamination.
Direct sulfonation via thermal treatment with concentrated sulfuric acid
manufactures sulfonated carbons with comparatively lower specific surface area and
acid density. They are also vulnerable to leaching of sulfonic acid groups which results
in low reusability. Konwar, et al. (2014) carried out sulfonation using covalent
anchoring of 4-benzenediazoniumsulfonate radicals via two methods. The biomass
derived activated carbon was maintained at a temperature of 3-5 °C and stirred with
100 mL of 20-32 % hypophosphorous acid, H3PO2 for 30 min. After that, another 50
mL hypophosphorous acid was added and the mixture was hold for 1 h with periodical
stirring. Next the mixture was filtered and washed with acetone and water extensively,
followed by drying overnight in vacuum. The second method was using hydrochloric
acid instead of hypophosphorous acid with similar washing procedure. The obtained
catalyst was dried at 110 °C in an oven. The mixture was hold for 12 h at 5 °C.
Sulfonation using 4-benzenediazoniumsulfonate helps to maintain structural stability
of the carbon surface and presence of high strength C-SO3H bonds leads to improved
reusability.
Tamborini, et al. (2015) mixed 0.2 g nanoporous carbon with 10 mL fuming
sulfuric acid, producing a suspension which was then heated at a temperature of 80 °C
for 8 h under reflux. They were then cooled to ambient temperature and washed with
distilled water until no sulfate ions were found in the wash water via barium chloride
test. Next, upon drying at 70 °C for 12 h, centrifugation was used to separate black
precipitate from the reaction mix. The application of fuming sulfuric acid is not
recommended as it causes safety and operation problem as compared to other methods
(Kang, Ye and Chang, 2013). Tamborini, et al. (2015) also reported another method
using a mixture of chlorosulfuric acid, HClSO3 and sulfuric acid in a molar ratio of
2:10 instead of fuming sulfuric acid. The subsequent mixture was heated at the same
conditions with previous but with additional constant stirring. Similar filtration and
washing procedure were carried out too.
Negm, et al. (2017) enumerated the procedure to prepare a super acidic
sulfonated modified mica catalyst (Mica-Ph-SO3H). Phenyl grafted mica was
distributed in 1,2-dichloroethane and excess chlorosulfonic acid was added at 0 °C.
This mixture was stirred vigorously for 12 h and subsequently warmed at 50 °C. The

27
precipitate was washed thoroughly with 1,2-dichloroethane, followed by drying at
50 °C under vacuum.
Niu, et al. (2018) proposed the arylation of sulfanilic acid to synthesise
heterogeneous acid catalyst. Mixture of sulfanilic acid and bamboo activated carbon
at a molar ratio of 1 was vigorously stirred to attach the Ph-SO3H active sites to the
carbon structure. Sodium hydroxide, NaOH was used to control the pH of this mixture
emulsion at around 7-8. Sodium nitrite, NaNO2 was added to terminate the sulfonation
process and it dissolved completely by adding deionized water. 25 wt.% hydrochloric
acid was added drop by drop to prevent spontaneous rise of reaction temperature. Next,
filtration was carried out under vacuum and washing step was done by using de-ionized
water until neutral pH. The slurry residual was cleaned by purging acetone to remove
any impurities before drying in an oven. The optimum sulfonation temperature and
time were at 50 °C and 10 minutes, respectively.
Wu, et al. (2014) suggested the method of wet impregnation of ammonium
persulfate, (NH4)2S2O8 into the dried precipitate of ZrO2-TiO2-Fe3O4 at different Zr to
Ti molar ratio. They were mixed with a solution to solid ratio of 15 mL/g and stirred
for 1 h at 500 rpm. Filtration was carried out to remove the precipitated solid, followed
by drying at 110 °C for 12 h. This method was a bit different from others. Calcination
was only done next for 3 h in air. It was stated that Zr to Ti molar ratio of 3:1 and
calcination temperature of 550 °C gave the best activity due to highest acidity.
Tang, et al. (2017) proposed the thermal decomposition of ammonium sulfate,
(NH4)2SO4 as a sulfonation method. Different concentrations of ammonium sulfate
was mixed with biochar. The mixture was ultrasonicated with water bath for 10
minutes with the aid of an ultrasonicator and subsequently heated to 235 °C in a
furnace for 15-90 min. Prior to washing with distilled water and filtration, the reaction
mixture was allowed to cool. The filtered precipitate was dried in an oven at 80 °C
overnight. The optimum sulfonation conditions were 10.0 w/v% of ammonium sulfate
and 30 minutes of heating period.
2.6 Characterisation and Screening of Synthesised Catalyst
Characterisation of fabricated catalysts is essential to study and understand the
intrinsic and extrinsic properties of the catalysts. This is aided by various analytical
instruments which generate information about surface morphology, thermal stability,

28
acid density and identity of the attached functional groups. The valuable outcomes will
justify the efficacy of the catalyst preparation methods. Examples of the instrument
involved are thermogravimetric analysis (TGA), Scanning Electron Microscopy
equipped with Energy Dispersive X-ray (SEM-EDX), Brunauer-Emmett-Teller (BET),
Fourier Transform Infrared Spectroscopy (FTIR) and Temperature Programmed
Desorption, Reduction and Oxidation (TPDRO).
Ayodele and Dawodu (2014) reported the usage of TGA for evaluating the
thermal stability and decomposition of prepared catalysts where the original mass of
the sample was measured by using an external weighing balance. The proposed
operating condition of TGA by Correia, et al. (2014) was heating rate of 10 °C/min
with temperature range of 25-1000 °C.
Furthermore, the images obtained from SEM-EDX provide structural
information, sulfur content and surface morphologies of the synthesised catalysts. The
SEM was operating under a vacuum of 1.33 × 10⁶ mbar with a 20 kV accelerating
voltage (Correia, et al., 2014). Sputter coater was used at first to cover the samples
with a thin layer of gold of about 10 nm.
On the other hand, TPDRO generates information about activation energy,
single point BET, acid sites concentration on surface with high precision, accuracy and
reliability in a short period of time (Fadoni and Lucarelli, n.d.). Surface area, pore
volume and size can be evaluated according to BET methods.
FTIR absorption or transmittance spectrum provides information about organic
compounds found in the synthesised catalysts. Zhang, et al. (2014) suggested that
FTIR analysis can be carried out in the wavenumber range of 600-4000 cm-1. The
sample was mixed with potassium bromide, KBr, forming a pellet for the subsequent
analysis. The functional groups present in the catalysts can be identified by careful
inspection of the spectrum.
Besides, titration method can be employed to determine the acid density of the
catalysts. A detailed procedure was enumerated by Konwar, et al. (2014). 0.04 g of the
prepared catalyst was mixed with 20 mL of 0.01 M sodium hydroxide aqueous solution.
The mixture was stirred uniformly for 4 h at room temperature with the aid of a
magnetic stirrer. The resulting solution was then titrated with 0.01 M hydrochloric acid,
HCl aqueous solution with phenolphthalein as an indicator. Centrifugal separation can
be used to eliminate any undissolved catalysts.

29
2.7 Characterisation of Feedstock and Products
For feedstock with high FFA content, it is advisable to use acid catalyst for higher
yield. Therefore, it is necessary to carry out an investigation of the feedstock’s
chemical composition and their respective amount prior to the biodiesel production
process. The fatty acids that are attached to glycerol in a TG molecule can be saturated
or unsaturated, depending on the presence of carbon-carbon double bond. Taking
linoleic acid as an example, it can be described as C 18:2 which means that it is a
hydrocarbon chain with 18 carbon atoms and two carbon-carbon double bonds. Table
2.7 shows a list of fatty acids which are commonly found in oils.
Table 2.7: Examples of Fatty Acids
Fatty acid Notation
Palmitic acid C 16:0
Stearic acid C 18:0
Oleic acid C 18:1
Linoleic acid C 18:2
Linolenic acid C 18:3
Santos Ribeiro, et al. (2017) carried out an interesterification reaction between
macaw oil and MA. A Gas Chromatography (GC) equipped with flame ionisation
detector (FID) and RTX-Wax capillary column (30 m × 0.25 mm × 0.25 μm) was used.
The fatty acids were first converted into methyl esters and the resulting retention time
was compared with that of FAME standards to find out the identity of the fatty acids.
Oleic acid and palmitic acid were found to be the major fatty acids in macaw oil with
a composition of 74.18 wt.% and 13.05 wt.%, respectively.
Casas, Ramos and Pérez (2011b) conducted another interesterification using
sunflower oil and MA as reactants. It was stated that the refined sunflower oil consisted
of 63 % linoleic acid, 25.2 % oleic acid, with palmitic acid, steric acid and linolenic
acid at minimal quantity.
Maddikeri, Pandit and Gogate (2013) claimed that the waste cooking oil used
in the interesterification with MA made up mainly by unsaturated fatty acids such as
linoleic and oleic acids. This was further supported by their similar research in 2014.

30
In another interesterification reaction carried out by Sustere, Murnieks and Kampars
(2016) using rapeseed oil with different types of alkyl acetates, the feedstock was
determined to contain 62.5 % oleic acid and 21.7 % linoleic acid.
The yield of FAME and the corresponding conversion are crucial parameters
which must be determined in order to verify the potency of the reaction pathway and
catalysts used. Casas, Ramos and Pérez (2013) claimed that the quantitative analysis
of FAME was conducted according to EN 14103 standard. The compositions of other
components such as triacetin, diacetin, monoacetin, glycerol, diacetinmonoglyceride,
monoacetindiglyceride and triglyceride were deduced based on method EN 14105. All
these analyses can be done using GC.
A sample of 150 mg was diluted in 10 ml of n-heptane which acted as a carrier.
1 ml of the mixture and 500 μL of internal standard which was 10,000 ppm methyl
heptadecanoate with pyridine as solvent was transferred to an analysis vial. 1 μL of the
final solution was injected and travelled through capillary column (15 m × 0.32 mm ×
0.10 μm). By comparing the retention time of a peak in the sample with that in the
standard, the FAME and triacetin peaks could be identified. The integrated area of the
peak representing FAME would give an indication value of the yield. The total yield
of FAME in unit of percentage can be expressed in Equation 2.1 (Santos Ribeiro, et
al., 2017).
𝐹𝐴𝑀𝐸 𝑌𝑖𝑒𝑙𝑑 (%) =𝑚𝑒𝑎𝑠𝑢𝑟𝑒𝑑 𝐹𝐴𝑀𝐸 𝑎𝑚𝑜𝑢𝑛𝑡 𝑖𝑛 𝑡ℎ𝑒 𝑠𝑎𝑚𝑝𝑙𝑒 (𝑔)
𝑡ℎ𝑒𝑜𝑟𝑒𝑡𝑖𝑐𝑎𝑙 𝑎𝑚𝑜𝑢𝑛𝑡 𝑓𝑟𝑜𝑚 𝑖𝑛𝑖𝑡𝑖𝑎𝑙 𝑜𝑖𝑙 𝑐𝑜𝑛𝑡𝑒𝑛𝑡 𝑜𝑛 𝑏𝑎𝑠𝑖𝑠 𝑜𝑓 𝑖𝑡𝑠 𝑓𝑎𝑡𝑡𝑦 𝑎𝑐𝑖𝑑 𝑐𝑜𝑚𝑝𝑜𝑠𝑖𝑡𝑖𝑜𝑛 (𝑔)
× 100
(2.1)
The total percentage yield of FAME can also be obtained from the FAME
calibration curve using external standard methods. Moreover, the conversion of FFA
can be evaluated by titration with potassium hydroxide, KOH. Potassium hydroxide
acts to neutralise the acids present. Titration results signify the initial acid value of the
feedstock (ai) and final acid value of the mixture after the reaction (af). The acid value
is a number expressed in the unit of milligrams of potassium hydroxide needed to
neutralise 1 g of FAME (Casas, Ramos and Pérez, 2011). The resulting conversion can
be calculated based on Equation 2.2 (Ayodele and Dawodu, 2014).

31
𝐹𝐹𝐴 𝑐𝑜𝑛𝑣𝑒𝑟𝑠𝑖𝑜𝑛 (%) =
𝑎𝑖 − 𝑎𝑓
𝑎𝑖× 100
(2.2)
2.8 Interesterification for Biodiesel Production
A detailed procedure of ultrasound aided interesterification was emphasised by
Maddikeri, Pandit and Gogate (2013). A 100 mL three-neck batch reactor was initially
filled with MA and waste cooking oil with a MA to oil molar ratio of 12:1. Three
openings were used to fit condenser, ultrasonic horn and temperature sensor.
Condenser worked to liquefy the vaporised methyl acetate while temperature sensor
was used to monitor the temperature change during the reaction. This experimental set
up can be switched to conventional interesterification by replacing the ultrasonic horn
with a stirrer. The mixture was heated to 40 °C. The 1 % catalysts in concentration
basis was then added into the reactor before reaction was started. Several samples were
withdrawn at a designated interval of time. Stoichiometric amount of ortho-phosphoric
acid was used to quench the collected samples immediately to inhibit the continual
progress of the reaction. Next the sample was washed to remove the catalyst by using
water. A 3Å molecular sieve was put in to eliminate the trace amount of moisture. The
samples were then refrigerated until further analysis.
Chemical interesterification reaction between rapeseed oil and MA was carried
out by Sustere, Murnieks and Kampars (2016). The mixture of rapeseed oil and methyl
acetate in MA to oil molar ratio of 18:1 was heated up to 55 °C in a three-neck flask.
Next, reaction was started once catalyst in catalyst to oil molar ratio of 0.16:1 was
added and progressed for 60 min. Phosphoric acid in equimolar amount was added and
emerged salts were eliminated by filtration. Repetition of experiment was carried out
to calculate the average value.
Wu, et al. (2014) proposed a novel interesterification of cottonseeds and methyl
acetate to be carried out by in situ reactive extraction. A mixture of 20 g cottonseeds
and varying volumes of MA was charged into a round-bottom flask accommodated
with water-cooled condenser and magnetic stirrer. The mixture was then heated to a
temperature of 50 °C. Once the catalyst was added, the reaction was initiated with
mechanical stirring at around 300 rpm for a reaction period of 10.8 h. The mixture was
then cooled and filtered to remove any solid residue. The discussed interesterification
reactions are summarised in Table 2.8.

32
Table 2.8: Interesterification of Biodiesel Production
Feedstock Reaction
Time (h)
Reaction
Temperature
(°C)
Methyl
Acetate to
Oil Molar
Ratio
Catalyst
Amount
Yield
(%) References
Waste
cooking oil - 40 12:1
1% in
concentration
basis
90.0
(Maddikeri,
Pandit and
Gogate, 2013)
Cottonseed
oil 10.8 50 13.8 mL/g 21.3 wt.% 98.5
(Wu, et al.,
2014)
Rapeseed
oil 1 55 18:1
Catalyst to
oil molar
ratio= 0.16:1
82.7
(Sustere,
Murnieks and
Kampars,
2016)
2.8.1 Optimisation Study
The preparation procedures suggested in Sections 2.4 and 2.5 are sufficient to fabricate
a feasible catalyst for biodiesel production. The determination of optimum conditions
for the fabrication process is crucial to maximise the performance of catalyst in
reaction. Various parameters involved such as calcination temperature and time can be
manipulated to obtain the highest biodiesel yield or conversion.
Meng, et al. (2013) reported an investigation on calcination temperature of a
solid Ca/Al composite oxide-based alkaline catalyst prepared via chemical synthesis
and thermal activation with the aid of sodium aluminate solution and calcium
hydroxide emulsion. Calcination temperature has great influence on the catalytic
activity. Since the fabricated catalyst consisted of Ca12Al14O33 and CaO, development
of the Ca12Al14O33 phase at higher calcination temperature resulted in larger surface
area as shown in Figure 2.6. The optimum calcination temperature was found to be
600 °C with the highest biodiesel yield of more than 94 % (Reaction conditions:
methanol/rapeseed oil molar ratio 15:1, catalyst amount 6 wt.%, reaction temperature
65 °C and reaction time 3 h).

33
Figure 2.6: Specific Surface Area of Ca/Al Composite Oxide Catalysts at Different
Calcination Temperatures (Meng, et al., 2013)
The effect of sulfonation temperature on performance of catalyst in
esterification reaction was discussed by Yu, et al. (2017). Sulfonation temperature
regulates the quantity and location of -SO3H groups as well as the firmness of their
attachment to the carbon-based structure. It was proven that the increment in
sulfonation temperature from 90 to 105 °C resulted in an increase of oleic acid
conversion with a maximum value of 95.7 %. However, further rising of sulfonation
temperature gave adverse outcome. Therefore, it can be concluded that 105 °C was the
optimum sulphonation temperature for this case.
Beside calcination temperature, the performance of catalyst is strongly
impacted by calcination time. Aguilar-Garnica, et al. (2013) conducted the sulfonation
of recycled poly(styrene-co-butadiene) via fuming sulfuric acid. The sulfonation
process was conducted using varying times and temperatures. Three sulfonating times
of 1, 3 and 5 h were applied to each of the temperature (30, 70 and 110 °C). This 3 ×
3 experimental design was used to set up a mathematical model in order to obtain the
sulfonation data at 95 % confidence. The achieved optimum condition was 2.5 h and
75 °C with maximum number of acid sites attached to the polymer. The prepared
catalysts were proven to be able to work with the feedstock with high FFA content.
2.8.2 Stability and Regeneration Test
To transform the biodiesel production into a sustainable process, the synthesis and
utilisation of solid catalysts for consecutive cycles without considerable drop in
activity is an important parameter to be considered. Stability test can be conducted to
2.335.14
27.36
9.8
3.27
0
5
10
15
20
25
30
120 400 600 800 1000
Spec
ific
Surf
ace
Are
a
(m2/g
)
Calcination Temperature (°C)

34
evaluate the reusability of the prepared catalyst, thus deciding whether it is suitable to
be used for practical applications. After each experimental run, the active site grafted
on catalyst may leach to the reaction solution, influencing the catalytic performance.
Regeneration can be performed to restore the catalytic activity.
Mardhiah, et al. (2017) conducted an esterification reaction using carbon-based
solid acid catalyst derived from de-oiled Jatropha curcas seeds. The catalyst was
prepared via sulphonation by heat treatment with concentrated sulfuric acid. Once the
reaction was completed, the catalyst was gathered and cleansed thoroughly with hot
distilled water at 80 °C and n-hexane to eliminate any impurities, followed by drying.
The catalyst was then re-used for a series of the same esterification reaction under the
optimum operating conditions. The product from each cycle was tested for acid value
and conversion yield which indicated the catalyst effectiveness on each cycle.
Moreover, the presence of sulfate groups, -SO3 in the filtered methanol was tested
using barium chloride to verify the occurrence of leaching. Titration method was also
used to monitor the changes in the acid capacity of the catalyst after each cycle. Figure
2.7 shows that there was a slight decline in conversion yield until the fourth cycle.
Drop in catalytic activity is due to the decline in catalyst’s acid capacity. Nevertheless,
there was no sulfate leaching since the barium chloride testing gave a negative result.
Figure 2.7: Reusability of Carbon-Based Acid Catalysts (Reaction conditions:
methanol/oil ratio 12:1, catalyst amount 7.5 wt.%, reaction temperature 60 °C, reaction
time 1h and stirring rate 350 rpm) (Mardhiah, et al., 2017)
0
0.5
1
1.5
2
2.5
0
20
40
60
80
100
0 1 2 3 4 5
Aci
d C
apac
ity (
mm
ol/
g)
Conver
sion Y
ield
(%
)
Number of Cycles
Conversion Yield (%) Acid Capacity (mmol/g)

35
Asikainen, Munter and Linnekoski (2015) made use of seven different types of
solid acid catalysts to catalyse the production of FAME from palmitic acid derivatives.
Deactivation studies of Nafion NR50 were studied by conducting five successive
reaction cycles of 24 h on mixture of algae oil model compounds. The reaction was
carried out with 0.05 mmol of model compound, 5 mL of methanol and 80 mg of
catalyst at temperature of 65 °C and stirring rate of 450 rpm. The experimental results
obtained for 5 cycles were 35 ± 5 %, signifying that no catalyst deactivation took place.
For Nafion or silica composite catalyst, deactivation may take place due to blockage
caused by large molecular weight hydrophobic products.
Wu, et al. (2014) had investigated the usage of magnetic solid acid catalysts
for biodiesel production from cottonseeds. Same reaction was repeated consecutively
under optimum conditions to determine the stability and reusability of S2O82-/ZrO2-
TiO2-Fe3O4 with Zr/Ti molar ratios of 3/1 (SZTF-3-1) catalyst. The catalytic activity
remained high with minimal decrement after eight cycles. A drastic drop in catalytic
activity was discovered after being reused for nine times. This was further supported
by the declining trend in biodiesel yield. X-ray Photoelectron Spectroscopy (XPS) was
used to determine the chemical state of sulfur in the fabricated catalyst after each
experimental run. The corresponding results are depicted in Figure 2.8 and it
conformed with that of biodiesel yield over the recycled catalyst. This is because the
sulfur present on the sulfated oxide catalyst contributes to acidity which in turn
imposes a great impact on the catalytic activity. Nevertheless, the regeneration of the
catalyst can be easily done by treatment with S2O82- again.
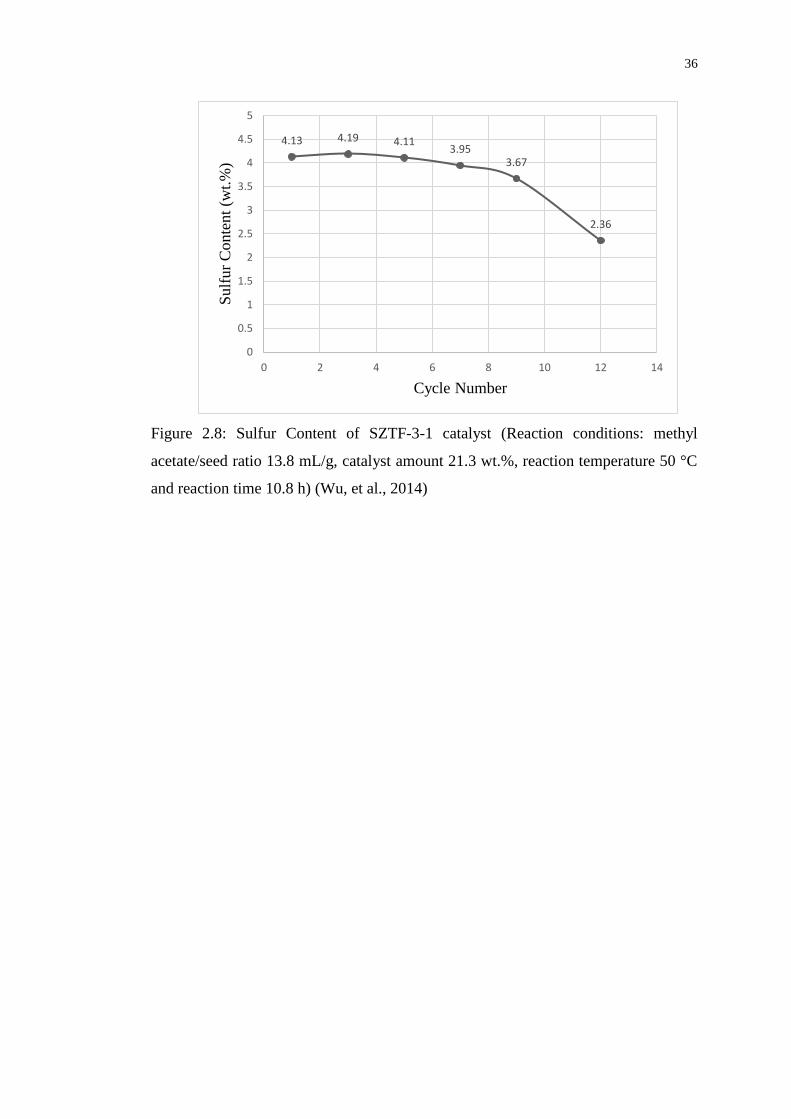
36
Figure 2.8: Sulfur Content of SZTF-3-1 catalyst (Reaction conditions: methyl
acetate/seed ratio 13.8 mL/g, catalyst amount 21.3 wt.%, reaction temperature 50 °C
and reaction time 10.8 h) (Wu, et al., 2014)
4.13 4.19 4.113.95
3.67
2.36
0
0.5
1
1.5
2
2.5
3
3.5
4
4.5
5
0 2 4 6 8 10 12 14
Sulf
ur
Conte
nt
(wt.
%)
Cycle Number

37
CHAPTER 3
3 METHODOLOGY AND WORK PLAN
3.1 Prerequisite Requirements
The required raw materials, chemicals and equipment for the research project are
clearly stated in the following sections. The raw materials and chemicals must be well
prepared prior to the experiment whereas the apparatus and instrument are used to
perform the experiment and evaluate the characteristics of the experimental products,
respectively.
3.1.1 Raw Materials
In this project, biomass waste of banana peels was chosen as the carbon precursor for
synthesising the solid acid catalysts. Waste banana peels was obtained from a local
hawker at Negeri Sembilan, Malaysia.
3.1.2 Chemicals
Table 3.1 lists out the chemicals that were involved in catalyst preparation, biodiesel
production reaction and analytical procedures. Their respective sources, purities and
the approximate amounts are clearly stated too.
Table 3.1: List of Chemicals Required
Chemicals Source Purity Estimated
Quantity Purpose
2-Propanol Merck ≥99.8 % 200 mL Solvent for biodiesel
Cooking oil
Lam Soon
Edible
Oils
100 % 10 mL Reactant for
interesterification

38
Table 3.1 (Continued)
Chemicals Source Purity Estimated
Quantity Purpose
Distilled water UTAR 100 % Excess
Preparation of sulfuric
acid, hydrochloric acid,
potassium hydroxide and
sodium hydroxide
aqueous solutions and
washing of solid acid
catalyst
Hydrochloric acid Fisher
Chemical 37 % 100 mL
Titrant for measurement
of acid density of
synthesised catalyst
Methanol Merck ≥99.8 % 100 mL Reactant for
transesterification
Methyl acetate Alfa
Aesar 99 % 3 L
Reactant for
interesterification
Methyl
heptadecanoate
Sigma-
Aldrich 4 g/L 100 mL
Internal standard for Gas
Chromatography (GC)
n-Hexane Merck ≥99 % 1 L Solvent for biodiesel
product in GC analysis
Oleic acid Fisher
Chemical 85-92 % 2.5 L
Reactant for
interesterification
ortho-Phosphoric
acid Merck 85 % 2.5 L
Chemical activation of
waste banana peels
Palmitic acid Merck ≥98 % 50 g Reactant for
interesterification

39
Table 3.1 (Continued)
Chemicals Source Purity Estimated
Quantity Purpose
Phenolphthalein R & M
Chemicals 1 g/L 100 mL pH indicator
Potassium
hydroxide pellets Merck ≥99 % 50 g
Titrant for measurement
of acid values of
feedstock and product
Sodium
hydroxide pellets Merck ≥85 % 50 g
Measurement of acid
density of synthesised
catalyst
Stearic acid Merck ≥97 % 50 g Reactant for
interesterification
Sulfuric acid Fisher
Chemical 98 % 2.5 L Sulfonating agent
3.1.3 Apparatus, Instruments and Equipment
Throughout the research, different apparatus and equipment were involved to offer
various applications. Table 3.2 shows the apparatus and equipment employed in
synthesis of solid acid catalyst and interesterification while Table 3.3 displays the
instruments utilised in the analysis of feedstock, products and fabricated solid acid
catalysts.
Table 3.2: List of Apparatus and Equipment
Apparatus/ Equipment Specification Purpose
Blender Berjaya Size reduction of biomass waste
Condenser column Coil Type Condensing vapour methyl
acetate during reaction

40
Table 3.2 (Continued)
Apparatus/ Equipment Specification Purpose
Furnace Muffle Carbonisation of biomass waste
into biochar
Heating mantle Mtops Maintaining the desired operating
temperature of interesterification
Mortar and pestle - Size reduction of biochar
Oven Memmert Drying of biomass waste, biochar
and solid acid catalyst
Separating funnel 500 mL Separation of biodiesel from the
remaining reactants
Sieve PRADA (300 and
850 micron)
Sieving of biomass waste and
biochar
Three-neck round bottom
flask 500 mL Interesterification flask
Table 3.3: List of Instruments
Instrument Specification Purpose
Fourier Transform
Infrared Spectroscopy
(FTIR)
Nicolet iS10 FTIR
Identification of adsorbed
species and chemisorption of the
solid catalyst from the
functional groups present
Gas Chromatography
(GC)
GC-FID Perkin
Elmer Clarus 500 Determination of biodiesel yield
Scanning Electron
Microscopy Equipped
with Energy Dispersive
X-ray (SEM-EDX)
Hitachi Model S-
3400N
Determination of surface
morphology and chemical
elements such as sulfur present
in the fabricated catalyst

41
Table 3.3 (Continued)
Instrument Specification Purpose
X-ray Diffractometer
(XRD)
Shimadzu XRD-
6000 |
Identification of crystalline
phase and chemical composition
in the synthesised catalyst
3.2 Overall Research Methodology and Flow Diagram
The research process comprises of a series of methodology with the main purpose of
synthesising a carbon based solid acid catalyst for biodiesel production. The overall
research plan can be divided into various successive components and the project was
carried out according to the flow diagram illustrated in Figure 3.1.
3.3 Experimental Procedures
The experimental works that need to be carried out are mainly the synthesis of catalyst
and production of biodiesel via interesterification. Repetition of experiment is
necessary to optimise the catalytic performance of the produced catalyst.
3.3.1 Catalyst Preparation
The collected waste banana peels were washed and any unwanted part was removed.
They were then cut into smaller pieces and placed evenly on a metal tray. Preliminary
cutting was required to increase the surface area for drying. Drying was carried out
using an oven at 80 °C overnight to eliminate moisture. This moderate temperature
was used to prevent decomposition of biomass waste at high temperature. Further size
reduction was carried out using a blender to make the fully dried banana peels into
powder form as fine particles size facilitated the sulfonation procedures. Next, a test
sieve with 850 μm mesh was used to control the particle size distribution of the powder.
Extra samples of waste banana peels were kept in reserve in the fridge for use when
needed.

42
Figure 3.1: Flow Diagram of Research Methodology
Pretreatment of biomass waste
• Washing and cleaning
• Drying
• Size reduction
• Sieving
Synthesis of solid acid catalysts
• Chemical activation with ortho-phosphoric acid
• Calcination
• Controlling distribution of biochar particle size via sieving
• Direct sulfonation via thermal treatment with sulfuric acid
Characterisation of developed catalysts
• Scanning Electron Microscopy equippedwith Energy Dispersive X-Ray (SEM-EDX)
• X-ray Diffractometer (XRD)
• Fourier Transform Infrared Spectroscoy(FTIR)
• Titration
Biodiesel Production
• Interesterification
Process Study
• Effects of sulfonating agent concentrationon the properties of catalysts and biodieselyield
• Comparison of interesterification andconventional trasesterification
• Effects of feedstocks on biodiesel yield

43
3.3.2 Calcination of Biomass and Sulfonation
Powder formed was mixed with 30 v/v% ortho-phosphoric acid in acid to solid mass
ratio of 7:1 and impregnated for 24 h (Ee, et al., 2017). This was to increase the
porosity of the biomass waste particles and cause fragmentation of lignocellulosic
materials. Washing of chemical impregnated biomass waste was done with distilled
water and this step was repeated for three times prior to drying at 80 °C overnight.
After drying, the solid was subjected to 3 h calcination in air at 600 °C (Viena,
Elvitriana and Wardani, 2018). The calcination process was carried out in a
programmable furnace with heating rate of 5 °C/min. Appendix A shows the
illustration of waste banana peel based activated carbon (WBPAC) that appeared in
black powder form. Biochar produced was sieved under the size of 300 micron.
Catalysts used for biodiesel production were prepared via direct sulfonation with
different concentrations of sulfuric acid while maintaining all the other parameters. All
sulfonations were performed by immersing 25 g of WBPAC in 250 mL of sulfuric acid
at 80 °C (Tamborini, et al., 2015). The mixture was stirred drastically at 500 rpm for
6 h. The resulting precipitated solid was filtered out and dried at 80 °C overnight. Table
3.4 depicts the catalyst annotation and the corresponding preparation conditions.
Appendix A also shows the sulfonated catalyst which all presented as black powder.
Table 3.4: Catalyst Synthesis Parameter and Nomenclature
Catalyst Sample Concentration of Sulfuric Acid (mol/L)
Cat-2 2
Cat-3 3
Cat-8 8
Cat-13 13
3.3.3 Biodiesel Production
The synthesised solid acid catalysts were used to produce biodiesel via
interesterification. Their catalytic performances would be evaluated based on the
resulting biodiesel yield and conversion. Oleic acid was chosen as the feedstock to
react with methyl acetate in this research project. Interesterification was conducted in
a 500 mL three-neck round bottom flask equipped with a coil condenser, a
thermometer, magnetic stirrer and heating mantle. Capacity of 500 mL was selected

44
since the reaction mixture did not exceed 200 mL. Coil condenser was used to
condense the evaporated methyl acetate, preventing them from escaping. A
thermometer was dipped inside the reaction mixture to monitor the reaction
temperature.
10 mL of oleic acid was added to form a reaction mixture which consisted of
methyl acetate and oleic acid at a molar ratio of 50:1. 12 wt.% of developed catalyst
was also added into the mixture. The reaction was performed for 8 h excluding the
temperature build-up period with rotational speed of 600 rpm provided by a magnetic
stirrer. Stirring was to ensure uniform temperature and well mixing of the reaction
mixture. At the end of the reaction, excess methyl acetate was eliminated through
evaporation and the catalyst was filtered after the product was cooled to room
temperature. Each set of experiment conducted using synthesised catalysts was
repeated twice.
In addition, the synthesised solid acid catalyst with optimum chemical and
physical properties from the interesterification process was used to produce biodiesel
via conventional transesterification under the same reaction conditions. To evaluate
the effectiveness of applying interesterification in producing biodiesel, other
feedstocks such as palmitic acid, stearic acid and cooking oil were employed with
concentrated sulfuric acid as homogeneous catalyst.
3.4 Feedstock Characterisation: Acid Value
Titration method was employed to evaluate the acid value of the feedstock. 1 g of oleic
acid was mixed with of 5 mL 2-propanol which was the solvent in a conical flask,
forming the analyte while 0.1 M potassium hydroxide, KOH aqueous solution was the
titrant. Few drops of phenolphthalein were added too to serve as pH indicator. Titration
process continued until a pink colour appeared which signified the end point. Blank
titration was also carried out to eliminate the influence of solvent on the results. Acid
value of the oleic acid can be calculated using Equation 3.1 as stated below. Acid value
of other feedstocks that were palmitic acid, stearic acid and cooking oil were evaluated
too.

45
𝐴𝑐𝑖𝑑 𝑣𝑎𝑙𝑢𝑒 𝑜𝑓 𝑜𝑙𝑒𝑖𝑐 𝑎𝑐𝑖𝑑 (
𝑚𝑔 𝐾𝑂𝐻
𝑔)
=(𝑉 − 𝐵) × 𝑀 × 𝑀𝑊𝐾𝑂𝐻
𝑊×
1000 𝑚𝑔
1 𝑔
(3.1)
where
V = Volume of KOH solution used (L)
B = Volume of KOH solution used in blank titration (L)
M = Molarity of KOH solution= 0.1 M
MWKOH = Molecular weight of KOH= 56.11 g/gmol
W = Weight of oleic acid= 1 g
3.5 Catalyst Characterisation and Screening
Numerous characterisation techniques were carried out on all the developed solid acid
catalysts before and after sulfonation. The purpose of doing so is to study the effect of
synthesis parameter on the chemical and physical characteristics of the catalysts. This
can be done by using high performance analytical instruments such as Scanning
Electron Microscope equipped with Energy-Dispersive X-ray (SEM-EDX), Fourier
Transform Infrared Spectroscopy (FTIR) and X-ray Diffractometer (XRD).
Conventional titration method was also used to determine the acid density of the
catalyst.
3.5.1 Scanning Electron Microscopy Equipped with Energy Dispersive X-ray
(SEM-EDX)
SEM-EDX was utilised to obtain information about surface morphology of the
synthesised solid acid catalysts. In order to carry out analysis using SEM, the test
sample must be conductive. This could be done by using a sputter-coater machine to
cover a thin layer of palladium or gold on the surface of the catalyst. Catalyst was
observed under the magnifications of 700X and 1000X with SEM-EDX which was
operated at an accelerating voltage of 15 kV. The acquired images were used to
evaluate the pore diameter of the catalysts via manual measurement. The actual pore
size could be calculated by referring to the scale of each micrograph. Since SEM was

46
furnished with EDX, the elemental and chemical information of the developed
catalysts were also generated. The attachment of certain elements on the catalysts
surface such as sulfur and their corresponding composition were also known.
3.5.2 X-ray Diffractometer (XRD)
XRD was applied to locate the precise arrangements of atoms in a crystal structure and
to identify the crystalline phase present and composition of the synthesised catalysts.
X-rays were generated in a cathode ray tube and filtered to produce monochromatic
radiation. Sample was finely ground and pressed on a steel plate to ensure a uniform,
homogenise and smooth surface. During the analytical test, the sample was oriented
and scanned from 10° to 80° with a scanning speed of 2°/min in order to obtain a
diffractogram which was presented as a function of intensity in terms of the angle 2
theta/theta.
3.5.3 Fourier Transform Infrared Spectroscopy (FTIR)
FTIR was used to study the chemisorption of functional groups anchored on the
catalysts. It was a qualitative analysis used to validate the presence of the sulfonic
groups, -SO3H. An infrared radiation with wavenumber ranging from 400 to 4000 cm-
1 was passed through a sample which is placed atop of the diamond crystal. The sample
was maintained at fixed position with the aid of the pressure tower and compression
tip. Energy of radiation was absorbed by the sample molecules to vibrate and rotate.
However, only radiation of a specific wavelength could be absorbed by the samples
molecules to vibrate at specific frequencies due to their distinct molecular structure.
These frequencies could be associated with particular bond types. The results were
presented in transmittance spectra. An infrared background data from cleaned diamond
crystal was collected every time before conducting FTIR scanning for catalyst samples.
3.5.4 Acid Density
Back titration technique could be used to determine the acid density of the synthesised
solid acid catalyst. 0.1 g of catalyst was mixed with 60 mL of 0.01 M sodium hydroxide,
NaOH aqueous solution. The mixture was agitated uniformly at room temperature and
300 rpm for 30 minutes by using magnetic stirrer. After filtration, the filtrate was
titrated with 0.01 M hydrochloric acid, HCl in the presence of phenolphthalein. The

47
titration process stopped when the solution changes from pink to colourless. The
chemical reaction between sodium hydroxide and hydrochloric acid is described by
Equation 3.2. It is known from the stoichiometry ratio that 1 mol of sodium hydroxide
reacted with 1 mol of hydrochloric acid. The volume of hydrochloric acid added was
used to evaluate the acid density of the catalyst as shown in Equations 3.3, 3.4 and 3.5.
𝑁𝑎𝑂𝐻 + 𝐻𝐶𝑙 → 𝑁𝑎𝐶𝑙 + 𝐻2𝑂 (3.2)
𝑀𝑜𝑙𝑒 𝑜𝑓 𝐻𝐶𝑙
= 𝑉𝑜𝑙𝑢𝑚𝑒 𝑜𝑓 𝐻𝐶𝑙 𝑎𝑑𝑑𝑒𝑑 (𝑚𝐿) × 0.01𝑚𝑜𝑙
𝐿 ×
1 𝐿
1000 𝑚𝐿
(3.3)
𝑀𝑜𝑙𝑒 𝑜𝑓 𝑁𝑎𝑂𝐻 𝑛𝑒𝑢𝑡𝑟𝑎𝑙𝑖𝑠𝑒𝑑 𝑏𝑦 𝐻𝐶𝑙 = 𝑀𝑜𝑙𝑒 𝑜𝑓 𝐻𝐶𝑙
𝑀𝑜𝑙𝑒 𝑜𝑓 𝑁𝑎𝑂𝐻 𝑛𝑒𝑢𝑡𝑟𝑎𝑙𝑖𝑠𝑒𝑑 𝑏𝑦 𝑎𝑐𝑖𝑑 𝑠𝑖𝑡𝑒𝑠 𝑜𝑛 𝑐𝑎𝑡𝑎𝑙𝑦𝑠𝑡
= 𝐼𝑛𝑖𝑡𝑖𝑎𝑙 𝑚𝑜𝑙𝑒 𝑜𝑓 𝑁𝑎𝑂𝐻 − 𝑀𝑜𝑙𝑒 𝑜𝑓 𝑁𝑎𝑂𝐻 𝑛𝑒𝑢𝑡𝑟𝑎𝑙𝑖𝑠𝑒𝑑 𝑏𝑦 𝐻𝐶𝑙
(3.4)
𝐴𝑐𝑖𝑑 𝑑𝑒𝑛𝑠𝑖𝑡𝑦 (
𝑚𝑚𝑜𝑙 𝑁𝑎𝑂𝐻
𝑔)
=𝑀𝑜𝑙𝑒 𝑜𝑓 𝑁𝑎𝑂𝐻 𝑛𝑒𝑢𝑡𝑟𝑎𝑙𝑖𝑠𝑒𝑑 𝑏𝑦 𝑎𝑐𝑖𝑑 𝑠𝑖𝑡𝑒𝑠 𝑜𝑛 𝑐𝑎𝑡𝑎𝑙𝑦𝑠𝑡
0.1
×1000 𝑚𝑚𝑜𝑙
1 𝑚𝑜𝑙
(3.5)
3.6 Biodiesel Characterisation
Biodiesel produced via interesterification between oleic acid and methyl acetate in the
presence of synthesised catalyst was analysed using gas chromatography (GC) to
determine the resulting yield. Titration was also performed to obtain conversion via
determination of the products’ acid values.
3.6.1 Gas Chromatography (GC)
Samples of the interesterification product were withdrawn for GC analysis. Product
samples were diluted with n-hexane according to a specific dilution factor. A constant

48
amount of methyl heptadecanoate was also added as an internal standard. After
appropriate dilution and preparation, 1 µL of test sample was injected into GC and
instantly vaporised.
Helium gas acted as a carrier gas to bring the samples to flow along the fused
silica capillary column (30 m x 0.53 mm x 0.5μm). Table 3.5 depicts the setting of the
GC for quantitative analysis of biodiesel content in the product. Separation of the
sample mixture into its constituent components was due to different travelling speeds
and retention times. GC was equipped with a flame ionisation detector (FID) which
sensed the individual components while recorder analysed the results, producing a
chromatogram. Peaks of the spectrum related to the amount of biodiesel present in the
sample.
Table 3.5: Gas Chromatography Specifications for Biodiesel Samples
Specifications Set Value
Injector temperature (°C) 200
Detector temperature (°C) 220
Carrier gas flowrate (mL/min) 3
Oven initial temperature (°C) 110
Oven maximum temperature (°C) 220
Heating rate (°C/min) 10
Since external standard was employed as the analysis method to determine the
biodiesel yield, a standard methyl oleate calibration curve, that was a plot of peak area
ratio against concentration of methyl oleate, needed to be generated beforehand. In this
case, methyl oleate was diluted with n-hexane before conducting the GC analysis.
Various dilution factors were used to generate test samples at different concentrations.
A line equation that was obtained from the calibration curve was used to estimate the
biodiesel concentration in the product. The concentration data could be used to
calculate the respective biodiesel yield as shown in Equation 3.6.
𝑌𝑖𝑒𝑙𝑑(%) =
𝐶𝑜𝑛𝑐𝑒𝑛𝑡𝑟𝑎𝑡𝑖𝑜𝑛 𝑜𝑓 𝑚𝑒𝑡ℎ𝑦𝑙 𝑜𝑙𝑒𝑎𝑡𝑒 (𝑔
𝐿)
𝐷𝑖𝑙𝑢𝑡𝑖𝑜𝑛 𝑓𝑎𝑐𝑡𝑜𝑟 × 𝑉𝑜𝑙𝑢𝑚𝑒(𝐿)
10 𝑚𝐿 𝑜𝑙𝑒𝑖𝑐 𝑎𝑐𝑖𝑑 × 𝐷𝑒𝑛𝑠𝑖𝑡𝑦 𝑜𝑓 𝑜𝑙𝑒𝑖𝑐 𝑎𝑐𝑖𝑑 (𝑔
𝑚𝐿)
× 100% (3.6)

49
3.6.2 Acid Value
Acid value determination method that was discussed in Section 3.4 was applied for
product analysis. The analyte was replaced by product obtained from
interesterification reaction. Titration result gave the final acid value after the reaction.
Conversion of the reaction can be calculated based on the initial and final acid values
as shown in Equation 3.7.
𝐴𝑐𝑖𝑑 𝑉𝑎𝑙𝑢𝑒 𝐶𝑜𝑛𝑣𝑒𝑟𝑠𝑖𝑜𝑛 (%) =𝑎𝑖−𝑎𝑓
𝑎𝑖 × 100% (3.7)
where
𝑎𝑖 = 𝑖𝑛𝑖𝑡𝑖𝑎𝑙 𝑎𝑐𝑖𝑑 𝑣𝑎𝑙𝑢𝑒 𝑜𝑓 𝑜𝑙𝑒𝑖𝑐 𝑎𝑐𝑖𝑑 (𝑚𝑔 𝐾𝑂𝐻
𝑔)
𝑎𝑓 = 𝑓𝑖𝑛𝑎𝑙 𝑎𝑐𝑖𝑑 𝑣𝑎𝑙𝑢𝑒 𝑜𝑓 𝑝𝑟𝑜𝑑𝑢𝑐𝑡 (𝑚𝑔 𝐾𝑂𝐻
𝑔)

50
CHAPTER 4
4 RESULTS AND DISCUSSION
4.1 Catalyst Characterisation
Since the catalysts used in this study were sulfonated with different concentrations of
sulfuric acid as sulfonating agent, characterisation of catalyst was conducted to study
their differences in chemical and physical aspects. This was done by utilising four
types of analytical instruments, namely Scanning Electron Microscope equipped with
Energy Dispersive X-ray (SEM-EDX), X-ray Diffractometer (XRD) and Fourier
Transform Infrared Spectroscopy (FTIR). The catalytic performance of different types
of catalyst on biodiesel production were investigated too. Biodiesel production was
carried out through interesterification at 60 °C with methyl acetate to oleic acid molar
ratio of 50, 12 wt.% catalyst loading and stirring speed of 600 rpm for a period of 8 h.
4.1.1 Scanning Electron Microscope (SEM)
SEM was used to study the topography, surface morphology and structural properties
of untreated and pretreated waste banana peels, WBPAC and synthesised catalysts at
the magnification of 700X and 1000X non-destructively. Figure 4.1 shows the SEM
images of the waste banana peels, chemically activated banana peels, WBPAC and the
synthesised catalyst Cat-13. Cat-13 was chosen as the representative among all the
synthesised catalysts to compare with samples at different stages of synthesising
procedures because it was the best performed catalyst in interesterification reaction.
It can be seen that a naturally smooth and irregular morphology was observed
in waste banana peel. Less cracks and crevices were available for the acidic site to
anchor. After undergoing chemical treatment of activation, modification in structure
and textural properties were revealed. More cracks and defects with rough texture
surface were noticed. This proves that activation process helps in porosity
development which in turn largely affects the surface area (Prachpreecha,
Pipatpanyanugoon and Sawangwong, 2016).

51
Figure 4.1: SEM Images of Waste Banana Peels, Chemically Activated Banana Peels,
WBPAC and Synthesised Catalyst Cat-13 at the Magnification of 1000X, (a) Waste
Banana Peels, (b) Chemically Activated Banana Peels, (c) WBPAC and (d) Cat-13
Surface roughness was increased in a large extent where uneven and
unorganised surfaces, small particles and pores were visible after carbonisation, thus
making WBPAC a promising catalyst support. According to Viena, Elvitriana and
Wardani (2018), high temperature of thermal activation resulted in hollower pores on
the carbon due to release of some volatile compounds. The pore size of WBPAC was
estimated to be around 3 μm from the microscopy image. These small perforations
present increase the specific surface area and act as a site for the attachment of sulfonic
groups. However, the surface morphology had not much difference between before
and after sulfonation process.
Besides, Figure 4.2 illustrates the SEM images of various catalysts at different
concentration of sulfonating agent. As the catalyst were prepared using higher
concentration of sulfuric acid, the surfaces became rougher and the porosity were
increased. Mao, et al. (2018) claimed that usage of high concentration of sulfuric acid
in sulfonation process will result in better carbon frame structures. Less pores were

52
observed on the surface of Cat-2 compared to Cat-13. Surfaces of Cat-2 and Cat-3
were smoother than others. On the other hand, Cat-13 was high in porosity with
numerous black holes on the surface. There was no noticeable change on the surface
morphology between Cat-8 and Cat-13.
Figure 4.2: SEM Images of Synthesised Catalysts at the Magnification of 700X, (a)
Cat-2, (b) Cat-3, (c) Cat-8 and (d) Cat-13
4.1.2 Energy Dispersive X-ray Spectrometer (EDX)
EDX is a surface characterisation technique that reveals the identity of the chemical
elements present at the surface. In the analytical test, data were collected at four
different spots for each sample to obtain an average and more accurate information.
Atomic percentage is preferred over weight percentage in result presentation because
the former only depends on the number of atom whereas the latter is influenced by the
atomic mass of the element itself. In other words, if an element has a large value of
atomic mass, this contributes to a larger weight percentage. The detailed elemental
compositions of carbon, C, oxygen, O, silicon, Si, phosphorus, P, sulfur, S and indium,

53
In in atomic percentage for untreated and pretreated waste banana peels, WBPAC and
synthesised catalysts are summarised in Table 4.1.
Table 4.1: Surface Elemental Composition in Atomic Percentage
Sample Elemental Composition (at.%)
C O Si P S In
Waste banana peels 57.27 37.91 0.62 0.39 0.24 3.57
Chemically activated
banana peels 67.85 30.50 0.31 0.99 0.26 0.09
WBPAC 82.17 13.91 1.35 2.33 0.09 0.15
Cat-2 88.05 9.35 0.91 1.02 0.63 0.04
Cat-3 86.14 10.67 1.39 0.97 0.78 0.05
Cat-8 84.96 11.43 0.84 1.39 1.28 0.10
Cat-13 81.13 16.11 0.67 0.59 1.39 0.11
Waste banana peels mainly consist of carbon and oxygen, supplementing by
minor elements such as silicon, phosphorus, sulfur and indium. The carbon content
must surpass others since it is the building block of life. The atomic percentage of the
carbon increased from 57.27 % to 82.17 % as it transformed from waste banana peels
to activated carbon. However, the atomic percentage of carbon did not vary much after
the sulfonation process. On the other hand, the significant oxygen content is
contributed by the rich sources of carbohydrates and fibres in the samples (Palma, et
al., 2010).
The elemental compositions of silicon and phosphorus fluctuated below 2.50
at.%. Leaching of silicon from the ceramic crucible might be the factor that causes the
atomic fraction of silicon to increase after thermal activation. Moreover, phosphorus
content increased from 0.39 to 0.99 at.%. This is because phosphoric acid was used to

54
pretreat the waste banana peels and the increment might due to the retainment of
phosphoric acid resulting from insufficient washing. The presence of high atomic
percentage of indium in the waste banana peels might originate from the agricultural
soil. Ladenberger, et al. (2015) reported that the indium had a median value of 0.0176
mg/kg in agricultural soil. Nonetheless, indium had been successfully reduced through
the chemical treatment of phosphoric acid, washing and carbonisation.
Sulfur is the chief active element responsible for the catalytic activities of the
synthesised catalysts and it can be assumed that all sulfur atoms were present as
sulfonic acid sites on the catalyst surface (Ngaosuwan, Goodwin and Prasertdham,
2016). Activated carbon prior to sulfonation had negligible sulfur content that was 0.09
at.% but this was increased noticeably after sulfonation, indicating successful
attachment of active sites on the catalyst support. As depicted in Figure 4.3, as the
concentration of sulfonating agent increased, the sulfur content of the resulting catalyst
increased too with the highest sulfur content in Cat-13. This was attributed to that
higher sulfuric acid concentration could stimulate more H2SO4 molecules to form a
connection with carbon layer, giving more sulfonic group attachment and yielding
higher acid capacity. Large specific surface area with mesopores in activated carbon
further increased the accessibility of sulfuric acid to the catalyst support. As a result,
Cat-13 gave the highest biodiesel yield when it was implemented in the
interesterification reaction. Figure 4.4 depicts the EDX analysis spectrum at one of the
spot of Cat-13. A complete EDX analysis report for all the samples tested are attached
in Appendix B.
Nevertheless, carbon, oxygen, silicon, phosphorus and indium contents of the
catalysts were inconsistent. Some elements exist both on the surface and inside the
pore. EDX works only for surface elemental analysis and does not represent the bulk
composition. Hence, those element inside the pore may not be discovered completely
by using EDX.

55
Figure 4.3: Sulfur Content of Synthesised Catalysts
Figure 4.4: EDX Analysis Spectrum of Cat-13
4.1.3 X-ray Diffractometer (XRD)
XRD is an analytical technique used to identify the composition, crystalline phase and
crystallite size from the constructive interference of monochromatic X-rays and a
crystalline sample. Only a solid with crystalline structure can diffract the beams of X-
ray. This is due to the fact that unlike amorphous materials, the atoms of crystalline
0
0.2
0.4
0.6
0.8
1
1.2
1.4
1.6
0 2 4 6 8 10 12 14
Ato
mic
Per
centa
ge
of
Sulf
ur
(at.
%)
Concentration of Sulfuric Acid (mol/L)

56
structure are arranged in a periodic array. The XRD patterns of the untreated and
pretreated waste banana peels, WBPAC and Cat-13 are shown in Figure 4.5. It can be
seen that all the samples tested were semicrystalline since only a few crystalline phases
were detected. Chellappan, et al. (2018a) claimed that the broad diffraction peak at 2Ɵ
ranging from 20° to 30° in each sample corresponded to C (0 0 2). This was induced
by the presence of amorphous carbon structure which consisted of randomly oriented
aromatic carbon sheets. However, this broad peak became narrower from waste banana
peels to Cat-13 due to the formation of stable carbonaceous material that is ordered
graphitic structure in the fabricated catalyst.
The XRD patterns of the activated banana peels and WBPAC were not the
same, indicating that there is a change of crystal structure during thermal treatment.
The XRD pattern of Cat-13 was almost identical to that one of the WBPAC which
means the direct sulfonation method has negligible impact on the mirostructure of the
carbon materials. Nevertheless, the intensity of diffraction peak C (0 0 2) decreased,
suggesting the attachment of sulfonic group on the surface of the catalyst support
which leads to increment in the degree of randomness among the carbon sheets
(Chellappan, et al., 2018a).
Figure 4.6 depicts the XRD diffraction peaks of catalysts that were synthesised
under different sulfonating conditions. Similar peaks were found at 2Ɵ of around 38.5°,
44.7°, 65° and 78.2° which correspond to Al (1 1 1), (2 0 0), (2 2 0) and (3 1 1) (Hu,
et al., 2018). These peaks were contributed by the sample holder which is made out of
aluminium. On the other hand, Zhao, et al. (2018) emphasised that the main
characteristics reflection of sulfur crystal happens at 2Ɵ of 23.16° which corresponds
to S (2 2 2). However, it is difficult to observe any information regarding sulfur from
the diffraction peak pattern since S (2 2 2) overlaps with C (0 0 2). Contrarily,
intensities of diffraction peak at 2Ɵ of 23.16° for the synthesised catalysts are tabulated
in Table 4.2. As the concentration of the sulfonating agent increased, the diffraction
peak intensified, signifying that more sulfur phase was present.

57
Figure 4.5: XRD Patterns of Waste Banana Peels, Chemically Activated Banana Peels, WBPAC and Synthesised Catalyst Cat-13

58
Figure 4.6: XRD Patterns of Synthesised Catalysts

59
Table 4.2: Data of Diffraction Peaks at 2Ɵ of 23.16°
Sample Intensity
Cat-2 336
Cat-3 354
Cat-8 360
Cat-13 390
4.1.4 Fourier Transform Infrared Spectroscopy (FTIR)
FTIR analysis was performed with the wavenumber range of 400 to 4000 cm-1 to
identify the functional group present on the surface of the catalysts. This is a critical
analytical test to verify the presence of the acidic group which is the active site in
catalysing the interesterification reaction and leading to biodiesel production.
According to Chellappan, et al. (2018a), a solid acid catalyst must possess hydroxyl, -
OH, carboxylic acid, -COOH and sulfonic acid, -SO3H functional groups for it to be
efficient. Table 4.3 lists out the common stretching vibrations in catalysts and their
corresponding frequencies.
Table 4.3: Infrared Stretching Frequencies (Thushari and Babel, 2018; Coates, 2006;
Niu, et al., 2018)
Vibration Frequency Range (cm-1)
O-H stretch 2800-3600
C=O stretch 1500-1800
C=C stretch 1600
O=S=O stretch 1100-1200
-SO3H stretch 1296
C-S stretch 670-715
As shown in Figure 4.7, well defined discrepancies were detected from the
comparison of WBPAC and the synthesised solid acid catalyst Cat-13, revealing the
effect of direct sulfonation method on the catalyst support. A deep band ranging from
1100 to 1200 cm-1 appeared in the FTIR spectrum of Cat-13, indicating the stretching
vibration of O=S=O in symmetrical and asymmetrical forms. Bands at around 1296
cm-1 and 670 to 715 cm-1 demonstrated the existence of sulfonic group and its

60
successful incorporation onto the carbon matrix of WBPAC. Since concentrated
sulfuric acid was used as the sulfonating agent, aliphatic groups of CH2 or CH3 can be
oxidised to carboxylic acid groups, enhancing the total acid density of the fabricated
catalysts (Sandouqa, Al-Hamamre and Asfar, 2018). This was supported by the
presence of vibration bands around 1500 to 1800 cm-1 which signified the C=O
stretching of the carbonyl or carboxylic acid functional groups at the surface of the
solid acid catalyst. However, catalyst support was suspected to have carbonyl or
carboxylic region prior to sulfonation since the relevant peak was also present in the
FTIR spectrum of WBPAC. The stretching mode of conjugated C=C bond at 1600 cm-
1 was attributable to the aromatic ring formed as a result of incomplete carbonisation
of carbonaceous materials. Therefore, a more rigid carbon material was formed. The
stretching vibration of hydroxyl group was not obvious in both samples but its
presence would enhance the catalytic performance of the synthesised catalysts (Shuit
and Tan, 2014).
Figure 4.7: Comparison of FTIR Spectra of WBPAC and Cat-13
FTIR spectra of various synthesised solid acid catalysts were compared in
Figure 4.8 and analysis was done to notify any variation. The observed transmittance
peaks at 1296 cm-1, 1100 to 1200 cm-1 and 670 to 715 cm-1 were attributed to the
O=S=O stretching, -SO3H stretching and C-S stretching, respectively. This proved that

61
the active sites were well established on the surface of the sulfonated solid acid
catalysts. Sulfonic acid group was the most prominent functional group since the
O=S=O and -SO3H stretching peaks were more significant compared to others. The
weak and broad peak at wavenumber ranging from 2800 to 3600 cm-1 was assigned to
the stretching mode of O-H in the alcoholic or phenolic group in the samples. All the
catalysts produced showed a clear characteristic peak of incompletely carbonised
materials at band of 1600 cm-1. A more defined EDX spectrum for each sample is
attached in Appendix C.
Figure 4.8: Comparison of FTIR Spectra of All Catalysts
4.1.5 Total Acid Density
Back titration was conducted to evaluate the total acid density of catalyst that
contributed mainly by the sulfonic acid group and enhanced by the weak hydroxyl or
phenolic and carboxylic acid groups (Abdullah, et al., 2017). The total acid densities
of all catalysts produced under different concentrations of sulfuric acid are tabulated
in Table 4.4 whereas the corresponding trend is clearly depicted in Figure 4.9. All
fabricated catalysts showed excellent acidic site concentration. Chellappan, et al.
(2018a) stated that strong hydrogen bonding to sulfonic groups caused mutual
electron-withdrawal which subsequently resulted in high acid density. The total acid
density of the synthesised catalyst increased with the concentration of sulfonating

62
agent used. As the concentration of sulfuric acid increased, higher sulfur content will
allow more acidic site to anchor on the catalyst support and thus resulting in higher
distribution of acidity (Abdullah, et al., 2017).
Table 4.4: Total Acid Density of Synthesised Catalysts at Different Concentrations of
Sulfonating Agent
Catalyst Sample Concentration of Sulfuric
Acid (mol/L)
Total Acid Density
(mmol NaOH/g)
Cat-2 2 0.70
Cat-3 3 0.87
Cat-8 8 1.02
Cat-13 13 1.74
Figure 4.9: Total Acid Density of Synthesised Catalysts at Different Concentrations of
Sulfonating Agent
Cat-13 that was sulfonated using the highest concentration of sulfuric acid
possessed the strongest acidity of 1.74 mmol/g. This result was supported by the
preceding EDX analysis whereby the highest sulfur content was determined in Cat-13.
This is also supported by the microstructure of Cat-13 since it was rougher as
compared to others, having larger specific surface area. Hence, more surface acidic
sites were exposed directly to the sodium hydroxide solution. Chellappan, et al. (2018b)
0
0.2
0.4
0.6
0.8
1
1.2
1.4
1.6
1.8
2
1 2 3 4 5 6 7 8 9 10 11 12 13
Tota
l A
cid D
ensi
ty (
mm
ol
NaO
H/g
)
Concentration of Sulfuric Acid (mol/L)

63
also applied direct sulfonation method with concentrated sulfuric acid and obtained a
comparable total acid density of 1.71 mmol/g for the wood sawdust biochar based
catalyst. However, for Cat-2, the total acid density was only 0.70 mmol NaOH/g
because the loaded sulfonic acid groups were insufficient, resulting in low catalytic
efficiency.
4.2 Feedstock Characterisation: Acid Value
Oleic acid was the main feedstock that reacted with methyl acetate in the presence of
synthesised catalysts to produce methyl oleate as the desired product of biodiesel and
triacetin as the by-product. In addition to oleic acid, other feedstocks such as palmitic
acid, stearic acid and cooking oil were also used to produce biodiesel in the presence
of concentrated sulfuric acid as homogeneous catalyst. This was to compare the
effectiveness of interesterification reaction with that of conventional
transesterification in producing biodiesel.
The acid values of all the feedstocks involved were determined using
conventional titration method involving potassium hydroxide solution and all the
relevant results are tabulated in Table 4.5. Since the purchased stearic and palmitic
acids are in pellet forms, they were subjected to melting prior to titration. Nevertheless,
the acid number of stearic acid could not be detected since solid was formed during
the titration process. The solid nature of the stearic acid is contributed by the presence
of long chain saturated fatty acids and thus it is only slightly soluble in the form of
potassium salts (Kanicky and Shah, 2002). In addition, the melting points of fatty acids
such as palmitic and stearic acids lie within the range of 30 to 65 °C but the titration
process carried out at room temperature. Contrarily, as compared to palmitic acid,
stearic acid has higher melting point and is easier to solidify due to its longer carbon
chain (Mondal, 2011). However, an acid value range for stearic acid is obtained from
a report in 2016 by The United States Pharmacopeial Convention. All the detected acid
values will be used in the Sections 4.3.2, 4.4 and 4.5 to calculate the acid value
conversion in interesterification reaction.

64
Table 4.5: Acid Values of Feedstocks
Sample Volume of KOH used (ml) Acid Value (mg KOH/g)
Oleic Acid 42.7 239.59
Palmitic Acid 44.6 241.83
Stearic Acid - 194-212
Cooking Oil 0.2 1.12
4.3 Biodiesel Characterisation
In this study, all the synthesised catalysts were employed in the interesterification
reaction at 60 °C for 8 h with 12 wt.% catalyst loading and methyl acetate to oleic acid
molar ratio of 50:1 to yield methyl oleate. The interesterification reaction conditions
were remained unchanged for all the experimental run to study the efficiency and
effectiveness of the catalysts used. The methyl oleate yield as well as the acid value
conversion will be used as indicators to discover the catalyst that exhibits the best
catalytic activity. The optimum sulfonation condition that produces the best performed
catalyst will be identified too. An illustration of the product of interesterification
reaction is shown in Appendix A.
4.3.1 Gas Chromatography (GC)
GC was used to verify the presence of methyl oleate and its area under the
chromatogram can be used to evaluate the resulting biodiesel yield. Figure 4.10 depicts
a standard calibration curve with ratio of methyl oleate area to internal standard area
(MO/IS) against the concentration of methyl oleate. The line equation shown can be
used to determine the corresponding methyl oleate concentration in product. Retention
time of methyl oleate is about 15 min and the product of the interesterification reaction
was assumed to consist of methyl oleate only, neglecting the presence of by-product.
Figure 4.11 shows a chromatogram including methyl oleate produced in the
interesterification reaction.

65
Figure 4.10: Methyl Oleate Standard Calibration Curve
Figure 4.11: Chromatogram of Interesterification of Oleic Acid with Methyl Acetate
Table 4.6 shows the concentrations of methyl oleate produced using different
synthesised catalysts and the respective calculated yield. Looking into the pattern of
Figure 4.12, as the concentration of sulfuric acid increased, the biodiesel yield
increased. This shows a similar trend to that of the sulfur content and acid density of
the synthesised catalysts. Cat-13 which underwent sulfonation using 13 mol/L sulfuric
y = 0.2472x
R² = 0.991
0
2
4
6
8
10
12
14
0 10 20 30 40 50 60
MO
/IS
Concentration of Methyl Oleate (g/L)

66
acid gave the highest yield of 43.81 %. The results of gas chromatography analysis are
conformed to the observation of microstructure from SEM analysis which showed that
Cat-13 had high specific surface area with mesopores. Other than that, it also possessed
the highest sulfur content and acidity from the outcomes of EDX analysis and acid
density test, respectively. Catalyst that is sulfonated under more concentrated
sulfonating agent will have more sulfonic acid groups attached on its surface giving it
to have higher total acid density and subsequently offer better catalytic activity. All
these evidences explain the combined effect of high acid density and large surface area
of Cat-13 in producing the highest methyl oleate yield. The gas chromatography
reports for all catalysts are attached in Appendix D as reference.
Table 4.6: Methyl Oleate Yield with Different Catalysts Used
Catalyst Methyl Oleate Concentration (g/L) Yield (%)
Cat-2 0 0
Cat-3 0.96 1.89
Cat-8 4.68 11.17
Cat-13 18.90 43.81
Figure 4.12: Effect of Concentration of Sulfonating Agent on the Methyl Oleate
Yield
0
5
10
15
20
25
30
35
40
45
50
0 2 4 6 8 10 12 14
Yie
ld (
%)
Concentration of Sulfuric Acid (mol/L)

67
One repetitive interesterification reaction was conducted using catalysts
sulfonated with concentrated sulfuric acid and produced negative result. This is
because concentrated sulfuric acid has high viscosity and cause adverse effect by
limiting the dispersion of WBPAC in the sulfonating agent. The motion of WBPAC
might be constrained and resulting in the formation of lump as well as decreasing the
total specific surface area that can be exposed for the attachment of sulfonic acid
groups. Other than that, concentrated sulfuric acid may oversaturate the surface of
catalyst support with sulfonic acid groups and render it to become highly negatively
charged. Therefore, lone-pair electron of the oleic acid carbonyl group is hard to reach
the hydroxyl group of the sulfonic acidic site (Shuit, Ng and Tan, 2015).
The overall yield was not satisfied due to the fact that the acid density might
probably attributable to weak acid groups such as hydroxyl or phenolic and carboxylic
groups which had poor catalytic performance in the interesterification reaction. Wu, et
al. (2014) reported a biodiesel yield of 98.5 % using magnetic solid acid catalyst of
S2O82-/ZrO2-TiO2-Fe3O4 that was prepared via sulfonation with ammonium persulfate.
Interesterification was carried out at 50 °C for 10.8 h with 21.3 wt.% of catalyst loading
and methyl acetate to seed ratio of 13.8 mL/g. This result obtained was much higher
as compared to this study which was using biomass derived solid acid catalyst. The
difference maybe contributed by different sulfonating agent and conditions of
interesterification reaction.
Interesterification reaction using Cat-13 was repeated by adding in 5 wt.%
concentrated sulfuric acid as auxiliary homogeneous catalyst, giving a comparable
yield of 42.74 %. This showed that the concentrated sulfuric acid did not improve the
overall biodiesel yield. Another experimental run was conducted by using 5 wt.%
concentrated sulfuric acid and WBPAC in the absence of any synthesised catalyst. In
this case, WBPAC acted as a medium for the interesterification reaction to take place.
A higher yield of 56.38 % was obtained which challenged the effectiveness of the
fabricated catalysts. All these investigations were performed to find the most efficient
and affordable reaction pathway for biodiesel production from acidic oil.

68
4.3.2 Acid Value Conversion
At the end of the interesterification reaction, excess methyl acetate was removed by
evaporation and the remaining product was tested to determine the final acidity. Table
4.7 enumerates the final acid value of the products whereas Figure 4.13 depicts the
calculated acid value conversions. All synthesised catalysts brought about acid value
reduction from an initial acid number of 239.59 mg KOH/g, excluding Cat-2. As the
concentration of sulfonating agent increased, the final acid value of the reaction
mixture decreased in a larger extent. For instance, Cat-3 successfully reduced the acid
value of the reaction mixture from 239.59 to 230.61 mg KOH/g whereas the acid value
dropped to 189.09 mg KOH/g for Cat-8 which was sulfonated using higher
concentration of sulfuric acid.
In the case of Cat-2, yield obtained from GC analysis is zero which means that
the acid value should remain constant throughout the reaction. Leaching of acidic
active site into the reaction mixture was probably happened and contributed to the
increment in acid value. Talha and Sulaiman (2016) claimed that heterogeneous acid
catalyst had an intrinsic drawback that is leaching of catalyst active sites to
contaminate the product. To eliminate the problem of leaching, catalysts can be
fabricated in larger molecular size (Emrani and Shahbazi, 2012). Acid value for
interesterified oleic acid in the presence of Cat-13 was 40.40 mg KOH/g which
corresponded to a conversion of 83.14 %. This proves that the interesterification
reaction was performed well and oleic acid was successfully converted into products.
The results of acid value conversion are accord with the those yields determined by
using GC.
Table 4.7: Acid Values of Biodiesel Products
Catalyst Volume of KOH used
(ml)
Acid Value
(mg KOH/g)
Acid Value
Conversion
(%)
Cat-2 45.8 256.42 -
Cat-3 41.1 230.61 3.75
Cat-8 33.7 189.09 21.08
Cat-13 7.2 40.40 83.14
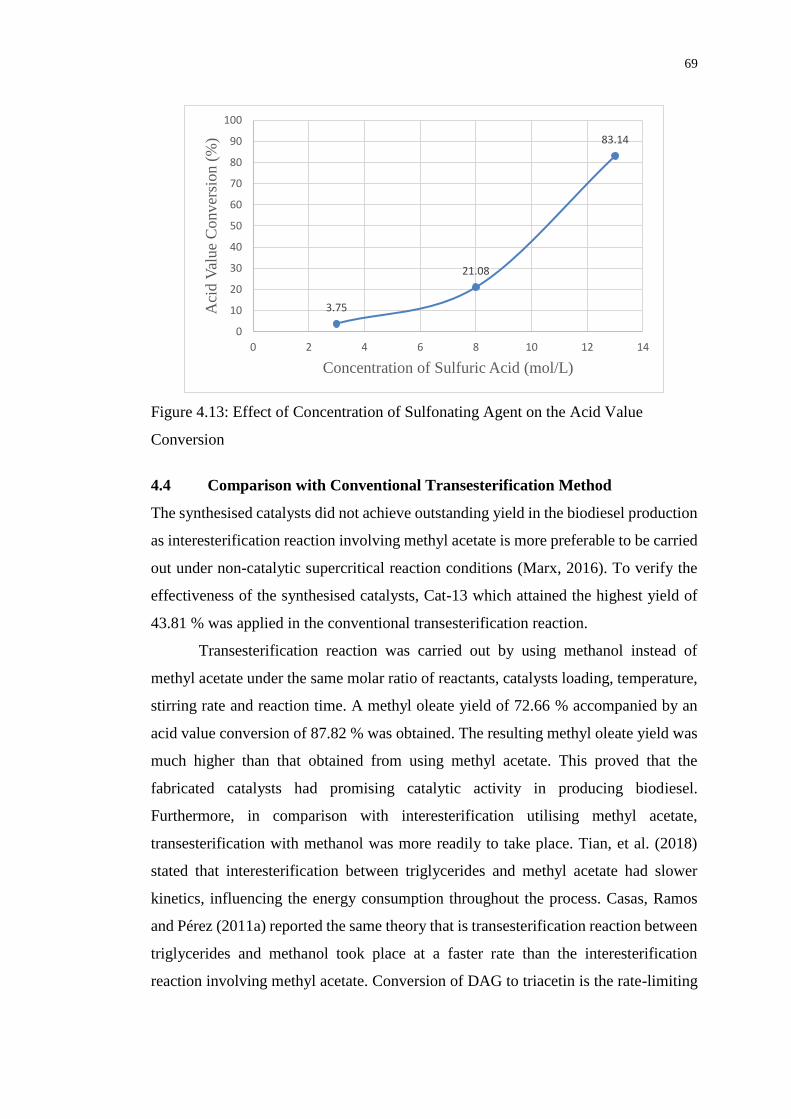
69
Figure 4.13: Effect of Concentration of Sulfonating Agent on the Acid Value
Conversion
4.4 Comparison with Conventional Transesterification Method
The synthesised catalysts did not achieve outstanding yield in the biodiesel production
as interesterification reaction involving methyl acetate is more preferable to be carried
out under non-catalytic supercritical reaction conditions (Marx, 2016). To verify the
effectiveness of the synthesised catalysts, Cat-13 which attained the highest yield of
43.81 % was applied in the conventional transesterification reaction.
Transesterification reaction was carried out by using methanol instead of
methyl acetate under the same molar ratio of reactants, catalysts loading, temperature,
stirring rate and reaction time. A methyl oleate yield of 72.66 % accompanied by an
acid value conversion of 87.82 % was obtained. The resulting methyl oleate yield was
much higher than that obtained from using methyl acetate. This proved that the
fabricated catalysts had promising catalytic activity in producing biodiesel.
Furthermore, in comparison with interesterification utilising methyl acetate,
transesterification with methanol was more readily to take place. Tian, et al. (2018)
stated that interesterification between triglycerides and methyl acetate had slower
kinetics, influencing the energy consumption throughout the process. Casas, Ramos
and Pérez (2011a) reported the same theory that is transesterification reaction between
triglycerides and methanol took place at a faster rate than the interesterification
reaction involving methyl acetate. Conversion of DAG to triacetin is the rate-limiting
3.75
21.08
83.14
0
10
20
30
40
50
60
70
80
90
100
0 2 4 6 8 10 12 14
Aci
d V
alue
Conver
sion (
%)
Concentration of Sulfuric Acid (mol/L)

70
step in interesterification. Therefore, rate of interesterification reaction is low,
resulting in unsatisfied biodiesel yield.
4.5 Interesterification with Different Types of Feedstocks
Due to the reason that the synthesised catalysts could not give a favourable biodiesel
yield, interesterification was repeated using pure concentrated sulfuric acid as
homogeneous catalyst with other reaction conditions remained. 5 wt.% of concentrated
sulfuric acid was used to replace the biomass derived solid acid catalysts (Fernandes,
et al., 2014). Additional experimental runs were conducted by utilising other kinds of
feedstock such as palmitic acid, stearic acid and cooking oil instead of oleic acid. At
the end of the reaction, separating funnel was used to separate the spent concentrated
sulfuric acid from the desired product. The respective outcomes were tabulated in
Table 4.8.
Table 4.8: Biodiesel Yields and Acid Values of Different Feedstocks
Sample Yield (%) Initial Acid Value
(mg KOH/g)
Final Acid Value
(mg KOH/g)
Oleic Acid 67.17 239.59 56.11
Palmitic Acid 0.08 241.83 54.99
Stearic Acid 0.06 194-212 -
Cooking Oil 28.23 1.12 132.42
As referring to the previous data of the best performed catalyst, Cat-13, the
biodiesel yield of oleic acid increased a lot from 43.81 to 67.17 % by applying pure
concentrated sulfuric acid. High acid value conversion of 76.58 % was also obtained,
corresponding to the final acidity of 56.11 mg KOH/g. Other feedstocks showed
comparatively lower yields. For instance, palmitic and stearic acids produced yields of
0.08 and 0.06 %, respectively. Due to the high melting point of palmitic acid,
accumulation might occur during the progress of reaction and caused heterogeneity
between palmitic acid and other reactants (Wu, et al., 2017). This mass transfer
limitation leaded to low biodiesel production. The situation was even worse for the
case of stearic acid since it has higher melting point as compared to palmitic acid. The

71
final acid value in the interesterification with stearic acid could not be detected due to
formation of solid.
Cooking oil consists of a mixture of four types of fatty acids, namely oleic acid,
palmitic acid, stearic acid and linoleic acid. Thus, the product formed not only
composed of methyl oleate but with methyl palmitate, methyl stearate and methyl
linoleate. It resulted in higher yield as compared to palmitic and stearic acids but still
lower than that of oleic acid. However, the increment of acid value after the reaction
was due to the contamination of product by the spent concentrated sulfuric acid.

72
CHAPTER 5
5 CONCLUSIONS AND RECOMMENDATIONS
5.1 Conclusions
The present work focused on synthesising solid acid catalyst from biomass waste of
banana peels for glycerol-free biodiesel production. Several characterisation
techniques such as SEM-EDX, XRD and FTIR were carried out on the synthesised
catalysts. SEM micrographs showed that the catalysts produced had rough and porous
surface. EDX analysis showed an increasing trend of sulfur content with the
concentration of the sulfonating agent used. On the other hand, based on the results of
FTIR analysis, the presence of sulfonic acid group vibration band proved its successful
attachment on the catalyst support. It was identified that an increase in the
concentration of sulfuric acid favoured the formation of high specific surface area, acid
densities and sulfur content in the synthesised solid acid catalyst. The catalyst
produced by biochar sulfonated with 13 M sulfuric acid exhibited the highest total acid
density and sulfur content of 1.74 mmol NaOH/g and 1.39 at.%, respectively.
The synthesised catalysts were then used to catalyse the interesterification of
oleic acid with operating conditions as methyl acetate to oleic acid molar ratio of 50:1
and catalyst loading of 12 wt.%. The main finding of this work showed an
improvement in reaction yields using a catalyst synthesised under more concentrated
sulfonating agent. This novel approach of biomass derived solid acid catalyst catalysed
interesterification demonstrated a biodiesel yield of 43.81 % and reduction of the acid
value from 239.59 to 40.40 mg KOH/g for the best performed catalyst which is Cat-
13. The superiority of the synthesised catalyst was established with an increase of
biodiesel yield to 72.66 % in the case of conventional transesterification. This
indicated the potential of waste banana peel as a promising biomass waste to synthesise
catalyst.
In addition, the current work established the effects of feedstock on the
biodiesel production with the aid of concentrated sulfuric acid as homogeneous
catalyst. Other typical fatty acids such as palmitic acid and stearic acid as well as
cooking oil were tested. For the case of oleic acid, the biodiesel yield obtained using
concentrated sulfuric acid was higher than that of the synthesised catalyst as

73
homogeneous catalyst did not have the problem of mass transfer limitation. The
collected results indicated the potential for interesterification to produce methyl oleate
and triacetin while eliminating the production of glycerol. It also proved that methyl
as an efficient acyl acceptor.
Overall, all the planned objectives were fulfilled. The presented results were
very important as they emphasised on one of the cheaper synthesis route of catalyst
which considerably useful in biodiesel production. It can be concluded that the low
cost of biomass waste derived solid acid catalyst compared to alternative catalyst such
as enzymes or non-catalytic supercritical reaction conditions, combined with
promising biodiesel yield assures further exploration into this scheme.
5.2 Recommendations for Future Work
Experimental work was conducted according to the scope of study but aberration
occurred in the results caused consumption of time to perform more repetition of
laboratory work, restricting the exploration of the study. The discrepancies in the
results might due to differences in every batch of samples collected or catalyst
produced. Several improvements can be made in the future related research work in
order to ameliorate the precision, consistency and reliability of the experimental data.
Various recommendations related to the study are listed in the following.
i. Mass production of sample that is demanded for the experimental
procedure is more preferable to be done in one batch. This is to eliminate
the deviation of sample properties found in different batches of production.
ii. The equipment used such as hot plate and magnetic stirrer in every step of
the procedures must be consistent to maintain the uniformity of the
experimental environment.
iii. Beside concentration of sulfuric acid, more parameter studies on the
synthesis of catalyst such as sulfonation time and temperature as well as
carbonisation duration and temperature can be conducted. Other than that,
parameter studies on the interesterification such as methyl acetate to oleic
acid molar ratio, reaction temperature and time can also be performed to
find the optimum operating conditions for higher yield.

74
iv. Each parameter study must be carried out with more set of experimental
runs so that the set values tested do not lie too far from each other.
v. Once the catalysts have been produced, they must be employed in the
characterisation analysis and reaction as soon as possible to avoid
degradation, oxidation or contamination to happen.
vi. Biodiesel product obtained must be analysed quickly to avoid any possible
degradation or contamination.
vii. It is advisable to improve the catalyst specific surface area which has
significant effect on catalytic activity. Different activating agents can be
investigated. Low density biomass can be tested since it offers high
porosity and surface area.
viii. Since the carbonisation process was done in the presence of air, oxidation
of sulfuric acid might occur which rendered to blockage of pore and
reduction in porosity and surface area of the catalyst support. Carbonisation
in inert gas such as nitrogen is advisable to be carried out.
ix. Further literature review on the exact mechanism of interesterification
reaction may find out ways to improve the biodiesel yield.
x. Since oleic acid gave a good biodiesel yield, other low cost feedstocks from
biomass or waste which are rich in oleic acid are proposed to be used in the
interesterification reaction.

75
REFERENCES
Abdullah, S., Hanapi, N., Azid, A., Umar, R., Juahir, H., Khatoon, H. and Endut, A.,
2017. A review of biomass-derived heterogeneous catalyst for a sustainable biodiesel
production. Renewable and Sustainable Energy Reviews, 70, pp.1040-1051.
Adewale, P., Dumont, M. and Ngadi, M., 2015. Enzyme-catalyzed synthesis and
kinetics of ultrasonic-assisted biodiesel production from waste tallow. Ultrasonics
Sonochemistry, 27, pp.1-9.
Aguilar-Garnica, E., Paredes-Casillas, M., Herrera-Larrasilla, T., Rodríguez-
Palomera, F. and Ramírez-Arreola, D., 2013. Analysis of recycled poly (styrene-co-
butadiene) sulfonation: a new approach in solid catalysts for biodiesel
production. SpringerPlus, 2(1), p.475.
Andrade, T., Errico, M. and Christensen, K., 2017. Influence of the reaction conditions
on the enzyme catalyzed transesterification of castor oil: A possible step in biodiesel
production. Bioresource Technology, 243, pp.366-374.
Ang, G., Tan, K. and Lee, K., 2014. Recent development and economic analysis of
glycerol-free processes via supercritical fluid transesterification for biodiesel
production. Renewable and Sustainable Energy Reviews, 31, pp.61-70.
Ashton Acton, Q., 2013. Lanthanoid Series Elements—Advances in Research and
Application: 2013 Edition.
Asikainen, M., Munter, T. and Linnekoski, J., 2015. Conversion of polar and non-polar
algae oil lipids to fatty acid methyl esters with solid acid catalysts – A model
compound study. Bioresource Technology, 191, pp.300-305.
Atabani, A., Silitonga, A., Ong, H., Mahlia, T., Masjuki, H., Badruddin, I. and Fayaz,
H., 2013. Non-edible vegetable oils: a critical evaluation of oil extraction, fatty acid
compositions, biodiesel production, characteristics, engine performance and emissions
production. Renewable and Sustainable Energy Reviews, 18, pp. 211-245.
Atadashi, I., Aroua, M., Abdul Aziz, A. and Sulaiman, N., 2013. The effects of
catalysts in biodiesel production: A review. Journal of Industrial and Engineering
Chemistry, 19(1), pp.14-26.
Ayodele, O. and Dawodu, F., 2014. Production of biodiesel from Calophyllum
inophyllum oil using a cellulose-derived catalyst. Biomass and Bioenergy, 70, pp.239-
248.
Bharathiraja, B., Chakravarthy, M., Kumar, R., Yuvaraj, D., Jayamuthunagai, J.,
Kumar, R. and Palani, S., 2014. Biodiesel production using chemical and biological
methods – A review of process, catalyst, acyl acceptor, source and process
variables. Renewable and Sustainable Energy Reviews, 38, pp.368-382.

76
Boon-anuwat, N., Kiatkittipong, W., Aiouache, F. and Assabumrungrat, S., 2015.
Process design of continuous biodiesel production by reactive distillation: Comparison
between homogeneous and heterogeneous catalysts. Chemical Engineering and
Processing: Process Intensification, 92, pp.33-44.
Bora, A., Dhawane, S., Anupam, K. and Halder, G., 2018. Biodiesel synthesis from
Mesua ferrea oil using waste shell derived carbon catalyst. Renewable Energy, 121,
pp.195-204.
BP., 2017. BP statistical review of world energy. 66th ed. [pdf] British: BP Plc.
Available at: <https://www.bp.com/content/dam/bp/en/corporate/pdf/energy-
economics/statistical-review-2017/bp-statistical-review-of-world-energy-2017-full-
report.pdf> [Accessed 26 Feb. 2018].
Buasri, A., Rochanakit, K., Wongvitvichot, W., Masa-ard, U. and Loryuenyong, V,
2015. The application of calcium oxide and magnesium oxide from natural dolomitic
rock for biodiesel synthesis. Energy Procedia, 79, pp.562-566.
Calero, J., Luna, D., Sancho, E., Luna, C., Bautista, F., Romero, A., Posadillo, A.,
Berbel, J. and Verdugo-Escamilla, C., 2015. An overview on glycerol-free processes
for the production of renewable liquid biofuels, applicable in diesel
engines. Renewable and Sustainable Energy Reviews, 42, pp.1437-1452.
Casas, A., Ramos, M. and Pérez, Á., 2011a. Kinetics of chemical interesterification of
sunflower oil with methyl acetate for biodiesel and triacetin production. Chemical
Engineering Journal, 171(3), pp.1324-1332.
Casas, A., Ramos, M. and Pérez, Á., 2011b. New trends in biodiesel production:
Chemical interesterification of sunflower oil with methyl acetate. Biomass and
Bioenergy, 35(5), pp.1702-1709.
Casas, A., Ramos, M. and Pérez, Á., 2013. Methanol-enhanced chemical
interesterification of sunflower oil with methyl acetate. Fuel, 106, pp.869-872.
Chakraborty, R., Chatterjee, S., Mukhopadhyay, P. and Barman, S., 2016. Progresses
in waste biomass derived catalyst for production of biodiesel and bioethanol: s
review. Procedia Environmental Sciences, 35, pp. 546-554.
Chellappan, S., Nair, V., V, S. and K, A., 2018a. Experimental validation of biochar
based green Bronsted acid catalysts for simultaneous esterification and
transesterification in biodiesel production. Bioresource Technology Reports, 2, pp.38-
44.
Chellappan, S., Nair, V., V., S. and K., A., 2018b. Synthesis, optimization and
characterization of biochar based catalyst from sawdust for simultaneous esterification
and transesterification. Chinese Journal of Chemical Engineering.
Chen, H. and Cui, Z., 2016. A microwave-sensitive solid acid catalyst prepared from
sweet potato via a simple method. Catalysts, 6(12), p.211.

77
Chen, S., Lao-ubol, S., Mochizuki, T., Abe, Y., Toba, M. and Yoshimura, Y., 2014.
Production of Jatropha biodiesel fuel over sulfonic acid-based solid acids. Bioresource
Technology, 157, pp.346-350.
Chisti, Y., 2013. Constraints to commercialization of algal fuels. Journal of
Biotechnology, 167(3), pp. 201-214.
Coates, J., 2006. Interpretation of Infrared Spectra, A Practical
Approach. Encyclopedia of Analytical Chemistry.
Colombo, K., Ender, L. and Barros, A., 2017. The study of biodiesel production using
CaO as a heterogeneous catalytic reaction. Egyptian Journal of Petroleum, 26(2),
pp.341-349.
Correia, L., Saboya, R., de Sousa Campelo, N., Cecilia, J., Rodríguez-Castellón, E.,
Cavalcante, C. and Vieira, R., 2014. Characterization of calcium oxide catalysts from
natural sources and their application in the transesterification of sunflower
oil. Bioresource Technology, 151, pp.207-213.
Dawodu, F., Ayodele, O., Xin, J., Zhang, S. and Yan, D., 2014. Effective conversion
of non-edible oil with high free fatty acid into biodiesel by sulphonated carbon
catalyst. Applied Energy, 114, pp.819-826.
Domingues, C., Correia, M., Carvalho, R., Henriques, C., Bordado, J. and Dias, A.,
2013. Vanadium phosphate catalysts for biodiesel production from acid industrial by-
products. Journal of Biotechnology, 164(3), pp. 433-440.
Dong, T., Gao, D., Miao, C., Yu, X., Degan, C., Garcia-Pérez, M., Rasco, B., Sablani,
S. and Chen, S., 2015. Two-step microalgal biodiesel production using acidic catalyst
generated from pyrolysis-derived bio-char. Energy Conversion and Management, 105,
pp.1389-1396.
Ee, T., Lim, S., Ling, P., Huei, W. and Chyuan, O., 2017. Synthesis of seaweed based
carbon acid catalyst by thermal decomposition of ammonium sulfate for biodiesel
production. AIP Conference Proceedings, 1828(1).
Efavi, J., Kanbogtah, D., Apalangya, V., Nyankson, E., Tiburu, E., Dodoo-Arhin, D.,
Onwona-Agyeman, B. and Yaya, A., 2018. The effect of NaOH catalyst concentration
and extraction time on the yield and properties of Citrullus vulgaris seed oil as a
potential biodiesel feed stock. South African Journal of Chemical Engineering.
Ehsan, M. and Chowdhury, M., 2015. Production of biodiesel using alkaline based
catalysts from waste cooking oil: a case study. Procedia Engineering, 105, pp.638-
645.
Eliezer, A., Ramón, P., Leonardo, G., Roger, S. and Sebastian, V., 2015.
Emulsification of animal fats and vegetable oils for their use as a diesel engine fuel:
An overview. Renewable and Sustainable Energy Reviews, 47, pp.623-633.
Emrani, J. and Shahbazi, A., 2012. A single bio-based catalyst for bio-fuel and bio-
diesel. Journal of Biotechnology & Biomaterials, 02(01).

78
Endut, A., Abdullah, S., Hanapi, N., Hamid, S., Lananan, F., Kamarudin, M., Umar,
R., Juahir, H. and Khatoon, H., 2017. Optimization of biodiesel production by solid
acid catalyst derived from coconut shell via response surface
methodology. International Biodeterioration & Biodegradation, 124, pp.250-257.
Energy Commission., n.d.. Malaysia Energy Information Hub-statistics, MEIH.
[online] Available at: <http://meih.st.gov.my/statistics> [Accessed 26 Feb. 2018].
Energy Commission, 2016. Malaysia energy statistics handbook 2016. [online]
Available at: <http://meih.st.gov.my/documents/10620/57af5e2a-7695-4618-a111-
4ba0a49ba992> [Accessed 12 Apr. 2018].
Ezebor, F., Khairuddean, M., Abdullah, A. and Boey, P., 2014. Oil palm trunk and
sugarcane bagasse derived solid acid catalysts for rapid esterification of fatty acids and
moisture-assisted transesterification of oils under pseudo-infinite
methanol. Bioresource Technology, 157, pp. 254-262.
Fadoni, M. and Lucarelli, L., n.d.. Temperature programmed desorption, reduction,
oxidation and flow chemisorption for the characterisation of heterogeneous catalysts.
Theoretical aspects, instrumentation and applications. [ebook] Available at:
<https://pdfs.semanticscholar.org/7962/dd7e7b0db6eccf86260794663881712ed1fc.p
df> [Accessed 29 Mar. 2018].
Fernandes, P., Borges, L., Carvalho, C. and Souza, R., 2014. Microwave assisted
biodiesel production from trap grease. Journal of the Brazilian Chemical Society.
Ghoreishi, S. and Moein, P., 2013. Biodiesel synthesis from waste vegetable oil via
transesterification reaction in supercritical methanol. The Journal of Supercritical
Fluids, 76, pp.24-31.
Guldhe, A., Singh, P., Ansari, F., Singh, B. and Bux, F., 2017. Biodiesel synthesis
from microalgal lipids using tungstated zirconia as a heterogeneous acid catalyst and
its comparison with homogeneous acid and enzyme catalysts. Fuel, 187, pp.180-188.
Hu, Z., Chen, F., Xu, J., Nian, Q., Lin, D., Chen, C., Zhu, X., Chen, Y. and Zhang, M.,
2018. 3D printing graphene-aluminum nanocomposites. Journal of Alloys and
Compounds, 746, pp.269-276.
Johari, A., Nyakuma, B., Mohd Nor, S., Mat, R., Hashim, H., Ahmad, A., Yamani
Zakaria, Z. and Tuan Abdullah, T., 2015. The challenges and prospects of palm oil
based biodiesel in Malaysia. Energy, 81, pp. 255-261.
Kang, S., Ye, J. and Chang, J., 2013. Recent advances in carbon-based sulfonated
catalyst: preparation and application. International Review of Chemical Engineering,
5(2), pp.133-144.
Kanicky, J. and Shah, D., 2002. Effect of Degree, Type, and Position of Unsaturation
on the pKa of Long-Chain Fatty Acids. Journal of Colloid and Interface Science,
256(1), pp.201-207.

79
Kim, B., Im, H. and Lee, J., 2015. In situ transesterification of highly wet microalgae
using hydrochloric acid. Bioresource Technology, 185, pp.421-425.
Kirubakaran, M. and Arul Mozhi Selvan, V., 2018. A comprehensive review of low
cost biodiesel production from waste chicken fat. Renewable and Sustainable Energy
Reviews, 82, pp.390-401.
Konwar, L., Boro, J. and Deka, D., 2014. Review on latest developments in biodiesel
production using carbon-based catalysts. Renewable and Sustainable Energy Reviews,
29, pp. 546-564.
Konwar, L., Das, R., Thakur, A., Salminen, E., Mäki-Arvela, P., Kumar, N., Mikkola,
J. and Deka, D., 2014. Biodiesel production from acid oils using sulfonated carbon
catalyst derived from oil-cake waste. Journal of Molecular Catalysis A: Chemical,
388-389, pp.167-176.
Korkut, I. and Bayramoglu, M., 2018. Selection of catalyst and reaction conditions for
ultrasound assisted biodiesel production from canola oil. Renewable Energy, 116,
pp.543-551.
Ladenberger, A., Demetriades, A., Reimann, C., Birke, M., Sadeghi, M., Uhlbäck, J.,
Andersson, M. and Jonsson, E., 2015. GEMAS: Indium in agricultural and grazing
land soil of Europe — Its source and geochemical distribution patterns. Journal of
Geochemical Exploration, 154, pp.61-80.
Lee, J., Jung, J., Oh, J., Sik Ok, Y. and Kwon, E., 2017. Establishing a green platform
for biodiesel synthesis via strategic utilization of biochar and dimethyl
carbonate. Bioresource Technology, 241, pp.1178-1181.
Leggieri, P., Senra, M. and Soh, L., 2018. Cloud point and crystallization in fatty acid
ethyl ester biodiesel mixtures with and without additives. Fuel, 222, pp.243-249.
Li, M., Zheng, Y., Chen, Y. and Zhu, X., 2014. Biodiesel production from waste
cooking oil using a heterogeneous catalyst from pyrolyzed rice husk. Bioresource
Technology, 154, pp.345-348.
Liu, T., Li, Z., Li, W., Shi, C. and Wang, Y., 2013. Preparation and characterization
of biomass carbon-based solid acid catalyst for the esterification of oleic acid with
methanol. Bioresource Technology, 133, pp.618-621.
Maddikeri, G., Pandit, A. and Gogate, P., 2013. Ultrasound assisted interesterification
of waste cooking oil and methyl acetate for biodiesel and triacetin production. Fuel
Processing Technology, 116, pp.241-249.
Mao, D., Zhang, X., Zhang, X., Jia, M. and Yao, J., 2018. Glucose-derived solid acids
and their stability enhancement for upgrading biodiesel via esterification. Chinese
Journal of Chemical Engineering.
Mardhiah, H., Ong, H., Masjuki, H., Lim, S. and Pang, Y., 2017. Investigation of
carbon-based solid acid catalyst from Jatropha curcas biomass in biodiesel
production. Energy Conversion and Management, 144, pp.10-17.

80
Marx, S., 2016. Glycerol-free biodiesel production through transesterification: a
review. Fuel Processing Technology, 151, pp.139-147.
Meher, L., Churamani, C., Arif, M., Ahmed, Z. and Naik, S., 2013. Jatropha curcas as
a renewable source for bio-fuels—A review. Renewable and Sustainable Energy
Reviews, 26, pp.397-407.
Meng, Y., Wang, B., Li, S., Tian, S. and Zhang, M., 2013. Effect of calcination
temperature on the activity of solid Ca/Al composite oxide-based alkaline catalyst for
biodiesel production. Bioresource Technology, 128, pp.305-309.
Micic, R., Tomić, M., Kiss, F., Martinovic, F., Simikić, M. and Molnar, T., 2016.
Comparative analysis of single-step and two-step biodiesel production using
supercritical methanol on laboratory-scale. Energy Conversion and Management, 124,
pp.377-388.
Mohamed, S., Md., M. and Mazlan, A., 2016. Power generation sources in Malaysia:
status and prospects for sustainable development. Journal of Advanced Review on
Scientific Research, 25(1), pp.11-28.
Mondal, S., 2011. Thermo-regulating textiles with phase-change materials. Functional
Textiles for Improved Performance, Protection and Health, pp.163-183.
Negm, N., Sayed, G., Habib, O., Yehia, F. and Mohamed, E., 2017. Heterogeneous
catalytic transformation of vegetable oils into biodiesel in one-step reaction using
super acidic sulfonated modified mica catalyst. Journal of Molecular Liquids, 237,
pp.38-45.
Ngaosuwan, K., Goodwin, J. and Prasertdham, P., 2016. A green sulfonated carbon-
based catalyst derived from coffee residue for esterification. Renewable Energy, 86,
pp.262-269.
Niu, S., Ning, Y., Lu, C., Han, K., Yu, H. and Zhou, Y., 2018. Esterification of oleic
acid to produce biodiesel catalyzed by sulfonated activated carbon from
bamboo. Energy Conversion and Management, 163, pp.59-65.
Nomanbhay, S. and Ong, M., 2017. A review of microwave-assisted reactions for
biodiesel production. Bioengineering, 4(2), p.57.
Nordblad, M., Silva, V., Nielsen, P. and Woodley, J., 2014. Identification of critical
parameters in liquid enzyme-catalyzed biodiesel production. Biotechnology and
Bioengineering, 111(12), pp.2446-2453.
Oh, T., Hasanuzzaman, M., Selvaraj, J., Teo, S. and Chua, S., 2018. Energy policy and
alternative energy in Malaysia: issues and challenges for sustainable growth – an
update. Renewable and Sustainable Energy Reviews, 81, pp. 3021-3031.
Onukwuli, D., Emembolu, L., Ude, C., Aliozo, S. and Menkiti, M., 2017. Optimization
of biodiesel production from refined cotton seed oil and its characterization. Egyptian
Journal of Petroleum, 26(1), pp.103-110.

81
Ortiz-Martínez, V., Salar-García, M., Palacios-Nereo, F., Olivares-Carrillo, P.,
Quesada-Medina, J., Ríos, A. and Hernández-Fernández, F., 2016. In-depth study of
the transesterification reaction of Pongamia pinnata oil for biodiesel production using
catalyst-free supercritical methanol process. The Journal of Supercritical Fluids, 113,
pp.23-30.
Ouda, O., Raza, S., Nizami, A., Rehan, M., Al-Waked, R. and Korres, N., 2016. Waste
to energy potential: a case study of Saudi Arabia. Renewable and Sustainable Energy
Reviews, 61, pp. 328-340.
Palma, C., Contreras, E., Urra, J. and Martínez, M., 2010. Eco-friendly technologies
based on banana peel use for the decolourization of the dyeing process
wastewater. Waste and Biomass Valorization, 2(1), pp.77-86.
Pereira, C., Portilho, M., Henriques, C. and Zotin, F., 2014. SnSO4 as catalyst for
simultaneous transesterification and esterification of acid soybean oil. Journal of the
Brazilian Chemical Society, 25(12), pp.2409-2416.
Pourzolfaghar, H., Abnisa, F., Daud, W. and Aroua, M., 2016. A review of the
enzymatic hydroesterification process for biodiesel production. Renewable and
Sustainable Energy Reviews, 61, pp.245-257.
Prachpreecha, O., Pipatpanyanugoon, K. and Sawangwong, P., 2016. A study of
characterizations and efficiency of activated carbon prepared from peel and bunch of
banana for methyl orange dye adsorption. IOSR Journal of Environmental Science,
Toxicology and Food Technology (IOSR-JESTFT), 10(4), pp.17-26.
Rajalingam, A., Jani, S., Senthil Kumar, A. and Adam Khan, M., 2016. Production
methods of biodiesel. Journal of Chemical and Pharmaceutical Research, 8(3),
pp.170-173.
Sakdasri, W., Sawangkeaw, R. and Ngamprasertsith, S., 2015. Continuous production
of biofuel from refined and used palm olein oil with supercritical methanol at a low
molar ratio. Energy Conversion and Management, 103, pp.934-942.
Sakdasri, W., Sawangkeaw, R. and Ngamprasertsith, S., 2018. Techno-economic
analysis of biodiesel production from palm oil with supercritical methanol at a low
molar ratio. Energy.
Salar-García, M., Ortiz-Martínez, V., Olivares-Carrillo, P., Quesada-Medina, J., de los
Ríos, A. and Hernández-Fernández, F., 2016. Analysis of optimal conditions for
biodiesel production from Jatropha oil in supercritical methanol: Quantification of
thermal decomposition degree and analysis of FAMEs. The Journal of Supercritical
Fluids, 112, pp.1-6.
Samniang, A., Tipachan, C. and Kajorncheappun-ngam, S., 2014. Comparison of
biodiesel production from crude Jatropha oil and Krating oil by supercritical methanol
transesterification. Renewable Energy, 68, pp.351-355.

82
Sánchez, B., Mendow, G., Levrand, P. and Querini, C., 2013. Optimization of
biodiesel production process using sunflower oil and tetramethyl ammonium
hydroxide as catalyst. Fuel, 113, pp.323-330.
Sandouqa, A., Al-Hamamre, Z. and Asfar, J., 2018. Preparation and performance
investigation of a lignin-based solid acid catalyst manufactured from olive cake for
biodiesel production. Renewable Energy, 132, pp.667-682.
Santos Ribeiro, J., Celante, D., Simões, S., Bassaco, M., Silva, C. and Castilhos, F.,
2017. Efficiency of heterogeneous catalysts in interesterification reaction from macaw
oil (Acrocomia aculeata) and methyl acetate. Fuel, 200, pp.499-505.
Shuit, S., Ng, E. and Tan, S., 2015. A facile and acid-free approach towards the
preparation of sulphonated multi-walled carbon nanotubes as a strong protonic acid
catalyst for biodiesel production. Journal of the Taiwan Institute of Chemical
Engineers, 52, pp.100-108.
Shuit, S. and Tan, S., 2014. Feasibility study of various sulphonation methods for
transforming carbon nanotubes into catalysts for the esterification of palm fatty acid
distillate. Energy Conversion and Management, 88, pp.1283-1289.
Su, F., Peng, C., Li, G., Xu, L. and Yan, Y., 2016. Biodiesel production from woody
oil catalyzed by Candida rugosa lipase in ionic liquid. Renewable Energy, 90, pp.329-
335.
Sustere, Z., Murnieks, R. and Kampars, V., 2016. Chemical interesterification of
rapeseed oil with methyl, ethyl, propyl and isopropyl acetates and fuel properties of
obtained mixtures. Fuel Processing Technology, 149, pp.320-325.
Talha, N. and Sulaiman, S., 2016. Overview of catalysts in Biodiesel
Production. ARPN Journal of Engineering and Applied Sciences, 11(1), pp.439-448.
Tamborini, L., Militello, M., Balach, J., Moyano, J., Barbero, C. and Acevedo, D.,
2015. Application of sulfonated nanoporous carbons as acid catalysts for Fischer
esterification reactions. Arabian Journal of Chemistry.
Tang, Z., Lim, S., Pang, Y., Wong, K. and Ong, H., 2017. Synthesis of seaweed based
carbon acid catalyst by thermal decomposition of ammonium sulfate for biodiesel
production.
The United States Pharmacopeial Convention, 2016. Stearic acid. Stage 6
Harmonization. [online] Available at:
<https://www.uspnf.com/sites/default/files/usp_pdf/EN/USPNF/usp-nf-
notices/m78200.pdf> [Accessed 22 Aug. 2018].
Thushari, I. and Babel, S., 2018. Sustainable utilization of waste palm oil and
sulfonated carbon catalyst derived from coconut meal residue for biodiesel
production. Bioresource Technology, 248, pp.199-203.
Tian, Y., Xiang, J., Verni, C. and Soh, L., 2018. Fatty acid methyl ester production via
ferric sulfate catalyzed interesterification. Biomass and Bioenergy, 115, pp.82-87.

83
Tiwari, A., Rajesh, V. and Yadav, S., 2018. Biodiesel production in micro-reactors: A
review. Energy for Sustainable Development, 43, pp.143-161.
Touhami, D., Zhu, Z., Balan, W., Janaun, J., Haywood, S. and Zein, S., 2017.
Characterization of rice husk-based catalyst prepared via conventional and microwave
carbonisation. Journal of Environmental Chemical Engineering, 5(3), pp.2388-2394.
United Nations, 2017. World population 2017. [pdf] Available at:
<https://esa.un.org/unpd/wpp/Publications/Files/WPP2017_Wallchart.pdf>
[Accessed 25 Feb. 2018].
U.S. Energy Information Administration, 2017. International energy outlook 2017.
[pdf] Available at: <https://www.eia.gov/outlooks/ieo/pdf/0484(2017).pdf>
[Accessed 26 Feb. 2018].
Viena, V., Elvitriana and Wardani, S., 2018. Application of banana peels waste as
adsorbents for the removal of CO2, NO, NOx, and SO2 gases from motorcycle
emissions. IOP Conference Series: Materials Science and Engineering, 334, p.012037.
Wu, H., Liu, Y., Zhang, J. and Li, G., 2014. In situ reactive extraction of cottonseeds
with methyl acetate for biodiesel production using magnetic solid acid
catalysts. Bioresource Technology, 174, pp.182-189.
Wu, L., Kobayashi, T., Li, Y., Xu, K. and Lv, Y., 2017. Determination and abatement
of methanogenic inhibition from oleic and palmitic acids. International
Biodeterioration & Biodegradation, 123, pp.10-16.
Yu, H., Niu, S., Lu, C., Li, J. and Yang, Y., 2017. Sulfonated coal-based solid acid
catalyst synthesis and esterification intensification under ultrasound irradiation. Fuel,
208, pp.101-110.
Zhang, M., Sun, A., Meng, Y., Wang, L., Jiang, H. and Li, G., 2014. Catalytic
performance of biomass carbon-based solid acid catalyst for esterification of free fatty
acids in waste cooking oil. Catalysis Surveys from Asia, 19(2), pp.61-67.
Zhao, C., Lv, P., Yang, L., Xing, S., Luo, W. and Wang, Z., 2018. Biodiesel synthesis
over biochar-based catalyst from biomass waste pomelo peel. Energy Conversion and
Management, 160, pp.477-485.
Zhao, S., Li, P., Adkins, J., Zhu, L., Du, F., Zhou, Q. and Zheng, J., 2018. Carboxyl
grafted sulfur-expanded graphite composites as cathodes for lithium-sulfur
batteries. Journal of Electroanalytical Chemistry, 823, pp.422-428.

84
APPENDICES
APPENDIX A: Experimental Progress
Figure A-1: Waste Banana Peels Before Drying
Figure A-2: Waste Banana Peels After Drying
Figure A-3: Powder of Dried Waste Banana Peels

85
Figure A-4: Chemical Activation of Waste Banana Peels Powder
Figure A-5: Chemically Activated Banana Peels
Figure A-6: Carbonisation of Chemically Activated Banana Peels

86
Figure A-7: Size Reduction of WBPAC Using Mortar and Pestle
Figure A-8: Sieving of WBPAC under 300 Micron
Figure A-9: Apparatus Set Up of Sulfonation and Interesterification Reactions

87
Figure A-10: Synthesised Catalysts
Figure A-11: Biodiesel Product

88
APPENDIX B: EDX Reports
Element Wt% At%
CK 42.95 59.37
OK 35.46 36.80
SiK 00.67 00.39
PK 00.62 00.33
SK 00.44 00.23
InL 19.86 02.87
Matrix Correction ZAF
Element Wt% At%
CK 36.73 57.58
OK 30.27 35.62
SiK 01.23 00.82
PK 01.13 00.69
SK 00.65 00.38
InL 30.00 04.92
Matrix Correction ZAF
Element Wt% At%
CK 37.15 53.93
OK 38.50 41.97
SiK 00.41 00.26
PK 00.33 00.18
SK 00.19 00.10
InL 23.43 03.56
Matrix Correction ZAF
Element Wt% At%
CK 41.64 58.19
OK 35.51 37.26
SiK 01.69 01.01
PK 00.67 00.36
SK 00.49 00.26
InL 20.00 02.92
Matrix Correction ZAF
Figure B-1: EDX Analysis at Different Locations of Biomass Waste Banana Peels

89
Element Wt% At%
CK 57.46 65.51
OK 38.58 33.02
SiK 00.48 00.23
PK 01.86 00.82
SK 00.72 00.31
InL 00.89 00.11
Matrix Correction ZAF
Element Wt% At%
CK 59.96 67.57
OK 37.14 31.42
SiK 00.41 00.20
PK 01.24 00.54
SK 00.40 00.17
InL 00.85 00.10
Matrix Correction ZAF
Element Wt% At%
CK 60.96 68.75
OK 34.87 29.52
SiK 00.85 00.41
PK 02.52 01.10
SK 00.39 00.16
InL 00.40 00.05
Matrix Correction ZAF
Element Wt% At%
CK 61.23 69.58
OK 32.86 28.03
SiK 00.86 00.42
PK 03.42 01.51
SK 00.88 00.38
InL 00.75 00.09
Matrix Correction ZAF
Figure B-2: EDX Analysis at Different Locations of Chemically Activated Banana
Peels

90
Element Wt% At%
CK 77.16 84.55
OK 15.30 12.59
SiK 01.22 00.57
PK 05.06 02.15
SK 00.00 00.00
InL 01.26 00.14
Matrix Correction ZAF
Element Wt% At%
CK 76.40 84.73
OK 13.87 11.55
SiK 02.46 01.17
PK 05.10 02.19
SK 00.37 00.15
InL 01.79 00.21
Matrix Correction ZAF
Element Wt% At%
CK 75.19 82.90
OK 17.12 14.17
SiK 00.46 00.22
PK 06.01 02.57
SK 00.00 00.00
InL 01.21 00.14
Matrix Correction ZAF
Element Wt% At%
CK 66.29 76.51
OK 20.03 17.35
SiK 06.93 03.42
PK 05.37 02.41
SK 00.49 00.21
InL 00.89 00.11
Matrix Correction ZAF
Figure B-3: EDX Analysis at Different Locations of WBPAC

91
Element Wt% At%
CK 82.26 88.24
OK 10.92 08.79
SiK 03.69 01.69
PK 01.70 00.71
SK 01.42 00.57
InL 00.00 00.00
Matrix Correction ZAF
Element Wt% At%
CK 82.12 89.10
OK 08.88 07.23
SiK 02.55 01.18
PK 04.10 01.72
SK 01.69 00.69
InL 00.65 00.07
Matrix Correction ZAF
Element Wt% At%
CK 79.79 85.81
OK 15.26 12.32
SiK 01.38 00.63
PK 01.47 00.61
SK 01.34 00.54
InL 00.76 00.09
Matrix Correction ZAF
Element Wt% At%
CK 83.99 89.05
OK 11.38 09.06
SiK 00.32 00.14
PK 02.52 01.04
SK 01.79 00.71
InL 00.00 00.00
Matrix Correction ZAF
Figure B-4: EDX Analysis at Different Locations of Cat-2

92
Element Wt% At%
CK 79.90 85.51
OK 15.79 12.69
SiK 00.86 00.40
PK 02.01 00.83
SK 01.43 00.57
InL 00.00 00.00
Matrix Correction ZAF
Element Wt% At%
CK 75.02 83.62
OK 14.01 11.72
SiK 05.58 02.66
PK 02.76 01.19
SK 01.64 00.68
InL 00.99 00.12
Matrix Correction ZAF
Element Wt% At%
CK 81.64 87.89
OK 11.11 08.98
SiK 03.03 01.40
PK 01.99 00.83
SK 02.23 00.90
InL 00.00 00.00
Matrix Correction ZAF
Element Wt% At%
CK 80.80 87.54
OK 11.44 09.31
SiK 02.38 01.10
PK 02.43 01.02
SK 02.37 00.96
InL 00.59 00.07
Matrix Correction ZAF
Figure B-5: EDX Analysis at Different Locations of Cat-3

93
Element Wt% At%
CK 75.73 83.67
OK 15.16 12.57
SiK 01.91 00.90
PK 03.45 01.48
SK 03.16 01.31
InL 00.59 00.07
Matrix Correction ZAF
Element Wt% At%
CK 80.32 87.21
OK 12.05 09.82
SiK 01.78 00.83
PK 02.10 00.88
SK 02.83 01.15
InL 00.92 00.10
Matrix Correction ZAF
Element Wt% At%
CK 75.65 84.17
OK 14.09 11.77
SiK 01.24 00.59
PK 04.84 02.09
SK 02.98 01.24
InL 01.20 00.14
Matrix Correction ZAF
Element Wt% At%
CK 77.11 84.81
OK 13.99 11.55
SiK 02.18 01.03
PK 02.60 01.11
SK 03.46 01.42
InL 00.66 00.08
Matrix Correction ZAF
Figure B-6: EDX Analysis at Different Locations of Cat-8

94
Element Wt% At%
CK 72.38 79.89
OK 21.19 17.55
SiK 01.43 00.67
PK 01.16 00.50
SK 03.17 01.31
InL 00.67 00.08
Matrix Correction ZAF
Element Wt% At%
CK 72.38 79.89
OK 21.19 17.55
SiK 01.43 00.67
PK 01.16 00.50
SK 03.17 01.31
InL 00.67 00.08
Matrix Correction ZAF
Element Wt% At%
CK 72.38 79.89
OK 21.19 17.55
SiK 01.43 00.67
PK 01.16 00.50
SK 03.17 01.31
InL 00.67 00.08
Matrix Correction ZAF
Element Wt% At%
CK 76.75 84.85
OK 14.19 11.78
SiK 01.45 00.69
PK 02.02 00.87
SK 03.92 01.62
InL 01.66 00.19
Matrix Correction ZAF
Figure B-7: EDX Analysis at Different Locations of Cat-13

95
APPENDIX C: FTIR Reports
Figure C-1: FTIR Spectrum of WBPAC

96
Figure C-2: FTIR Spectrum of Cat-2

97
Figure C-3: FTIR Spectrum of Cat-3

98
Figure C-4: FTIR Spectrum of Cat-8

99
Figure C-5: FTIR Spectrum of Cat-13

100
APPENDIX D: GC Reports
Figure D-1: Peak Report and Chromatogram of Cat-2

101
Figure D-2: Peak Report and Chromatogram of Cat-3

102
Figure D-3: Peak Report and Chromatogram of Cat-8

103
Figure D-4: Peak Report and Chromatogram of Cat-13

104
Figure D-5: Peak Report and Chromatogram of Biodiesel Product from
Interesterification Using Solid Catalyst Synthesised with Concentrated Sulfuric Acid

105
Figure D-6: Peak Report and Chromatogram of Biodiesel Product from
Transesterification Using Cat-13

106
Figure D-7: Peak Report and Chromatogram of Biodiesel Product from
Interesterification of Oleic Acid Catalysed by Concentrated Sulfuric Acid

107
Figure D-8: Peak Report and Chromatogram of Biodiesel Product from
Interesterification of Palmitic Acid Catalysed by Concentrated Sulfuric Acid

108
Figure D-9: Peak Report and Chromatogram of Biodiesel Product from
Interesterification of Stearic Acid Catalysed by Concentrated Sulfuric Acid

109
Figure D-10: Peak Report and Chromatogram of Biodiesel Product from
Interesterification of Cooking Oil Catalysed by Concentrated Sulfuric Acid

110
APPENDIX E: Sample Calculations
Biodiesel Yield
Taking data of Cat-13 from Figure D-4,
𝑀𝑒𝑡ℎ𝑦𝑙 𝑜𝑙𝑒𝑎𝑡𝑒 𝑝𝑒𝑎𝑘 𝑎𝑟𝑒𝑎 = 9302.15
𝐼𝑛𝑡𝑒𝑟𝑛𝑎𝑙 𝑠𝑡𝑎𝑛𝑑𝑎𝑟𝑑 𝑝𝑒𝑎𝑘 𝑎𝑟𝑒𝑎 = 1990.54
𝑀𝑒𝑡ℎ𝑦𝑙 𝑜𝑙𝑒𝑎𝑡𝑒 𝑝𝑒𝑎𝑘 𝑎𝑟𝑒𝑎
𝐼𝑛𝑡𝑒𝑟𝑛𝑎𝑙 𝑠𝑡𝑎𝑛𝑑𝑎𝑟𝑑 𝑝𝑒𝑎𝑘 𝑎𝑟𝑒𝑎 =
9302.15
1990.54= 4.673179
From the line equation of calibration curve,
𝑀𝑒𝑡ℎ𝑦𝑙 𝑜𝑙𝑒𝑎𝑡𝑒 𝑝𝑒𝑎𝑘 𝑎𝑟𝑒𝑎
𝐼𝑛𝑡𝑒𝑟𝑛𝑎𝑙 𝑠𝑡𝑎𝑛𝑑𝑎𝑟𝑑 𝑝𝑒𝑎𝑘 𝑎𝑟𝑒𝑎
= 0.2472 × 𝐶𝑜𝑛𝑐𝑒𝑛𝑡𝑟𝑎𝑡𝑖𝑜𝑛 𝑜𝑓 𝑚𝑒𝑡ℎ𝑦𝑙 𝑜𝑙𝑒𝑎𝑡𝑒 (𝑔
𝐿)
4.673179 = 0.2472 × 𝐶𝑜𝑛𝑐𝑒𝑛𝑡𝑟𝑎𝑡𝑖𝑜𝑛 𝑜𝑓 𝑚𝑒𝑡ℎ𝑦𝑙 𝑜𝑙𝑒𝑎𝑡𝑒 (𝑔
𝐿)
𝐶𝑜𝑛𝑐𝑒𝑛𝑡𝑟𝑎𝑡𝑖𝑜𝑛 𝑜𝑓 𝑚𝑒𝑡ℎ𝑦𝑙 𝑜𝑙𝑒𝑎𝑡𝑒 = 18.904446𝑔
𝐿
𝑌𝑖𝑒𝑙𝑑(%) =
𝐶𝑜𝑛𝑐𝑒𝑛𝑡𝑟𝑎𝑡𝑖𝑜𝑛 𝑜𝑓 𝑚𝑒𝑡ℎ𝑦𝑙 𝑜𝑙𝑒𝑎𝑡𝑒 (𝑔
𝐿)
𝐷𝑖𝑙𝑢𝑡𝑖𝑜𝑛 𝑓𝑎𝑐𝑡𝑜𝑟 × 𝑉𝑜𝑙𝑢𝑚𝑒(𝐿)
10 𝑚𝐿 𝑜𝑙𝑒𝑖𝑐 𝑎𝑐𝑖𝑑 × 𝐷𝑒𝑛𝑠𝑖𝑡𝑦 𝑜𝑓 𝑜𝑙𝑒𝑖𝑐 𝑎𝑐𝑖𝑑 (𝑔
𝑚𝐿)
× 100%
=
18.904446 𝑔
𝐿
40× 8.25 𝑚𝐿 ×
1 𝐿
1000 𝑚𝐿
10 𝑚𝐿 × 0.00089𝑔
𝑚𝐿
× 100%
= 43.81 %

111
Acid Value Conversion
Taking data of initial acid value of oleic acid from Table 4.5 and final acid value for
the case of Cat-13 from Table 4.7,
𝐴𝑐𝑖𝑑 𝑉𝑎𝑙𝑢𝑒 𝐶𝑜𝑛𝑣𝑒𝑟𝑠𝑖𝑜𝑛 (%) =𝑎𝑖 − 𝑎𝑓
𝑎𝑖× 100%
=239.59 − 40.40
239.59× 100%
= 83.14 %