synthesis, purification and micronisation of copper
TRANSCRIPT

SYNTHESIS, PURIFICATION AND MICRONISATION
OF
COPPER INDOMETHACIN
USING
DENSE GAS TECHNOLOGY
by
Barry Warwick, M.Sc. (Chem)
A Thesis Submitted to The School of Chemical Engineering and Industrial Chemistry
in Partial Fulfillment of the Requirements for the Degree of Doctor of Philosophy
THE UNIVERSITY OF NEW SOUTH WALES
February 2001

ABSTRACT
II
The primary aim of this work was to provide an alternative method of synthesis of the
non-steroidal anti-inflammatory drug copper indomethacin (Cu-Indo) and to produce
alternative forms of the drug to increase its marketability. Dense gases as anti-solvents
were used to achieve these aims. The study involved the synthesis, purification,
micronisation and co-precipitation of Cu-Indo with polyvinylpyrrolidone (PVP) using
dense carbon dioxide as an anti-solvent.
Initially the volumetric and solubility behaviours of the solvent—anti-solvent systems
were investigated to determine the optimum processing conditions. The solubility of
Cu-Indo in an expanded solution was found to be a complex function of the solvent and
other solutes.
Copper indomethacin was successfully synthesised and purified in a single vessel using
dense carbon dioxide as an anti-solvent. Drug yields of 98 % and purities near 100 %
were achieved at optimum conditions with the advantages of less residual solvent in the
drug, less solvent waste, reduced processing time and increased yields over the
conventional synthesis process.
Copper indomethacin was produced in a variety of morphologies and particle sizes
using dense carbon dioxide as an anti-solvent. An investigation of the effect of process
parameters on the particle characteristics showed that solute concentration was the
dominant variable. Spherical particles with diameters less than 8 µm were obtained at
optimum conditions. The immediate benefit of micronising Cu-Indo was demonstrated
with an eight fold increase in dissolution rate when compared to the conventionally
produced drug.
Polyvinylpyrrolidone was successfully co-precipitated with Cu-Indo using dense carbon
dioxide as an anti-solvent. The PVP—Cu-Indo co-precipitates were found to increase
the solubility of the drug in ethanol with a 36 fold solubility enhancement at optimum
conditions.

ABSTRACT
III
The use of dense carbon dioxide as anti-solvent in this work demonstrates the potential
of the GAS and ASES processes in the pharmaceutical industry. Copper indomethacin
was synthesised, purified and micronised in a single vessel at a substantial saving in
terms of time and solvent usage. The micronisation of Cu-Indo and the formation of the
PVP—Cu-Indo co-precipitate provided alternative forms of the drug substantially
increasing its marketability.
IV
“The fear of the Lord is the beginning of knowledge,
but fools despise wisdom and discipline.”
Proverbs 1 vs. 7
To Lucille, Sarah and Anna
ACKNOWLEDGEMENTS
V
First and foremost I would like to thank Prof. Neil R. Foster for his guidance,
encouragement and support throughout the course of this work. I am especially grateful
for his ability to see opportunity where others see failure. It has been a most valuable
experience working under his supervision.
Many thanks to Dr. Fariba Dehghani for her advice and encouragement at every stage of
my studies. Her patience and selfless efforts are appreciated. I would especially like to
thank her for the many hours she has spent editing this thesis.
I would like to thank Dr. Ray Biffin and Mr. Hubertus Regtop for making this project
possible. Their generous donation of time and equipment is much appreciated.
I extend my gratitude to my colleagues. To Dr. Emma Coen, Dr. Linda Sze Tu, Dr.
Russell Thiering, Keivan Bezanehtak, Rana Bustami, Kiang Charoenchaitrakool, Gary
Combes and Raffaella Mammucari for stimulating conversation and much comic relief.
I would like to thank Louise Stanton for her efforts in the co-precipitation experiments.
Thank you to Mr. Bong van Dang for all your administrative duties. Your efforts are
appreciated.
Thank you to Dr. Jane E. Weder for providing the background information on Cu-Indo
and for the FTIR and EPR analyses. Your expertise has been most valuable.
Thank you to my mother-in-law Sylvia McNicoll for proof reading I appreciate it very
much.
Lastly I would like to thank my wife, Lucille, for her selfless giving, love,
encouragement and support. None of this work would have been possible without her.

TABLE OF CONTENTS
VI
ABSTRACT................................................................................................................. II
CHAPTER 1 1. BACKGROUND ....................................................................................................1
1.1. Introduction............................................................................................................1
1.2. Copper Indomethacin.............................................................................................4
1.3. References............................................................................................................13
CHAPTER 2
2. DENSE GASES AS ANTI-SOLVENTS — THEORY ...........................17 2.1. Introduction..........................................................................................................17
2.2. Thermodynamic Considerations ..........................................................................19
2.2.1. Pure Anti-Solvent Phase Behaviour.............................................................19
2.2.2. Anti-Solvent—Solvent Phase Behaviour.....................................................23
2.2.3. Anti-Solvent—Solvent—Solute Phase Behaviour.......................................35
2.2.4. Modelling GAS and ASES Phase Behaviour ..............................................40
2.2.4.1. Modelling Anti-Solvent—Solvent Phase Behaviour ...........................40
2.2.4.2. Modelling Anti-Solvent—Solvent—Solute Phase Behaviour .............44
2.3. Crystallisation Theory Considerations ...............................................................48
2.4. Hydrodynamic Considerations ............................................................................56
2.5. Mass Transfer Considerations .............................................................................58
2.6. References............................................................................................................63
CHAPTER 3
3. DENSE GASES AS ANTI-SOLVENTS — APPLICATIONS ............68 3.1. Introduction..........................................................................................................68
3.2. Micronisation/Recrystallisation...........................................................................68
3.2.1. Applications of Micronised Pharmaceuticals ..............................................70
3.2.1.1. Increased Bioavailability......................................................................70

TABLE OF CONTENTS
VII
3.2.1.2. Intravenous Delivery............................................................................71
3.2.1.3. Oral Delivery........................................................................................71
3.2.1.4. Inhalation Delivery ..............................................................................72
3.2.1.5. Ocular Delivery....................................................................................72
3.2.1.6. Nasal Delivery......................................................................................73
3.2.1.7. Drug Delivery to the Central Nervous System ....................................74
3.2.2. Methods of Micronising Pharmaceuticals....................................................74
3.2.3. GAS as a Micronisation/Recrystallisation Technique .................................77
3.2.4. ASES as a Micronisation/Recrystallisation Technique ...............................81
3.3. Co-Precipitation/Encapsulation...........................................................................86
3.3.1. ASES as an Encapsulation Technique .........................................................87
3.4. Purification/Fractional Crystallisation.................................................................89
3.4.1. GAS as a Purification / Fractional Crystallisation Technique ....................90
3.4.2. ASES as a Fractionation Technique.............................................................93
3.5. Experimental Techniques ....................................................................................95
3.5.1. GAS Experimental Techniques ....................................................................95
3.5.2. ASES Experimental Techniques ..................................................................97
3.6. References..........................................................................................................101
CHAPTER 4
4. DENSE GASES AS ANTI-SOLVENTS — PARTICLE
FORMATION MECHANISMS AND THE INFLUENCE OF
PROCESS PARAMETERS ...........................................................................114 4.1. Introduction........................................................................................................114
4.2. GAS – The Influence of Process Parameters.....................................................115
4.3. ASES The Influence of Process Parameters ......................................................117
4.3.1. The Formation of Microspheres.................................................................120
4.3.1.1. One Droplet — One Particle Theory .................................................121
4.3.1.2. One Droplet — Many Particles Theory.............................................121
4.3.1.3. No Droplet Formation, Nucleation and Growth Theory....................122
4.3.2. Fibre Formation..........................................................................................122
4.3.3. The Effect of Solute ...................................................................................123

TABLE OF CONTENTS
VIII
4.3.4. The effect of Anti-Solvent Density (Pressure)...........................................125
4.3.5. The Effect of Temperature.........................................................................132
4.3.6. The Effect of Solution/Anti-Solvent Flow Rate ........................................133
4.3.7. The Effect of Solvent Type........................................................................136
4.3.8. The Effect of Solute Concentration ..........................................................137
4.3.9. The Effect of Nozzle Diameter/Type.........................................................140
4.3.10. Pre-Addition of Anti-Solvent...................................................................144
4.3.11. The Effect of Stirring Rate.......................................................................145
4.4. Effect of Process Parameters on Encapsulation/Co-Precipitation.....................145
4.5. References..........................................................................................................148
CHAPTER 5
5. SOLUBILITY OF SOLUTES IN SOLUTIONS EXPANDED
WITH CO2 ...........................................................................................................155
5.1. Introduction........................................................................................................155
5.2. Experimental......................................................................................................156
5.2.1. Experimental Apparatus and Procedure.....................................................156
5.3. Volumetric Expansion of the CO2—Solvent Systems.......................................160
5.4. Solid Solubility in Expanded Solution ..............................................................165
5.5. Conclusions........................................................................................................177
5.6. References..........................................................................................................179
CHAPTER 6
6. SYNTHESIS AND PURIFICATION OF COPPER
INDOMETHACIN USING THE GAS AND ASES
PROCESSES .......................................................................................................180 6.1. Introduction........................................................................................................180
6.2. Experimental......................................................................................................183
6.2.1. Experimental Apparatus and Procedure.....................................................184
6.3. Synthesis of Cu-Indo by the GAS Process ........................................................187
6.4. Synthesis and Purification of Cu-Indo by the ASES Process ............................192

TABLE OF CONTENTS
IX
6.5. Characterisation of the GAS and ASES Processed Cu-Indo .............................194
6.6. Comparison between CO2 and Ethanol as Antisolvents....................................200
6.7. Conclusion .........................................................................................................201
6.8. References..........................................................................................................203
CHAPTER 7
7. MICRONISATION OF COPPER INDOMETHACIN
USING THE GAS AND ASES PROCESSES .........................................205 7.1. Introduction........................................................................................................205
7.2. Experimental......................................................................................................206
7.2.1. Experimental Apparatus and Procedure.....................................................206
7.3. Micronisation by the GAS Process....................................................................208
7.3.1. The Effect of Expansion Rate and Stirring................................................209
7.3.2. The Effect of Temperature.........................................................................214
7.3.3. The Effect of Solvent .................................................................................214
7.3.4. The Effect of Concentration.......................................................................217
7.3.5. Summary of the effects of GAS Process Variables ...................................219
7.4. Micronisation of Cu-Indo by the ASES Process ...............................................220
7.4.1. The Effect of Concentration.......................................................................222
7.4.2. The Effect of Nozzle Diameter ..................................................................228
7.4.3. The Effect of Antisolvent Density .............................................................230
7.4.4. The Effect of Temperature.........................................................................234
7.4.5. The Effect of Solution Flow Rate ..............................................................238
7.4.6. The Effect of Solvent .................................................................................240
7.4.7. Summary of the effects of ASES Process Variables..................................244
7.5. Particle Size Distribution...................................................................................244
7.6. Dissolution Studies ............................................................................................248
7.7. Conclusions........................................................................................................250
7.8. References..........................................................................................................252

TABLE OF CONTENTS
X
CHAPTER 8
8. CO-PRECIPITATION OF COPPER INDOMETHACIN
AND POLYVINYLPYRROLIDONE BY THE ASES
PROCESS .............................................................................................................256 8.1. Introduction........................................................................................................256
8.1.1. Polyvinylpyrrolidone .................................................................................257
8.2. Experimental......................................................................................................260
8.2.1. Experimental Apparatus and Procedure.....................................................260
8.3. Precipitation of PVP Using Dense CO2 as Anti-Solvent...................................263
8.3.1. The Effect of PVP Concentration ..............................................................265
8.3.2. The Effect of Anti-Solvent Density ...........................................................267
8.3.3. The Effect of Temperature.........................................................................271
8.4. Co-Precipitation of PVP and Cu-Indo by ASES ...............................................271
8.5. Drug Content .....................................................................................................280
8.6. Solubility of the PVP—Cu-Indo Co-Precipitates..............................................281
8.7. Dissolution of the PVP—Cu-Indo Co-Precipitates ...........................................288
8.8. Conclusions........................................................................................................290
8.9. References..........................................................................................................292
APPENDIX I
I. LITERATURE REVIEW OF THE USE OF DENSE GASES
AS ANTI-SOLVENTS .....................................................................................295
I.1. Review of GAS Applications .............................................................................295
I.2. Review of ASES Applications ...........................................................................305
I.3. References ..........................................................................................................317
APPENDIX II
II. VOLUMETRIC EXPANSION EXPERIMENTAL
RESULTS — BINARY DATA .....................................................................329
II.1. CO2—DMF.......................................................................................................329

TABLE OF CONTENTS
XI
II.2. CO2—NMP.......................................................................................................331
II.3. CO2—DMSO....................................................................................................332
APPENDIX III
III. VOLUMETRIC EXPANSION EXPERIMENTAL
RESULTS — TERNARY DATA .................................................................333 III.1. CO2—DMF—Cu-Indo....................................................................................333
III.2. CO2—DMF—Cu-Acetate................................................................................335
III.3. CO2—DMF—Indomethacin............................................................................336
APPENDIX IV
IV. VOLUMETRIC EXPANSION EXPERIMENTAL
RESULTS — QUATERNARY DATA ......................................................337
IV.1. CO2—DMF—Cu-Indo—Cu-Acetate..............................................................337
IV.2. CO2—DMF—Cu-Indo—Indomethacin ..........................................................338
IV.3. CO2—DMF—Cu-Indo—Acetic acid ..............................................................338
APPENDIX V
V. DISSOLUTION EXPERIMENTAL RESULTS ...................................339
V.1. Dissolution of Micronised Cu-Indo..................................................................339
V.2. Dissolution of PVP—Cu-Indo Co-Precipitates ................................................340
APPENDIX VI
VI. SEM IMAGES OF COPPER INDOMETHACIN
PARTICLES PRODUCED BY THE GAS AND ASES
PROCESSES .......................................................................................................341
VI.1. Particles Produced by the GAS Process ..........................................................341
VI.2. Particles Produced by the ASES Process ........................................................347

TABLE OF CONTENTS
XII
APPENDIX VII
VII. PARTICLE SIZE ANALYSES RESULTS .........................................351
APPENDIX VIII
VIII. SEM IMAGES OF PVP AND PVP—Cu-INDO CO-
PRECIPITATES ................................................................................................354
VIII.1. PVP Particles Produced by the ASES Process .............................................354
VIII.2. PVP—Cu-Indo Particles Produced by the ASES Process ............................355
LIST OF PUBLICATIONS ................................................................................358

LIST OF FIGURES
XIII
Figure 1.1 Molecular structure of [Cu2(indomethacin)4(DMF)2].....................................5
Figure 1.2 The inflammation cascade. .............................................................................8
Figure 1.3 COX I and COX II sites of action.................................................................10
Figure 2.1 Phase diagram for a pure substance..............................................................20
Figure 2.2 Reduced density of a pure substance in the vicinity of its critical
point............................................................................................................................22
Figure 2.3 Diffusivity behaviour of CO2........................................................................24
Figure 2.4 Viscosity behaviour of CO2. ........................................................................25
Figure 2.5 Solubility of ethane and ethene in organic solvents......................................27
Figure 2.6 Solubility of CO2 in organic solvents. ..........................................................28
Figure 2.7 Volumetric expansion of ethyl acetate pressurised with CO2.......................30
Figure 2.8 Variation of density of organic solvents upon pressurisation with
CO2. ............................................................................................................................31
Figure 2.9 ∆V vs CO2 mole fraction for various organic solvents. ................................33
Figure 2.10 ∆V* vs CO2 mole fraction for various organic solvents. ............................34
Figure 2.11 Ternary phase diagram for CO2—water—ethanol at constant
temperature and pressure. (a) 35°C, 6.9 MPa, (b) 35°C, 10.2 MPa...........................36
Figure 2.12 Ternary anti-solvent—solvent—solute phase behaviour............................37
Figure 2.13 Ternary phase diagram for CO2—toluene—naphthalene at
temperatures between 315 and 325 K and pressure between 8.2 and 9.8
MPa.............................................................................................................................39
Figure 2.14 The relationship between supersaturation and particle growth...................52

LIST OF FIGURES
XIV
Figure 2.15 Ternary phase diagram showing different polymer precipitation
schemes for the ASES process. ..................................................................................61
Figure 3.1 Diagram of a typical GAS experimental apparatus......................................96
Figure 3.2 Diagram of a typical ASES experimental apparatus.....................................98
Figure 4.1 Common ASES processing conditions in terms of anti-solvent
phase behaviour. .......................................................................................................126
Figure 4.2 Common ASES processing conditions in terms of anti-solvent
density.......................................................................................................................127
Figure 4.3 Ternary phase diagram showing the effect of solvent quality upon
the two phase envelope and the mass transfer pathway for a polystyrene
solution precipitated into compressed CO2...............................................................138
Figure 4.4 Different nozzle designs used in ASES. .....................................................141
Figure 5.1 Experimental apparatus used to determine volumetric expansion
and solute solubility..................................................................................................157
Figure 5.2 Volumetric expansion of DMF—CO2 as a function of pressure at
25, 30 and 40°C. .......................................................................................................161
Figure 5.3 Volumetric expansion of NMP—CO2 and DMSO—CO2 as a
function of pressure..................................................................................................162
Figure 5.4 Comparison between the DMF—CO2, NMP—CO2 and DMSO—
CO2 systems at 25°C.................................................................................................163
Figure 5.5 Volumetric expansion of the DMF—CO2, NMP—CO2 and
DMSO—CO2 systems as a function of CO2 mole fraction. .....................................164
Figure 5.6 Comparison between literature results and this work for the
volumetric expansion of DMF with CO2 at 25°C.....................................................166
Figure 5.7 Mole fraction of Cu-Indo dissolved in the liquid phase..............................167

LIST OF FIGURES
XV
Figure 5.8 Concentration of Cu-Indo in DMF (CO2 free basis)...................................168
Figure 5.9 Solubility of Cu-Acetate in expanded DMF at 25°C..................................170
Figure 5.10 Solubility of indomethacin in expanded DMF at 25°C.............................171
Figure 5.11 Mole fraction of CO2 as a function of pressure at 25°C in the
presence of solute. ....................................................................................................173
Figure 5.12 Volumetric expansion of DMF containing acetic acid at 25°C. ...............175
Figure 5.13 Solubility of Cu-Indo in quaternary systems at 25°C...............................176
Figure 5.14 Solubility of the second solute in the CO2—DMF—Cu-Indo—
Solute systems at 25°C.............................................................................................178
Figure 6.1 Comparison between the conventional, GAS and ASES processes
for the synthesis of Cu-Indo.....................................................................................182
Figure 6.2 GAS experimental apparatus......................................................................185
Figure 6.3 ASES experimental apparatus.....................................................................185
Figure 6.4 SEM image of the Cu-Indo obtained from the conventional
synthesis....................................................................................................................189
Figure 6.5 SEM images of the precipitates collected after GAS processing at
25°C. (a) A 5 mg.g-1 solution of Cu-Indo in DMF expanded slowly without
stirring. (b) A 200 mg.g-1 solution of Cu-Indo in DMF expanded rapidly
with stirring...............................................................................................................190
Figure 6.6 SEM images of Cu-Indo precipitates collected after ASES
processing at 25°C and 6.89 MPa using a solution flow rate of 0.2 mL.min-1
and a 1020 µm nozzle. (a) 20 mg.g-1, (b) 200 mg.g-1 solution of Cu-Indo in
DMF..........................................................................................................................195
Figure 6.7 Comparison between the Infrared spectra of the conventionally
synthesised Cu-Indo and the GAS and ASES processed Cu-Indo. (a)

LIST OF FIGURES
XVI
Conventional Synthesis, (b) GAS Process, 5 mg.g-1 solution, (c) GAS
Process, 200 mg.g-1 solution, (d) ASES Process, 20 mg.g-1 solution.......................197
Figure 6.8 Comparison between the X-band EPR spectra of the conventionally
synthesised Cu-Indo and the GAS and ASES processed Cu-Indo. (a)
Conventional Synthesis, (b) GAS Process, 5 mg.g-1 solution, (c) GAS
Process, 200 mg.g-1 solution, (d) ASES Process, 20 mg.g-1 solution.......................198
Figure 6.9 Comparison between the DSC spectra of the conventionally
synthesised Cu-Indo and the GAS and ASES processed Cu-Indo. (a)
Conventional Synthesis, (b) GAS Process, 5 mg.g-1 solution, (c) GAS
Process, 200 mg.g-1 solution, (d) ASES Process, 20 mg.g-1 solution.......................199
Figure 7.1 SEM images of Cu-Indo particles produced by the GAS process at
25°C from a 5 mg.g-1 solution of Cu-Indo in DMF. (a) slow expansion, (b)
rapid expansion.........................................................................................................211
Figure 7.2 SEM images of Cu-Indo particles produced by the GAS process at
25°C from a stirred 5 mg.g-1 solution of Cu-Indo in DMF. (a) slow
expansion, (b) rapid expansion.................................................................................213
Figure 7.3 SEM images of Cu-Indo particles produced by the GAS process at
40°C from a stirred 5 mg.g-1 solution of Cu-Indo in DMF. (a) slow
expansion, (b) rapid expansion.................................................................................215
Figure 7.4 SEM images of Cu-Indo particles produced by the GAS process at
25°C. (a) A stirred 5 mg.g-1 solution of Cu-Indo in DMSO expanded
rapidly. (b) A stirred 5 mg.g-1 solution of Cu-Indo in DMSO expanded
rapidly.......................................................................................................................216
Figure 7.5 SEM images of Cu-Indo particles produced by the GAS process at
25°C. (a) A stirred 200 mg.g-1 solution of Cu-Indo in DMF expanded
rapidly. (b) A stirred 50 mg.g-1 solution of Cu-Indo in DMF expanded
slowly........................................................................................................................218

LIST OF FIGURES
XVII
Figure 7.6 SEM images of Cu-Indo particles produced by the ASES process at
25°C and 6.89 MPa with a solution flow rate of 0.2 mL.min-1 and a nozzle
diameter of 1020 µm, (a) 5 mg.g-1, (b) 20 mg.g-1,(c) 100 mg.g-1, (d) 200
mg.g-1 solution of Cu-Indo in DMF..........................................................................223
Figure 7.7 SEM images of Cu-Indo particles by the ASES process from 200
mg.g-1 solutions of Cu-Indo in DMF at 25°C and 6.89 MPa with a solution
flow rate of 0.2 mL.min-1 and a nozzle diameter of 1020 µm. .................................224
Figure 7.8 Photographs of DMF solutions sprayed into liquid CO2 at 25°C and
6.89 MPa at a solution flow rate of 0.2 mL.min-1 through a 1020 µm nozzle,
(a) Pure DMF, (b) 5 mg.g-1, (c) 100 mg.g-1, (d) 200 mg.g-1 Cu-Indo solution.........227
Figure 7.9 SEM images of Cu-Indo particles produced by the ASES process at
25°C and 6.89 MPa with a solution flow rate of 0.2 mL.min-1 and a nozzle
diameter of 229 µm. (a) 5 mg.g-1, (b) 20 mg.g-1, (c) 100 mg.g-1, (d) 200
mg.g-1 solution of Cu-Indo in DMF..........................................................................229
Figure 7.10 SEM images of Cu-Indo particles produced by the ASES process
at 25°C with a solution flow rate of 0.2 mL.min-1 and a nozzle diameter of
229 µm. (a) 5 mg.g-1 solution of Cu-Indo in DMF at 13.79 MPa, (b) 20
mg.g-1 solution of Cu-Indo in DMF at 10.34 MPa, (c) 100 mg.g-1 solution of
Cu-Indo in DMF at 13.79 MPa, (d) 200 mg.g-1 solution of Cu-Indo in DMF
at 10.34 MPa.............................................................................................................231
Figure 7.11 SEM images of Cu-Indo particles by the ASES process from 100
mg.g-1 solutions of Cu-Indo in DMF at 25°C and 6.55 MPa with a solution
flow rate of 0.2 mL.min-1 and a nozzle diameter of 229 µm. ...................................233
Figure 7.12 SEM images of Cu-Indo particles produced by the ASES process
at 40°C and 14.48 MPa with a solution flow rate of 0.2 mL.min-1 and a
nozzle diameter of 229 µm. (a) 5 mg.g-1, (b) 20 mg.g-1, (c) 100 mg.g-1
solution of Cu-Indo in DMF.....................................................................................235
LIST OF FIGURES
XVIII
Figure 7.13 X-ray diffraction patterns of Cu-Indo particles produced from the
conventional synthesis process and by the ASES process from 100 mg.g-1
solutions of Cu-Indo in DMF with a solution flow rate of 0.2 mL/min and a
nozzle diameter of 229µm. (a) Conventional synthesis process. (b) 25 °C
and 6.89 MPa. (c) 25 °C and 13.79 MPa. (d) 40 °C and 14.48 MPa........................237
Figure 7.14 SEM images of Cu-Indo particles produced by the ASES process
from 100 mg.g-1 solutions of Cu-Indo in DMF at 25°C and 6.89 MPa using
a nozzle with a diameter of 229 µm. Solution flow rate of (a) 0.1 mL.min-1,
(b) 0.2 mL.min-1, (c) 0.5 mL.min-1. ..........................................................................239
Figure 7.15 SEM images of Cu-Indo particles produced by the ASES process
from DMSO and NMP at a Cu-Indo concentration of 5 mg.g-1 with a
solution flow rate of 0.2 mL.min-1 and a nozzle diameter of 1020 µm. (a)
Cu-Indo in DMSO at 40°C and 14.48 MPa. (b) Cu-Indo in NMP at 25°C
and 6.89 MPa............................................................................................................241
Figure 7.16 SEM images of Cu-Indo particles produced by the ASES process
from 100 mg.g-1 Cu-Indo solutions in NMP at 25°C and 6.89 MPa with a
solution flow rate of 0.2 mL.min-1 and a nozzle diameter of 1020 µm. ...................243
Figure 7.17 Particle size distributions of Cu-Indo particles produced from
DMF solutions by the ASES process. (a) 200 mg.g-1 Cu-Indo solution at
25°C and 10.34 MPa using a 1020 µm nozzle and a solution flow rate of 0.2
mL.min-1, (b) 20 mg.g-1 Cu-Indo solution at 25°C and 6.89 MPa using a 229
µm nozzle and a solution flow rate of 0.2 mL.min-1. ...............................................246
Figure 7.18 Particle size distributions of Cu-Indo particles produced from
DMF solutions at a concentration of 100 mg.g-1 by the ASES process using
a 229 µm nozzle, 0.2 mL.min-1 solution flow rate. (a) 25°C and 6.89 MPa,
(b) 25°C and 13.79 MPa, (c) 40°C and 14.48 MPa..................................................247
Figure 7.19 Dissolution of Cu-Indo produced by ASES. 100 mg.g-1 solution of
Cu-Indo in DMF using a 229 µm nozzle and a solution flow rate of 0.2
mL.min-1. ..................................................................................................................249

LIST OF FIGURES
XIX
Figure 8.1 Types of polymer—drug composites..........................................................257
Figure 8.2 Polyvinylpyrrolidone chemical structure....................................................257
Figure 8.3 SEM image of PVP. ....................................................................................264
Figure 8.4 SEM images of PVP particles produced from DMF by the ASES
process at 25°C and 14.0 MPa using solution flow rate of 0.1 mL.min-1
through a 229 µm nozzle. (a) 50 mg.g-1, (b) 100 mg.g-1 solution of PVP in
DMF..........................................................................................................................266
Figure 8.5 SEM images of PVP particles produced from DMF solutions of
PVP at a concentration of 50 mg.g-1 by the ASES process at 25°C and 7.0
MPa using solution flow rate of 0.1 mL.min-1 through a 229 µm nozzle. ...............268
Figure 8.6 SEM images of PVP particles produced from DMF solutions of
PVP at a concentration of 100 mg.g-1 by the ASES process at 25°C and 6.6
MPa using solution flow rate of 0.1 mL.min-1 through a 229 µm nozzle. ...............270
Figure 8.7 SEM images of PVP particles produced by the ASES process from
a 50 mg.g-1 solution of in DMF at 10°C and 5.5 MPa using a solution flow
rate of 0.1 mL.min-1 through a 229 µm nozzle.........................................................272
Figure 8.8 SEM images of the PVP—Cu-Indo particles produced from DMF
solutions with a solute concentration of 100 mg.g-1 by the ASES process at
25°C using a solution flow rate of 0.1 mL.min-1 through a 229 µm nozzle.
PVP to Cu-Indo ratio (a) 10.39 MPa and a 70:30 PVP:Cu-Indo ratio, (b)
14.0 MPa and a 50:50 PVP:Cu-Indo ratio. ...............................................................274
Figure 8.9 SEM images comparing the particles produced from ASES using
100 mg.g-1 solutions of Cu-Indo, PVP and PVP—Cu-Indo in DMF at 25°C
and 14.0 MPa. (a) Cu-Indo, (b) PVP, (c) 50:50 PVP:Cu-Indo ratio.........................275
Figure 8.10 Photograph of the PVP—Cu-Indo precipitate formed from the
ASES process............................................................................................................277

LIST OF FIGURES
XX
Figure 8.11 SEM images of the PVP—Cu-Indo particles produced from DMF
solutions with a solute concentration of 100 mg.g-1 by the ASES process at
25°C and 10.39 MPa using a solution flow rate of 0.1 mL.min-1 through a
229 µm nozzle. PVP to Cu-Indo ratio (a) 70:30, (b) 50:50......................................278
Figure 8.12 Photograph of the precipitation of PVP—Cu-Indo co-precipitate
by ASES. The solution concentration was 100 mg.g-1 in a 90:10 ratio of
PVP:Cu-Indo. The system was at 25°C, 10.39 MPa with a solution flow rate
of 0.1 mL.min-1 through a 229 µm nozzle................................................................279
Figure 8.13 PVP—sulfathiazole complex. ...................................................................283
Figure 8.14 Comparison between the DSC spectra of (a) PVP, (b) Cu-Indo, (c)
50:50 physical mix of PVP and Cu-Indo, (d) 50:50 PVP—Cu-Indo co-
precipitate. ................................................................................................................284
Figure 8.15 Comparison between the X-band EPR spectra of (a) Cu-Indo and
(b) 50:50 PVP—Cu-Indo co-precipitate...................................................................286
Figure 8.16 Proposed PVP—Cu-Indo complex. (a) Proposed dimeric complex,
(b) proposed monomeric complex............................................................................287
Figure 8.17 Dissolution of Cu-Indo..............................................................................289

LIST OF TABLES
XXI
Table 1.1 FDA guidelines for levels of residual solvents in pharmaceuticals.
Permitted Daily Exposure (PDE)..................................................................................3
Table 1.2 Non-steroidal anti-inflammatory drugs. ...........................................................7
Table 2.1 Critical pressures and temperatures of anti-solvents used in GAS and
ASES...........................................................................................................................21
Table 3.1 Conventional methods of micronisation.........................................................75
Table 5.1 Chemicals and reagents. ...............................................................................156
Table 6.1 Chemicals and reagents. ...............................................................................183
Table 6.2 The yield and purity of the Cu-Indo synthesis in DMF expanded
solution at 25°C. (GAS Process). .............................................................................188
Table 6.3 The yield and purity of the Cu-Indo synthesis in DMF expanded
solution at 25°C in the presence of excess reactant. (GAS process)........................192
Table 6.4 The purity of the Cu-Indo synthesis in DMF expanded solution at 25°C.
(ASES Process).........................................................................................................193
Table 6.5 Comparison between CO2 and Ethanol as antisolvents for the Cu-
Indo—DMF system at 25°C.....................................................................................201
Table 6.6 Comparison between GAS and the conventional process in the
synthesis of Cu-Indo at 25°C....................................................................................201
Table 7.1 Chemicals and reagents. ...............................................................................206
Table 7.2 GAS micronisation results............................................................................210
Table 7.3 Experimental conditions and results for the micronisation of Cu-Indo
using the ASES technique. The solution and CO2 flow rates were 0.2 and 4–5
mL.min-1 respectively unless otherwise stated.........................................................221

LIST OF TABLES
XXII
Table 7.4 Particle size distribution results....................................................................245
Table 8.1 K values and molecular weights of PVP. .....................................................258
Table 8.2 Chemicals and reagents. ...............................................................................260
Table 8.3 Typical properties of PVP............................................................................263
Table 8.4 Results of the precipitation of PVP by ASES...............................................265
Table 8.5 Results of the co-precipitation of PVP and Cu-Indo by ASES. ...................273
Table 8.6 Drug content of PVP—Cu-Indo co-precipitates...........................................280
Table 8.7 Solubility of Cu-Indo and PVP—Cu-Indo co-precipitate in ethanol at
25°C..........................................................................................................................281
CHAPTER 1
1
1. BACKGROUND
1.1. Introduction
In many countries demands are being placed on the production process by regulatory
authorities due to environmental and health concerns. In these countries most organic
solvents are banned for use in the food industry, or the tolerances of residual solvent in
the final product are very low.1 In the future these demands will become greater as
worldwide concern for the environment and personal health increases.
A recent book entitled “Green Chemistry”2 highlighted the following facts regarding
environmental concerns and the chemical industry:
i. Despite the technical advances that have been made in the last
century, the manufacture, processing, use, and disposal of many
chemical products has had a negative impact on human health and the
environment.
ii. Public opinion at present is that all chemicals are toxic or hazardous,
and should be treated with suspicion. Public opinion has been
translated into tougher government regulation of the chemical
industry. As an example, in the United States in 1950 less than 20
environmental laws were in place, but by 1995 these laws had
increased to over 120.
iii. The cost of complying with environmental regulations through
remediation activities (i.e. waste treatment, control, and disposal
costs) in the United States is in the range 100 to 150 billion US
dollars per year.
iv. The remediation approach to environmental protection is not
sustainable. These costs should be reclaimed for use in the research
and development of environmentally friendly alternatives.
v. Areas of investigation into environmentally friendly processes should
encompass:

CHAPTER 1
2
a. Finding alternative chemical feedstocks that are less hazardous and
are renewable.
b. Selecting reagents that are less hazardous, produce less waste, are
more selective and have greater efficiency.
c. Finding alternative chemical syntheses that produce less waste.
d. Finding alternative solvents that are less hazardous to the
environment and to human health. Solvents present one of the
greatest hazards in the chemical industry because they are used in
such high volumes.
It is apparent that the survival of the chemical industry is dependent on the discovery of
environmentally friendly alternatives to existing processes. Nowhere is this truer than in
the pharmaceutical industry where product specifications are especially stringent.
The Food and Drug Administration (FDA) guidelines of levels of solvent residues
allowed in pharmaceuticals are given in Table 1.1.3 Solvents are classified as Class 1, 2
or 3 depending on the nature of the solvent in terms of toxicity. Class 1 solvents should
be avoided, Class 2 solvents should be limited and Class 3 solvents are not considered
hazardous to humans at levels normally accepted in pharmaceuticals. The Permitted
Daily Exposure (PDE) is the maximum amount of solvent that is allowed in an
equivalent daily dose of the pharmaceutical.
The FDA guidelines for residual solvents state that all steps should be taken by the
manufacturer of the pharmaceutical to reduce the use and levels of solvents in the final
product. The onus is on the manufacturer to prove that the levels of residual solvent in
the pharmaceutical meet the requirements in Table 1.1. The use of solvents in the
pharmaceutical industry is unavoidable, and the aim becomes to choose the most
acceptable solvent that will give the desired results, and to reduce the residues of this
solvent to acceptable limits. The reduction of solvent residues is non-trivial and can
become a time consuming and expensive part of the chemical process.

CHAPTER 1
3
Table 1.1 FDA guidelines for levels of residual solvents in pharmaceuticals.3
Permitted Daily Exposure (PDE)
Solvent PDE / mg/day Solvent PDE / mg/day
Class 1 Solvents
Benzene 0 1,1-Dichloroethane 0
Carbon Tetrachloride 0 1,1,1-Trichloroethane 0
1,2-Dicloroethane 0
Class 2 Solvents
Acetonitrile 4.1 Hexane 2.9
Chlorobenzene 3.6 Methanol 30
Chloroform 0.6 2-Methoxyethanol 0.5
Cyclohexane 38.8 Methylbutyl ketone 0.5
1,2-Dichloroethane 18.7 Methylcyclohexane 11.8
Dichloromethane 6 N-Methylpyrrolidone 48.4
1,2-Dimethoxyethane 1 Nitromethane 0.5
N,N-Dimethylacetamide 10.9 Pyridine 2
N,N-Dimethylformamide 8.8 Sulfolane 1.6
1,4-Dioxane 3.8 Tetralin 1
2-Ethoxyethanol 1.6 Toluene 8.9
Ethyleneglycol 6.2 1,1,2-Trichloroethane 0.8
Formamide 2.2 Xylene 21.7
Class 3 Solvents
Acetic acid 50 Heptane 50 Acetone 50 Isobutyl acetate 50
Anisole 50 Isopropyl acetate 50
1-Butanol 50 Methyl acetate 50
2-Butanol 50 3-Methyl-1-butanol 50
Butyl acetate 50 Methylethyl ketone 50
tert-Butylmethyl ether 50 Methylisobutyl ketone 50
Cumene 50 2-Methyl-1-propanol 50
Dimethyl sulfoxide 50 Pentane 50
Ethanol 50 1-Pentanol 50
Ethylacetate 50 1-Propanol 50
Ethyl ether 50 2-Propanol 50
Ethyl formate 50 Propyl acetate 50
Formic Acid 50 Tetrahydrofuran 50

CHAPTER 1
4
The trend towards greater environmental and health concerns has resulted in the
development of innovative technologies that may prove to be far superior to the
technology that they replace. Supercritical fluid technology is such a technology that
has advanced rapidly in recent years.
It has long been the goal of supercritical fluid researchers to discover alternative
processing methods that are environmentally friendly as well as commercially feasible.
This has recently been referred to as developing a “Sustainable Technology”.4 It is no
coincidence that as the demand for environmentally friendly alternative processes
increased, so the research effort into supercritical fluid technology increased. The
reason for this is mainly due to the use of carbon dioxide. Carbon dioxide, is able to
replace more expensive and toxic substances such as chlorofluorocarbons and carbon
tetrachloride at near or supercritical conditions.5 When carbon dioxide, which is
environmentally benign, is used as the solvent, the issues of solvent residue and solvent
waste are eliminated.
1.2. Copper Indomethacin
Copper indomethacin is a novel non-steroidal, anti-inflammatory drug (NSAID) that has
been developed and manufactured by Biochemical Veterinary Research (BVR).6-8 A
representation of the drug [Cu2(indomethacin)4L2] [Cu-Indo; indomethacin = 1-4-
(chlorobenzoyl)-5-methoxy-2-methyl-1H-indole-3-acetic acid, L = N,N-
dimethylformamide (DMF)] is shown in Figure 1.1.
The structure of Cu-Indo has been determined previously.9,10 The molecule consists of
two Cu atoms linked by four indomethacin molecules. A DMF molecule is bound to
each Cu atom. If the drug is synthesised in another solvent, that solvent will replace the
DMF.10,11 Prior to the release of Cu-Indo by BVR, there had been no clinical
application of the copper complex despite a number of reports on the preparation of Cu-
Indo complexes in the literature.12-14

CHAPTER 1
5
Cu
Cu
O
O
O O
C
C
C
R
DMF
R
R
R
DMF
CCH3
CH2
O
= R
N
O
C
O
O
O
Figure 1.1 Molecular structure of [Cu2(indomethacin)4(DMF)2].
CHAPTER 1
6
It has been stated that NSAIDs are the most frequently prescribed drugs in the world
with over 100 million prescriptions per annum.15,16 Historically, the use of synthetic
NSAIDs as anti-inflammatory, analgesic and antipyretic agents began in 1899 with the
introduction of aspirin.17 By the end on the nineteenth century a number of other drugs
were discovered that showed behaviour similar to aspirin.17 Of these only derivatives of
acetaminophen are in use today.17 More recently, new generations of aspirin-like drugs
have been introduced which are listed in Table 1.2.
The drugs listed in Table 1.2 are antipyretic, analgesic and anti-inflammatory. The
activities of these drugs are significantly different. However, there is no clear
explanation for the different activities.17 Generally the drugs similar to aspirin possess
side effects, such as gastric or intestinal ulceration.18-23 Despite the side effects, the use
of NSAIDs continues to expand, particularly in the treatment of chronic diseases in the
elderly, in whom the gastrointestinal side effects are the most common and serious.24-27
It has been reported that up to 40% of patients taking NSAIDs suffer from
gastrointestinal side effects.25 Much research has been performed to find compounds
with the same therapeutic effects and lower side effects. The search for safer NSAIDs
has resulted in over 35 NSAIDs being available on the market today.18
The current understanding of inflammation in the body is that it is due to the response
of the body to an antigen such as gamma globulin.28 Once entering the body the antigen
combines with antibodies from the defense system releasing a number of chemical
mediators such as prostaglandins and leukotrines. The release of these mediators results
in heat, redness, swelling and pain.11 The inflammation cascade and the sites of action
of NSAIDs are shown in Figure 1.2.
CHAPTER 1
7
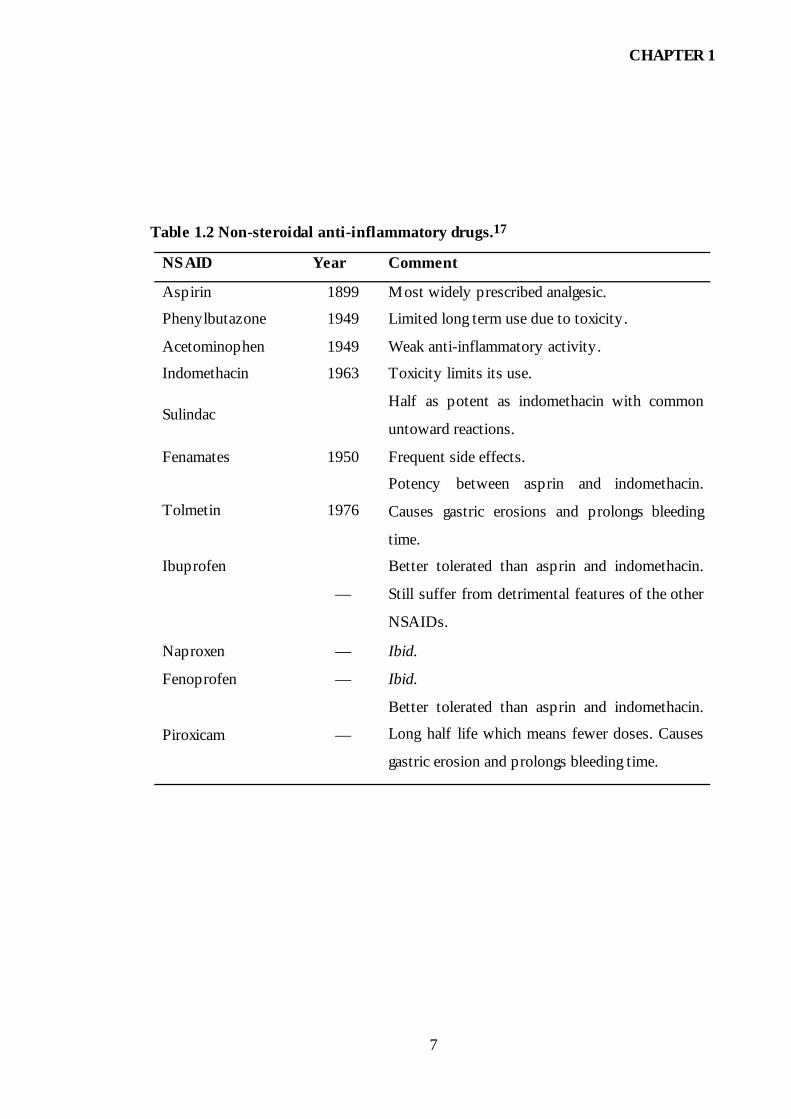
Table 1.2 Non-steroidal anti-inflammatory drugs.17
NSAID Year Comment
Aspirin 1899 Most widely prescribed analgesic.
Phenylbutazone 1949 Limited long term use due to toxicity.
Acetominophen 1949 Weak anti-inflammatory activity.
Indomethacin 1963 Toxicity limits its use.
Sulindac Half as potent as indomethacin with common
untoward reactions.
Fenamates 1950 Frequent side effects.
Tolmetin 1976
Potency between asprin and indomethacin.
Causes gastric erosions and prolongs bleeding
time.
Ibuprofen
—
Better tolerated than asprin and indomethacin.
Still suffer from detrimental features of the other
NSAIDs.
Naproxen — Ibid.
Fenoprofen — Ibid.
Piroxicam —
Better tolerated than asprin and indomethacin.
Long half life which means fewer doses. Causes
gastric erosion and prolongs bleeding time.

CHAPTER 1
8
Arachidonic acid
Cyclic endoperoxides
Prostaglandins; Thromboxanes; Prostacyclin
Inflammatory & Immune SystemResponse; Gastric Protection
Leukotrienes
Tissue Injury to Cell Membrane Phospholipid(e.g. Chemical, Physical, Biological)
Phospholipidase A2(Inhibited in part by NSAIDs)
Lipooxygenase(Variable inhibition byNSAIDs)
Cyclooxygenase I & II(Inhibited by NSAIDs)
Inflammatory & Immune SystemResponse.
Figure 1.2 The inflammation cascade.11
CHAPTER 1
9
The anti-inflammatory action of NSAIDs is thought to be the inhibition of prostaglandin
synthesis by the inhibition of the cyclooxygenase (COX) enzyme.29 There are two
forms of COX, which are known as COX I and COX II. The two forms are similar
except that COX II has a larger active site.30 COX I is thought to be involved in the
maintenance of essential physiological functions, such as platelet aggregation, gastric
protection and maintenance of renal function.31 The activation of COX I leads to the
production of prostacyclin, which is anti-thrombogenic and when expressed by the
gastric mucosa is gastric protective.32 The roles of COX I and COX II are illustrated in
Figure 1.3.
COX II is induced under inflammatory conditions33,34 and results in the inflammatory
response of the body. Most modern NSAIDs preferentially inhibit COX I over COX
II.31,35,36 This selective inhibition of COX I is thought to be responsible for the
gastrointestinal toxicity of NSAIDs.23,35,37 Two selective COX II inhibitors that are
currently available are celecoxib and rofecoxib.11 These compounds have still been
found to have deleterious effects with celecoxib having being linked to 10 deaths and 11
cases of gastro-intestinal hemorrhage after three months on the US market and 2.5
million prescriptions filled.11 Finding alternatives is therefore of serious importance.
Copper has been used as a traditional drug remedy for arthritis for many years.38
Interest in copper complexes as anti-inflammatory drugs was recently inspired by
Sorensen39 who suggested that the active forms of anti-inflammatory drugs were in fact
the Cu-complexes. The Cu-complex was found to be more active than either the parent
Cu(II) salt or NSAID with fewer side effects.39 Since this report there have been
numerous reports on the potential benefits of Cu(II)-complexes.40
Two copper complexes of asprin were developed in Australia as topical application for
human use in the 1970s and 1980s.41,42 Production of these two complexes has since
ceased and they are no longer available. The release of Cu-Indo by BVR for the
treatment of inflammation and pain in animals is the first widely available Cu-NSAID
complex.

CHAPTER 1
10
Normal G.I.Tract
Site of Inflammation
Arachidonic Acid
NSAIDs
NSAIDs
COX - Iconstitutive
COX - IIinducible
Physiological prostaglandin,e.g., gastric protection
Pathological prostaglandin,
e.g., inflammation
Cytokines , Endotoxins
Corticosteroids
COX - II inhibitors
(+)
(-)
(-)
(-)(-)
(-)(-)
Figure 1.3 COX I and COX II sites of action.11

CHAPTER 1
11
The exact reason why Cu-Indo has none of the side effects of traditional NSAIDs and
enhanced potency is still unknown at present. It is presumed to be uninhibiting to COX
I while inhibiting COX II. Another advantage of Cu-Indo is its free radical scavenging
activity. Copper indomethacin has been found to be ten times more effective at
dismutasing superoxide than superoxide dismutase12 whereas indomethacin has no
activity against superoxides.
A clear example of the anti-ulcerogenic activity of Cu-Indo is the fact that indomethacin
cannot be used in dogs because of fatal gastrointestinal side effects,19,21,22 while Cu-
Indo can be used without these side effects.43 Since the introduction of Cu-Indo in
Australia over 7 million dog doses have been sold capturing a sizable portion of the
domestic market.
At present Cu-Indo is available in the form of tablets, granules and a paste. The tablets
are used for the treatment of inflammation and pain in dogs while the granules and
pastes are used for horses. Future directions in the development of Cu-Indo are to
increase the range of formulations and to introduce the drug into the human market. The
motivation for the research described in this thesis was to accelerate the development of
Cu-Indo.
To enable Cu-Indo to be marketed on a worldwide basis in both animals and humans a
method of manufacture that produces a pure solvent free drug and is environmentally
friendly is needed. Conventional methods of synthesis of the drug are inadequate
because the processes needed to purify the drug are lengthy and costly. Organic solvents
and anti-solvents are used in the synthesis and purification steps, resulting in the
generation of solvent waste as well as the problem of residual solvent in the drug. A
more efficient method of manufacture would be to have the reaction, drug recovery and
purification all occurring in a single vessel. The applicability of using carbon dioxide as
an alternative anti-solvent is investigated in this thesis to demonstrate its applicability as
a tool in the synthesis of pharmaceuticals.

CHAPTER 1
12
The second motivation for the research described in this thesis was to produce Cu-Indo
in novel forms that would enable it to be marketed on a worldwide basis for both human
and animal use. A difficulty associated with developing new formulations of Cu-Indo is
the low solubility of the drug in solvents which are acceptable for use in animals or
humans. Further difficulties arise from the pH dependent stability of the drug. The
simplest and safest solvent to use in drug formulation is water. Many drugs, including
Cu-Indo, are only sparingly soluble in water and additives such as surfactants and
additional co-solvents are needed to increase the solubility of the drug in water. To date,
attempts to develop alternative formulations such as for ophthalmic, intravenous or
inhalation delivery have failed due to instability of the drug, or difficulty in producing
the drug with the correct physical properties. To overcome these problems, the potential
of using carbon dioxide as an anti-solvent in producing different forms of Cu-Indo were
investigated. The aims were to micronise Cu-Indo for possible use in inhalation
delivery, or as a suspension for application in ocular drug delivery and to co-precipitate
Cu-Indo with a suitable polymer to increase its solubility in solvents suitable for
intravenous applications.
In Chapters 2, 3 and 4 a detailed discussion of the theoretical and practical aspects of
using gases as anti-solvents is presented. A thorough review of the applications of gases
as anti-solvents is also included. In Chapter 5 the volumetric expansion behaviour of the
high pressure systems involving carbon dioxide and the solvents and solutes used in the
synthesis and processing of Cu-Indo are presented. The use of gases as anti-solvents in
the synthesis of Cu-Indo is presented in Chapter 6. The synthesis using gases as anti-
solvents is compared to the conventional method of synthesis using organic liquid anti-
solvents. The use of gases as anti-solvents in the recrystallisation and micronising of
Cu-Indo is demonstrated in Chapter 7. The effect of process parameters on the
precipitates produced are examined and discussed. The use of gases as anti-solvents to
form blends of drug and polymer with the formation of a Cu-Indo—polyvinyl
pyrrolidone co-precipitate is demonstrated in Chapter 8. The co-precipitate so formed is
compared to the pure drug in terms of solubility and dissolution rate.

CHAPTER 1
13
1.3. References
1. Perrut, M.; "Supercritical Fluid Applications : Industrial Developments and
Economic Issues," Proceedings of the 5th International Symposium on Supercritical
Fluids, Atlanta, Georgia, 2000.
2. Anastas, P. T.; Williamson, T. C.; "Frontiers in Green Chemistry," Green Chemistry,
Anastas, P. T. and Williamson, T. C., Ed.; Oxford University Press: Oxford, 1998, 1.
3. Hubbard, K. W.; "Guidence on Impurities: Residual Solvents," International
Conference on Harmonisation, 1997.
4. Eckert, C. A.; Bush, D.; Brown, J. S.; Liotta, C. L.; "Tuning Solvents for Sustainable
Technology," Proceedings of the 5th International Symposium on Supercritical
Fluids, Atlanta, Georgia, 2000.
5. Hutchenson, K. W.; Foster, N. R.; Innovations in Supercritical Fluid Science and
Technology; Hutchenson, K. W. and Foster, N. R., Ed.; American Chemical Society:
Washington, DC, 1995; 608, 1.
6. Regtop, H. L.; Biffin, J. R.; "Divalent Metal Complexes of Indomethacin,
Compositions and Medical Methods of their Use," U.S. 5,466,824, 1995.
7. Regtop, H. L.; Biffin, J. R.; "Preparation of Divalent Metal Salts of Indomethacin,"
U.S. 5,310,936, 1994.
8. Regtop, H. L.; Biffin, J. R.; "Divalent Metal Salts of Indomethacin as Anti-
Inflammatory and Analgesic Agents," Wo. 9,014,337, 1990.
9. Weser, U.; Schubotz, L. M.; Catalytic Reaction of Copper Complexes with
Superoxide; Rainsford, K. D., Winlesham, K. and Whitehouse, M. W., Ed.;
Birkhauser Verlag: Basel, Boston, Stuttgart, 1981, 103.
10. Weder, J. E.; Hambley, T. W.; Kennedy, B. J.; Lay, P. A.; MacLachlan, D.;
Bramley, R.; Delfs, C. D.; Murray, K. S.; Moubaraki, B.; Warwick, B.; Biffin, J. R.;
Regtop, H. L.; "Anti-Inflammatory Dinuclear Copper(II) Complexes with
Indomethacin. Synthesis, Magnetism and EPR Spectroscopy. Crystal Structure of the
N,N-Dimethylformamide Adduct," Inorganic Chemistry. 1999, 38, 1736.
11. Weder, J. E. "Characterisation of Copper(II) Dimers of the Non-Steroidal Anti-
Inflammatory Drug Indomethacin," University of Sydney; 2000

CHAPTER 1
14
12. Weser, U.; Sellinger, K. H.; Lengfelder, E.; Werner, W.; Strahle, J.; "Structure of
Cu2(Indomethacin)4 and the Reaction with Superoxide in Aprotic Systems,"
Biochimica et Biophysica Acta 1980, 631, 232.
13. David, L.; Cosar, O.; Chis, V.; Negoescu, A.; Vlasin, I.; "ESR Study of Cu(II)-
Indomethacin and Its Pyridine and DMF Adducts," Applied Magnetic Resonance
1994, 6, 521.
14. Sorenson, J. R. J.; Oberley, L. W.; Crouch, R. K.; Kensler, T. W.; Kishore, V.;
Leuthauser, S. W. C.; Oberley, T. D.; Pezeshk, A.; "Pharmacological Activities of
Copper Compounds in Chronic Diseases.," Biol. Trace Elem. Res. 1983, 5, 257.
15. Gabriel, S. E.; Matteson, E. L.; "Economic and Quality-of-Life Impact on NSAIDs
in Rheumatoid Arthritis," PharmacoEconomics 1995, 8, 479.
16. Davies, N. M.; "Non-steroidal Anti-inflammatory Drug-Induced Gastro-intestinal
Permeablity," Alimentary Pharmacology and Therapeutics 1998, 12, 303.
17. Goodman, L. S.; Gilman, A.; The Pharmacological Basis of Therapeutics; 7th ed.;
Macmillan Publishing Co., Inc.: New York, 1985, 1839.
18. Reynolds, J. E. F.; Martindale. The Extra Pharmacopoeia.; 31st ed.; The
Pharmaceutical Press: London, 1996.
19. Adams, H. R.; "Veterinary Pharmacology and Therapeutics," 7th ed.; Iowa State
University Press 1995, 443.
20. Dukes, M. N. G.; "Meyler's Side Effects of Drugs An Encyclopedia of Adverse
Reactions and Interactions," 13th ed.; Elsevier: Amsterdam, 1996.
21. Ewing, G. O.; "Indomethacin-Associated Gastrointestinal Haemorrhage in a Dog,"
Journal. American Veterinary Medical Association 1972, 161, 1665.
22. Menguy, R.; Desbaillets, L.; "Role of Inhibition of Gastric Mucous Secretion in the
Phenomenon of Gastric Mucosal Injury by Indomethacin," American Journal of
Digestive Diseases 1967, 12, 862.
23. Wallace, J. L.; "Mechanisms of Non-Steroidal Anti-Inflammatory Drugs (NSAID)
Induced Gastrointestinal Damage - Potential for Development of Gastrointestinal
Tract Safe NSAIDs," Canadian Journal of Physiology and Pharmacology 1994, 72,
1493.
24. Thomas, J.; "Australian Presciption Products Guide," 26th ed.; Australian
Pharmaceutical Publishing Co. Ltd.: Hawthorn, Victoria, 1997; Vol. 1, 1327.

CHAPTER 1
15
25. Rodriguez, L. A. G.; "Non-Steroidal Anti-Inflammatory Drugs, Ulcers and Risk: A
Collabarative Meta-Analysis," Seminars in Arthritis and Rhematism 1997, 26, 16.
26. Hogan, D. B.; Campbell, N. R. C.; Crutcher, R.; Jennett, P.; MacLeod, N.;
"Presciption of Non-Steroidal Anti-inflammatory Drugs for Elderly People in
Alberta," Canadian Medical Association. Journal 1994, 151, 315.
27. Griffin, M. R.; Piper, J. M.; Daugherty, J. R.; Snowden, M.; Ray, W. A.; "Non-
Steroidal Anti-inflammatory drug Use and Increased Risk for Peptic Ulcer Disease in
Elderely Persons," Annals of Internal Medicine 1991, 114, 257.
28. Davidson, L. S. P.; "Davidson's Principles and Practice of Medicine," Davidson's
Principles and Practice of Medicine, 17th ed.; Edwards, C. R. W., Bouchier, I. A. D.,
Haslett, C. and Chilvers, E. R., Ed.; Churchill Livingstone: Edinburgh, 1995.
29. Kurumbail, R. G.; Stevens, A., M.; Gierse, J. K.; McDonald, J. J.; Stegeman, R. A.;
Pak, J. Y.; Gildehaus, D.; Miyashiro, J. M.; Penning, T. D.; Seibert, K.; Isakson, P.
C.; Stalling, W. C.; "Structural Basis for Selective Inhibition of Cyclo-Oxygenase-2
by Anti-inflammatory Agents.," Nature 1996, 384, 644.
30. Hawkey, C. J.; "COX-2 Inhibitors," The Lancet 1999, 353, 307.
31. Brideau, C.; Kargman, S.; Liu, S.; Dallob, A. L.; Ehrich, E. W.; Rodger, I. W.;
Chan, C. C.; "A Human Blood Assay for Clinical Evaluation of Biochemical
Efficacy of Cyclo-Oxygenase Inhibitors," Inflammation Research 1996, 45, 68.
32. Frohlich, J. C.; "A Classification of NSAIDs According to the Relative Inhibition
of Cyclo-Oxygenase Isoenzymes," JIPS 1997, 18, 30.
33. Kojubu, D. A.; Fletcher, B. S.; Varnum, B. C.; Lim, R. W.; Herschman, H. R.;
"TIS10, a Phorbol Ester Tumor Promoter-Inducible mRNA from Swiss 3T3 Cells,
Endcodes a Novel Prostaglandin Synthase/Cyclo-Oxygenase Homolog," J. Biol.
Chem. 1991, 266.
34. Xie, W.; Robertson, D. L.; Sunmons, D. L.; "Mitogen-Inducible Prostaglandin G/H
Synthase: A New Target for Non-Steroidal Anti-Iinflammatory Drugs," Drug Dev.
Res. 1992, 25, 249.
35. Donnelly, M. T.; Hawkey, C. J.; "Review Article: Cox-11 Inhibitors - A New
Generation of Safer NSAIDs?," Alimentary Pharmacology and Therapeutics 1997,
11, 227.
36. de Brum Fernandes, A. J.; "New Perspectives for Non-Steroidal Anti-Inflammatory
Therapy," Journal of Rheumatology 1997, 24, 246.

CHAPTER 1
16
37. Wallace, J. L.; "Non-Steroidal Anti-Inflammatory Drugs and Gastro-Eneropathy:
The Second Hundred Years," Gastroenterology 1997, 112, 1000.
38. Walker, W. R.; Keats, D. M.; "An Investigation of the Therapeutic Value of the
Copper Braclet. Demal Assimilation of Copper in Arthritis/Rheumatoid Condition,"
Agents and Actions 1976, 6/4, 454.
39. Sorenson, J. R. J.; "Copper Chelates as Possible Active Forms of the Arthritic
Agents," Journal of Medicinal Chemistry 1976, 19, 135.
40. Sorenson, R. J.; "Copper Complexes Offer a Physiological Approach to Treatment
of Chronic Diseases," Progress in Medicinal Chemistry, ; Ellis, G. P. and West, G.
B., Ed.; Elsevier Science Publishers, B.V. (Biomedical Division): New York, 1989;
Vol. 26, 437.
41. Walker, W. R.; Beveridge, S. J.; Whitehouse, M. W.; "Anti-inflammatory Activity
of a Dermally Applied Copper salicylate Preparation (Alcusal)," Agents and Actions
1980, 10, 38.
42. Beveridge, S. J.; Walker, W. R.; Whitehouse, M. W.; "Anti-Inflammatory Activity
of Copper Aslicylates Applied to Rats Percutaneously in Dimethylsulfoxide with
Glycerol," J. Pharm. Pharmacol. 1980, 32, 425.
43. "MIMS Australia, IVS Annual," Index of Veterinary Specialists Annual, ; MIMS
Publishing, Crows Nest, N.S.W.: Sydney, 1997, 145 & 276.

CHAPTER 2
17
2. DENSE GASES AS ANTI-SOLVENTS — THEORY
2.1. Introduction
The concept of using supercritical fluids to precipitate solids has been known for over a
century.1 The concept of precipitating solids from solutions using dense gases as anti-
solvents however, is a relatively recent development, with the first experiments being
reported by Gallagher and co-workers2 The ability of dense gases such as carbon
dioxide to dissolve in and expand organic solvents was exploited in order to precipitate
solids from organic solution. The process reported by Gallagher and co-workers has
now become known as the gas anti-solvent process and has sparked off a whole new
direction in research. The number of recent publications relating to the potential of
using dense gases as anti-solvents is evidence of this.3-9
Two experimental techniques have been designed to take advantage of the gas anti-
solvent procedure. The first type of process, known as the Gas Anti-Solvent (GAS)
process, involves the addition of the gas anti-solvent to a solution containing a solute at
a certain temperature. As the pressure is increased, the gas anti-solvent dissolves in the
solution, reducing the dissolving power of the solvent and precipitating the solute. The
second type of process involves the injection of a solution into a precipitation chamber
that has been pressurised with gas anti-solvent. The second process has been referred to
by many different names depending on the conditions under which the gas anti-solvent
is being used. The more common names are Precipitation with a Compressed Anti-
Solvent (PCA),10 Supercritical Anti-Solvent precipitation (SAS),11 Solution Enhanced
Dispersion by Supercritical fluids (SEDS),12 and the Aerosol Solvent Extraction System
(ASES). In this text the acronym ASES will be used in reference to the latter process.
For both processes precipitation occurs in an extremely short time span and precipitated
particles have narrow particle size distribution.
The GAS process is a batch precipitation technique that utilises near critical, or
supercritical fluid anti-solvents to precipitate solutes from solution. By definition the
process relies on the solute being relatively insoluble in the anti-solvent, but the anti-

CHAPTER 2
18
solvent being miscible with the solvent. As the concentration of anti-solvent mixed into
the liquid solution increases, the liquid solvent expands and the solvent power of that
phase decreases. At a critical anti-solvent concentration, or expanded volume, the
solution becomes saturated and, at higher anti-solvent concentrations, the solute
precipitates. The precipitate can then be filtered out and washed with pressurised anti-
solvent to prevent re-dissolution into the solvent. The nature of the final precipitate in
this process is simply a function of the pressurisation rate, temperature and the type of
solvent and anti-solvent used.
The Aerosol Solvent Extraction System (ASES) process is a continuous precipitation
technique that, like the GAS process, utilises near-critical, or supercritical fluid anti-
solvents to precipitate solutes from solution. The main difference between the GAS and
ASES processes is that in the latter the solution containing the solute/s is sprayed into
an anti-solvent environment, allowing the solution to expand and induce precipitation of
the solute. The ASES process causes a dramatic drop in the solvation power of the
solvent and therefore the supersaturation at which precipitation occurs can be
exceptionally high. Particles with diameters less than 1 µm can be precipitated in this
manner. The efficiency of ASES precipitation is further enhanced by the use of spraying
devices such as fine nozzles and orifices that are able to uniformly disperse the solution
as fine droplets with large surface area to improve the diffusion processes involved in
the precipitation. The time scale for the ASES precipitation process has been measured
to be within 10-5s.13
The work presented in this thesis involved the use of both the GAS and the ASES
process using CO2 as the anti-solvent. To provide a framework of understanding,
theoretical aspects such as thermodynamics, hydrodynamics, mass transfer and
nucleation and crystallisation will be presented in relation to the GAS and ASES
processes. It must be kept in mind that, in terms of industrial processes, the GAS and
ASES concepts are in their infancy and, as such, the fundamental data required for a
rigorous description of the processes is unavailable.

CHAPTER 2
19
2.2. Thermodynamic Considerations
The ability of a dense gas to behave as an anti-solvent depends on its ability to dissolve
in the solution containing the solute to be precipitated. An understanding of the phase
behaviour is therefore essential to performing a successful precipitation using the GAS
or ASES processes.
The following discussion will focus on the phase behaviour of systems relevant to the
GAS and ASES processes. The phase behaviour of the pure anti-solvent will be
presented first and the sections that follow will discuss the more complex systems that
contain solvent and one or more solutes. The various models that have been reported in
the literature to predict the phase behaviour of these systems will also be discussed.
2.2.1. Pure Anti-Solvent Phase Behaviour
Essentially any gas can be used as an anti-solvent in the GAS or ASES processes with
the only requirement being that the gas must be sufficiently soluble in the solution of
interest at the desired pressure and temperature. Carbon dioxide, however, is by far the
most commonly used anti-solvent due to its inert nature, low cost, availability and mild
operating conditions.
The phase diagram of a pure component is depicted in Figure 2.1. The three curves
represented by a solid line indicate the co-existence of two phases and are boundaries
for the single phase regions. Line A—B is referred to as the sublimation curve and
indicates the region where the gas and solid phases exist in equilibrium. Line B—C is
the fusion curve and indicates the region where solid and liquid phases exist in
equilibrium. Line B—D is the vapourisation curve and indicates the region where gas
and liquid phases exist in equilibrium. Point D, called the critical point, marks the end
of the vapour—liquid equilibrium curve. At pressures and temperatures above the
critical point, indicated by the shaded area, the gas and liquid phases become identical
and the system is said to be supercritical.

CHAPTER 2
20
����������������������������������������������������������������������������������������������������������������������������������������������������������������������������������������������������������������������������������������������������������������������������������������������������������������������������������������������������������������������������������������������������������������������������������������������������������������������������������������������������������������������������������������
Supercritical FluidRegion
Liquid
Gas
SolidPres
sure
Temperature
A
B
C
D
Figure 2.1 Phase diagram for a pure substance.

CHAPTER 2
21
The critical pressures and temperatures of a number of compounds are listed in Table
2.1. A trend that can be noted is that most hydrocarbons have critical pressures close to
5.0 MPa. The critical temperatures for the light hydrocarbons are around room
temperature and carbon dioxide has a mild critical temperature and slightly elevated
critical pressure.14
As a fluid approaches its critical point, unusual effects are observed. The isothermal
compressibility and the heat capacity (at constant pressure) of the fluid become
infinitely large. The density and the dielectric constant of the fluid increases sharply as
the pressure increases through the critical point. The density behaviour of a pure
component in the vicinity of the critical point is depicted in Figure 2.2.14
Table 2.1 Critical pressures and temperatures of anti-solvents used in GAS and
ASES.14
Anti-Solvent Critical Temperature / °C Critical Pressure / MPa
Carbon Dioxide 31 7.1
Ethane 32 4.8
Ethylene 10 5.1
Propane 96.7 4.19
Propylene 91.9 4.56
Ammonia 132.5 11.13
Water 374.2 21.76
Benzene 289.0 4.83
Trifluoromethane 26 4.7
Chlorotrifluoromethane 29 3.9
Xenon 16 5.8
Nitrous Oxide 36 7.2
Isopropanol 235.2 4.7
At reduced temperatures (T/Tc) between 0.9 and 1.2 and reduced pressures greater than
1.0 the reduced density of the fluid changes from gas-like to liquid-like. The slope of

CHAPTER 2
22
Tr = 0.8
0.9
1.0
1.1
1.2
1.55
1.0
1.0
Red
uced
Den
sity
Reduced Pressure
Figure 2.2 Reduced density of a pure substance in the vicinity of its critical point.14

CHAPTER 2
23
the isotherms (the compressibilities) are very high, close to the critical point, implying
that very small changes in pressure can induce large changes in density. It is this density
characteristic of fluids near their critical point that has made them attractive as solvents
for extracting components from mixtures.
Another important feature of a supercritical fluid is that although the densities approach
those of liquids the transport properties such as diffusivity and viscosity remain gas-
like. The self-diffusivity of carbon dioxide with those of solutes in organic liquids is
compared in Figure 2.3.14 The self-diffusivity of CO2 is about 1-2 orders of magnitude
higher than the diffusivity of solutes in liquids.
The change in viscosity of CO2 with pressure at various temperatures is shown in Figure
2.4. The viscosity increases rapidly around the critical point, but even at high pressures,
the values are around 0.09 cp, which is an order of magnitude below the typical
viscosities of liquid organic solvents.14
The combined properties of liquid-like densities, gas-like diffusivities and viscosities
and zero surface tension of fluids such as CO2 near their critical point have been the
catalyst for the research conducted with supercritical fluids.
2.2.2. Anti-Solvent—Solvent Phase Behaviour
The ability of gases such as CO2 to dissolve in organic solvents has been
demonstrated15 long before the introduction of the use of dense gases as anti-solvents.2
For example the equilibrium phase properties of the toluene—CO2 system were
reported 20 years earlier.15 However, since the report by Gallagher and co-workers,2
studies specific to the GAS and ASES systems have appeared.

CHAPTER 2
24
Diff
usiv
ity /
cm2.s-1
Temperature / oC0 20 40 60 80 100
10-5
10-4
10-3
10-2
������������������������������������������������������������������������������������������������������������������������������������������������������������������������������������������������������������������������������������������������������������������������������������������������������������������������������������������������������������������������������������������������������������������������������������������Diffusivities of solutes in Normal Liquids
Pressure (MPa)78
101520
Saturated Vapour
Critical Point
Saturated Liquid
Figure 2.3 Diffusivity behaviour of CO2.14

CHAPTER 2
25
Visc
osity
/ cp
Pressure / MPa4.0 10.0 100.0
0.01
0.07
0.09
0.11
0.03
0.05
77 oC47 oC
37 oC
Figure 2.4 Viscosity behaviour of CO2.14

CHAPTER 2
26
Kordikowski and co-workers16 have reported the results on the pressurisation of a
number of organic solvents with CO2, ethane and ethene. The solubility of the anti-
solvents in the solvents as a function of pressure and temperature are depicted in Figure
2.5 and Figure 2.6.
The results reported by Kordikowski and co-workers showed that the selection of anti-
solvent for a particular solution depends on the degree of polarity of the solvent. The
pressurisation of solutions of polar solvents such as acetonitrile with ethane or ethene
resulted in liquid—liquid immiscibility. Liquid—Liquid immiscibility did not occur
when acetonitrile was pressurised with CO2. Similar results were observed for the
solvents N-methyl pyrrolidone (NMP) and N,N-dimethylformamide (DMF) where the
formation of a second liquid phase occurred upon pressurisation with ethylene and
ethane. Liquid—liquid immiscibility did not occur when DMF and NMP were
pressurised with CO2, chlorodifluoromethane, or dichlorodifluoromethane.2 The
observations were correlated to the differences in polarity of the solvents and anti-
solvents. Ethane, ethene and ethylene are non-polar compounds, whereas DMF, NMP
and acetonitrile are polar molecules. Interestingly, the possibility of CO2 dissolving a
solute is often correlated to the ability of hexane to dissolve the solute. In the case of
these systems, CO2 was able to dissolve in the polar solvents that are immiscible with
hexane.2 The ability of CO2 to dissolve in polar solvents has been attributed to the
relatively large quadropole moment of the molecule, which results in the existence of a
small polarity.16
For the GAS and ASES processes the occurrence of immiscibility is undesirable as the
processes of precipitation of the solute and the subsequent removal of solvent relies on
the anti-solvent being miscible with the solvent. It is therefore essential that the phase
behaviour of the binary anti-solvent—solvent system be investigated. Although
immiscibility may occur for a particular system at certain conditions, the system may
still be operable if the process parameters are manipulated such that the region of
immiscibility is avoided.

CHAPTER 2
27
0
0.1
0.2
0.3
0.4
0.5
0.6
0.7
0.8
0.9
0 5.0 10.0 15.0 20.0 25.0Pressure / MPa
Mol
e Fr
actio
n (A
ntis
olve
nt)
Ethane—AcetonitrileEthane—Ethyl AcetateEthane—1,4-Dioxane
0
0.1
0.2
0.3
0.4
0.5
0.6
0.7
0.8
0.9
1
0 2.0 4.0 6.0 8.0Pressure / MPa
Mol
e Fr
actio
n (A
ntis
olve
nt) Ethene—Ethyl Acetate
Ethene — 1,4-Dioxane
Figure 2.5 Solubility of ethane and ethene in organic solvents.16

CHAPTER 2
28
0
0.1
0.2
0.3
0.4
0.5
0.6
0.7
0.8
0.9
1
0 2 4 6 8Pressure / MPa
Mol
e Fr
actio
n (A
ntiso
lven
t)
Acetonitrile
Ethyl Acetate
1,4-DioxaneEthanol
Figure 2.6 Solubility of CO2 in organic solvents.16

CHAPTER 2
29
In describing the phase behaviour of the anti-solvent—solvent system, the expansion of
the liquid phase has often been used. The classical definition of volumetric expansion
(∆V) was given by the following equation.2
∆VV
= VL (T,P,x1)-V2 (T,P0)
V2 (T,P0) 2.1
where VL is the total volume of the liquid phase and V2 is the total volume of the pure
solvent at the same temperature and atmospheric pressure P0, and x1 is the mole fraction
of the anti-solvent in the liquid phase. At low pressures the expansion of the liquid
phase is low and follows Henry's law.2 The volumetric expansion of ethylacetate upon
pressurisation with CO2 is depicted in Figure 2.7.16
As the pressure approached the vapour pressure of the anti-solvent, the expansion
became asymptotic and eventually the solvent and anti-solvent became totally miscible.
The point at which the two fluids become miscible is termed the threshold pressure, or
critical point, of the mixture. Below the point of mutual miscibility, the solvent has little
solubility in the anti-solvent.
The density of the liquid phase of various organic solvents upon pressurisation with
CO2 is shown in Figure 2.8. The density passes through a maximum as the pressure
increases. The increase in density indicates that at low pressures CO2 could act as a
solvent rather than an anti-solvent.16
It has been shown that for a given anti-solvent mole fraction, the volumetric expansion
was the same for all temperatures and organic solvents studied (Figure 2.9).16 The
inability to distinguish between solvents using the classical definition of expansion has
led to the following definition being proposed for solvent expansion.17 :

CHAPTER 2
30
0
100
200
300
400
500
600
700
800
900
0 2.0 4.0 6.0Pressure / MPa
∆V
/ %
25 °C
30 °C
40 °C
Figure 2.7 Volumetric expansion of ethyl acetate pressurised with CO2.16

CHAPTER 2
31
700
750
800
850
900
950
1000
1050
1100
0 1 2 3 4 5 6Pressure / MPa
Den
sity
/ kg.
m-3
AcetonitrileEthyl Acetate1,4-DioxaneEthanol
Figure 2.8 Variation of density of organic solvents upon pressurisation with CO2.16

CHAPTER 2
32
∆V*
V* = V% L (T,P,x1) — V% 2 (T,P0)
V% 2 (T,P0) 2.2
where V% L is the molar volume of the liquid mixture and V% 2 is the molar volume of the
pure solvent. The expansion behaviour of a number of solvents pressurised with CO2 is
shown in Figure 2.10.
When Equation 2.2 is used to describe the expansion, different solvents show different
expansion behaviour. These differences include ∆V* passing through a minimum with
increasing mole fraction of anti-solvent. The precipitation of solute was found to
coincide with the minimum in ∆V*. It was therfore proposed that the optimum
expansion for a given solvent and anti-solvent was the pressure where the volumetric
expansion passed through a minimum.18
In some anti-solvent processes a mixture of solvents are used in order to increase the
solubility of a specific solute or for co-precipitation purposes. Hydrophilic compounds
that are sparingly soluble in organic solvent, such as proteins, require water to be used
as a solvent. Common anti-solvents with moderate critical temperatures are insoluble in
water and as such are unable to act as an anti-solvent. In these cases an organic solvent
that is miscible in both the anti-solvent and water may be added to improve the
miscibility of water and the anti-solvent.19-21
The three component CO2—water—ethanol systems at 35°C and at 6.9 MPa and 10.2
MPa respectively are shown in Figure 2.11.5 At the lower pressure CO2 and ethanol
exists in two phases and is seen by the V—L boundary intersecting the CO2—ethanol
axis. At both pressures water and CO2 exist in two phases and water and ethanol are
miscible. The mixture exists in two phases and is bounded by the saturated liquid and
vapour curves. As the pressure is increased above the critical pressure of the binary
CO2—ethanol system, CO2 and ethanol become totally miscible.

CHAPTER 2
33
0
200
400
600
800
1000
1200
0 0.2 0.4 0.6 0.8 1CO2 Mole Fraction
∆V /
%
Acetonitrile
Ethylacetate
1,4-Dioxane
Ethanol
Figure 2.9 ∆V vs CO2 mole fraction for various organic solvents.16

CHAPTER 2
34
15
5
-5
-15
-25
-35
-45
-55
∆V
* / %
CO2 Mole Fraction0 0.2 0.4 0.6 0.8 1
Acetonitrile
Ethanol
Ethyl Acetate1,4-Dioxane
Figure 2.10 ∆V* vs CO2 mole fraction for various organic solvents.17

CHAPTER 2
35
If the system shown in Figure 2.11 were to be used in the GAS or ASES process the
conditions chosen would need to be where all three components are miscible. The
conditions where all three components are miscible are shown by the shaded area in
Figure 2.11.
2.2.3. Anti-Solvent—Solvent—Solute Phase Behaviour
The pure anti-solvent and binary anti-solvent—solvent phase behaviour, although
important in determining the suitability of a system for application of the GAS or ASES
processes, can be far removed from the actual phase behaviour of a ternary anti-
solvent—solvent—solute system. To date, no study has presented the complete phase
behaviour of an organic solid in the presence of an organic solvent expanded with a
supercritical fluid.5 A simple representation of the phase behaviour of a ternary system
at a pressure and temperature above and below the anti-solvent—solvent critical point is
shown in Figure 2.12 a and b. Below the critical point of the anti-solvent—solvent
mixture (Figure 2.12 a) the following phases can co-exist: liquid, vapour—liquid,
liquid—solid, vapour—liquid—solid, vapour—solid and vapour. Above the critical
point of the anti-solvent—solvent mixture (Figure 2.12 b) the number of co-existing
phases reduces to vapour, vapour—solid, liquid and liquid—solid.
If the concentration of solute in solution is relatively low, the ternary system displays
similar phase behaviour to the binary anti-solvent—solvent system. At higher
concentrations of solute in solution, in many instances, the ternary system cannot be
related to the phase behaviour of the three corresponding binary systems.18 At higher
concentrations, the presence of solute in the expanded solution can result in complex
phase behaviour.17,18,22,23 For example the CO2—toluene—naphthalene system gives a
liquid phase split upon pressurisation24 and an ethanol solution of citric acid does not
undergo expansion when pressurised with CO2.25 Tai and co-workers25 suggested that
this was due to the strong cohesive forces between the solute and solvent preventing the
solvent molecules from interacting with the anti-solvent molecules.

CHAPTER 2
36
������������������������������������������������������������������������������������������������������������������������������������������������������������������������������������������������������������������������������������������������������������������������������������������������������������������������������������������������������������������������������������������������������������������������������������������������������������������������������������������������������������������������������������������������������������������������������������������������������������������������������������������������������������������������������������������������������������������������������������������������������������������������������������������������������������������������������������������������������������������������������������������������������������������������������������������������������������������������������������������������������������������������������������������������������������������������������������������������������������������������������������������������������������������������������������������������������������������������������������������������������������������������������������������������������������������������������������������������������������������������������������������������������������������������������������������������������������������������������������������������������������������������������������������������������������������������������������������������������������������������������������������������������������������������������������������������������������������������������������������������������������������������������������������������������������������������������������������������������������������������������������������������������������������������������������������������������������������������������������������������������������������
����������������������������������������������������������������������������������������������������������������������������������������������������������������������������������������������������������������������������������������������������������������������������������������������������������������������������������������������������������������������������������������������������������������������������������������������������������������������������������������������������������������������������������������������������������������������������������������������������������������������������������������������������������������������������������������������������������������������������������������������������������������������������������������������������������������������������������������������������������������������������������������������������������������������������������������������������������������������������������������������������������������������������������������������������������������������������������������������������������������������������������������������������������������������������������������������������������������������������������������������������������������������������������������������������������������������������������������������������������������������������������������������������������������������������������������������������������������������������������������������������������������������������������������������������������������������������������������������������������������������������������������������������������������������������������������������������������������������������������
Ethanol
CO2Water
L + V
L
6.9 MPa
V
a
Ethanol
CO2Water
L + V
L
10.2 MPa
b
Figure 2.11 Ternary phase diagram for CO2—water—ethanol at constant
temperature and pressure.5 (a) 35°C, 6.9 MPa, (b) 35°C, 10.2 MPa

CHAPTER 2
37
Solid
CO2Organic
L
L + S
V + S V
b
Solid
CO2Organic
V + L + S
V
L + S
L
V + L
V + S
a
Figure 2.12 Ternary anti-solvent—solvent—solute phase behaviour.5

CHAPTER 2
38
The phase behaviour of the CO2—toluene—naphthalene system has been determined by
means of a thermodynamic model at pressures and temperatures of relevance to the
GAS and ASES processes.22 An example of the complex phase behaviour possible
upon the addition of a solute to the anti-solvent—solvent system is shown in Figure
2.13. A second liquid phase appears and, depending on the overall composition, either
L1—L2—V or S—L2—V equilibrium may occur.
Polymers are a class of compounds that have complex phase behaviour when
pressurised with anti-solvents such as CO2. Liquid—liquid phase separation can occur
before the polymer vitrifies.8 Dissolved gases have a plasticising effect on amorphous
polymers due to dissolution of the gas in the polymer, resulting in a lowering of the
glass transition temperature. This lowering of glass transition temperature can go below
that of operating temperatures of GAS and ASES26 and can influence the morphology
and particle size of the particles produced.
The solubility of solute in an expanded solution at the operating conditions also needs to
be considered. Depending on the concentration of the solute in solution and the nature
of the solute, precipitation will occur at different expansion levels.24,27 520 This is the
basis of fractionation and can play a significant role in the GAS and ASES processes.
As the concentration of anti-solvent increases in the expanded solution, a solute will
tend to its solubility in pure anti-solvent.8 If the solute to be precipitated is too soluble
at the final conditions, or if the process is performed at a condition where the expansion
of the solvent is below the precipitation threshold of the solute, then no precipitation
will occur. In some studies microparticle formation has been unsuccessful due to the
solubility of the drug at process conditions28-30 and encapsulation experiments have
failed because of the drug being extracted instead of precipitated.31
The solubility of the substance to be precipitated in a suitable organic solvent is another
thermodynamic criteria. For most organic solids this criterion is met, but for most
inorganic and hydrophilic materials the situation is different. They are usually soluble in
water or sulfuric acid which are not expanded by simple gases such as CO2.32 A

CHAPTER 2
39
Naphthalene (50 %)
Toluene (50 %)CO2
L1 + L2 + V
S + L
LL1 + VV
S + V
L2 + V
S + L2 + V
Figure 2.13 Ternary phase diagram for CO2—toluene—naphthalene at
temperatures between 315 and 325 K and pressure between 8.2 and 9.8 MPa.22
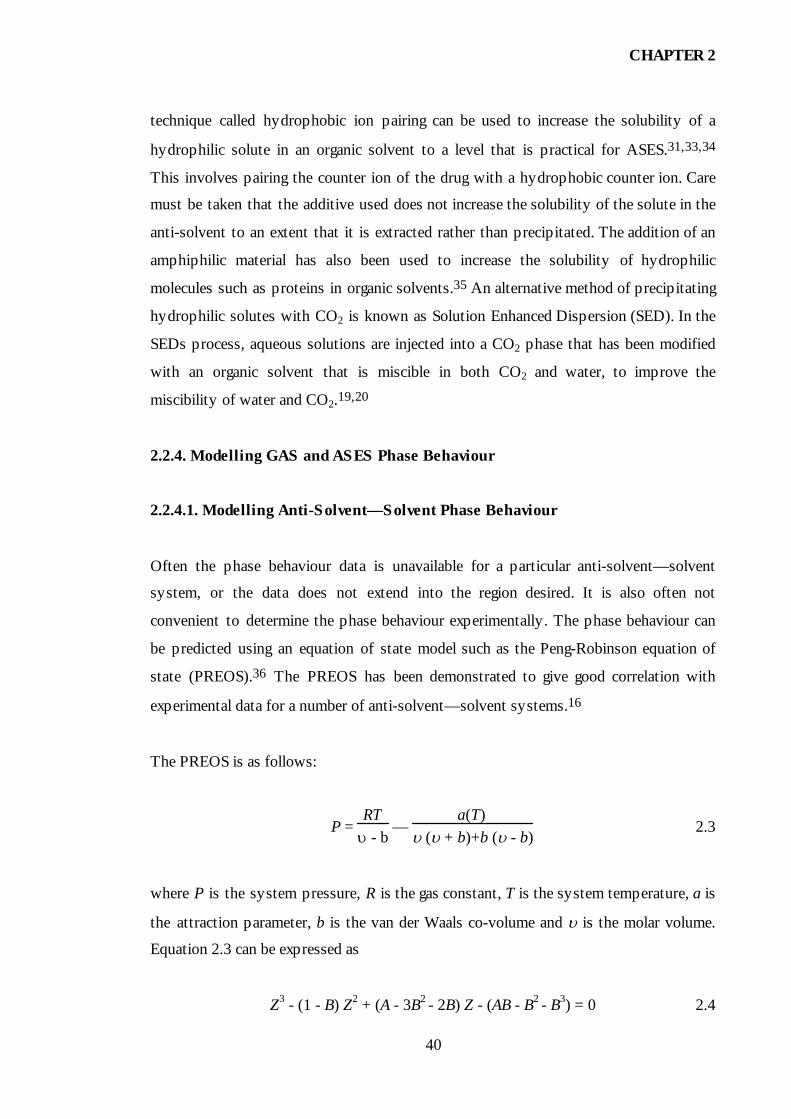
CHAPTER 2
40
technique called hydrophobic ion pairing can be used to increase the solubility of a
hydrophilic solute in an organic solvent to a level that is practical for ASES.31,33,34
This involves pairing the counter ion of the drug with a hydrophobic counter ion. Care
must be taken that the additive used does not increase the solubility of the solute in the
anti-solvent to an extent that it is extracted rather than precipitated. The addition of an
amphiphilic material has also been used to increase the solubility of hydrophilic
molecules such as proteins in organic solvents.35 An alternative method of precipitating
hydrophilic solutes with CO2 is known as Solution Enhanced Dispersion (SED). In the
SEDs process, aqueous solutions are injected into a CO2 phase that has been modified
with an organic solvent that is miscible in both CO2 and water, to improve the
miscibility of water and CO2.19,20
2.2.4. Modelling GAS and ASES Phase Behaviour
2.2.4.1. Modelling Anti-Solvent—Solvent Phase Behaviour
Often the phase behaviour data is unavailable for a particular anti-solvent—solvent
system, or the data does not extend into the region desired. It is also often not
convenient to determine the phase behaviour experimentally. The phase behaviour can
be predicted using an equation of state model such as the Peng-Robinson equation of
state (PREOS).36 The PREOS has been demonstrated to give good correlation with
experimental data for a number of anti-solvent—solvent systems.16
The PREOS is as follows:
P = RT
υ - b —
a(T)υ (υ + b)+b (υ - b)
2.3
where P is the system pressure, R is the gas constant, T is the system temperature, a is
the attraction parameter, b is the van der Waals co-volume and υ is the molar volume.
Equation 2.3 can be expressed as
Z3 - (1 - B) Z2 + (A - 3B2 - 2B) Z - (AB - B2 - B3) = 0 2.4
CHAPTER 2
41
where
A = aP
R2T2 2.5
B = bPRT
2.6
Z = PυRT
2.7
Equation 2.4 yields one to three roots depending on the number of phases in the system.
For a two phase system, the largest value of Z corresponds to the vapour phase and the
smallest positive root to that of the liquid phase.
At the critical point:
b(Tc) = 0.07780 RTc
Pc 2.8
a(Tc) = 0.45724 R2T2
c
Pc 2.9
where Tc is the critical temperature and Pc is the critical pressure of the component in
question. At temperatures other than the critical point:
a(T) = a(Tc) α(Tr,ω) 2.10
b(Tc) = b(T) 2.11
where α(Tr,ω) is a dimensionless function of reduced temperature and the accentric
factor ω. Expressions for k and α are as follows:

CHAPTER 2
42
k = 0.37464 + 1.54226ω - 0.26992ω2 2.12
α = [1 + k
1 - Tr ]2 2.13
a(T) = 0.45724 R2T2
c
Pc
1 + (0.37464 + 1.54226ω - 0.26992ω2)
1 - Tr
2 2.14
The mixture parameter a is defined as follows:
a = ∑i
∑j
xixjaij 2.15
aij = (1 - kij) aiaj 2.16
where xi and yi are the mole fractions in the liquid and vapour phase of component i. kij
is the unlike pair interaction parameter which accounts for non-ideal interactions
between unlike molecules. For non-polar solvents kij is sufficient to model the data and
the mixture parameter b is defined as follows:
b = ∑i
xibi 2.17
Most of the solvents used in the GAS or ASES processes are polar and two binary
interaction parameters, kij and lij, are needed to model the data accurately.16 The
expression for the mixture parameter b then becomes :
b = ∑i
∑j
xixjbij 2.18
bij = (1 - lij) bi + bj
2 2.19
For a binary system the following iso-fugacity criteria hold:

CHAPTER 2
43
y1
x1 =
φV1
φL1
2.20
y2
x2 =
φV2
φL2
2.21
where φLi and φ
Vi are the liquid and vapour phase fugacities of component i respectively.
The following constraints on the two fluid phases applies:
∑i = 1
2 xi = 1 2.22
∑i = 1
2 yi = 1 2.23
If the pressure and temperature are fixed Equations 2.20 to 2.23 represent four non-
linear equations and four unknowns, which are the molar compositions of the liquid and
vapour phases. The fugacity co-efficients of the liquid and vapour phase constituents
can be calculated using the following equation:
ln φi = bNB
(Z - 1) - ln (Z - B) — A
2 2B
2∑
j xjaij
a ln
Z + 2.414B
Z - 0.414B 2.24
bN = 2∑k
N xkbik — ∑
j
Nx j
2bjj — 2∑j=1
N-1 ∑
i=j+1
N xixi-jbij 2.25
The PREOS has been applied to a number of anti-solvent—solvent systems.16 Using
temperature independent binary interaction parameters, good correlation with
experimenatal data were obtained for most of the anti-solvent—solvent systems studied.

CHAPTER 2
44
The PREOS was unable to model the systems such as ethane—acetonitrile in which
liquid—liquid immiscibility occurred.
2.2.4.2. Modelling Anti-Solvent—Solvent—Solute Phase Behaviour
A few models have been proposed to predict the solubility of solids in expanded
solutions.22,24,37,38 For a ternary anti-solvent—solvent—solute system, the following
isofugacity equation can be added to those given by Equations 2.22 and 2.23:
y3
x3 =
φV3
φL3
2.26
with the following constraints on the two fluid phases:
∑i=1
3 xi = 1 2.27
∑i=1
3 yi = 1 2.28
The subscripts 1,2 and 3 refer to the anti-solvent, solvent and solute respectively. In
most cases the PREOS, with one or two interaction parameters, has been used to
calculate the fugacity co-efficients of each component in the liquid and vapour phase.
The PREOS is unable to represent the behaviour of the solid phase and it is in the
description of the solid phase that the following models differ.
Chang and Randolph used the decrease in the partial molar volume (υ2) of the solvent
upon expansion to calculate the solubility of the solute in the expanded solvent.37 Only
Equations 2.22 and 2.23 are considered in the model. The partial molar volumes were
calculated using the following analytical differentiation of the PREOS:

CHAPTER 2
45
υi = RTP
Z + ( )1 - xi
δZ
δxi T,P i = 1,2 2.29
The solubility of the solute in the liquid phase was calculated in terms of the partial
molar volumes of the solvent using the following expression:
S3(T,P) = υ2 (T,P,x) υ2 (T,1,0)
S3(T,1) 2.30
where S3(T,P) is the equilibrium solubility of the solute in the liquid phase, S3(T,1) is
the solubility of the solute in the solvent at atmospheric pressure and υ2(T,1,0) is the
partial molar volume of the pure solvent at atmospheric pressure. Using this approach
only the binary data was needed to predict the ternary phase behaviour, and a good
correlation between experimental and predicted results were obtained for the CO2—
toluene—β-carotene and CO2—n-butanol—acetominophen systems at 25 °C up to
pressures of 9.0 MPa. The model is based on the assumption that the anti-solvent—
solute interactions are negligible compared to the anti-solvent—solvent interactions and
only provides results based upon the rough approximation of Equation 2.30.11 Despite
the approximations, the model may be useful when data such as critical constants are
unavailable for the solid.
Other models that have been proposed make use of all three iso-fugacity Equations:
2.22, 2.23 and 2.26. The difference in these models is the manner in which the
equilibrium between the solute in the solid and liquid phases is dealt. As all the models
treat the vapour—liquid equilibrium in the same way, only the manner in which the
solid—liquid equilibrium is dealt with will be described below.
Dixon and Johnston used a combination of regular solution theory and the PREOS to
describe the ternary phase behaviour of the CO2—toluene—phenanthrene and CO2—
toluene—naphthalene systems.38 The solid—liquid equilibrium was described by the
following relationship:

CHAPTER 2
46
f3 0S
= x3γ
3 f
3 0L
2.31
where f3 0S
and f3 0L
represent the fugacities of the pure solid solute and the pure subcooled
liquid solute respectively, and γ3 is the solute activity co-efficient. At the system
temperature and at a reference pressure (P0) the fugacity of the solute in the liquid phase
was given by:
f3 L = x
3γ
3 (P
0,{x
i
0}) f
3 0L
φ3 (P,{x
i})P
φ3 (P0,{x
i
0})P
0 2.32
where {xi
0} is the set of mole fractions at the reference pressure. The fugacity of the
solid at pressure P was given by:
f3 S = f
3 0S
exp
⌡⌠
P0
P
υ3
S
RT dP 2.33
where υ3
S is the solid molar volume. By inserting Equations 2.32 and 2.33 into 2.31 the
following expression was obtained:
f3 0S
exp
⌡⌠
P0
P
υ3
S
RT dP = x
3γ
3 (P
0,{x
i
0}) f
3 0L
φ3 (P,{x
i})P
φ3 (P0,{x
i
0})P
0 2.34
The assumptions that the solid phase contained pure solute and that the mole fraction of
solute in the gas phase was negligible were made using this model. The latter
assumption reduces 2.26 to zero and only Equations 2.22, 2.23 and 2.34 are solved to
calculate the phase behaviour of the ternary system. Good correlations between the
calculated and experimental data were obtained at 25°C and pressures up to 7 MPa
using only binary interaction parameters. 38

CHAPTER 2
47
Another description of the solid—liquid equilibrium has been given by Kikic and co-
workers.11,22 The assumption was made that the solid phase is pure and the equilibrium
equation for the solute between the solid and liquid phases was given by:
f3 0S
= x3 φ L 3 P 2.35
The fugacity of the solid state was calculated using an equation developed by Prausnitz
and co-workers39 which relates the solid state to a fictitious liquid state. The equation is
strictly valid at the triple point pressure of the solute and is of the following form:
ln f
3 0S
f3 0L =
∆h3 f
RT3 f
1 - T
3 f
T 2.36
where f3 0S
and f3 0L
are the fugacities of the solute in the solid and subcooled liquid phase
and ∆h3 f and T
3 f are the heat of fusion and the melting temperature of the solute. The
effect of pressure on the fugacities is taken into account using the following two
expressions:
f3 0S
= f3
0S(T,P0) exp
⌡⌠
P0
P
υ3 0S
RT dP 2.37
f3 0L
= f3 0L
(T,P0) exp⌡⌠
P0
P
υ3
0L
RT dP 2.38
The ratio of Equations 2.37 and 2.38 gives:
f
3 0S
f3 0L =
f3 0S
f3 0L (T,P0) exp
⌡⌠
P0
P
υ3
0S - υ
3 0L
RT dP 2.39

CHAPTER 2
48
Inserting Equation 2.36 into Equation 2.39 gives:
f3 0S
= f3
0L(T,P) exp
⌡⌠
P0
P
υ3 0S
- υ3 0L
RT dP +
∆h3 f
RT3 f
1 - T
3 f
T 2.40
The difference between the solid and liquid molar volumes is usually negligible and the
first addendum to the exponential term in Equation 2.40 can be dropped without loss of
accuracy. Good correlation between the experimental and calculated results for the
CO2—toluene—phenanthrene, CO2—toluene—naphthalene and CO2—toluene—β-
carotene were obtained at a temperature of 25 °C and pressures up to 7.0 MPa using this
model.
De la Fuenta and co-workers17 have proposed an alternative equation to calculate the
fugacity of the solid phase. The fugacity of the solid phase was given by:
ln φ3 = ln
PSubl
P —
VT,P
RT ( )P-PSubl 2.41
where TT,P, PT,P and VT,P are the triple point temperature, triple point pressure and molar
volume of the solute at the triple point respectively. PSubl is given by:
PSubl = PT,P exp
∆HSubl
T,P
R
1
TT,P -
1T
2.42
where ∆HSublT,P is the heat of sublimation.
2.3. Crystallisation Theory Considerations
In spite of the fact that the crystallisation of solids is one of the oldest chemical
processes, the process is not fully understood and has been referred to as an art rather

CHAPTER 2
49
than a science.40,41 Part of the reason for this is that crystallisation is a complex
process.42 As a consequence, the theoretical foundations of the crystallisation process
are not well developed and only yield acceptable results when applied to systems that
differ only slightly from ideality.42
Crystallisation from solution can be divided into three processes: supersaturation,
nucleation and crystal growth. The interaction between these processes is important in
determining the particle size and particle size distribution of the precipitate collected
from the crystallisation vessel. The aim of this section is to briefly review the
application of crystallisation theory to the GAS and ASES processes. For a detailed
description of the theoretical and practical aspects of crystallisation the following
references can be used as a starting point.40-42
Supersaturation is often quoted as being the dominant factor that determines the size
and shape of particles in the GAS and ASES processes.8 Conventionally supersaturation
in solutions is achieved by cooling, evaporation of solvent, chemical reaction, or by the
introduction of a second solute. The latter method is often referred to as salting out
precipitation. In the GAS and ASES processes, supersaturation is achieved by the
dissolution of gas anti-solvent into the solution. In such systems pressure, or rate of
diffusion of anti-solvent into the solution, becomes a unique variable that determines the
concentration of anti-solvent.
Expressions that are commonly quoted to express supersaturation in the GAS or ASES
process are the supersaturation ratio :
S = CC* 2.43
and the concentration driving force:
∆C = C - C* 2.44

CHAPTER 2
50
where C is the solution concentration at a certain pressure and C* is the equilibrium
saturation at atmospheric pressure.
The importance of supersaturation in the GAS and ASES process has been qualitatively
demonstrated using equations derived from the thermodynamic approach of Becker and
Doring43,44 and McCabe and Smith45 for the rate of homogenous nucleation.2,7,32,46,47
Equations of the following type have been quoted:
J = Z exp
∆Gmax
RT 2.45
where J is the rate of production of nuclei, Z is the collision frequency and ∆Gmax is the
Gibbs free energy expression. ∆Gmax is given by
∆Gmax = B
(RT lnS)2 2.46
where B is a constant which includes the physical properties of the system, and S is the
supersaturation ratio.
The growth of nuclei from the GAS process has been related to the mass transfer
correlation.2,32,46:
flux of material to the surface = kA ∆C 2.47
where k is the mass transfer co-efficient, A is the surface area of the particle at any
particular instant and ∆C is the concentration driving force at any particular instant
given by the concentration of the solute in the expanded solution minus its equilibrium
concentration.
Equations 2.45, 2.46 and 2.47 have not been used for quantitative purposes with
Equations 2.45 and 2.46 being strictly valid for the homogenous condensation of a
vapour to liquid droplets. However, these Equations have some qualitative value in

CHAPTER 2
51
determining the relevant experimental parameters governing crystal formation in the
GAS and ASES systems.32
Equations 2.45, 2.46 and 2.47 show that the important parameters in the GAS process
that determine particle size and morphology are: initial concentration of the solution,
operating temperature and pressure, rate of creation of supersaturation as determined by
the rate of addition of anti-solvent, maximum level of supersaturation as determined by
the rate of addition of anti-solvent and the growth period determined by the amount of
solute remaining after primary nucleation.
The precipitate characteristics in terms of particle size and size distribution are
determined by the interaction between the nucleation and growth rates and the rate of
creation of supersaturation.2 In the GAS process all three are influenced by the rate of
addition of anti-solvent. The relationship between solution concentration and solvent
expansion is shown in Figure 2.14. The rate of nucleation and growth of precipitate is
also shown in relation to solution expansion. The graph is divided into two regions;
solutions located below the solid line are stable unsaturated solutions (S < 1), and
solutions above the solid line are saturated (S ≥ 1). Saturated solutions may be described
as either metastable, where particle growth dominates (below the dashed line) or
unstable where nucleation is most rapid (above the dashed line), that is the shaded
region in Figure 2.14. The solid line, S = 1, is the binodal curve, at which point
dissolution of a solid occurs when depressurising an expanded solution at an infinitely
slow rate. The dashed line, S = Smax, represents the spinodal curve.
If an anti-solvent is injected into a solution, as in the GAS process, such as that defined
by the point A in Figure 2.14 a, the solution expands and the solvation power of the
solution dramatically decreases. When enough carbon dioxide has been dissolved, the
solution becomes saturated, S =1 (point B). Further expansion causes supersaturation
and in the vicinity of the unstable region (point C), S =Smax, nucleation results. The
critical supersaturation ratio is typically within the range of 2 to 546 and may or may not
correspond with the visual observations of particulate aggregation, called the point of
catastrophic nucleation. It would be expected the injection of a solution into an anti-

CHAPTER 2
52
S = Smax
S = 1D
BA
Solu
tion
Con
cent
ratio
n
Solution Expansion
Supersaturation Ratio
Rat
e
Growth Rate
Nucleation Rate
1 Smax
C
Figure 2.14 The relationship between supersaturation and particle growth.42

CHAPTER 2
53
solvent that is already at pressure, as in the ASES process, would result in an extremely
high rate of expansion. As a result even higher levels of supersaturation would be
expected in the ASES process and have been estimated to be in the order of 2630.47 At
these relatively high values of supersaturation the rate of particle nucleation is rapid
(Figure 2.14). The onset of nucleation forces solute out of solution and the solute
concentration falls back to a slightly supersaturated concentration (point D), close to the
binodal line. As the supersaturation drops the relative rate of nucleation decreases whilst
the particle growth becomes the dominant mechanism. In the case where solvent
expansion is sufficiently rapid to hold the solution saturation in the vicinity of the
unstable region, the nucleation of particles will occur continuously. The precipitate is
therefore polydisperse as each nucleus grows for a different period of time. In practice,
however, the rate of nucleation is so rapid that there is a significant drop in
supersaturation and it is very difficult to maintain supersaturation ratios close to Smax,
even with rapid solution expansion or cooling.
The width of the metastable region is a very important variable in crystallisation, and is
a strong function of the kinetics of the system. A rapid increase in the supersaturation of
a solution leads to a broadening of the metastable region, therefore delaying
precipitation to a higher supersaturation concentration. As nucleation rate is a function
of the supersaturation ratio, this results in more rapid nucleation and the generation of a
greater number of nucleation sites, which grow to a smaller size due to the finite mass
of solute in solution. At a slower rate of supersaturation increase, the precipitate exists
as larger and therefore fewer particles.
Solvent strength and the extent to which the precipitation system is mixed also effect
the width of the metastable region. For strong solvents, or highly concentrated solutions,
the number of molecules in a critically sized stable nucleus decreases and therefore the
metastable region narrows.42 As a result, the frequency of formation of critically sized
aggregates increases. Mixing, or agitation, of a solution again decreases the width of the
metastable zone and therefore the extent to which a solution is supersaturated before
precipitation.

CHAPTER 2
54
A number of saturated solvent—solute systems have been studied in terms of nucleation
and growth when expanded by CO2 at low expansion rates.25 It was discovered that not
all systems behaved the same when pressurised with CO2. The solutes could be divided
into three groups depending on the type of nucleation observed. Some systems
experienced catastrophic nucleation even at very low levels of expansion and others did
not crystallise at all even at high levels of expansion. The majority of the systems
studied underwent both nucleation and growth. Of the solutes studied, most inorganic
solutes precipitated by heterogeneous nucleation and a few by catastrophic nucleation,
metal—organic solutes precipitated by both heterogeneous and catastrophic nucleation
and organic solutes precipitated by heterogeneous nucleation or not at all. Tai and
Cheng have used supersaturation to explain the behaviour of different solutions when
expanded by the GAS process.25,48 A function for supersaturation in the GAS process
was given :
∆C = ⌡⌠
-
∂Ce
∂Cg T,P dCg = ⌡⌠
0
Cg
αdCg 2.48
α = -
∂Ce
∂Cg 2.49
where Ce is the solute solubility in the expansion course and Cg is the concentration of
dissolved anti-solvent on a solute free basis.48 Equation 2.49 was used to explain the
observation that not all solutes are precipitated from solution upon addition of anti-
solvent in the GAS process. The α factor is the change in solute concentration with
dissolution of anti-solvent. For a solution to remain in equilibrium the α factor can be
affected in two ways. The anti-solvent can reduce the dissolving power of the solvent by
decreasing the partial molar volume of the solvent, or the anti-solvent can act as an
additional solvent. A positive value for α implies the solute is insoluble in the anti-
solvent and nucleation and growth will occur. A negative α implies the anti-solvent
behaves as an additional solvent and undersaturation occurs. A large α implies that the
solute is insoluble in anti-solvent and the sensitivity of the solvent—solute dissolving

CHAPTER 2
55
power to the concentration of dissolved anti-solvent is high. At moderate values of α
nucleation and growth will occur.
Berends and co-workers50 adapted Nývlt theory49 to predict the pressure profile needed
to maintain constant supersaturation and growth rate in a batch GAS crystalliser. The
following expression was used:
weq
* (0) - weq* (t)
weq* (0) - weq
* (τ) =
t
τα 2.50
where weq* is the equilibrium solubility of the solute in the liquid phase and is calculated
by Equation 2.30, weq* (0) and weq
* (t) are the equilibrium solubility at time 0 and t
respectively, α is a correction factor and τ is the growth time. The pressure profiles for
unseeded and seeded growth were predicted and the results applied to the crystallisation
of phenanthrene from toluene using CO2 as anti-solvent.
The growth rates of the individual faces of a crystal are affected to different extents by
the supersaturation of the solution. As a consequence, in some cases it is possible to
alter the morphology of the forming crystals by changing the level of supersaturation at
which the crystallisation occurs. As a general rule the morphology of crystals is
disturbed at high levels of supersaturation, while at low levels of supersaturation more
regular crystals are formed due to the decrease in crystal growth rates. The effect of
supersaturation on crystal morphology has been investigated using the GAS process by
Yeo and co-workers.51 The effect of the rate of expansion on the crystal morphology
formed from DMSO solutions of NH4Cl and BaCl2 has been investigated by Yeo and
co-workers.51 It was observed that the rate of expansion altered the crystal morphology
and size. Generally slow expansion conditions produced equant morphologies, while
rapid expansion conditions resulted in needle-like or tabular morphologies which is
consistent with growth rates of individual crystal faces being dependent on
supersaturation.
Tai and Cheng investigated growth of single crystals of a number of solutes from
expanded solutions utilising the GAS process.48 In all cases the solutions were

CHAPTER 2
56
expanded slowly. The observations were that crystals generally undergo facet-growth in
the GAS process as occurs in conventional crystallisation processes. The crystal growth
rates ranged from 0.2 to 1.2 x 10⁻⁷ m.s-1, which was in the same order as growth rates in
aqueous solutions. The conclusions reached from the study were that crystal growth, at
conditions of slow expansion, in the GAS process is similar to that observed in
conventional processes of solution crystallisation.
2.4. Hydrodynamic Considerations
Hydrodynamic considerations in the dense gas precipitation of solutes has been
associated mainly with the ASES process. When a solution is injected into an anti-
solvent through a capillary, hydrodynamic forces act on the jet produced and tend to
cause the liquid jet to breakup. The breakup of the liquid stream occurs as a result of
shear, surface tension, and viscosity forces created by rapid expansion of a liquid stream
in a fluid. For low viscosity solutions the Weber number (NWe) indicates the extent of
break-up of a liquid droplet emerging from a nozzle into a flowing fluid. The Weber
number is the ratio of the deforming external pressure forces to the reforming surface
tension forces experienced by a liquid droplet.52 It is numerically defined by the
following equation:
NWe = ρU2D
σ 2.51
where ρ is the anti-solvent density, U the relative velocity, D the droplet diameter, and
σ is the interfacial tension. When external pressure forces are large compared to the
surface tension forces, NWe is large, causing jet breakup into droplets.
Large Weber numbers are expected in the ASES process compared to conventional
techniques such as spray drying and liquid anti-solvent processes. In the ASES process,
a number of contributing processes aid in breakup of the liquid jet into fine droplets.
Small values of interfacial tension, high anti-solvent density, and large mass transfer
driving forces are all expected to aid in jet breakup.
CHAPTER 2
57
The jet breakup length for Newtonian fluids can be related to jet velocity and viscosity
through the Weber and Reynolds numbers. An example of such an expression is:
Ld
= C NWe (1+3Z) 2.52
where L is the jet breakup length, d is the jet diameter, and C is a constant. The
Ohnesorge number Z is defined as follows:
Z = NWe
NRe =
µ
ρdσ 2.53
where µ is the jet viscosity, d is the jet diameter and NRe is the Reynolds number. Z
relates viscosity to surface tension forces. Jet breakup by atomisation will occur when Z
and NRe are large and by Rayleigh instabilities when Z and NRe have lower values.
Lengsfeld and co-workers23 proposed that when a dilute organic solvent is injected into
an anti-solvent in which the solvent is totally miscible (above the critical point of the
mixture), jet breakup does not proceed as described by conventional atomisation theory.
The formation of droplets is negated by the rapid disappearance of surface tension as the
solvent is sprayed into the anti-solvent. Dispersion of the jet then proceeds by means of
gas-like mixing. The basis of this proposition is that surface tension disappears before
the time scale of jet breakup. To test this hypothesis a model was developed based on
the modified Weber theory for jet breakup, which included time dependent surface
tension. The calculated jet breakup length was compared to the experimentally
measured jet breakup lengths. The results indicated that for partially miscible systems
the model could predict the experimentally observed jet breakup lengths reasonably
well when using dynamic surface tension. When the model was applied to totally
miscible systems, it was found that at conditions in the two phase region, the predicted
and observed jet breakup lengths were once again in agreement. In the single phase
region, the calculated jet breakup length was far shorter than the visually observed jet
breakup length. Both these lengths were far greater than the calculated length for the
disappearance of surface tension. The conclusion reached from the analyses was that the

CHAPTER 2
58
observed jet breakup in the single phase region was not a phase boundary, but a Kelvin-
Helmholtz instability driven by a density and velocity jump. These conclusions were
supported by the observation that the same jet shape was observed when injecting
supercritical trifluromethane into supercritical CO2.
For highly viscous solutions, jet breakup is more complex. Changing solution viscosity
or interfacial tension, affects jet breakup with increased viscosity stabilising the jet, and
increased interfacial tension destabilising the jet. The following function has been
proposed to predict jet breakup lengths for highly viscous solutions.53
λ ~ 13
v2ρa3
σ 2.54
where λ is the wavelength, v is the kinematic viscosity, ρ is the solution density, a is the
jet radius and σ is the interfacial tension. Equation 2.54 does not consider any
viscoelastic effects but it is thought to be useful in predicting jet breakup lengths for
highly viscous solutions in vapour over liquid ASES systems.53
2.5. Mass Transfer Considerations
As with hydrodynamic considerations, the discussion of mass transfer in the literature
has mainly dealt with the ASES process. When a solution is injected into a bulk anti-
solvent, mass transfer can occur in two directions. The anti-solvent can diffuse into the
liquid solution and the solvent can diffuse into the bulk anti-solvent.
A spray drying model has been used to describe the mass transfer processes occurring
on a methylene chloride droplet containing dissolved poly(L-lactic acid) in compressed
CO2.54 At pressures of 85 bar and temperatures of 29 °C, the flying time of the droplets
was found to be shorter than the time taken for the droplets to dry. The mass transfer
was found to be a function of droplet size with larger droplets taking longer to dry. The
conclusions reached from this study were that the required flying time of droplets is an
important consideration and should be considered in crystalliser design, and that the
growth of particles, rather than nucleation, was the dominant process.

CHAPTER 2
59
Another model has been developed to describe the mass transfer processes occurring on
a droplet that forms when injecting toluene into CO2.55 A 50 µm droplet was chosen as
a starting point and the initial interfacial flux, droplet radius, and droplet saturation were
calculated at various pressures and temperatures below the mixture critical point.
Calculations were performed to determine the initial interfacial flux, the droplet radius
with respect to time, and the composition of the droplet with respect to time. The results
showed that the initial net mass transfer was always into the droplet, which caused the
droplet to swell. The extent of swelling was a function of pressure and temperature with
the droplets undergoing a four-fold increase in size at certain conditions. The time to
reach maximum size was less than 0.3 seconds. Droplet lifetimes were found to vary
with pressure and temperature with shorter lifetimes at high values of pressure and low
values of temperature. The lifetimes of the droplets were between 1 and 2.5 seconds.
The composition of the droplet did not follow the same trend as the lifetime of the
droplet. Droplets that had longer lifetimes were found to saturate relatively early while
droplets with short lifetimes were found to saturate relatively late. The implications of
this last result are that, depending on the conditions, a droplet could saturate at a stage
when it was still larger than its initial size, an important consideration when forming
fine particles.
A number of researches have described the time for mass transfer to occur for a given
droplet radius. For example the time scale for diffusion loss of toluene from spherical
droplets can be given by:
t½ ~ 0.02182a2
D 2.55
where t½ is the time taken to lose half of the toluene from the droplet and D is the
diffusivity of toluene at the conditions in question.53,56 By assuming a diffusivity of 10-
5 cm2.s-1 the time for half the toluene to diffuse out of the droplet can be estimated for a
given droplet radius. For a droplet of 0.5 µm a half time of 10-6 s can be calculated. For
a droplet of 10 µm the half time is of approximately 4 x 10⁻⁴ s and for a droplet of 330
µm the half time is 0.6 s.
CHAPTER 2
60
For a droplet of solvent in vapour phase CO2 the diffusion of solvent into the vapour
phase is very low. The mass transfer of CO2 into such a droplet can be estimated using
the following equation57,58:
XCO2,tXCO2,∞
= 6d
Dtπ 2.56
where D is the diffusion co-efficient of CO2 into the liquid phase, d is the droplet
diameter, XCO2,t .and XCO2,∞ are the CO2 concentrations inside the droplets at time t and
at equilibrium respectively. The equation is strictly valid for short times only. For D = 2
x 10-9 m2.s-1 and d = 35 µm the time required for 90% dissolution into the droplet is 40
ms.
The mass transfer pathways in regards to polymer solution have been used to interpret
the morphology of the precipitates produced. Possible mass transfer pathways for a
polymer solution being injected into a compressed anti-solvent are depicted in Figure
2.15. Each pathway can be thought of as a change in composition with time at a certain
location in the liquid solution, or at a particular time the change in composition from the
center of the liquid solution phase to the interface.59 Two boundary curves which mark
the transitions from binodal to spinodal behaviour converge at the plait point (C*). The
region between the solvent—polymer axis and the binodal curve is the stable region. In
this region no precipitation will occur. The area between the binodal and spinodal curve
is the metastable region in which precipitation primarily occurs by nucleation and
growth. The area between the spinodal and anti-solvent axis is an unstable region where
precipitation occurs by spinodal decomposition. The concentration of the polymer
solution will determine where the mass transfer path crosses the binodal and spinodal
curves and ultimately determine the morphology of the polymer particles. On the
solvent side of the plait point in the metastable region polymer discrete domains
nucleate and grow in a solvent continuous phase. On the polymer side of the plait point,
solvent voids will nucleate and grow in a polymer rich phase forming fibres. Near the
plait point the distance to the binodal curve is short and the binodal and spinodal curves

CHAPTER 2
61
A
A’
B’
B
CD
C’
D’
Polymer
AntisolventSolvent
GlassyRegion
C*
Figure 2.15 Ternary phase diagram showing different polymer precipitation
schemes for the ASES process.10,53,59

CHAPTER 2
62
are close together. Phase separation will occur primarily by spinodal decomposition
which is characterised by the presence of bicontinuous phases, often with fine
structure.59 The spinodal curve can be crossed at any concentration but is most likely at
the plait point. The closer the end point of the mass transfer path is to the anti-solvent
vertex, the greater the number of voids in the polymer.10 The transition from discrete to
continuous polymer morphologies is thought to occur at approximately 3C*.13,60
CHAPTER 2
63
2.6. References
1. Hannay, B. J.; Hogarth, J.; ""On The Solubility Of Solids In Gases."," Proc. Roy.
Soc. 1879, 324.
2. Gallagher, P. M.; Coffey, M. P.; Krukonis, V. J.; Klasutis, N.; Gas Anti-Solvent
Recrystallization: New Process To Recrystallize Compounds Insoluble in
Supercritical Fluids; Johnston, K. P. and Penninger, J. M. L., Ed.; American
Chemical Society: Washington, DC, 1989; 406, 334.
3. Subramaniam, B.; Rajewski, R. A.; Snavely, K.; "Pharamaceutical Processing with
Supercritical Carbon Dioxide," J. Pharm. Sci. 1997, 86, 885.
4. Subra, P.; Jestin, P.; "Powders Elaboration in Supercritical Media: Comparison with
Conventional Routes," Powder Technol. 1999, 103, 2.
5. Palakodaty, S.; York, P.; "Phase Behavioral Effects on Particle Formation Processes
Using Supercritical Fluids," Pharm. Res. 1999, 16, 976.
6. Jarzebski, A. B.; Malinowski, J. J.; "Potentials and Prospects for Application of
Supercritical Fluid Technology in Bioprocessing," Process Biochem. (Oxford) 1995,
30, 343.
7. Bungert, B.; Sadowski, G.; Arlt, W.; "New Processes With Compressed Gases,"
Chem. Ing. Tech. 1997, 69, 298.
8. Bungert, B.; Sadowski, G.; Arlt, W.; "Separations And Material Processing In
Solutions With Dense Gases," Ind. Eng. Chem. Res. 1998, 37, 3208.
9. Reverchon, E.; "Supercritical Anti-Solvent Precipitation of Micro- and Nano-
Particles," J. Supercrit. Fluids 1999, 15, 1.
10. Dixon, D. J.; Johnston, K. P.; "Formation of Microporous Polymer Fibers and
Oriented Fibrils by Precipitation with a Compressed Fluid Anti-Solvent," J. Appl.
Polym. Sci. 1993, 50, 1929.
11. Kikic, I.; Bertucco, A.; Lora, M.; "A Thermodynamic Description Of Systems
Involved In Supercritical Anti-Solvent Processes," The 4th International Symposium
on Supercritical Fluids, Sendai, Japan, 1997, A, 39.
12. York, P.; Hanna, M.; "Particle Engineering by Supercritical Fluid Technologies for
Powder Inhalation Drug Delivery," Respiratory Drug Delivery, 1996; Vol. V, 231.
13. Mawson, S.; Kanakia, S.; Johnston, K. P.; "Metastable Polymer Blends by
Precipitation with a Compressed Fluid Anti-Solvent," Polymer 1997, 38, 2957.

CHAPTER 2
64
14. McHugh, M. A.; Krukonis, V. J.; "Supercritical Fluid Extraction," ; Butterworth:
Stoneham, MA, 1986.
15. Ng, H.J.; Robinson, D. B.; "Equlibrium Phase Properties of the Toluene-Carbon
Dioxide System," J. Chem. Eng. Data 1978, 23, 325.
16. Kordikowski, A.; Schenk, A. P.; Van Nielen, R. M.; Peters, C. J.; "Volume
Expansions and Vapor-Liquid Equilibria of Binary Mixtures of a Variety of Polar
Solvents and Certain Near-Critical Solvents," J. Supercrit. Fluids 1995, 8, 205.
17. de la Fuenta Badilla, J. C.; Peters, C. J.; de Swaan Arons, J.; "Volume Expansion in
Relation to the Gas-Anti-Solvent Process," J. Supercrit. Fluids 2000, 17, 13.
18. Peters, C. J.; Kordikowski, A.; Wilmes, B.; "Phase Behaviour of Selected Systems
of Interest for the GAS Process," Proceedings of the 5th International Symposium on
Supercritical Fluids, Atlanta, Georgia, 2000.
19. Nesta, D. P.; Elliott, J. S.; Warr, J. P.; "Supercritical Fluid Precipitation of
Recombinant Human Immunoglobulin from Aqueous Solutions," Biotechnol.
Bioeng. 2000, 67, 457.
20. Palakodaty, S.; York, P.; Pritchard, J.; "Supercritical Fluid Processing of Materials
from Aqueous Solutions: The Application of SEDS to Lactose as a Model
Substance," Pharm. Res. 1998, 15, 1835.
21. Thiering, R.; Dehghani, F.; Dillow, A.; Foster, N. R.; "Solvent Effects On The
Controlled Dense Gas Precipitation Of Model Proteins," J. Chem. Technol.
Biotechnol. 2000, 75, 29.
22. Kikic, I.; Lora, M.; Bertucco, A.; "A Thermodynamic Analysis of Three-Phase
Equilibria in Binary and Ternary Systems for Applications in Rapid Expansion of a
Supercritical Solution (RESS), Particles from Gas-Saturated Solutions (PGSS), and
Supercritical Anti-Solvent (SAS)," Ind. Eng. Chem. Res. 1997, 36, 5507.
23. Lengsfeld, C. S.; Delplanque, J. P.; Barocas, V. H.; Randolph, T. W.; "Mechanism
Governing Microparticle Morphology during Precipitation by a Compressed Anti-
Solvent: Atomization vs Nucleation and Growth," J. Phys. Chem. B 2000, 104, 2725.
24. Bertucco, A.; Lora, M.; Kikic, I.; "Fractional Crystallization by Gas Anti-Solvent
Technique: Theory and Experiments," AIChE J. 1998, 44, 2149.
25. Tai, C. Y.; Cheng, C.S.; "Effect of CO2 on Expansion and Supersaturation of
Saturated Solutions," AIChE J. 1998, 44, 989.
CHAPTER 2
65
26. Cannon, C. S.; Falk, R. F.; Randolph, T. W.; "Role of Crystallinity in Retention of
Polymer Particle Morphology in the Presence of Compressed Carbon Dioxide,"
Macromolecules 1999, 32, 1890.
27. Chang, C. J.; Randolph, A. D.; Craft, N. E.; "Separation of β-Carotene Mixtures
Precipitated from Liquid Solvents with High-Pressure Carbon Dioxide," Biotechnol.
Prog. 1991, 7, 275.
28. Bleich, J.; Müller, B.; "Production Of Drug Loaded Microparticles By The Use Of
Supercritical Gases With The Aerosol Solvent Extraction System (ASES) Process,"
J. Mocroencapsulation 1996, 13, 131.
29. Bodmeier, R.; Wang, H.; Dixon, D.; Mawson, S.; Johnston, K.; "Polymeric
Microspheres Prepared By Spraying Into Compressed Carbon Dioxide," Pharm. Res.
1995, 12, 1211.
30. Steckel, H.; Thies, J.; Müller, B.; "Micronising of Steroids for Pulmonary Delivery
by Supercritical Carbon Dioxide," Int. J. Pharm. 1997, 152, 99.
31. Falk, R.; Randolph, T. W.; Meyer, J. D.; Kelly, R. M.; Manning, M. C.; "Controlled
Release of Ionic Compounds from Poly(L-Lactide) Microspheres Produced by
Precipitation with a Compressed Anti-Solvent," J. Controlled Release 1997, 44, 77.
32. Gallagher, P. M.; Krukonis, V.; Botsaris, G. D.; "Gas Anti-Solvent (GAS)
Recrystallization: Application to Particle Design," AIChE Symposioum Series 1991,
87, 96.
33. Falk, R. F.; Randolph, T. W.; "Process Variable Implications for Residual Solvent
Removal and Polymer Morphology in the Formation of Gentamicin-Loaded Poly(L-
Lactide) Microparticles," Pharm. Res. 1998, 15, 1233.
34. Meyer, J. D.; Falk, R. F.; Kelly, R. M.; Shively, J. E.; Withrow, S. J.; Dernell, W.
S.; Kroll, D. J.; Randolph, T. W.; Manning, M. C.; "Preparation and in Vitro
Characterization of Gentamycin-Impregnated Biodegradable Beads Suitable for
Treatment of Osteomyelitis," J. Pharm. Sci. 1998, 87, 1149.
35. Manning, M. C.; Randolph, T. W.; Shefter, E.; Falk, R. F., III; "Solubilization of
Pharmaceutical Substances in an Organic Solvent and Preparation of Pharmaceutical
Powders Using the Same," Us 5770559, 1998.
36. Peng, D.; Robinson, D. B.; "A New Two-Constant Equation of State," Ind. Eng.
Chem., Fundam. 1976, 15, 59.

CHAPTER 2
66
37. Chang, C. J.; Randolph, A. D.; "Solvent expansion and solute solubility predictions
in gas-expanded liquids," AIChE J. 1990, 36, 939.
38. Dixon, D. J.; Johnston, K. P.; "Molecular Thermodynamics of Solubilities in Gas
Anti-Solvent Crystallization," AIChE J. 1991, 37, 1441.
39. Prausnitz, J. M.; Lichtenthaler, R. N.; de Azevedo, E. G.; "Molecular
Thermodynamics of Fluid-Phase Equilibria," ; Prentice-Hall Inc.: Englewood Cliffs,
NJ, 1986.
40. Khamski, E. V.; "Crystallization From Solutions," ; Olenum Publishing
Coorporation: New York, 1970.
41. Mullin, J. W.; "Crystallization," 3Rev. ed.; Butterworth-Heinemann: Oxford, 1997.
42. Nývlt, J.; "Industrial Crystallisation From Solutions," ; Butterworths: London, 1971.
43. Becker, R.; Doring, W.; Ann. Physik 1935, 24, 719.
44. Adamson, A. W.; "Physical Chemistry of Surfaces," ; Interscience Publishers:
Easton, P.A., 1963.
45. McCabe, W. L.; Smith, J. C.; "Unit Operations of Chemical Engineering," 3 ed.;
McGraw-Hill: New York, 1976.
46. Gallagher, P. M.; Coffey, M. P.; Krukonis, V. J.; Hillstrom, W. W.; "Gas Anti-
Solvent Recrystallization of RDX: Formation of Ultra-Fine Particles of a Difficult-to-
Comminute Explosive," J. Supercrit. Fluids 1992, 5, 130.
47. Schmitt, W. J.; Salada, M. C.; Shook, G. G.; Speaker, S. M., III; "Finely-Divided
Powders by Carrier Solution Injection into a Near or Supercritical Fluid," AIChE J.
1995, 41, 2476.
48. Tai, C. Y.; Cheng, C.-S.; "Supersaturation and Crystal Growth in Gas Anti-Solvent
Crystallization," J. Cryst. Growth 1998, 183, 622.
49. Nývlt, J.; "Batch Crystalliser Design," Advances in Industrial Crystallization, ;
Garside, J., Davey, R. J. and Jones, A. G., Ed.; Butterworth-Heineman Ltd: Oxford,
1991.
50. Berends, E. M.; Bruinsma, O. S. L.; de Graauw, J.; van Rosmalen, G. M.;
"Crystallization of Phenanthrene from Toluene with Carbon Dioxide by the GAS
Process," AIChE J. 1996, 42, 431.
51. Yeo, S.; Choi, J.; Lee, T.; "Crystal Formation of BaCl2 and NH4Cl Using a
Supercritical Fluid Anti-Solvent," Proceedings of the 5th International Symposium
on Supercritical Fluids, Atlanta, Georgia, 2000.
CHAPTER 2
67
52. Lefebvre, A. H.; "Atomization and Sprays," ; Hemisphere: New York, 1989.
53. Dixon, D. J.; Luna-Bárcenas, G.; Johnston, K. P.; "Microcellular Microspheres and
Miroballoons by Precipitation with a Vapour-Liquid Compressed Fluid Anti-
Solvent," Polymer 1994, 35, 3998.
54. Rantakyla, M.; Jantti, M.; Jaarmo, S.; Aaltonen, O.; "Modeling Droplet - Gas
Interaction and Particle Formation in Gas-Anti-Solvent System (GAS)," Proceedings
of the 5th Meeting on Supercritical Fluids, Nice, France, 1998, 333.
55. Werling, J.; Debenedetti, P.; "Numerical Modeling of Mass Transfer in the
Supercritical Anti-Solvent Process," J. Supercrit. Fluids 1999, 16, 167.
56. Crank, J.; "The Mathematics of Diffusion," 2nd ed.; Oxford University Press:
London, 1975.
57. Mugele, R. A.; AIChE J. 1960, 6, 3.
58. Wubbolts, F.; Bruinsma, O.; van Rosmalen, G.; "Dry-Spraying of Ascorbic Acid or
Acetaminophen Solutions with Supercritical Carbon Dioxide," J. Cryst. Growth
1999, 198/199, 767.
59. Dixon, D. J.; Johnston, K. P.; Bodmeier, R. A.; "Polymeric Materials Formed by
Precipitation with a Compressed Fluid Anti-Solvent," AIChE J. 1993, 39, 127.
60. Luna-Bárcenas, G.; Kanakia, S. K.; Sanchez, I. C.; Johnston, K. P.; "Semicrystalline
Microfibrils and Hollow Fibers by Precipitation with a Compressed-Fluid Anti-
Solvent," Polymer 1995, 36, 3173.

CHAPTER 3
68
3. DENSE GASES AS ANTI-SOLVENTS — APPLICATIONS
3.1. Introduction
The reasons for applying the GAS or ASES processes to a substance can be to alter its
morphology, change its particle size or particle size distribution, fractionate it from a
mixture, precipitate solutes simultaneously to form a blend, or a combination of the
above reasons.
The potential benefits of the GAS process have been shown to have application in the
crystallisation of drugs, polymers, explosives, purification of organic acids and in the
fractionation and purification of polymers such as polymeric absorbents. An up to date
summary of all work investigating the GAS process is presented in Appendix I, Table
I.1.
The ASES process was first developed by Müller and coworkers as an alternative
microencapsulation technique for the formation of polymeric microparticle drug
delivery systems.1 Since then the process has been extended to the encapsulation of
pharmaceuticals.2-5 In addition, the ASES process has been employed for the
micronisation or recrystallisation of a wide range of compounds including
superconductor precursors6, pigments7, and for the micronisation of fine
pharmaceuticals such as proteins for aerosol drug delivery systems.8-11 The process is
also capable of precipitating polymeric fibres12 and metastable polymer blends13 and
fractionating solute mixtures.14 A summary of the research in the area of ASES
precipitation is presented in Appendix I, Table I.2.
3.2. Micronisation/Recrystallisation
Micronised precipitates are a requirement of many applications. Micronised powders
are required for use as explosives, chromatography, absorbents and catalyst supports,
dyes, catalysts, and superconductors. The most common reason quoted for applying the
ASES or GAS process as a micronisation technique is to micronise compounds for use

CHAPTER 3
69
in the pharmaceutical industry. In view of this, the application of micronisation in the
pharmaceutical industry and current methods of micronisation will be briefly discussed
before the use of GAS and ASES as a micronisation technique is reviewed.
The fact that two formulations of a specific drug meet certain chemical or physical
criteria does not necessarily mean that they are equivalent in their biological activity.15
Two drug formulations that are chemically equivalent may differ in their bioavailability
due to differences in physical factors such as crystal form and particle size.15 The
implication is that physical differences in a particular drug, a result of limitations in the
manufacturing process, can have consequences in the therapeutic activity of the drug.
The physical properties of the drug (such as particle size and particle size distribution)
can have significant implications depending on the method of drug delivery. The strive
towards improvements in drug therapy often focuses on the discovery of new drugs with
the delivery system used in the application of the drug receiving less attention.16
However, innovative drug delivery systems are needed to keep up with drug discovery
technologies and are an essential aspect of future innovation and growth.16,17 Drug
delivery development is an exciting avenue of research that at present the larger
pharmaceutical companies have not addressed.16 New drug delivery systems can help
cope with cost containment in healthcare, reduce adverse effects, improve patient
compliance, shorten the drug development time and extend the life of products with
expiring patents.17
There are many methods of delivering a drug to a patient. The task of the
pharmaceutical researcher is to discover the most appropriate method of delivering the
desired drug to achieve the most beneficial therapeutic activity with the least discomfort
to the patient. Often the latter two requirements are difficult to achieve simultaneously
and can pose a considerable challenge in drug development. For instance, the delivery
of vaccines is routinely performed by injection due to gastrointestinal destruction when
administered orally.18 Oral delivery is preferred due to the advantages of ease of
delivery, patient comfort , ease of administration, improved safety and less stringent
quality control.18 The challenge then becomes one of developing a delivery system for
vaccines that enables oral administration while maintaining therapeutic activity.

CHAPTER 3
70
The micronisation of pharmaceuticals is frequently utilised in the development of
advanced drug delivery systems17 and it is current trends in these systems that will be
discussed below.
3.2.1. Applications of Micronised Pharmaceuticals
The aim of micronising a pharmaceutical is to enhance bioavailability, increase the rate
of action, target delivery, give a predictable therapeutic response and provide greater
efficacy/safety.17 Micronised pharmaceuticals have found application in various
delivery systems including inhalation aerosols, injectable suspensions, controlled
release dosage forms and topical applications.19 The aim of this discussion is not to
provide a thorough review of the applications of micronised pharmaceuticals, but to
demonstrate and give examples of the usefulness of micronisation in advanced drug
delivery systems.
3.2.1.1. Increased Bioavailability
For a drug to be of use it has to be absorbed by the body. The absorption of a drug
involves its passage across cell membranes with the plasma membrane being the
common barrier to all drugs. The characteristics of a drug that determine its ability to
cross cell membranes are its molecular size and shape, solubility at the site of
absorption, degree of ionisation and relative lipid solubility of its ionised and
nonionised forms.15 The barriers to the absorption of a drug may be a single layer of
cells such as the intestinal epithelium or multiple layers of cells such as the skin.
Solubility is one of the important considerations in the absorption of drugs. Generally
drugs given in aqueous solution are more readily absorbed than those given in oily
solution, suspension, or solid form because they mix more readily with the aqueous
phase at the absorptive site.15

CHAPTER 3
71
The solubility of poorly water soluble drugs may be enhanced by micronisation. The
rate of dissolution of the micronised drug increases due to a larger surface area being
available to the dissolution medium. The increase in dissolution rate for micronised
pharmaceuticals has been translated to increased rate of absorption, level of absorption
and activity of the drug when administered orally.20-23 The enhanced bioavailability of
a drug as a consequence of micronisation may enable the use of a lower therapeutic
dose whilst maintaining the same level of activity. Reducing the required dose of drug
translates to the benefits of less chance of toxic side effects and a commercial saving in
terms of drug usage.
3.2.1.2. Intravenous Delivery
Ideally an intravenous drug formula is water based. In many instances drugs are
insufficiently soluble in water to enable an effective dose to be delivered intravenously.
A method of enabling the intravenous delivery of water insoluble drugs is to deliver
them as aqueous suspensions with drug particle sizes less than 5 µm.24 The upper limit
on particle size is 5 µm to avoid capillary blockage.
3.2.1.3. Oral Delivery
The application of micronised drugs in oral delivery systems is not limited to increased
bioavailability through increased dissolution. If the drug in question is unstable when
administered orally due to gastro-intestinal destruction, it is possible to administer the
drug orally by using a microparticulate carrier to protect the drug until it is absorbed as
a microparticle through the gastro-intestinal tract. The drug is then released after
absorption of the microparticle in an environment that does not destroy the drug.
Examples of this are illustrated in a number of recent reviews on the oral delivery of
peptides, proteins and vaccines.18,25-31
Microparticles are thought to be absorbed through the region of the gut-associated
lymphoid tissue known as Peyers Patches.18,25,26,29 It is generally accepted that particle
size is a key factor that determines uptake.18 Particles in the 0.05 to 3 µm size range are

CHAPTER 3
72
capable of uptake and decreasing particle size increases the extent of uptake.18 Particles
greater than 10 µm are not taken up and pass through the body.18,25
3.2.1.4. Inhalation Delivery
The respiratory system is an attractive delivery route due to the large surface area of the
alveolar region (50 to 100 m2) for absorption.15 Furthermore the rate of blood flow is
high and the blood is in close proximity to the alveolar air (10 µm).15 Advantages with
drug delivery to the lung as opposed to other routes include, almost instantaneous
absorption of drug into the blood, avoidance of hepatic first-pass loss and, in the case of
pulmonary disease, local application.15 Inhalation of a drug is also less invasive than
other delivery routes such as injection thereby increasing patient compliance to
treatment.
Inhalation delivery is not only applicable to the delivery of drugs that treat asthma or
chronic obstructive pulmonary diseases, such as peptides, proteins and hormones, but
can be used for the delivery of narcotics, ACE-inhibitors, insulin, calcitonin, heparin, α-
1 antitrypsin, interferon, FSH, vaccines and gene therapy.17
For effective adsorption of a drug after inhalation, it has to reach the alveolar zone of
the lung. In the past, pressurised metered dose aerosols have been the most common
form for inhalation but dry powder inhalation is gaining increased importance.17 In the
case of the inhalation of suspensions and powders, the particle sizes of the drug should
fall into the 1 to 5 µm range to reach the alveolar region.32 Particles larger than 5 µm
are typically deposited in the upper airway where they are expelled through sneezing,
blowing, wiping or carried into the gastrointestinal tract through the swallowing of
mucus.15 Particles that are less than 1 µm remain suspended and are exhaled.33
3.2.1.5. Ocular Delivery
The classic drug delivery system to the eye is the aqueous eye drop.34 Besides the
problem of delivering poorly water soluble drugs to the eye using this mechanism, rapid

CHAPTER 3
73
elimination of the drug occurs due to rapid tear turnover and precorneal loss.34 The
result is that the half life of drugs applied as aqueous drops to the eye is about 1 to 3
minutes and only 1 to 3% of the drug is absorbed through the intraocular tissue.34
Furthermore the possibility of systematic drug exposure due to nasolacrimal duct
drainage can lead to unwanted side effects and toxicity.34,35
Alternatives to the aqueous eye drop are drug formulations that involve ointments or
large inserts. These delivery systems suffer the disadvantages of patient discomfort
through blurred vision or difficulty in application.
Two alternative ocular drug delivery formulations are nano- and micro- particulates.35
The drug is combined with a polymer carrier as a nano- or micro- particle and a
suspension of these particles are administered to the eye in much the same way as the
aqueous eye drop. Upon application the particles reside in the occular cul-de-sac, and
the drug is released through diffusion, chemical reaction or polymer degradation.35 To
prevent discomfort the particle sizes should not exceed 10 µm.34 Upon administration
the particulate formulation has a longer residence time in the eye as it is not removed as
easily as aqueous formulations by the action of tears.
Of all the ocular delivery systems, microparticulate technology is the most promising as
it has the advantage of improved patient compliance because the microparticles can be
topically administered as an eye drop.35 To date only one microparticulate product,
Betopic S, has been released on the US market.35 The limitation to forming
microparticulate drug systems for ocular drug delivery is the difficulty and expense of
manufacture of sterile drug-polymer particles.35
3.2.1.6. Nasal Delivery
The nose is an attractive drug delivery route because of the convenience of application
and the ability of the nasal mucosa to absorb various drugs.36 The administration of (20
to 45 µm) microparticulate particles of insulin encapsulated with various resins via the
nasal route of rabbits has been found to result in the effective absorption of insulin into

CHAPTER 3
74
the blood stream.36 Encapsulation of the drug was necessary as polar drugs such as
insulin are not well absorbed by the nasal mucosa.
3.2.1.7. Drug Delivery to the Central Nervous System
Drug delivery to the central nervous system poses a problem due to the exclusion of
many drugs from blood transfer to the brain owing to the negligible permeability of the
brain capillary endothelial wall, which makes up the blood brain barrier. Strategies that
have been used to transfer drugs to the brain include osmotic disruption of the blood
brain barrier, infusion pumps delivering drugs to the cerebrospinal fluid, intravenous
injection of surfactant coated nanoparticles, implantation of tissues or cells and gene
therapy.37 The newest strategies involve drug delivery polymeric devices which are
inserted into the target area by invasive surgery after which the drug is slowly released
from the polymer to the surrounding area.37 Another strategy of drug delivery to the
brain involves the formation of encapsulated microparticles of the drug.37 A suspension
of these microparticles is then delivered to the precise target area by stereotaxy which is
far less invasive than open surgery.
3.2.2. Methods of Micronising Pharmaceuticals
In the formulation of suspensions for intravenous delivery or dry powders for
inhalation, particle size determines the effectiveness of the drug. It is therefore
important in the micronising of pharmaceuticals that the process be predictable and
reproducible.
As a unit operation, the theory of size reduction has focused on energy relationships,
equipment and grinding limits.38-40 In terms of pharmaceuticals, the compounds to be
micronised are often costly, sensitive and unstable and the application of grinding
technologies from other industries is not suitable.19 The availability of equipment
designed specifically for the pharmaceutical industry is, however, lacking and often the
pharmaceutical industry has no choice but to adopt these unsuitable technologies. Some

CHAPTER 3
75
of the more common micronising techniques that have been adopted by the
pharmaceutical industry are listed in Table 3.1.
Table 3.1 Conventional methods of micronisation.19,41,42
Method Size Distribution
(µm)
Disadvantages
Fluid Energy Mill 1-5 High energy input, temperature increase,
electrostatic charging.
Spray Drying ∼ 5 Operation above ambient temperature.
Lyophilisation < 1 Poor control over size distribution, energy
intensive.
Solution
Preparation
< 1 Poor control over size distribution, solvent
recovery.
Freeze Drying Applicable to only a few substances.
More recently Rapid Expansion of Supercritical Solution (RESS) and Precipitation
from Gas Saturated Solution (PGSS) technologies based on the use of supercritical
fluids have been developed for use in the micronising of pharmaceuticals. These
technologies were developed to enable the micronising of pharmaceuticals at low
temperatures using non-toxic solvents such as supercritical CO2.
The RESS process involves dissolving the solute of interest in a supercritical fluid and then rapidly (< 10-6 s) depressurising the solution. Very high levels of supersaturation can result thereby precipitating the solute as a fine precipitate. The very rapid
depressurisation and high supersaturation ratios are expected to provide uniform conditions of nucleation and therefore narrow particle size distributions and small
particle sizes respectively.43 The RESS process offers a number of advantages over
conventional micronisation methods such as grinding or precipitation from solution. Solids which are sensitive to shock, thermal degradation, or chemical degradation from exposure to the atmosphere can be micronised by RESS which takes place at mild
operating conditions in an inert atmosphere of supercritical solvent. The precipitate and supercritical solvent are also conveniently separated during the decompression stage,

CHAPTER 3
76
unlike a conventional precipitation from solution which requires a solvent removal step.
The process has been demonstrated to be suitable for the micronisation of polymers44,
dyes45, pharmaceuticals46 and inorganic substances.47 A significant disadvantage of the RESS process however is the limited solubility of most pharmaceuticals in supercritical
fluids such as CO2. The low solubility in many cases makes the RESS process unsuitable as a micronisation technique due to the very high gas to solute ratios.
The PGSS process is similar to the RESS process but in this case a compressed gas such
as CO2 is dissolved under pressure in a melted solid.48-50 The solution so formed is then rapidly expanded to a lower pressure through a nozzle and the evaporation of the
compressed medium lowers the temperature below that of the solidification temperature of the solute. Micronised solid particles are formed during the spray process. The advantages of PGSS are much the same as those for RESS with the additional
advantages of lower pressure requirements and lower consumption of gas compared to RESS. As with the RESS process the PGSS process is limited in the substances that can be processed. A requirement is that the solute has a low melting point and that the
compressed gas dissolves in the melt. These conditions are not met by most pharmaceuticals. In terms of the processing of pharmaceuticals there is much scope for the development
of alternative micronisation techniques. Although the techniques described above have been used to process pharmaceuticals, they all suffer from serious drawbacks. The use of compressed gases as anti-solvents is presented in this thesis as an alternative
technique that may enable the processing of a broader range of not only pharmaceuticals but many other chemicals.
Dense gas processing occurs in an inert atmosphere at near ambient temperatures,
without the application of high shear forces (in the case of GAS), which is in contrast to
some of the traditional “high shear” techniques listed above. It is therefore
advantageous to use dense gas precipitation in the processing of thermally, chemically,
or physically unstable material.

CHAPTER 3
77
3.2.3. GAS as a Micronisation/Recrystallisation Technique
In terms of some explosives, the requirement on powders is that the particle size should
be less than 40 µm51 and of a regular morphology.52 These two requirements are
important in terms of the combustion process and sensitivity of the material. The GAS
process has been demonstrated to be an effective tool in the recrystallisation of the
explosives nitroguanidine, cyclotrimethylenetrinitramine and 1,3,5,7-tetranitro-1,3,5,7-
tetraazacyclooctane (HMX),51-55 molecules which are sensitive to thermal and
mechanical stress. It was observed that the size of the particles produced was related to
the rate of the expansion of the solution. Rapid expansion resulted in smaller particles
than slow expansion. The particle size distribution and quality of the precipitate was
superior to the conventional crystallisation precipitate.
The GAS process has been demonstrated as being an effective micronisation technique
for the precipitation of both organic and inorganic materials.56 Cobalt chloride and 2-
hydroxybenzylalcohol (saligenin) were precipitated from acetone using a carbon
dioxide anti-solvent. In the case of saligenin it was discovered that particles formed
were independent of the initial concentration of solution. Monodisperse, irregular
shaped particles were produced in all cases. Slow volumetric expansion of the solution
produced very large particles (1000 µm) whereas faster expansion produced small
particles (20 µm). For cobalt chloride two distinct crystal morphologies, having
different colours, were observed - "purple needles" and "magenta chunks". For rapidly
expanded solutions, small particles were formed with the crystal structure depending on
the initial concentration and temperature. Higher concentration at higher temperature
resulted in a purple precipitate, whilst a lower concentration at room temperature,
resulted in a precipitate that was more pink in colour. Slow expansion produced crystals
only slightly larger than those produced by rapid expansion (100 µm).
Benedetti and co-workers studied the micronisation of hyaluronic acid ethyl ester
(HYAFF-11) by expanding a DMSO polymer solution with carbon dioxide.57 Spheres
with an average size of 0.4 µm and a very narrow size distribution were obtained. These
were smaller by an order of magnitude than the particles obtained from the ASES

CHAPTER 3
78
process. It was found that temperature did not have any effect on the particle
morphology within a range of 35°C to 60°C. The feed concentration was found to have
the largest effect on the particle size distribution. Larger particles that tended to
aggregate formed from dilute solutions. As the solutions became more concentrated,
smaller more discrete particles were formed.
Differing crystal morphologies of a substituted para linked polyamide were formed by
expanding DMSO solutions at different rates with carbon dioxide.58 At a rapid rate of
expansion (2.06 MPa.min-1) a 0.03 (w/w)% solution formed a non-spherulitic
precipitate, whereas at a slow pressurisation (0.08 MPa.min-1) rate a 0.12 (w/w)%
solution resulted in the formation of a spherulitic network of lamellar crystals. This
difference in crystal morphology was attributed to agitation in the expanding solution.
Slow injection of carbon dioxide provides a stable environment for the formation of
crystals. Fast addition of carbon dioxide, on the other hand, provides a turbulent
environment for crystal growth. This leads to particles with a lower crystalline content.
The precipitation of insulin from a carbon dioxide expanded DMSO solution again
showed that expansion rate influences particle size.11
GAS as a micronisation technique was further extended into pharmaceutical
applications by the recrystallisation of a variety of steroidal compounds from acetone
and ethanol using a carbon dioxide anti-solvent..11,59,60 The aim was to produce
particles approximately 10 µm in size for use in respiratory inhalers. Particles of 1 to 2
µm of dexamethasone were produced from acetone and flat platelets were produced
from expanded ethanol solutions.
The GAS process has been applied to the model compounds phenanthrene and
naphthalene to determine the effect of process parameters. The effects of stirrer speed,
different pressurisation profiles and growth times for phenanthrene precipitated from a
toluene and carbon dioxide system have been studied.61 It was discovered that the
average particle size of the phenanthrene crystals could be influenced by a factor of
three (160 to 540 µm) by varying process conditions. Berends and co-workers61 also

CHAPTER 3
79
measured the residual solvent in the product. It was found that the residual solvent
concentration could be reduced to 12 ppm by washing with supercritical carbon dioxide.
The GAS process was found to produce smaller particles of β-Carotene with a narrower
particle size distribution than those obtained from a conventional micronisation
technique.62 Particle sizes in the range from 2 to 10 µm were obtained. The advantages
of low oxygen exposure and rapid recrystallisation were noted to reduce the oxidation
and degradation of the product.
Micron sized particles of bilirubin, a heat labile oxidation medicine, have been produced
using the GAS process.63 Crude bilirubin was dissolved in DMSO and then precipitated
by expanding the solution with supercritical carbon dioxide. Particles of less than 0.5
µm diameter and 1 µm length were obtained.
The size of sulfathiozole crystals could be controlled by varying the expansion rate.64 A
slow stepwise expansion of the sulfathiozole saturated ethanol solutions with CO2
resulted in large pillar like crystals (2 to 6 mm) attached to the walls of the container.
By rapidly expanding the solution similar crystals were obtained that were reduced in
size by two to three times. These also grew on the walls of the container. Using a two
step pressurisation much smaller crystals (45 - 280 µm) precipitated from the bulk
solution and did not grow on the sides of the container. Consequently it was concluded
that the pressure pulse caused homogeneous nucleation and precipitate growth occurred
in the suspension without aggregation. A very high pressure was initially applied to the
system and held until a desired expansion was reached at which time a second
depressurisation step was introduced to hold the solution at that expansion level.
Wubbolts and co-workers observed that the temperature in the precipitation chamber
increased upon pressurisation.65 This increase in temperature was due to the heat of
condensation that occurred when gaseous CO2 condensed into the solvent. The GAS
process was modified slightly by introducing carbon dioxide into the system as a liquid
rather than as a vapour which prevented the temperature increase. The system was first
pressurised with helium before liquid carbon dioxide was introduced at the elevated

CHAPTER 3
80
pressure. Using this pre-pressurisation technique, acetaminophen was recrystallised
from ethanol. Varying the rate of addition of carbon dioxide controlled expansion of the
solution. Crystals with well developed faces with very little agglomeration were formed.
High yields were obtained from concentrated solutions. The particles formed from the
higher concentration solutions were smaller.
Thiering and co-workers studied the effect of various parameters on the precipitation of
para-hydroxybenzoic acid (p-HBA) from methanol, acetone and ethyl acetate solutions
expanded with carbon dioxide at 35°C. The type of solvent used in the process was
found to have the greatest effect on crystal morphology as opposed to changes in rate of
expansion and initial solute concentration. Precipitation of p-HBA from methanol
solutions resulted in 1 - 2 µm spheres, whilst precipitation from acetone and ethyl
acetate caused products up to 3 mm in length to form. This was explained in terms of
the hydrogen bonding that forms in methanol solutions between the methanol and p-
HBA. Greater expansion rates and therefore higher supersaturation are required before
these bonds can be broken and precipitation can occur. The corresponding rapid
nucleation and growth rate resulted in an amorphous precipitate. Changes to the initial
solute concentration of methanol solutions caused changes in particle morphology and
size. Larger particles were formed at higher concentrations. The formation of larger
particles was explained by the fact that there is a greater mass of solute to build upon
the same number of existing nuclei. Changes in the rate of addition of carbon dioxide
also resulted in changes to particle morphology. At slow rates of carbon dioxide
addition, and therefore slow expansion, dendritic shaped needles of up to 1 mm were
formed. At fast addition and therefore high expansion rates, amorphous particles were
produced.
The use of an alternative anti-solvent to CO2 has been demonstrated with the
precipitation of polystyrene from toluene using HFC-134a as anti-solvent.66 A lower
pressure was needed than when using CO2 to precipitate the polymer. In the same
experiments the morphology of the polymer obtained could be varied by changing the
concentration of the initial solution.

CHAPTER 3
81
The micronisation of the proteins lysozyme, insulin, and myoglobin has been
achieved.11,67,68 Monodisperse microspheres with an average diameter of 0.1 to 1.5 µm
were obtained when lysozyme or insulin was precipitated from DMSO with CO2.
Importantly lysozyme showed no loss of biological activity after processing. To develop
a more attractive solvent system, insulin was precipitated from mixtures of water and
ethanol or methanol. Protein particles of 1.5 µm were obtained from water using
ammonia as an anti-solvent.
Solutes that are sparingly soluble in organic solvents such as α-chymotrypsin,
imipramine, insulin, ribonuclease, cytochrome C and pentamidine have been
successfully micronised with the GAS process in combination with the hydrophobic ion
pairing technique to increase the solubility.69 By adding an amphiphilic material such as
sodium dodecyl sulfate or bis-(2-ethylhexyl) sodium sulfosuccinate to the solution the
solubility of the solute can be increased to levels that are practical for GAS processing.
The crystal size and morphology of BaCl2 and NH4Cl were altered by varying the rate
of addition of CO2.70,71 A slow injection rate produced cubic crystals of BaCl2 while a
fast injection rate produced flattened needles. For NH4Cl the cubic shape was also
obtained for slow expansion but a tabular habit was obtained with fast expansion. For
NH4Cl a size reduction from 200 to 1.8 µm was observed with increasing expansion
rate.
3.2.4. ASES as a Micronisation/Recrystallisation Technique
The ASES process has been shown to be able to precipitate particles of a wide range of
sizes and morphologies including nanospheres as small as 0.1 µm72, to porous fibres
averaging 150 µm in size12, microfibrils73 and larger wafer structures.74 Many of the
encouraging results to date are discussed with respect to the types of solutes that have
been precipitated.
The ASES process has been applied to the proteins catalase and insulin.75-77 Catalase
precipitated as 1 µm spherical and rectangular particles whereas insulin formed both

CHAPTER 3
82
aggregated nanospheres and 1 µm thick needles 5 µm in length. The two types of
particles were found in separate areas of the collection filter device.
Yeo and co-workers conducted a more detailed study of the precipitation of insulin from
DMSO and DMFA.11,78 Eighty percent of the powder produced was between 1 µm to 4
µm in diameter. Temperature, solute concentration or the nature of the solvent did not
significantly affect particle size. The biological activity of the insulin powder was also
shown to be unchanged from in vivo studies. Raman spectroscopy further confirmed
these findings.78 Similar results for other proteins such as trypsin and lysozyme were
also recorded.9,10
The micronisation of proteins is a difficult, yet desirable, objective in the
pharmaceutical industry for the development of alternative drug delivery systems such
as inhalation. The low solubility and incompatibility of proteins in organic solvents
provides a challenge when using the ASES technique due to the low solubility of CO2 in
water. Methods that have been used to enable the ASES process to be used as a
micronisation technique for proteins are to either inject a solution of the protein
dissolved in water simultaneously with an organic solvent into CO2, or to inject the
aqueous solution of protein directly into CO2 which has been modified with an organic
solvent. The presence of the organic solvent enables the water to be extracted by the
CO2 and the protein to precipitate. Human immunoglobulin79, lysozyme80,81, albumin,
rhDNase insulin81, trypsin80, a therapeutic peptide, antibody Fv and Fab and Plasmid
DNA pSVβ82 have been processed using this method. Trypsin and human
immunoglobulin were micronised, but were found to lose biological activity on
processing. A more positive result was obtained for lysozyme, albumin and insulin
which produced micro-sized particles which maintained biological activity.
Substantially denaturation of rhDNase occurred during the process.
The ASES technique has also been applied to a number of organic compounds and
pharmaceuticals to determine the feasibility of the process as a micronisation technique.
Naproxen5, prednisolone acetate83, amoxicillin, griseofulvin, ampicillin, tetracycline84-
86, methylprednisilone87, paracetamol88, hydrocortisone, ibuprofen, camptothecin89,90,

CHAPTER 3
83
salmeterol xinafoate91, hydroquinone, acetominophen ascorbic acid92,93 and p-
hydroxybenzoic acid94,95 have all been processed using ASES. The success of the
micronisation has been found to be solute-solvent dependent with some systems such as
griseofulvin - N-methylpyrolidone not precipitating due to solvent-solute interactions.86
A similar result was obtained for the steroids betamethasone-17-valerate, and
beclomethasone-17,21-dipropionate with no precipitate forming on processing by
ASES.96 In some cases particle morphology was found to be solvent dependent.91
Salmeterol xinofoate precipitated from acetone exhibited accretion-forms while those
precipitated from ethanol exhibited a thin blade-like morphology. Generally once the
optimum conditions were found microparticles were produced for most of the
pharmaceuticals studied.
The micronisation of pharmaceuticals that are not normally soluble in organic solvent
suitable for ASES such as streptomycin, has been performed using hydrophobic ion
pairing to increase the solubility of the solute in the organic solvent.69 The homogenous
organic solutions containing the ion paired compound were injected into CO2 through a
sonicated nozzle producing spheroidal 0.4 to 1 µm particles.
A number of polymers have been processed at various conditions using the ASES
process with varying results. Polystyrene formed a wide range of morphologies ranging
from microspheres, to porous fibres and microballoons.12,74,97 Microspheres were
precipitated from a 1 wt% solution of polystyrene in toluene through a 100µm nozzle
and at higher concentrations fibres were precipitated. Microparticles of polystyrene
could be obtained for higher concentrations of polystyrene by injecting the toluene
solution into gaseous HFC-134a instead of CO2.98 When injecting into liquid HFC-134a
chunks of polystyrene were obtained.98 For the semicrystalline polymer
polyacrylonitrile hollow fibres and highly oriented microfirils were produced even at
low concentrations.73,99 Fibre formation was also observed for a polyamide with a rigid
backbone.58
Since the successful development of the ASES process as a micronisation technique for
the production of fine pharmaceuticals, its application has been extended to the

CHAPTER 3
84
precipitation of FDA approved bioerodible polymers as encapsulating agents. These
have included slow-degrading types of high molecular weight such as poly(lactic
acid)57,100-103 and polycaprolactone102 as well as faster degrading copolymers such as
poly(lactide-co-glycolic acid).104
Randolph and co-workers first precipitated L-poly(lactic acid) in 1993 from methylene
chloride solution.100 Sub-micrometer-sized particles were produced using near-critical
or supercritical carbon dioxide as the anti-solvent. Various other authors have since
consistently precipitated L-poly(lactic acid) in the form of discrete microspheres
throughout a broad range of operating conditions and solution concentrations.57,95,101-
103
Bodmeier and co-workers attempted to find polymers that would not agglomerate
during the ASES process.102 A range of biodegradable polymers, including ethyl
cellulose, poly(methyl methylacrylate), poly(E-caprolactone), DL-poly(lactic acid), L-
poly(lactic acid) and DL-poly(lactide-co-glycolic acid) were studied. The amorphous
polymers with a low glass transition temperature were agglomerated even at low
processing temperatures such as –10°C. The formation of discrete microparticles was
favoured at moderate temperatures, low polymer concentrations, high pressures and
high flow rates of carbon dioxide. The semi-crystalline polymer, L-poly(lactic acid),
which has a high glass transition temperature, exhibited negligible plasticisation effects.
L-poly(lactic acid) was found to commonly precipitate as discrete microspheres, the size
of which increased from less than 1 µm up to 5 µm with a temperature increase of 0 to
32°C, which may be due to effects on the system hydrodynamics. At 40°C the
semicrystalline biodegrdable polymers L-poly(lactic acid) and poly(β-hydroxy butyric
acid) formed microspheres when processed by ASES but the amorphous polymers
poly(DL-lactide) and poly(DL-lactide-co-glycolide) were extracted and gave no
precipitate.104
Mawson and co-workers modified the solution injection device by developing a coaxial
nozzle in an attempt to reduce particle agglomeration.105 Polystyrene and L-poly(lactic
acid) particles were precipitated from toluene and methylene chloride respectively. A

CHAPTER 3
85
stabiliser (poly(1,1-dihydroperfluorooctyl acrylate)) was added into the solutions to
further reduce particle flocculation and agglomeration.106,107 The addition of the
stabiliser was found to significantly reduce flocculation.
A study of the ASES processing of a range of biopolymers including dextran, inulin,
poly-L-lactic acid, poly(hydroxypropylmetacrylamide) and poly-hyaluronic acid has
been performed.108,109 Nano- and microparticles were obtained for all polymers tested
with some fiber formation occurring at certain conditions in the processing of poly-
hyaluronic acid. In the same study networked particles of polyvinyl alcohol were
obtained while the polymer poly caprolactone was not precipitated at all. The lack of
precipitation of poly caprolactone was attributed to the high solubility of the polymer in
CO2.
Epoxy resin has been precipitated from acetone and methyl ethyl ketone using the
ASES process.110,111 By comparing particle morphology with and without surfactant,
and with co- and counter-current operation, it was concluded that mass transfer and
hence nucleation and growth rates are more significant than jet break-up in controlling
the particle size distribution.
The very fast precipitation that occurs in the ASES process has been exploited to form a
polymer blend of polycarbonate and poly(styrene-co-acrylonitrile).13 The success of
blend formation was found to be a function of temperature and concentration with
optimum conditions being temperatures below 25°C and concentrations below 3 wt %.
Various other compounds have also been precipitated such as highly uniform
nanospheres of several kinds of pigments,7,112,113 nanoparticles of superconductor
precursors for the textile and electronic industries6,114,115 and various morphologies of
buckminsterfullerene.116 Phospholipids such as soy lecithin have been successfully
micronised by the ASES process for application in the elaboration of liposomes.117,118
Amorphous spherical and agglomerated particles in the range 1 to 40 µm were obtained
when injecting ethanol solution of the phospholipids into CO2. A very promising result

CHAPTER 3
86
from this study was the absence of residual solvent in the processed product which
meant that more toxic solvent could be used in processing.
The ASES process has been demonstrated to be an effective micronisation technique for
a number of hydrophilic compounds such as lactose and sucrose.119-122 The
micronisation was achieved by introducing the solute dissolved in water, an organic
modifier such as methanol and CO2 simultaneously through a multiple channel nozzle.
Extraction of water was possible due to the presence of methanol and the solute
precipitated as microparticles.
The potential of the ASES process was evaluated in terms of scale-up using
acetominophen and lysozyme as model compounds.123 For both solutes the
microparticles produced in the pilot plant were essentially the same as those produced at
lab scale. The biological integrity of lysozyme was also maintained after pilot plant
processing.
3.3. Co-Precipitation/Encapsulation
The formation of co-precipitates or the encapsulation of particles with a second solid is
an important process, especially in relation to the pharmaceutical industry. A successful
encapsulation or co-precipitation does not necessarily have to result in microparticles. In
some applications the formation of microparticles is essential as in the case of inhalation
formulations. The formation of macrostructures of biodegradable polymer such as
hollow fibres or balloons that contain the relevant drug are useful in other applications
such as delayed release where the drug is taken orally.
To date there are no reported studies where the GAS process has been used as an
encapsulation technique. In a fundamental study on co-precipitation it was observed that
as different solutes show different precipitation pressures, from a thermodynamic point
of view, they cannot be precipitated together.124 To obtain the simultaneous
precipitation of two solutes the process must be carried out at kinetically limited

CHAPTER 3
87
conditions. The ASES technique is a very fast precipitation process and as such is
attractive as an encapsulation or co-precipitation process.
3.3.1. ASES as an Encapsulation Technique
At present ASES technology for microencapsulation purposes is still in its early stages
with many areas yet to be explored. Studies to date have involved the simultaneous
precipitation of neat core and coating solute solutions or the precipitation of pre-mixed
solutions with various types of coaxial nozzles. The technique has been applied with
some success and typically some percentage of the microspheres produced are bound up
in a network structure.
The potential of the ASES process for microencapsulation was demonstrated with the
microencapsulation of the model drug, hyoscine butylbromide, with L-poly(lactic acid)
by co-precipitation from a mixture of methanol and methylene chloride.2 In this case a
large percentage of the drug was on the surface of the polymer. Other model drugs,
including indomethacin, piroxicam and thymopentin, have also been co-precipitated
with L-poly(lactic acid) from methylene chloride.3 A maximum drug loading of 19.8 wt
% was obtained with hyoscine butylbromide while a loading of 4.9% was achieved with
thymopentin. The drug loading of the particles was related to the solubility of the drug
in the anti-solvent phase. The more soluble drug, indomethacin, was totally extracted
and was not present in the polymer after processing.
A detailed study on the microencapsulation of compounds with L-poly(lactic acid) from
methylene chloride was published by Falk and co-workers.4,125 The ionic compounds
considered were gentamycin, naloxone, and naltrexone. Drug loading efficiencies of up
to 37.4 wt % were achieved with rifampin/L-poly(lactic acid) particles while others
such as naltrexone/L-PLA were as low as 1.7 wt %. The process was unable to
effectively incorporate highly lipophilic drugs into the polymer particles. Drug release
profiles were also studied. For gentamycin/L-poly(lactic acid) microspheres almost no
burst release was observed and the drug release profile indicated release by matrix-
controlled diffusion.
CHAPTER 3
88
A successful co-precipitation of naproxen and L-poly(lactic acid) from acetone has been
achieved using the ASES process.5 A relatively uniform mixture of the drug and
polymer was obtained.
The potential of ASES to encapsulate proteins has been investigated in an attempt to
encapsulate lysozyme with L-poly(lactic acid) or D,L-poly(lactic-co-glycolic acid) from
a dichloromethane solution.126 As in the pure protein precipitation studies, the
biological integrity and solubility of the protein in a suitable solvent for ASES are
important issues. Initially, a suspension of lysozyme in the polymer solution was
injected into the carbon dioxide anti-solvent present as a vapour to partially solidify the
droplets before they fell into a carbon dioxide liquid phase. The integrity of the polymer
coating or the biological activity of the lysozyme was not investigated. Particle
aggregation, however, was noted to be significantly reduced when operating at a
temperature of -20°C. At this temperature the polymer was sufficiently rigid to prevent
coalescence and the rate of mixing between the carbon dioxide and organic solvent is
still rapid enough to disperse the polymer.
The possibility of forming protein polymer composites has been investigated further
with the formation of micro-capsules of insulin, lysozyme and chimotrypsin with L-
poly(lactic acid).127 Alternative methods to solubilise the protein in the organic solvent-
polymer solution were tried to enable the preparation of a homogenous mixture of the
polymer and protein in an organic solvent. Methods of hydrophobic ion pairing for
chimotrypsin, protein conjugation for insulin and a binary solvent mixture for lysozyme
were investigated. The two former methods did not solubilise the protein enough for an
ASES study and the latter method was used for further investigation. A high protein
yield of over 80% was obtained with the biological activity of insulin being maintained.
The biological activity of lysozyme decreased by 70% during processing. Importantly,
dissolution studies showed that the protein had been encapsulated with slow release of
the protein occurring.

CHAPTER 3
89
Combinations of urea/chloramphenicol and ascorbic acid/paracetamol have been co-
precipitated from ethanol at 40°C and 9.0 MPa using the ASES process.128 The quality
of the products produced each time were not quantified, although problems with particle
agglomeration and fractionation below 8.5 MPa were identified for the co-precipitation
of paracetamol with ascorbic acid.
The need to precipitate multiple solutes, with differing solubilities, in the ASES process
has lead to the development of multiple channel nozzles that enable drug and polymer
solutions to be mixed near, or at the point of contact, with the anti-solvent.95 Using the
coaxial nozzle the co-precipitation of the model drug p-hydroxybenzoic acid with the L-
poly(lactic acid) or L-poly(lactide-co-glycolide) was investigated. The solution of the
drug was injected through the inner nozzle and the polymer through the outer nozzle.
The co-precipitation appeared to be successful when analysed visually.
The effect of polymer crystallinity and thermal behaviour in the encapsulation of two
model drugs albumin and estriolm have been investigated.129 The block copolymers b-
poly-L-lactide-co-D,L-lactide-co-glycolide and poly-D,L-lactide-co-glycolide were co-
precipitated with the model drugs. The two polymers gave the same encapsulation
results, which were that the drug was primarily coated on the surface.
The coating of sugar and glass beads with poly(D,L,-lactide-glycolide) or
hydrocortisone has been achieved by spraying the coating solution into a vessel
containing the beads pre-pressurised with CO2.90 The beads were coated with
microspheres of the polymer or a thin film of the drug.
3.4. Purification/Fractional Crystallisation
Purification and fractional crystallisation using the GAS and ASES processes exploit
the sharp change in solvent power that occurs as a solvent expands. Solutes of differing
solubility will therefore precipitate at different stages of expansion. This separation
process is analogous to conventional liquid phase fractional crystallisation.

CHAPTER 3
90
The main advantage of fractionation with GAS and ASES over conventional techniques
is that the use of organic solvents is minimised and the recovery of a dry product is
more easily attainable.
3.4.1. GAS as a Purification / Fractional Crystallisation Technique
The first reported work using the GAS process for purification was a solubility study of
β-carotene in toluene or n-butanol expanded with CO2.14 The solubility of β-carotene
was found to decrease with increasing pressure (ie. increasing expansion). A binary
phase equilibrium model was used to predict the experimental results. Fractional
crystallisation was investigated by the separation of β-carotene from oxidation products.
Butanol, toluene and cyclohexanone were chosen as solvents due to the differential
solubility of β-carotene and its oxides. The ratio of solids salting out to solids in
solution decreased exponentially as the feed concentration was reduced. The separation
factor also decreased as the amount of β-carotene in the feed increased. Best separation
was obtained under supercritical conditions rather than at subcritical conditions. Using
two consecutive GAS crystallisations β-carotene content was increased from 73.1% to
90.1%. This was an improvement over conventional liquid recrystallisation techniques
that achieved enrichment from 88.7% to 94.5% in a four-stage process.
Liou and Chang studied the separation of anthracene from crude anthracene using
acetone as the solvent and carbon dioxide as the anti-solvent.130 Anthracene was the
least soluble constituent in the crude acetone mixture, also consisting of phenanthrene,
carbazole and naphthalene. Different feed concentrations were used at pressures of 5.2
and 10.3 MPa. The results showed that total yield of precipitated solids increased with
an increasing feed concentration and at increased pressure. The low solubility of
anthracene in acetone implied that it had the highest degree of saturation in the solution.
Supersaturation and precipitation could therefore be achieved at a lower expansion than
for the other solids. This implied that the purification of anthracene is possible. At 103
atm the purity and yield of anthracene was as high as 90%.

CHAPTER 3
91
Similarly, the separation of a mixture of anthracene and anthraquinone dissolved in
cyclohexanone using carbon dioxide as the anti-solvent has been studied.131,132 The
anthracene and anthraquinone solutions were both prepared with the same degree of
saturation to allow equal opportunity for supersaturation upon expansion. The solubility
of these solutions was measured at 18°C and 40°C. It was discovered that for feed
concentrations having the same level of saturation, the yield of anthracene was always
higher and increased with increasing degree of saturation. A parameter termed the
minimum solubility was defined as the hypothetical feed concentration required for a
zero yield at a fixed temperature. The minimum solubility of anthracene was always
lower than that for anthraquinone at a fixed temperature. It was therefore implied that
anthracene needs less expansion to reach supersaturation and therefore could be
separated by keeping the pressure below the precipitation pressure of anthraquinone.
This was tested by expanding solutions containing mixtures of the two at different feed
concentrations. It was found that higher temperature gave rise to better separation than
lower temperature. After precipitation of solid at the correct conditions, pure anthracene
could be obtained by simple filtration.
Shishikura investigated the separation of citric acid from by-product organic acids in
acetone.133 The separation of citric acid from oxalic acid was studied at the same
concentrations as those expected in a fermentation broth. Citric acid was recovered at a
99.8% to 96.4% purity, whilst oxalic acid remained in solution and did not precipitate
out.
The separation of fractions of licorice root extract was performed by means of a two
step extraction using ethanol as the solvent and carbon dioxide as the anti-solvent.134
Licorice extract was dissolved in ethanol and fed into an extraction column that was
maintained at a low supercritical carbon dioxide to solution ratio (ie. low expansion).
The polar substances that were least soluble precipitated out in the column. The
supernatant was then fed into a second extraction column that had a higher supercritical
carbon dioxide to solution ratio. In the second column the poorly polar fractions were
extracted with the carbon dioxide and the middle polar fractions were concentrated in
solution. In this study the carbon dioxide was acting as an anti-solvent and a poor

CHAPTER 3
92
solvent. The purification of fermented citric acid was further investigated using acetone
as the solvent and carbon dioxide as the anti-solvent. Citric acid was extracted from the
condensed broth with acetone and the residual impurities were removed by carbon
dioxide induced precipitation. The acetone solution was filtered to remove the
impurities and the citric acid was crystallised by further expansion with carbon dioxide.
The residual acetone concentration was below commercially acceptable levels, but still
had a deleterious affect on taste.
The purification of bilirubin extended the use of GAS as a purification process to
medicinal compounds.63 Dimethylsulfoxide was used as the solvent and carbon dioxide
as the anti-solvent. Temperatures ranging from 35°C to 60°C and pressures between
15.0 MPa to 30.6 MPa were used in the experiments. Temperatures above 35°C were
chosen because of the ability of supercritical carbon dioxide to rapidly dry precipitates.
Process time was therefore shortened by operating at supercritical conditions. The
purity of bilirubin in the feed was 30.1%. The precipitated bilirubin had a purity of
greater than 90%. The optimum operating conditions were 40°C and 100 – 15.0 MPa.
The GAS process has been used for the separation of isomers. In a fundamental study a
mixture of ortho- and para-hydroxybenzoic acid (HBA) was separated by dissolution in
methanol and expanding with carbon dioxide.135 Both isomers possess similar
solubilities in methanol, but the solubility of p-HBA in carbon dioxide expanded
methanol is two orders of magnitude lower than for o-HBA. This implies that p-HBA
should precipitate out first in expanded methanol solutions. A precipitate containing
99% p-HBA was obtained after a single step from a 50:50 o-HBA : p-HBA methanol
feed solution. It was also observed that the presence of a solute in the solvent-anti-
solvent system significantly changed the volume expansion of the solvent. The volume
expansion of methanol-carbon dioxide system did not significantly change upon
addition of o-HBA acid into the system. However, when p-HBA was added a second
liquid phase formed.
Phenanthrene and naphthalene were fractionally precipitated from an equimolar toluene
solution with carbon dioxide.136 Phenanthrene could be collected as 98.5% pure

CHAPTER 3
93
precipitate. Under no conditions was the precipitation of naphthalene noted and it was
only recovered as an 87% pure liquid phase. In order to explain the contrasting phase
behaviour of these two solutes, the quaternary system was modelled using the structure
outlined by Kikic and co-workers.137,138
The liquid solutes lecithin and coriander essential oil have been separated from soya oil
and coriander triglycerides respectively using the GAS process.139 The GAS process
was implemented to reduce the large number of refining steps normally required to
obtain pure product conventionally. Using the GAS process 90% separation could be
achieved in a single step.
The fractionation of the protein systems lysozyme-ribonuclease, alkaline-phosphatase
and trypsin-catalse dissolved in DMSO and precipitated with CO2 have been studied
using the GAS process.140 Pure lysozyme, alkaline phosphatase and trypsin could be
obtained from their respective mixtures in a single step using the GAS process. Gas
anti-solvent processing of ribonuclease, lysozyme and trypsin resulted in 20 to 30% loss
of biological activity. Almost total loss of the biological activity of alkaline phosphatase
occurred.
In a precipitation study on polyamides it was found that the polyamide could be
separated from LiCl, a salt used to solubilise the polyamide, using the GAS process.141
LiCl was found to precipitate at a higher pressure than the polyamide and by remaining
at pressures below this pressure pure polyamide could be obtained.
The inorganic salts BaCl2 and NH4Cl could be separated by dissolving a mixture of the
two solutes in DMSO and precipitating with CO2.70,71
3.4.2. ASES as a Fractionation Technique
The first application of ASES as a fractionation technique was the separation of trans-β-
carotene and total β-carotene from raw β-carotene.14 After processing, the trans-β-
carotene content of the powder increased from 74.8 to 81.6%.

CHAPTER 3
94
Catchpole and Bergmann used the ASES process to fractionate a mixture of lecithin
from soya oil in hexane.142 A one hundred percent efficient separation was achieved at
operating conditions of only 25°C and 5.0 MPa. The separation process was conducted
continuously for up to 7 hours. The degree of separation was a function of pressure,
temperature, and to a lesser extent, the ratio of solvent to carbon dioxide. Higher
extraction of lecithin was found at higher pressure.
Racemic mixtures of (R)-2,2'-Binaphthyl-1,1'-diamine and (S)-2,2'-Binaphthyl-1,1'-
diamine were separated by crystallising with (R)-camphorsulfonic acid in CO2.143 The
efficiency of the separation was found to decrease with increasing pressure. The
relationship between resolution and temperature was more complex with an increase in
resolution with increasing temperature observed at lower pressures and the opposite
effect observed at higher pressures. At optimum conditions a resolution of 93% could
be obtained in a single crystallisation.
Nylon was successfully separated from carpet waste using the ASES technique.144 A
slight increase in molecular weight of the recovered nylon was observed compared to
the original nylon. The increase in molecular weight was attributed to the lower
molecular weight fractions being washed out with the expanded solution.
Lecithin has been separated from de-oiled egg yolk by injecting a hexane solution of the
egg yolk into liquid CO2.145 Sub-critical processing was found to be more successful
than supercritical conditions. The potential of scaling up the technique was
demonstrated from a cost point of view, with the cost of the fractionation being well
within the limits for nutritional uses.
In a co-precipitation study, the use of ASES as a fractionation technique was
demonstrated with the separation of paracetamol and ascorbic acid occurring at lower
pressures.128 The goal of the study was to form the composite, but at lower pressure,
only paracetamol precipitated.

CHAPTER 3
95
3.5. Experimental Techniques
3.5.1. GAS Experimental Techniques
A schematic diagram of a typical GAS set up is shown in Figure 3.1. A GAS apparatus
typically consists of an anti-solvent supply (A), from which preheated (C) anti-solvent
is delivered into the precipitation vessel (F) by means of a pump (B). The flow of anti-
solvent is controlled by a needle valve (D). Valve (E) permits anti-solvent to be added
from the bottom or the top of the precipitation vessel. Once precipitation is complete
filtration of the solution through a filter (G) allows the precipitate to be collected. The
flow of solution out of the precipitation vessel is controlled by a valve (H). The solvent
and anti-solvent are separated in the solvent trap (I) and the mass of anti-solvent may be
measured by a gas flow meter (J).
The standard GAS experimental procedure begins with the loading of organic solution
into the crystallisation vessel. A filter at the bottom of the vessel is able to hold the
solution within the chamber. The crystallisation vessel is then charged with gaseous
anti-solvent through the filter or a capillary tube submerged in the fluid. The pressure is
controlled by a back-pressure regulator, adjustment of the gas flow using the micro-
metering valve, or the pump. Mixing of the gas and solution is achieved by mechanical
stirrer, typically magnetic, or by using the frit as a gas sparger. The expansion of the
solution and subsequent precipitation is observed through a view glass. The level of
expansion can be measured by observing the solution level against calibrated markings
on the glass, or by using a travelling telescope or cathetometer. Once crystallisation is
complete, anti-solvent is delivered at constant pressure from the top of the vessel to
force the expanded organic solution through the filter. Once all of the liquid has been
filtered off, the precipitate is washed with fresh anti-solvent to remove residual solvent.
The mass of dense gas used in this stage of the experiment can be measured using the
gas flow meter. The pressure is reduced and the precipitate collected for analysis.
Most of the experimental designs rely on the gas bubbling through the solution for
mixing. This method of mixing has been proved to be as efficient as a magnetic stirrer
for small volume crystallisation vessels.51 In larger vessels, such as those exceeding 1L,

CHAPTER 3
96
F
A
D
EG
H
I
J
C
TP
B
Figure 3.1 Diagram of a typical GAS experimental apparatus.

CHAPTER 3
97
an efficient mixer is required in order to provide a homogenous mixture. Dead volume
should be avoided in the design of the precipitation chamber.
It has been observed that significant temperature changes can occur during the
pressurisation of the precipitation vessel due to the exothermic nature of gas
compression.51,64,65 Temperature increases of up to 20°C have been noted in the GAS
process during the rapid addition of carbon dioxide. To minimise these temperature
fluctuations, the crystallisation vessel may be initially pressurised with an inert gas.65
The anti-solvent may then be added from the bottom of the crystalliser at this elevated
pressure as a compressed gas or liquid. The pressure is kept constant by releasing the
inert gas through a micro-metering valve or backpressure regulator.
A GAS apparatus used in purification or fractionation is very similar to that previously
described for micronisation. The experiments are conducted by loading the crystalliser
with the solution to be extracted and then pressurising the solution with the anti-solvent
to the desired pressure. The system is then left to equilibrate until precipitation has
ceased. The liquid phase is then removed at constant pressure, either by forcing it
through the filter or by drawing it off with a capillary. The liquid phase is separated
from the gas anti-solvent in the cold trap. The precipitate is then washed with anti-
solvent. The desired compounds may be in the precipitated product or in the liquid. A
multi-stage GAS separator such as that used for the concentration of the antimicrobial
substances in licorice and in the purification of citric acid134,146 consists of a series of
precipitation vessels that sequentially step up in pressure, precipitating different solutes
in each vessel.
3.5.2. ASES Experimental Techniques
A schematic diagram of a typical ASES set up is shown in Figure 3.2. A solution, held
in a solution reservoir (A), is delivered by pump (B) into the ASES precipitation vessel
(C) via a dispersing device such as a nozzle or orifice (D). The precipitation chamber is
pre-pressurised with anti-solvent (E) by a secondary pump (F), which also controls the
system pressure during the course of an experiment. Precipitate is usually collected by

CHAPTER 3
98
J
A
BD
E
H
I
T
T
P
G
CF
Figure 3.2 Diagram of a typical ASES experimental apparatus.

CHAPTER 3
99
means of a filtration device (G) through which the solvent and anti-solvent solution can
pass before being depressurised across a valve or orifice (H). The anti-solvent and liquid
solvent may be separated (J) and recycled at this point. The whole apparatus is
immersed in a temperature-controlled water bath or oven to maintain constant operating
temperatures (I).
In most ASES research the anti-solvent phase is present as a single phase. Spraying a
solution into a two phase anti-solvent environment has been investigated in attempts to
reduce particle agglomeration.97,126
The basic experimental apparatus has been modified to tailor the process to specific
applications. For micronisation applications, nozzles of different diameters and designs
have been employed to control and/or reduce particle size and distribution of
precipitated products. Nozzle and orifice sizes employed in the studies to date have
ranged from 20 µm to 500 µm. Ultrasonic69,100, high-energy89,90, double81,95,105,123
and triple80,82,119,120 nozzle arrangements have been incorporated to further improve
the quality of micronised products by increasing jet breakup, reducing particle
agglomeration and controlling the extent of mixing and solute-solvent interaction at the
point of precipitation.
Multiple nozzle assemblies have not only been employed for micronisation applications,
but also for microencapsulation applications. Double and triple nozzle arrangements
have allowed more control over the order of precipitation of each solute to improve
encapsulation of pharmaceuticals precipitated with the process.81,91,95
The design of the precipitation vessel has also been modified to increase the efficiency
and control of the process. Agitated precipitation vessels with a baffle cone87, co-
current and countercurrent systems104,110,111 have been investigated to aid in mixing
and product separation.
The experimental scale of the majority of ASES studies has involved high pressure
precipitation vessels of about 50-100 ml in volume with sight gauge to enable visual

CHAPTER 3
100
observations during operation. The process has been scaled up to a 50 litre precipitation
vessel that consumed up to 40 kg.h-1 anti-solvent and had the ability to recycle
solvent.103

CHAPTER 3
101
3.6. References
1. Müller, B. W.; Waßmus, W.; "ASES - A New Production Technique for Polymeric
Microparticles," Acta Pharm. Technol. 1990, 36, 35 S.
2. Bleich, J.; Kleinebudde, B. W.; Müller, B. W.; "Influence Of Gas Density And
Pressure On Microparticles Produced With The ASES Process," Int. J. Pharm. 1994,
106, 77.
3. Bleich, J.; Müller, B.; "Production Of Drug Loaded Microparticles By The Use Of
Supercritical Gases With The Aerosol Solvent Extraction System (ASES) Process,"
J. Mocroencapsulation 1996, 13, 131.
4. Falk, R.; Randolph, T. W.; Meyer, J. D.; Kelly, R. M.; Manning, M. C.; "Controlled
Release of Ionic Compounds from Poly(L-Lactide) Microspheres Produced by
Precipitation with a Compressed Anti-Solvent," J. Controlled Release 1997, 44, 77.
5. Chou, Y.; Tomasko, D. L.; "GAS Crystallization of Polymer-Pharmaceutical
Composite Particles," The 4th International Symposium on Supercritical Fluids,
Sendai, Japan, 1997, A, 55.
6. Reverchon, E.; Della Porta, G.; Di Trolio, A.; Pace, S.; "Supercritical Anti-Solvent
Precipitation of Nanoparticles of Superconductor Precursors," Ind. Eng. Chem. Res.
1998, 37, 952.
7. Gao, Y.; Mulenda, T.; Shi, Y.; Yuan, W.; "Fine Particles Preparation of Red Lake C
Pigment by Supercritical Fluid," J. Supercrit. Fluids 1998, 369.
8. Debenedetti, P. G.; Lim, G. B.; Prud'homme, R. K.; "Formation of Protein
Microparticles by Anti-Solvent Precipitation," Ep 542314, 1993.
9. Winters, M. A.; Knutson, B. L.; Debenedetti, P. G.; Sparks, H. G.; Przybycien, T.
M.; Stevenson, C. L.; Prestrelski, S. J.; "Precipitation of Proteins in Supercritical
Carbon Dioxide," J. Pharm. Sci. 1996, 85, 586.
10. Winters, M. A.; Debenedetti, P. G.; Carey, J.; Sparks, H. G.; Sane, S. U.;
Przybycien, T. M.; "Long-Term and High-Temperature Storage of Supercritically-
Processed Microparticulate Protein Powders," Pharm. Res. 1997, 14, 1370.
11. Yeo, S. D.; Lim, G. B.; Debenedetti, P. G.; Bernstein, H.; "Formation of
Microparticulate Protein Powders Using a Supercritical Fluid Anti-Solvent,"
Biotechnol. Bioeng. 1993, 41, 341.

CHAPTER 3
102
12. Dixon, D. J.; Johnston, K. P.; "Formation of Microporous Polymer Fibers and
Oriented Fibrils by Precipitation with a Compressed Fluid Anti-Solvent," J. Appl.
Polym. Sci. 1993, 50, 1929.
13. Mawson, S.; Kanakia, S.; Johnston, K. P.; "Metastable Polymer Blends by
Precipitation with a Compressed Fluid Anti-Solvent," Polymer 1997, 38, 2957.
14. Chang, C. J.; Randolph, A. D.; Craft, N. E.; "Separation of β-Carotene Mixtures
Precipitated from Liquid Solvents with High-Pressure Carbon Dioxide," Biotechnol.
Prog. 1991, 7, 275.
15. Goodman, L. S.; Gilman, A.; The Pharmacological Basis of Therapeutics; 7th ed.;
Macmillan Publishing Co., Inc.: New York, 1985, 1839.
16. Breimer, D. D.; "Future Challanges for Drug Delivery Research," Adv. Drug Deliv.
Rev. 1998, 33, 265.
17. Jain, K. K.; "Strategies and Technologies for Drug Delivery Systems," TiPS 1998,
19, 155.
18. Hillery, A. M.; "Microparticulate Delivery Systems: Potential Drug/Vaccine
Carriers Via Mucosal Routes," PSTT 1998, 1, 69.
19. Thibert, R.; Tawashi, R.; "Micronization of Pharmaceutical Solids," Microspheres
Microencapsules Liposomes 1999, Volume : 1 (Preparation and Chemical
Applications), 327.
20. Atkinson, R. M.; Bedford, C.; Child, K. J.; E.G., T.; "The Effect of Griseofulvin
Particle Size on Blood Levels in Man," Antibiotics and Chemotherapy 1962, XII,
232.
21. Johnson, B. F.; O'Grady, J. O.; Bye, C.; "The Influence of Digoxin Particle Size on
Absorption of Digoxin and the Efefct of Propantheline and Metoclopromide," Br. J.
Clin. Pharmac. 1978, 5, 465.
22. Asbury, M. J.; McInnes, G. T.; Ramsay, L. E.; Shelton, J. R.; "Improvement in the
Bioavailability and Activity of Spironolactone by Micronisation," Proceedings of the
B.P.S., 1981, 270P.
23. Kondo, N.; Iwao, T.; Masuda, H.; Yamanouchi, K.; Ishihara, Y.; Yamada, N.; Haga,
T.; Ogawa, Y.; Yokoyama, K.; "Improved Oral Absorption of a Poorly Water-
Soluble Drug, HO-221 by Wet-Bead Milling Producing Particles in Submicron
Region," Chem. Pharm. Bull. 1993, 41, 737.

CHAPTER 3
103
24. Grau, M. J.; Kayser, O.; Müller, R. H.; "Nanosuspensions of Poorly Soluble Drugs -
Reproducibility of Small Scale Production," Int. J. Pharm. 2000, 196, 155.
25. Chen, H.; Langer, R.; "Oral Particularte Delivery: Status and Future Trends," Adv.
Drug Deliv. Rev. 1998, 339.
26. Andrianov, A. K.; Payne, L. G.; "Polymeric Carriers for Oral Uptake of
Microparticulates," Adv. Drug Deliv. Rev. 1998, 34, 155.
27. Brayden, D. J.; O'Mahoney, D. J.; "Novel Oral Drug Delivery Gateways for
Biotechnology Products: Polypeptides and Vaccines," PSTT 1998, 1, 291.
28. Ponchel, G.; Montisci, M.; Dembri, A.; Durrer, C.; Duchêne, D.; "Mucoadhesion of
Colloidal Particulate Systems in the Gastro-Intestinal Tract," Eur. J. Pharm.
Biopharm. 1997, 44, 25.
29. O' Hagan, D. T.; "Microparticles and Polymers for the Mucosal Delivery of
Vaccines," Adv. Drug Deliv. Rev. 1998, 34, 305.
30. Yeh, P.; Ellens, H.; Smith, P. L.; "Physiological Considerations in the Design of
Particulate Dosage Forms for Oral Vaccine Delivery," Adv. Drug Deliv. Rev. 1998,
34, 123.
31. Allémann, E.; Leroux, J.; Gurny, R.; "Polymeric nano- and Microparticles for the
Oral Delivery of Peptides and Peptidomimetics," Adv. Drug Deliv. Rev. 1998, 34,
171.
32. Moren, F.; "Aerosol Dosage Forms and Formulations," Aerosols in Medicine:
Principles, Diagnosis and Therapy, ; Moren, F. and Newhouse, M. T., Ed.; Elsevier:
New York, 1985, 261.
33. Patton, J. S.; "Pulmonary Delivery of Drugs for Bone Disorders," Adv. Drug Deliv.
Rev. 2000, 42, 239.
34. Zimmer, A.; Kreuter, J.; "Microspheres and Nanoparticles Used in Ocular Delivery
Systems," Adv. Drug Deliv. Rev. 1995, 16, 61.
35. Ding, S.; "Recent Developments in Ophthalmic Drug Delivery," PSTT 1998, 1, 328.
36. Takenaga, M.; Serizawa, Y.; Azechi, Y.; Ochiai, A.; Kosaka, Y.; Igarashi, R.;
Mizushima, Y.; "Microparticle Resins as a Potential Nasal Drug Delivery System for
Insulin," J. Controlled Release 1998, 52, 81.
37. Benoit, J.; Faisant, N.; Venier-Julienne, M.; Menei, P.; "Development of
Microspheres for Nurelogical Disorders: From Basics to Clinical Applications," J.
Controlled Release 2000, 65, 285.

CHAPTER 3
104
38. Austin, L. G.; Rogers, R. S. C.; "Powder Technology in Industrial Size Reduction,"
Powder Technol. 1985, 42, 90.
39. Lowrison, G. C.; "Crushing and Grinding: The Size Reduction of Solid Materials,"
Butterworth: London, 1974.
40. Snow, R. H.; "Annual Review of Size Reduction - 1975," Powder Technol. 1975,
23, 31.
41. Jarzebski, A. B.; Malinowski, J. J.; "Potentials and Prospects for Application of
Supercritical Fluid Technology in Bioprocessing," Process Biochem. (Oxford) 1995,
30, 343.
42. Weidner, E.; Knez, Z.; Novak, Z.; "Process for the Production of Particles or
Powders," U.S. 6,056,791, 2000.
43. Tom, J.; Debenedetti, P.; "Particle Formation with Supercritical Fluids - A Review,"
J. Aerosol Sci. 1991, 22, 555.
44. Bush, P. J.; Pradhan, D.; Ehrlich, P.; "Lamellar Structure and Organization in
Polyethylene Gels Crystallized from Supercritical Solution in Propane,"
Macromolecules 1991, 24, 1439.
45. Chang, C. J.; Randolph, A. D.; "Solvent expansion and solute solubility predictions
in gas-expanded liquids," AIChE J. 1990, 36, 939.
46. Tom, J. W.; Debenedetti, P. G.; "Formation of Bioerodible Polymeric Microspheres
and Microparticles by Rapid Expansion of Supercritical Solutions," Biotechnol.
Prog. 1991, 7, 403.
47. Matson, D. W.; Peterson, R. C.; Smith, R. D.; "Production of Fine Powders by the
Rapid Expansion of Supercritical Fluid Solutions," Advances in Ceramics 1987, 21,
109.
48. Weidner, E.; Knez, Z.; Novak, Z.; "PGSS (Particles from Gas Saturated Solutions) -
A New Process for Powder Generation," Proceedings of the 3rd International
Symposium on Supercritical Fluids, Strasbourg, France, 1994, Tome 3, 229.
49. Weidner, E.; Steiner, R.; Knez, Z.; "Powder Generation from Polyethyleneglycols
with Compressed Fluids," Process Technol. Proc. 1996, 12, 223.
50. Weidner, E.; "Powder Generation by High Pressure Spray Processes," Proccedings
of the International Meeting of the GVC-Fachausschuß
,,Hochdruckverfahrenstechnik'', Karlsruhe, Germany, 1999, 217.

CHAPTER 3
105
51. Gallagher, P. M.; Coffey, M. P.; Krukonis, V. J.; Hillstrom, W. W.; "Gas Anti-
Solvent Recrystallization of RDX: Formation of Ultra-Fine Particles of a Difficult-
to-Comminute Explosive," J. Supercrit. Fluids 1992, 5, 130.
52. Krukonis, V. J.; Gallagher, P. M.; Coffey, M. P.; "Gas Anti-Solvent
Recrystallization Process," U.S. 5,360,478, 1994.
53. Gallagher, P. M.; Coffey, M. P.; Krukonis, V. J.; Klasutis, N.; Gas Anti-Solvent
Recrystallization: New Process To Recrystallize Compounds Insoluble in
Supercritical Fluids; Johnston, K. P. and Penninger, J. M. L., Ed.; American
Chemical Society: Washington, DC, 1989; 406, 334.
54. Cai, J.-G.; Liao, X.-C.; Zhou, Z.-Y.; "Mocroparticle Formation and Crystallization
Rate of HMX Using Supercritical Carbon Dioxide Anti-Solvent Recrystallization,"
The 4th International Symposium on Supercritical Fluids, Sendai, Japan, 1997, A,
23.
55. Teipel, U.; Gerber, P.; Foerter-Barth, U.; Niehaus, M.; Krause, H.; "Formation of
Particles of Explosives with Supercritical Fluids," Int. Annu. Conf. ICT 1996, 27th,
7.1.
56. Gallagher, P. M.; Krukonis, V.; Botsaris, G. D.; "Gas Anti-Solvent (GAS)
Recrystallization: Application to Particle Design," AIChE Symposioum Series 1991,
87, 96.
57. Benedetti, L.; Bertucco, A.; Pallado, P.; "Production Of Micronic Particles Of
Biocompatible Polymer Using Supercritical Carbon Dioxide," Biotechnol. Bioeng.
1997, 53, 232.
58. Yeo, S. D.; Debenedetti, P. G.; Radosz, M.; Schmidt, H. W.; "Supercritical Anti-
Solvent Process for Substituted Para-Linked Aromatic Polyamides: Phase
Equilibrium and Morphology Study," Macromolecules 1993, 26, 6207.
59. Gallagher-Wetmore, P.; Coffey, M. P.; Krukonis, V.; "Application of Supercritical
Fluids in Recrystallization: Nucleation and Gas Anti-Solvent (GAS) Techniques,"
Respiratory Drug Delivery 1994, IV, 287.
60. Gallagher-Wetmore, P.; Coffey, M. P.; Krukonis, V.; "Recrystallization Using
Supercritical Fluids: Novel Techniques for Particle Modification," 1994, 162.
61. Berends, E. M.; Bruinsma, O. S. L.; de Graauw, J.; van Rosmalen, G. M.;
"Crystallization of Phenanthrene from Toluene with Carbon Dioxide by the GAS
Process," AIChE J. 1996, 42, 431.
CHAPTER 3
106
62. Cocero, M. J.; Ferrero, S.; Vicente, S.; "GAS Crystallization of β-Carotene from
Ethyl Acetate Solutions Using CO2 as Anti-Solvent," Proceedings of the 5th
International Symposium on Supercritical Fluids, Atlanta, Georgia, 2000.
63. Jianguo, C.; Zhongwen, Y.; Zhanyun, Z.; "Purification of Bilirubin and Micro-
Particle Formation with Supercritical Fluid Anti-Solvent Precipitation," Chinese J. of
Chem. Eng. 1996, 4, 257.
64. Kitamura, M.; Yamamoto, M.; Yoshinaga, Y.; Masuoka, H.; "Crystal Size Control
of Sulfathiazole Using High Pressure Carbon Dioxide," J. Cryst. Growth 1997, 178,
378.
65. Wubbolts, F. E.; Kersch, C.; van Rosmalen, G. M.; "Semi-Batch Precipitation of
Acetaminophen from Ethanol with Liquid Carbon Dioxide at a Constant Pressure,"
Proceedings of the 5th Meeting on Supercritical Fluids, Nice, France, 1998, 249.
66. Tan, C.-S.; Chang, W.-W.; "Precipitation of Polystyrene from Toluene with HFC-
134a by the GAS Process," Ind. Eng. Chem. Res. 1998, 37, 1821.
67. Thiering, R.; Dehghani, F.; Dillow, A.; Foster, N. R.; "Solvent Effects On The
Controlled Dense Gas Precipitation Of Model Proteins," J. Chem. Technol.
Biotechnol. 2000, 75, 29.
68. Thiering, R.; Dehghani, F.; Dillow, A.; Foster, N. R.; "The Influence of Operating
Conditions on the Dense Gas Precipitation of Model Proteins," J. Chem. Technol.
Biotechnol. 2000, 75, 29.
69. Manning, M. C.; Randolph, T. W.; Shefter, E.; Falk, R. F., III; "Solubilization of
Pharmaceutical Substances in an Organic Solvent and Preparation of Pharmaceutical
Powders Using the Same," Us 5770559, 1998.
70. Yeo, S.-D.; Choi, J.-H.; Lee, T.-J.; "Crystal Formation of BaCl2 and NH4Cl Using a
Supercritical Fluid Anti-Solvent," J. Supercrit. Fluids 2000, 16, 235.
71. Yeo, S.; Choi, J.; Lee, T.; "Crystal Formation of BaCl2 and NH4Cl Using a
Supercritical Fluid Anti-Solvent," Proceedings of the 5th International Symposium
on Supercritical Fluids, Atlanta, Georgia, 2000.
72. Reverchon, E.; Porta, G. D.; Sannino, D.; Lisi, L.; Ciambelli, P.; "Supercritical Anti-
Solvent Precipitation: a Novel Technique to Produce Catalyst Precursors. Preparation
and Characterization of Samarium Oxide Nanoparticles," Stud. Surf. Sci. Catal. 1998,
118, 349.

CHAPTER 3
107
73. Luna-Bárcenas, G.; Kanakia, S. K.; Sanchez, I. C.; Johnston, K. P.; "Semicrystalline
Microfibrils and Hollow Fibers by Precipitation with a Compressed-Fluid Anti-
Solvent," Polymer 1995, 36, 3173.
74. Dixon, D. J.; Luna-Bárcenas, G.; Johnston, K. P.; "Microcellular Microspheres and
Microballoons by Precipitation with a Vapour-Liquid Compressed Fluid Anti-
Solvent," Polymer 1994, 35, 3998.
75. Tom, J. W.; Lim, G.; Debenedetti, P. G.; Prud'homme, R. K.; "Applications of
Supercritical Fluids in the Controlled Release of Drugs," Supercritical Fluid
Engineering Science Fundamentals and Applications, ; Kiran, E. and Brennecke, J.
F., Ed. 1993; Vol. 514, 238.
76. Debenedetti, P. G.; Tom, J. W.; Yeo, S.-D.; Lim, G.-B.; "Application of
Supercritical Fluids for the Production of Sustained Delivery Devices," J. Controlled
Release 1993, 24, 27.
77. Debenedetti, P. G.; Lim, G.; Prud'Homme, R. K.; "Preparation of Protein
Microparticles by Supercritical Fluid Precipitation," U.S. 6,063,910, 2000.
78. Yeo, S.-D.; Debenedetti, P. G.; Patro, S. Y.; Przybycien, T. M.; "Secondary
Structure Characterization of Microparticulate Insulin Powders," J. Pharm. Sci. 1994,
83, 1651.
79. Nesta, D. P.; Elliott, J. S.; Warr, J. P.; "Supercritical Fluid Precipitation of
Recombinant Human Immunoglobulin from Aqueous Solutions," Biotechnol.
Bioeng. 2000, 67, 457.
80. Sloan, R.; Hollowood, M. E.; Humpreys, G. O.; Ashraf, W.; York, P.; "Supercritical
Fluid Processing: Preparation of Stable Protein Particles," Proceedings of the 5th
Meeting on Supercritical Fluids, Nice, France, 1998, 301.
81. Bustami, R. T.; Chan, H.; Dehghani, F.; Foster, N. R.; "Generation of Protein
Micro-Particles Using High Pressure Modified Carbon Dioxide," Proceedings of the
5th International Symposium on Supercritical Fluids, Atlanta, Georgia, 2000.
82. Sloan, R.; Tservistas, M.; Hollowood, M. E.; Sarup, L.; Humphreys, G. O.; York,
P.; Ashraf, W.; Hoare, M.; "Controlled Particle Formation of Biological Material
Using Supercritical Fluids," Proceedings of the 6th Meeting on Supercritical Fluids,
Nottingham, United Kingdom, 1999, 169.

CHAPTER 3
108
83. Kulshreshtha, A. K.; Smith, G. G.; Anderson, S. D.; Krukonis, V. J.; "Process for
Sizing Prednisolone Acetate using a Supercritical Fluid Anti-Solvent," US 5803966,
1998.
84. Reverchon, E.; Della Porta, G.; Flaivene, M. G.; "Process Parameters and
Morphology in Amoxicillin Micro and Submicro Particles Generation by
Supercritical Anti-Solvent Precipitation," J. Supercrit. Fluids 2000, 17, 239.
85. Reverchon, E.; Della Porta, G.; Falivene, M. G.; "Process Parameters Controlling
the Supercritical Anti-Solvent Micronisation of Some Antibiotics," Proceedings of
the 6th Meeting on Supercritical Fluids, Nottingham, United Kingdom, 1999, 157.
86. Reverchon, E.; Porta, G. D.; "Production of Antibiotic Micro- and Nano-Particles by
Supercritical Anti-Solvent Precipitation," Powder Technol. 1999, 106, 23.
87. Schmitt, W. J.; Salada, M. C.; Shook, G. G.; Speaker, S. M., III; "Finely-Divided
Powders by Carrier Solution Injection into a Near or Supercritical Fluid," AIChE J.
1995, 41, 2476.
88. Shekunov, B. Y.; Hanna, M.; York, P.; "Crystallization Process in Turbulent
Supercritical Flows," J. Cryst. Growth 1999, 198/199, 1345.
89. Subramaniam, B.; Saim, S.; Rajewski, A.; Stella, V.; "Methods for Particle
Micronization and Nanonization by Recrystallization from Organic Solutions
Sprayed into a Compressed Anti-Solvent," U.S. 5,874,029, 1999.
90. Subramaniam, B.; Saim, S.; Rajewski, R. A.; Stella, V.; "Methods for a Particle
Precipitation and Coating Using Near-Critical and Supercritical Antisolvents," US
5833891, 1998.
91. York, P.; Hanna, M.; "Particle Engineering by Supercritical Fluid Technologies for
Powder Inhalation Drug Delivery," Respiratory Drug Delivery, 1996; Vol. V, 231.
92. Wubbolts, F. E.; Bruinsma, O. S. L.; de Graauw, J.; van Rosmalen, G. M.;
"Continuous Gas Anti-Solvent Crystallisation of Hydroquinone from Acetone Using
Carbon Dioxide," The 4th International Symposium on Supercritical Fluids, Sendai,
Japan, 1997, A, 63.
93. Wubbolts, F.; Bruinsma, O.; van Rosmalen, G.; "Dry-Spraying of Ascorbic Acid or
Acetaminophen Solutions with Supercritical Carbon Dioxide," J. Cryst. Growth
1999, 198/199, 767.
94. Thiering, R.; Charoenchaitrakool, M.; Sze-Tu, L.; Dehghani, F.; Dillow, A. K.;
Foster, N. R.; "Crystallization of Para-Hydroxybenzoic Acid by Solvent Expansion

CHAPTER 3
109
with Dense Carbondioxide," Proceedings of the 5th Meeting on Supercritical Fluids,
Nice, France, 1998, 291.
95. Sze Tu, L.; Dehghani, F.; Dillow, A. K.; Foster, N. R.; "Applications of Dense
Gases in Pharmaceutical Processing," Proceedings of the 5th Meeting on
Supercritical Fluids, Nice, France, 1998, 263.
96. Steckel, H.; Thies, J.; Müller, B.; "Micronising of Steroids for Pulmonary Delivery
by Supercritical Carbon Dioxide," Int. J. Pharm. 1997, 152, 99.
97. Dixon, D. J.; Johnston, K. P.; Bodmeier, R. A.; "Polymeric Materials Formed by
Precipitation with a Compressed Fluid Anti-Solvent," AIChE J. 1993, 39, 127.
98. Tan, C.-S.; Lin, H.-Y.; "Precipitation of Polystyrene by Spraying Polystyrene-
Toluene Solution into Compressed HFC-134a," Ind. Eng. Chem. Res. 1999, 38, 3898.
99. Johnston, K. P.; Luna-Barcenas, G.; Dixon, D.; Mawson, S.; "Polymeric Materials
by Precipitation with a Compressed Fluid Anti-Solvent," Proceedings of the 3rd
International Symposium on Supercritical Fluids, Strasbourg, France, 1994, 359.
100. Randolph, T. W.; Randolph, A. D.; Mebes, M.; Yeung, S.; "Sub-Micrometer-Sized
Biodegradable Particles of Poly(L-Lactic Acid) via the Gas Anti-Solvent Spray
Precipitation Process," Biotechnol. Prog. 1993, 9, 429.
101. Ruchatz, F.; Kleinebudde, P.; Müller, B. W.; "Residual Solvents in Biodegradable
Microparticles. Influence of Process Parameters on the Residual SOlvent in
Microparticles Produced by the Aerosol Solvent Extraction System (ASES) Process,"
J. Pharm. Sci. 1997, 86, 101.
102. Bodmeier, R.; Wang, H.; Dixon, D.; Mawson, S.; Johnston, K.; "Polymeric
Microspheres Prepared By Spraying Into Compressed Carbon Dioxide," Pharm. Res.
1995, 12, 1211.
103. Thies, J.; Müller, B. W.; "Size Controlled Production of Biodegradable
Microparticles with Supercritical Gases," Eur. J. Pharm. Biopharm. 1998, 45, 67.
104. Bleich, J.; Müller, B. W.; Waßmus, W.; "Aerosol Solvent Extraction System - A
New Microparticle Production Technique," Int. J. Pharm. 1993, 97, 111.
105. Mawson, S.; Kanakia, S.; Johnston, K. P.; "Coaxial Nozzle for Control of Particle
Morphology in Precipitation with a Compressed Fluid Anti-Solvent," J. Appl. Polym.
Sci. 1997, 64, 2105.

CHAPTER 3
110
106. Mawson, S.; Johnston, K. P.; Betts, D. E.; McClain, J. B.; DeSimone, J. M.;
"Stabilized Polymer Microparticles by Precipitation with a Compressed Fluid Anti-
Solvent. 1. Poly(fluoro acrylates)," Macromolecules 1997, 30, 71.
107. Mawson, S.; Yates, M. Z.; O'Neill, M. L.; Johnston, K. P.; "Stabilized Polymer
Microparticles by Precipitation with a Compressed Fluid Anti-Solvent. 2.
Poly(propylene oxide)- and Poly(butylene oxide)-Based Copolymers," Langmuir
1997, 13, 1519.
108. Reverchon, E.; Della Porta, G.; De Rosa, I.; Subra, P.; Letourneur, D.;
"Biopolymers Micronisation by Supercritical Anti-Solvent Precipitation: the
Influence of Some Process Parameters," Fifth Conference on Supercritical Fluids
and their Applications, Garda (Verona), 1999, 473.
109. Reverchon, E.; De Rosa, I.; Della Porta, G.; "Effect of Process Parameters on the
Supercritical Anti-Solvent Precipitation of Microspheres of Natural Polymers,"
Dipartimento Ingegneria Chimica Alimentare,Universita Salerno,Fisciano,Italy.,
1999.
110. Heater, K. J.; Tomasko, D. L.; "Processing of Epoxy Resins Using Carbon Dioxide
as an Anti-Solvent," J. Supercrit. Fluids 1998, 14, 55.
111. Heater, K. J.; Tomasko, D. L.; "Processing of Epoxy Resins Using Carbon Dioxide
as an Anti-Solvent," J. Supercrit. Fluids 1998, 14, 55.
112. Gao, Y.; Mulenda, T. K.; Shi, Y.-F.; Yuan, W.-K.; "Fine Particles Preparation of
Red Lake Pigment by Supercritical Fluid," The 4th International Symposium on
Supercritical Fluids, Sendai, Japan, 1997, A, 31.
113. Hong, L.; Bitemo, S. R.; Gao, Y.; Yuan, W.; "Precipitation of Microparticulate
Organic Pigment Powders by Supercritical Anti-Solvent (SAS) Process,"
Proceedings of the 5th International Symposium on Supercritical Fluids, Atlanta,
Georgia, 2000.
114. Reverchon, E.; Celano, C.; Della Porta, G.; Di Trolio, A.; Pace, S.; "Supercritical
Anti-Solvent Precipitation: A New Technique for Preparing Submicronic Yttrium
Powders to Improve YBCO Superconductors," J. Mater. Res. 1998, 13, 284.
115. Reverchon, E.; Della Porta, G.; Sannino, D.; Ciambelli, P.; "Supercritical Anti-
Solvent Precipitation of Nanoparticles of a Zinc Oxide Precursor," Powder Technol.
1999, 102, 127.
CHAPTER 3
111
116. Chattopadhyay, P.; Gupta, R. B.; "Supercritical CO2 Based Production of
Fullerene Nanoparticles," Proceedings of the 5th International Symposium on
Supercritical Fluids, Atlanta, Georgia, 2000.
117. Magnan, C.; Commenges, N.; Badens, E.; Charbit, G.; "Fine Phospholipid
Particles Formed by Precipitation with a Compressed Fluid Anti-Solvent,"
Proccedings of the International Meeting of the GVC-Fachausschuß
,,Hochdruckverfahrenstechnik'', Karlsruhe, Germany, 1999, 223.
118. Magnan, C.; Badens, E.; Commenges, N.; Charbit, G.; "Soy Lecithin
Micronization by Precipitation with a Compressed Fluid Anti-Solvent - Influence of
Process Parameters," Fifth Conference on Supercritical Fluids and their
Applications, Garda (Verona), 1999, 479.
119. Hanna, M.; York, P.; Yu. Shekunov, B.; "Control of the Polymeric Forms of a
Drug Substance by Solution Enhanced Dispersion by Supercritical Fluids (SEDS),"
Proceedings of the 5th Meeting on Supercritical Fluids, Nice, France, 1998, Tome 1.
120. Hanna, M.; York, P.; "Method and Apparatus for the Formation of Particles," U.S.
6,063,138, 2000.
121. Palakodaty, S.; York, P.; Hanna, M.; Pritchard, J.; "Crystallization of Lactose
Using Solution Enhanced Dispersion by Supercritical Fluids (SEDS) Technique,"
Proceedings of the 5th Meeting on Supercritical Fluids, Nice, France, 1998, Tome 1,
275.
122. Palakodaty, S.; York, P.; Pritchard, J.; "Supercritical Fluid Processing of Materials
from Aqueous Solutions: The Application of SEDS to Lactose as a Model
Substance," Pharm. Res. 1998, 15, 1835.
123. Gilbert, D. J.; Palakodaty, S.; Sloan, R.; York, P.; "Particle Engineering for
Pharmaceurical Applications - A Process Scale Up," Proceedings of the 5th
International Symposium on Supercritical Fluids, Atlanta, Georgia, 2000.
124. Bertucco, A.; Pallado, P.; "Understanding Gas Anti-Solvent Processes of
Biocompatible Polymers and Drugs with Supercritical CO2," Proccedings of the
International Meeting of the GVC-Fachausschuß ,,Hochdruckverfahrenstechnik'',
Karlsruhe, Germany, 1999, 231.
125. Meyer, J. D.; Falk, R. F.; Kelly, R. M.; Shively, J. E.; Withrow, S. J.; Dernell, W.
S.; Kroll, D. J.; Randolph, T. W.; Manning, M. C.; "Preparation and in Vitro

CHAPTER 3
112
Characterization of Gentamycin-Impregnated Biodegradable Beads Suitable for
Treatment of Osteomyelitis," J. Pharm. Sci. 1998, 87, 1149.
126. Young, T. J.; Johnston, K. P.; Mishima, K.; Tanaka, H.; "Encapsulation of
Lysozyme in a Biodegradable Polymer by Precipitation with a Vapor-over-Liquid
Anti-Solvent," J. Pharm. Sci. 1999, 88, 640.
127. Elvassore, N.; Bertucco, A.; Caliceti, P.; "Production of Protein-Polymer Micro-
Capsules by Supercritical Anti-Solvent Techniques," Proceedings of the 5th
International Symposium on Supercritical Fluids, Atlanta, Georgia, 2000.
128. Weber, A.; Tschernjaew, J.; Kummel, R.; "Co-Precipitation with Compressed
Antisolvents for the Manufacture of Microcomposites," Proceedings of the 5th
Meeting on Supercritical Fluids, Nice, France, 1998, Tome 1, 243.
129. Engwicht, A.; Girreser, U.; Müller, B. W.; "Critical Properties of Lactide-co-
Glycoloid Polymers for the Use in Microparticle Preparation by the Aerosol Solvent
Extraction System," Int. J. Pharm. 1999, 185, 61.
130. Liou, Y.; Chang, C. J.; "Separation of Anthracene from Crude Anthracene Using
Gas Anti-Solvent Recrystallization," Sep. Sci. Technol. 1992, 27, 1277.
131. Chang, C. J.; Liou, Y.; "Purification of Polycyclic Aromatic Compounds Using
Salting-Out Separation in High-Pressure Carbon Dioxide," J. Chem. Eng. Jpn. 1993,
26, 517.
132. Chang, C. J.; Liou, Y.; Lan, W. J.; "Relative Supersaturation Ratio and Separation
Factor in Crystallization with High Pressure CO2," Can. J. Chem. Eng. 1994, 72, 56.
133. Shishikura, A.; "Purification of Organic Acids by Gas Anti-Solvent
Crystallization," Dev. Food Eng., Proc. Int. Congr. Eng. Food, 6th 1994, Pt. 2, 858.
134. Shishikura, A.; "Applications of Compressed Carbon Dioxide in the Separation
Process of Foodstuffs as a Poor and Anti-Solvent.," The 4th International Symposium
on Supercritical Fluids, Sendai, Japan, 1997, A, 51.
135. Foster, N. R.; Yun, S. L. J.; Dillow, A.; Wells, P. A.; Lucien, F. P.; "A
Fundamental Study of the Gas Anti-Solvent Process," The 4th International
Symposium on Supercritical Fluids, Sendai, Japan, 1997, A, 27.
136. Bertucco, A.; Lora, M.; Kikic, I.; "Fractional Crystallization by Gas Anti-Solvent
Technique: Theory and Experiments," AIChE J. 1998, 44, 2149.

CHAPTER 3
113
137. Kikic, I.; Bertucco, A.; Lora, M.; "A Thermodynamic Description Of Systems
Involved In Supercritical Anti-Solvent Processes," The 4th International Symposium
on Supercritical Fluids, Sendai, Japan, 1997, A, 39.
138. Kikic, I.; Lora, M.; Bertucco, A.; "A Thermodynamic Analysis of Three-Phase
Equilibria in Binary and Ternary Systems for Applications in Rapid Expansion of a
Supercritical Solution (RESS), Particles from Gas-Saturated Solutions (PGSS), and
Supercritical Anti-Solvent (SAS)," Ind. Eng. Chem. Res. 1997, 36, 5507.
139. Catchpole, O. J.; Hochmann, S.; Anderson, S. R. J.; "Gas Anti-Solvent
Fractionation of Natural Products," Process Technol. Proc. 1996, 12, 309.
140. Winters, M. A.; Frankel, D. Z.; Debenedetti, P. G.; Carey, J.; Devaney, M.;
Przybycien, T. M.; "Protein Purification With Vapor-Phase Carbon Dioxide,"
Biotechnol. Bioeng. 1999, 62, 247.
141. Yeo, S.-D.; Debenedetti, P. G.; Radosz, M.; Giesa, R.; Schmidt, H.-W.;
"Supercritical Anti-Solvent Process for a Series of Substituted Para-Linked Aromatic
Polyamides," Macromolecules 1995, 28, 1316.
142. Catchpole, O. J.; Bergmann, C.; "Continuous Gas Anti-Solvent Fractionation Of
Natural Products," Proceedings of the 5th Meeting on Supercritical Fluids, Nice,
France, 1998, 257.
143. Kordikowski, A.; York, P.; "Chiral Separation Using Supercritical CO2,"
Proceedings of the 6th Meeting on Supercritical Fluids, Nottingham, United
Kingdom, 1999, 163.
144. Griffith, A. T.; Park, Y.; Roberts, C. B.; "Separation and Recovery of Nylon from
Carpet Waste using a Supercritical Fluid Anti-Solvent Technique," Polymer Plastics
Technology & Engineering 1999, 38, 411.
145. Weber, A.; Nolte, C.; Bork, M.; Kummel, R.; "Recovery of Lecithin from Egg
Yolk-Extracts by Gas Anti-Solvent Crystallization," Proceedings of the 6th Meeting
on Supercritical Fluids, Nottingham, United Kingdom, 1999.
146. Shishikura, A.; Kanamori, K.; Takahashi, H.; Kinbara, H.; "Separation and
Purification of Organic Acids by Gas Anti-Solvent Crystallization," J. Agric. Food.
Chem. 1994, 42, 1993.

CHAPTER 4
114
4. DENSE GASES AS ANTI-SOLVENTS — PARTICLE
FORMATION MECHANISMS AND THE INFLUENCE OF
PROCESS PARAMETERS
4.1. Introduction
The ASES and GAS processes have been shown to be able to produce precipitates of a
variety of particle sizes and morphology. In the majority of circumstances the aim is to
produce fine powders. In a few cases, particularly encapsulation, this is not the case and
larger, alternative morphologies may be preferred. It is not possible at present to predict
particle size and morphology for a system. The result is that numerous preliminary
experiments have to be performed on each system to determine the optimum process
conditions. In part, this is due to the complexity of the physical processes governing the
system. Thermodynamics, hydrodynamics, mass transfer nucleation and crystallisation
thermodynamics change throughout the process and all need to be considered
simultaneously.1 Despite the fact that the processes governing GAS and ASES are
complex, some information regarding the mechanisms involved have been determined
by studying the effect of process parameters on the particles produced. These
mechanisms will be discussed below.
Supersaturation is the key parameter that determines particle size in both the GAS and
ASES processes.2 In the GAS process the rate of creation of supersaturation and the
level of supersaturation is manipulated by the rate of pressurisation. The ASES process
on the other hand is performed at a static pressure normally, at conditions of asymptotic
expansion or in the single-phase miscible region. At conditions of asymptotic expansion
the very high levels of supersaturation are generated. For this reason, the ASES process
has been referred to as an optimised GAS process.2 The GAS technique has been said to
be able to offer more control of the final particle characteristics due to the ability to
control the rate of expansion and therefore supersaturation.3

CHAPTER 4
115
In the GAS process the anti-solvent is added to the solution and is closely related to a
conventional salting out crystallisation. The rate of supersaturation is essentially a
function of the diffusion of the anti-solvent into the solution. The ASES process is more
complex with the level of supersaturation being a function of the diffusion of the anti-
solvent into the solution and the solvent into the anti-solvent. The precipitation is a
combination of both a salting out and evaporation crystallisation. The operating
conditions of the ASES process will determine which diffusion process dominates.
4.2. GAS – The Influence of Process Parameters
Process parameters that influence particle formation in GAS precipitation include the
expansion (pressurisation) rate, seeding by pressure pulse, or the addition of seed
crystals, solvent and anti-solvent type, feed concentration, temperature and agitation.
Each of these parameters can influence the size, size distribution, shape and crystallinity
of the particles formed.
The most influential parameter over particle size is the rate of expansion of the solution.
The rate of expansion determines supersaturation concentration at which nucleation
occurs, therefore effecting the rate of precipitation. The effect of rate of expansion has
been observed in a number of experiments4-8 and some researchers have reported a
twofold decrease in particle size with even relatively small increases in the rate of
expansion. The effect of expansion rate has been described in terms of supersaturation.
The faster the rate of expansion, the greater the supersaturation will be at the point of
nucleation. Thus the rate of nucleation and the number of nuclei will be larger. The final
precipitate size will therefore be small. The size of the particles precipitated by GAS, at
a controlled supersaturation, have been found to increase with a longer growth time.9
Kitamura and co-workers showed that by using a more rapid initial pressurisation rate to
nucleate seed crystals and then returning to lower pressures and slower rates of
pressurisation a sharp reduction in precipitate size could be achieved.5 These smaller
crystals mainly precipitated from the bulk solution and did not grow on the sides of the
container due to the very rapid nucleation. Bimodal size distributions have been
observed for intermediate expansion rates.10,11 At intermediate expansion rates the

CHAPTER 4
116
creation of supersaturation by gas dissolving in the solution can be reduced by the
growth of crystals. During the expansion the supersaturation line may be crossed a
number of times as the two competing effects of nucleation and growth take place. A
number of distinct nucleation events results in a multimodal particle size distribution.11
It has also been observed that the rate of expansion can have an effect on particle
morphology.7,12-14 The uniformity of crystal morphology is dependent on the stability
of the growth environment during expansion. A slow expansion rate provides a stable
environment for crystal growth resulting in a uniformly crystalline solid. Conversely a
fast expansion rate results in a turbulent environment giving rise to particles of less
crystalline nature. Another phenomenon that results in particles of differing
morphology, and is directly related to expansion rate, is the formation of particles at the
gas liquid interface.8,9 At the liquid gas interface, the concentration of anti-solvent in
the liquid phase will be greater resulting in a higher level of supersaturation than in the
bulk liquid phase. At the interface the rate of nucleation is greater resulting in
kinetically favoured crystal forms.
Seeding has been observed to affect particle size and morphology.9 Seeds were induced
by a pressure pulse during the expansion profile which resulted in a period of high
supersaturation generating nucleus particles. The seeds then formed the basis of further
particle growth. It was found that seeding resulted in larger, better packed particles with
a narrower size distribution than precipitate obtained from non-seeded experiments.
Solvent type has been found to have a dramatic effect on particle morphology.3,7,8,13,15-
17 Many differing particle morphologies are obtained for the same material crystallised
from differing solvents. The different solvents provide different environments for
particle growth and, for the reasons listed above, lead to different growth mechanisms
and therefore morphologies. The influence of anti-solvent type has not been explored in
depth. Changing anti-solvent had a minimal effect on the particle size and morphology.6
The concentration of the solid in the organic solvent has been found to have an
inconsistent effect on particle size and morphology and it is not possible to generalise

CHAPTER 4
117
results. Increases in particle size with increasing solute concentration,18 and decreases
in particle size with increasing solute concentration,13,14,19 have been reported. The
morphology of precipitate has been observed to change with solute concentration.7,8,12
Increased solute concentration has resulted in more crystalline precipitate14, and also
less crystalline precipitate.13 A decrease in precipitate aggregation at higher solute
concentrations was also reported.19 Gallagher and co-workers7 noted that concentration
of the solute had little effect when the solution was expanded rapidly.
The effect of temperature on the characteristics of precipitated material has also been
found to be variable. Different behaviour for the effect of temperature has been
observed7,18,20 with some workers reporting no effect with changing temperature.8,19
The inconsistency in these results may be due to the fact that temperature has a series of
effects on the dense gas precipitation mechanism. Solvent/anti-solvent miscibility and
therefore solution expansion, as well as the crystallisation mechanism, are both strong
functions of temperature.
Stirrer speed or solution agitation is an experimental parameter that has been
disregarded by many researchers, since equilibrium conditions have been assumed.
Often mixing is achieved by sparging less dense anti-solvent through the solvent. Both
magnetic stirrers and spargers have been used to more vigorously mix solutions under
pressure and rapidly bring about equilibrium. Note that mixing is most difficult at low
anti-solvent densities. Stirrer speed, though, has also been observed to have an effect on
particle size and size distribution.9 Faster stirrer speeds were found to give smaller
particles with a narrow size distribution due to attrition. At very slow stirrer speeds
inefficient mixing of solvent and anti-solvent results in non-equilibrium particles giving
a larger size distribution.
4.3. ASES The Influence of Process Parameters
There are numerous adjustable parameters associated with the ASES process for the
precipitation of a particular solute. Pressure, temperature, flow rate of anti-solvent, flow
rate of solvent, nozzle type and diameter, concentration, type of solvent and type of

CHAPTER 4
118
anti-solvent are parameters that can be manipulated in ASES. Having multiple process
variables makes the ASES process attractive in that it is possible to manipulate particle
size and morphology by altering process parameters. However, it is a non-trivial task to
compare experimental results from different studies in the literature. It is also
impossible to limit the formation of particles to one type of mechanism as the
thermodynamics, hydrodynamics, mass transfer and ultimately nucleation and particle
growth are strong functions of these variables.
As an introduction it is convenient to start with the simplest experiment, which is the
injection of pure solvent into the anti-solvent. The injection of pure toluene into liquid
phase CO2 was found to result in jet breakup and the formation of small suspended
liquid droplets when using a single channel nozzle by Mawson and co-workers.21 The
droplets were observed as a refractive index discontinuity. By changing to a coaxial
nozzle and injecting toluene into CO2 at the same conditions, the refractive index
gradients were not observed and the conclusion was reached that no droplets were
formed due to rapid mixing.
When pure dichloromethane was injected into supercritical CO2 the droplets formed
were similar in size to the diameter of the capillary (100 µm).1 Rapid mass transfer of
CO2 into the droplet and solvent out of the droplet caused the droplet to swell, and
eventually evaporate, before reaching the bottom of the vessel.
When pure ethanol was sprayed into vapour phase CO2 a jet of fine solvent droplets was
observed.22 These droplets filled the whole vessel and collected as a liquid at the
bottom of the vessel. When injecting ethanol into CO2 at conditions above the mixture
critical point, no mist was seen. Instead the jet could be observed extending 1.5 cm from
the nozzle tip after which it disappeared.
Pure dichloromethane has been injected into a vapour over liquid CO2 system.23 At the
flow rate studied, the dichloromethane did not atomise but fell as large droplets through
the vapour phase and into the liquid phase and quickly dispersed. At temperatures less

CHAPTER 4
119
than –30°C the drops did not disperse immediately but remained intact in the liquid
phase for about 1 cm before dispersing.
These observations indicate that jet breakup is a strong function of the density of the
anti-solvent. At low density, when the anti-solvent is in the vapour phase, the flow rate
and nozzle geometry determine the hydrodynamic mechanism. At high enough flow
rates, and large Weber numbers, atomisation of the liquid jet occurs and small droplets
form in the vapour phase which then fall to the bottom of the vessel and collect as a
liquid phase. At low flow rates, and low Weber numbers, atomisation does not occur
and the solvent falls through the vapour phase as large droplets. At low anti-solvent
density the solubility of the anti-solvent in the solvent is limited by thermodynamics.
Mass transfer of anti-solvent into the solvent droplet is limited. Negligible mass transfer
of solvent into the anti-solvent occurs and the integrity of the droplet is maintained until
the droplet is destroyed upon hitting the bottom of the vessel or the liquid phase at the
bottom of the vessel. It has been shown that for partially miscible systems the surface
tension of the jet rapidly approaches the equilibrium surface tension of the mixture.24
As the density of the anti-solvent is increased, and the single phase region of the
mixture is approached, the hydrodynamics of the system changes. Mass transfer of anti-
solvent into the solvent increases and once the single phase region is reached the solvent
and anti-solvent become totally miscible. The high density of the anti-solvent and the
reduction in surface tension between the solvent and the anti-solvent is expected to
produce very high Weber numbers and therefore very small droplets. If the surface
tension between the solvent and anti-solvent decreases rapidly enough, Weber number
theory is no longer applicable and dispersion of the solvent is by gaslike mixing.24
Whatever the mechanism of dispersion, whether by droplet formation or gas-like
mixing, it is evident that the rate at which the phase boundary between the solvent and
anti-solvent disappears is dependent on the density of the bulk anti-solvent. At low
density, when the anti-solvent is in the vapour phase, the dispersed liquid solvent
remains as droplets until these droplets are destroyed by impact with the vessel or a
liquid phase. At high density when the anti-solvent is liquid or supercritical, the solvent
phase boundary disappears rapidly which implies that the mass transfer processes

CHAPTER 4
120
operating are occurring rapidly. Any form of mixing enhancement such as the use of a
coaxial nozzle speeds up the dispersion process.
The issue of whether the liquid is dispersed as droplets or by gas-like mixing has
generated much discussion in the literature. The most common explanation for the
results that have been observed are based on the premise that droplets are formed when
the liquid solution is injected into the anti-solvent through a capillary.1,4,21,22,25-42 The
mechanism of particle formation has then been explained in terms of the processes that
occur on these droplets.
4.3.1. The Formation of Microspheres
In a large number of studies the predominant morphology is the formation of
microspheres. In some cases microspheres have formed even when the solute used is
crystalline, which is unusual because microspheres are indicative of an amorphous
morphology.4
The change from crystalline to amorphous has been observed in a number of systems
and has resulted in the conclusion that the ASES process tends to reduce the
crystallinity of the solute.30-32,43,44 The amorphous change is thought to be due to the
very fast precipitation that does not enable organisation of the compound into a
crystalline form.
Descriptions of possible mechanisms of particle formation in the ASES process were
first proposed by Dixon and co-workers to explain the processes involved in the
microspheres obtained when injecting toluene solutions of polystyrene into CO2.25 The
mechanisms proposed have been termed the One Droplet - One Particle and One
Droplet - Many Particle theories.24

CHAPTER 4
121
4.3.1.1. One Droplet — One Particle Theory
The one droplet — one particle theory proposes that when a solution is injected into a
bulk anti-solvent, hydrodynamic forces break up the liquid stream into discrete droplets.
Mass transfer processes occurring on these droplets result in the formation of a single
particle. The formation of hollow spheres is thought to proceed by this mechanism. As
the anti-solvent enters the droplet of solution, a film forms on the surface of the droplet.
Mass transfer of solvent out of the droplet then causes the outer shell to harden.45 A
hollow core is thought to be a result of CO2 entering the droplet through the glassy skin.
More anti-solvent enters the droplet than solvent leaves, resulting in a decrease in
concentration of solute in the core. The concentration of solvent in the core is sufficient
to prevent vitrification. The solvent rich droplets in the core grow and coalesce. As this
occurs the droplets rupture and collapse against the inner surface resulting in a hollow
core.45
4.3.1.2. One Droplet — Many Particles Theory
The One Droplet — Many Particle theory was proposed in conjunction with the One
Droplet — One Particle theory, as a result of experimental observation that indicated
that a more complex process than droplet formation was at work.25 In this theory the
initial formation of droplets is proposed, but the mass transfer of anti-solvent into and
solvent out of the droplet results in high levels of supersaturation in the droplet. The
high level of supersaturation causes many nuclei to form in the droplet which results in
many particles, which are smaller than the initial droplet size.
A similar mechanism of particle formation has been proposed by Reverchon and co-
workers.31,33,46 Droplet formation is once again the method of solution dispersion in
the bulk anti-solvent. Once a droplet has formed, rapid diffusion of anti-solvent into the
droplet causes the droplet to expand and solute inside the droplet to precipitate.
Precipitation begins at the surface of the droplet where the supersaturation is the
greatest. Solute inside the droplet migrates to the surface and an empty shell made up of
many primary particles is formed. If the expansion level is low enough, the formed shell

CHAPTER 4
122
remains intact as a single particle made up of many primary particles forms from each
droplet. If expansion of the droplet continues once the shell has formed, it explodes
producing many small particles. The formation of these empty shells is similar to the
formation of the hollow spheres described in the One Droplet — One Particle theory,
however the distinction is that in the case of the empty shells, they are made up of many
smaller particles whereas the hollow spheres are essentially a single particle.
4.3.1.3. No Droplet Formation, Nucleation and Growth Theory
The conclusion drawn from a number of studies is that the formation of droplets is not
very important in the ASES process:.24,44,47-50 Rather the mechanism of particle
formation is predominantly one of nucleation and growth. The basis for this conclusion
has been the relative insensitivity of the particle size and morphology to adjusting
process variables that are expected to increase Weber number and produce smaller
particles. If this mechanism holds then the ASES process becomes a GAS process with
very high rates of pressurisation.
Evidence for the particles produced by ASES being predominantly a nucleation and
growth mechanism rather than a droplet formation mechanism is the similarity of
particles produced by the GAS and ASES processes. Microspheres of 1-2 µm have been
produced for polystyrene25 and various proteins,16,17 when processing by the GAS and
ASES processes.
4.3.2. Fibre Formation
The formation of fibres is observed particularly when solutions of polymer in high
concentration are injected into liquid or supercritical anti-solvent.23,25,27,51,52 Fibre
formation is due to vitrification of the solute before breakup of the liquid jet occurs. In
terms of hydrodynamics an increase in concentration results in two competing effects.
Stabilisation of the jet occurs due to an increase in viscosity and destabilisation of the
jet can occur due to an increase in viscoelasticity.25 Stabilisation of the jet tends to
delay jet disintegration which enables vitrification of the solute while the jet is intact,

CHAPTER 4
123
resulting in the formation of fibres.25,27 Jet destabilisation due to increased
viscoelasticity is offset by the stabilisation due to increased viscosity.
Hollow fibres can form by a similar mechanism to the formation of hollow spheres.
Mass transfer of anti-solvent into the liquid solution results in skin formation around the
jet. Diffusion of anti-solvent occurs through the skin faster than solvent can diffuse out
of the skin. The interior of the jet remains rich in solvent and anti-solvent rich-voids
grow. These voids coalesce before vitrification occurs due to the high level of solvent
present in the core and leads to a hollow fibre.51
As mentioned previously, there are numerous process parameters that can be adjusted
when carrying out the ASES process. It is difficult to isolate each parameter and this has
been highlighted by Dixon and co-workers.25 The density of the anti-solvent
environment was noted to effect both jet break-up and mass transfer through a complex
mechanism, which is complicated by the fact that the density of the liquid solution
changes throughout the spraying process. Nevertheless the effect of process parameters
on the morphology and size of precipitates is important in terms of understanding the
ASES process.
4.3.3. The Effect of Solute
Strictly speaking the solute cannot be considered a process parameter, but in terms of
the ASES process the nature of the solute has a significant influence on the particle size
and morphology.
A few generalisations can be made about the precipitates formed by ASES based on the
nature of the solute. Compounds with simple molecular structures generally form
primary particles, while complex molecules produce more complex morphologies.32,46
Examples of this will be given below.
It has been found that as the size of a molecule increases it becomes more difficult to
form crystalline material.53 The reason for this is that the high turbulence generated

CHAPTER 4
124
during the process affects both nucleation and growth of the resulting particles. The
regular arrangement of molecules is interrupted and the crystallinity of the final
precipitate is reduced. The reduction in crystallinity with increasing molecular weight
results in macromolecular compounds such as proteins and polymers precipitating in the
form of microspheres and/or other amorphous structures such as fibres and films.
The differences between low and high molecular weight compounds has been attributed
to differences between the rates of mass transfer compared to the rates of nucleation and
growth.54 The mass transfer process will play a more significant role for high molecular
weight compounds which have slower nucleation kinetics. In these cases the solute
concentration with respect to time can determine the phase behaviour which influences
particle morphology. In the case of low molecular weight compounds, nucleation
kinetics are much faster than the mass transfer process implying that the rate of
nucleation plays a more significant role.54
Carbon dioxide can have a considerable influence on the morphology of polymer
precipitates produced by the ASES process. A significant difference between molecules
of low molecular weight and polymers is the solubility of CO2 in the solute. The
solubility of CO2 in low molecular weight compounds is in most cases negligible,
whereas it can be significant in high molecular weight compounds such as polymers.55
The gas solubility in the solute has the effect of altering physical properties such as
lowering the glass transition temperature and causing plasticisation.23,27 Particle-
particle and particle-wall collisions of plasticised polymers result in primary particles
forming flocculates and agglomerates.51,56 When two plasticised particles collide they
initially flocculate, and if they are soft enough, surface area minimisation may occur by
coalescence forming a single larger particle.56
Amorphous polymers tend to flocculate and agglomerate as a result of plasticisation,23
while more crystalline polymers have been found to give particles with less
agglomeration due to their better thermal behaviour and greater crystallinity.23,57

CHAPTER 4
125
The issue of agglomeration has led to attempts to prevent agglomeration of polymer
particles by the addition of surfactants.48,58 Poly(methyl methacrylate) (PMMA), which
is highly plasticised by CO2 was successfully precipitated as individual microparticles
by ASES with the additions of triblock co-polymers as stabilisers to the polymer
solution.58 The inclusion of a similar surfactant to a solution of epoxy resulted in the
formation of microspheres but agglomeration was not prevented.48 In the case of the
epoxy precipitation, the agglomeration was thought to occur during the washing stage
rather than the precipitation stage of the process. The stabilisers are thought to operate
by absorbing onto the formed particle surface in the form of a micelle, thus reducing
interfacial tension between CO2 and the dispersed phase.
A class of polymers called aramids (para-linked aromatic polyamides), which have
useful applications as high modulus and heat resistant fibres, has been found to form
fibres due to their rigid backbone when processing by ASES.12 When a dilute solution
of polymer was injected concurrently with carbon dioxide, shear caused by the different
flow rates of the two phases resulted in an orientation of the polymer chains in the
direction of the applied stress. The rigidity of the backbone encouraged fibre formation.
4.3.4. The effect of Anti-Solvent Density (Pressure)
The adjustment of the density of the gas anti-solvent is one of the major variables in the
ASES process and can effect jet break-up, phase behaviour, and mass transfer
pathways.21,51 The effect of density on particle size and morphology has resulted in
conflicting results in the literature.24,46 Part of the reason for these contradicting results
may be due to the experiments being performed with the anti-solvent in different states.
The conditions that are commonly used when carrying out the ASES process in terms of
phase and density respectively are shown in Figure 4.1 and Figure 4.2. The anti-solvent
can exist in three phases once the temperature is set. At low pressure and low density
the anti-solvent exists as a vapour, as the pressure is increased a liquid anti-solvent
phase will form and the vapour and liquid phases coexist. As the pressure is increased
further the vapour and liquid phases will converge and become a single liquid-phase, or
if the temperature is high enough a supercritical fluid phase. The

CHAPTER 4
126
������������������������������������������������������������������������������������������������������������������������������������������������������������������������������������������������������������������������������������������������������������������������������������������������������������������������
Supercritical FluidRegion
Liquid
Gas
SolidPres
sure
Temperature
Figure 4.1 Common ASES processing conditions in terms of anti-solvent phase
behaviour.

CHAPTER 4
127
0.0
0.2
0.4
0.6
0.8
1.0
0.0 10.0 20.0 30.0 40.0Pressure / MPa
Den
sity
/ g.m
L-1
20 °C30 °C40 °C50 °C60 °C70 °C
Figure 4.2 Common ASES processing conditions in terms of anti-solvent density.
CHAPTER 4
128
pressure and temperature of the anti-solvent determines the equilibrium conditions of
the process mixture. At low pressures the system is at low expansion conditions and as
the pressure is increased the system moves towards the miscible or asymptotic
expansion conditions. The particle sizes and morphologies that have been produced by
ASES for various solutes have been strongly influenced by the phase of the anti-solvent.
It is convenient to divide the discussion on the effect of density into three sections based
on the phase of the anti-solvent.
Vapour Phase
There are a number of consequences of injecting a solution into low-density anti-
solvent. Firstly, the vapour phase corresponds to systems where the solvent and anti-
solvent will be partially miscible. Diffusion of anti-solvent into the solution occurs up to
the thermodynamically set limit but extraction of the solvent into the anti-solvent does
not occur to any great extent. The lower bulk density means that Weber numbers are
smaller and jet break-up is more difficult to achieve. The result of the limited diffusion
of the anti-solvent and dispersion of the solution is expected to result in lower levels of
supersaturation. Low precipitation yields can be expected.40 In the worst case, the
density is such that enough anti-solvent can diffuse into the solution to cause
supersaturation and precipitation.
As the density is increased the diffusion of anti-solvent into the solution will increase
and the solute will begin to precipitate. Depending on the mass transfer rates, diffusion
of anti-solvent into the solution may not be rapid enough to cause precipitation in the
droplets. In this case precipitation will occur in the liquid layer which collects at the
bottom of the vessel.33,34 Large crystals of organics22 and irregular films for polymers
have been obtained due to precipitation occurring in the liquid layer.1 The liquid layer is
rich in solvent which implies that the level of supersaturation will be low resulting in
low levels of nucleation and larger particles.
Increasing the density further but remaining in the vapour phase has resulted in
precipitation occurring in the liquid droplets before they collect as a liquid layer. Skin
formation around droplets has been observed for polymer solutions at these conditions.1

CHAPTER 4
129
The particles formed had a cusped morphology due to slow drying in the low-density
environment.
Bodmeir and co-workers27 found that the smallest particles of poly(d,l-lactide) were
obtained when a dichloromethane solution was sprayed into vapour phase CO2 They
found that there was hardly any change in particle size with increasing density. They
concluded that for their system atomisation was sufficient at low density and any
increase in atomisation with increased density did not make any difference to the final
particle size.
Spraying a dilute solution of polymer into vapour CO2 did not result in atomisation of
the liquid jet.25 The jet broke into large droplets. A second liquid phase formed at the
bottom of the cell and significant agglomeration occurred.
Vapour Over Liquid
At higher densities the vapour over liquid condition occurs where the anti-solvent exists
in both the liquid and vapour phase in the vessel. When a solution is injected at these
conditions mass transfer and hydrodynamics will be similar to the lower density system.
However the increase in density is expected to increase Weber numbers and result in
smaller droplets. The major difference with the vapour over liquid compared to the
vapour phase system is that for the former the droplets fall into a liquid phase where the
solvent and anti-solvent are miscible.
As before, depending on the rates of mass transfer, precipitation can either occur in the
liquid droplets or in the liquid phase at the bottom of the vessel. In this case however,
the liquid phase is rich in anti-solvent and high rates of supersaturation are expected.
Microspheres were produced when polymer solutions of low concentration were
injected into vapour over liquid CO2.23 The solution did not atomise but fell as large
droplets into the liquid phase. Little precipitation occurred before the droplet hit the
liquid phase after which rapid mass transfer produced intense nucleation resulting in

CHAPTER 4
130
small microspheres. The results from this study are interesting in that microspheres
were formed from large droplets.
Hollow microspheres and microballoons have been formed for toluene solutions of
polystyrene sprayed into a vapour over liquid CO2.45 The formation of these particles
was attributed to jet break-up occurring in the vapour phase to form discrete droplets.
Skin formation is thought to occur in the vapour phase due to diffusion of CO2 into the
droplet. Once the droplet enters the liquid phase, toluene on the surface diffuses out and
the outer shell is hardened. Jet break-up in the vapour phase was essential to the
formation of these microspheres as evidenced by fibre formation for the same solution
when injected into liquid CO2. Microspheres of polystyrene have formed at similar
conditions by spraying into vapour over liquid HFC-134a.40 Atomisation of the liquid
jet was again important with fused and coalesced particles being formed when the flow
rate was insufficient to cause jet break-up.
Fibre formation was prevented for a toluene solution of polystyrene in high
concentration by injecting at vapour over liquid conditions25 The reason for the change
in morphology was attributed to the low level of solvent dissolution in the gaseous anti-
solvent which prevents the jet viscosity increasing. Jet break-up is able to occur before
vitrification and droplets form. These droplets fall into the liquid phase anti-solvent and
result in the formation of discrete microspheres.
Microspheres of L-PLA were obtained when spraying into vapour over liquid CO2.27
The solution was seen to break up into droplets and then fall into the liquid phase. Rapid
precipitation occurred and microparticles formed.
Liquid/Supercritical Phase
The majority of ASES studies have been conducted at conditions where the anti-solvent
is in the liquid or supercritical phase. At these conditions, an increase in density is
expected to increase Weber numbers resulting in jet break-up into smaller droplets.
Smaller droplets will provide greater surface area for mass transfer to occur thereby

CHAPTER 4
131
increasing the rate of mass transfer. Higher levels of supersaturation should be
obtainable, resulting in greater rates of nucleation and smaller particles.
Mass transfer effects are expected to be more significant at higher densities. The
diffusion of solvent into the anti-solvent is much greater than at vapour phase conditions
and it should be decreased by an increase in density.48 The rate of mass transfer of anti-
solvent into the solvent decreases with increasing density due to the increase in
viscosity of the anti-solvent.
The influence of increasing pressure and therefore density has been found to produce
conflicting results. Increasing density has resulted in a decrease in particle size25,27,59-
61, an increase in particle size1 and to have little effect on particle
size.12,22,25,27,31,33,41,46,47,62,63
The reasoning for the above observations has been based on the effects of
hydrodynamics and mass transfer rates. The decrease in particle size with increasing
density occurs in systems where atomisation is important. At higher densities the Weber
numbers are larger which means that jet breakup will produce smaller droplets
producing smaller particles. For the systems that showed little change with varying
density, the reasoning was that atomisation was sufficient at low density to produce
very small droplets and an increase in density had little effect on the droplet size and
correspondingly on the particle size. An increase in particle size as density is increased
has been explained in terms of mass transfer and nucleation kinetics, which are more
dominant than the hydrodynamic influences at the conditions studied.1,64 At higher
pressures in the miscible region the diffusivity of anti-solvent into the solution will
decrease. This will produce lower supersaturation levels and correspondingly a lower
rate of nucleation and larger particles. The decrease in droplet size due to increased
density is offset by the reduction in anti-solvent diffusivity.
Two different morphologies of amoxicillin dissolved in DMSO were obtained when
spraying at low density supercritical conditions.30 At these conditions the solvent and
anti-solvent were only partially miscible and a solvent rich liquid phase collected at the

CHAPTER 4
132
bottom of the vessel. Spherical particles were obtained from the upper supercritical
phase, and a film was obtained in the lower liquid phase. At similar conditions a film of
tetracycline hydrochloride was produced.32 A solute film was thought to form as a
result of the low solvent expansion conditions and formation of the second solvent rich
liquid phase at the bottom of the vessel. The solute forms as a film as the liquid solution
dries.
4.3.5. The Effect of Temperature
As with adjusting density, varying the temperature of the anti-solvent has
increased1,25,27,30,31,33,46,59,62,65, decreased60 and had no effect22,66 on particle size.
The influence of temperature on the ASES system is once again a result of competing
effects. In terms of hydrodynamics an increase in temperature will reduce the viscosity
of the solution and therefore increase the velocity of the solution through the nozzle.25
Weber numbers are expected to increase and therefore reduce the droplet size producing
smaller particles. Mass transport rates are expected to increase, although only slightly,
aiding in the reduction in particle size.1 However an increase in temperature will
increase particle sizes by reducing the density of the anti-solvent resulting in less
effective atomisation and increasing the growth rates of the particles produced.1,31,33,46
The effect on particle size with increasing temperature depends on whether
hydrodynamic or growth effects dominate.
The majority of studies have shown that the particle size increases with increasing
temperature. The indication is therefore that atomisation is less dominant than particle
growth at elevated temperatures. In the two phase region, changing the temperature had
no affect on the particle size or morphology.25 The latter observation reinforces the
observation from the density variation experiments that indicate that at low density
conditions atomisation is more dominant.
Manning and co-workers came to the conclusion that the smallest particles are generally
observed just above the critical temperature of the anti-solvent with the particles
increasing in size as the temperature is lowered or raised.67

CHAPTER 4
133
An important consideration regarding temperature and the processing of polymers is
plasticisation. A number of studies have shown that agglomeration of polymer particles
occurred resulting in an increase in particle size. At increased temperatures
plasticisation of the polymer can occur due to the lowering of the glass transition
temperature in the presence of compressed CO2. The formed particles coalesce to form
larger particles by interparticle collision..25,27,47,51
The agglomeration of a polymer has been reduced by decreasing the temperature of the
anti-solvent to -20°C.23 Interestingly, by reducing the temperature further to –30°C
large agglomerates formed as a result of the decreased mass transfer rates. The slow
dispersion of the polymer resulted in the particles agglomerating.
Increasing temperature has been found to reduce the yield of precipitate due to
increased solubility of the solute at elevated temperatures in the anti-solvent and
solvent.62 The yield is reduced due to the some of the solute remaining in solution and
being extracted with the solvent and anti-solvent. In this same study an increase in
temperature was found to increase the particle size distribution.62
Precipitation of polystyrene at 0°C resulted in a change in morphology from a hollow
fibre at higher temperature to an interconnected network of polymer voids.51 At lower
temperatures mass transfer is slowed down thus delaying nucleation. Phase separation
could therefore occur by spinodal decomposition rather than by nucleation and growth
resulting in the change in morphology.
4.3.6. The Effect of Solution/Anti-Solvent Flow Rate
The size and morphology of particles produced by the ASES process can be influenced
by varying the anti-solvent and the solution flow rate. The effect of adjusting these flow
rates is threefold. Firstly, the thermodynamic conditions in the vessel will change to
solvent lean conditions if the anti-solvent flow rate is increased or solution flow rate
decreased. Secondly, the hydrodynamics will change due to the change in the velocity

CHAPTER 4
134
of the anti-solvent or solution. Lastly, the mixing conditions in the vessel will change
due to changes in turbulence in the vessel.
Changing the ratio of anti-solvent to solution flow rates can influence the mass transfer
rates in the system. Mass transfer rates can be improved if a high relative velocity of
anti-solvent to solvent is maintained. The improvement is a consequence of the
increased turbulence in the vessel increasing dispersion of the solution.68
Reducing the anti-solvent flow rate has been found to increase the crystallinity of
polymer.43 The increase in crystallinity was attributed to the increase in solvent
concentration in the vessel at steady state conditions which increases crystallinity in two
ways. Firstly, the presence of a higher concentration of solvent, at low anti-solvent flow
rates, increases the mobility of the polymer chains enabling them to rearrange in a more
crystalline. Secondly, the precipitation process is slowed down with a higher level of
solvent being present allowing time for the polymer molecules to rearrange into a more
crystalline form.43
A change in morphology of polymer particles has been observed when changing the
flow rate of anti-solvent and solution. Microparticles instead of fibres were observed
when the flow rate of anti-solvent was increased.27 The change in morphology was
attributed to increased jet break-up as a result of the increased flow rate through the
nozzle. At faster flow rates the jet is broken into droplets and microparticles form.
An increase in solution flow rate has produced more aligned polymer fibrils.52 This
alignment was attributed to an increase in shear with increasing solution flow rate,
which in turn elongates the polymer coils and reduces the viscosity of the solution.
Diffusion into and out of the jet is increased due to the reduced viscosity and nucleation
is rapid. The microfibrils can be formed in the jet before the coils undergo relaxation
resulting in a more aligned morphology in the direction of the jet.
Increasing the solution flow rate resulted in a sintering of amoxicillin particles.30 The
sintering was attributed to the higher level of solvent in the vessel which encouraged

CHAPTER 4
135
coalescence of particles. A similar but reverse result was observed where increasing
anti-solvent flow rate reduced agglomeration.49 The decrease in agglomeration was
attributed to the reduction in the level of residual solvent.
Changing the direction of anti-solvent flow from co-current to countercurrent has
resulted in less agglomeration of polymer particles.48 This was attributed to two effects.
Firstly, countercurrent flow increased the relative velocity between the anti-solvent and
the liquid jet resulting in increased shear forces and increased jet break-up. Secondly,
mixing was improved, thus increasing mass transfer and delaying the settling of the
particles allowing them to dry while suspended.
The effect of decreasing anti-solvent flow rate has been to decrease particle sizes in the
SEDS process.66 In the SEDS process the level of organic modifier in the vessel
determines the extent of mixing between the CO2 anti-solvent and water. At high CO2
flow rates the selectivity of the organic solvent towards the CO2 is high and the organic
solvent is selectively removed. The liquid phase becomes mainly water and since
Reynolds numbers are high due to the high flow rate, the limiting factor becomes the
diffusion coefficient of water in CO2. The rate of formation of thermodynamic
equilibrium is longer than the nucleation rate and the achievable level of supersaturation
remains low. Growth is able to occur resulting in larger particles. At low flow rates the
aqueous phase remains rich in organic solvent and remains miscible with CO2. Water is
extracted in a similar time scale to nucleation. Crystallisation is rapid and particles are
smaller.66
An increased solution flow rate of polymer resulted in larger particles due to the
increased level of solvent in the vessel.1 The driving force for mass transfer is reduced
and the level of supersaturation is reduced resulting in fewer nuclei and larger particles.
Solution flow rate was found to influence morphology in the fractionation of nylon from
carpet waste.41 At very high upstream pressures a change in morphology from spherical
to hollow half-spheres occurred. The change in morphology was attributed to the
increased mass transfer, as a result of smaller droplets, and increased shear at higher

CHAPTER 4
136
flow rate causing the forming spheres to rupture. Particle sizes were not influenced to
any great extent with varying flow rate.
A few workers have found that altering the anti-solvent and solvent flow rate did not
affect the particles produced in the miscible region.22,32,49 The supersaturation in the
miscible region is very large and forming smaller droplets makes little difference. The
conclusion was that parameters that affect mixing of the solvent and anti-solvent have
little effect on the particles, because it works on a shorter time scale than the
crystallisation process.22
An increased solution flow rate has been found to change the phase separation of
polymer from a predominantly nucleation and growth mechanism to one of spinodal
decomposition.51 The transition into spinodal decomposition is thought to be a result of
increased rates of mass transfer with increased flow rate.
The level of residual solvent has been found to be a function of anti-solvent flow
rate.43,49 Higher anti-solvent flow rates were found to result in lower levels of residual
solvent in the precipitate.
4.3.7. The Effect of Solvent Type
The solvent used can affect the processes occurring in the ASES system in a number of
ways. Solvents can have different viscosities, vapour pressures, ability to dissolve solute
and different mass transfer rates, all of which can be important in determining the final
particle characteristics.
In the precipitation of the steroid methylprednisilone, it was observed that the more
volatile or soluble with carbon dioxide the solvent was, the smaller the size of the
particles that were generated.62 The more miscible the anti-solvent and the solvent the
higher will be the supersaturation levels achievable and consequently smaller particles
should be produced.
CHAPTER 4
137
The solute solubility in the solvent was important in the production of microparticles of
polystyrene.21 Smaller particles were produced using tetrahydrofuran - a poor solvent
for polystyrene as opposed to toluene which is a good solvent for polystyrene. The
observation was explained by comparing the ternary phase diagrams of the two systems
as in Figure 4.3. The width of the metastable region on the ternary phase diagram of the
tetrahydrofuran-polystyrene-carbon dioxide system is narrower due to the lower
solubility of polystyrene in tetrahydrofuran. The mass transfer pathway during the
precipitation process shows that the nucleation and growth rate was faster for
tetrahydrofuran than toluene, as indicated by a narrower metastable region. The polymer
therefore precipitates sooner in the jet and smaller particles are produced.
Epoxy resin precipitation from methyl ethyl ketone and acetone produced different
morphologies.48 The particles produced from methyl ethyl ketone were smaller and
more spherical. The change in size and morphology was attributed to the lower vapour
pressure of methyl ethyl ketone which resulted in a lower driving force into CO2. The
lower driving force alters the nucleation mechanism, particularly at the surface of the
droplet, resulting in the changed morphology and size. It was also theorised that solute-
solvent interactions may play a significant part in final particle morphology.
N-methyl pyrrolidone (NMP) has been found to produce coalesced particles of zinc
acetate as opposed to those formed from dimethylsulfoxide.31 The coalescence was
attributed to the increased solubility of the solute in NMP, resulting in a co-solvent
effect and solubilising the solute slightly at final conditions. N-methyl pyrrolidone has
been found to totally extract the antibiotic griseofulvin, as opposed to dimethylsulfoxide
and dichloromethane which produced precipitates at the same conditions.32 Strong
interactions between the solvent and the solute are thought to result in the formation of a
solvato complex. The anti-solvent is unable to break up the solvato complex. The solute
remains soluble and is extracted from the vessel with the solvent.

CHAPTER 4
138
Polystyrene
CO2Solvent
GlassyRegion
Tetrahydrofuran
Toluene
Figure 4.3 Ternary phase diagram showing the effect of solvent quality upon the
two phase envelope and the mass transfer pathway for a polystyrene solution
precipitated into compressed CO2.21

CHAPTER 4
139
4.3.8. The Effect of Solute Concentration
The morphology of polymer particles has been found to be a strong function of
concentration.21,25,51,52,69 The most dramatic changes in polymer morphology have
been observed when the concentration was increased from the dilute to semi-dilute
regime. In the dilute regime discrete morphologies were observed such as
microspheres1,21,25,48,51,69 and microfibrils.52 At higher concentrations continuous
morphologies such as fibres25,51,52,69 and rods48 have been formed.
The transition from polymer discrete to polymer continuous morphologies occurs at
approximately three times the plait point concentration.52,69 The change in morphology
has been attributed to the increased polymer chain entanglement that occurs at higher
concentration. A dilute polymer solution is one in which the polymer chains are far
apart and do not overlap in solution. A semi-dilute polymer solution is one in which the
polymer chains are close enough together to overlap in solution. Overlap of polymer
chains can have a significant influence on the hydrodynamics of the system due to
increased solution viscosity. Increased concentration also means that precipitation
occurs sooner due to the lower level of anti-solvent needed to form a supersaturated
solution. The combination of these effects and the change in the mass transfer pathway
is thought to cause the changes in morphology.
Polystyrene and poly(L-lactic acid) were found to produce microparticles which
decreased in size as the concentration was increased below the plait point.21 The trend
of decreasing size with increasing concentration was attributed to the shortening of the
distance between the binodal and spinodal curve as the concentration approaches the
plait point. The metastable region is narrower and the mass transfer pathway crosses the
spinodal curve before much growth has had time to occur in the metastable region.
Time scales of polymer—solvent phase separation and polymer—polymer phase
separation were used to explain the results obtained at different concentrations from
attempts to form a polymer blend.69 Below the plait point, atomisation of the solution
occurs and the diffusion of CO2 into the solution is rapid enough that the polymer

CHAPTER 4
140
solution phase separation occurs before polymer-polymer phase separation and a blend
was formed. At concentrations three times above the plait point concentration,
stabilisation of the jet due to increased viscosity resulted in skin formation. The
formation of a skin decreased the mass transfer of CO2 into the solution and polymer-
polymer phase separation could occur before polymer-solvent phase separation.69
The concentration of polystyrene in toluene has been found to influence the morphology
of hollow microspheres produced by spraying into a vapour over liquid regime45 and
the morphology of hollow fibres produced when spraying in the miscible region.51 As
the concentration increased, the cavity in the spheres or fibres became smaller until they
were no longer hollow.
The effect of concentration of precipitation involving molecules of lower molecular
weight has also been studied. Most observations have been that the size of the particles
increases with increasing concentration.30,32,33,42,62 The increase in particle size has
been attributed to the change in the time for supersaturation to be reached. A dilute
solution reaches saturation relatively late, thus enabling atomisation to occur before
nucleation and smaller particles are formed, while concentrated solutions nucleate
before atomisation can occur resulting in larger particles.42
No effect with changing concentration41 and smaller particles with increasing
concentration has been observed.22 The reduction in particle size with increasing
concentration was attributed to higher supersaturation at higher concentration resulting
in a greater nucleation rate and less opportunity for particle growth.
4.3.9. The Effect of Nozzle Diameter/Type
The approach that has been made to nozzle design in the literature has been closely
related to the particle formation mechanism that is thought to be in operation. As
mentioned previously, the most common interpretations have been based on the
formation of droplets in the anti-solvent phase. If this is the mechanism in operation,
then the objective in making small particles becomes one of decreasing droplet size.

CHAPTER 4
141
Most of the nozzle adaptations and designs are made with the objective of increasing
atomisation and forming smaller droplets of liquid solution in the bulk anti-solvent.
Typical nozzle designs that have been reported as being used in ASES processes in the
literature are shown in Figure 4.4. These designs range from a single capillary to
multichannel and vibrating nozzles.
The simplest nozzle is a single capillary through which the liquid solution flows (Figure
4.4 a). The nozzle diameter and flow rate determine the Weber number once all other
parameters are set. Different results have been produced from studies in which the effect
of nozzle diameter on the hydrodynamics of the process and ultimately its effect on
particle size have been examined. An increase in nozzle diameter, from 30 to 200 µm,
was found to increase the particle size of Red Lake C pigment by an order of
magnitude.59 Changing the nozzle diameter from 300 to 500 µm had no effect on the
size of L-poly(lactic acid).38 Independence of particle size on changing nozzle diameter
has also been observed in other studies.41,48 The effect of nozzle diameter can be
explained in terms of the particle formation mechanism in operation. If atomisation and
droplet formation is the dominant process determining particle size, then reducing the
nozzle diameter will most likely result in a reduction in particle size. If mass transfer is
very rapid and supersaturation, and nucleation levels are not altered to any significant
extent by a reduction in droplet size, then changing the nozzle diameter is not expected
to change particle design.
Another nozzle design which is described in the literature is the coaxial nozzle which
consists of an inner nozzle surrounded by one or more larger outer nozzles (Figure 4.4
b). The anti-solvent usually flows through the outer and the liquid solution through the
inner nozzle. The effect of using a coaxial nozzle is twofold.21 Firstly, the relative
velocities of the two flows will be reduced thus reducing atomisation and mass transfer.
Secondly, mixing is improved by the increased turbulence created by the anti-solvent
flowing at higher velocity in close proximity to the liquid solvent increasing dispersion
of the liquid solution.

CHAPTER 4
142
(a) (b)
(d)
EnergisingGas
(c)
Figure 4.4 Different nozzle designs used in ASES.

CHAPTER 4
143
A coaxial nozzle with CO2 flowing in the annular region has been used to improve
circulation of the droplets and reduce agglomeration compared to the standard
nozzle.21,23 The coaxial nozzle improved mixing and this was observed by the
precipitate being recirculated through the vessel. Mass transfer was slower in the jet for
the coaxial nozzle but faster in the suspension outside the jet leading to improved drying
of the suspended particles.
A coaxial nozzle design and the presence of a stabiliser has been found to reduce
flocculation of poly(methyl methacrylate) compared to the particles produced with
stabiliser and the standard nozzle design.56 The reason for the reduced flocculation was
attributed to the altering of the position of the majority of mass transfer occurring from
inside to outside of the jet with the coaxial design. As absorption of the stabiliser is
thought to occur mainly outside of the jet, transferring the mass transfer process outside
of the jet enabled more time for diffusion and absorption of the stabiliser.
Multi-channel nozzles containing three concentric nozzles have been employed to
enable the micronisation of hydrophilic molecules (Figure 4.4 c).70,71 The solubility of
water in the anti-solvent was improved by delivering an organic solvent via one of the
nozzle channels.
The standard nozzle design has been noted to have limitations in producing micron
sized particles due to premature nucleation occurring before secondary atomisation.
Relatively large droplets form which results in larger particles. Coalescence of droplets
can also occur before nucleation due to low interphase mass transfer.42 Premature
nucleation can become a major hindrance to atomisation for concentrated solutions.42
Nozzle variations aimed at improving atomisation have included the generation of high
frequency waves through sonication1,29,67 and the inclusion of a high energy gas
flowing proximal to the solvent (Figure 4.4 c).37,42 Smaller particles are thought to be
achievable with the introduction of high frequency waves speeding up the atomisation
process so that it occurs before nucleation and to increase mass transfer so that
nucleation occurs before coalescence of droplets.42 As with the standard nozzle, the
effect of the vibrating nozzles on particle size will depend on the mechanism of particle

CHAPTER 4
144
formation in operation. Correspondingly, the vibrating nozzle has been found to make
little difference to particle size1,67 and to decrease particle size.37,42
Subramaniam and co-workers found that the use of an energising gas other than CO2 in
their high energy nozzle can delay precipitation of solutions of high concentration by
the second gas acting as a buffer.42 The delay in nucleation allows atomisation to occur
and subsequently smaller particles to be produced.
4.3.10. Pre-Addition of Anti-Solvent
A variation of the ASES process is to pressurise the solution to be injected with anti-
solvent before injection into the bulk anti-solvent. The level of pre-added anti-solvent is
kept below the saturation level of the solute to prevent precipitation in the lines before
entering the bulk anti-solvent phase. A consequence of pre-adding anti-solvent to the
solution is to reduce the viscosity of the solution and bring the solution closer to
supersaturation conditions. Less anti-solvent diffusion into the liquid solution is
required for precipitation which means that precipitation should occur sooner.
Pre-addition of CO2 to the solution has produced porous fibres when spraying a semi-
dilute concentration of polystyrene into CO2.25 It was hoped that the pre-addition of
CO2 would aid jet break-up and prevent fibre formation. However, the effect of
breaking up the jet was offset by the reduction in the time scale of vitrification. Pre-
addition of CO2 had no effect for dilute polymer solutions.51
Pre-addition of CO2 to a polymer solution and spraying into a vapour over liquid system
produced microballoons.45 These microballoons had a more uniform porous structure
than those produced without the pre-addition of CO2. Pre-addition of CO2 to the
solution results in rapid supersaturation due to a lower level of CO2 being needed to
diffuse into the droplet to cause vitrification. The rapid generation of supersaturation
means that there was less time for the growth and rupture of cells resulting in a more
uniform particle.

CHAPTER 4
145
The pre-addition of CO2 to a solution of RG503H had little effect on particle size but
caused the formation of bubbles on the surface of the particles.37,42
Pre-addition of CO2 reduced the viscosity of the polymer solution, resulting in a slight
decrease in spraying pressure.38 A reduction in particle size was observed compared
with the conventional spray. The decrease in agglomeration was most likely the result
of a rapid hardening of the droplet surface. There was no increase in particle porosity by
pre-addition of CO2.
4.3.11. The Effect of Stirring Rate
The introduction of stirring into the ASES process is expected to increase the rate of
mixing of the anti-solvent and solution. An increase in mixing should increase the mass
transfer rates resulting in higher levels of supersaturation and consequently greater
nucleation rates. Smaller particles are therefore expected. Schmitt and co-workers62
investigated the effect of stirring while performing the ASES process. It was observed
that an increase in stirring rate produced smaller particles up to 900 rpm and then no
further reduction in particle size was observed by increasing the rate.
4.4. Effect of Process Parameters on Encapsulation/Co-Precipitation
The possibility of encapsulating drugs with polymers, forming drug polymer
composites, or coating surfaces with drugs or polymers by ASES is arguably one of the
most promising applications of the process. The encapsulation or coating of
pharmaceuticals or other materials requires that the particles to be encapsulated are
totally encased in a second compound. Many of the issues that were discussed
previously for the ASES process also apply to the encapsulation of compounds and will
not be repeated here. Extra issues that are important when producing encapsulated or
composite drugs are the drug loading and encapsulation efficiency. Combining a drug
and polymer and precipitating them by ASES does not necessarily result in an effective
encapsulation. For example, the drug and polymer may precipitate in separate domains,
or the drug may precipitate mostly on the surface of the polymer both resulting in

CHAPTER 4
146
ineffective encapsulation. Although the potential of the ASES process as an
encapsulation technique has been demonstrated, little information has been given
regarding the effect of process parameters and few generalisations can be made.
Various authors have shown that drug loading is a function of the solubility of the drug
in the anti-solvent and therefore is a function of the pressure or density of the
system.26,29,47 It was generally found that the higher the solubility of the drug at higher
pressure, the lower the drug loading due to the enhancement in solubility and thus the
extraction of the drug into the anti-solvent phase. Drug loadings of non-polar drugs such
as piroxicam in L-poly(lactic acid) particles were relatively low and found to decrease
significantly as the pressure was increased from 90 to 200 bar at 40°C.26 Experiments
on more polar drugs such as hyoscine-butylbromide achieved drug loadings of 19.5
wt% which remained unchanged, even at higher pressures, due to their negligible
change in solubility in the carbon dioxide anti-solvent.
Falk and co-workers found that an increase in the drug to polymer ratio increased the
drug loading of rifampin, gentamycin, and naltrexone particles in L-poly(lactic acid).29
The effect was least significant with the most lipophilic drug, rifampin, which had
highest solubility in carbon dioxide.
The concentration of polymer solution has been found to influence encapsulation
efficiency.23,37 Subramaniam and co-workers found that at lower concentrations of
polymer solution sugar beads were more uniformly coated than at higher polymer
concentrations.37 The reduction in encapsulation with increasing concentration was
attributed to larger polymer particles forming at higher concentration which did not coat
the beads as well. Young and co-workers,23 however, found that when spraying a
lysozyme suspension containing dissolved polymer into vapour over liquid CO2, an
increase in polymer concentration resulted in improved encapsulation efficiencies. The
vapour over liquid regime was used to enable large droplets of solution to form in the
vapour phase and fall into the liquid phase. The suspended lysozyme particles would be
contained in these droplets and the probability of encapsulation would be increased due
to the close proximity of the precipitating polymer to the suspended particles. At low

CHAPTER 4
147
polymer concentrations a low encapsulation efficiency was obtained. At low polymer
concentrations large droplets dispersed as they entered the anti-solvent liquid phase. The
polymer precipitated as microspheres which were too small to effectively encapsulate
the suspended lysozyme particles. At higher polymer concentrations the large droplets
were not dispersed as they entered the anti-solvent liquid phase. Larger polymer
particles were formed which were capable of encapsulating the lysozyme particles
resulting in higher encapsulation efficiencies.
Subramaniam and co-workers investigated the effect of anti-solvent flow rate and
temperature on encapsulation efficiencies.37 An increase in anti-solvent flow rate was
found to reduce the efficiency of coating of non-pareil sugar beads. The reduction in
polymer coating at higher anti-solvent flow rates is thought to be as a result of the
precipitating polymer being entrained in the flowing anti-solvent and not adhering to the
surface of the sugar beads. Raising the temperature to 40°C increased the coating
efficiency and the polymer precipitated as a film which totally covered the surface of
the beads.

CHAPTER 4
148
4.5. References
1. Randolph, T. W.; Randolph, A. D.; Mebes, M.; Yeung, S.; "Sub-Micrometer-Sized
Biodegradable Particles of Poly(L-Lactic Acid) via the Gas Anti-Solvent Spray
Precipitation Process," Biotechnol. Prog. 1993, 9, 429.
2. Bungert, B.; Sadowski, G.; Arlt, W.; "Separations And Material Processing In
Solutions With Dense Gases," Ind. Eng. Chem. Res. 1998, 37, 3208.
3. Gallagher-Wetmore, P.; Coffey, M. P.; Krukonis, V.; "Application of Supercritical
Fluids in Recrystallization: Nucleation and Gas Anti-Solvent (GAS) Techniques,"
Respiratory Drug Delivery 1994, IV, 287.
4. Yeo, S. D.; Lim, G. B.; Debenedetti, P. G.; Bernstein, H.; "Formation of
Microparticulate Protein Powders Using a Supercritical Fluid Anti-Solvent,"
Biotechnol. Bioeng. 1993, 41, 341.
5. Kitamura, M.; Yamamoto, M.; Yoshinaga, Y.; Masuoka, H.; "Crystal Size Control of
Sulfathiazole Using High Pressure Carbon Dioxide," J. Cryst. Growth 1997, 178,
378.
6. Gallagher, P. M.; Coffey, M. P.; Krukonis, V. J.; Klasutis, N.; Gas Anti-Solvent
Recrystallization: New Process To Recrystallize Compounds Insoluble in
Supercritical Fluids; Johnston, K. P. and Penninger, J. M. L., Ed.; American
Chemical Society: Washington, DC, 1989; 406, 334.
7. Gallagher, P. M.; Krukonis, V.; Botsaris, G. D.; "Gas Anti-Solvent (GAS)
Recrystallization: Application to Particle Design," AIChE Symposioum Series 1991,
87, 96.
8. Gallagher, P. M.; Coffey, M. P.; Krukonis, V. J.; Hillstrom, W. W.; "Gas Anti-
Solvent Recrystallization of RDX: Formation of Ultra-Fine Particles of a Difficult-to-
Comminute Explosive," J. Supercrit. Fluids 1992, 5, 130.
9. Berends, E. M.; Bruinsma, O. S. L.; de Graauw, J.; van Rosmalen, G. M.;
"Crystallization of Phenanthrene from Toluene with Carbon Dioxide by the GAS
Process," AIChE J. 1996, 42, 431.
10. Müller, M.; Meier, U.; Kessler, A.; Mazzotti, M.; "Precipitation of a Pharmaceutical
Using High Pressure Carbon Dioxide as Anti-Solvent," Proceedings of the 5th
International Symposium on Supercritical Fluids, Atlanta, Georgia, 2000.

CHAPTER 4
149
11. Muhrer, G.; Dörfler, W.; Mazzotti, M.; "Gas Anti-Solvent Recrystallization of
Speciality Chemicals : Effect of Process Parameters on Particle Size Distribution,"
Proceedings of the 5th International Symposium on Supercritical Fluids, Atlanta,
Georgia, 2000.
12. Yeo, S. D.; Debenedetti, P. G.; Radosz, M.; Schmidt, H. W.; "Supercritical Anti-
Solvent Process for Substituted Para-Linked Aromatic Polyamides: Phase
Equilibrium and Morphology Study," Macromolecules 1993, 26, 6207.
13. Thiering, R.; Charoenchaitrakool, M.; Sze-Tu, L.; Dehghani, F.; Dillow, A. K.;
Foster, N. R.; "Crystallization of Para-Hydroxybenzoic Acid by Solvent Expansion
with Dense Carbondioxide," Proceedings of the 5th Meeting on Supercritical Fluids,
Nice, France, 1998, 291.
14. Wubbolts, F. E.; Kersch, C.; van Rosmalen, G. M.; "Semi-Batch Precipitation of
Acetaminophen from Ethanol with Liquid Carbon Dioxide at a Constant Pressure,"
Proceedings of the 5th Meeting on Supercritical Fluids, Nice, France, 1998, 249.
15. Gallagher-Wetmore, P.; Coffey, M. P.; Krukonis, V.; "Recrystallization Using
Supercritical Fluids: Novel Techniques for Particle Modification," 1994, 162.
16. Thiering, R.; Dehghani, F.; Dillow, A.; Foster, N. R.; "Solvent Effects On The
Controlled Dense Gas Precipitation Of Model Proteins," J. Chem. Technol.
Biotechnol. 2000, 75, 29.
17. Thiering, R.; Dehghani, F.; Dillow, A.; Foster, N. R.; "The Influence of Operating
Conditions on the Dense Gas Precipitation of Model Proteins," J. Chem. Technol.
Biotechnol. 2000, 75, 29.
18. Cai, J.-G.; Liao, X.-C.; Zhou, Z.-Y.; "Microparticle Formation and Crystallization
Rate of HMX Using Supercritical Carbon Dioxide Anti-Solvent Recrystallization,"
The 4th International Symposium on Supercritical Fluids, Sendai, Japan, 1997, A,
23.
19. Benedetti, L.; Bertucco, A.; Pallado, P.; "Production Of Micronic Particles Of
Biocompatible Polymer Using Supercritical Carbon Dioxide," Biotechnol. Bioeng.
1997, 53, 232.
20. Jianguo, C.; Zhongwen, Y.; Zhanyun, Z.; "Purification of Bilirubin and Micro-
Particle Formation with Supercritical Fluid Anti-Solvent Precipitation," Chinese J. of
Chem. Eng. 1996, 4, 257.
CHAPTER 4
150
21. Mawson, S.; Kanakia, S.; Johnston, K. P.; "Coaxial Nozzle for Control of Particle
Morphology in Precipitation with a Compressed Fluid Anti-Solvent," J. Appl. Polym.
Sci. 1997, 64, 2105.
22. Wubbolts, F.; Bruinsma, O.; van Rosmalen, G.; "Dry-Spraying of Ascorbic Acid or
Acetaminophen Solutions with Supercritical Carbon Dioxide," J. Cryst. Growth
1999, 198/199, 767.
23. Young, T. J.; Johnston, K. P.; Mishima, K.; Tanaka, H.; "Encapsulation of
Lysozyme in a Biodegradable Polymer by Precipitation with a Vapor-over-Liquid
Anti-Solvent," J. Pharm. Sci. 1999, 88, 640.
24. Lengsfeld, C. S.; Delplanque, J. P.; Barocas, V. H.; Randolph, T. W.; "Mechanism
Governing Microparticle Morphology during Precipitation by a Compressed Anti-
Solvent: Atomization vs Nucleation and Growth," J. Phys. Chem. B 2000, 104, 2725.
25. Dixon, D. J.; Johnston, K. P.; Bodmeier, R. A.; "Polymeric Materials Formed by
Precipitation with a Compressed Fluid Anti-Solvent," AIChE J. 1993, 39, 127.
26. Bleich, J.; Müller, B.; "Production Of Drug Loaded Microparticles By The Use Of
Supercritical Gases With The Aerosol Solvent Extraction System (ASES) Process,"
J. Mocroencapsulation 1996, 13, 131.
27. Bodmeier, R.; Wang, H.; Dixon, D.; Mawson, S.; Johnston, K.; "Polymeric
Microspheres Prepared By Spraying Into Compressed Carbon Dioxide," Pharm. Res.
1995, 12, 1211.
28. Debenedetti, P. G.; Tom, J. W.; Yeo, S.-D.; Lim, G.-B.; "Application of
Supercritical Fluids for the Production of Sustained Delivery Devices," J. Controlled
Release 1993, 24, 27.
29. Falk, R.; Randolph, T. W.; Meyer, J. D.; Kelly, R. M.; Manning, M. C.; "Controlled
Release of Ionic Compounds from Poly(L-Lactide) Microspheres Produced by
Precipitation with a Compressed Anti-Solvent," J. Controlled Release 1997, 44, 77.
30. Reverchon, E.; Della Porta, G.; Flaivene, M. G.; "Process Parameters and
Morphology in Amoxicillin Micro and Submicro Particles Generation by
Supercritical Anti-Solvent Precipitation," J. Supercrit. Fluids 2000, 17, 239.
31. Reverchon, E.; Della Porta, G.; Sannino, D.; Ciambelli, P.; "Supercritical Anti-
Solvent Precipitation of Nano-Particles of a Zinc Oxide Precursor," Powder Technol.
1999, 102, 127.

CHAPTER 4
151
32. Reverchon, E.; Porta, G. D.; "Production of Antibiotic Micro- and Nano-Particles by
Supercritical Anti-Solvent Precipitation," Powder Technol. 1999, 106, 23.
33. Reverchon, E.; Della Porta, G.; Di Trolio, A.; Pace, S.; "Supercritical Anti-Solvent
Precipitation of Nano-Particles of Superconductor Precursors," Ind. Eng. Chem. Res.
1998, 37, 952.
34. Reverchon, E.; Celano, C.; Della Porta, G.; Di Trolio, A.; Pace, S.; "Supercritical
Anti-Solvent Precipitation: A New Technique for Preparing Submicronic Yttrium
Powders to Improve YBCO Superconductors," J. Mater. Res. 1998, 13, 284.
35. Debenedetti, P. G.; Lim, G.; Prud'Homme, R. K.; "Preparation of Protein
Microparticles by Supercritical Fluid Precipitation," U.S. 6,063,910, 2000.
36. Subra, P.; Jestin, P.; "Powders Elaboration in Supercritical Media: Comparison with
Conventional Routes," Powder Technol. 1999, 103, 2.
37. Subramaniam, B.; Saim, S.; Rajewski, R. A.; Stella, V.; "Methods for a Particle
Precipitation and Coating Using Near-Critical and Supercritical Antisolvents," US
5833891, 1998.
38. Thies, J.; Müller, B. W.; "Size Controlled Production of Biodegradable
Microparticles with Supercritical Gases," Eur. J. Pharm. Biopharm. 1998, 45, 67.
39. Tom, J. W.; Lim, G.; Debenedetti, P. G.; Prud'homme, R. K.; "Applications of
Supercritical Fluids in the Controlled Release of Drugs," Supercritical Fluid
Engineering Science Fundamentals and Applications, ; Kiran, E. and Brennecke, J.
F., Ed. 1993; Vol. 514, 238.
40. Tan, C.-S.; Lin, H.-Y.; "Precipitation of Polystyrene by Spraying Polystyrene-
Toluene Solution into Compressed HFC-134a," Ind. Eng. Chem. Res. 1999, 38, 3898.
41. Griffith, A. T.; Park, Y.; Roberts, C. B.; "Separation and Recovery of Nylon from
Carpet Waste using a Supercritical Fluid Anti-Solvent Technique," Polymer Plastics
Technology & Engineering 1999, 38, 411.
42. Subramaniam, B.; Saim, S.; Rajewski, A.; Stella, V.; "Methods for Particle
Micronization and Nanonization by Recrystallization from Organic Solutions
Sprayed into a Compressed Anti-Solvent," U.S. 5,874,029, 1999.
43. Falk, R. F.; Randolph, T. W.; "Process Variable Implications for Residual Solvent
Removal and Polymer Morphology in the Formation of Gentamicin-Loaded Poly(L-
Lactide) Microparticles," Pharm. Res. 1998, 15, 1233.

CHAPTER 4
152
44. Steckel, H.; Thies, J.; Müller, B.; "Micronising of Steroids for Pulmonary Delivery
by Supercritical Carbon Dioxide," Int. J. Pharm. 1997, 152, 99.
45. Dixon, D. J.; Luna-Bárcenas, G.; Johnston, K. P.; "Microcellular Microspheres and
Microballoons by Precipitation with a Vapour-Liquid Compressed Fluid Anti-
Solvent," Polymer 1994, 35, 3998.
46. Reverchon, E.; "Supercritical Anti-Solvent Precipitation of Micro- and Nano-
Particles," J. Supercrit. Fluids 1999, 15, 1.
47. Bleich, J.; Kleinebudde, B. W.; Müller, B. W.; "Influence Of Gas Density And
Pressure On Microparticles Produced With The ASES Process," Int. J. Pharm. 1994,
106, 77.
48. Heater, K. J.; Tomasko, D. L.; "Processing of Epoxy Resins Using Carbon Dioxide
as an Anti-Solvent," J. Supercrit. Fluids 1998, 14, 55.
49. Ruchatz, F.; Kleinebudde, P.; Müller, B. W.; "Residual Solvents in Biodegradable
Microparticles. Influence of Process Parameters on the Residual Solvent in
Microparticles Produced by the Aerosol Solvent Extraction System (ASES) Process,"
J. Pharm. Sci. 1997, 86, 101.
50. Chattopadhyay, P.; Gupta, R. B.; "Supercritical CO2 Based Production of Fullerene
Nano-Particles," Proceedings of the 5th International Symposium on Supercritical
Fluids, Atlanta, Georgia, 2000.
51. Dixon, D. J.; Johnston, K. P.; "Formation of Microporous Polymer Fibers and
Oriented Fibrils by Precipitation with a Compressed Fluid Anti-Solvent," J. Appl.
Polym. Sci. 1993, 50, 1929.
52. Luna-Bárcenas, G.; Kanakia, S. K.; Sanchez, I. C.; Johnston, K. P.; "Semicrystalline
Microfibrils and Hollow Fibers by Precipitation with a Compressed-Fluid Anti-
Solvent," Polymer 1995, 36, 3173.
53. Yeo, S.-D.; Choi, J.-H.; Lee, T.-J.; "Crystal Formation of BaCl2 and NH4Cl Using a
Supercritical Fluid Anti-Solvent," J. Supercrit. Fluids 2000, 16, 235.
54. Werling, J.; Debenedetti, P.; "Numerical Modeling of Mass Transfer in the
Supercritical Anti-Solvent Process," J. Supercrit. Fluids 1999, 16, 167.
55. Connon, C. S.; Falk, R. F.; Randolph, T. W.; "Role of Crystallinity in Retention of
Polymer Particle Morphology in the Presence of Compressed Carbon Dioxide,"
Macromolecules 1999, 32, 1890.

CHAPTER 4
153
56. Mawson, S.; Johnston, K. P.; Betts, D. E.; McClain, J. B.; DeSimone, J. M.;
"Stabilized Polymer Microparticles by Precipitation with a Compressed Fluid Anti-
Solvent. 1. Poly(fluoro acrylates)," Macromolecules 1997, 30, 71.
57. Engwicht, A.; Girreser, U.; Müller, B. W.; "Critical Properties of Lactide-co-
Glycoloid Polymers for the Use in Microparticle Preparation by the Aerosol Solvent
Extraction System," Int. J. Pharm. 1999, 185, 61.
58. Mawson, S.; Yates, M. Z.; O'Neill, M. L.; Johnston, K. P.; "Stabilized Polymer
Microparticles by Precipitation with a Compressed Fluid Anti-Solvent. 2.
Poly(propylene oxide)- and Poly(butylene oxide)-Based Copolymers," Langmuir
1997, 13, 1519.
59. Gao, Y.; Mulenda, T.; Shi, Y.; Yuan, W.; "Fine Particles Preparation of Red Lake C
Pigment by Supercritical Fluid," J. Supercrit. Fluids 1998, 369.
60. Robertson, J.; King, M. B.; Seville, J. P. K.; Merrifield, D. R.; Buxton, P. C.;
"Recrystallisation of Organic Compounds Using Near Critical Carbon Dioxide," The
4th International Symposium on Supercritical Fluids, Sendai, Japan, 1997, A, 47.
61. York, P.; Hanna, M.; "Particle Engineering by Supercritical Fluid Technologies for
Powder Inhalation Drug Delivery," Respiratory Drug Delivery, 1996; Vol. V, 231.
62. Schmitt, W. J.; Salada, M. C.; Shook, G. G.; Speaker, S. M., III; "Finely-Divided
Powders by Carrier Solution Injection into a Near or Supercritical Fluid," AIChE J.
1995, 41, 2476.
63. Reverchon, E.; Della Porta, G.; De Rosa, I.; Subra, P.; Letourneur, D.;
"Biopolymers Micronisation by Supercritical Anti-Solvent Precipitation: the
Influence of Some Process Parameters," Fifth Conference on Supercritical Fluids
and their Applications, Garda (Verona), 1999, 473.
64. Polakodaty, S.; York, P.; Hanna, M.; Pritchard, J.; "Crystallization of Lactose Using
Solution Enhanced Dispersion by Supercritical Fluids (SEDS) Technique,"
Proceedings of the 5th Meeting on Supercritical Fluids, Nice, France, 1998, 275.
65. Winters, M. A.; Knutson, B. L.; Debenedetti, P. G.; Sparks, H. G.; Przybycien, T.
M.; Stevenson, C. L.; Prestrelski, S. J.; "Precipitation of Proteins in Supercritical
Carbon Dioxide," J. Pharm. Sci. 1996, 85, 586.
66. Palakodaty, S.; York, P.; Pritchard, J.; "Supercritical Fluid Processing of Materials
from Aqueous Solutions: The Application of SEDS to Lactose as a Model
Substance," Pharm. Res. 1998, 15, 1835.

CHAPTER 4
154
67. Manning, M. C.; Randolph, T. W.; Shefter, E.; Falk, R. F., III; "Solubilization of
Pharmaceutical Substances in an Organic Solvent and Preparation of Pharmaceutical
Powders Using the Same," US 5770559, 1998.
68. Palakodaty, S.; York, P.; "Phase Behavioral Effects on Particle Formation Processes
Using Supercritical Fluids," Pharm. Res. 1999, 16, 976.
69. Mawson, S.; Kanakia, S.; Johnston, K. P.; "Metastable Polymer Blends by
Precipitation with a Compressed Fluid Anti-Solvent," Polymer 1997, 38, 2957.
70. Sloan, R.; Hollowood, M. E.; Humpreys, G. O.; Ashraf, W.; York, P.; "Supercritical
Fluid Processing: Preparation of Stable Protein Particles," Proceedings of the 5th
Meeting on Supercritical Fluids, Nice, France, 1998, 301.
71. Hanna, M.; York, P.; "Method and Apparatus for the Formation of Particles," U.S.
6,063,138, 2000.

CHAPTER 5
155
5. SOLUBILITY OF SOLUTES IN SOLUTIONS EXPANDED WITH
CO2
5.1. Introduction
There have been many examples of the application of the GAS and ASES processes
reported in the literature. However, there is relatively little data available regarding the
solubility of solutes in the expanded solutions of the systems that have been studied.
Knowledge of the solubility of the reactants and products in a reaction medium is an
important parameter to be verified before a synthesis is carried out. In a conventional
synthesis reaction, variables such as the volume of organic solvent, or the concentration
of one reactant, can be easily varied. However, in the case of an expanded solution
which is under pressure, and in many cases with no means of visual observation,
alteration of these variables would be difficult.
Knowledge of the thermodynamics of a system is of equal importance when
micronising compounds by GAS or ASES. The condition at which precipitation of
solute occurs in a solution expanded with a gas anti-solvent depends on many factors
such as the nature of the solvent and solute. It is therefore important to study the
behaviour of the system to ensure that the micronisation process is operated at optimum
conditions.
The volumetric expansion and solute solubility of systems relevant to the synthesis and
micronisation of Cu-Indo using CO2 as an antisolvent were investigated and the results
are reported below. Firstly, the volumetric expansion of N,N-dimethylformamide
(DMF), N-methylpyrrolidone (NMP) and dimethylsulfoxide (DMSO) upon
pressurisation with CO2 will be presented. Secondly, the solubility of copper
indomethacin (Cu-Indo), copper acetate (Cu-Acetate), indomethacin and acetic acid in
DMF expanded with CO2 will be presented to determine the applicability of using CO2
as an antisolvent for the synthesis and micronisation of Cu-Indo. Thirdly, the solubility
of Cu-Indo in DMF expanded with CO2 in the presence of Cu-Acetate, indomethacin or

CHAPTER 5
156
acetic acid will be presented and compared to the solubility of Cu-Indo in the ternary
CO2—DMF—Cu-Indo system.
5.2. Experimental
All chemicals and reagents used are listed in Table 5.1. All chemicals and reagents were
used as supplied.
Table 5.1 Chemicals and reagents.
Chemical/Reagent Purity (%) /
Grade
Supplier
Copper Indomethacin 90 Biochemical Veterinary
Research
Copper (II) Acetate 98 Sigma-Aldrich
Indomethacin 99 Shanghai Shon Long
Pharmaceutical Factory
Glacial Acetic Acid 99.7 Ajax Chemicals
N,N-dimethylformamide 99.9 Burdick and Jackson
N-methylpyrrolidone 99.5 ISP Technologies Inc.
Dimethylsulfoxide 99.8 Ajax Chemicals
Carbon Dioxide > 99.9 BOC Gasses
Tetramethylammonium Chloride 97 Aldrich Chemical Co.
Acetonitrile 99.8 EM Science
5.2.1. Experimental Apparatus and Procedure
The experimental apparatus used in the volumetric expansion and solubility studies is
shown schematically in Figure 5.1. The apparatus consists of a high pressure vessel
(Jerguson sight gauge series No. 32) with an internal volume of 60 mL. The high
pressure vessel enabled observation of the system throughout each experiment. A
magnetic stirrer was designed for the high pressure vessel to ensure the solution was
well mixed before and during sampling. A 0.5 µm stainless steel filter frit was situated
at the bottom of the reaction vessel to sparge the CO2 in the liquid phase during

CHAPTER 5
157
P
CO2 Source
Syringe PumpHeating Coil
Magnetic StirrerThermostated Heater
Reaction Vessel
Water bath
CO2Reservoir
Filter
T
Sample Loop
Figure 5.1 Experimental apparatus used to determine volumetric expansion and
solute solubility.

CHAPTER 5
158
pressurisation and to trap any precipitated solid in the washing step. A 500 mL stainless
steel surge tank was placed before the high pressure vessel to maintain constant pressure
while a sample was taken. An ISCO LC-500 syringe pump was used to generate the
required pressure. Pressure monitoring was made possible by the use of a Druck
Pressure transducer (Model DPI 260 ± 0.007 MPa). The temperature was controlled to
within 0.1oC by submerging the apparatus in a water bath heated with a Thermoline
Unistat 130 water heater. The flow of CO2 through the vessel was from the bottom
during the pressurisation step or from the top during the washing step and was
controlled by two three way ball valves (Whitey SS-41XS2). Two 2-way ball valves
(Whitey SS-41S2) separated by a filter housing (Swagelok ANUPROA Filter) were
used as a sample loop. The sample loop had an internal volume of 1.85 mL (calibrated
with water).
A volumetric or solubility experiment consisted of loading the high pressure vessel with
approximately 20 mL of pure solvent or solution. In the systems that involved solid, an
excess of solid was added to ensure that the solution was saturated throughout the
experiment. The vessel was then placed in a controlled temperature water bath in order
to reach the desired temperature. The CO2 was passed through a heating coil to maintain
the CO2 at operating temperature, and then sparged through the solution via a frit
located at the bottom of the Jerguson. The system was allowed to equilibrate with
stirring after which a sample was taken at constant temperature and pressure. During
sampling, the CO2 was passed through the vessel from the top of the high pressure
vessel and a sample was taken by pushing the solution through the filter and into a
sample loop at constant pressure. To ensure that there were no bubbles in the sample
loop the pressurised liquid was slowly let into the sample loop from the bottom by
allowing the vapor to purge from the top of the sample loop. Once liquid started
escaping from the top of the valve, sampling was ceased and the sample valve
disconnected. Each experimental point was repeated until consistent results within 5%
RSD were obtained.
The mole fraction of each component was determined by gravimetric means. The mass
of CO2 was calculated by measuring mass of the sample loop before and after
depressurisation. The sample loop was depressurised by releasing the pressure over 10

CHAPTER 5
159
minutes and collecting any liquid that was extracted with the CO2 into a cold trap. The
liquid in the cold trap was sonicated for five minutes to remove residual CO2. The mass
of the depressurised liquid and the empty sample loop was then measured and recorded.
The mass of CO2 in the sample loop was then calculated by subtracting the mass of the
empty sample loop and collected solution from the full sample loop.
The mass of Cu-Indo and indomethacin was determined by High Pressure Liquid
Chromatography (HPLC). The HPLC used consisted of a Waters 600 pump, a 996
Photo Diode Array detector and a 717Plus Autoinjector. The samples were separated
using a Symmetry C18 column with a mobile phase made up of 70% acetonitrile and
30% 0.01M tetramethyl ammonium chloride in 0.1% acetic acid. A flow rate of 1
mL.min-1 was used and the analytes were detected at a wavelength of 320 nm.
The mass of Cu-Acetate was determined by atomic absorption (AAS) using a Perkin
Elmer Analyst 300. The analyses conditions were as follows: air-acetylene flame, 324.8
nm wavelength and a 0.7 nm slit width.
The mass of organic solvent was calculated by subtracting the mass of solute from the
mass of collected solution. The mole fraction of each component was calculated from
the measured masses.
The volumetric expansion of the liquid phase was calculated from the mass of organic
solvent in the sample loop as follows:
mP0
S
mPS — 1 5.1
where mS is the mass of organic solvent in the sample loop and P0 and P represent the
pressures at atmospheric and the pressure at sampling respectively.

CHAPTER 5
160
5.3. Volumetric Expansion of the CO2—Solvent Systems
The volumetric expansion behaviour of the CO2—DMF system at 25, 30 and 40°C was
examined and is illustrated in Figure 5.2 (See Appendix II for data). The volumetric
expansion was calculated using Equation 5.1. The volume of the liquid phase was found
to increase with increasing pressure. At a given pressure, there was a reduction in the
volumetric expansion of the solution with increasing temperature as shown in Figure
5.2.
The volumetric expansion behaviour of the CO2—NMP and CO2—DMSO systems at
25°C and 40°C was examined and is illustrated in Figure 5.3 (See Appendix II for data).
The trend of increasing expansion with increasing pressure and decreasing temperature
was observed for both NMP and DMSO.
The volumetric expansion behaviour of DMF, NMP and DMSO when pressurised with
CO2 at 25°C is compared in Figure 5.4. At pressures above 3 MPa, CO2 was more
soluble in DMF and the DMF solution undergoes a greater degree of expansion than the
other two solvents. NMP and DMSO had similar expansion profiles over the pressure
range tested. The solubility of CO2 in a solvent is expected to increase with decreasing
organic solvent polarity. The dipole moment, which can be used as a measure of
polarity, of DMF, NMP and DMSO is 13.0, 13.6 and 13.7 Cm respectively.1 DMF is
less polar than NMP and DMSO and correspondingly the solubility of CO2 in DMF is
greater for a given temperature and pressure than for NMP and DMSO. The polarity of
NMP and DMSO is similar and is reflected by CO2 having a similar solubility in these
solvents.
The solubility of CO2 in the liquid phase was measured for the DMF, NMP and DMSO
systems and is shown in Figure 5.5. The data in Figure 5.5 reveal an interesting
observation. For all isotherms, and for a given mole fraction of CO2, the volumetric
expansion of the liquid phase was the same.2 Kordikowski and co-workers observed a
similar trend for a number of different solvents pressurised with CO2. The inability to
distinguish between different solvents when pressurised with CO2 led Kordikowski and

CHAPTER 5
161
Pressure / MPa
% E
xpan
sion
0
200
400
600
800
1000
0.0 1.0 2.0 3.0 4.0 5.0 6.0 7.0 8.0
25 °C
30 °C
40 °C
Figure 5.2 Volumetric expansion of DMF—CO2 as a function of pressure at 25, 30
and 40°C.

CHAPTER 5
162
Pressure / MPa
% E
xpan
sion
0
50
100
150
200
250
0.0 1.0 2.0 3.0 4.0 5.0 6.0 7.0 8.0
NMP 25°C
NMP 40°C
DMSO 25°C
DMSO 40°C
Figure 5.3 Volumetric expansion of NMP—CO2 and DMSO—CO2 as a function of
pressure.

CHAPTER 5
163
Pressure / MPa
% E
xpan
sion
0
200
400
600
800
1000
0.0 1.0 2.0 3.0 4.0 5.0 6.0 7.0 8.0
DMF
NMP
DMSO
Figure 5.4 Comparison between the DMF—CO2, NMP—CO2 and DMSO—CO2
systems at 25°C.

CHAPTER 5
164
Mole Fraction CO2
% E
xpan
sion
0
100
200
300
400
500
0.0 0.1 0.2 0.3 0.4 0.5 0.6 0.7 0.8 0.9 1.0
NMP 25°C
NMP 40°C
DMSO 25°C
DMSO 40°C
DMF 25°C
DMF 30°C
DMF 40°C
Figure 5.5 Volumetric expansion of the DMF—CO2, NMP—CO2 and DMSO—
CO2 systems as a function of CO2 mole fraction.
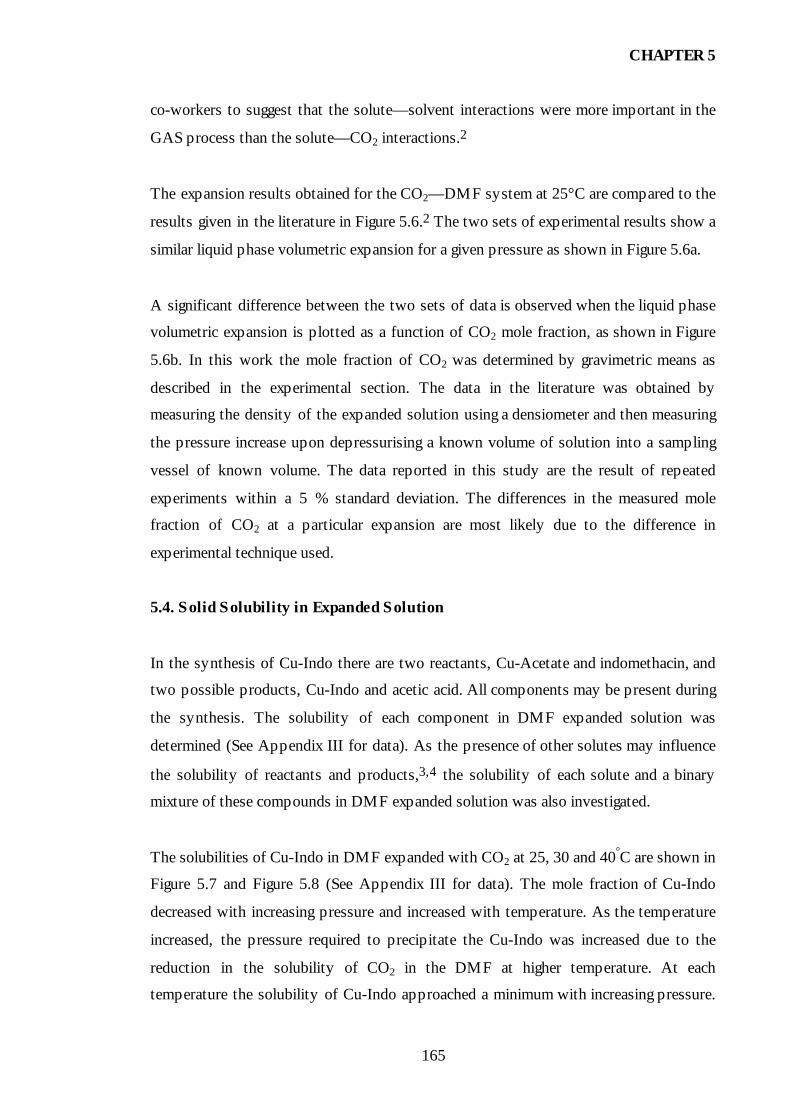
CHAPTER 5
165
co-workers to suggest that the solute—solvent interactions were more important in the
GAS process than the solute—CO2 interactions.2
The expansion results obtained for the CO2—DMF system at 25°C are compared to the
results given in the literature in Figure 5.6.2 The two sets of experimental results show a
similar liquid phase volumetric expansion for a given pressure as shown in Figure 5.6a.
A significant difference between the two sets of data is observed when the liquid phase
volumetric expansion is plotted as a function of CO2 mole fraction, as shown in Figure
5.6b. In this work the mole fraction of CO2 was determined by gravimetric means as
described in the experimental section. The data in the literature was obtained by
measuring the density of the expanded solution using a densiometer and then measuring
the pressure increase upon depressurising a known volume of solution into a sampling
vessel of known volume. The data reported in this study are the result of repeated
experiments within a 5 % standard deviation. The differences in the measured mole
fraction of CO2 at a particular expansion are most likely due to the difference in
experimental technique used.
5.4. Solid Solubility in Expanded Solution
In the synthesis of Cu-Indo there are two reactants, Cu-Acetate and indomethacin, and
two possible products, Cu-Indo and acetic acid. All components may be present during
the synthesis. The solubility of each component in DMF expanded solution was
determined (See Appendix III for data). As the presence of other solutes may influence
the solubility of reactants and products,3,4 the solubility of each solute and a binary
mixture of these compounds in DMF expanded solution was also investigated.
The solubilities of Cu-Indo in DMF expanded with CO2 at 25, 30 and 40°C are shown in
Figure 5.7 and Figure 5.8 (See Appendix III for data). The mole fraction of Cu-Indo
decreased with increasing pressure and increased with temperature. As the temperature
increased, the pressure required to precipitate the Cu-Indo was increased due to the
reduction in the solubility of CO2 in the DMF at higher temperature. At each
temperature the solubility of Cu-Indo approached a minimum with increasing pressure.

CHAPTER 5
166
0
200
400
600
800
1000
0.0 1.0 2.0 3.0 4.0 5.0 6.0 7.0 8.0Pressure / MPa
% E
xpan
sion
This Work 25°CKordikowski 25°C
0
200
400
600
800
1000
0.0 0.2 0.4 0.6 0.8 1.0Mole Fraction CO2
% E
xpan
sion
This Work 25°CKordikowski 25°C
(a)
(b)
Figure 5.6 Comparison between literature2 results and this work for the
volumetric expansion of DMF with CO2 at 25°C.
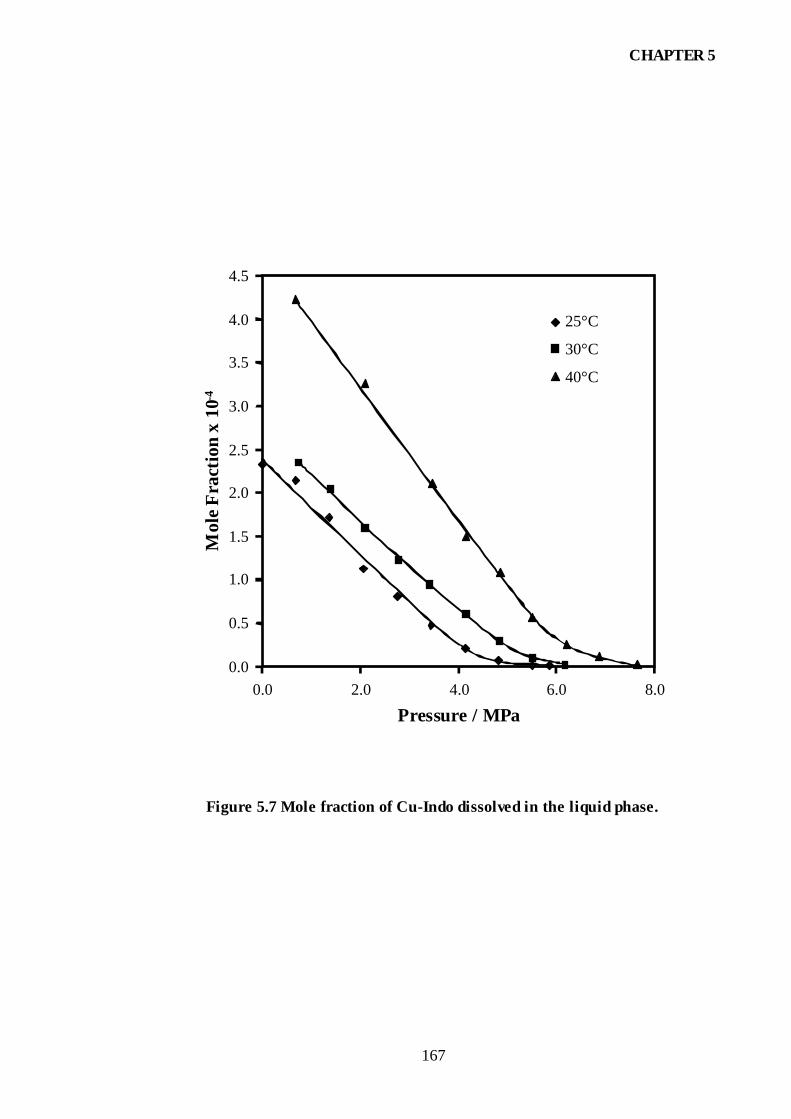
CHAPTER 5
167
Pressure / MPa
Mol
e Fra
ctio
n x
10-4
0.0
0.5
1.0
1.5
2.0
2.5
3.0
3.5
4.0
4.5
0.0 2.0 4.0 6.0 8.0
25°C
30°C
40°C
Figure 5.7 Mole fraction of Cu-Indo dissolved in the liquid phase.

CHAPTER 5
168
Pressure / MPa
Con
cent
ratio
n / m
g.g-1
0.0
2.0
4.0
6.0
8.0
10.0
12.0
0.0 2.0 4.0 6.0 8.0
25°C
30°C
40°C
Figure 5.8 Concentration of Cu-Indo in DMF (CO2 free basis).

CHAPTER 5
169
This minimum is expected to coincide with the solubility of the solute in CO2.5 A
decrease in mole fraction of Cu-Indo was due to the increased mass capacity of the
solution (the dilution effect) as CO2 dissolved in the liquid phase and was not
necessarily indicative of precipitation. The concentration of Cu-Indo, where the
concentration of Cu-Indo is expressed in terms of a CO2 free basis, is shown in Figure
5.8 and indicates the pressure at which precipitation occurred in the system. The
solubility of Cu-Indo decreased rapidly as the pressure was increased, even at low
pressures. The effectiveness of CO2 as an antisolvent for precipitating Cu-Indo was
demonstrated with a greater than 95% yield at 25°C and 5.9 MPa.
The solubility of Cu-Acetate in DMF expanded with CO2 at 25°C is shown in Figure 5.9
(See Appendix III for data). The mole fraction of Cu-Acetate decreased with increasing
mole fraction of CO2 in the liquid phase. The concentration of Cu-Acetate (CO2 free
basis) increased slightly as the pressure was increased up to 3 MPa and then decreased
when the pressure was increased further. The initial increase in solubility may be due to
the density increase of the liquid phase that occurs at low pressures.2 This density
increase results in CO2 acting as a co-solvent at pressures below 3 MPa. The increased
solubility of Cu-Acetate in the CO2—DMF—Cu-Acetate system may be due to the high
solubility of Cu-Acetate in DMF at atmospheric conditions. Cu-Acetate was two orders
of magnitude more soluble in DMF than Cu-Indo at atmospheric conditions. The
solute—solvent interaction between DMF and Cu-Acetate was greater than between
DMF and Cu-Indo. The initial density increase in the liquid phase outweighed the
antisolvent effect of CO2 and this led to a solubility increase for Cu-Acetate. The
solubility increase continued until enough CO2 dissolved in the liquid phase and the
antisolvent effect dominated the solute—solvent interactions. In the case of Cu-Indo,
which was far less soluble in the organic solvent, this initial density increase did not
result in greater solubility because the solute—solvent interaction was dominated by the
antisolvent effect of CO2.
The solubility of indomethacin in DMF expanded with CO2 at 25°C is depicted in
Figure 5.10 (See Appendix III for data). The mole fraction of indomethacin decreased
gradually and at 5.5 MPa it dramatically decreased. The concentration of indomethacin
(CO2 free basis) remained constant at pressures below 5.5 MPa and then decreased to 46

CHAPTER 5
170
Pressure / MPa
Mol
e Fra
ctio
n
Con
cent
ratio
n / m
g.g-1
0.000
0.005
0.010
0.015
0.020
0.025
0.0 2.0 4.0 6.0 8.00
10
20
30
40
50
60
70
80
Figure 5.9 Solubility of Cu-Acetate in expanded DMF at 25°C.
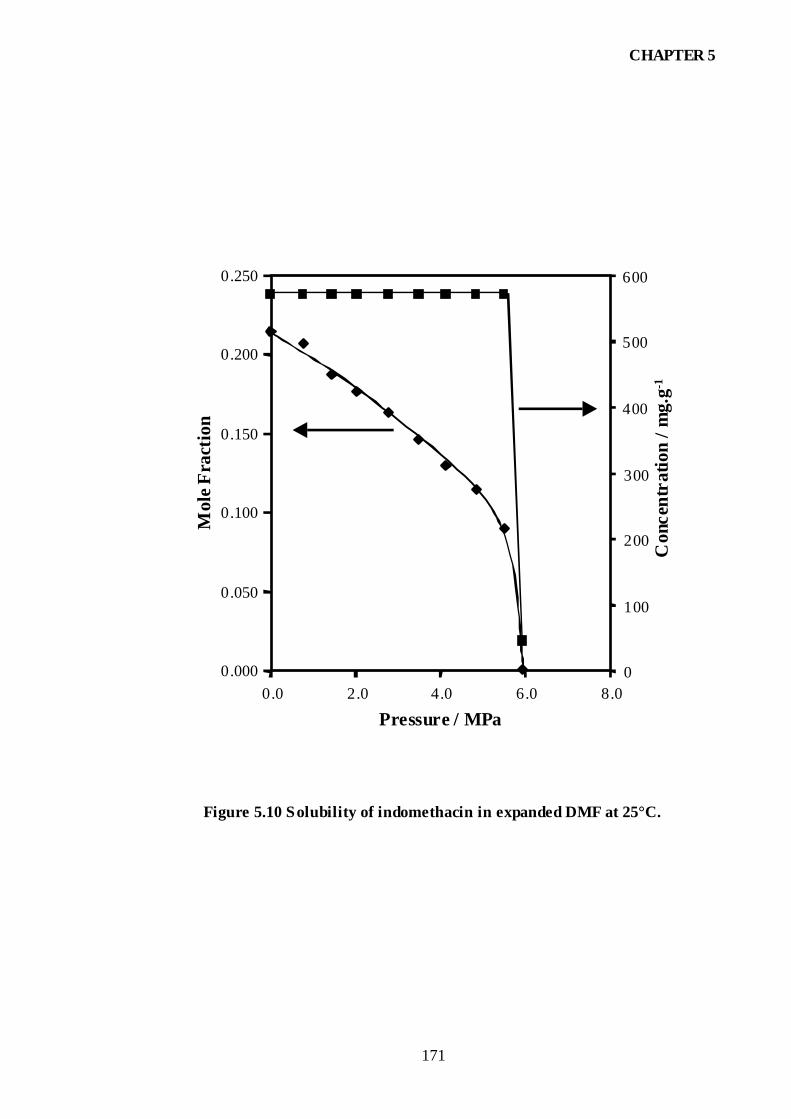
CHAPTER 5
171
Pressure / MPa
Mol
e Fra
ctio
n
Con
cent
ratio
n / m
g.g-1
0.000
0.050
0.100
0.150
0.200
0.250
0.0 2.0 4.0 6.0 8.00
100
200
300
400
500
600
Figure 5.10 Solubility of indomethacin in expanded DMF at 25°C.

CHAPTER 5
172
mg.g-1 of DMF at 6 MPa. A second liquid phase appeared between 5.5 MPa and 6 MPa.
The second liquid phase converged with the first liquid phase once precipitation of the
indomethacin occurred.
The mole fraction of CO2 dissolved in the liquid phase for the DMF, Cu-Indo + DMF,
Cu-Actetate + DMF and indomethacin + DMF systems at 25°C is compared in Figure
5.11. At pressures below 5.5 MPa, the mole fraction of CO2 in the liquid phase was
lower for DMF solutions containing indomethacin than for the other systems. The
CO2—DMF expansion behaviour (the amount of CO2 dissolved in DMF) did not
change when solutes of low solubility such as Cu-Indo and Cu-Acetate were present in
the system. The solubility of Cu-Indo and Cu-Acetate in DMF at atmospheric pressure
and 25°C was 5.4 and 60 mg.g-1 respectively. A similar observation was made for the
expansion profile of the DMSO—CO2 system when protein with low solubility was
added to the system.6 However, the data in Figure 5.11 show that highly soluble
compounds such as indomethacin, which has a solubility of 571 mg.g-1 in DMF at
atmospheric pressure and 25°C, dramatically influences the phase behaviour of the
system. The lower solubility of CO2 in DMF in the presence of indomethacin may be
due to intermolecular forces between the solute and solvent. An analogous observation
has been made for the citric acid—ethanol system.7 A high solubility suggests that there
are strong cohesive forces between the solute and the solvent and the system no longer
behaves as pure DMF. The strong cohesive forces, which leave little solvent available to
interact with CO2, resulted in a second liquid phase forming at higher pressures. A
splitting of the liquid phase occurred in the CO2—naphthalene—toluene system in
which one liquid phase was rich in CO2 and the other rich in the solute.8 As the pressure
increased the amount of CO2 increased which resulted in an increased competing force
for DMF between CO2 and indomethacin. Eventually at pressures greater than 5.5 MPa,
the DMF—indomethacin and DMF—CO2 phases split. A further pressure increase
caused the indomethacin to precipitate out of solution. Once precipitation occurred and
the indomethacin concentration in solution decreased, the two liquid phases merged and
the phase behaviour of the system approached that of the CO2—DMF system.

CHAPTER 5
173
Pressure / MPa
Mol
e Fr
actio
n
0.0
0.2
0.4
0.6
0.8
1.0
0.0 2.0 4.0 6.0 8.0
DMF
Cu-Indo
Cu-Acetate
Indomethacin
Figure 5.11 Mole fraction of CO2 as a function of pressure at 25°C in the presence
of solute.

CHAPTER 5
174
The phase behaviour of the DMF—CO2—acetic acid (36 mg.g-1) system at 25°C is
shown in Figure 5.12. The presence of acetic acid did not influence the expansion
profile of the DMF—CO2 system over the pressure range tested.
The data from the ternary systems containing a solute indicate that Cu-Indo could be
separated from Cu-Acetate and indomethacin at 25°C by pressure manipulation. The
solubility of Cu-Indo in DMF and DMF expanded solutions at all pressures examined
was lower than that of Cu-Acetate and indomethacin. The saturation concentrations of
Cu-Acetate and indomethacin at various pressures can be obtained using the data in
Figure 5.9 and Figure 5.10. The synthesis process would be performed at conditions
where the concentration of the reactants, Cu-Acetate and indomethacin, are far from
saturation. If the initial concentration of a solute in solution is less than saturation,
precipitation will not occur until the solid—liquid equilibrium line is crossed.8 The
solubility studies show that at each pressure, the solubility of Cu-Indo was lower than
Cu-Acetate and indomethacin, hence it crossed the solid—liquid equilibrium line before
the others.
The solubility of a compound in an expanded solution may be influenced by the
presence of another solute. The solubility of Cu-Indo at 25°C in DMF expanded
solutions containing acetic acid, Cu-Acetate or indomethacin are depicted in Figure 5.13
(See Appendix IV for data). The initial concentrations of acetic acid, Cu-Acetate and
indomethacin in DMF were 60, 8 and 6.2 mg.g-1, respectively. These concentrations
were chosen close to the conditions that are to be used during the Cu-Indo synthesis.
The presence of acetic acid resulted in a 10 fold increase in the solubility of Cu-Indo.
Precipitation only occurred at a pressure above 5 MPa, corresponding to a CO2 mole
fraction of 0.7. Above these pressures pure Cu-Indo precipitated from solution. Cu-Indo
is dissociated in the presence of acetic acid to indomethacin and Cu-Acetate. A driving
force is needed to push the equilibrium toward the formation of Cu-Indo. Carbon
dioxide is able to induce precipitation of Cu-Indo at pressures above 5 MPa. At these
conditions CO2 drives the equilibrium toward the formation of Cu-Indo by its
antisolvent action.

CHAPTER 5
175
Pressure / MPa
% E
xpan
sion
00.0 2.0 4.0 6.0 8.0
200
400
600
800
1000
Figure 5.12 Volumetric expansion of DMF containing acetic acid at 25°C.

CHAPTER 5
176
Pressure / MPa
Con
cent
ratio
n / m
g.g-1
0.0
10.0
20.0
30.0
40.0
50.0
60.0
70.0
0.0 2.0 4.0 6.0 8.0
Indomethacin
Cu-Acetate
Acetic Acid
Ternary Cu-indo
Figure 5.13 Solubility of Cu-Indo in quaternary systems at 25°C.

CHAPTER 5
177
The presence of Cu-Acetate resulted in a four fold increase in the initial concentration
of Cu-Indo. In this case, however, the precipitation of Cu-Indo followed a similar trend
to that of the ternary CO2—DMF—Cu-Indo system, where precipitation occurred
throughout the pressurisation process. The presence of indomethacin resulted in a two
fold decrease in the initial concentration of Cu-Indo. Precipitation of Cu-Indo occurred
throughout the pressurisation process shown by the solubility decrease in Figure 5.13.
In the ternary CO2—DMF—Cu-Acetate system, an initial Cu-Acetate concentration of
8 mg.g-1 would result in precipitation occurring at pressures above 5 MPa. However, in
the presence of Cu-Indo the precipitation of Cu-Acetate began at 2 MPa (Figure 5.14). It
is suggested that Cu-Indo lowered the solubility of Cu-Acetate in the DMF expanded
solution. The concentration of indomethacin in the expanded solution is illustrated in
Figure 5.14. The concentration of indomethacin remained constant at all pressures,
which implies that Cu-Indo could be separated from indomethacin simply by increasing
the pressure of the system. It is interesting to note that at a concentration of 6.2 mg.g-1
of indomethacin in DMF, the second liquid phase did not appear in the system.
5.5. Conclusions
The volumetric expansion and solubility studies of the binary, ternary and quaternary
systems demonstrate that the solubility of a compound such as Cu-Indo in an expanded
solution depends not only on temperature and pressure, but also on the concentration
and presence of other compounds dissolved in the system. The effect of pressure and
temperature can be related to CO2 density and is predictable. However, the phase
behaviour and hence the solubility of Cu-Indo is a complex function of the solvent and
other solutes.
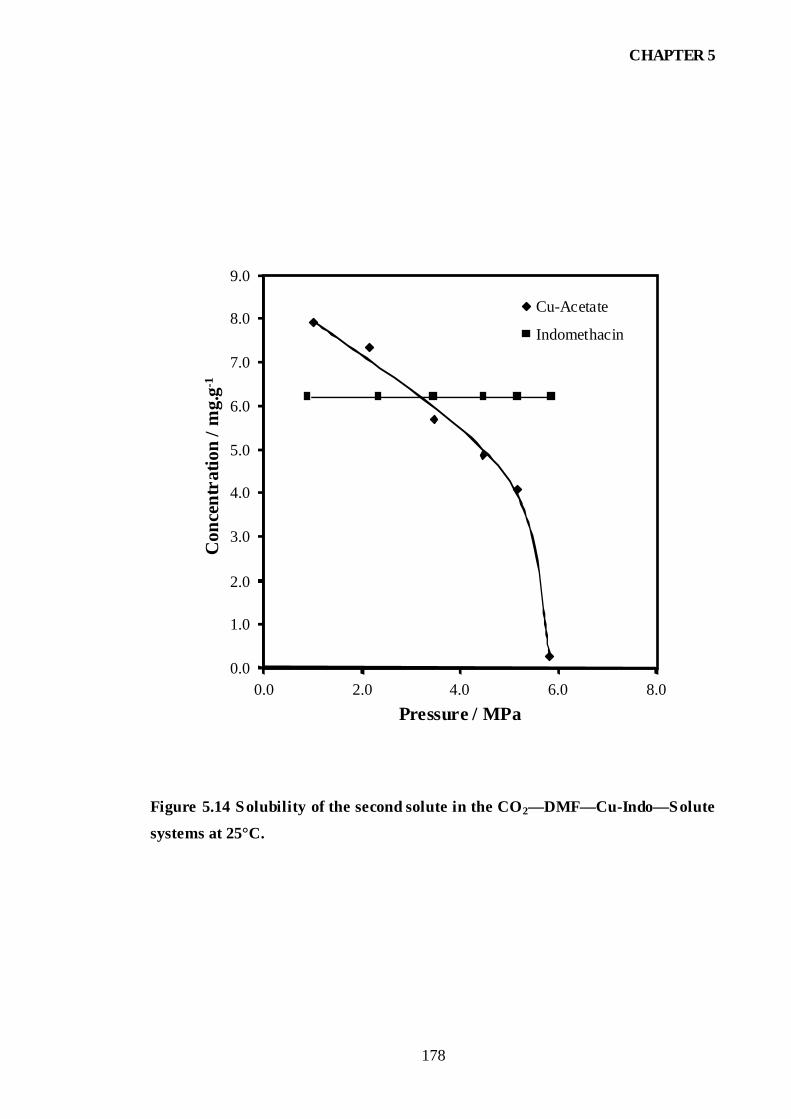
CHAPTER 5
178
Pressure / MPa
Con
cent
ratio
n / m
g.g-1
0.0
1.0
2.0
3.0
4.0
5.0
6.0
7.0
8.0
9.0
0.0 2.0 4.0 6.0 8.0
Cu-Acetate
Indomethacin
Figure 5.14 Solubility of the second solute in the CO2—DMF—Cu-Indo—Solute
systems at 25°C.

CHAPTER 5
179
5.6. References
1. Reichardt, C.; "Solvent and Solvent Effects in Organic Chemistry," 2 ed.; VCH:
Weinheim, Germany, 1990.
2. Kordikowski, A.; Schenk, A. P.; Van Nielen, R. M.; Peters, C. J.; "Volume
Expansions and Vapor-Liquid Equilibria of Binary Mixtures of a Variety of Polar
Solvents and Certain Near-Critical Solvents," J. Supercrit. Fluids 1995, 8, 205.
3. Dixon, D. J.; Johnston, K. P.; "Molecular Thermodynamics of Solubilities in Gas
Anti-Solvent Crystallization," AIChE J. 1991, 37, 1441.
4. Foster, N. R.; Yun, S. L. J.; Dillow, A.; Wells, P. A.; Lucien, F. P.; "A Fundamental
Study of the Gas Anti-Solvent Process," The 4th International Symposium on
Supercritical Fluids, Sendai, Japan, 1997, A, 27.
5. Bungert, B.; Sadowski, G.; Arlt, W.; "Separations And Material Processing In
Solutions With Dense Gases," Ind. Eng. Chem. Res. 1998, 37, 3208.
6. Thiering, R.; Dehghani, F.; Dillow, A.; Foster, N. R.; "Solvent Effects On The
Controlled Dense Gas Precipitation Of Model Proteins," J. Chem. Technol.
Biotechnol. 2000, 75, 29.
7. Tai, C. Y.; Cheng, C.-S.; "Effect of CO2 on Expansion and Supersaturation of
Saturated Solutions," AIChE J. 1998, 44, 989.
8. Bertucco, A.; Lora, M.; Kikic, I.; "Fractional Crystallization by Gas Anti-Solvent
Technique: Theory and Experiments," AIChE J. 1998, 44, 2149.

CHAPTER 6
180
6. SYNTHESIS AND PURIFICATION OF COPPER
INDOMETHACIN USING THE GAS AND ASES PROCESSES
6.1. Introduction
The major emphasis of the GAS and ASES processes has been to develop fine
particles.1,2 Some work has been published on the use of these techniques to purify
chemicals by selectively precipitating impurities and removing the substance of interest,
or by precipitating the desired substance and leaving the impurities behind in solution.3-
12
A new application of GAS or ASES is in the area of chemical reactions. In most
chemical reactions, it is desirable to obtain product of the highest possible purity, in the
least number of steps and using as little solvent as possible. This becomes increasingly
important in the pharmaceutical industry, where the presence of impurities in the final
product can make the batch unsuitable for use. Removing these impurities is often more
complex than the initial reaction and is very costly in terms of equipment required and
time taken to carry out the purification steps. These impurities come from a number of
sources namely: unreacted reactants, side reactions, unwanted isomers and residual
solvents. The use of dense gases as antisolvents can provide a convenient way of
removing these impurities.
A further advantage of using dense gases in chemical reactions is the ability to control
solvent parameters such as density, viscosity and diffusivity. Changes in these
parameters have been well documented for reactions undertaken in supercritical
fluids.13,14 The ability of the solvent to dissolve the product can be altered by varying
pressure and temperature. Reactions that are equilibrium controlled can then be
controlled by selectively removing product from the reaction mixture through
precipitation. One example is the reaction of isoprene with maleic anhydride in
supercritical CO2.14 Undesirable side reactions can be avoided by removing the product
from the reaction as it forms.

CHAPTER 6
181
In this study, the feasibility of using CO2 as an antisolvent in the synthesis and
processing of Cu-Indo (introduced in the background section) is examined. Cu-Indo
may be synthesised by the following reaction:
4 Indomethacin + 2 Cu-Acetate ↔ Cu-Indo + 4 Acetic Acid 6.1
In this reaction, Cu(II) acetate monohydrate (Cu-Acetate) is reacted with indomethacin
in an organic solvent such as N,N-dimethylformamide (DMF) to yield Cu-Indo.
The conventional process for the synthesis of Cu-Indo involves multiple stages as
shown in Figure 6.1. Organic solvents, such as DMF as the primary solvent and ethanol
as the antisolvent, are used in both the synthesis and purification of Cu-Indo, which
results in the generation of solvent waste as well as solvent residues in the drug. The
crystallisation step, which commences once the ethanol is added to the synthesis
mixture, takes longer than 24 hours. The organic solvents are removed by filtration,
which is a slow process mainly due to the blockage of filters. The larger the batch size
the more complex the problem becomes. A single filtration step is not sufficient to
purify Cu-Indo and a washing step is needed to remove impurities, which requires
further filtration and product loss. The Cu-Indo is then dried to remove the wash
solvent. The drug is unstable at elevated temperatures, which means that lower
temperatures need to be used for drying thus requiring long drying times.
Utilisation of the GAS or ASES processes in the Cu-Indo synthesis enables the entire
process to be performed in a single vessel and at room temperature. With the GAS
process, once reaction is complete, the expanded solution is filtered and the precipitated
drug washed with antisolvent. When the synthesis is performed by means of the ASES
process the antisolvent—solvent mix is continuously removed from the precipitated
drug by filtration. Once precipitation is complete, washing of the precipitate is
performed by simply stopping the flow of solution thereby allowing pure antisolvent to
flow through the vessel. The reduced viscosity and increased diffusivity of the dense
gas results in a solution that is easier to filter thus speeding up filtration time. The
antisolvent is then removed from Cu-Indo by a simple depressurisation.

CHAPTER 6
182
DMF
antisolvent
reactantsFiltration Step Filtration Stepresidual
Cu-Indo
DMF
++
+
Wash andCu-Indo
+
residualwash solvent
Drying StepCu-Indo
Conventional Process
DMF
antisolvent
reactants
Filtration Step+
+
Solvent Recovery Solvent Recovery
Heat
Solvent RecoveryDepressurisation
Depressurisationto giveCu-Indo
GAS / ASES Process
Figure 6.1 Comparison between the conventional, GAS and ASES processes for the
synthesis of Cu-Indo.

CHAPTER 6
183
Another advantage of performing the synthesis by GAS or ASES is that, at all times, the
process is under an atmosphere of CO2 with no exposure to the outside environment.
The potential of drug oxidation or contamination by foreign substances is reduced,
which is particularly important in pharmaceutical manufacture.
One of the objectives in the synthesis of Cu-Indo is to maximise yield and, at the same
time, reduce solvent usage. Both reactants need to be soluble to enable the reaction to
take place, therefore the limiting reactant in the Cu-indo synthesis is Cu-Acetate with a
solubility of approximately 60 mg.g-1 (0.3 mmol/g) in DMF at 25°C. Accordingly, the
concentration of indomethacin for complete reaction would need to be 215 mg.g-1 (0.6
mmol/g). Reaction of Cu-Acetate and indomethacin at this concentration in solution
yields Cu-Indo and acetic acid at concentrations of 255.5 mg.g-1 (0.15 mmol/g) and 72
mg.g-1 (0.12 mmol/g) respectively.
6.2. Experimental
All chemicals and reagents used in the synthesis of Cu-Indo are listed in Table 6.1. All
chemicals and reagents were used as supplied.
Table 6.1 Chemicals and reagents.
Chemical/Reagent Purity (%) /
Grade
Supplier
Copper Indomethacin 90 Biochemical Veterinary Research
Copper (II) Acetate 98 Sigma-Aldrich
Indomethacin 99 Shanghai Shon Long
Pharmaceutical Factory
Glacial Acetic Acid 99.7 Ajax Chemicals
N,N-dimethylformamide 99.9 Burdick and Jackson
Ethanol 99.8 CSR Distilleries
Carbon Dioxide > 99.9 BOC Gasses
Tetramethylammonium Chloride 97 Aldrich Chemical Co.
Acetonitrile 99.8 EM Science

CHAPTER 6
184
6.2.1. Experimental Apparatus and Procedure
The GAS experimental apparatus used in the synthesis experiments is shown
schematically in Figure 6.2. The apparatus consists of a high pressure vessel (Jerguson
sight gauge series No. 32) with an internal volume of 60 mL. The reaction vessel
enabled observation of phase behaviour throughout each experiment. A magnetic stirrer
was designed for the high pressure vessel to ensure the solution was well mixed before
and during sampling. A 0.5 µm stainless steel filter frit was situated at the bottom of the
reaction vessel to sparge the CO2 in the liquid phase during pressurisation and to trap
any precipitated solid in the washing step. A 500 mL stainless steel surge tank was
placed before the reaction vessel to maintain constant pressure while a sample was
taken. An ISCO LC-500 syringe pump was used to generate the required pressure.
Pressure monitoring was made possible by the use of a Druck Pressure transducer
(Model DPI 260 ± 0.007 MPa). The temperature was controlled to within 0.1°C by
submerging the apparatus in a water bath heated with a Thermoline Unistat 130 water
heater. The flow of CO2 through the reaction vessel was from the bottom during the
pressurisation step or from the top during the washing step and was controlled by two
three way ball valves (Whitey SS-41XS2). A solvent trap was placed after the three way
ball valves.
Syntheses by GAS experiments were conducted by mixing Cu-Acetate and
indomethacin in a 1:2 molar ratio in DMF. Sufficient DMF was added to adjust the
synthesis solution to the desired concentration. The reaction vessel was then charged
with a 5 to 10 mL volume of the mixture and brought to the desired pressure by passing
CO2 through the filter. Once reaction was complete, the liquid was removed at constant
pressure by passing CO2 from the top of the vessel and pushing the liquid through the
filter. Cu-Indo that had precipitated was washed and dried by removing the solvent rich
liquid phase at a constant pressure between 5.7 and 5.9 MPa and a CO2 flow rate of 2 to
4 mL.min-1. In each batch 200 to 400 mL of CO2 was used to minimise the residual
solvent. The system was then depressurised and a sample taken for analysis.
A schematic of the ASES experimental apparatus is shown in Figure 6.3. The apparatus
is similar to the GAS apparatus with the following exceptions: The magnetic stirrer was

CHAPTER 6
185
P
CO2 Source
Syringe PumpHeating Coil
Magnetic StirrerThermostatedHeater
Reaction Vessel
Water bath
CO2Reservoir
Filter
T
Solvent Trap
Figure 6.2 GAS experimental apparatus.
P
CO2 Source
Syringe PumpHeating Coil
Reaction Vessel
Water bath
CO2Reservoir
Filter
T
Reactant Solution
HPLC Pump
Nozzle
Solvent Trap
ThermostatedHeater
Figure 6.3 ASES experimental apparatus.
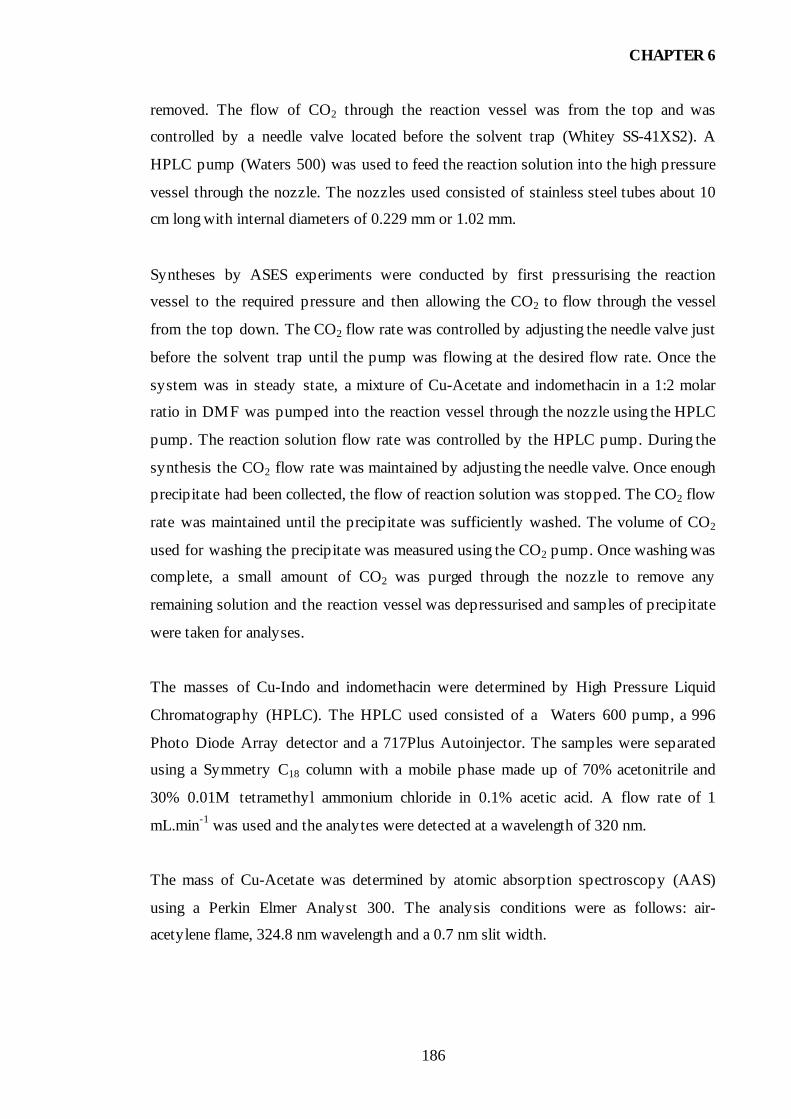
CHAPTER 6
186
removed. The flow of CO2 through the reaction vessel was from the top and was
controlled by a needle valve located before the solvent trap (Whitey SS-41XS2). A
HPLC pump (Waters 500) was used to feed the reaction solution into the high pressure
vessel through the nozzle. The nozzles used consisted of stainless steel tubes about 10
cm long with internal diameters of 0.229 mm or 1.02 mm.
Syntheses by ASES experiments were conducted by first pressurising the reaction
vessel to the required pressure and then allowing the CO2 to flow through the vessel
from the top down. The CO2 flow rate was controlled by adjusting the needle valve just
before the solvent trap until the pump was flowing at the desired flow rate. Once the
system was in steady state, a mixture of Cu-Acetate and indomethacin in a 1:2 molar
ratio in DMF was pumped into the reaction vessel through the nozzle using the HPLC
pump. The reaction solution flow rate was controlled by the HPLC pump. During the
synthesis the CO2 flow rate was maintained by adjusting the needle valve. Once enough
precipitate had been collected, the flow of reaction solution was stopped. The CO2 flow
rate was maintained until the precipitate was sufficiently washed. The volume of CO2
used for washing the precipitate was measured using the CO2 pump. Once washing was
complete, a small amount of CO2 was purged through the nozzle to remove any
remaining solution and the reaction vessel was depressurised and samples of precipitate
were taken for analyses.
The masses of Cu-Indo and indomethacin were determined by High Pressure Liquid
Chromatography (HPLC). The HPLC used consisted of a Waters 600 pump, a 996
Photo Diode Array detector and a 717Plus Autoinjector. The samples were separated
using a Symmetry C18 column with a mobile phase made up of 70% acetonitrile and
30% 0.01M tetramethyl ammonium chloride in 0.1% acetic acid. A flow rate of 1
mL.min-1 was used and the analytes were detected at a wavelength of 320 nm.
The mass of Cu-Acetate was determined by atomic absorption spectroscopy (AAS)
using a Perkin Elmer Analyst 300. The analysis conditions were as follows: air-
acetylene flame, 324.8 nm wavelength and a 0.7 nm slit width.

CHAPTER 6
187
Differential Scanning Calorimetry (DSC) (2010 TA Instruments) was conducted by
heating 10 mg of sample in aluminium pans from 25 °C to the desired upper limit at 10
°C/min.
Room temperature X-band Electron Paramagnetic Resonance (EPR) spectroscopy was
used to determine the integrity of the Cu-Indo dimer. EPR spectra were measured using
a Bruker EMX EPR at X-band frequencies of approximately 9.5 GHz and ambient
temperatures.
Solid-state infrared spectroscopy (400-4000 cm-1, KBr matrix and background) spectra
were recorded using a Bio-Rad FTS-40 spectrophotometer fitted with a DRIFTS
attachment (resolution 4 cm-1 at 4000 cm-1, 2 cm-1 at 2000 cm-1 and 1 cm-1 at 1000 cm1).
A KBr background was recorded prior to each measurement, with a 30 s CO2 purge of
the chamber prior to each series of scans (16 scans per sample). All spectra were
normalised on their most intense peak.
6.3. Synthesis of Cu-Indo by the GAS Process
The results of the GAS synthesis experiments are given in Table 6.2. The target Cu-
Indo concentration was varied from 5 mg.g-1, below the ternary saturation concentration
to 200 mg.g-1 which is close to the maximum possible synthesis concentration.
The behaviour of the system during the synthesis was dependent on the concentration of
solute. In the dilute solutions (e.g. 5, 10, and 20 mg.g-1) Cu-Indo precipitated from
solution at 5.2 MPa. The higher concentration solutions (e.g. 50, 100 and 200 mg.g-1)
resulted in a second liquid phase, which appeared as liquid droplets. This second liquid
phase dried into solid Cu-Indo upon further pressurisation. The extent of formation of
the second liquid phase increased with increasing concentration of reactant and hence
Cu-Indo. The second liquid phase was hardly noticeable when 50 mg.g-1 of Cu-Indo
was produced, while at 200 mg.g-1 it was significant. The nature of the precipitates was
a function of the Cu-Indo concentration produced during the synthesis. Free flowing
precipitates made up of individual particles were collected from dilute solutions, while
agglomerated particles were formed from solutions of higher concentration.
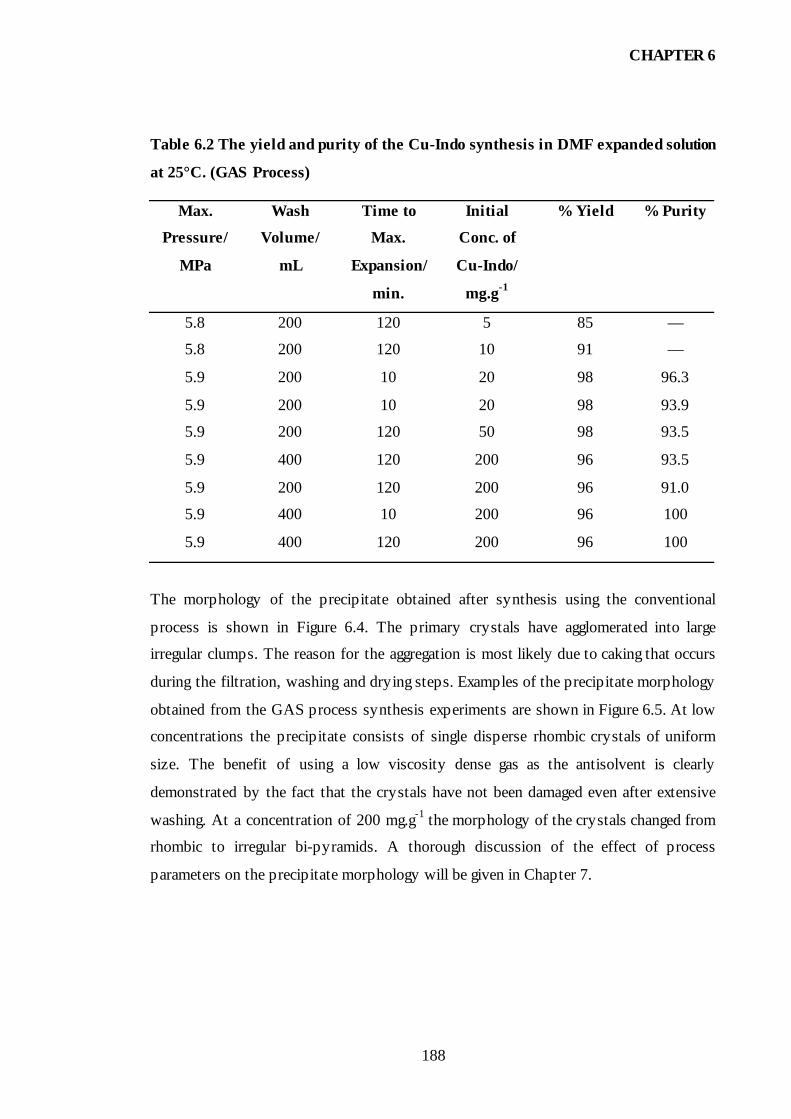
CHAPTER 6
188
Table 6.2 The yield and purity of the Cu-Indo synthesis in DMF expanded solution
at 25°C. (GAS Process)
Max.
Pressure/
MPa
Wash
Volume/
mL
Time to
Max.
Expansion/
min.
Initial
Conc. of
Cu-Indo/
mg.g-1
% Yield % Purity
5.8 200 120 5 85 —
5.8 200 120 10 91 —
5.9 200 10 20 98 96.3
5.9 200 10 20 98 93.9
5.9 200 120 50 98 93.5
5.9 400 120 200 96 93.5
5.9 200 120 200 96 91.0
5.9 400 10 200 96 100
5.9 400 120 200 96 100
The morphology of the precipitate obtained after synthesis using the conventional
process is shown in Figure 6.4. The primary crystals have agglomerated into large
irregular clumps. The reason for the aggregation is most likely due to caking that occurs
during the filtration, washing and drying steps. Examples of the precipitate morphology
obtained from the GAS process synthesis experiments are shown in Figure 6.5. At low
concentrations the precipitate consists of single disperse rhombic crystals of uniform
size. The benefit of using a low viscosity dense gas as the antisolvent is clearly
demonstrated by the fact that the crystals have not been damaged even after extensive
washing. At a concentration of 200 mg.g-1 the morphology of the crystals changed from
rhombic to irregular bi-pyramids. A thorough discussion of the effect of process
parameters on the precipitate morphology will be given in Chapter 7.

CHAPTER 6
189
100 µm
Figure 6.4 SEM image of the Cu-Indo obtained from the conventional synthesis.

CHAPTER 6
190
(b)
(a)
10 µm
20 µm
Figure 6.5 SEM images of the precipitates collected after GAS processing at 25°C.
(a) A 5 mg.g-1 solution of Cu-Indo in DMF expanded slowly without stirring. (b) A
200 mg.g-1 solution of Cu-Indo in DMF expanded rapidly with stirring.

CHAPTER 6
191
The yield of each synthesis experiment was calculated by comparing the initial
concentration of Cu-Indo to the concentration in the liquid removed once precipitation
had ceased. The yield was greater than 90%, except at lower concentrations where the
yield was 85%. The amount of Cu-Indo that remained soluble in the expanded DMF
was a function of the acetic acid concentration. Quaternary data for the CO2—DMF—
Cu-Indo—acetic acid system indicates that the solubility of Cu-Indo increased in the
presence of acetic acid. During the synthesis four moles of acetic acid are formed for
each mole of Cu-Indo formed, therefore, the yield decreases due to the increased
concentration of acetic acid. However, a yield of 90% is quite reasonable.
The purity of the precipitates collected was determined by HPLC and was found to vary
between 91 and 100%. The purity of Cu-Indo depends on a number of factors such as
residual solvent, co-precipitants and molecules of solvation. A thorough characterisation
of Cu-Indo indicated that it is not unusual for molecules such as water and DMF to be
included in the Cu-Indo crystals.15,16 The water most likely comes from Cu-Acetate
which has a water molecule included in its crystal. Water and DMF do not form part of
the Cu-Indo structure but are included in the crystal as molecules of solvation. These
molecules are difficult to remove as they are quite strongly bound in the crystals. A
purity of greater than 94% is therefore considered acceptable. Purities greater than 94%
will occur when molecules of solvation are not included in the crystal.
The volume of CO2 used for washing was an important factor in removing residual
solvent. Cu-Indo washed with 400 mL of CO2 possessed less residual solvent than that
washed with 200 mL of CO2. The rate of expansion has little effect on the purity of Cu-
Indo. Similar purity results were obtained for both rapid and slow expansion
experiments.
Two Cu-Indo synthesis experiments were conducted at 25°C, one with excess Cu-
Acetate and the other with excess indomethacin, to determine what effect this would
have on the Cu-Indo precipitation. The results are given in Table 6.3. A 5% excess of
Cu-Acetate or indomethacin was added in each case.

CHAPTER 6
192
Table 6.3 The yield and purity of the Cu-Indo synthesis in DMF expanded solution
at 25°C in the presence of excess reactant. (GAS process)
Max.
Pressure/
MPa
Wash
Volume/
mL
Time to
Max.
Expansion/
min.
Reactant in
Excess
% Yield % Purity
5.9 400 120 Indomethacin 99 92.9
5.9 400 120 Cu-Acetate 96 94.8
In the presence of excess Cu-Acetate, the yield of Cu-Indo was 96% and the purity of
the precipitate collected was 94%. An excess of Cu-Acetate does not have any effect on
the purity of the Cu-Indo produced. This is contrary to the data for the CO2—DMF—
Cu-Indo—Cu-Acetate system presented in Chapter 5, which indicated that Cu-Acetate
would precipitate with Cu-Indo. This result demonstrates the complex interactions that
occur in multicomponent mixtures. The presence of the acetic acid has resulted in an
increased solubility of Cu-Acetate in expanded DMF.
The presence of excess indomethacin resulted in a Cu-Indo yield of 99% and a Cu-Indo
purity of 93%. In this case the yield has improved which can be explained by the
quaternary data for the CO2—DMF—Cu-Indo—indomethacin system. The solubility of
Cu-Indo was reduced in the presence of indomethacin, which resulted in more Cu-Indo
precipitating and an increase in the yield of the synthesis. The purity remained the same
implying that the excess indomethacin has remained in solution.
6.4. Synthesis and Purification of Cu-Indo by the ASES Process
A limitation of the GAS process is that the total volume of solution that can be
processed at one time is limited by the size of the vessel. At final conditions of
expansion when performing a GAS precipitation, the liquid solution has expanded by as
much as 900%. The vessel has to be approximately ten fold larger in volume than the
quantity of solution to be processed. A more efficient method, in terms of the quantity
of precipitate that could be obtained for a single run, would be to perform the synthesis
using the ASES process. For example, consider a solution of Cu-indo in DMF at a

CHAPTER 6
193
concentration of 200 mg.g-1 to be expanded in a 100 mL vessel with CO2. In order to
allow for 900% expansion, a maximum of 10 mL of solution could be added per batch.
The approximate yield of Cu-Indo, assuming 100% precipitation, would be 2 g. If the
synthesis was performed using the ASES process, the yield of precipitate that could be
collected in one batch is theoretically limited to the volume of precipitate that could fit
into the 100 mL vessel.
Experiments were performed to determine the applicability of the ASES process to the
synthesis of Cu-Indo and the results of the experiments are given in Table 6.4. The
target Cu-Indo concentration was varied from 20 mg.g-1 to 200 mg.g-1. In all
experiments, a 10 cm stainless steel tube with an internal diameter of 1020 µm was used
as a nozzle. The solution flow rate was 0.2 mL.min-1, the solution flow time was 10
min., and the CO2 flow rate was maintained at between 4 and 5 mL.min-1 during the
precipitation and at 2.5 mL.min-1 during the washing step. A wash volume of liquid CO2
of 200 mL at the pressure and temperature of the experiment was used for each
experiment.
Table 6.4 The purity of the Cu-Indo synthesis in DMF expanded solution at 25°C.
(ASES Process)
Pressure
/ Mpa
Temperature
/ °C
Conc. of
Cu-Indo/ mg.g-1
% Purity
6.89 25 200 98.5
10.34 25 200 102.4
14.48 40 200 100.8
6.89 25 20 97.9
10.34 25 20 101.2
14.48 40 20 103.1
The concentration of Cu-Indo in solution, as in the GAS experiments, affected the
behaviour of the system. In the case of the 200 mg.g-1 solutions, precipitation occurred
as soon as the solution entered the vessel through the nozzle and collected on the sides
and at the bottom of the vessel. After a few minutes, precipitate started collecting

CHAPTER 6
194
around the tip of the nozzle. The same result was observed for all conditions using the
200 mg.g-1 solution.
A different behaviour was observed at all pressures and temperatures examined when
the 20 mg.g-1 solutions were sprayed into the vessel. A cloud of precipitate formed as
soon as the solution entered the vessel which remained suspended in the vessel.
Towards the end of the spraying process fluffy aggregates of some of these particles
were seen to form, at which stage they fell to the bottom of the vessel.
For all experiments performed the Cu-Indo obtained was greater than 97.9% pure. The
purity results greater than 100% are interesting. They indicate that some of the solvent
molecules that are coordinated to the copper atoms may have been removed.
Examples of the precipitate morphology obtained from the ASES process synthesis
experiments are shown in Figure 6.6. At 20 mg.g-1, the precipitate consisted of
aggregates of microspheres. The primary particles were approximately 2 µm in
diameter. At 200 mg.g-1 concentrations, the morphology changed from uniform
microspheres to large spheres of various diameters. These examples are only given as an
indication of the type of precipitates that are obtained from ASES processing and a
thorough discussion of the effect of process parameters on the precipitate morphology
will be given in Chapter 7.
6.5. Characterisation of the GAS and ASES Processed Cu-Indo
The structure of the Cu-Indo complex is thought to be an integral part of the mechanism
of its action as an anti-inflammatory.16 It is therefore important to ensure that GAS or
ASES processing does not alter the basic Cu-Indo molecular structure. The SEM images
have shown that the morphology of the drug is significantly altered after GAS or ASES
processing, particularly at higher concentrations. In order to ascertain whether this
alteration had any effect on the molecular structure a number of analytical techniques
were used to characterise a few of the samples collected.

CHAPTER 6
195
(b)
(a)
100 µm
5 µm
Figure 6.6 SEM images of Cu-Indo precipitates collected after ASES processing at
25°C and 6.89 MPa using a solution flow rate of 0.2 mL.min-1 and a 1020 µm
nozzle. (a) 20 mg.g-1, (b) 200 mg.g-1 solution of Cu-Indo in DMF.
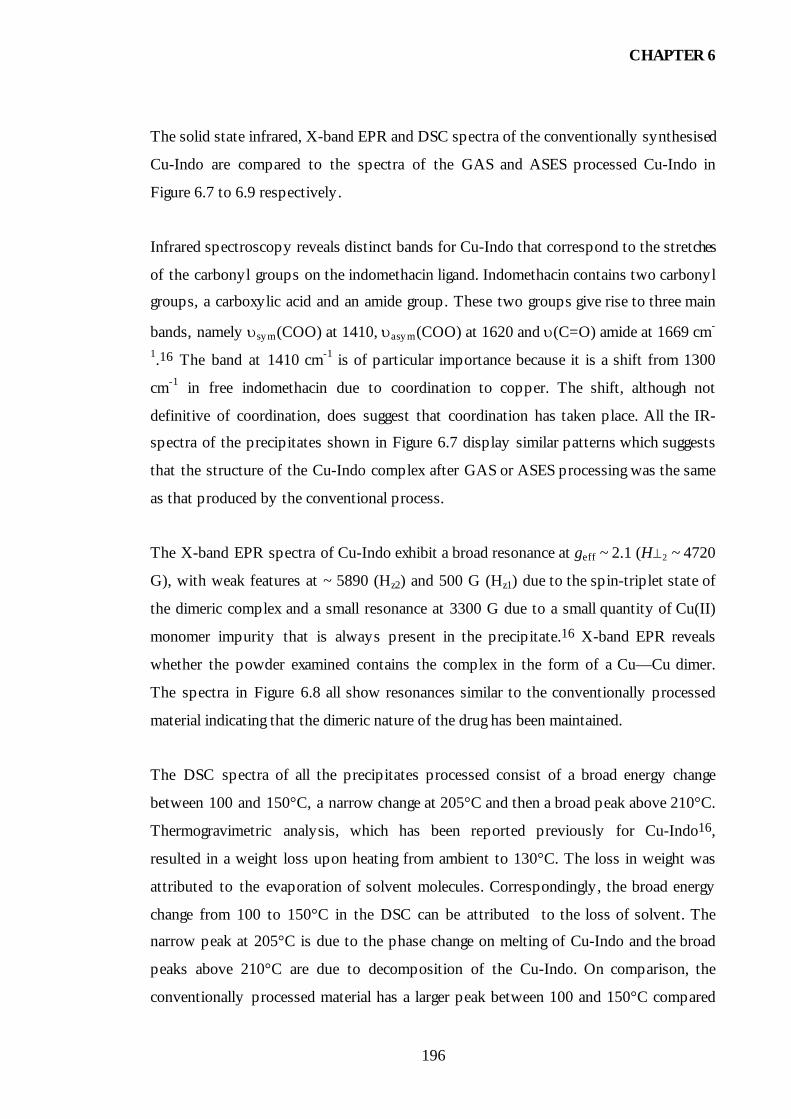
CHAPTER 6
196
The solid state infrared, X-band EPR and DSC spectra of the conventionally synthesised
Cu-Indo are compared to the spectra of the GAS and ASES processed Cu-Indo in
Figure 6.7 to 6.9 respectively.
Infrared spectroscopy reveals distinct bands for Cu-Indo that correspond to the stretches
of the carbonyl groups on the indomethacin ligand. Indomethacin contains two carbonyl
groups, a carboxylic acid and an amide group. These two groups give rise to three main
bands, namely υsym(COO) at 1410, υasym(COO) at 1620 and υ(C=O) amide at 1669 cm-
1.16 The band at 1410 cm-1 is of particular importance because it is a shift from 1300
cm-1 in free indomethacin due to coordination to copper. The shift, although not
definitive of coordination, does suggest that coordination has taken place. All the IR-
spectra of the precipitates shown in Figure 6.7 display similar patterns which suggests
that the structure of the Cu-Indo complex after GAS or ASES processing was the same
as that produced by the conventional process.
The X-band EPR spectra of Cu-Indo exhibit a broad resonance at geff ~ 2.1 (H⊥2 ~ 4720
G), with weak features at ~ 5890 (Hz2) and 500 G (Hz1) due to the spin-triplet state of
the dimeric complex and a small resonance at 3300 G due to a small quantity of Cu(II)
monomer impurity that is always present in the precipitate.16 X-band EPR reveals
whether the powder examined contains the complex in the form of a Cu—Cu dimer.
The spectra in Figure 6.8 all show resonances similar to the conventionally processed
material indicating that the dimeric nature of the drug has been maintained.
The DSC spectra of all the precipitates processed consist of a broad energy change
between 100 and 150°C, a narrow change at 205°C and then a broad peak above 210°C.
Thermogravimetric analysis, which has been reported previously for Cu-Indo16,
resulted in a weight loss upon heating from ambient to 130°C. The loss in weight was
attributed to the evaporation of solvent molecules. Correspondingly, the broad energy
change from 100 to 150°C in the DSC can be attributed to the loss of solvent. The
narrow peak at 205°C is due to the phase change on melting of Cu-Indo and the broad
peaks above 210°C are due to decomposition of the Cu-Indo. On comparison, the
conventionally processed material has a larger peak between 100 and 150°C compared

CHAPTER 6
197
Rel
ativ
e In
tens
ity
400 600 800 1000 1200 1400 1600 1800 2000
Wavenumber / cm-1
(a)
(b)
(c)
(d)
Figure 6.7 Comparison between the Infrared spectra of the conventionally
synthesised Cu-Indo and the GAS and ASES processed Cu-Indo. (a) Conventional
Synthesis, (b) GAS Process, 5 mg.g-1 solution, (c) GAS Process, 200 mg.g-1 solution,
(d) ASES Process, 20 mg.g-1 solution

CHAPTER 6
198
(a)
(b)
(c)
(d)
Magnetic Field / G0 2000 4000 6000 8000 10000
Figure 6.8 Comparison between the X-band EPR spectra of the conventionally
synthesised Cu-Indo and the GAS and ASES processed Cu-Indo. (a) Conventional
Synthesis, (b) GAS Process, 5 mg.g-1 solution, (c) GAS Process, 200 mg.g-1 solution,
(d) ASES Process, 20 mg.g-1 solution

CHAPTER 6
199
(a)
(b)
(c)
(d)
∆H
Temperature / °C50 100 150 200 250
Figure 6.9 Comparison between the DSC spectra of the conventionally synthesised
Cu-Indo and the GAS and ASES processed Cu-Indo. (a) Conventional Synthesis,
(b) GAS Process, 5 mg.g-1 solution, (c) GAS Process, 200 mg.g-1 solution, (d) ASES
Process, 20 mg.g-1 solution

CHAPTER 6
200
with the GAS and ASES processed materials with the precipitate produced by ASES
having the smallest peak. The indication is that synthesising Cu-Indo by the GAS and
ASES processes results in less solvent impurities being present in the final precipitate,
which supports the findings of the purity analyses above. The melting point is consistent
for all the precipitates indicating that GAS and ASES processing has not altered the
molecular structure of the molecule.
6.6. Comparison between CO2 and Ethanol as Antisolvents
The conventional synthesis for Cu-Indo involves the use of ethanol as an antisolvent.
The results of CO2 and ethanol as antisolvents for the DMF—Cu-Indo system in terms
of yield of precipitate relative to mole fraction of antisolvent at 25°C are given in Table
6.5. The yield of Cu-Indo precipitated was greater than 90% for mole fractions of
ethanol from 0.5 to 0.95. In the CO2 system the yield of Cu-Indo was greater than 90%
at mole fractions of CO2 greater than 0.8. Ethanol is a better antisolvent in terms of
yield at low mole fractions and is as effective as CO2 at higher mole fractions.
Carbon dioxide and ethanol are compared as antisolvents in the synthesis of Cu-Indo in
Table 6.6. Sufficient ethanol was added to each solution to give a mole fraction of 0.95.
The synthesis solutions contained target Cu-Indo concentrations of 5, 50 and 200mg.g-1.
The use of ethanol as an antisolvent only resulted in 40 and 75% yields for the 5 and 50
mg.g-1 solutions, respectively. A 91% yield was obtained for the 200 mg.g-1 solution. At
the same mole fraction CO2 gave yields of 85% for the 5 mg.g-1 solutions and greater
than 95% for the 50 and 200 mg.g-1 solutions. The data in Table 6.6 demonstrate that for
the Cu-Indo synthesis CO2 is more effective as an antisolvent, especially when using
low concentrations of Cu-Indo.
The benefits of replacing ethanol with CO2 are to give improved yields and to reduce
the time taken to crystallise Cu-Indo. Crystallisation was complete within 2 hours at
25°C when CO2 was used as the antisolvent, while at least 24 hours was required when
ethanol was used as an antisolvent. An added adavantage is the ease of recycling CO2.
Purification of the CO2, once it has been used as the antisolvent, is achieved by

CHAPTER 6
201
depressurising in a cold trap. Purification of ethanol is achieved by distillation which is
expensive in terms of energy used and time taken.
Table 6.5 Comparison between CO2 and Ethanol as antisolvents for the Cu-Indo—
DMF system at 25°C.
Antisolvent Pressure /
MPa
Antisolvent Mole
Fraction
% Yield
0.1 0.5 90
0.1 0.8 96
0.1 0.9 96 Ethanol
0.1 0.95 96
3.5 0.5 60
4.8 0.7 90 CO2
5.5 0.9 95
5.8 0.95 95
Table 6.6 Comparison between GAS and the conventional process in the synthesis
of Cu-Indo at 25°C.
Antisolvent Pressure/
MPa
Cu-Indo Conc./
mg.g-1
% Yield
Ethanol 0.1 40
CO2 5.8 5
85
Ethanol 0.1 75
CO2 5.8 50
98
Ethanol 0.1 91
CO2 5.8 200
96
6.7. Conclusion
The GAS and ASES techniques were successfully used for the synthesis and
purification of Cu-Indo. A high purity product can be achieved in a single step.
Characterisation of the precipitates obtained from the synthesis of Cu-Indo by the GAS

CHAPTER 6
202
and ASES processed indicated that the drug had maintained its molecular structure, the
only differences being that the GAS and ASES processed materials contained fewer
solvent impurities. The reactants and byproducts of the Cu-Indo synthesis had a marked
effect on the solubility of Cu-Indo in DMF expanded with CO2. Replacing CO2 with
ethanol as an antisolvent was found to increase the yield of the process.
Carbon dioxide provides an excellent alternative to ethanol in the synthesis of Cu-Indo,
giving the advantages of a single step synthesis, faster crystallisation rate, reduced
solvent requirement and controllable particle size.

CHAPTER 6
203
6.8. References
1. Reverchon, E.; "Supercritical Anti-Solvent Precipitation of Micro- and Nano-
Particles," J. Supercrit. Fluids 1999, 15, 1.
2. Bungert, B.; Sadowski, G.; Arlt, W.; "New Processes With Compressed Gases,"
Chem. Ing. Tech. 1997, 69, 298.
3. Shishikura, A.; Kanamori, K.; Takahashi, H.; Kinbara, H.; "Separation and
Purification of Organic Acids by Gas Anti-Solvent Crystallization," J. Agric. Food.
Chem. 1994, 42, 1993.
4. Dixon, D. J.; Johnston, K. P.; "Molecular Thermodynamics of Solubilities in Gas
Anti-Solvent Crystallization," AIChE J. 1991, 37, 1441.
5. Chang, C. J.; Randolph, A. D.; Craft, N. E.; "Separation of β-Carotene Mixtures
Precipitated from Liquid Solvents with High-Pressure Carbon Dioxide," Biotechnol.
Prog. 1991, 7, 275.
6. Liou, Y.; Chang, C. J.; "Separation of Anthracene from Crude Anthracene Using Gas
Anti-Solvent Recrystallization," Sep. Sci. Technol. 1992, 27, 1277.
7. Chang, C. J.; Liou, Y.; "Purification of Polycyclic Aromatic Compounds Using
Salting-Out Separation in High-Pressure Carbon Dioxide," J. Chem. Eng. Jpn. 1993,
26, 517.
8. Chang, C. J.; Liou, Y.; Lan, W. J.; "Relative Supersaturation Ratio and Separation
Factor in Crystallization with High Pressure CO2," Can. J. Chem. Eng. 1994, 72, 56.
9. Jianguo, C.; Zhongwen, Y.; Zhanyun, Z.; "Purification of Bilirubin and Micro-
Particle Formation with Supercritical Fluid Anti-Solvent Precipitation," Chinese J. of
Chem. Eng. 1996, 4, 257.
10. Shishikura, A.; "Applications of Compressed Carbon Dioxide in the Separation
Process of Foodstuffs as a Poor and Anti-Solvent.," The 4th International Symposium
on Supercritical Fluids, Sendai, Japan, 1997, A, 51.
11. Foster, N. R.; Yun, S. L. J.; Dillow, A.; Wells, P. A.; Lucien, F. P.; "A Fundamental
Study of the Gas Anti-Solvent Process," The 4th International Symposium on
Supercritical Fluids, Sendai, Japan, 1997, A, 27.
12. Griffith, A. T.; Park, Y.; Roberts, C. B.; "Separation and Recovery of Nylon from
Carpet Waste using a Supercritical Fluid Anti-Solvent Technique," Polymer Plastics
Technology & Engineering 1999, 38, 411.

CHAPTER 6
204
13. Savage, P. E.; Gopalan, S.; Mizan, T. I.; Martino, C. J.; Brock, E. E.; "Reactions at
Supercritical Conditions: Applications and Fundamentals," AIChE J. 1995, 41, 1723.
14. Subramaniam, B.; McHugh, M. A.; "Reactions in Supercritical Fluids-A Review,"
Ind. Eng. Chem. Process. Des. Dev. 1986, 25, 1.
15. Weder, J. E.; Hambley, T. W.; Kennedy, B. J.; Lay, P. A.; MacLachlan, D.;
Bramley, R.; Delfs, C. D.; Murray, K. S.; Moubaraki, B.; Warwick, B.; Biffin, J. R.;
Regtop, H. L.; "Anti-Inflammatory Dinuclear Copper(II) Complexes with
Indomethacin. Synthesis, Magnetism and EPR Spectroscopy. Crystal Structure of the
N,N-Dimethylformamide Adduct," Inorganic Chemistry. 1999, 38, 1736.
16. Weder, J. E. "Characterisation of Copper(II) Dimers of the Non-Steroidal Anti-
Inflammatory Drug Indomethacin," University of Sydney; 2000

CHAPTER 7
205
7. MICRONISATION OF COPPER INDOMETHACIN USING THE
GAS AND ASES PROCESSES
7.1. Introduction
The parameters of purity and yield are not the only criteria that need to be considered
for many industrial syntheses. For materials such as explosives, catalysts, pigments
and pharmaceuticals, the physical properties such as particle size, particle morphology
and particle size distribution can significantly influence the product quality. This is
especially significant in the synthesis of pharmaceuticals as these physical properties
can have a significant effect on the applicability of a particular delivery system and/or
the pharmaceutical action of the drug. If the product obtained from the actual
synthesis does not meet the stipulated requirements, post synthesis processing such as
ball milling or spray drying is necessary for size reduction.
The GAS and ASES processes have been demonstrated to be effective for the
micronisation of various materials. The primary aim of the work described in this
chapter was to determine the applicability of the GAS and ASES processes as
techniques to micronise Cu-Indo. Of particular interest was the possibility of
micronising Cu-Indo during the synthesis, therefore eliminating the need for post
synthesis processing.
The ability to micronise Cu-Indo is expected to offer a number of advantages over the
particles produced from the conventional synthesis process. Micronisation of Cu-Indo
is expected to increase the dissolution rate of the drug in water. Cu-Indo is relatively
insoluble in water and any increase in dissolution rate is expected to increase
bioavailability. Increased bioavailability offers the possibility of a lower dose having
the required therapeutic response. A lower dose rate reduces the possibility of toxic
side effects and offers a commercial advantage of increased units for a quantity of
drug.

CHAPTER 7
206
The second objective of the work described in this chapter was to determine the GAS
and ASES process variables that affect Cu-Indo particle morphology. The process
conditions examined were chosen to be applicable to commercial processing of the
drug. As discussed in Chapter 4, conflicting results have been reported in the literature
regarding the effect of process parameters on drug particles formed when using dense
gases as anti-solvents. These conflicts have arisen primarily when micronising by
ASES which is indicative of the complexity of the particle formation mechanisms in
operation during the process. The results reported for the micronisation of Cu-indo are
therefore discussed in relation to particle formation mechanisms that are presented in
the literature.
7.2. Experimental
The chemicals and reagents used in the micronisation of Cu-Indo are listed Table 7.1.
All chemicals and reagents were used as supplied.
Table 7.1 Chemicals and reagents.
Chemical/Reagent Purity (%) Supplier
Copper Indomethacin 90 Biochemical Veterinary Research
Copper (II) Acetate 98 Sigma-Aldrich
Indomethacin 99 Shanghai Shon Long
Pharmaceutical Factory
N,N-dimethylformamide 99.9 Burdick and Jackson
N-methylpyrrolidone 99.5 ISP Technologies Inc.
Dimethylsulfoxide 99.8 Ajax Chemicals
Carbon Dioxide > 99.9 BOC Gasses
Iso-propyl Alcohol 99.9 Aldrich Chemical Co.
7.2.1. Experimental Apparatus and Procedure
The GAS and ASES experimental apparatus used in the micronisation experiments
were identical to those described in Chapter 6 for the synthesis of Cu-Indo (Figures
6.2 and 6.3).

CHAPTER 7
207
GAS and ASES micronisation experiments were conducted with two types of
solution. The first type of solution was prepared by dissolving Cu-Indo in a suitable
solvent. The second type of solution examined was prepared by mixing Cu-Acetate
and indomethacin in a 1:2 molar ratio in a suitable solvent, as for the synthesis of Cu-
Indo. Copper indomethacin forms in the presence of acetic acid during the synthesis.
The presence of acetic acid enhances the solubility of Cu-Indo, therefore enabling
dissolution of up to 200 mg.g-1 of Cu-Indo in DMF.
Micronisation by GAS experiments was conducted by charging the vessel with 5 to 10
mL of solution. The vessel was then brought to the desired pressure by passing CO2
through the filter from the bottom. The rate of pressurisation was controlled by means
of a needle valve. Two pressurisation rates were examined. The slow pressurisation
rate experiments were conducted by increasing the pressure from atmospheric to the
desired maximum over 40 minutes. The fast pressurisation rate experiments were
conducted by increasing the pressure from atmospheric to the desired maximum over
1 minute. Once the precipitation was complete, the liquid was removed at constant
pressure by passing CO2 from the top of the vessel and pushing the liquid through the
filter. The Cu-Indo that precipitated was washed and dried by removing the solvent
rich liquid phase at a constant pressure between 5.7 and 5.9 MPa and a CO2 flow rate
of 2 to 4 mL.min-1. In each batch 200 to 400 mL of CO2 was used to minimise the
residual solvent. The system was depressurised and a sample taken for analysis.
Micronisation by ASES experiments was conducted by first pressurising the reaction
vessel to the required pressure and then allowing the CO2 to flow through the vessel
from the top down. The CO2 flow rate was controlled by adjusting the needle valve
just before the solvent trap until the pump was flowing at 4 to 5 mL.min-1. Once the
system was in steady state the solution was pumped into the reaction vessel through
the nozzle using the HPLC pump. The solution flow rate was controlled by the HPLC
pump. Once enough precipitate had been collected, the flow of solution was stopped.
The precipitate was washed by maintaining the flow of CO2 through the vessel until
200 mL of CO2, at the pressure in question had passed through the vessel. The volume
of CO2 used for washing the precipitate was measured using the CO2 pump. Once

CHAPTER 7
208
washing was complete, a small amount of CO2 was purged through the nozzle to
remove any remaining solution. The reaction vessel was then depressurised and
samples of precipitate were taken for analysis.
Precipitation of Cu-Indo by ASES with the anti-solvent existing as both a vapour and
a liquid were performed by pressurising the vessel until it was half full with liquid
CO2. The flow of CO2 was then stopped. In order to prevent a large accumulation of
solvent in the vessel, the solution was pumped through the nozzle for approximately 2
minutes and then stopped. Once solution flow was stopped the pressure was increased
to 6.89 MPa and the precipitate was washed with CO2 as described for the other ASES
experiments.
Particle morphology of the solid powders was determined using a scanning electron
microscope (SEM) (Hitachi S4500). Prior to use, samples were mounted on metal
plates and gold coated using a sputter coater under vacuum.
Particle size distributions of the powders were determined using laser diffraction
(Mastersizer, Malvern, UK). The samples were suspended in iso-propyl alcohol and
sonicated for one minute prior to analysis.
X-ray diffraction (XRD) was used to compare the level of crystallinity between the
powders formed. Measurements were made on a Siemans D-500 diffractometer using
Cu-K(alpha) radiation (λ = 1.54056 Å). Samples were placed in aluminium sample
holders and were scanned from 3 to 23° at a scanning rate of 2°.min-1.
7.3. Micronisation by the GAS Process
The size of particles produced by micronisation with GAS has been reported to be
dominated by the rate of expansion of the solution.1-5 The GAS process is essentially
one of nucleation and growth of particles from a supersaturated solution. The size of
particles is then reduced at high expansion rates, due to the high levels of
supersaturation generated, which result in rapid rates of nucleation and consequently
little particle growth.

CHAPTER 7
209
The morphology of particles formed from the GAS process has also been reported to
be affected by the rate of expansion of the solution.4,6-8 The relationship between
particle morphology and rate of expansion of solution arises from the stability of the
environment surrounding a growing particle. The uniformity of crystal morphology is
dependent on the stability of the growth environment during expansion. A slow
expansion rate provides a stable environment for crystal growth resulting in a
uniformly crystalline solid. Conversely, a fast expansion rate results in a turbulent
environment giving rise to particles of less crystalline nature.
The process parameters that have been examined when micronising Cu-Indo by the
GAS process are expansion rate, solvent, stirring, temperature and solute
concentration. The results of the GAS micronisation study are summarised in Table
7.2.
7.3.1. The Effect of Expansion Rate and Stirring
Examples of Cu-Indo particles produced from DMF solutions containing Cu-Indo at a
concentration of 5 mg.g-1 at 25°C and 5.8 MPa are shown in Figure 7.1. A
concentration of 5 mg.g-1 was chosen to ensure that the concentration of Cu-Indo was
below saturation. Precipitation that occurred was therefore a result of the addition of
CO2 to the solution. The particles produced by slow expansion (in Figure 7.1a) of the
solution had a rhombic morphology and particle sizes of 20 µm. Repeated Cu-Indo
crystallisation at the same conditions produced similar particles but the sizes varied
between 50 and 20 µm. The particles generated from the rapid expansion experiments
were not uniform and two different crystal morphologies were observed. The first type
of morphology was similar to that produced by slow expansion but was larger in the
order of 100 µm. The second type was bi-pyramidal in the order of 20 µm.

CHAPTER 7
210
Table 7.2 GAS micronisation results.
Solvent Temp
/ °C
Conc. of
Cu-Indo /
mg.g-1
Expansion
Rate
Morphology Approximate
Particle S ize / µm
DMF 25 5 Slow
No stirring Rhombic 50 — 20
DMF 25 5 Rapid
No Stirring
Rhombic
Bi-pyramidal
100
20
DMF 25 5 Slow Rhombic 50 — 10
DMF 25 5 Rapid Rhombic 50 — 10
DMF 40 5 Slow Rhombic 50
DMF 40 5 Rapid Rhombic 50
NMP 25 5 Slow Aggregates 100 — 50
NMP 25 5 Rapid Aggregates 100 — 50
DMSO 25 5 Slow Aggregates 100 — 50
DMSO 25 5 Rapid Aggregates 100 — 50
DMF 25 200* Slow Bi-pyramidal 2 — 20
DMF 25 200* Rapid Bi-pyramidal 2 — 20
DMF 25 100* Slow Bi-pyramidal 2 — 20
DMF 25 50* Slow Bi-pyramidal 2 — 20
DMF 25 20* Slow Bi-pyramidal 2 — 20
Slow Expansion— 0 to 5.8 MPa over 40 minutes.
Fast Expansion— 0 to 5.8 MPa over 1 minute.
* — These solutions are formed during the synthesis of Cu-Indo and contain acetic acid.
The Cu-Indo particles formed from rapid expansion experiments with a bi-pyramidal
morphology may be the result of a second liquid phase that formed due to inefficient
mixing. Inefficient mixing of the solution resulted in the temporary formation of a
lower DMF—Cu-Indo rich liquid phase and an upper CO2 rich liquid phase. At the
interface of the two phases a precipitate formed that diffused into the DMF rich phase.
Further pressurisation of the solution with CO2 resulted in the two liquid phases
merging. Further precipitation occurred from the single expanded liquid phase. The

CHAPTER 7
211
(b)
(a)
20 µm
100 µm
Figure 7.1 SEM images of Cu-Indo particles produced by the GAS process at
25°C from a 5 mg.g-1 solution of Cu-Indo in DMF. (a) slow expansion, (b) rapid
expansion.

CHAPTER 7
212
Cu-Indo particles with a bi-pyramidal morphology are thought to occur at the interface
between the two liquid phases and the larger rhombic crystals from the system once
the two liquid phases merge. At the interface of the two liquid phases the level of
supersaturation will be greater due to the higher concentration of CO2 dissolved in the
DMF rich phase in the vicinity of the interface. Similar observations have been
reported in the literature when a liquid—liquid phase separation occurs during the
GAS process.5,9 The level of supersaturation is thought to be one of the main factors
that affect crystal habit.10,11 The change in habit with varying supersaturation levels
arises from the change in the relative growth rates of the various crystal faces. With
higher levels of supersaturation the nucleation and growth of crystals will be more
rapid and it is possible for a kinetically favoured crystal form to develop.
In order to determine whether the bi-pyramidal particles were the result of the second
liquid phase formation, the same experiments were conducted with stirring. Stirring
should prevent the formation of the second liquid phase by preventing the buildup of
CO2 at the liquid-vapour interface. Examples of the Cu-Indo particles produced from
DMF solutions containing Cu-Indo at a concentration of 5 mg.g-1 at 25°C and 5.8
MPa are shown in Figure 7.2. The Cu-Indo particles produced from both the slow and
rapid expansion experiments with stirring had a rhombic morphology with sizes
between 50 and 10 µm. A second liquid phase did not occur even when the solution
was expanded rapidly and there was no evidence of the bi-pyramidal particles that
were produced from non-stirred solutions. These results suggest that the bi-pyramidal
crystals were formed at the interface of the two liquid phases. The significant
difference between the particles produced with and without stirring is the degree of
aggregation and the particle size distribution. Two distinct crystal types were formed
in the agitated system. The particles produced were either single rhombic crystals of
approximately 50 µm in size or clusters of crystals of rhombic crystals less than 10
µm in size. It is known that stirring reduces the level of supersaturation achievable in
a liquid solution.12 The reduction in the level of supersaturation with agitation may
explain the similarity in the crystals formed at slow and rapid expansion rates. Even at
the low expansion rate the maximum level of supersaturation is reached. The low level
of supersaturation achievable with stirring is also evidenced by the fact that the

CHAPTER 7
213
(b)
(a)
100 µm
100 µm
Figure 7.2 SEM images of Cu-Indo particles produced by the GAS process at
25°C from a stirred 5 mg.g-1 solution of Cu-Indo in DMF. (a) slow expansion, (b)
rapid expansion.

CHAPTER 7
214
thermodynamically stable rhombic crystal form is produced for both the slow and
rapid expansion experiments.
7.3.2. The Effect of Temperature
In order to investigate the effect of temperature on the Cu-Indo particles produced
from the GAS process, a stirred solution of Cu-Indo in DMF at a concentration of 5
mg.g-1 was expanded with CO2 at 40°C and up to 7.5 MPa. Examples of the particles
collected from slow and rapid expansion experiments are shown in Figure 7.3 (See
also Appendix VI, Figure VI.1). Single rhombic crystals in the order of 50 µm were
obtained from both expansion rates at 40°C.
An increase in temperature is expected to have a number of effects on the crystallising
system. For an equivalent pressure at a higher temperature, the solubility of CO2 in the
solvent will be lower resulting in a lower level of expansion, the solubility of the
solute will increase and the rate of crystal growth is expected to increase. The first two
effects imply that supersaturation will take longer to achieve and that the level of
supersaturation will not be as high as at lower temperature. Lower levels of
supersaturation and increased growth rates imply that with an increase in temperature
larger particles are expected. In both the slow and fast expansion experiments at 40°C
the particles produced were only slightly larger than those produced at 25°C. The
minimal effect of temperature on particle size has been observed in other GAS
systems.5,11,13 The Cu-Indo particles produced at 40°C suggest that the rate of
nucleation is rapid enough to offset any increase in particle growth rate.
7.3.3. The Effect of Solvent
In order to examine the effect of changing the solvent on the size and morphology of
Cu-Indo particles produced from GAS, solutions of Cu-Indo in NMP and DMSO were
precipitated at both a slow and rapid rate of pressurisation. The solutions were stirred
to prevent second liquid phase formation. The pressure was increased from 0 to 5.8
MPa as described above for the DMF solutions. An example of the particles produced
are shown in Figure 7.4 (See also Appendix VI, Figures VI.2 to VI.7). The particles

CHAPTER 7
215
(b)
(a)
100 µm
100 µm
Figure 7.3 SEM images of Cu-Indo particles produced by the GAS process at
40°C from a stirred 5 mg.g-1 solution of Cu-Indo in DMF. (a) slow expansion, (b)
rapid expansion.

CHAPTER 7
216
(b)
(a)
100 µm
100 µm
Figure 7.4 SEM images of Cu-Indo particles produced by the GAS process at
25°C. (a) A stirred 5 mg.g-1 solution of Cu-Indo in NMP expanded rapidly. (b) A
stirred 5 mg.g-1 solution of Cu-Indo in DMSO expanded rapidly.

CHAPTER 7
217
produced from both NMP and DMSO consisted of clusters of needle like crystals.
These clusters ranged in size from 50 to 100 µm. As with the stirred DMF solutions,
the particle size was not a strong function of the rate of expansion.
Changing the solvent from DMF to DMSO and NMP has resulted in a change in Cu-
Indo morphology. Solvent type has been reported to have a dramatic effect on
morphology of particles produced by the GAS process.4,5,7,14-17 Different solvents
provide different environments for particle growth and lead to different growth
mechanisms and, therefore, morphologies.
7.3.4. The Effect of Concentration
In terms of solvent usage and processing steps it would be more economical to use
higher concentration solutions, such as those used in the synthesis of Cu-Indo. To
determine the effect of increasing the concentration of Cu-Indo and the presence of
acetic acid on the Cu-Indo particles produced from the GAS process, DMF solutions
of Cu-Indo at concentrations of 20, 50 , 100 and 200 mg.g-1 were expanded with CO2
at 25°C.
Examples of the Cu-Indo particles produced from the higher concentration DMF
solutions are shown in Figure 7.5 (See also Appendix VI, Figures VI.8 to VI.12). The
particles produced from all the solutions of higher concentration had a bi-pyramidal
morphology. Once again, the rate of expansion had little effect on the morphology or
size of the particles produced.
The change in crystal morphology from rhombic to bi-pyramidal, upon increasing the
concentration of Cu-Indo in DMF, can be explained in terms of the thermodynamic
behaviour of the system. Upon pressurisation with CO2, the solutions of higher
concentration formed a second liquid phase at approximately 4.8 MPa. The second
liquid phase could not be dispersed even with stirring. Some precipitation occurred in
the upper liquid phase but not in the lower solute rich phase. As the pressure was
increased above 4.8 MPa, rapid nucleation occurred in the lower solute rich liquid
phase. After precipitation the two liquid phases merged. An analogous observation has
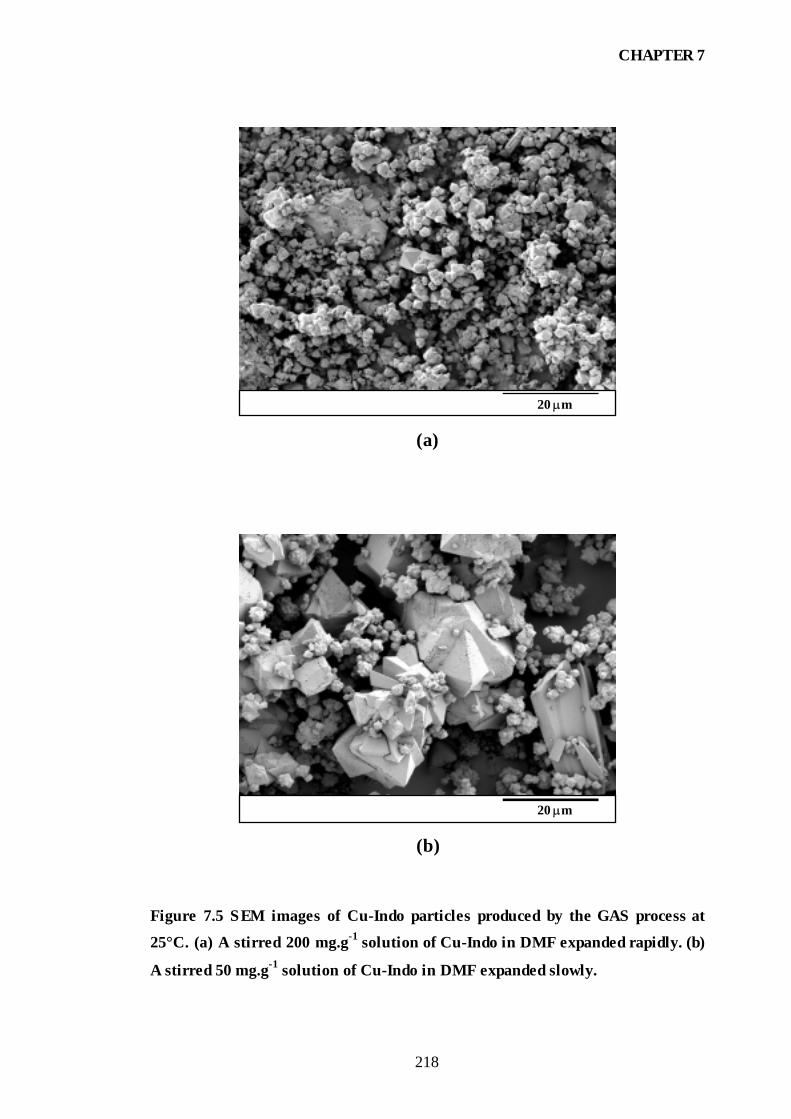
CHAPTER 7
218
(b)
(a)
20 µm
20 µm
Figure 7.5 SEM images of Cu-Indo particles produced by the GAS process at
25°C. (a) A stirred 200 mg.g-1 solution of Cu-Indo in DMF expanded rapidly. (b)
A stirred 50 mg.g-1 solution of Cu-Indo in DMF expanded slowly.

CHAPTER 7
219
been made for a number of other systems containing solute in high concentration.18,19
The formation of a second liquid phase is thought to be the result of intermolecular
forces between the solute and solvent. The strong interactions, which leave little
solvent available to interact with CO2, resulted in a second liquid phase forming at
higher pressures. The hypothesis that the bi-pyramidal crystals are the kinetically
favoured morphology is supported by these high concentration experiments. The
formation of the second liquid phase results in CO2 being unable to dissolve in the
solute rich phase until the pressure reaches values where the Cu-Indo solutions of
lower concentration underwent exponential expansion. As the pressure increases, a
point is reached where the CO2-DMF interactions are favoured over the DMF-Cu-
Indo interactions. At this point DMF is extracted from the solute rich phase resulting
in very high levels of supersaturation in the solute rich phase. These very high levels
of supersaturation favour the formation of the kinetically favoured crystal form, which
in the case of Cu-Indo is the bi-pyramidal morphology.
7.3.5. Summary of the effects of GAS Process Variables
The dominant process variables that effect particle size and morphology when
precipitating Cu-Indo by GAS are solvent type and solute concentration. The change
in morphology from rhombic to bi-pyramidal occurred at conditions where levels of
supersaturation and rates of nucleation were greatest. The bi-pyramidal morphology is
therefore the kinetically favoured crystal form of Cu-Indo.
The size and morphology of Cu-Indo was relatively insensitive to the rate of
expansion and temperature. The insensitivity to the rate of expansion is surprising as
this is often reported to be the dominant variable in the GAS process. The reason for
this is most likely that the level of supersaturation achieved at both expansion rates
investigated was similar. Nucleation rates would then be similar and similar particle
sizes would be expected. The experiments conducted without stirring and at higher
concentration demonstrated that an increase in nucleation rate results in a change in
Cu-Indo morphology from rhombic to bi-pyramidal. The formation of rhombic
particles is therefore evidence of a lower rate of nucleation.

CHAPTER 7
220
From a micronisation perspective, the best particles of Cu-indo were produced from
DMF solution with concentrations greater than 20 mg.g-1. At these conditions the
smallest particles were produced with most particles being less than 20 µm in size.
7.4. Micronisation of Cu-Indo by the ASES Process
Although the ASES process has been used to micronise numerous compounds there is
at present little understood about the ASES particle formation mechanisms. Currently
there are two schools of thought regarding the particle formation mechanisms that
may be in operation.
The first mechanism proposed by Dixon and co-workers20 was based on the idea that
a solution, when injected through a nozzle into a dense gas environment, would
behave in a similar manner to existing spraying processes. The liquid jet, upon
entering the antisolvent environment, breaks up into droplets. Mass transfer processes
of anti-solvent into and solvent out of the droplets results in the formation of particles
within the confines of each droplet. The size of the droplets determines final particle
size.
The second mechanism proposed was by Lengsfeld and co-workers21 who suggested
that droplets do not form when the solution enters the antisolvent. At conditions where
the antisolvent and solvent are totally miscible a rapid decrease in surface tension
around the jet results in the solvent spreading out in a similar manner to a gaseous jet.
Nucleation and growth of particles occurs within this gaseous plume.
Both mechanisms are supported by results obtained in the literature and the exact
mechanism in operation appears to be system dependent. It is important to determine
which mechanism is in operation. Process parameters that determine particle size
differ depending on the particle formation mechanism in operation. Adjusting process
variables of the ASES process and determining their effect on the particles produced
can aid in determining the dominant particle formation mechanism.

CHAPTER 7
221
The process parameters that have been examined for the micronisation of Cu-Indo
using the ASES process include solution flow rate, temperature, nozzle diameter,
solvent type and antisolvent density. As mentioned previously two types of solution
were examined, pure Cu-Indo solutions and synthesis solutions. The results obtained
from the ASES process for both types of solutions are listed in Table 7.3.
Table 7.3 Experimental conditions and results for the micronisation of Cu-Indo
using the ASES technique. The solution and CO2 flow rates were 0.2 and 4–5
mL.min-1 respectively unless otherwise stated.
Solvent Conc. /
mg/g
T /
°C P/ Mpa
Nozzle
Diameter / µm Morphology
Size /
µm
DMF 5 25 6.89 1020 B-P < 5 DMF 5 25 6.89 229 B-P < 5 DMF 5 25 13.79 229 B-P < 5 DMF 5 40 14.48 1020 B-P < 5 DMF 5 40 14.48 229 B-P < 5 DMSO 5 25 6.89 1020 P – DMSO 5 25 13.79 1020 P – DMSO 5 40 14.48 1020 P – NMP 5 25 6.89 1020 I 5 — 2 NMP 5 25 13.79 1020 I 5 — 2 NMP 5 40 14.48 1020 I 5 — 2 DMF* 20 25 6.89 1020 S + B-P ∼ 5 DMF* 20 25 10.34 229 S + B-P ∼ 5 DMF* 20 25 6.89 229 S + B-P ∼ 5 DMF* 20 40 14.48 229 B-P ∼ 5 DMF* 100 25 6.89 229 S ∼ 5 DMF* 100 25 13.79 229 S ∼ 5 DMF*+ 100 25 6.89 229 S ∼ 5 DMF*% 100 25 6.89 229 B-P ∼ 5 DMF* 100 25 6.89 1020 S ∼ 5 DMF* 100 25 6.55 229 S ∼ 5 DMF* 100 40 14.48 229 I-S ∼ 5 NMP* 100 25 6.89 229 S ∼ 20 DMF* 200 25 6.89 1020 S + B-P 50 – 10 DMF* 200 25 10.34 229 S + B-P 50 – 10 DMF* 200 25 6.89 229 S + B-P 50 – 10
* — These solutions are formed during the synthesis of Cu-Indo and contain acetic acid.
+ — Solution flow rate of 0.1 mL.min-1. % — Solution flow rate of 0.5 mL.min-1.
B-P — Bi-pyramidal, S — Spherical, I — Irregular, I-S — Irregular spheres, P – Platelets

CHAPTER 7
222
7.4.1. The Effect of Concentration
Examples of Cu-Indo particles produced from DMF solutions containing Cu-Indo at
various concentrations are shown in Figure 7.6. The Cu-Indo particles produced from
solutions at a concentration of 5 mg.g-1 (Figure 7.6a) had a bi-pyramidal morphology
and were less than 5 µm in size. The Cu-Indo particles produced from solutions at a
concentration of 20 mg.g-1 (Figure 7.6b) had a predominantly spherical morphology
with diameters less than 5 µm. A few particles with a bi-pyramidal morphology were
also evident amongst the particles with a spherical morphology. The bi-pyramidal
particles were of a similar size to the particles with a spherical morphology. The Cu-
Indo particles produced from solutions with a concentration of 100 mg.g-1 (Figure
7.6c) had a spherical morphology with diameters less than 5 µm. At a Cu-Indo
concentration of 200 mg.g-1 (Figure 7.6d), the particles produced were spherical with
diameters ranging from 50 to 20 µm. Further examples of the particles produced from
200 mg.g-1 solutions are shown in Figure 7.7. In some cases, the surface of the spheres
were made up of smaller bi-pyramidal particles and in others the surface of the
spheres were smooth. The large spheres were porous and had hollow centres as shown
in Figure 7.7b. Single bi-pyramidal particles were also present amongst the larger
spheres.
The size and morphology of Cu-Indo particles produced at the conditions studied were
a strong function of solute concentration with an overall increase in particle size. An
increasing particle size with increasing concentration has been reported in the
literature and has been explained based on the jet breaking up into liquid droplets.22-26
An increase in solute concentration increases the viscosity of the solution which tends
to delay atomisation. An increase in solute concentration also enables supersaturation
to be achieved more rapidly. The combined effect of increasing viscosity and rapid
precipitation results in particles forming before the jet is able to atomise into small
droplets. Larger particles are therefore formed from larger droplets.
Alternatively, particle size is expected to decrease with increasing concentration if
nucleation is occurring within a gaseous plume. If the jet disperses as a gaseous
plume, the ASES process resembles the GAS process with extremely rapid rates of

CHAPTER 7
223
(c)
(a)
5 µm
5 µm
(b)
5 µm
(d)
10 µm
Figure 7.6 SEM images of Cu-Indo particles produced by the ASES process at
25°C and 6.89 MPa with a solution flow rate of 0.2 mL.min-1 and a nozzle
diameter of 1020 µm, (a) 5 mg.g-1, (b) 20 mg.g-1,(c) 100 mg.g-1, (d) 200 mg.g-1
solution of Cu-Indo in DMF.

CHAPTER 7
224
(b)
(a)
30 µm
50 µm
Figure 7.7 SEM images of Cu-Indo particles by the ASES process from 200
mg.g-1 solutions of Cu-Indo in DMF at 25°C and 6.89 MPa with a solution flow
rate of 0.2 mL.min-1 and a nozzle diameter of 1020 µm.

CHAPTER 7
225
solvent expansion. Wubbolts and co-workers reported a decrease in particle size with
increasing concentration and attributed their result to increased supersaturation and
rapid rates of nucleation enabling little opportunity for particle growth.27
In the case of the ASES processing of Cu-Indo at the above conditions the particle
formation appears to be a combination of both mechanisms. A negligible change in
particles size is observed when increasing Cu-Indo concentration between 5 and 100
mg.g-1, but an increase in particle size is observed when increasing the Cu-Indo
concentration to 200 mg.g-1. The bi-pyramidal particle morphology which is obtained
from the 5 mg.g-1 solutions is similar to the morphology obtained from the GAS
process at higher concentration conditions. The spherical particles formed at
concentrations between 20 and 100 mg.g-1 concentration of Cu-Indo appear to be
formed from liquid droplets. The formation of spherical particles is, however, not
always indicative of droplet formation. The formation of spherical particles is an
indication of a loss of particle crystallinity. Loss of particle crystallinity has been
attributed to extremely high levels of supersaturation and rapid nucleation rates
preventing the organisation of molecules into a crystalline form.22,23,28-30 It is
feasible that spherical particles can result from nucleation and growth within a
gaseous plume. The formation of microspheres of polystyrene20 and various
proteins16,17 when processing by the GAS processes is evidence of this.
The large spherical particles formed at Cu-Indo concentration of 200 mg.g-1 are
indicative of precipitation occurring from a liquid droplet. Hollow spherical particles
with diameters in the order of 10 to 100 µm have been produced using the ASES
process for solutions of polystyrene in toluene,31 yttrium acetate in DMSO32 and zinc
acetate in DMSO.29 The spheres in the latter two examples had surfaces that were
made up of many smaller primary particles. The proposed particle formation
mechanism for all of the examples given was based on the initial formation of droplets
of solution in the antisolvent. The presence of individual Cu-Indo bi-pyramidal
particles amongst the larger spheres may be a result of the disintegration of the larger
spheres. Reverchon and co-workers have proposed that the presence of such particles
was the result of “exploding balloons”.24,29,33 The proposed mechanism is based on
the formation of a droplet and the subsequent formation of many particles in each

CHAPTER 7
226
droplet. At high enough expansion rates, the droplets continue to expand until they
“explode” resulting in many individual particles.
Observation of the behaviour of the liquid jet when DMF solutions of Cu-Indo, at
various concentrations were sprayed into liquid CO2 was conducted to clarify the
particle formation mechanism in operation. Photographs of a jet of pure DMF and a 5,
100 and 200 mg.g-1 DMF solution of Cu-Indo being sprayed into liquid CO2 at 25°C,
6.89 MPa and a solution flow rate of 0.2 mL.min-1 through a 1020 µm nozzle are
shown in Figure 7.8.
For each solution examined the solution entered the vessel as a stream which had a
diameter similar to the internal diameter of the nozzle. After a few minutes of
spraying, the liquid in the vessel separated into two distinct regions which were
divided by a boundary about 1 cm from the tip of the nozzle. The existence of this
boundary, which is clearly evident in Figure 7.8b, is a result of the co-current flow of
CO2 and solution. The boundary occurs at the point where the solution and CO2
entering the vessel mix. The time delay before the boundary becomes evident is due to
the system reaching steady state conditions. Once steady state conditions are reached
the boundary remains constant.
At a CO2 pressure of 6.89 MPa and a temperature of 25°C, DMF and CO2 are totally
miscible. If jet break-up occurs at these conditions, as for a conventional spray
process, Weber numbers are expected to be large and the jet will atomise into small
droplets. Alternatively, at miscible conditions the rapid disappearance of surface
tension between the solution and the antisolvent results in the jet spreading out in a
gaseous plume and droplets never form.
The photographs shown in Figure 7.8 reveal that below 100 mg.g-1 (Figure 7.8 b and
c) of Cu-Indo in DMF the jet behaviour was similar to that of pure DMF (Figure 7.8a).
Jet break-up occurred for these solutions at approximately 5 mm from the tip of the
nozzle and DMF dissipated into the bulk antisolvent. Precipitation of Cu-Indo occurs
in the area of jet break-up. If jet break-up occurs by atomisation and droplet
formation, then precipitation is occurring within these droplets. If the jet is simply

CHAPTER 7
227
(b)(a)
(d)(c)
Figure 7.8 Photographs of DMF solutions sprayed into liquid CO2 at 25°C and
6.89 MPa at a solution flow rate of 0.2 mL.min-1 through a 1020 µm nozzle, (a)
Pure DMF, (b) 5 mg.g-1, (c) 100 mg.g-1, (d) 200 mg.g-1 Cu-Indo solution.

CHAPTER 7
228
spreading out as a gaseous plume, then precipitation is occurring by nucleation and
growth within this plume.
At a concentration of 200 mg.g-1 of Cu-Indo in DMF a change in jet behaviour
occurred. The jet extended further than the lower concentration solutions before
break-up occurred. Precipitate was seen to form at the tip of the nozzle and forming
particles fell to the bottom of the vessel from a point above the mixing boundary of
DMF and CO2. The jet did not spread out as for the lower concentration solutions.
These observations indicate that at concentrations of 200 mg.g-1 of Cu-Indo in DMF
the increase in solution viscosity results in the jet breaking up into liquid droplets. The
formation of large hollow spheres then results from mass transfer effects occurring on
each droplet.
In summary, increasing the concentration of Cu-Indo in DMF from 5 to 200 mg.g-1
results in a dramatic change in particle size and morphology. The particles produced
from the ASES process using 5, 20 and 100 mg.g-1 solutions of Cu-Indo in DMF are a
quarter of the size of those produced from the GAS process. The ASES particle
formation mechanism at 5 mg.g-1 Cu-Indo concentrations is most likely one of
nucleation and growth within a gaseous plume. At concentrations between 20 and 100
mg.g-1, the particle formation mechanism may be either droplet formation or gaseous
mixing. At Cu-Indo concentrations of 200 mg.g-1, the increased viscosity and surface
tension of the solution results in delayed jet break-up and particles forming from large
droplets.
7.4.2. The Effect of Nozzle Diameter
Cu-Indo solutions in DMF at concentrations of 5, 20, 100 and 200 mg.g-1 were
precipitated by ASES at 25°C and 6.89 MPa at a solution flow rate of 0.2 mL.min-1
through a 229 µm nozzle. Examples of the Cu-Indo particles produced using the
nozzle with reduced diameter are shown in Figure 7.9 (See also Appendix VI, Figures
VI.13 and VI.19).

CHAPTER 7
229
(c)
(a)
5 µm
10 µm
(b)
5 µm
(d)
10 µm
Figure 7.9 SEM images of Cu-Indo particles produced by the ASES process at
25°C and 6.89 MPa with a solution flow rate of 0.2 mL.min-1 and a nozzle
diameter of 229 µm. (a) 5 mg.g-1, (b) 20 mg.g-1, (c) 100 mg.g-1, (d) 200 mg.g-1
solution of Cu-Indo in DMF.

CHAPTER 7
230
For all Cu-Indo concentrations examined, the Cu-Indo particles were similar to those
produced from the corresponding solutions using the 1020 µm nozzle. A reduction in
nozzle diameter had a negligible effect on the morphology or size of the particles
produced.
A negligible change in particle size was reported when decreasing the nozzle diameter
used in the ASES process. This behaviour is indicative of a process where atomisation
is not the dominant process determining particle size.34-36 There are two reasons
which can be used to explain the insensitivity of particle size to nozzle diameter. The
first, based on droplet formation, is that Weber numbers are very large in the ASES
process and the atomisation process is not altered significantly when changing nozzle
diameter. The second reason, based on particles forming by nucleation and growth
within a gaseous like plume, is that reducing nozzle diameter does not alter the rate of
nucleation to any great extent.
7.4.3. The Effect of Antisolvent Density
Cu-Indo solutions in DMF at concentrations of 5, 20, 100 and 200 mg.g-1 were
precipitated by ASES at 25°C and pressures of 10.34 or 13.79 MPa at a solution flow
rate of 0.2 mL.min-1 through a 229 µm nozzle. The Cu-Indo particles produced at
higher CO2 pressure are shown in Figure 7.10.
The particles produced were similar to the particles produced at lower pressure for
each corresponding solution concentration. Changing the anti-solvent pressure from
6.89 MPa to 10.34 and 13.79 MPa had a negligible effect on the size or morphology
of the Cu-Indo particles produced.
At 25°C the density of CO2 at pressures of 6.89 and 13.79 MPa is 0.738 and 0.866
g.mL-1 respectively. An increase in antisolvent density is expected to increase the
Weber number and therefore favour the formation of smaller droplets. From a mass
transfer point of view, an increase in density from 0.738 to 0.866 mg.mL-1 at 25°C
should result in a decrease in the diffusivity of CO2 into the solution and of solvent
into the anti-solvent. The decrease in diffusivity results in a delay in supersaturation of

CHAPTER 7
231
(c)
(a)
5 µm
5 µm
(b)
5 µm
(d)
20 µm
Figure 7.10 SEM images of Cu-Indo particles produced by the ASES process at
25°C with a solution flow rate of 0.2 mL.min-1 and a nozzle diameter of 229 µm.
(a) 5 mg.g-1 solution of Cu-Indo in DMF at 13.79 MPa, (b) 20 mg.g-1 solution of
Cu-Indo in DMF at 10.34 MPa, (c) 100 mg.g-1 solution of Cu-Indo in DMF at
13.79 MPa, (d) 200 mg.g-1 solution of Cu-Indo in DMF at 10.34 MPa.

CHAPTER 7
232
the liquid solution, a decrease in nucleation rate and the subsequent formation of
larger particles. Enhanced atomisation favours the formation of smaller droplets which
results in an increase in the rate of mass transfer of CO2 into the droplet by increasing
the surface area of the liquid solution. An increase in anti-solvent density is therefore
expected to alter the mass transfer and hydrodynamics of the system in a complex
way.
In the experiments conducted with Cu-Indo in DMF, varying the anti-solvent density
between 0.738 and 0.866 g.mL-1 had a negligible effect on the size or morphology of
the particles produced for Cu-Indo concentrations between 5 and 200 mg.g-1. It is
evident that, for the density range examined, any increase in atomisation and reduction
in mass transfer rates was insufficient to alter the particles produced.
The effect of anti-solvent density was further explored for the Cu-Indo solutions at a
concentration of 100 mg.g-1. The pressure of CO2 was decreased at 25°C to 6.55 MPa.
At this pressure and temperature CO2 exists as both a liquid and vapour. The density
of CO2 is drastically reduced when it exists as a vapour. Particles produced when
injecting DMF solutions of Cu-Indo at a concentration of 100 mg.g-1 at 25°C and 6.55
MPa at a solution flow rate of 0.2 mL.min-1 through a 229 µm nozzle are shown in
Figure 7.11.
The Cu-Indo particles collected were spheres with diameters less than 5 µm. The Cu-
Indo particles were similar to the particles produced when injecting the same solution
into liquid CO2, keeping all other conditions the same.
By altering the phase of CO2 from liquid to vapour the behaviour of the jet changed
significantly. The solution fell through the vapour phase as large droplets which
dispersed as they hit the liquid layer. Precipitation occurred as soon as the droplet hit
the liquid layer. The formation of microspheres upon spraying a solution in the vapour
over liquid regime has been observed previously.37-39 Of these studies Bodmeier and
co-workers,37 and Tan and co-workers38 reported that atomisation of the solution in
the vapour phase was the important factor in forming micro-droplets and the
corresponding microparticles. In these experiments the solution flow rate and nozzle

CHAPTER 7
233
10 µm
Figure 7.11 SEM image of Cu-Indo particles by the ASES process from 100
mg.g-1 solutions of Cu-Indo in DMF at 25°C and 6.55 MPa with a solution flow
rate of 0.2 mL.min-1 and a nozzle diameter of 229 µm.

CHAPTER 7
234
diameter were such that atomisation of the liquid jet occurred in the CO2 vapour
phase. Young and co-workers39 observed the same behaviour as seen for Cu-Indo.
The solution did not atomise but formed large droplets which fell through the vapour
phase into the liquid phase. Rapid mass transfer and intense nucleation resulted in the
formation of microspheres.
The Cu-Indo particle size and morphology produced from the vapour phase
experiments supports the hypothesis that the particle formation mechanism, at higher
pressures, is one of nucleation and growth within a gaseous plume. The formation of
microspheres is then a result of rapid rates of nucleation which occur due to the anti-
solvent rich environment of the process. For these solutions the ASES process
becomes an optimised GAS process.
7.4.4. The Effect of Temperature
Cu-Indo solutions in DMF at concentrations of 5, 20 and 100 mg.g-1 were sprayed into
supercritical CO2 at 40°C and 14.48 MPa at a solution flow rate of 0.2 mL.min-1
through a 229 µm nozzle. Examples of the Cu-Indo particles produced at 40°C are
shown in Figure 7.12 (See also Appendix VI, Figure VI.14).
The morphology of the particles produced at all concentrations had a bi-pyramidal
morphology that were less than 5 µm in size. The most significant observation to be
made from the experiments conducted at 40 °C is that the particles produced from the
DMF solutions with a Cu-Indo concentration of 20 and 100 mg.g-1 are no longer
spherical. At a pressure of 14.48 MPa and a temperature of 40°C, CO2 has a density of
0.772 g.mL-1 which falls between the densities studied at subcritical conditions.
An increase in temperature has a multiple effect on the ASES process. The viscosity
of the liquid solution decreases and therefore its velocity through the nozzle should
increase.20 An increase in solution velocity will give larger Weber numbers and
subsequently result in smaller droplets. Mass transfer rates are expected to increase
slightly with increasing temperature.40 Particle growth rates are expected to increase
with increasing temperature.20,24,29,33,40 An increase in temperature therefore results

CHAPTER 7
235
(c)
(a)
5 µm
5 µm
(b)
5 µm
Figure 7.12 SEM images of Cu-Indo particles produced by the ASES process at
40°C and 14.48 MPa with a solution flow rate of 0.2 mL.min-1 and a nozzle
diameter of 229 µm. (a) 5 mg.g-1, (b) 20 mg.g-1, (c) 100 mg.g-1 solution of Cu-Indo
in DMF.

CHAPTER 7
236
in competing effects on particle size. If hydrodynamics dominates, a decrease in
particle size is expected and if growth effects dominate, an increase in particle size is
expected.
In the case of the precipitation of DMF solutions of Cu-Indo at a concentration of 5
mg.g-1, the particle size and morphology was insensitive to changing temperature. For
the 20 and 100 mg.g-1 solution however, increasing the temperature resulted in more
crystalline particles. Increasing the temperature increases the solubility of the solute in
solution. An increase in solubility of Cu-Indo in DMF will tend to lower the level of
supersaturation achievable and a corresponding reduction in nucleation rate results. A
lowering in nucleation rate slows the crystallisation process and more crystalline
particles are able to form.22,23,28-30
The Cu-Indo particles produced at 40°C are further evidence in favour of the particle
formation mechanism being one of nucleation and growth within the expanding
gaseous plume. Interestingly, an increase in temperature did not significantly increase
the size of the Cu-Indo particles. The indication is that the rate of nucleation remained
rapid enough to offset any increase in particle growth.
To further investigate the increase in Cu-Indo crystallinity with increasing
temperature, X-ray diffraction (XRD) spectra were measured for the different types of
precipitates obtained from the ASES process for the 100 mg.g-1 solutions. These
spectra, as well spectra for the unprocessed Cu-Indo, are shown in Figure 7.13. The
XRD spectra of unprocessed Cu-Indo shows that the sample is reasonably crystalline
and is similar to the reported data for Cu-Indo.41 The XRD spectra of the ASES
processed Cu-Indo shows that much of the crystallinity is lost during ASES
processing. The degree of crystallinity of Cu-Indo processed by ASES was slightly
higher at supercritical conditions.

CHAPTER 7
237
7 11 15 19 232q
3
(a)
(b)
(c)
(d)
Rel
ativ
e In
tens
ity
Figure 7.13 X-ray diffraction patterns of Cu-Indo particles produced from the
conventional synthesis process and by the ASES process from 100 mg.g-1
solutions of Cu-Indo in DMF with a solution flow rate of 0.2 mL/min and a nozzle
diameter of 229µm. (a) Conventional synthesis process. (b) 25 °C and 6.89 MPa.
(c) 25 °C and 13.79 MPa. (d) 40 °C and 14.48 MPa.

CHAPTER 7
238
7.4.5. The Effect of Solution Flow Rate
Particles produced from injecting DMF solutions of Cu-Indo at a concentration of
100 mg.g-1, at different solution flow rates through a 229 µm nozzle at a temperature
of 25°C and a pressure of 6.89 MPa are shown in Figure 7.14.
At a solution flow rate of 0.1 mL.min-1 (Figure 7.14a), the particles produced were
spherical with diameters less than 5 µm, similar to those produced at 0.2 mL.min-1
(Figure 7.14b). When the flow rate was increased to 0.5 mL.min-1 (Figure 7.14c), the
morphology of the particles changed from smooth spheres to spheres with an irregular
surface. The particles with an irregular surface resemble the bi-pyramidal particles
produced from these solutions at 40°C (Figure 7.12c). The particles produced at all
flow rates were approximately the same size.
The insensitivity of Cu-Indo particle size to changing solution flow rate can be
attributed to two factors. In terms of hydrodynamics, increasing solution flow rate is
expected to decrease particle size by increasing atomisation of the liquid solution. If,
however, Weber numbers are already very large as in the ASES system, then
increasing solution flow rates will not result in a significant change in atomisation. As
a result, particle sizes are not altered significantly with changing solution flow rate.
The insensitivity of particle size to changing solution flow rate can also be attributed
to a particle formation mechanism that is not dependent on jet atomisation and droplet
formation. If the particle formation mechanism is dominated by the rate of nucleation,
then altering solution flow rates would not be expected to alter particle sizes
significantly.
The change in morphology with increasing solution flow rate can be attributed to the
increase in solvent concentration in the vessel. During an ASES precipitation, the
mole fraction of antisolvent and solvent in the vessel will reach an equilibrium
depending on the relative flow rates of each. In the case of CO2 and DMF this
equilibrium condition is evident by the appearance of a phase boundary just below the
nozzle after a few minutes of operation. If the solution flow rate is increased, or the
antisolvent flow rate decreased, the level of solvent in the vessel will increase. An

CHAPTER 7
239
(c)
(a)
10 µm
10 µm
(b)
10 µm
Figure 7.14 SEM images of Cu-Indo particles produced by the ASES process
from 100 mg.g-1 solutions of Cu-Indo in DMF at 25°C and 6.89 MPa using a
nozzle with a diameter of 229 µm. Solution flow rate of (a) 0.1 mL.min-1, (b) 0.2
mL.min-1, (c) 0.5 mL.min-1.

CHAPTER 7
240
increase in solvent will reduce the mass transfer driving force in the vessel. The level
of supersaturation and the rate of nucleation is reduced. The slowing down of the
precipitation process favours the formation of more crystalline material as is observed
in these experiments. The degree of crystallinity of a number of solutes has been
reported to vary with changing solution or antisolvent flow rate when processing them
by ASES.22,28,40
7.4.6. The Effect of Solvent
The final parameter investigated for the precipitation of Cu-Indo was the effect of
changing solvent. Solutions of Cu-Indo in DMSO and NMP at a concentration of 5
mg.g-1 were precipitated by ASES at temperatures of 25 and 40°C and pressures of
6.89, 13.79 and 14.48 MPa. At the conditions investigated, CO2 and both DMSO and
NMP are totally miscible and the volumetric expansion behaviour of the systems are
similar. The solution flow rate was 0.2 mL.min-1 and the nozzle had a diameter of
1020 µm. Examples of the particles collected from 5 mg.g-1 solutions of Cu-Indo
dissolved in DMSO and NMP are shown in Figure 7.15 a and b, respectively (See also
Appendix VI, Figures VI.15 to VI.18).
The precipitate collected from the DMSO solutions (Figure 7.15a) consisted of
agglomerates of irregular platelets. Increasing the density or temperature of the
antisolvent did not alter the morphology of the precipitate. The particles of Cu-Indo
produced from NMP at all temperatures and pressures investigated were of sizes
between 2 and 5 µm and had an irregular morphology (Figure 7.15b).
The morphology of the particles produced when processing DMSO solutions of Cu-
Indo by ASES were of a similar morphology to those obtained when the same
solutions were precipitated by the GAS process. The particles obtained from the
NMP—Cu-Indo solutions were process dependent. The particles produced from the
ASES process were significantly smaller and less agglomerated than those produced
by the GAS process (Figure 7.4 c and d). The rounded edges of the particles produced

CHAPTER 7
241
(b)
(a)
200 µm
10 µm
Figure 7.15 SEM images of Cu-Indo particles produced by the ASES process
from DMSO and NMP at a Cu-Indo concentration of 5 mg.g-1 with a solution
flow rate of 0.2 mL.min-1 and a nozzle diameter of 1020 µm. (a) Cu-Indo in
DMSO at 40°C and 14.48 MPa. (b) Cu-Indo in NMP at 25°C and 6.89 MPa.

CHAPTER 7
242
by ASES suggested that they were less crystalline, as was observed for DMF—Cu-
Indo solutions.
The effect of increasing the concentration of Cu-Indo in NMP was investigated by
processing a 100 mg.g-1 NMP—Cu-Indo solution by ASES. The particles obtained are
shown in Figure 7.15.
Two distinct Cu-Indo particle types were obtained when processing 100 mg.g-1
NMP—Cu-Indo solutions. Large spheres with diameters in the order of 20 µm and
irregular particles with sizes in the order of 5 µm were produced. The surfaces of the
large spheres were made up of many smaller particles (Figure 7.16b) which had a
similar morphology to the particles obtained from the 5 mg.g-1 NMP—Cu-Indo
solutions (Figure 7.15b).
Changing the solvent used for dilute solutions of Cu-Indo had a dramatic effect on the
morphology of the particles produced. The differences in morphology can be
attributed to the solvent—solute interactions. The solvent forms an integral part of the
Cu-Indo molecular structure in that the solvent molecule occupies a coordination site
on each copper atom. It would therefore be expected that the morphologies of the
crystals would differ upon changing the solvent. Once again, the process variables of
temperature and antisolvent density have had little effect on the particle size and
morphology. It can therefore be concluded that, as with DMF, the dominant particle
formation mechanism in operation at these concentrations is one of nucleation and
growth after the liquid droplets have dispersed.
Increasing the concentration of Cu-Indo in NMP to 100 mg.g-1 resulted in a change in
particle size and morphology. The particle formation mechanism appears to have
changed to one that may be dominated by droplet formation as discussed for the 200
mg.g-1 DMF solutions. The reason for the change in particle formation mechanism
with changing solvent is complex as the solvent has multiple effects in the ASES
process. Changing the solvent can alter the viscosity, vapour pressure, solubility of the
solute, mass transfer and phase behaviour in the system. A change in one or all of
these variables can alter the particle formation mechanism.

CHAPTER 7
243
(b)
(a)
50 µm
3 µm
Figure 7.16 SEM images of Cu-Indo particles produced by the ASES process
from 100 mg.g-1 Cu-Indo solutions in NMP at 25°C and 6.89 MPa with a solution
flow rate of 0.2 mL.min-1 and a nozzle diameter of 229 µm.

CHAPTER 7
244
7.4.7. Summary of the effect of ASES Process Variables
The dominant process parameters which determine Cu-Indo particle size and
morphology when processing by ASES are solute concentration, solution flow rate,
temperature and solvent type. The size of the particles produced increased
significantly when the concentration of Cu-Indo reached 200 mg.g-1 in DMF and 100
mg.g-1 in NMP. At all other concentrations examined, the size of the Cu-Indo particles
was insensitive to process parameters. Particle morphology was found to change from
spherical to bi-pyramidal when increasing temperature or solution flow rate. The
change in morphology could be attributed to decreases in rates of crystallisation.
The change in particle size with increased solution concentration could be explained
by the particle formation mechanism in operation at the experimental conditions
studied. At solute concentrations below 100 mg.g-1, the dispersion of the jet upon
entering the vessel is by a process similar to that of gaseous jets. Droplets are not
formed and the particle formation mechanism is one of nucleation and growth within
the gaseous plume. At solute concentration of 200 mg.g-1 the increase in viscosity
results in increased surface tension and the particle formation mechanism becomes
one of precipitation within forming droplets.
The Cu-Indo particles produced from DMF solutions at concentrations below 100
mg.g-1 are most desirable. The particles produced were less than 5 µm and had a
narrow particle size distribution. Particle sizes below 5 µm are able to be used as
injectable suspensions, in inhalation therapies and as suspensions for use in
ophthalmic applications.
7.5. Particle S ize Distribution
The particle size distribution obtained from the ASES processing of DMF solutions of
Cu-Indo at 20, 100 and 200 mg.g-1 were analysed further using the Malvern
Mastersizer. The results are tabulated in Table 7.4.

CHAPTER 7
245
Table 7.4 Particle size distribution results.
Particle S ize Distribution Conc. /
mg.g-1
T / °C P / MPa Nozzle
Diameter
/ mm
D(v,10%) D(v,50%) D(v,90%)
200 25 10.34 1.02 2.7 4.7 10.1
20 25 6.89 0.229 3.0 5.3 8.6
100 25 6.89 0.229 2.7 (0.3) 4.9 (0.8) 8.5 (1.1)
100 25 13.79 0.229 2.9 (0.1) 5.5 (0.4) 9.7 (0.8)
100 40 14.48 0.229 2.6 (0.4) 4.8 (1.1) 9.8 (1.6)
100 25 6.89 1.02 2.6 (0.1) 4.1 (0.3) 7.1 (0.4)
The solution flow rate was 0.2 mL.min-1 for all experiments.
The results obtained for the particle size distribution support the observation from the
SEM images, with 90% of the volume of particles produced having diameters below
10 µm. The results suggest that little agglomeration of particles has occurred with the
mean particle diameters corresponding to the individual particles observed in the SEM
images.
The particle size distribution of the Cu-Indo precipitates analysed in Table 7.4 are
shown Figure 7.17 (See also Appendix VI, Figures VI.1 to 4). All the precipitates
examined show a similar size distribution between 1 and 10 µm. The formation of
larger spheres at solute concentration of 200 mg.g-1 are evident in Figure 7.17a with a
local maxima in particle diameter at around 25 µm.
The effect of prolonged spraying times on the particle size distribution was
determined by conducting experiments at three different conditions using 100 mg.g-1
solutions of Cu-Indo in DMF. For each experiment the solution was sprayed for 50
minutes. The particle size distribution from the prolonged spraying experiments are
shown in Figure 7.18. A prolonged spraying time has little effect on the particle size
distribution at all conditions examined, which implies that the production of bulk
quantities of precipitate is feasible - an important consideration in terms of scale up.

CHAPTER 7
246
(b)
(a)
0
5
10
15
20
25
30
2.0 2.7 3.6 4.9 6.6 9.0 12.2 16.6 22.5 30.5 48.3Particle Diameter / µm
In %
0
5
10
15
20
25
30
2.0 2.7 3.6 4.9 6.6 9.0 12.2 16.6 22.5 30.5 48.3Particle Diameter / µm
In %
Figure 7.17 Particle size distributions of Cu-Indo particles produced from DMF
solutions by the ASES process. (a) 200 mg.g-1 Cu-Indo solution at 25°C and 10.34
MPa using a 1020 µm nozzle and a solution flow rate of 0.2 mL.min-1, (b) 20
mg.g-1 Cu-Indo solution at 25°C and 6.89 MPa using a 229 µm nozzle and a
solution flow rate of 0.2 mL.min-1.

CHAPTER 7
247
(a)Particle Diameter / µm
In %
0
5
10
15
20
25
30
2.0 2.7 3.6 4.9 6.6 9.0 12.2 16.6 22.5 30.5 48.3
(b)Particle Diameter / µm
In %
0
5
10
15
20
25
30
2.0 2.7 3.6 4.9 6.6 9.0 12.2 16.6 22.5 30.5 48.3
(c)Particle Diameter / µm
In %
0
5
10
15
20
25
30
2.0 2.7 3.6 4.9 6.6 9.0 12.2 16.6 22.5 30.5 48.3
Figure 7.18 Particle size distributions of Cu-Indo particles produced from DMF
solutions at a concentration of 100 mg.g-1 by the ASES process using a 229 µm
nozzle, 0.2 mL.min-1 solution flow rate. (a) 25°C and 6.89 MPa, (b) 25°C and
13.79 MPa, (c) 40°C and 14.48 MPa.
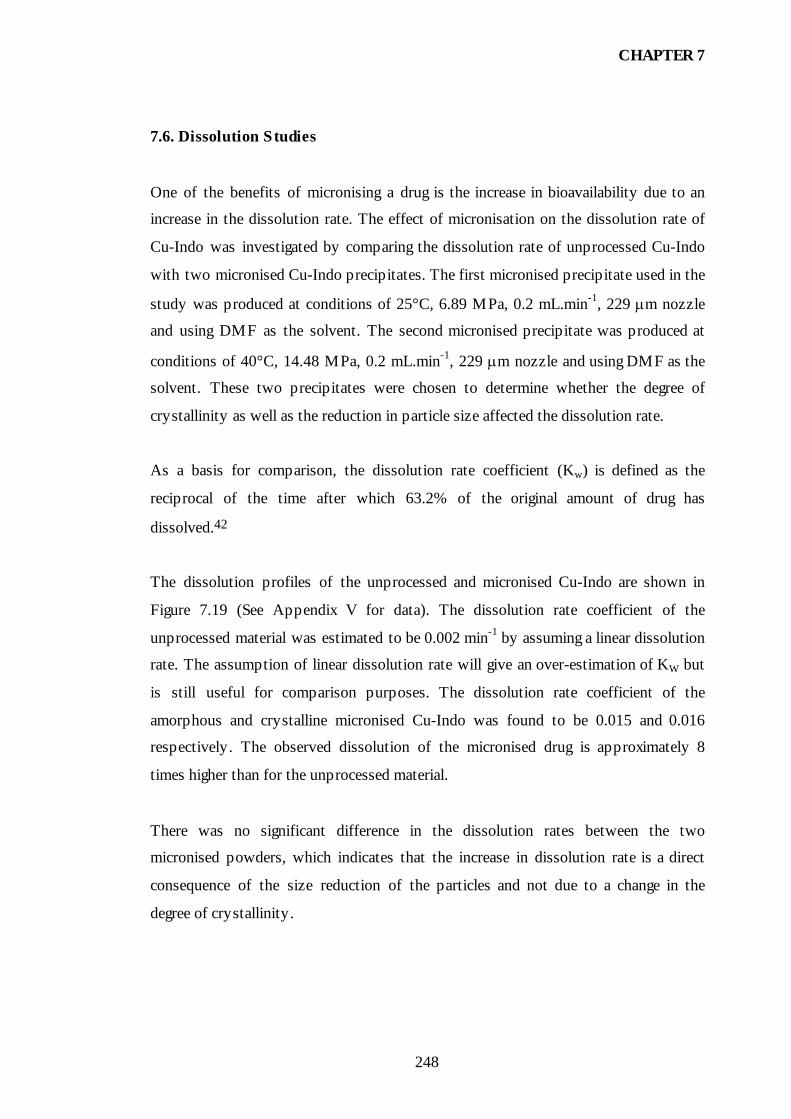
CHAPTER 7
248
7.6. Dissolution Studies
One of the benefits of micronising a drug is the increase in bioavailability due to an
increase in the dissolution rate. The effect of micronisation on the dissolution rate of
Cu-Indo was investigated by comparing the dissolution rate of unprocessed Cu-Indo
with two micronised Cu-Indo precipitates. The first micronised precipitate used in the
study was produced at conditions of 25°C, 6.89 MPa, 0.2 mL.min-1, 229 µm nozzle
and using DMF as the solvent. The second micronised precipitate was produced at
conditions of 40°C, 14.48 MPa, 0.2 mL.min-1, 229 µm nozzle and using DMF as the
solvent. These two precipitates were chosen to determine whether the degree of
crystallinity as well as the reduction in particle size affected the dissolution rate.
As a basis for comparison, the dissolution rate coefficient (Kw) is defined as the
reciprocal of the time after which 63.2% of the original amount of drug has
dissolved.42
The dissolution profiles of the unprocessed and micronised Cu-Indo are shown in
Figure 7.19 (See Appendix V for data). The dissolution rate coefficient of the
unprocessed material was estimated to be 0.002 min-1 by assuming a linear dissolution
rate. The assumption of linear dissolution rate will give an over-estimation of KW but
is still useful for comparison purposes. The dissolution rate coefficient of the
amorphous and crystalline micronised Cu-Indo was found to be 0.015 and 0.016
respectively. The observed dissolution of the micronised drug is approximately 8
times higher than for the unprocessed material.
There was no significant difference in the dissolution rates between the two
micronised powders, which indicates that the increase in dissolution rate is a direct
consequence of the size reduction of the particles and not due to a change in the
degree of crystallinity.

CHAPTER 7
249
Time / min
% D
issol
utio
n
0
10
20
30
40
50
60
70
80
90
100
0 20 40 60 80 100 120 140 160 180 200
25°C, 6.89 MPa
40°C, 14.48 MPa
Unprocessed Cu-Indo
Figure 7.19 Dissolution of Cu-Indo produced by ASES. 100 mg.g-1 solution of Cu-
Indo in DMF using a 229 µm nozzle and a solution flow rate of 0.2 mL.min-1.

CHAPTER 7
250
7.7. Conclusions
The results obtained from the processing of solutions of Cu-Indo by GAS and ASES
indicate that both processes are dominated by a complex combination of process
parameters. The particles produced by the GAS process appear to be mostly
influenced by the concentration of Cu-Indo in solution. The particles produced by the
ASES process were also found to be a strong function of the solution concentration. In
this case, however, the particles produced at the lowest concentration resembled the
particles produced at the highest concentrations when processing by GAS. The similar
particle morphology produced at the opposite extremes of concentration for both
processes indicates that the statement by Bungert and co-workers,43 that the ASES
process is an optimised GAS process in terms of supersaturation, is valid. The
dominant particle formation mechanism at most of the conditions studied for both
processes was one of nucleation and growth within an homogenous liquid phase. At
the high concentration extreme examined using the ASES process however, a particle
formation mechanism based on precipitation occurring within liquid droplets,
appeared to be in operation.
The degree of crystallinity of the precipitate formed from the ASES process was
found to increase at supercritical conditions and at higher solution flow rates. This
result is significant since it provides a method of controlling the level of crystallinity
of a drug.
In terms of micronisation, the ASES produced particles of Cu-Indo were most suited
to drug delivery applications. The results from the particle size distribution study
showed that 90% of the mass of precipitate produced contained particles that were less
than 10 µm in diameter. The particle size distribution was not altered significantly
when altering the pressure, temperature or nozzle diameter, which makes the ASES
process well suited to the production of uniform batches of micronised Cu-Indo.
The micronisation of Cu-Indo was possible at the point of synthesis. The possibility of
micronising at the point of synthesis offers savings in terms of solvent usage, time and
cost, as secondary processing is avoided.

CHAPTER 7
251
The immediate benefit of micronising Cu-Indo was demonstrated with an eight fold
increase in the dissolution rate of the micronised drug when compared to the
unprocessed drug.

CHAPTER 7
252
7.8. References
1. Yeo, S. D.; Lim, G. B.; Debenedetti, P. G.; Bernstein, H.; "Formation of
Microparticulate Protein Powders Using a Supercritical Fluid Anti-Solvent,"
Biotechnol. Bioeng. 1993, 41, 341.
2. Kitamura, M.; Yamamoto, M.; Yoshinaga, Y.; Masuoka, H.; "Crystal Size Control
of Sulfathiazole Using High Pressure Carbon Dioxide," J. Cryst. Growth 1997, 178,
378.
3. Gallagher, P. M.; Coffey, M. P.; Krukonis, V. J.; Klasutis, N.; Gas Anti-Solvent
Recrystallization: New Process To Recrystallize Compounds Insoluble in
Supercritical Fluids; Johnston, K. P. and Penninger, J. M. L., Ed.; American
Chemical Society: Washington, DC, 1989; 406, 334.
4. Gallagher, P. M.; Krukonis, V.; Botsaris, G. D.; "Gas Anti-Solvent (GAS)
Recrystallization: Application to Particle Design," AIChE Symposioum Series 1991,
87, 96.
5. Gallagher, P. M.; Coffey, M. P.; Krukonis, V. J.; Hillstrom, W. W.; "Gas Anti-
Solvent Recrystallization of RDX: Formation of Ultra-Fine Particles of a Difficult-
to-Comminute Explosive," J. Supercrit. Fluids 1992, 5, 130.
6. Yeo, S. D.; Debenedetti, P. G.; Radosz, M.; Schmidt, H. W.; "Supercritical Anti-
Solvent Process for Substituted Para-Linked Aromatic Polyamides: Phase
Equilibrium and Morphology Study," Macromolecules 1993, 26, 6207.
7. Thiering, R.; Charoenchaitrakool, M.; Sze-Tu, L.; Dehghani, F.; Dillow, A. K.;
Foster, N. R.; "Crystallization of Para-Hydroxybenzoic Acid by Solvent Expansion
with Dense Carbondioxide," Proceedings of the 5th Meeting on Supercritical
Fluids, Nice, France, 1998, 291.
8. Wubbolts, F. E.; Kersch, C.; van Rosmalen, G. M.; "Semi-Batch Precipitation of
Acetaminophen from Ethanol with Liquid Carbon Dioxide at a Constant Pressure,"
Proceedings of the 5th Meeting on Supercritical Fluids, Nice, France, 1998, 249.
9. Berends, E. M.; Bruinsma, O. S. L.; de Graauw, J.; van Rosmalen, G. M.;
"Crystallization of Phenanthrene from Toluene with Carbon Dioxide by the GAS
Process," AIChE J. 1996, 42, 431.
10. Pamplin, B. R.; "Crystal Growth," ; Permagon Press Ltd.: Oxford, 1975; Vol. 6.

CHAPTER 7
253
11. Yeo, S.-D.; Choi, J.-H.; Lee, T.-J.; "Crystal Formation of BaCl2 and NH4Cl Using
a Supercritical Fluid Anti-Solvent," J. Supercrit. Fluids 2000, 16, 235.
12. Khamski, E. V.; "Crystallization From Solutions," ; Olenum Publishing
Coorporation: New York, 1970.
13. Benedetti, L.; Bertucco, A.; Pallado, P.; "Production Of Micronic Particles Of
Biocompatible Polymer Using Supercritical Carbon Dioxide," Biotechnol. Bioeng.
1997, 53, 232.
14. Gallagher-Wetmore, P.; Coffey, M. P.; Krukonis, V.; "Application of Supercritical
Fluids in Recrystallization: Nucleation and Gas Anti-Solvent (GAS) Techniques,"
Respiratory Drug Delivery 1994, IV, 287.
15. Gallagher-Wetmore, P.; Coffey, M. P.; Krukonis, V.; "Recrystallization Using
Supercritical Fluids: Novel Techniques for Particle Modification," 1994, 162.
16. Thiering, R.; Dehghani, F.; Dillow, A.; Foster, N. R.; "Solvent Effects On The
Controlled Dense Gas Precipitation Of Model Proteins," J. Chem. Technol.
Biotechnol. 2000, 75, 29.
17. Thiering, R.; Dehghani, F.; Dillow, A.; Foster, N. R.; "The Influence of Operating
Conditions on the Dense Gas Precipitation of Model Proteins," J. Chem. Technol.
Biotechnol. 2000, 75, 29.
18. Bertucco, A.; Lora, M.; Kikic, I.; "Fractional Crystallization by Gas Anti-Solvent
Technique: Theory and Experiments," AIChE J. 1998, 44, 2149.
19. Tai, C. Y.; Cheng, C.-S.; "Effect of CO2 on Expansion and Supersaturation of
Saturated Solutions," AIChE J. 1998, 44, 989.
20. Dixon, D. J.; Johnston, K. P.; Bodmeier, R. A.; "Polymeric Materials Formed by
Precipitation with a Compressed Fluid Anti-Solvent," AIChE J. 1993, 39, 127.
21. Lengsfeld, C. S.; Delplanque, J. P.; Barocas, V. H.; Randolph, T. W.; "Mechanism
Governing Microparticle Morphology during Precipitation by a Compressed Anti-
Solvent: Atomization vs Nucleation and Growth," J. Phys. Chem. B 2000, 104,
2725.
22. Reverchon, E.; Della Porta, G.; Flaivene, M. G.; "Process Parameters and
Morphology in Amoxicillin Micro and Submicro Particles Generation by
Supercritical Anti-Solvent Precipitation," J. Supercrit. Fluids 2000, 17, 239.
23. Reverchon, E.; Porta, G. D.; "Production of Antibiotic Micro- and Nano-Particles
by Supercritical Anti-Solvent Precipitation," Powder Technol. 1999, 106, 23.

CHAPTER 7
254
24. Reverchon, E.; Della Porta, G.; Di Trolio, A.; Pace, S.; "Supercritical Anti-Solvent
Precipitation of Nanoparticles of Superconductor Precursors," Ind. Eng. Chem. Res.
1998, 37, 952.
25. Schmitt, W. J.; Salada, M. C.; Shook, G. G.; Speaker, S. M., III; "Finely-Divided
Powders by Carrier Solution Injection into a Near or Supercritical Fluid," AIChE J.
1995, 41, 2476.
26. Subramaniam, B.; Saim, S.; Rajewski, A.; Stella, V.; "Methods for Particle
Micronization and Nanonization by Recrystallization from Organic Solutions
Sprayed into a Compressed Anti-Solvent," U.S. 5,874,029, 1999.
27. Wubbolts, F.; Bruinsma, O.; van Rosmalen, G.; "Dry-Spraying of Ascorbic Acid
or Acetaminophen Solutions with Supercritical Carbon Dioxide," J. Cryst. Growth
1999, 198/199, 767.
28. Falk, R. F.; Randolph, T. W.; "Process Variable Implications for Residual Solvent
Removal and Polymer Morphology in the Formation of Gentamicin-Loaded
Poly(L-Lactide) Microparticles," Pharm. Res. 1998, 15, 1233.
29. Reverchon, E.; Della Porta, G.; Sannino, D.; Ciambelli, P.; "Supercritical Anti-
Solvent Precipitation of Nanoparticles of a Zinc Oxide Precursor," Powder
Technol. 1999, 102, 127.
30. Steckel, H.; Thies, J.; Müller, B.; "Micronising of Steroids for Pulmonary Delivery
by Supercritical Carbon Dioxide," Int. J. Pharm. 1997, 152, 99.
31. Dixon, D. J.; Luna-Bárcenas, G.; Johnston, K. P.; "Microcellular Microspheres
and Miroballoons by Precipitation with a Vapour-Liquid Compressed Fluid Anti-
Solvent," Polymer 1994, 35, 3998.
32. Reverchon, E.; Celano, C.; Della Porta, G.; Di Trolio, A.; Pace, S.; "Supercritical
Anti-Solvent Precipitation: A New Technique for Preparing Submicronic Yttrium
Powders to Improve YBCO Superconductors," J. Mater. Res. 1998, 13, 284.
33. Reverchon, E.; "Supercritical Anti-Solvent Precipitation of Micro- and Nano-
Particles," J. Supercrit. Fluids 1999, 15, 1.
34. Thies, J.; Müller, B. W.; "Size Controlled Production of Biodegradable
Microparticles with Supercritical Gases," Eur. J. Pharm. Biopharm. 1998, 45, 67.
35. Heater, K. J.; Tomasko, D. L.; "Processing of Epoxy Resins Using Carbon
Dioxide as an Anti-Solvent," J. Supercrit. Fluids 1998, 14, 55.

CHAPTER 7
255
36. Griffith, A. T.; Park, Y.; Roberts, C. B.; "Separation and Recovery of Nylon from
Carpet Waste using a Supercritical Fluid Anti-Solvent Technique," Polymer
Plastics Technology & Engineering 1999, 38, 411.
37. Bodmeier, R.; Wang, H.; Dixon, D.; Mawson, S.; Johnston, K.; "Polymeric
Microspheres Prepared By Spraying Into Compressed Carbon Dioxide," Pharm.
Res. 1995, 12, 1211.
38. Tan, C.-S.; Lin, H.-Y.; "Precipitation of Polystyrene by Spraying Polystyrene-
Toluene Solution into Compressed HFC-134a," Ind. Eng. Chem. Res. 1999, 38,
3898.
39. Young, T. J.; Johnston, K. P.; Mishima, K.; Tanaka, H.; "Encapsulation of
Lysozyme in a Biodegradable Polymer by Precipitation with a Vapor-over-Liquid
Anti-Solvent," J. Pharm. Sci. 1999, 88, 640.
40. Randolph, T. W.; Randolph, A. D.; Mebes, M.; Yeung, S.; "Sub-Micrometer-
Sized Biodegradable Particles of Poly(L-Lactic Acid) via the Gas Anti-Solvent
Spray Precipitation Process," Biotechnol. Prog. 1993, 9, 429.
41. Weder, J. E.; Hambley, T. W.; Kennedy, B. J.; Lay, P. A.; MacLachlan, D.;
Bramley, R.; Delfs, C. D.; Murray, K. S.; Moubaraki, B.; Warwick, B.; Biffin, J.
R.; Regtop, H. L.; "Anti-Inflammatory Dinuclear Copper(II) Complexes with
Indomethacin. Synthesis, Magnetism and EPR Spectroscopy. Crystal Structure of
the N,N-Dimethylformamide Adduct," Inorganic Chemistry. 1999, 38, 1736.
42. Loth, H.; Hemgesberg, E.; "Properties and Dissolution of Drugs Micronized by
Crystallization from Supercritical Gases," Int. J. Pharm. 1986, 32, 265.
43. Bungert, B.; Sadowski, G.; Arlt, W.; "Separations And Material Processing In
Solutions With Dense Gases," Ind. Eng. Chem. Res. 1998, 37, 3208.

CHAPTER 8
256
8. CO-PRECIPITATION OF COPPER INDOMETHACIN AND
POLYVINYLPYRROLIDONE BY THE ASES PROCESS
8.1. Introduction
The formation of drug—polymer blends is an important process in the pharmaceutical
industry particularly when the drug in question is not suitable for use in its pure form.
Drug—polymer combinations may be formed to protect the drug from its surroundings,
increase the stability of the drug during storage, increase the solubility of the drug,
control the release of the drug in the body and for target delivery of the drug.
The combination of drug and polymer can occur in two solid forms as shown in Figure
8.1. Drug—polymer composites can exist in the form of a matrix where the drug and
polymer are distributed evenly throughout the solid matrix, or in a form where the drug
is totally encapsulated by the polymer. If the composite is of the matrix type, then either
the dissolution rate of the polymer, or the diffusion of the drug through the matrix,
controls the rate of drug release in the body. If the composite is of the encapsulated
type, then the rate of drug release is controlled by either the diffusion of drug through
the polymer wall, or by dissolution of the polymer wall.
Polymers that are commonly used for controlled delivery systems include polyamides
and polyesters.1 Of these, polyesters have received most attention because of their
predictable degradation properties with poly(lactic acid) being approved by the FDA for
use in humans. Water soluble polymers, such as polyethylene glycol and polyacrylic
acid, have also been used in the delivery of drugs. Water soluble polymers, when
combined with a drug, can facilitate rapid dissolution of the drug in the body, thus
providing faster therapeutic response.

CHAPTER 8
257
������������������������������������������������������������������������������������������������������������������������������������������������������������������������������������������������������������������������������������������������������������������������������������������������������������������������������������������������������������������������������������������������������������������������������������������������������������������������������������
Encapsulation Matrix
Polymer
Drug
Figure 8.1 Types of polymer—drug composites.
8.1.1. Polyvinylpyrrolidone
Polyvinylpyrrolidone (PVP) is a synthetic water soluble polymer consisting of linear 1-
vinyl-2-pyrrolidone monomer, the molecular structure of which is shown in Figure 8.2.
The PVP polymers are characterised according to their viscosity in aqueous solution,
relative to that of water, expressed as a K-value. Various types of PVP polymers based
on K-values and approximate molecular weights are listed in Table 8.1.
CH2H2C
H2C C=ON
CH nCH2
Figure 8.2 Polyvinylpyrrolidone chemical structure.

CHAPTER 8
258
PVP is non-toxic, has no irritant effect on the skin and causes no sensitization. It has the
property of being soluble in both water and commonly used organic solvents, which
makes it attractive for use in many types of formulations. PVP has been used in the
pharmaceutical industry since the 1940s with its first use being as a plasma expander.2
It has since found widespread application in the pharmaceutical industry. PVP is
commonly used as a binder in wet granulation, a coating to improve tablet
characteristics, an additive to change the dissolution profile of slow release
formulations, a crystal growth retarder, an anti-irritant for topical and opthalmic
products, a stabiliser and protective colloid in suspensions, a solubiliser in injectable
products for veterinary use and a viscosity modifier.
Table 8.1 K values and molecular weights of PVP.
K-value Approximate Molecular Weight /
g.mol-1
12 2500
15 8000
17 10,000
25 30,000
30 50,000
60 400,000
90 1,000,000
120 3,000,000
PVP has been shown to enhance the therapeutic effect of a wide variety of drugs. For
example, the addition of PVP to an injectable prostaglandin was found to extend its
therapeutic effect by increasing its viscosity and decreasing its diffusion rate.3 PVP has
also been shown to be safe for use in injections with no adverse effects reported in a
study of 250 patients injected with oxytetracycline solubilised in PVP.4
The functions of enhanced therapeutic effect and increased solubility are thought to be
the most promising benefits of co-precipitating PVP and Cu-Indo. One of the objectives
of further development of Cu-Indo is to produce new formulations to increase the

CHAPTER 8
259
marketability of the drug. The aim of the work described in this chapter was to provide
a form of Cu-Indo that may be suitable for opthalmic and injectable applications by co-
precipitation with PVP.
The conventional method of preparing a PVP—drug co-precipitate is to solubilise both
the drug and the PVP in a common solvent. The solvent is then evaporated to give the
precipitate. The conventional method of co-precipitation presents limitations when the
solvents used have high boiling points and/or are toxic. In the case of Cu-Indo the
solvents that are suitable for solubilisation are methylene dichloride, DMF, NMP and
DMSO. All of these solvents present problems of either elevated boiling points and/or
toxicity. The conventional method of preparing PVP—Cu-Indo precipitates is,
therefore, unsuitable due to residual solvent levels left in the co-precipitate after
evaporation.
A way of overcoming these problems is to precipitate a solution of the polymer and
drug by the GAS or ASES processes. Of these two processes, ASES is more attractive.
The rapid precipitation time scale of ASES results in the drug and polymer precipitating
in close proximity, thus increasing the probability of forming drug—polymer
composites.
In this study the precipitation of DMF solutions of PVP (average molecular weight of
10,000) and Cu-Indo using CO2 as the anti-solvent was investigated. DMF was chosen
as the solvent because of the successful results achieved using DMF in the
micronisation of the pure drug by the GAS and ASES processes. Preliminary
investigations of the precipitation of PVP from DMF using CO2 as an anti-solvent were
conducted. The aim of these investigations was to demonstrate the applicability of the
GAS and ASES processes to precipitating PVP and to determine optimum conditions
for co-precipitation. The process parameters of solute concentration, temperature and
anti-solvent density were investigated. The effect of solute concentration, PVP to Cu-
Indo ratio and anti-solvent density on the co-precipitates formed was examined. The co-
precipitates formed were then compared to the pure drug in terms of solubility in
ethanol and dissolution rates in water.

CHAPTER 8
260
8.2. Experimental
All chemicals and reagents used in the co-precipitation of PVP and Cu-Indo are listed in
Table 8.2. All chemicals and reagents were used as supplied.
Table 8.2 Chemicals and reagents.
Chemical/Reagent Purity (%) /
Grade
Supplier
Copper Indomethacin 90 Biochemical Veterinary Research
Polyvinylpyrrolidone Average M w
ca. 10 000
Aldrich Chemical Co.
N,N-dimethylformamide 99.9 Burdick and Jackson
Carbon Dioxide > 99.9 BOC Gases
Tetramethylammonium Chloride 97 Aldrich Chemical Co.
Acetonitrile 99.8 EM Science
8.2.1. Experimental Apparatus and Procedure
The GAS and ASES experimental apparatus used in the co-precipitation experiments
were identical to those described in Chapter 6 for the synthesis of Cu-Indo Indo
(Figures 6.2 and 6.3).
Precipitation experiments were conducted using solutions of PVP in DMF and mixtures
of PVP and Cu-Indo in DMF. The solutions that contained only PVP were prepared by
dissolving PVP in DMF to give the required concentration. Solutions used in the co-
precipitation experiments were formulated by weighing out PVP and Cu-Indo into a
beaker in the required ratio. Sufficient DMF was then added to the beaker to give the
desired concentration of solute in solution. The solutes were dissolved by sonication and
mixing.
Precipitation experiments using the GAS process were conducted by charging the vessel
with 5 to 10 mL of solution. The vessel was then brought to the desired pressure by

CHAPTER 8
261
passing CO2 through the filter from the bottom. The rate of pressurisation was
controlled by means of a needle valve. Once the precipitation was complete, the liquid
phase was removed at constant pressure by passing CO2 from the top of the vessel and
pushing the liquid through the filter. The precipitate that formed was washed and dried
by removing the solvent rich liquid phase at a constant pressure 6.8 MPa and a CO2
flow rate of 2 to 4 mL.min-1. In each batch 200 to 400 mL of CO2 was used to minimise
the residual solvent. The system was depressurised and a sample taken for analysis.
Precipitations by ASES experiments were conducted by first pressurising the pressure
vessel to the required pressure and then allowing the CO2 to flow through the vessel
from the top down. The CO2 flow rate was controlled by adjusting the needle valve just
before the solvent trap until the pump was flowing at 4 to 5 mL.min-1. Once the system
was in steady state, the solution was pumped into the pressure vessel through the nozzle
using the HPLC pump. The solution flow rate was controlled by the HPLC pump. Upon
completion of precipitation, the flow of solution was stopped. The precipitate was
washed with 200 mL of CO2 at the pressure in question.
Precipitation by ASES with the anti-solvent existing as both a vapour and a liquid were
performed by pressurising the vessel until it was half full with liquid CO2. The flow of
CO2 was then stopped. To prevent a large accumulation of solvent in the vessel, the
solution was pumped through the nozzle for approximately 2 minutes and then stopped.
Once solution flow was stopped the pressure was increased to 6.89 MPa and the
precipitate was washed with CO2 as described for the other ASES experiments.
Drug content of the PVP—Cu-Indo co-precipitates was determined by High Pressure
Liquid Chromatography (HPLC). The HPLC used consisted of a Waters 600 pump, a
996 Photo Diode Array detector and a 717Plus Autoinjector. The samples were
separated using a Symmetry C18 column with a mobile phase made up of 70%
acetonitrile and 30% 0.01M tetramethylammonium chloride in 0.1% acetic acid. A flow
rate of 1 mL.min-1 was used and the analytes were detected at a wavelength of 320 nm.

CHAPTER 8
262
Drug content was calculated using the following equation:
mD
mT × 100 8.1
where mD is the mass of Cu-Indo and mT is the total mass of the powder analysed.
The solubility of the co-precipitate powders was determined by adding an excess
quantity of co-precipitate to approximately 4 mL of ethanol at room temperature. The
mixtures were mixed for 20 min at room temperature. The excess solid was removed by
filtering the solution through a 0.45 µm syringe filter. The solution was analysed for
Cu-Indo content by HPLC as described above.
Dissolution rate experiments were conducted using the USP paddle method and the
Vanderkamp tester (VK6000, Vankel Industries Inc., Germany). In each experiment
enough powder was used to give approximately 10 mg of Cu-Indo. The powder was
mixed with 100 mg of lactose to aid in dispersion during dissolution. The mixture was
then added to 1 L of water (Milli-Q) which had been heated to 37°C. A stirring rate of
100 rpm was used for all dissolution experiments. Approximately 4 mL aliquots were
removed at regular intervals and were analysed for Cu-Indo concentration. The
concentration of Cu-Indo was determined by HPLC as described above.
Particle morphology of the solid powders was determined by scanning electron
microscope (SEM) (Hitachi S4500). Samples were mounted on metal plates and gold
coated using a sputter coater under vacuum prior to use.
Differential Scanning Calorimetry (DSC) (2010 TA Instruments) was conducted by
heating 10 mg of sample in aluminium pans from 25°C to the desired upper limit at 10
°C.min-1.
Room temperature X-band Electron Paramagnetic Resonance (EPR) spectroscopy was
used to determine the integrity of the Cu-Indo dimer. EPR spectra were measured using

CHAPTER 8
263
a Bruker EMX EPR at X-band frequencies of approximately 9.5 GHz and ambient
temperatures.
8.3. Precipitation of PVP Using Dense CO2 as Anti-Solvent
Previous reports on the micronisation of polymers by ASES have shown that particle
agglomeration was most likely when processing amorphous polymers with low glass
transition temperatures.5-7 At conditions commonly used in gas anti-solvent processes,
polymer glass transition temperatures are reduced to below operating conditions and
plasticisation occurs.
Typical properties of two PVP polymers are listed in Table 8.3 and an example SEM
image of unprocessed PVP (K = 17) is shown in Figure 8.3. Of particular relevance to
using PVP in gas anti-solvent processes are the relatively high glass transition
temperatures of 126 and 164°C.
Table 8.3 Typical properties of PVP.*
Property PVP K = 17 PVP K = 30
Appearance White powder White powder
Tgmax 126°C 164°C
Mean Particle Size 50 µm 30 µm
Polydispersity 3.12 3.36
Density (Bulk) 0.1 – 0.25 g/cc 0.25 - 0.4 g/cc
* (Information from GAF Chemicals Corporation technical brochure on Plasdone C-15 and Plasdone C-
30)
Tgmax — glass transition temperature
The feasibility of precipitating PVP from DMF by ASES was investigated. The process
parameters of PVP concentration, anti-solvent density and temperature were
investigated to determine their effect on the PVP precipitates produced. The process
conditions investigated and results obtained are listed in Table 8.4.
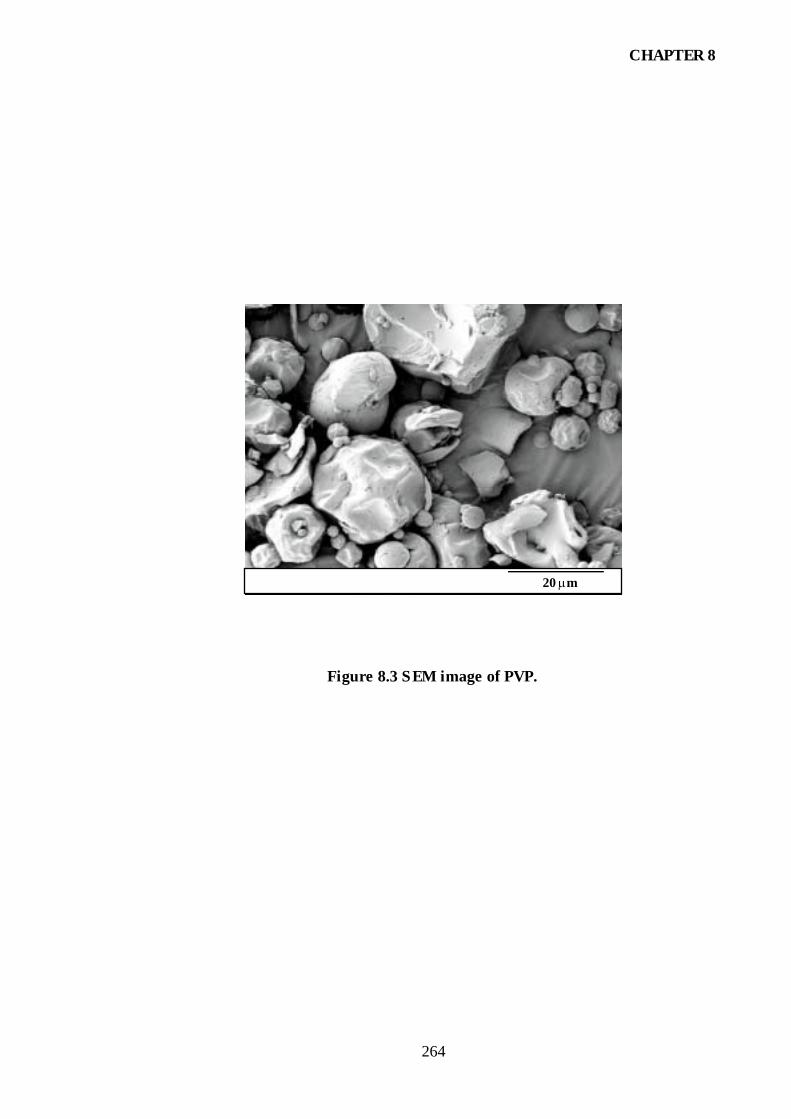
CHAPTER 8
264
20 µm
Figure 8.3 SEM image of PVP.
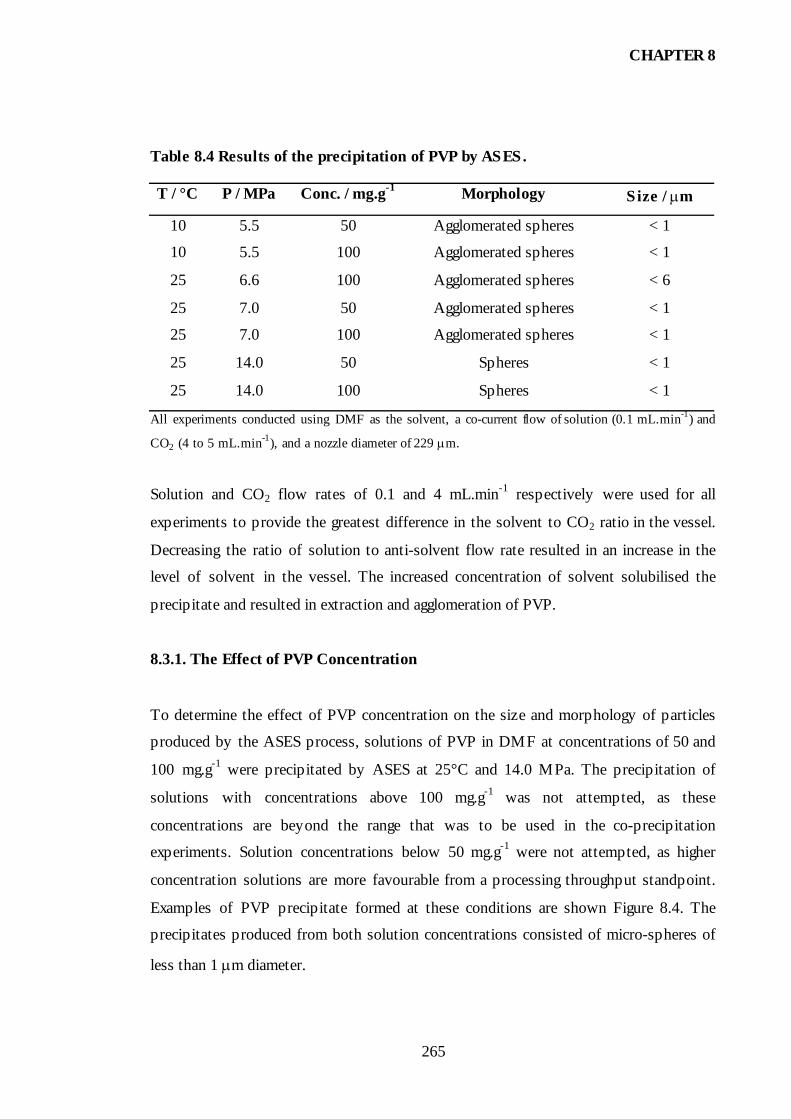
CHAPTER 8
265
Table 8.4 Results of the precipitation of PVP by ASES.
T / °C P / MPa Conc. / mg.g-1 Morphology Size / µm
10 5.5 50 Agglomerated spheres < 1
10 5.5 100 Agglomerated spheres < 1
25 6.6 100 Agglomerated spheres < 6
25 7.0 50 Agglomerated spheres < 1
25 7.0 100 Agglomerated spheres < 1
25 14.0 50 Spheres < 1
25 14.0 100 Spheres < 1
All experiments conducted using DMF as the solvent, a co-current flow of solution (0.1 mL.min-1) and
CO2 (4 to 5 mL.min-1), and a nozzle diameter of 229 µm.
Solution and CO2 flow rates of 0.1 and 4 mL.min-1 respectively were used for all
experiments to provide the greatest difference in the solvent to CO2 ratio in the vessel.
Decreasing the ratio of solution to anti-solvent flow rate resulted in an increase in the
level of solvent in the vessel. The increased concentration of solvent solubilised the
precipitate and resulted in extraction and agglomeration of PVP.
8.3.1. The Effect of PVP Concentration
To determine the effect of PVP concentration on the size and morphology of particles
produced by the ASES process, solutions of PVP in DMF at concentrations of 50 and
100 mg.g-1 were precipitated by ASES at 25°C and 14.0 MPa. The precipitation of
solutions with concentrations above 100 mg.g-1 was not attempted, as these
concentrations are beyond the range that was to be used in the co-precipitation
experiments. Solution concentrations below 50 mg.g-1 were not attempted, as higher
concentration solutions are more favourable from a processing throughput standpoint.
Examples of PVP precipitate formed at these conditions are shown Figure 8.4. The
precipitates produced from both solution concentrations consisted of micro-spheres of
less than 1 µm diameter.
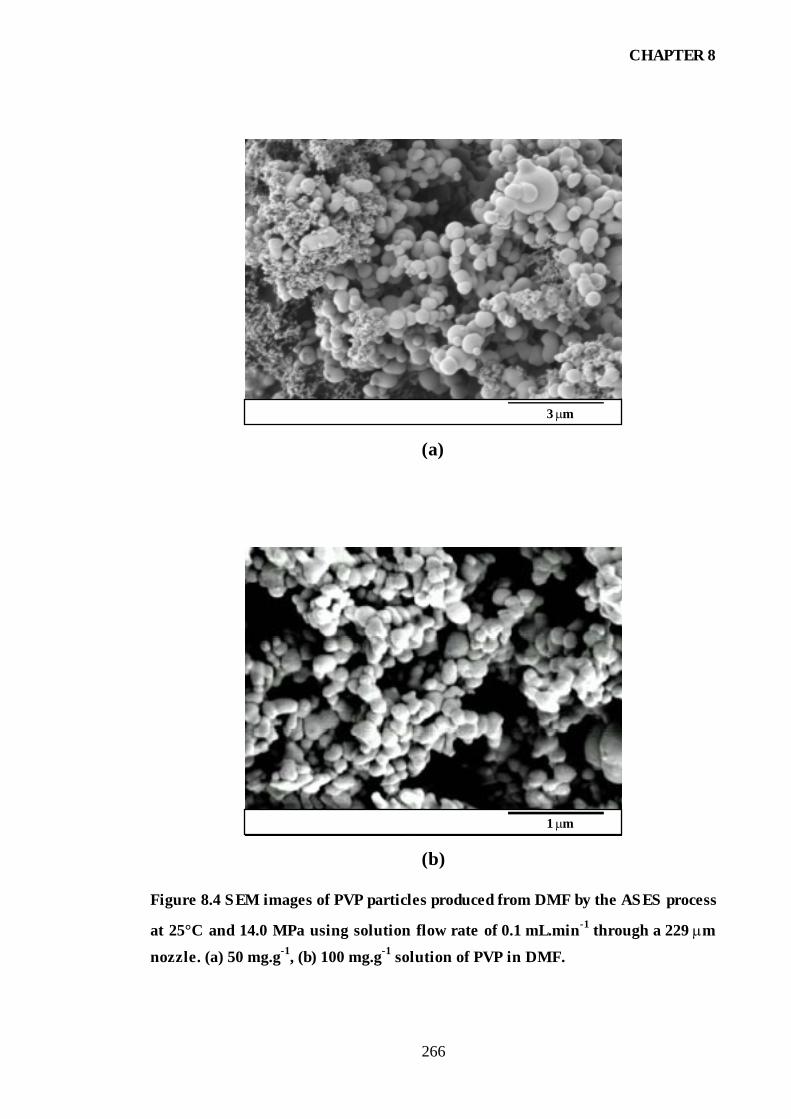
CHAPTER 8
266
(b)
(a)
3 µm
1 µm
Figure 8.4 SEM images of PVP particles produced from DMF by the ASES process
at 25°C and 14.0 MPa using solution flow rate of 0.1 mL.min-1 through a 229 µm
nozzle. (a) 50 mg.g-1, (b) 100 mg.g-1 solution of PVP in DMF.
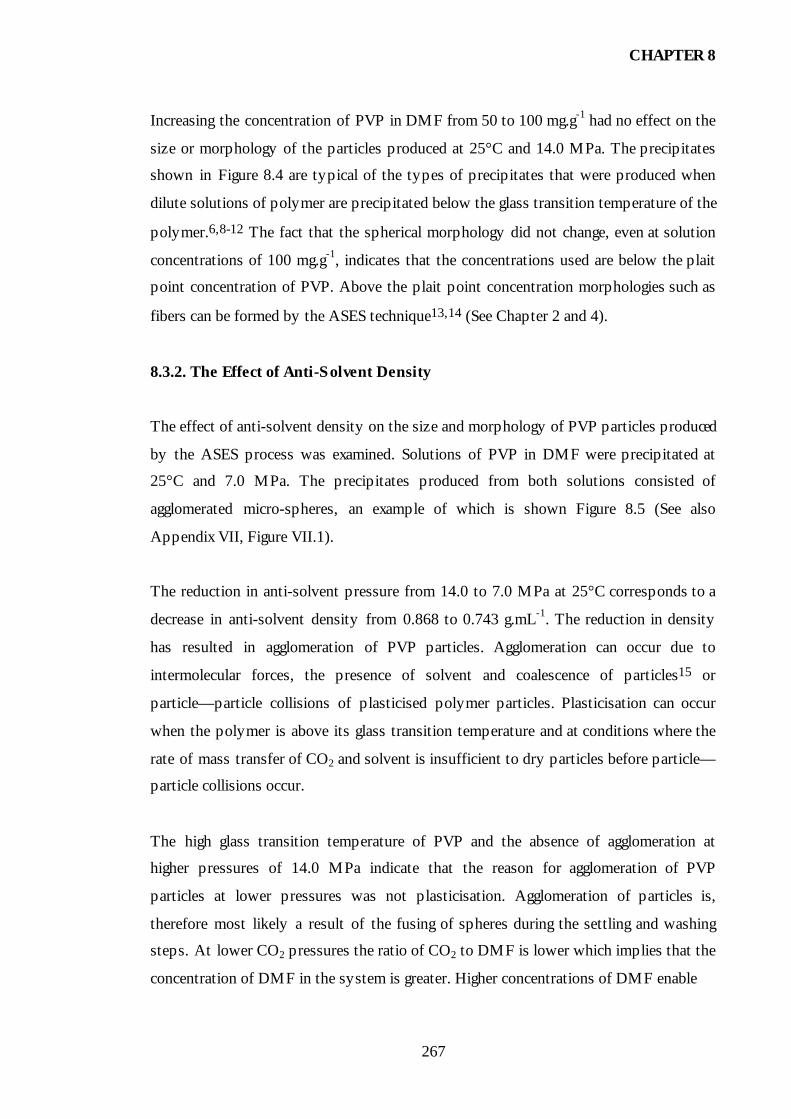
CHAPTER 8
267
Increasing the concentration of PVP in DMF from 50 to 100 mg.g-1 had no effect on the
size or morphology of the particles produced at 25°C and 14.0 MPa. The precipitates
shown in Figure 8.4 are typical of the types of precipitates that were produced when
dilute solutions of polymer are precipitated below the glass transition temperature of the
polymer.6,8-12 The fact that the spherical morphology did not change, even at solution
concentrations of 100 mg.g-1, indicates that the concentrations used are below the plait
point concentration of PVP. Above the plait point concentration morphologies such as
fibers can be formed by the ASES technique13,14 (See Chapter 2 and 4).
8.3.2. The Effect of Anti-Solvent Density
The effect of anti-solvent density on the size and morphology of PVP particles produced
by the ASES process was examined. Solutions of PVP in DMF were precipitated at
25°C and 7.0 MPa. The precipitates produced from both solutions consisted of
agglomerated micro-spheres, an example of which is shown Figure 8.5 (See also
Appendix VII, Figure VII.1).
The reduction in anti-solvent pressure from 14.0 to 7.0 MPa at 25°C corresponds to a
decrease in anti-solvent density from 0.868 to 0.743 g.mL-1. The reduction in density
has resulted in agglomeration of PVP particles. Agglomeration can occur due to
intermolecular forces, the presence of solvent and coalescence of particles15 or
particle—particle collisions of plasticised polymer particles. Plasticisation can occur
when the polymer is above its glass transition temperature and at conditions where the
rate of mass transfer of CO2 and solvent is insufficient to dry particles before particle—
particle collisions occur.
The high glass transition temperature of PVP and the absence of agglomeration at
higher pressures of 14.0 MPa indicate that the reason for agglomeration of PVP
particles at lower pressures was not plasticisation. Agglomeration of particles is,
therefore most likely a result of the fusing of spheres during the settling and washing
steps. At lower CO2 pressures the ratio of CO2 to DMF is lower which implies that the
concentration of DMF in the system is greater. Higher concentrations of DMF enable

CHAPTER 8
268
3 µm
Figure 8.5 SEM images of particles produced from DMF solutions of PVP at a
concentration of 50 mg.g-1 by the ASES process at 25°C and 7.0 MPa using
solution flow rate of 0.1 mL.min-1 through a 229 µm nozzle.
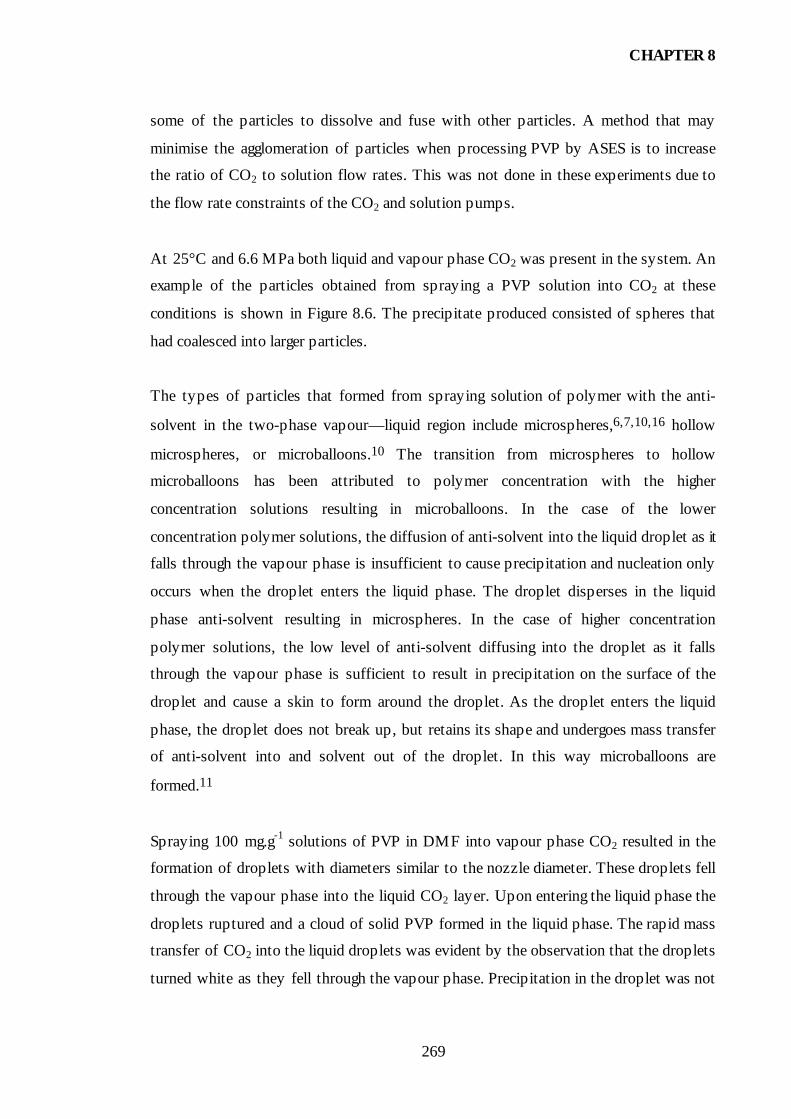
CHAPTER 8
269
some of the particles to dissolve and fuse with other particles. A method that may
minimise the agglomeration of particles when processing PVP by ASES is to increase
the ratio of CO2 to solution flow rates. This was not done in these experiments due to
the flow rate constraints of the CO2 and solution pumps.
At 25°C and 6.6 MPa both liquid and vapour phase CO2 was present in the system. An
example of the particles obtained from spraying a PVP solution into CO2 at these
conditions is shown in Figure 8.6. The precipitate produced consisted of spheres that
had coalesced into larger particles.
The types of particles that formed from spraying solution of polymer with the anti-
solvent in the two-phase vapour—liquid region include microspheres,6,7,10,16 hollow
microspheres, or microballoons.10 The transition from microspheres to hollow
microballoons has been attributed to polymer concentration with the higher
concentration solutions resulting in microballoons. In the case of the lower
concentration polymer solutions, the diffusion of anti-solvent into the liquid droplet as it
falls through the vapour phase is insufficient to cause precipitation and nucleation only
occurs when the droplet enters the liquid phase. The droplet disperses in the liquid
phase anti-solvent resulting in microspheres. In the case of higher concentration
polymer solutions, the low level of anti-solvent diffusing into the droplet as it falls
through the vapour phase is sufficient to result in precipitation on the surface of the
droplet and cause a skin to form around the droplet. As the droplet enters the liquid
phase, the droplet does not break up, but retains its shape and undergoes mass transfer
of anti-solvent into and solvent out of the droplet. In this way microballoons are
formed.11
Spraying 100 mg.g-1 solutions of PVP in DMF into vapour phase CO2 resulted in the
formation of droplets with diameters similar to the nozzle diameter. These droplets fell
through the vapour phase into the liquid CO2 layer. Upon entering the liquid phase the
droplets ruptured and a cloud of solid PVP formed in the liquid phase. The rapid mass
transfer of CO2 into the liquid droplets was evident by the observation that the droplets
turned white as they fell through the vapour phase. Precipitation in the droplet was not

CHAPTER 8
270
2.0 kV x 5.0 k 6 µm
Figure 8.6 SEM images of PVP particles produced from DMF solutions of PVP at
a concentration of 100 mg.g-1 by the ASES process at 25°C and 6.6 MPa using
solution flow rate of 0.1 mL.min-1 through a 229 µm nozzle.

CHAPTER 8
271
sufficient to result in skin formation and the droplet disintegrated upon entering the CO2
liquid phase. Rapid nucleation of PVP results in the formation of microspheres.
Agglomeration of particles most likely occurs due to the build-up of DMF in the liquid
phase. The smaller volume occupied by the liquid phase results in a higher
concentration of DMF in the liquid phase. The increased level of DMF causes the PVP
particles to soften and coalescence of particles results.
Agglomeration of polystyrene has been reported when precipitating by spraying into
vapour phase CO2.10 The formation of a solvent rich liquid phase at the bottom of the
vessel caused agglomeration of the polystyrene particles.
Spraying a solution of PVP into vapour over liquid CO2 can be viewed as similar to the
GAS process with extremely rapid rates of expansion. It would therefore be expected
that at best, precipitation by GAS would yield highly agglomerated particles as was
seen for the vapour over liquid ASES process. This was confirmed by the precipitation
of PVP from DMF by GAS yielding films and, in some instances, solubilisation and
extraction of the polymer.
8.3.3. The Effect of Temperature
The effect of temperature on the characteristics of PVP precipitated by the ASES
process was investigated. PVP particles were produced from 50 and 100 mg.g-1 DMF
solutions at 10°C using an anti-solvent pressure of 5.5 MPa examples of which are
shown in Figure 8.7 (See also Appendix VII, Figure VII.2).
Significant agglomeration of PVP particles occurred at 10°C. The results at 10°C
support the hypothesis that agglomeration was not due to plasticisation, since it was
expected to be decreased by reducing the temperature.
8.4. Co-Precipitation of PVP and Cu-Indo by ASES.
The preliminary investigations into the precipitation of PVP from DMF using ASES
showed that it was possible to form microspheres of PVP when operating at 25°C and

CHAPTER 8
272
3 µm
Figure 8.7 SEM images of PVP particles produced by the ASES process from a 50
mg.g-1 solution of in DMF at 10°C and 5.5 MPa using a solution flow rate of 0.1
mL.min-1 through a 229 µm nozzle.

CHAPTER 8
273
14.0 MPa. The aims of the co-precipitation experiments were to show the applicability
of ASES to produce polymer—drug co-precipitates and to investigate the effect of
process variables on the co-precipitate characteristics.
The ASES co-precipitation conditions investigated are listed in Table 8.5. All
experiments were conducted using DMF as the solvent, a solution flow rate of 0.1
mL.min-1, a nozzle with an internal diameter of 0.229 µm and a CO2 flow rate between
4 and 5 mL.min-1 co-current with the solution flow.
Table 8.5 Results of the co-precipitation of PVP and Cu-Indo by ASES.
T / °C P / MPa Conc. / mg.g-1 PVP:Cu-Indo
25 6.6 50 60:40
25 10.39 100 50:50
25 10.39 100 70:30
25 10.39 100 90:10
25 14.0 50 60:40
25 14.0 100 50:50
25 14.0 100 70:30
25 14.0 100 90:10
40 19.0 50 60:40
The particles produced from DMF solutions containing both PVP and Cu-Indo showed
no evidence of agglomeration even at low anti-solvent density conditions, examples of
which are shown in Figure 8.8. Variation of solute concentration, PVP to Cu-Indo ratio,
temperature and anti-solvent density had a negligible effect on the particles produced.
All the precipitates produced were pale green in colour and consisted of spheres with
diameters less than 1 µm.
The co-precipitation results demonstrate the system dependent nature of dense gas anti-
solvent processes. Examples of particles produced from ASES when precipitating
individual DMF solutions containing Cu-Indo, PVP and a mixture of PVP and Cu-Indo
are compared in Figure 8.9. The results obtained from experiments conducted using

CHAPTER 8
274
(b)
(a)
1.5 µm
1.5 µm
Figure 8.8 SEM images of the PVP—Cu-Indo particles produced from DMF
solutions with a solute concentration of 100 mg.g-1 by the ASES process at 25°C
using a solution flow rate of 0.1 mL.min-1 through a 229 µm nozzle. (a) 10.39 MPa
and a 70:30 PVP:Cu-Indo ratio, (b) 14.0 MPa and a 50:50 PVP:Cu-Indo ratio.

CHAPTER 8
275
(c)
(a)
3 µm
10 µm
(b)
1 µm
Figure 8.9 SEM images comparing the particles produced from ASES using 100
mg.g-1 solutions of Cu-Indo, PVP and PVP—Cu-Indo in DMF at 25°C and 14.0
MPa. (a) Cu-Indo, (b) PVP, (c) 50:50 PVP:Cu-Indo ratio.
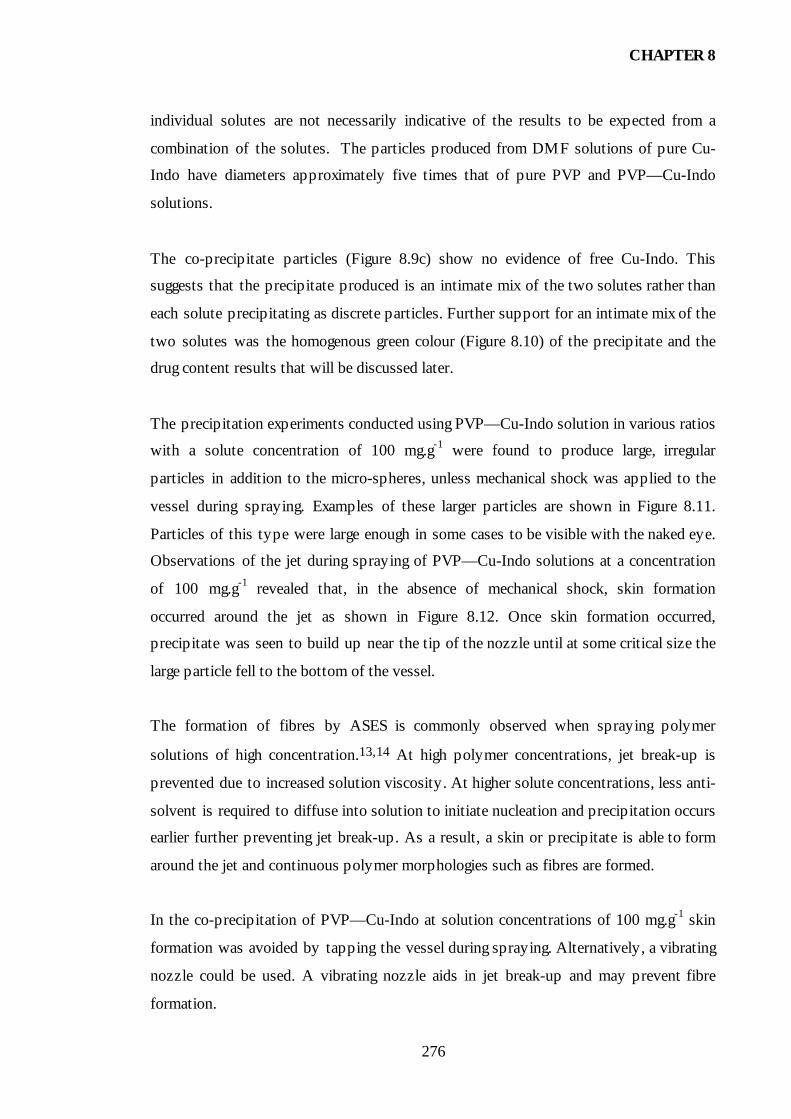
CHAPTER 8
276
individual solutes are not necessarily indicative of the results to be expected from a
combination of the solutes. The particles produced from DMF solutions of pure Cu-
Indo have diameters approximately five times that of pure PVP and PVP—Cu-Indo
solutions.
The co-precipitate particles (Figure 8.9c) show no evidence of free Cu-Indo. This
suggests that the precipitate produced is an intimate mix of the two solutes rather than
each solute precipitating as discrete particles. Further support for an intimate mix of the
two solutes was the homogenous green colour (Figure 8.10) of the precipitate and the
drug content results that will be discussed later.
The precipitation experiments conducted using PVP—Cu-Indo solution in various ratios
with a solute concentration of 100 mg.g-1 were found to produce large, irregular
particles in addition to the micro-spheres, unless mechanical shock was applied to the
vessel during spraying. Examples of these larger particles are shown in Figure 8.11.
Particles of this type were large enough in some cases to be visible with the naked eye.
Observations of the jet during spraying of PVP—Cu-Indo solutions at a concentration
of 100 mg.g-1 revealed that, in the absence of mechanical shock, skin formation
occurred around the jet as shown in Figure 8.12. Once skin formation occurred,
precipitate was seen to build up near the tip of the nozzle until at some critical size the
large particle fell to the bottom of the vessel.
The formation of fibres by ASES is commonly observed when spraying polymer
solutions of high concentration.13,14 At high polymer concentrations, jet break-up is
prevented due to increased solution viscosity. At higher solute concentrations, less anti-
solvent is required to diffuse into solution to initiate nucleation and precipitation occurs
earlier further preventing jet break-up. As a result, a skin or precipitate is able to form
around the jet and continuous polymer morphologies such as fibres are formed.
In the co-precipitation of PVP—Cu-Indo at solution concentrations of 100 mg.g-1 skin
formation was avoided by tapping the vessel during spraying. Alternatively, a vibrating
nozzle could be used. A vibrating nozzle aids in jet break-up and may prevent fibre
formation.

CHAPTER 8
277
Figure 8.10 Photograph of the PVP—Cu-Indo precipitate formed from the ASES
process.

CHAPTER 8
278
(b)
(a)
10 µm
5 µm
Figure 8.11 SEM images of the PVP—Cu-Indo particles produced from DMF
solutions with a solute concentration of 100 mg.g-1 by the ASES process at 25°C
and 10.39 MPa using a solution flow rate of 0.1 mL.min-1 through a 229 µm nozzle.
PVP to Cu-Indo ratio (a) 70:30, (b) 50:50.

CHAPTER 8
279
SkinFormation
Figure 8.12 Photograph of the precipitation of PVP—Cu-Indo co-precipitate by
ASES. The solution concentration was 100 mg.g-1 in a 90:10 ratio of PVP:Cu-Indo.
The system was at 25°C, 10.39 MPa with a solution flow rate of 0.1 mL.min-1
through a 229 µm nozzle.

CHAPTER 8
280
The co-precipitation results demonstrate the ability of the ASES technique to form solid
blends. The ability of ASES to form blends can be directly attributed to the rapid nature
of the precipitation. The formation of an intimate blend relies on the precipitation of
both solutes occurring on similar time scales in close proximity to each other.14 If the
solutes were to precipitate on different time scales, two discrete precipitates would form
rather than an intimate mix.
8.5. Drug Content
The experimental drug loading of co-precipitates produced by the ASES process at
different PVP to Cu-Indo ratios and at two different pressures are listed in Table 8.6. All
precipitates were formed at a temperature of 25°C and a solution concentration of 100
mg.g-1 in DMF.
In all cases the concentration of Cu-Indo in the precipitate is slightly higher than
expected. The reason for the slightly higher Cu-Indo content may be that some of the
PVP is extracted during the precipitation. As mentioned previously, PVP has a high
solubility in DMF and a small percent of DMF in the vessel would be enough to
dissolve some of the polymer.
Table 8.6 Drug content of PVP—Cu-Indo co-precipitates.
Sample/
PVP:Cu-Indo
P / MPa Cu-Indo
Expected / %
Cu-Indo
Obtained / %
50:50 10.4 51.3 53.5
70:30 10.4 30.1 31.3
90:10 10.4 10.3 10.3
50:50 14.0 47.1 51.4
70:30 14.0 27.6 29.3
90:10 14.0 8.9 10.2

CHAPTER 8
281
8.6. Solubility of the PVP—Cu-Indo Co-Precipitates
One of the main objectives of the co-precipitation of Cu-Indo and PVP was to increase
the solubility of Cu-Indo in solvents that can be used in injectable formulations,
particularly for administration to horses. A useful solvent for injectable applications is
ethanol. The solubility of a mixture of PVP and Cu-Indo and pure Cu-Indo in ethanol is
compared to the co-precipitate solubility results in Table 8.7.
A significant enhancement in the solubility of Cu-Indo in ethanol was observed for the
PVP—Cu-Indo co-precipitates obtained from ASES. The greatest enhancement of 36
was observed for the PVP—Cu-Indo co-precipitate in a ratio of 90:10. As the ratio of
PVP to Cu-Indo was decreased, the solubility enhancement decreased from 5.3 to 3.3
for the 70:30 and 50:50 co-precipitates respectively. The PVP—Cu-Indo co-precipitates
once dissolved in ethanol, remained soluble for approximately four hours. After four
hours Cu-Indo precipitated. No significant solubility enhancement was observed for the
PVP—Cu-Indo physical mixtures.
Table 8.7 Solubility of Cu-Indo and PVP—Cu-Indo co-precipitate in ethanol at
25°C.
Sample Solubility /
mg.g-1
Solubility
Enhancement
Cu-Indo 1.9 —
Physical mix PVP:Cu-Indo — 50:50 2.5 1.3
Physical mix PVP:Cu-Indo — 70:30 1.7 0.9
Physical mix PVP:Cu-Indo — 90:10 1.3 0.7
Co-precipitate PVP:Cu-Indo — 50:50 6.4 3.3
Co-precipitate PVP:Cu-Indo — 70:30 10.3 5.3
Co-precipitate PVP:Cu-Indo — 90:10 40.0 36
The typical dose of Cu-Indo is 2 mg per 10 kg of bodyweight. Taking the mass of a
horse to be 450 kg, at least 47 g of an ethanol solution of Cu-Indo would need to be
administered to give the required dose. By forming a PVP—Cu-Indo co-precipitate, the

CHAPTER 8
282
increase in solubility of the drug reduces the amount of solution to 14, 8.8 and 2.3 g for
the 50:50, 70:30 and 90:10 co-precipitates respectively. The reduction in the amount of
ethanol required per dose makes it possible to administer Cu-Indo by the injectable
route.
Two possible hypotheses have been presented to explain the solubility enhancement
observed when PVP is co-precipitated with compounds of lower molecular weight. The
first hypothesis explains the solubility enhancement in terms of an interaction between
the hydrocarbon segments of the polymer and similar portions of the co-solute.17,18
This interaction termed the "hydrophobic bond" concept has been used to explain the
increase in solubility observed for PVP—co-solute co-precipitates.19 The second
hypothesis explains the solubility enhancement in terms of the formation of a complex
between PVP and low molecular weight compounds.20 The formation of a complex has
been used to explain the solubility enhancement observed for a PVP—sulfathiazole co-
precipitate.20 The complex was proposed to have formed by hydrogen bonding between
the amino groups of the sulfathiazole and the oxygen groups of the PVP. A
representation of the proposed complex is shown in Figure 8.13
To investigate the nature of the PVP—Cu-Indo co-precipitate DSC was conducted on
PVP, Cu-Indo, a physical mix of PVP and Cu-Indo in a 50:50 ratio and the 50:50
PVP—Cu-Indo co-precipitate. The DSC spectra obtained are compared in Figure 8.14.
The DSC spectrum of PVP does not show a melting point at 300°C. The expected
melting point of PVP (10,000) is approximately 300°C. The absence of a melting point
peak is most likely due to the amorphous nature of the polymer and the correspondingly
low energy required for a phase transition. The broad peak from ambient to 100°C can
be attributed to a loss in water that has been observed for PVP previously.21-24 The
DSC spectra of the PVP—Cu-Indo physical mix (Figure 8.14 c) is identical to a
combination of the pure PVP and Cu-Indo spectra. The DSC spectra of the PVP–Cu-
Indo co-precipitate (Figure 8.14 d) is significantly different. The peak at 205°C
corresponding to the melting point of Cu-Indo shifted to a lower temperature. The broad
peak between 100 and 150°C corresponding to the loss of solvent from Cu-Indo is not
evident in the co-precipitate.

CHAPTER 8
283
O
SO2
NH
N
O
S
OH HO
N
Figure 8.13 PVP—sulfathiazole complex.20

CHAPTER 8
284
0 50 100 150 200 250 300 350 400Temperature / °C
∆H
(a)
(b)
(c)
(d)
Figure 8.14 Comparison between the DSC spectra of (a) PVP, (b) Cu-Indo, (c)
50:50 physical mix of PVP and Cu-Indo, (d) 50:50 PVP—Cu-Indo co-precipitate.

CHAPTER 8
285
Room temperature X-band EPR was conducted on the 50:50 PVP-Cu-Indo co-
precipitate to further investigate the nature of the co-precipitate. The X-band EPR
spectra of pure Cu-Indo and the PVP—Cu-Indo co-precipitate are compared in Figure
8.15. The spectra of the co-precipitate shows a large peak at 3300 G which corresponds
to Cu(II) monomer.25 The peak at 4720 G which corresponds to the Cu(II) dimer
appears in both spectra.25
The results from the DSC and X-band EPR analyses indicate that the PVP—Cu-Indo
co-precipitate is not simply a mixture of the two compounds. The results support the
hypothesis that the increase in Cu-Indo solubility in ethanol is due to a complex forming
between PVP and Cu-Indo. The complex may have a similar structure to the PVP—
sulfathiazole complex described previously, with hydrogen bonding between the two
molecules. In the case of PVP—Cu-Indo, however, it is more likely that the bonding is
occurring between the Cu of the Cu-Indo and the oxygen on PVP. The loss of the
solvent peak in the DSC spectra of the co-precipitate (Figure 8.14 d) indicates that the
coordination site on the Cu that is normally occupied by a solvent molecule may be
occupied by PVP. The presence of a larger Cu(II) monomer signal in the X-band EPR
spectra suggests that PVP may also be interfering with the Cu—Cu bond of the Cu-
Indo. A representation of the proposed PVP—Cu-Indo complex is shown in Figure
8.16.
The fact that a larger percentage of Cu(II) monomer is present in the PVP—Cu-Indo co-
precipitate is of concern as the active form of Cu-Indo is thought to be the dimeric
complex.25 As mentioned above, the co-precipitate was soluble in ethanol for
approximately four hours after which time Cu-Indo precipitated. The precipitation of
Cu-Indo may be due to PVP being replaced by ethanol in the Cu-Indo complex. Once
the solvent replaces PVP, the original Cu-Indo is formed which is slightly soluble in
ethanol and the excess solute precipitates. If this is the case, then the presence of
monomer in the co-precipitate does not pose a problem, as Cu-Indo should resort to its
original form once it is administered in the body.

CHAPTER 8
286
0 2000 4000 6000 8000 10000
Magnetic Field / G
(a)
(b)
Figure 8.15 Comparison between the X-band EPR spectra of (a) Cu-Indo and (b)
50:50 PVP—Cu-Indo co-precipitate.

CHAPTER 8
287
Cu
Cu
O
O
O O
C
C
C
RR
R
R
CCH 3
CH 2
O
= R
N
O
C
O
O
O
O
O
Cu
O
O
C
C
R
R
O
O
O
O
(a)
(b)
Figure 8.16 Proposed PVP—Cu-Indo complex. (a) Proposed dimeric complex, (b)
proposed monomeric complex

CHAPTER 8
288
8.7. Dissolution of the PVP—Cu-Indo Co-Precipitates
The dissolution rates of unprocessed Cu-Indo, micronised Cu-Indo, a physical mix of
PVP and Cu-Indo and PVP—Cu-Indo co-precipitates produced by ASES are compared
in Figure 8.17 (See Appendix V for data). The dissolution rate coefficient (Kw) was
used to compare dissolution rates. The dissolution rate coefficients of the 50:50, 70:30
and 90:10 PVP—Cu-Indo co-precipitates were calculated to be 0.029, 0.036 and 0.012,
respectively. No significant difference in dissolution rate was observed for a 50:50
physical mix of PVP and Cu-Indo. The 50:50 and 70:30 PVP—Cu-Indo co-precipitates
gave the greatest enhancement in dissolution rate with an increase of 18 and 14.5 times
respectively. Although this is a significant increase in dissolution rate compared to
unprocessed Cu-Indo, there is only a two fold increase in dissolution rate when
compared to the micronised Cu-Indo. The 90:10 PVP—Cu-Indo co-precipitate had a
similar dissolution rate to micronised Cu-Indo.
No significant increase in solubility was observed when the PVP—Cu-Indo co-
precipitates were dissolved in water. It is therefore unlikely that the increase in
dissolution rate was solely a result of the increased solubility of Cu-Indo in water. The
increase in dissolution rate may also be a result of the decrease in particle size of Cu-
Indo upon co-precipitation with PVP. The co-precipitate particles were generally less
than 1 µm in diameter, whereas the micronised Cu-Indo particles were between 2 and
10 µm. It is feasible that the reduction in particle size may be the reason for the increase
in dissolution rate. The fact that the 90:10 co-precipitate did not show as great an
enhancement in dissolution rate, indicates that a reduction in particle size is not the sole
reason for an increased rate of dissolution.
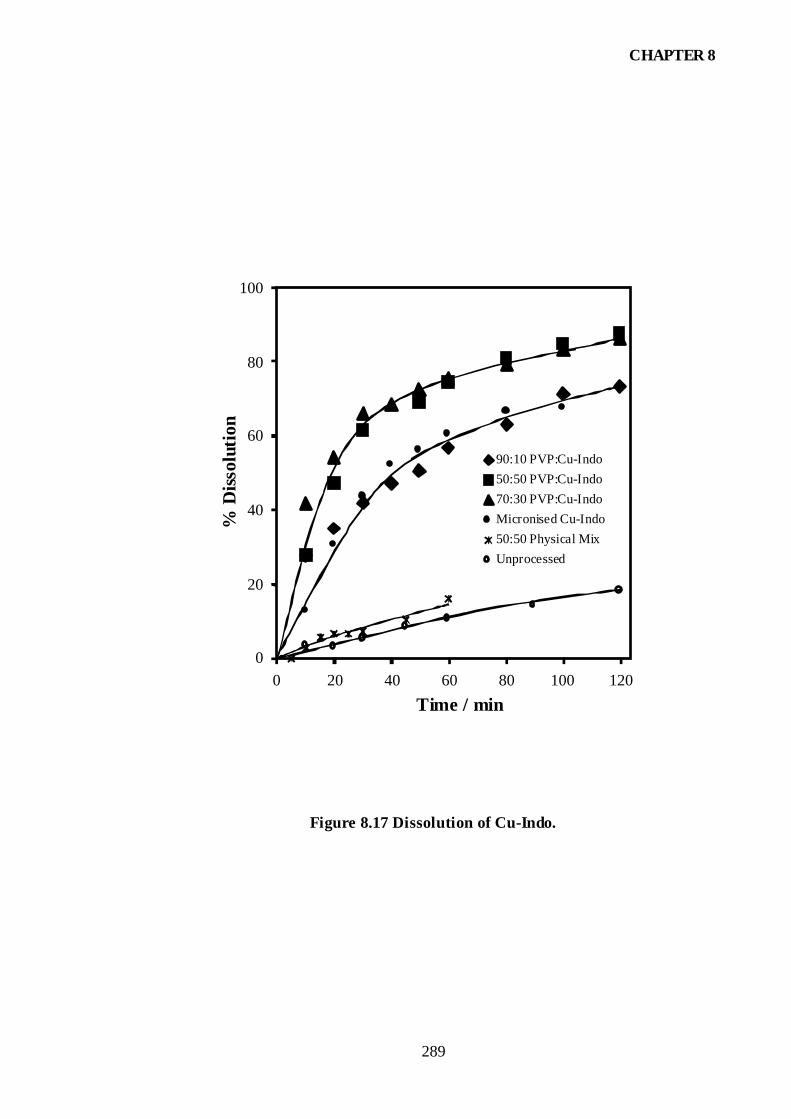
CHAPTER 8
289
Time / min
% D
issol
utio
n
0
20
40
60
80
100
0 20 40 60 80 100 120
90:10 PVP:Cu-Indo50:50 PVP:Cu-Indo70:30 PVP:Cu-IndoMicronised Cu-Indo50:50 Physical MixUnprocessed
Figure 8.17 Dissolution of Cu-Indo.

CHAPTER 8
290
8.8. Conclusions
Polyvinylpyrrolidone was successfully processed by the ASES technique using CO2 as
the anti-solvent. The ratio of CO2 to solvent was found to be an important parameter in
the processing of PVP. If the ratio of CO2 to solvent was too low, PVP was extracted
rather than precipitated in the vessel. At optimum conditions microspheres with
diameters less than 1 µm were produced from the ASES process. Pressure and solution
concentration were found to be important parameters controlling particle characteristics.
The degree of agglomeration of the PVP precipitate was found to increase at lower
pressures. Agglomeration was attributed to the washing step where the presence of
DMF resulted in the coalescence of particles.
Polyvinylpyrrolidone and Cu-Indo were successfully co-precipitated using the ASES
process. The co-precipitates could be produced in a number of PVP to Cu-Indo ratios
and drug content was as expected. In all experiments conducted, the co-precipitates
produced had a spherical morphology with diameters less than 1 µm. The benefit of co-
precipitating Cu-Indo with PVP was demonstrated by a 36 fold increase in the solubility
of the drug in ethanol.
The co-precipitate was found to give different DSC and X-band EPR spectra from a
simple addition of the pure PVP and Cu-Indo spectra. These results indicate that the co-
precipitate is not simply an intimate mix of PVP and Cu-Indo. It is likely that a PVP—
Cu-Indo complex is forming. The exact nature of this complex needs to be confirmed by
further investigation.
The co-precipitate showed a two-fold increase in dissolution rate in water compared to
micronised Cu-Indo. Co-precipitating PVP and Cu-Indo did not enhance the solubility
of the drug in water. The increase in dissolution rate was, therefore, attributed to the
reduction in particle size rather than an enhanced solubility of the drug. The particles of
co-precipitate produced were approximately an order of magnitude smaller than the
ASES micronised particles of Cu-Indo. At PVP:Cu-Indo ratios of 90:10, the rate of
dissolution decreased to be equivalent to the pure micronised drug.
CHAPTER 8
291
The PVP—Cu-Indo co-precipitate produced by ASES provides opportunities to develop
new formulation of Cu-Indo that were not previously possible. These formulations will
increase the marketability and competitiveness of the drug.

CHAPTER 8
292
8.9. References
1. Deluka, P.; Mehta, R.; Hausberger, A.; Thanoo, B.; Biodegradable Polyesters for
Drug and Polypeptide Delivery, Polymeric Delivery Systems: Properties and
Applications; American Chemical Society: Washington, DC, 1993.
2. Wessel, W.; Schoog, M.; Winkler, E.; "Polyvinylpyrrolidone (PVP), its Diagnostic,
Therapeutic and Technical Application and Consequences Thereof,"
Arzneimittelforschung 1971, 21, 1468.
3. Wu, H.; Lin, Z.; Li, Z.; Zhong, D.; Liu, X.; "Preparations of Prostaglandins. III.
Studies on the Sustained-Release of dl-15-Methylprostaglandin F2α from
Injections," Acta. Acad. Med. Primae Shanghai 1982, 9, 450.
4. Mawad, J.; Dtsch. Med. J. 1972, 26, 453.
5. Cannon, C. S.; Falk, R. F.; Randolph, T. W.; "Role of Crystallinity in Retention of
Polymer Particle Morphology in the Presence of Compressed Carbon Dioxide,"
Macromolecules 1999, 32, 1890.
6. Bodmeier, R.; Wang, H.; Dixon, D.; Mawson, S.; Johnston, K.; "Polymeric
Microspheres Prepared By Spraying Into Compressed Carbon Dioxide," Pharm. Res.
1995, 12, 1211.
7. Young, T. J.; Johnston, K. P.; Mishima, K.; Tanaka, H.; "Encapsulation of Lysozyme
in a Biodegradable Polymer by Precipitation with a Vapor-over-Liquid Anti-
Solvent," J. Pharm. Sci. 1999, 88, 640.
8. Yeo, S. D.; Debenedetti, P. G.; Radosz, M.; Schmidt, H. W.; "Supercritical Anti-
Solvent Process for Substituted Para-Linked Aromatic Polyamides: Phase
Equilibrium and Morphology Study," Macromolecules 1993, 26, 6207.
9. Dixon, D. J.; Johnston, K. P.; "Formation of Microporous Polymer Fibers and
Oriented Fibrils by Precipitation with a Compressed Fluid Anti-Solvent," J. Appl.
Polym. Sci. 1993, 50, 1929.
10. Dixon, D. J.; Johnston, K. P.; Bodmeier, R. A.; "Polymeric Materials Formed by
Precipitation with a Compressed Fluid Anti-Solvent," AIChE J. 1993, 39, 127.
11. Dixon, D. J.; Luna-Bárcenas, G.; Johnston, K. P.; "Microcellular Microspheres and
Microballoons by Precipitation with a Vapour-Liquid Compressed Fluid Anti-
Solvent," Polymer 1994, 35, 3998.

CHAPTER 8
293
12. Bleich, J.; Müller, B. W.; Waßmus, W.; "Aerosol Solvent Extraction System - A
New Microparticle Production Technique," Int. J. Pharm. 1993, 97, 111.
13. Luna-Bárcenas, G.; Kanakia, S. K.; Sanchez, I. C.; Johnston, K. P.; "Semicrystalline
Microfibrils and Hollow Fibers by Precipitation with a Compressed-Fluid Anti-
Solvent," Polymer 1995, 36, 3173.
14. Mawson, S.; Kanakia, S.; Johnston, K. P.; "Metastable Polymer Blends by
Precipitation with a Compressed Fluid Anti-Solvent," Polymer 1997, 38, 2957.
15. Heater, K. J.; Tomasko, D. L.; "Processing of Epoxy Resins Using Carbon Dioxide
as an Anti-Solvent," J. Supercrit. Fluids 1998, 14, 55.
16. Tan, C.-S.; Lin, H.-Y.; "Precipitation of Polystyrene by Spraying Polystyrene-
Toluene Solution into Compressed HFC-134a," Ind. Eng. Chem. Res. 1999, 38,
3898.
17. Molyneux, P.; Frank, H. P.; "The Interaction of Polyvinylpyrrolidone with Aromatic
Compounds in Aqueous Solution. Part I. Thermodynamics of the Binding Equilibria
and Interaction Forces," J. Am. Chem. Soc. 1961, 83, 3169.
18. Molyneux, P.; Frank, H. P.; "The Interaction of Polyvinylpyrrolidone with Aromatic
Compounds in Aqueous Solution. Part II. The Effect of the Interaction on the
Molecular Size of the Polymer," J. Am. Chem. Soc. 1961, 83, 3175.
19. Svoboda, G. H.; Sweeney, M. J.; Walkling, W. D.; "Antitumor Activity of an
Acronycine-Polyvinylpyrrolidone Co-Precipitate," J. Pharm. Sci. 1971, 60, 333.
20. Badawi, A. A.; El-Sayed, A. A.; "Dissolution Studies of Povidone-Sulfathiazole
Coacervated Systems," J. Pharm. Sci. 1980, 69, 492.
21. Suzuki, H.; "Influence of Water-Soluble Polymers on the Dissolution of Nifedipine
Solid Dispersions with Combined Carriers," Chem. Pharm. Bull. 1998, 46, 482.
22. Rodriguez-Espinosa, C.; Martin, C.; Goni, M. M.; Velaz, I.; Sanchez, M.;
"Dissolution Kinetics for Co-Precipitates of Diflunisal with PVP K30," European
Journal of Drug Metabolism and Pharmokinetics 1998, 23, 109.
23. Martinez, P.; Cantera, R. G.; Martin, C.; Dosi-Vieitez, C.; Martinez-Oharritz, C.;
"Preparation and Dissolution Rate of Gliquidone-PVP K30 Solid Dispersions,"
European Journal of Drug Metabolism and Pharmokinetics 1998, 23, 113.
24. Yagi, N.; Kenmotsu, H.; Sekikawa, H.; Takada, M.; "Dissolution Behaviour of
Probucol From Solid Dispersion Systems of Probucol-Polyvinylpyrrolidone," Chem.
Pharm. Bull. 1996, 44, 241.

CHAPTER 8
294
25. Weder, J. E. "Characterisation of Copper(II) Dimers of the Non-Steroidal Anti-
Inflammatory Drug Indomethacin," University of Sydney; 2000
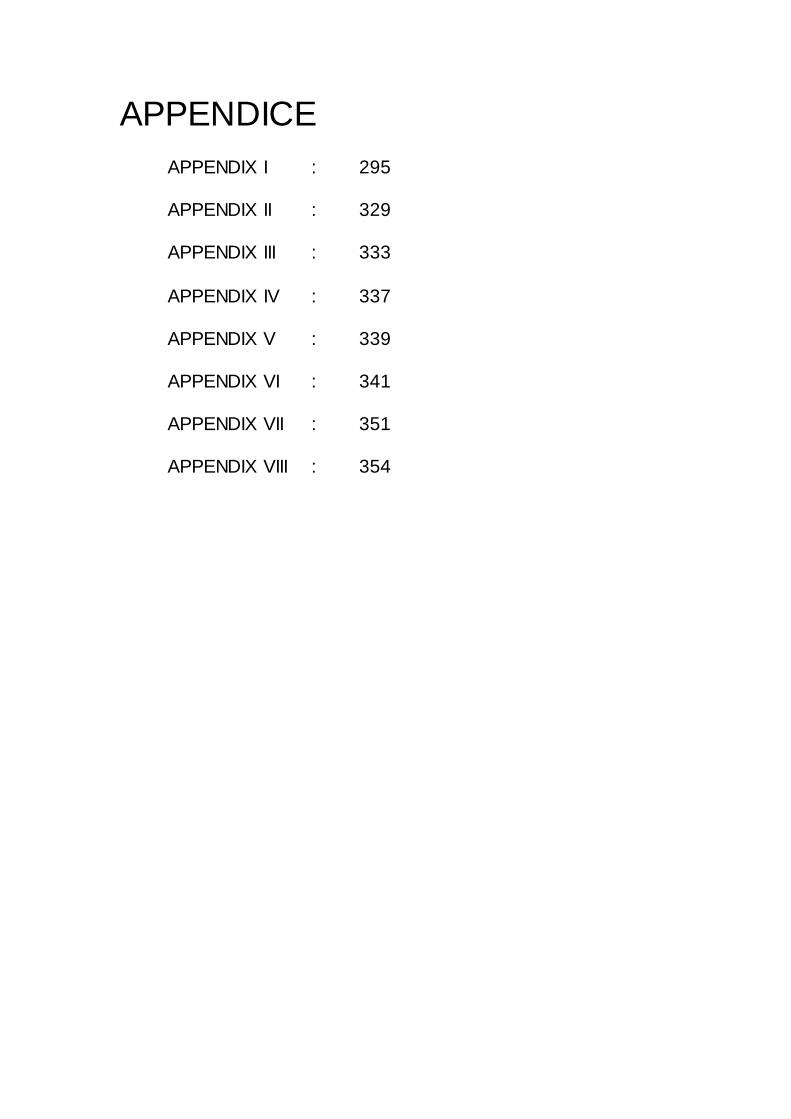
APPENDICE APPENDIX I : 295 APPENDIX II : 329 APPENDIX III : 333 APPENDIX IV : 337 APPENDIX V : 339 APPENDIX VI : 341 APPENDIX VII : 351 APPENDIX VIII : 354

295
APPENDIX I I.LITERATURE REVIEW OF THE USE OF DENSE GASES AS ANTI-SOLVENTS
I.1. Review of GAS Applications
Table I.1 Review of GAS applications.
MICRONISATION / RECRYSTALLISATION
Chemical Solvent Anti-Solvent T
(°C)
P
(MPa)
Particle
Size (µm)
Morphology
Reference
HYAFF-11 Hyaluronic acid
ethyl ester Dimethylsulfoxide CO2 35 10.0 0.4
aggregates
microspheres 1
Phenanthrene Toluene CO2 25 4.5 180 to 540 2 1,3,5,7-tetranitro-1,3,5,7-
tetraazacyclooctane (β-HMX) Acetone CO2 33
10.0 to
12.0 2 to 5 crystalline 3
β-Carotene Ethyl acetate CO2 43 to
82 2.5 to 6.0 2 to 10 Platelets 4
Nitroguanidine (NQ) N-Methylpyrrolidone,
Dimethylformamide ClF2CH, CO2
20 to
22
0.55 to
1.24 2 to 100
snowballs,
starbursts 5
Cobalt chloride
Saligenin Acetone
CO2
25 to
45 < 50
diamond, irregular
monodisperse
particles
6

APPEN
DIX
I
296
Table I.1 Review of GAS applications.
MICRONISATION / RECRYSTALLISATION
Chemical Solvent Anti-Solvent T
(°C)
P
(MPa)
Particle
Size (µm)
Morphology
Reference
Cyclotrimethylenetrinitramine
(RDX)
Acetone,
Cyclohexanone CO2
24 to
50 3.7 to 15.9 5 to 150 7
Prednisolone, Dexamethasone,
Flunisolide, Triamcinolone-
Acetonide
Acetone, Ethanol CO2 8
Dexamethasone Ethanol, Acetone CO2 1 to 2 large flat platelets 9
Bilirubin
Dimethylsulphoxide
CO2
35 to
60
10.0 to
30.0 < 0.5x1
powdered products
10
Sulfathiazole Ethanol CO2 25 5.8 10 to 6000 pillar like crystals 11 Cyclotrimethylenetrinitramine
(RDX)
Nitroguanidine (NQ)
Cobalt chloride
Acetone
Cyclohexanone
N-methylpyrrolidone
Dimethylformamide
CO2
Chloro-
difluoromethane
25 6.2
0.83 12

APPEN
DIX
I
297
Table I.1 Review of GAS applications.
MICRONISATION / RECRYSTALLISATION
Chemical Solvent Anti-Solvent T
(°C)
P
(MPa)
Particle
Size (µm)
Morphology
Reference
α-chymotrypsin
Imipramine
Insulin
Ribonuclease
Cytochrome C
Pentamidine
iso-Octane
Methylene chloride
Pyridine
Tetrahydrofuran
Methanol
Ethanol
CO2 28 to
36 7.6 to 8.55 0.1 to 50
spheroidal
fibre like
collapsed spheres
13
Polystyrene Toluene HFC-134a -20 to
60 0.5
microspheres
film 14
Cyclotetramethylene
Tetranitramine
Acetone
γ-Butyrolactone CO2 40 8.0 90 to 200 crystals 15,16
p-hydroxybenzoic acid
Methanol
Acetone
Ethyl acetate
CO2 35 1 to 2
clusters
amorphous
dendritic
spheres
17

APPEN
DIX
I
298
Table I.1 Review of GAS applications.
MICRONISATION / RECRYSTALLISATION
Chemical Solvent Anti-Solvent T
(°C)
P
(MPa)
Particle
Size (µm)
Morphology
Reference
Insulin
Lysozyme
Albumin
Dimethylsulfoxide
Dimethylformamide
Ethanol
Acetic acid
Ethyl acetate
Methanol
Ethanol + 2 to 15%
Water
CO2
NH4 0.01 to 1.8 spherical 18
Insulin
Lysozyme
Myoglobin
Methanol
Ethanol
Ethy lacetate
Dimethylsulfoxide
CO2 18 to
45 3.0 to 6.0 0.03 to 8
spherical
spherical-
agglomeration
19
Acetaminophen Ethanol CO2 20 to
25 7.1 20
Insulin Dimethylsulphoxide CO2 35 8.6 4 spheres 21
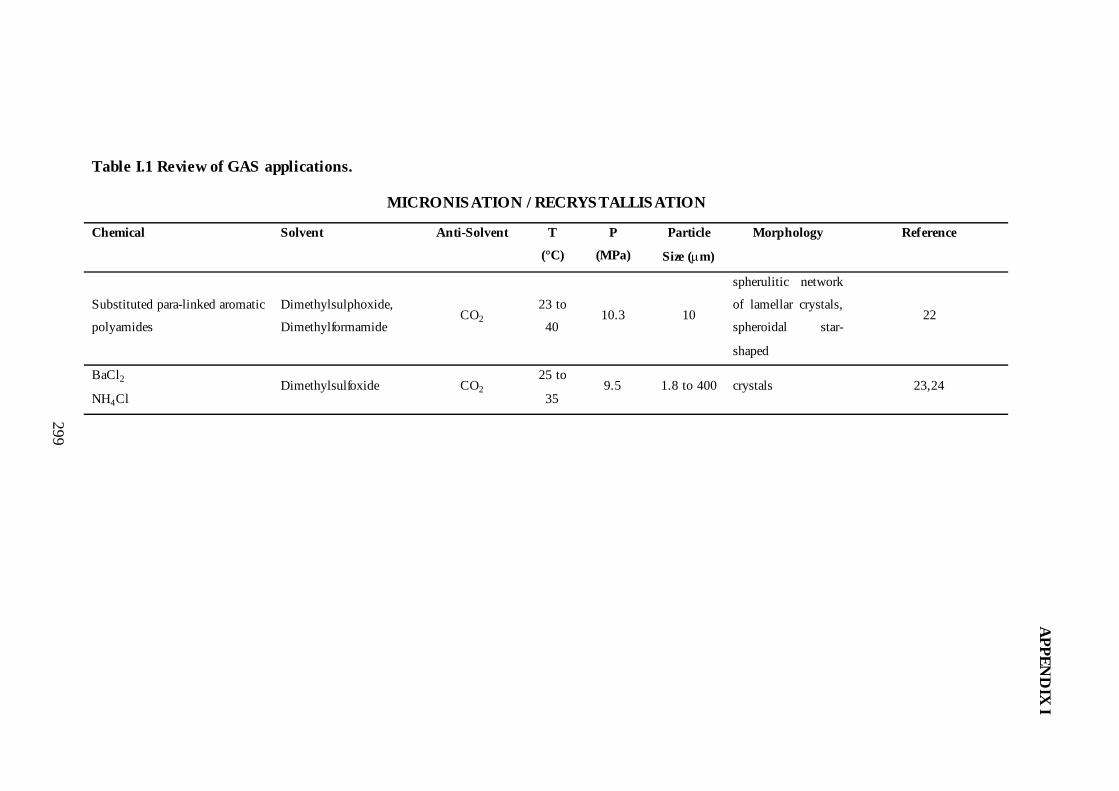
APPEN
DIX
I
299
Table I.1 Review of GAS applications.
MICRONISATION / RECRYSTALLISATION
Chemical Solvent Anti-Solvent T
(°C)
P
(MPa)
Particle
Size (µm)
Morphology
Reference
Substituted para-linked aromatic
polyamides
Dimethylsulphoxide,
Dimethylformamide CO2
23 to
40 10.3 10
spherulitic network
of lamellar crystals,
spheroidal star-
shaped
22
BaCl2
NH4Cl Dimethylsulfoxide CO2
25 to
35 9.5 1.8 to 400 crystals 23,24

APPEN
DIX
I
300
Table I.1 Review of GAS applications.
SEPARATION/PURIFICATION
Chemical Solvent Anti-Solvent T
(oC)
P
(MPa)
Purity
(%)
Reference
Naphthalene
Phenanthrene Toluene CO2 25 to 37 5.2 to 7.8 25
Lecithin from soya oil
Coriander essential from fixed oil Hexane CO2 25 to 40 4.0 to 7.5 100% to 0% 26
trans-β-Carotene from isomer and
oxide Acetaminophen
Cyclohexanone
Toluene
Butanol
CO2
25 to 35 7.0 to 9.7 > 99%
27
Anthracene from Anthraquinone Cyclo-hexanone CO2 18 to 40 3.5 to 12.4 28 Anthracene
Anthraquinone Cyclohexanone CO2 18 to 40 1.8 to 12.3 29
o-Hydroxybenzoic acid
p-Hydroxybenzoic acid Methanol CO2 25 7.0 99% 30
Bilirubin Dimethylsulfoxide CO2 35 to 60 10.0 to 30.0 > 90% 10
Anthracene from crude anthracene Acetone CO2 27 5.3 to 10.3 90% 31 Citric acid from byproduct organic
acids (oxalic and malic acids) Acetone CO2 30 2.5 to 2.7 > 99% 32
Fermented citric acid Acetone CO2 30 3.5 33

APPEN
DIX
I
301
Table I.1 Review of GAS applications.
SEPARATION/PURIFICATION
Chemical Solvent Anti-Solvent T
(oC)
P
(MPa)
Purity
(%)
Reference
Alkaline phosphatase from Insulin
Lysozyme from ribonuclease
Trypsin from catalase
DMSO CO2 34 to 44 0 to 8.0 100 34
Polyamides from LiCl N,N-Dimethylacetamide CO2 35 5.0 100 35
BaCl2 from NH4Cl DMSO CO2 25 4.35 100 23,24

APPEN
DIX
I
302
Table I.1 Review of GAS applications.
THEORETICAL
Chemical Solvent Anti-Solvent T
(oC)
P
(MPa)
Reference
Ethylcellulose
HP55
HYAFF 11
Salbuthanole
Pentamidine
Acetone
Ethylacetate
Dimthylsulfoxide
CO2 36
β-Carotene
Acetaminophen
Toluene
n-Butanol CO2 25 9.1 37
Naphthalene Toluene
CO2
Ethane
Ethene
Propane
38
Naphthalene
Phenanthrene
Anthracene
Benzoic Acis
Toluene
n-Octane
Ethanol
Acetone
CO2
Ethane
Ethene
Propane
39
Naphthalene
Phenanthrene
Mixture
Toluene CO2 25 6.4 40

APPEN
DIX
I
303
Table I.1 Review of GAS applications.
THEORETICAL
Chemical Solvent Anti-Solvent T
(oC)
P
(MPa)
Reference
NaCH3COO
LiCl
Acitominophen
Fructose
NH4Cl
NaSCN
Adipic acid
Naphthalene
Tartaric acid
Urea
NaClO3
NH4ClO4
Sucrose
NaCl
Monosodium glutamate
MgSO4•7H2O
Pentaerythritol
NH4H2PO4
K2SO4
Citric acid monohydrate
Ethanol
Acetone
Toluene
80 to 44% Methanol
CO2 14,41

APPEN
DIX
I
304
Table I.1 Review of GAS applications.
THEORETICAL
Chemical Solvent Anti-Solvent T
(oC)
P
(MPa)
Reference
Acetominophen
Paracetamol
Tylenol
Cholesterol
Ethanol
Diethyl ether CO2 19 to 44 7.0 to 15.0 42
Phenanthrene
Naphthalene
β-Carotene
Toluene CO2 25 7.0 43,44
Tetradecanoic acid
Stearic acid
Behenic acid
Ethyl acetate CO2 35 to 45 2.5 to 8.0 45
Naphthalene Toluene CO2 10 to 70 2.0 to 12.0 46

APPEN
DIX
I
305
I.2. Review of ASES Applications
Table I.2 Review of ASES applications.
MICRONISATION / RECRYSTALLISATION
Solute Solvent Anti-
Solvent
P
(MPa)
T
(°C)
Nozzle
(µm)
Particle Size
(µm) Morphology Reference
Hyaluronic acid benzylic ester
(HYAFF-11) Dimethylsulfoxide CO2 8.5 42 40 20 Microspheres 1
DL- Poly(lactic acid)
Poly(β-hydroxy butyric acid)
L- Poly(lactic acid)
DL-lactide-co-glycolide 50:50
Methylene chloride CO2 9.0/20.0 40 400 Microspheres 47
Poly(methyl methacrylate)
Ethyl cellulose
DL- Poly(lactic acid)
L-Poly(lactic Acid)
Poly(E-caprolactone)
DL-lactide-co-glycolide 50:50
Methylene chloride CO2 2.0 to 27.6 -10 to 40 100 Microspheres and
fibres 48
Lysozyme
Albumin
Dnase
Insulin
Water CO2 +
Ethanol 8.0 to 9.0 20 to 45
Coaxial nozzle
50 0.05 to 0.5 Microspheres 49

APPEN
DIX
I
306
Table I.2 Review of ASES applications.
MICRONISATION / RECRYSTALLISATION
Solute Solvent Anti-
Solvent
P
(MPa)
T
(°C)
Nozzle
(µm)
Particle Size
(µm) Morphology Reference
Buckminsterfullerene Toluene CO2 7.58 to
9.65 35 to 50 75 0.029 to 0.083
Porous spherical
balloons
Rods
50
Naproxen
L-Poly(Lactic Acid) Acetone CO2 6.8 25 180 3, 50
Fibres
Irregular particles 51
Catalase, Insulin Dimethylsulfoxide CO2 9.0 35 20 1 Crystals and
microspheres 52,53
Polystyrene Toluene CO2 4.65 to
8.03 0 to 30 100 0.1 to 20 Fibres and fibrils 54
Polystyrene Toluene CO2 3.96 to
22.47 0 to 40 100 0.1 to 20
Microspheres and
fibres 55
Polystyrene Toluene CO2 0.1 22 151 1400 Hollow
microspheres 56
Red Lake C
C. I. Pigment Blue
C. I. Pigment Yellow
Acetone CO2 6.0 to 25.0 40 to 150 5 to 500 Microspheres 57,58
Acetominophen
Lysozyme Water + Ethanol CO2
10.0 to
15.0 35 to 55 Coaxial nozzle
Acicular
Microspheres 59

APPEN
DIX
I
307
Table I.2 Review of ASES applications.
MICRONISATION / RECRYSTALLISATION
Solute Solvent Anti-
Solvent
P
(MPa)
T
(°C)
Nozzle
(µm)
Particle Size
(µm) Morphology Reference
Lactose
Maltose
Trehalose
Sucrose
Salmeterol xinafoate
R-TEM beta-lactamase
Water + Methanol
Water + Methanol
Water + Ethanol
Water + Ethanol
Actone + n-Hexane
Water + Ethanol
CO2 15.0 to
27.0 50 to 70
triple nozzle
assembly 60,61
Epoxy powder coating Acetone
Methyl ethyl ketone CO2 4.9 to 10.0 25 150 to 762
rods
microspheres 62
Bronze red Ethanol
Acetone CO2 5.5 to 12.0 35 to 75 50 1 to 14
Rhombic
Spheres
Needles
63
Sodium cromoglycate Methanol CO2 10.0 to
20.0 40 to 73 100 1 microspheres 64
Prednisolone acetate Acetone CO2 10.0 to
20.0 40 50 to 100 0.45 to 6.33 65
Polyacrylonitrile
Polystyrene
Dimethylformamide
Toluene CO2 40 50 to 100
0.1
100 to 3 cm
Microfibrils
Fibres 66,67

APPEN
DIX
I
308
Table I.2 Review of ASES applications.
MICRONISATION / RECRYSTALLISATION
Solute Solvent Anti-
Solvent
P
(MPa)
T
(°C)
Nozzle
(µm)
Particle Size
(µm) Morphology Reference
Soy lecithin Ethanol CO2 8.0 to 11.0 35 150 1 to 40
Agglomerated
spheres
Gel-like deposit
68,69
Streptomycin Methylene chloride CO2 8.8 to 8.9 35 to 36.8 sonicated
nozzle 0.1 to 0.4 Spheroidal 13
Polycarbonate
Poly(styrene-co-acrylonitrile) Tetrahydrofuran CO2 0, 23, 35 100 1
Aglgomerated
microspheres 70
L-Poly(lactic acid)
Polystyrene
Polyacrylonitrile
Methylene chloride
Toluene
Dimethylformamide
CO2 0 to 26 50 Microspheres 71
Polystyrene
Poly(methyl methacrylate)
Methyl ethyl ketone
Toluene CO2 12.4 23 50 1 to 50 Flocculates 72,73
Recombinant human immunoglobin G Water + Ethanol CO2 17.5 45 200 74
α-lactose Water + Ethanol
Water + Methanol CO2
15.0 to
30.0 50 to 90 75
Lactose monohydrate Water CO2 180 Irregular-shaped
particles 76
L-Poly(lactic acid) Methylene chloride CO2 6.2 to 9.65 31 to 40 75 1.5 Microspheres 77
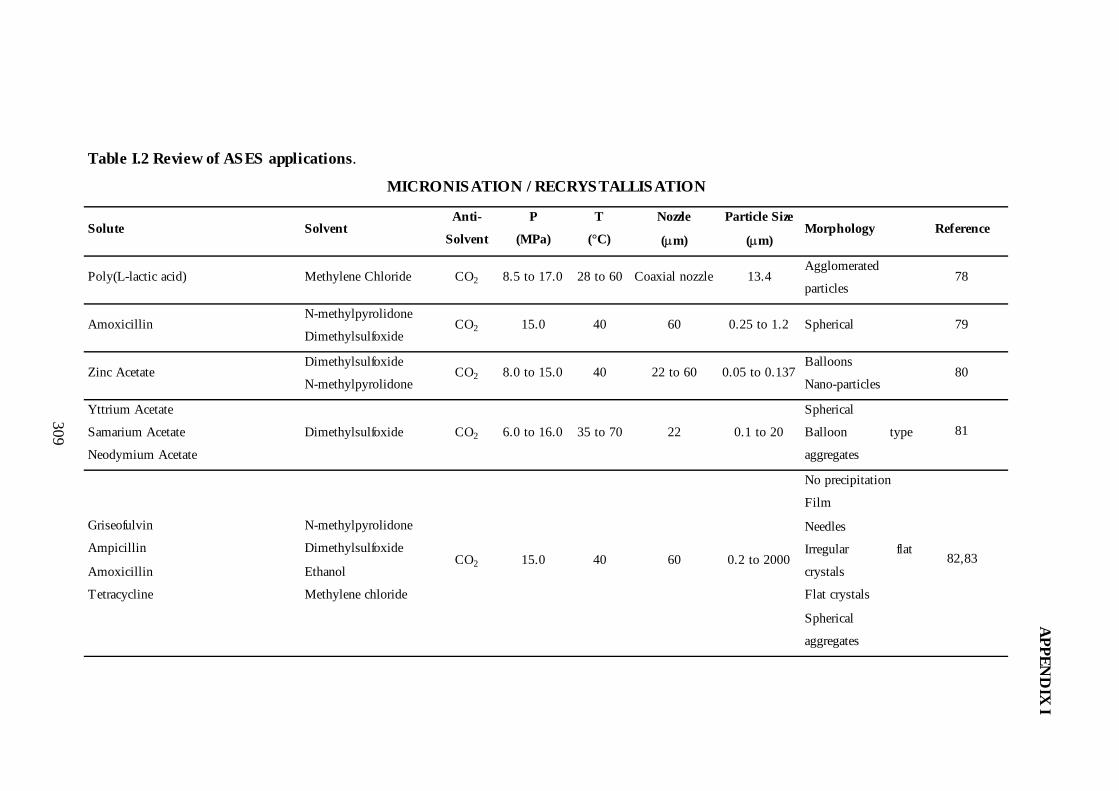
APPEN
DIX
I
309
Table I.2 Review of ASES applications.
MICRONISATION / RECRYSTALLISATION
Solute Solvent Anti-
Solvent
P
(MPa)
T
(°C)
Nozzle
(µm)
Particle Size
(µm) Morphology Reference
Poly(L-lactic acid) Methylene Chloride CO2 8.5 to 17.0 28 to 60 Coaxial nozzle 13.4 Agglomerated
particles 78
Amoxicillin N-methylpyrolidone
Dimethylsulfoxide CO2 15.0 40 60 0.25 to 1.2 Spherical 79
Zinc Acetate Dimethylsulfoxide
N-methylpyrolidone CO2 8.0 to 15.0 40 22 to 60 0.05 to 0.137
Balloons
Nano-particles 80
Yttrium Acetate
Samarium Acetate
Neodymium Acetate
Dimethylsulfoxide CO2 6.0 to 16.0 35 to 70 22 0.1 to 20
Spherical
Balloon type
aggregates
81
Griseofulvin
Ampicillin
Amoxicillin
Tetracycline
N-methylpyrolidone
Dimethylsulfoxide
Ethanol
Methylene chloride
CO2 15.0 40 60 0.2 to 2000
No precipitation
Film
Needles
Irregular flat
crystals
Flat crystals
Spherical
aggregates
82,83

APPEN
DIX
I
310
Table I.2 Review of ASES applications.
MICRONISATION / RECRYSTALLISATION
Solute Solvent Anti-
Solvent
P
(MPa)
T
(°C)
Nozzle
(µm)
Particle Size
(µm) Morphology Reference
Samarium acetate
Yttrium acetate
Neodymium acetate
Dimethylsulfoxide CO2 6.0 to 16.0 35 to 70 22 0.266 Microspheres 84
Dextran
Inulin
Poly-L-lactic acid
Poly(hydroxypropylmetacrylamide)
Poly-hyaluronic acid (HYAFF 11)
Dimethylsulfoxide
Methylene chloride CO2 8.0 to 15.0 40 60 0.1 to 100
microspheres
fibres 85,86
Polyvinyl alcohol
Poly caprolactone
Dimethylsulfoxide
Acetone
N-methylpyrolidone
Methylene chloride
CO2 8.0 to 15.0 40 60 networked particles
no precipitation 86
Model pharmaceutical compounds Dimethylformamide CO2 10.0 to
25.0 12 to 60
aggregated needles
platelets
hollow spheres
87,88
L-Poly(lactic acid) Methylene chloride CO2 9.0 40 1 to 2 microspheres 89

APPEN
DIX
I
311
Table I.2 Review of ASES applications.
MICRONISATION / RECRYSTALLISATION
Solute Solvent Anti-
Solvent
P
(MPa)
T
(°C)
Nozzle
(µm)
Particle Size
(µm) Morphology Reference
Methylprednisilone
THF,
Dimethylacetamide,
MeOH/Methylene
chloride,
1,3-Dioxilane
Ethane 10.0 to
15.0 -6 to 56 500 2.8 Needles 90
Trypsin
Lysosyme
Therapeutic Peptide
Antibody Fv and Fab
Plasmid DNA pSVβ
Water and Ethanol CO2 20.0 55 3 channel
coaxial nozzle < 2
irregular particles
and microspheres 91,92
Paracetamol Ethanol CO2 8.0 to 25.0 35 to 85 200 coaxial
nozzle 3 to 300
spheres
faceted crystals
needles
93
8 Steroids/surface-acting agent Methylene chloride CO2 8.5 40 300 < 5 microspheres 94

APPEN
DIX
I
312
Table I.2 Review of ASES applications.
MICRONISATION / RECRYSTALLISATION
Solute Solvent Anti-
Solvent
P
(MPa)
T
(°C)
Nozzle
(µm)
Particle Size
(µm) Morphology Reference
Hydrocortisone
Poly(DL-lactide-glycolide)
RG503H
HYAFF-7
Ibuprofen
Camptothecin
Dimethylsulfoxide
Ethyl acetate CO2 10.3 35 to 40
High energy
nozzle 0.5 to 500
Spherical
Whiskers
Hollow
microspheres
Flakes
Resin
95,96
p-hydroxybenzoic acid
L-Poly(lactic acid)
MeOH
Methylene chloride CO2 7.6 to 14.1 25
180
1020
Rhombic crystals
Microspheres 97
Polystyrene Toluene HFC-134a 0.579 to
0.897 -20 to 60 0.5 to 6
Microparticles
Fibrils 98
p-Hydroxybenzoic acid
MeOH
Acetone
Ethyl acetate
CO2 7.6 7 to 36 50 Rhombic particles 17
L-Poly(Lactic Acid) Methylene chloride CO2 7.0 to 12.5 40 6 to 50 Microspheres 99 Catalase
Insulin Ethanol CO2 8.0 35 20
Crystals and
microspheres 100
Trypsin,
Lysozyme
Insulin
Dimethylsulfoxide CO2 7.34 to
14.2
26.6 to
46.5 30 to 50 Microspheres 101

APPEN
DIX
I
313
Table I.2 Review of ASES applications.
MICRONISATION / RECRYSTALLISATION
Solute Solvent Anti-
Solvent
P
(MPa)
T
(°C)
Nozzle
(µm)
Particle Size
(µm) Morphology Reference
Insulin
Trypsin
Lysozyme
Dimethylsulfoxide CO2 9.1 to 17.3 28 to 46 1 to 5 102
Hydroquinone Acetone CO2 5.5, 6.1 22 67 needles and
prismatic particles 103
Acetominophen
Ascorbic acid Ethanol CO2 6.2 to 11.5 25 to 45 67 1 to 200
crystals
small aggregates 104
Insulin Dimethylsulfoxide
Dimethylformamide CO2 8.62 25 30 2.5 microspheres 21
Polyamide Dimethylsulfoxide
Dimethylformamide CO2 10.34 23 to 40 30 1 fibrils 22
Insulin Dimethylsulfoxide CO2 8.62 25 to 35 30 30 105
Salmeterol xinafoate Acetone
Ethanol CO2 35 coaxial nozzle
irregular needles
and particles 106

APPEN
DIX
I
314
Table I.2 Review of ASES applications.
ENCAPSULATION / CO-PRECIPITATION
Solute Solvent Anti-
solvent
P
(MPa)
T
(°C)
Nozzle
(µm)
Particle Size
(µm)
Morphology Reference
Indomethacin with L-Poly(lactic acid)
Thymopentin with L-Poly(lactic acid)
Piroxicam with L-Poly(lactic acid)
Hyoscine butylbromide with L-
Poly(lactic acid)
Methylene chloride CO2 9.0 to 20.0 400 < 8.4 Microsphere and
fibre network 107
Hyoscine butylbromide with L-
Poly(lactic acid)
Methanol
Methylene chloride CO2 9.0 to 20.0 33 to 60 1.7 Microspheres 108
Naproxen with L-Poly(lactic acid) Acetone CO2 6.8 25 180 < 20 51 Insulin with L-Poly(lactic acid)
Lysozima with L-Poly(lactic acid)
Chimotrypsin with L-Poly(lactic acid)
Trifluroacetic acid
Dimethylsulfoxide
Methylene chloride
CO2 10.0 to
13.0 19 to 37 50 1 to 5 Microspheres 109
Estriol with DL-lactide-co-glycolide
50:50
Bovine serum albumin with DL-lactide-
co-glycolide 50:50
2,2,2-
Trifluoroethanol
Methylene chloride
CO2 1.0 34 150 to 5 Microspheres 110
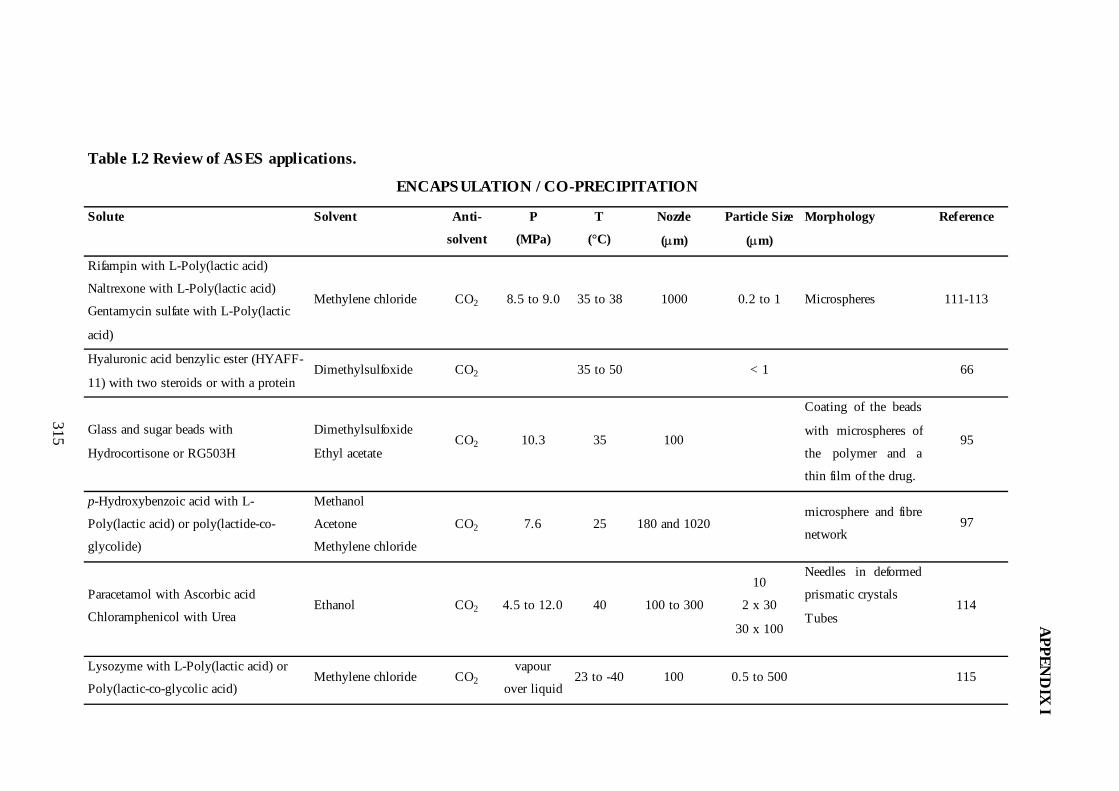
APPEN
DIX
I
315
Table I.2 Review of ASES applications.
ENCAPSULATION / CO-PRECIPITATION
Solute Solvent Anti-
solvent
P
(MPa)
T
(°C)
Nozzle
(µm)
Particle Size
(µm)
Morphology Reference
Rifampin with L-Poly(lactic acid)
Naltrexone with L-Poly(lactic acid)
Gentamycin sulfate with L-Poly(lactic
acid)
Methylene chloride CO2 8.5 to 9.0 35 to 38 1000 0.2 to 1 Microspheres 111-113
Hyaluronic acid benzylic ester (HYAFF-
11) with two steroids or with a protein Dimethylsulfoxide CO2 35 to 50 < 1 66
Glass and sugar beads with
Hydrocortisone or RG503H
Dimethylsulfoxide
Ethyl acetate CO2 10.3 35 100
Coating of the beads
with microspheres of
the polymer and a
thin film of the drug.
95
p-Hydroxybenzoic acid with L-
Poly(lactic acid) or poly(lactide-co-
glycolide)
Methanol
Acetone
Methylene chloride
CO2 7.6 25 180 and 1020 microsphere and fibre
network 97
Paracetamol with Ascorbic acid
Chloramphenicol with Urea Ethanol CO2 4.5 to 12.0 40 100 to 300
10
2 x 30
30 x 100
Needles in deformed
prismatic crystals
Tubes
114
Lysozyme with L-Poly(lactic acid) or
Poly(lactic-co-glycolic acid) Methylene chloride CO2
vapour
over liquid 23 to -40 100 0.5 to 500 115

APPEN
DIX
I
316
Table I.2 Review of ASES applications.
FRACTIONATION
Solute Solvent Anti-
Solvent
P
(MPa)
T
(°C)
Purity
(%)
Reference
Lecithin from soya oil Hexane CO2 4.5 to 7.5 25 to 40 100 116 Trans-β-Carotene and total β-carotene from
raw β-carotene Toluene CO2 7.5 31 96.8 27
Nylon from Carpet Material Formic Acid CO2 4.0 to 15.0 40 117 (R)-2,2'-Binaphthyl-1,1'-diamine from (S)-
2,2'-Binaphthyl-1,1'-diamine Methanol CO2 8.5 to 30.0 35 to 75 93 118
Lecithin from de-oiled egg yolk Hexane
Ethanol CO2 4.5 to 5.0 15 95 119
Paracetamol and ascorbic acid Ethanol CO2 7.0 40 100 114

APPENDIX I
317
I.3. References
1. Benedetti, L.; Bertucco, A.; Pallado, P.; "Production Of Micronic Particles Of
Biocompatible Polymer Using Supercritical Carbon Dioxide," Biotechnol. Bioeng.
1997, 53, 232.
2. Berends, E. M.; Bruinsma, O. S. L.; de Graauw, J.; van Rosmalen, G. M.;
"Crystallization of Phenanthrene from Toluene with Carbon Dioxide by the GAS
Process," AIChE J. 1996, 42, 431.
3. Cai, J.-G.; Liao, X.-C.; Zhou, Z.-Y.; "Mocroparticle Formation and Crystallization
Rate of HMX Using Supercritical Carbon Dioxide Anti-Solvent Recrystallization,"
The 4th International Symposium on Supercritical Fluids, Sendai, Japan, 1997, A,
23.
4. Cocero, M. J.; Ferrero, S.; Vicente, S.; "GAS Crystallization of β-Carotene from
Ethyl Acetate Solutions Using CO2 as Anti-Solvent," Proceedings of the 5th
International Symposium on Supercritical Fluids, Atlanta, Georgia, 2000.
5. Gallagher, P. M.; Coffey, M. P.; Krukonis, V. J.; Klasutis, N.; Gas Anti-Solvent
Recrystallization: New Process To Recrystallize Compounds Insoluble in
Supercritical Fluids; Johnston, K. P. and Penninger, J. M. L., Ed.; American
Chemical Society: Washington, DC, 1989; 406, 334.
6. Gallagher, P. M.; Krukonis, V.; Botsaris, G. D.; "Gas Anti-Solvent (GAS)
Recrystallization: Application to Particle Design," AIChE Symposioum Series 1991,
87, 96.
7. Gallagher, P. M.; Coffey, M. P.; Krukonis, V. J.; Hillstrom, W. W.; "Gas Anti-
Solvent Recrystallization of RDX: Formation of Ultra-Fine Particles of a Difficult-
to-Comminute Explosive," J. Supercrit. Fluids 1992, 5, 130.
8. Gallagher-Wetmore, P.; Coffey, M. P.; Krukonis, V.; "Application of Supercritical
Fluids in Recrystallization: Nucleation and Gas Anti-Solvent (GAS) Techniques,"
Respiratory Drug Delivery 1994, IV, 287.
9. Gallagher-Wetmore, P.; Coffey, M. P.; Krukonis, V.; "Recrystallization Using
Supercritical Fluids: Novel Techniques for Particle Modification," 1994, 162.

APPENDIX I
318
10. Jianguo, C.; Zhongwen, Y.; Zhanyun, Z.; "Purification of Bilirubin and Micro-
Particle Formation with Supercritical Fluid Anti-Solvent Precipitation," Chinese J. of
Chem. Eng. 1996, 4, 257.
11. Kitamura, M.; Yamamoto, M.; Yoshinaga, Y.; Masuoka, H.; "Crystal Size Control
of Sulfathiazole Using High Pressure Carbon Dioxide," J. Cryst. Growth 1997, 178,
378.
12. Krukonis, V. J.; Gallagher, P. M.; Coffey, M. P.; "Gas Anti-Solvent
Recrystallization Process," U.S. 5,360,478, 1994.
13. Manning, M. C.; Randolph, T. W.; Shefter, E.; Falk, R. F., III; "Solubilization of
Pharmaceutical Substances in an Organic Solvent and Preparation of Pharmaceutical
Powders Using the Same," Us 5770559, 1998.
14. Tan, C.-S.; Chang, W.-W.; "Precipitation of Polystyrene from Toluene with HFC-
134a by the GAS Process," Ind. Eng. Chem. Res. 1998, 37, 1821.
15. Teipel, U.; Foerter-Barth, U.; Krause, K. H.; "Formation of Particles with
Compressed Gases as Anti-Solvent," World Congress on Particle Technology 3,
Brighton, 1998, 189, 1.
16. Förter-Barth, U.; Teipel, U.; Krause, H.; "Formation of Particles by Applying the
Gas-Anti-Solvent (GAS) - Process," Proceedings of the 6th Meeting on Supercritical
Fluids, Nottingham, United Kingdom, 1999, 175.
17. Thiering, R.; Charoenchaitrakool, M.; Sze-Tu, L.; Dehghani, F.; Dillow, A. K.;
Foster, N. R.; "Crystallization of Para-Hydroxybenzoic Acid by Solvent Expansion
with Dense Carbondioxide," Proceedings of the 5th Meeting on Supercritical Fluids,
Nice, France, 1998, 291.
18. Thiering, R.; Dehghani, F.; Dillow, A.; Foster, N. R.; "Solvent Effects On The
Controlled Dense Gas Precipitation Of Model Proteins," J. Chem. Technol.
Biotechnol. 2000, 75, 29.
19. Thiering, R.; Dehghani, F.; Dillow, A.; Foster, N. R.; "The Influence of Operating
Conditions on the Dense Gas Precipitation of Model Proteins," J. Chem. Technol.
Biotechnol. 2000, 75, 29.
20. Wubbolts, F. E.; Kersch, C.; van Rosmalen, G. M.; "Semi-Batch Precipitation of
Acetaminophen from Ethanol with Liquid Carbon Dioxide at a Constant Pressure,"
Proceedings of the 5th Meeting on Supercritical Fluids, Nice, France, 1998, 249.

APPENDIX I
319
21. Yeo, S. D.; Lim, G. B.; Debenedetti, P. G.; Bernstein, H.; "Formation of
Microparticulate Protein Powders Using a Supercritical Fluid Anti-Solvent,"
Biotechnol. Bioeng. 1993, 41, 341.
22. Yeo, S. D.; Debenedetti, P. G.; Radosz, M.; Schmidt, H. W.; "Supercritical Anti-
Solvent Process for Substituted Para-Linked Aromatic Polyamides: Phase
Equilibrium and Morphology Study," Macromolecules 1993, 26, 6207.
23. Yeo, S.; Choi, J.; Lee, T.; "Crystal Formation of BaCl2 and NH4Cl Using a
Supercritical Fluid Anti-Solvent," Proceedings of the 5th International Symposium
on Supercritical Fluids, Atlanta, Georgia, 2000.
24. Yeo, S.-D.; Choi, J.-H.; Lee, T.-J.; "Crystal Formation of BaCl2 and NH4Cl Using a
Supercritical Fluid Anti-Solvent," J. Supercrit. Fluids 2000, 16, 235.
25. Bertucco, A.; Lora, M.; Kikic, I.; "Fractional Crystallization by Gas Anti-Solvent
Technique: Theory and Experiments," AIChE J. 1998, 44, 2149.
26. Catchpole, O. J.; Hochmann, S.; Anderson, S. R. J.; "Gas Anti-Solvent Fractionation
of Natural Products," Process Technol. Proc. 1996, 12, 309.
27. Chang, C. J.; Randolph, A. D.; Craft, N. E.; "Separation of β-Carotene Mixtures
Precipitated from Liquid Solvents with High-Pressure Carbon Dioxide," Biotechnol.
Prog. 1991, 7, 275.
28. Chang, C. J.; Liou, Y.; "Purification of Polycyclic Aromatic Compounds Using
Salting-Out Separation in High-Pressure Carbon Dioxide," J. Chem. Eng. Jpn. 1993,
26, 517.
29. Chang, C. J.; Liou, Y.; Lan, W. J.; "Relative Supersaturation Ratio and Separation
Factor in Crystallization with High Pressure CO2," Can. J. Chem. Eng. 1994, 72, 56.
30. Foster, N. R.; Yun, S. L. J.; Dillow, A.; Wells, P. A.; Lucien, F. P.; "A Fundamental
Study of the Gas Anti-Solvent Process," The 4th International Symposium on
Supercritical Fluids, Sendai, Japan, 1997, A, 27.
31. Liou, Y.; Chang, C. J.; "Separation of Anthracene from Crude Anthracene Using
Gas Anti-Solvent Recrystallization," Sep. Sci. Technol. 1992, 27, 1277.
32. Shishikura, A.; Kanamori, K.; Takahashi, H.; Kinbara, H.; "Separation and
Purification of Organic Acids by Gas Anti-Solvent Crystallization," J. Agric. Food.
Chem. 1994, 42, 1993.

APPENDIX I
320
33. Shishikura, A.; "Applications of Compressed Carbon Dioxide in the Separation
Process of Foodstuffs as a Poor and Anti-Solvent.," The 4th International Symposium
on Supercritical Fluids, Sendai, Japan, 1997, A, 51.
34. Winters, M. A.; Frankel, D. Z.; Debenedetti, P. G.; Carey, J.; Devaney, M.;
Przybycien, T. M.; "Protein Purification With Vapor-Phase Carbon Dioxide,"
Biotechnol. Bioeng. 1999, 62, 247.
35. Yeo, S.-D.; Debenedetti, P. G.; Radosz, M.; Giesa, R.; Schmidt, H.-W.;
"Supercritical Anti-Solvent Process for a Series of Substituted Para-Linked Aromatic
Polyamides," Macromolecules 1995, 28, 1316.
36. Bertucco, A.; Pallado, P.; "Understanding Gas Anti-Solvent Processes of
Biocompatible Polymers and Drugs with Supercritical CO2," Proccedings of the
International Meeting of the GVC-Fachausschuß ,,Hochdruckverfahrenstechnik'',
Karlsruhe, Germany, 1999, 231.
37. Chang, C. J.; Randolph, A. D.; "Solvent expansion and solute solubility predictions
in gas-expanded liquids," AIChE J. 1990, 36, 939.
38. de la Fuenta Badilla, J. C.; Peters, C. J.; de swaan Arons, J.; "Selection of the
Appropriate Combination Solvent, Anti-Solvent and Process Conditions for the Gas-
Anti-Solvent Process," Proceedings of the 5th Meeting on Supercritical Fluids, Nice,
France, 1998, Tome 1, 237.
39. de la Fuenta Badilla, J. C.; Peters, C. J.; de Swaan Arons, J.; "Volume Expansion in
Relation to the Gas-Anti-Solvent Process," J. Supercrit. Fluids 2000, 17, 13.
40. Dixon, D. J.; Johnston, K. P.; "Molecular Thermodynamics of Solubilities in Gas
Anti-Solvent Crystallization," AIChE J. 1991, 37, 1441.
41. Tai, C. Y.; Cheng, C.-S.; "Supersaturation and Crystal Growth in Gas Anti-Solvent
Crystallization," J. Cryst. Growth 1998, 183, 622.
42. Wubbolts, F. E.; Bruinsma, O. S. L.; van Rosmalen, G. M.; "Measurement and
Modelling of the Solubility of Acetaminophen and of Cholestrol in a Mixture of
Solvent and Carbon Dioxide at a Constant Pressure," Proceedings of the 5th
International Symposium on Supercritical Fluids, Atlanta, Georgia, 2000.
43. Kikic, I.; Lora, M.; Bertucco, A.; "A Thermodynamic Analysis of Three-Phase
Equilibria in Binary and Ternary Systems for Applications in Rapid Expansion of a
Supercritical Solution (RESS), Particles from Gas-Saturated Solutions (PGSS), and
Supercritical Anti-Solvent (SAS)," Ind. Eng. Chem. Res. 1997, 36, 5507.

APPENDIX I
321
44. Kikic, I.; Bertucco, A.; Lora, M.; "A Thermodynamic Description Of Systems
Involved In Supercritical Anti-Solvent Processes," The 4th International Symposium
on Supercritical Fluids, Sendai, Japan, 1997, A, 39.
45. Liu, Z.; Li, D.; Yang, G.; Han, B.; "Solubility of Organic Acids in Ethyl Acetate
Expanded with CO2," Fluid Phase Equlibria 2000, 167, 123.
46. Peters, C. J.; Kordikowski, A.; Wilmes, B.; "Phase Behaviour of Selected Systems
of Interest for the GAS Process," Proceedings of the 5th International Symposium on
Supercritical Fluids, Atlanta, Georgia, 2000.
47. Bleich, J.; Müller, B. W.; Waßmus, W.; "Aerosol Solvent Extraction System - A
New Microparticle Production Technique," Int. J. Pharm. 1993, 97, 111.
48. Bodmeier, R.; Wang, H.; Dixon, D.; Mawson, S.; Johnston, K.; "Polymeric
Microspheres Prepared By Spraying Into Compressed Carbon Dioxide," Pharm. Res.
1995, 12, 1211.
49. Bustami, R. T.; Chan, H.; Dehghani, F.; Foster, N. R.; "Generation of Protein
Micro-Particles Using High Pressure Modified Carbon Dioxide," Proceedings of the
5th International Symposium on Supercritical Fluids, Atlanta, Georgia, 2000.
50. Chattopadhyay, P.; Gupta, R. B.; "Supercritical CO2 Based Production of Fullerene
Nanoparticles," Proceedings of the 5th International Symposium on Supercritical
Fluids, Atlanta, Georgia, 2000.
51. Chou, Y.-H.; Tomasko, D. L.; "GAS Crystallization of Polymer-Pharmaceutical
Composite Particles," The 4th International Symposium on Supercritical Fluids,
Sendai, Japan, 1997, A, 55.
52. Debenedetti, P. G.; Tom, J. W.; Yeo, S.-D.; Lim, G.-B.; "Application of
Supercritical Fluids for the Production of Sustained Delivery Devices," J. Controlled
Release 1993, 24, 27.
53. Debenedetti, P. G.; Lim, G.; Prud'Homme, R. K.; "Preparation of Protein
Microparticles by Supercritical Fluid Precipitation," U.S. 6,063,910, 2000.
54. Dixon, D. J.; Johnston, K. P.; "Formation of Microporous Polymer Fibers and
Oriented Fibrils by Precipitation with a Compressed Fluid Anti-Solvent," J. Appl.
Polym. Sci. 1993, 50, 1929.
55. Dixon, D. J.; Johnston, K. P.; Bodmeier, R. A.; "Polymeric Materials Formed by
Precipitation with a Compressed Fluid Anti-Solvent," AIChE J. 1993, 39, 127.

APPENDIX I
322
56. Dixon, D. J.; Luna-Bárcenas, G.; Johnston, K. P.; "Microcellular Microspheres and
Miroballoons by Precipitation with a Vapour-Liquid Compressed Fluid Anti-
Solvent," Polymer 1994, 35, 3998.
57. Gao, Y.; Mulenda, T. K.; Shi, Y.-F.; Yuan, W.-K.; "Fine Particles Preparation of
Red Lake Pigment by Supercritical Fluid," The 4th International Symposium on
Supercritical Fluids, Sendai, Japan, 1997, A, 31.
58. Gao, Y.; Mulenda, T.; Shi, Y.; Yuan, W.; "Fine Particles Preparation of Red Lake C
Pigment by Supercritical Fluid," J. Supercrit. Fluids 1998, 369.
59. Gilbert, D. J.; Palakodaty, S.; Sloan, R.; York, P.; "Particle Engineering for
Pharmaceurical Applications - A Process Scale Up," Proceedings of the 5th
International Symposium on Supercritical Fluids, Atlanta, Georgia, 2000.
60. Hanna, M.; York, P.; Yu. Shekunov, B.; "Control of the Polymeric Forms of a Drug
Substance by Solution Enhanced Dispersion by Supercritical Fluids (SEDS),"
Proceedings of the 5th Meeting on Supercritical Fluids, Nice, France, 1998, Tome 1.
61. Hanna, M.; York, P.; "Method and Apparatus for the Formation of Particles," U.S.
6,063,138, 2000.
62. Heater, K. J.; Tomasko, D. L.; "Processing of Epoxy Resins Using Carbon Dioxide
as an Anti-Solvent," J. Supercrit. Fluids 1998, 14, 55.
63. Hong, L.; Bitemo, S. R.; Gao, Y.; Yuan, W.; "Precipitation of Microparticulate
Organic Pigment Powders by Supercritical Anti-Solvent (SAS) Process,"
Proceedings of the 5th International Symposium on Supercritical Fluids, Atlanta,
Georgia, 2000.
64. Jaarmo, S.; Rantakyla, M.; Aaltonen, O.; "Particle Tailoring with Supercritical
Fluids: Production of Amorphous Pharmaceutical Particles," The 4th International
Symposium on Supercritical Fluids, Sendai, Japan, 1997, A, 263.
65. Kulshreshtha, A. K.; Smith, G. G.; Anderson, S. D.; Krukonis, V. J.; "Process for
Sizing Prednisolone Acetate using a Supercritical Fluid Anti-Solvent," Us 5803966,
1998.
66. Johnston, K. P.; Luna-Barcenas, G.; Dixon, D.; Mawson, S.; "Polymeric Materials
by Precipitation with a Compressed Fluid Anti-Solvent," Proceedings of the 3rd
International Symposium on Supercritical Fluids, Strasbourge, France, 1994, 359.

APPENDIX I
323
67. Luna-Bárcenas, G.; Kanakia, S. K.; Sanchez, I. C.; Johnston, K. P.; "Semicrystalline
Microfibrils and Hollow Fibers by Precipitation with a Compressed-Fluid Anti-
Solvent," Polymer 1995, 36, 3173.
68. Magnan, C.; Commenges, N.; Badens, E.; Charbit, G.; "Fine Phospholipid Particles
Formed by Precipitation with a Compressed Fluid Anti-Solvent," Proccedings of the
International Meeting of the GVC-Fachausschuß ,,Hochdruckverfahrenstechnik'',
Karlsruhe, Germany, 1999, 223.
69. Magnan, C.; Badens, E.; Commenges, N.; Charbit, G.; "Soy Lecithin Micronization
by Precipitation with a Compressed Fluid Anti-Solvent - Influence of Process
Parameters," Fifth Conference on Supercritical Fluids and their Applications, Garda
(Verona), 1999, 479.
70. Mawson, S.; Kanakia, S.; Johnston, K. P.; "Metastable Polymer Blends by
Precipitation with a Compressed Fluid Anti-Solvent," Polymer 1997, 38, 2957.
71. Mawson, S.; Kanakia, S.; Johnston, K. P.; "Coaxial Nozzle for Control of Particle
Morphology in Precipitation with a Compressed Fluid Anti-Solvent," J. Appl. Polym.
Sci. 1997, 64, 2105.
72. Mawson, S.; Johnston, K. P.; Betts, D. E.; McClain, J. B.; DeSimone, J. M.;
"Stabilized Polymer Microparticles by Precipitation with a Compressed Fluid Anti-
Solvent. 1. Poly(fluoro acrylates)," Macromolecules 1997, 30, 71.
73. Mawson, S.; Yates, M. Z.; O'Neill, M. L.; Johnston, K. P.; "Stabilized Polymer
Microparticles by Precipitation with a Compressed Fluid Anti-Solvent. 2.
Poly(propylene oxide)- and Poly(butylene oxide)-Based Copolymers," Langmuir
1997, 13, 1519.
74. Nesta, D. P.; Elliott, J. S.; Warr, J. P.; "Supercritical Fluid Precipitation of
Recombinant Human Immunoglobulin from Aqueous Solutions," Biotechnol.
Bioeng. 2000, 67, 457.
75. Palakodaty, S.; York, P.; Pritchard, J.; "Supercritical Fluid Processing of Materials
from Aqueous Solutions: The Application of SEDS to Lactose as a Model
Substance," Pharm. Res. 1998, 15, 1835.
76. Palakodaty, S.; York, P.; Hanna, M.; Pritchard, J.; "Crystallization of Lactose Using
Solution Enhanced Dispersion by Supercritical Fluids (SEDS) Technique,"
Proceedings of the 5th Meeting on Supercritical Fluids, Nice, France, 1998, Tome 1,
275.

APPENDIX I
324
77. Randolph, T. W.; Randolph, A. D.; Mebes, M.; Yeung, S.; "Sub-Micrometer-Sized
Biodegradable Particles of Poly(L-Lactic Acid) via the Gas Anti-Solvent Spray
Precipitation Process," Biotechnol. Prog. 1993, 9, 429.
78. Rantakyla, M.; Jantti, M.; Jaarmo, S.; Aaltonen, O.; "Modeling Droplet - Gas
Interaction and Particle Formation in Gas-Anti-Solvent System (GAS)," Proceedings
of the 5th Meeting on Supercritical Fluids, Nice, France, 1998, 333.
79. Reverchon, E.; Della Porta, G.; Flaivene, M. G.; "Process Parameters and
Morphology in Amoxicillin Micro and Submicro Particles Generation by
Supercritical Anti-Solvent Precipitation," J. Supercrit. Fluids 2000, 17, 239.
80. Reverchon, E.; Della Porta, G.; Sannino, D.; Ciambelli, P.; "Supercritical Anti-
Solvent Precipitation of Nanoparticles of a Zinc Oxide Precursor," Powder Technol.
1999, 102, 127.
81. Reverchon, E.; Della Porta, G.; Di Trolio, A.; Pace, S.; "Supercritical Anti-Solvent
Precipitation of Nanoparticles of Superconductor Precursors," Ind. Eng. Chem. Res.
1998, 37, 952.
82. Reverchon, E.; Della Porta, G.; Falivene, M. G.; "Process Parameters Controlling
the Supercritical Anti-Solvent Micronisation of Some Antibiotics," Proceedings of
the 6th Meeting on Supercritical Fluids, Nottingham, United Kingdom, 1999, 157.
83. Reverchon, E.; Porta, G. D.; "Production of Antibiotic Micro- and Nano-Particles by
Supercritical Anti-Solvent Precipitation," Powder Technol. 1999, 106, 23.
84. Reverchon, E.; Celano, C.; Della Porta, G.; Di Trolio, A.; Pace, S.; "Supercritical
Anti-Solvent Precipitation: A New Technique for Preparing Submicronic Yttrium
Powders to Improve YBCO Superconductors," J. Mater. Res. 1998, 13, 284.
85. Reverchon, E.; De Rosa, I.; Della Porta, G.; "Effect of Process Parameters on the
Supercritical Anti-Solvent Precipitation of Microspheres of Natural Polymers,"
Dipartimento Ingegneria Chimica Alimentare,Universita Salerno,Fisciano,Italy.,
1999.
86. Reverchon, E.; Della Porta, G.; De Rosa, I.; Subra, P.; Letourneur, D.;
"Biopolymers Micronisation by Supercritical Anti-Solvent Precipitation: the
Influence of Some Process Parameters," Fifth Conference on Supercritical Fluids
and their Applications, Garda (Verona), 1999, 473.

APPENDIX I
325
87. Robertson, J.; King, M. B.; Seville, J. P. K.; Merrifield, D. R.; Buxton, P. C.;
"Recrystallisation of Organic Compounds Using Near Critical Carbon Dioxide," The
4th International Symposium on Supercritical Fluids, Sendai, Japan, 1997, A, 47.
88. Robertson, J.; King, M. B.; Seville, J. P. K.; "Particle Production Using Near-
Critical Solvents," Proceedings of the 5th Meeting on Supercritical Fluids, Nice,
France, 1998, 339.
89. Ruchatz, F.; Kleinebudde, P.; Müller, B. W.; "Residual Solvents in Biodegradable
Microparticles. Influence of Process Parameters on the Residual SOlvent in
Microparticles Produced by the Aerosol Solvent Extraction System (ASES) Process,"
J. Pharm. Sci. 1997, 86, 101.
90. Schmitt, W. J.; Salada, M. C.; Shook, G. G.; Speaker, S. M., III; "Finely-Divided
Powders by Carrier Solution Injection into a Near or Supercritical Fluid," AIChE J.
1995, 41, 2476.
91. Sloan, R.; Hollowood, M. E.; Humpreys, G. O.; Ashraf, W.; York, P.; "Supercritical
Fluid Processing: Preparation of Stable Protein Particles," Proceedings of the 5th
Meeting on Supercritical Fluids, Nice, France, 1998, 301.
92. Sloan, R.; Tservistas, M.; Hollowood, M. E.; Sarup, L.; Humphreys, G. O.; York,
P.; Ashraf, W.; Hoare, M.; "Controlled Particle Formation of Biological Material
Using Supercritical Fluids," Proceedings of the 6th Meeting on Supercritical Fluids,
Nottingham, United Kingdom, 1999, 169.
93. Shekunov, B. Y.; Hanna, M.; York, P.; "Crystallization Process in Turbulent
Supercritical Flows," J. Cryst. Growth 1999, 198/199, 1345.
94. Steckel, H.; Thies, J.; Müller, B.; "Micronising of Steroids for Pulmonary Delivery
by Supercritical Carbon Dioxide," Int. J. Pharm. 1997, 152, 99.
95. Subramaniam, B.; Saim, S.; Rajewski, R. A.; Stella, V.; "Methods for a Particle
Precipitation and Coating Using Near-Critical and Supercritical Antisolvents," Us
5833891, 1998.
96. Subramaniam, B.; Saim, S.; Rajewski, A.; Stella, V.; "Methods for Particle
Micronization and Nanonization by Recrystallization from Organic Solutions
Sprayed into a Compressed Anti-Solvent," U.S. 5,874,029, 1999.
97. Sze Tu, L.; Dehghani, F.; Dillow, A. K.; Foster, N. R.; "Applications of Dense
Gases in Pharmaceutical Processing," Proceedings of the 5th Meeting on
Supercritical Fluids, Nice, France, 1998, 263.

APPENDIX I
326
98. Tan, C.-S.; Lin, H.-Y.; "Precipitation of Polystyrene by Spraying Polystyrene-
Toluene Solution into Compressed HFC-134a," Ind. Eng. Chem. Res. 1999, 38,
3898.
99. Thies, J.; Müller, B. W.; "Size Controlled Production of Biodegradable
Microparticles with Supercritical Gases," Eur. J. Pharm. Biopharm. 1998, 45, 67.
100. Tom, J. W.; Lim, G.; Debenedetti, P. G.; Prud'homme, R. K.; "Applications of
Supercritical Fluids in the Controlled Release of Drugs," Supercritical Fluid
Engineering Science Fundamentals and Applications, ; Kiran, E. and Brennecke, J.
F., Ed. 1993; Vol. 514, 238.
101. Winters, M. A.; Knutson, B. L.; Debenedetti, P. G.; Sparks, H. G.; Przybycien, T.
M.; Stevenson, C. L.; Prestrelski, S. J.; "Precipitation of Proteins in Supercritical
Carbon Dioxide," J. Pharm. Sci. 1996, 85, 586.
102. Winters, M. A.; Debenedetti, P. G.; Carey, J.; Sparks, H. G.; Sane, S. U.;
Przybycien, T. M.; "Long-Term and High-Temperature Storage of Supercritically-
Processed Microparticulate Protein Powders," Pharm. Res. 1997, 14, 1370.
103. Wubbolts, F. E.; Bruinsma, O. S. L.; de Graauw, J.; van Rosmalen, G. M.;
"Continuous Gas Anti-Solvent Crystallisation of Hydroquinone from Acetone Using
Carbon Dioxide," The 4th International Symposium on Supercritical Fluids, Sendai,
Japan, 1997, A, 63.
104. Wubbolts, F.; Bruinsma, O.; van Rosmalen, G.; "Dry-Spraying of Ascorbic Acid or
Acetaminophen Solutions with Supercritical Carbon Dioxide," J. Cryst. Growth
1999, 198/199, 767.
105. Yeo, S.-D.; Debenedetti, P. G.; Patro, S. Y.; Przybycien, T. M.; "Secondary
Structure Characterization of Microparticulate Insulin Powders," J. Pharm. Sci.
1994, 83, 1651.
106. York, P.; Hanna, M.; "Particle Engineering by Supercritical Fluid Technologies for
Powder Inhalation Drug Delivery," Respiratory Drug Delivery, 1996; Vol. V, 231.
107. Bleich, J.; Müller, B.; "Production Of Drug Loaded Microparticles By The Use Of
Supercritical Gases With The Aerosol Solvent Extraction System (ASES) Process,"
J. Mocroencapsulation 1996, 13, 131.
108. Bleich, J.; Kleinebudde, B. W.; Müller, B. W.; "Influence Of Gas Density And
Pressure On Microparticles Produced With The ASES Process," Int. J. Pharm. 1994,
106, 77.

APPENDIX I
327
109. Elvassore, N.; Bertucco, A.; Caliceti, P.; "Production of Protein-Polymer Micro-
Capsules by Supercritical Anti-Solvent Techniques," Proceedings of the 5th
International Symposium on Supercritical Fluids, Atlanta, Georgia, 2000.
110. Engwicht, A.; Girreser, U.; Müller, B. W.; "Critical Properties of Lactide-co-
Glycoloid Polymers for the Use in Microparticle Preparation by the Aerosol Solvent
Extraction System," Int. J. Pharm. 1999, 185, 61.
111. Falk, R.; Randolph, T. W.; Meyer, J. D.; Kelly, R. M.; Manning, M. C.;
"Controlled Release of Ionic Compounds from Poly(L-Lactide) Microspheres
Produced by Precipitation with a Compressed Anti-Solvent," J. Controlled Release
1997, 44, 77.
112. Falk, R. F.; Randolph, T. W.; "Process Variable Implications for Residual Solvent
Removal and Polymer Morphology in the Formation of Gentamicin-Loaded Poly(L-
Lactide) Microparticles," Pharm. Res. 1998, 15, 1233.
113. Meyer, J. D.; Falk, R. F.; Kelly, R. M.; Shively, J. E.; Withrow, S. J.; Dernell, W.
S.; Kroll, D. J.; Randolph, T. W.; Manning, M. C.; "Preparation and in Vitro
Characterization of Gentamycin-Impregnated Biodegradable Beads Suitable for
Treatment of Osteomyelitis," J. Pharm. Sci. 1998, 87, 1149.
114. Weber, A.; Tschernjaew, J.; Kummel, R.; "Coprecipitation with Compressed
Antisolvents for the Manufacture of Microcomposites," Proceedings of the 5th
Meeting on Supercritical Fluids, Nice, France, 1998, Tome 1, 243.
115. Young, T. J.; Johnston, K. P.; Mishima, K.; Tanaka, H.; "Encapsulation of
Lysozyme in a Biodegradable Polymer by Precipitation with a Vapor-over-Liquid
Anti-Solvent," J. Pharm. Sci. 1999, 88, 640.
116. Catchpole, O. J.; Bergmann, C.; "Continuous Gas Anti-Solvent Fractionation Of
Natural Products," Proceedings of the 5th Meeting on Supercritical Fluids, Nice,
France, 1998, 257.
117. Griffith, A. T.; Park, Y.; Roberts, C. B.; "Separation and Recovery of Nylon from
Carpet Waste using a Supercritical Fluid Anti-Solvent Technique," Polymer Plastics
Technology & Engineering 1999, 38, 411.
118. Kordikowski, A.; York, P.; "Chiral Separation Using Supercritical CO2,"
Proceedings of the 6th Meeting on Supercritical Fluids, Nottingham, United
Kingdom, 1999, 163.

APPENDIX I
328
119. Weber, A.; Nolte, C.; Bork, M.; Kummel, R.; "Recovery of Lecithin from egg
Yolk-Extracts by Gas Anti-Solvent Crystallization," Proceedings of the 6th Meeting
on Supercritical Fluids, Nottingham, United Kingdom, 1999.

APPENDIX II
329
II. VOLUMETRIC EXPANSION EXPERIMENTAL RESULTS —
BINARY DATA
II.1. CO2—DMF
Table II.1 CO2—DMF experimental results at 25°C.
Mole Fraction Pressure /
MPa CO2 DMF
Expansion /
∆V %
0.00 0.000 1.000 0.0
0.77 0.097 0.903 2.2
1.38 0.179 0.821 8.8
2.12 0.285 0.715 17.8
2.76 0.381 0.619 28.4
3.48 0.486 0.514 49.1
4.16 0.587 0.413 71.6
4.81 0.700 0.300 121.6
5.49 0.869 0.131 384.6
5.85 0.939 0.061 942.5

APPENDIX II
330
Table II.2 CO2—DMF experimental results at 30°C.
Mole Fraction Pressure /
MPa CO2 DMF
Expansion /
∆V %
0.00 0.000 1.000 0.0
0.82 0.122 0.878 4.8
1.52 0.216 0.784 12.2
2.10 0.290 0.710 17.5
2.74 0.379 0.621 29.1
3.45 0.466 0.534 41.8
4.12 0.552 0.448 61.3
4.83 0.653 0.347 97.9
5.54 0.768 0.232 177.8
6.21 0.896 0.104 500.8
Table II.3 CO2—DMF experimental results at 40°C.
Mole Fraction Pressure /
MPa CO2 DMF
Expansion /
∆V %
0.00 0.000 1.000 0.0
0.72 0.102 0.898 2.4
2.14 0.251 0.749 14.0
3.45 0.382 0.618 28.5
4.19 0.465 0.535 42.4
4.85 0.539 0.461 57.5
5.50 0.613 0.387 79.3
6.21 0.675 0.325 106.0
6.89 0.757 0.243 167.5
7.58 0.873 0.127 394.5

APPENDIX II
331
II.2. CO2—NMP
Table II.4 CO2—NMP experimental results at 25°C.
Mole Fraction Pressure /
MPa CO2 DMF
Expansion /
∆V %
0.00 0.000 1.000 0.0
0.81 0.113 0.887 5.1
1.42 0.194 0.806 9.5
2.11 0.287 0.713 16.0
2.79 0.379 0.621 26.1
3.50 0.463 0.537 34.7
4.19 0.578 0.452 50.8
4.88 0.624 0.376 77.8
5.52 0.725 0.275 121.1
5.85 0.801 0.199 197.0
Table II.5 CO2—NMP experimental results at 40°C.
Mole Fraction Pressure /
MPa CO2 DMF
Expansion /
∆V %
0.00 0.000 1.000 0.0
2.10 0.167 0.833 8.9
3.38 0.277 0.723 18.3
4.85 0.406 0.594 34.8
5.61 0.478 0.522 48.7
6.25 0.537 0.463 62.9
6.89 0.612 0.388 89.3
7.59 0.718 0.282 151.0

APPENDIX II
332
II.3. CO2—DMSO
Table II.6 CO2—DMSO experimental results at 25°C.
Mole Fraction Pressure /
MPa CO2 DMF
Expansion /
∆V %
0.00 0.000 1.000 0.0
0.79 0.076 0.924 3.7
1.39 0.132 0.868 6.8
2.16 0.206 0.794 14.3
2.98 0.291 0.709 25.1
3.48 0.353 0.647 33.5
4.19 0.435 0.565 45.3
4.90 0.514 0.486 71.3
5.55 0.608 0.392 104.2
5.96 0.730 0.270 176.6
Table II.7 CO2—DMSO experimental results at 40°C.
Mole Fraction Pressure /
MPa CO2 DMF
Expansion /
∆V %
0.00 0.000 1.000 0.0
2.03 0.144 0.856 6.8
3.53 0.261 0.739 17.0
4.82 0.382 0.618 31.3
5.53 0.452 0.548 43.1
6.25 0.518 0.482 57.7
6.89 0.595 0.405 82.3
7.58 0.698 0.302 131.8

APPENDIX III
333
III. VOLUMETRIC EXPANSION EXPERIMENTAL RESULTS —
TERNARY DATA
III.1. CO2—DMF—Cu-Indo
Table III.1 CO2—DMF—Cu-Indo experimental results at 25°C.
Mole Fraction Pressure /
MPa CO2 DMF Cu-Indo /
x 10-6
Cu-Indo
Conc. / mg.g-1
(CO2 free
basis)
0.00 0.000 0.999 23.3 5.39
0.69 0.080 0.920 21.4 5.32
1.38 0.197 0.803 17.1 4.93
2.07 0.282 0.718 11.2 3.61
2.76 0.387 0.613 8.05 3.05
3.45 0.487 0.513 4.75 2.15
4.14 0.582 0.418 2.11 1.17
4.83 0.697 0.303 0.69 0.53
5.52 0.871 0.129 0.14 0.26
5.86 0.941 0.059 0.08 0.25
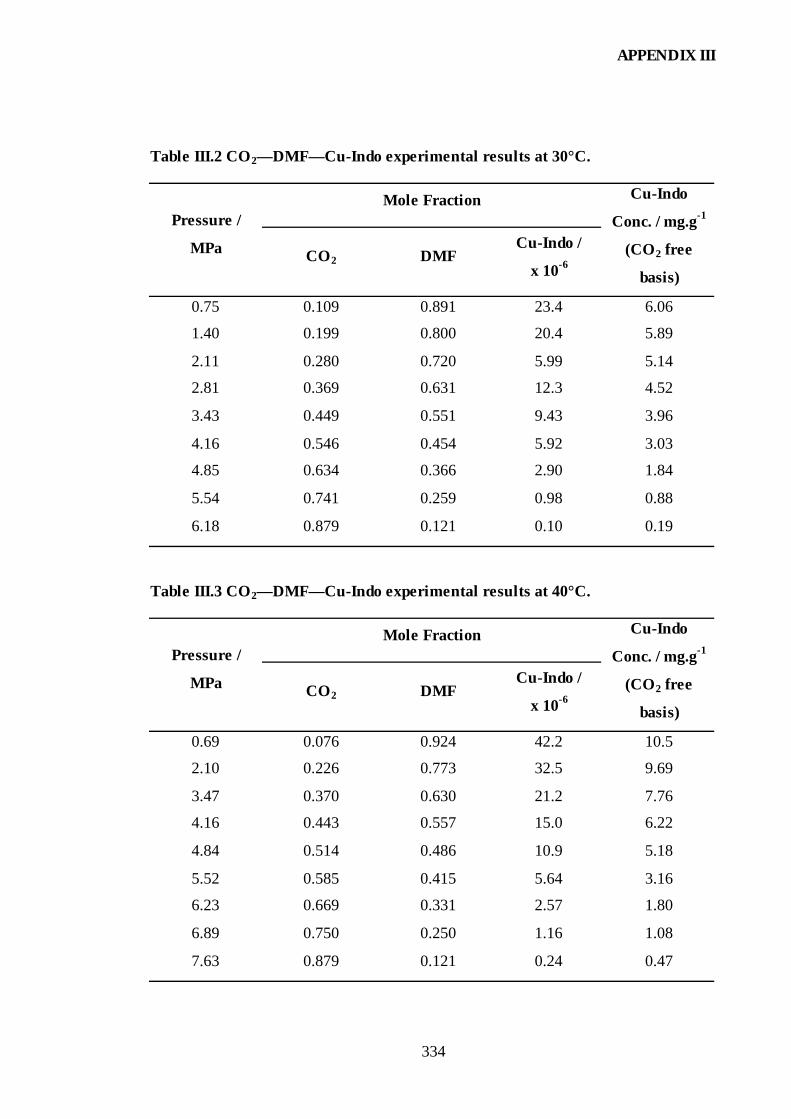
APPENDIX III
334
Table III.2 CO2—DMF—Cu-Indo experimental results at 30°C.
Mole Fraction Pressure /
MPa CO2 DMF Cu-Indo /
x 10-6
Cu-Indo
Conc. / mg.g-1
(CO2 free
basis)
0.75 0.109 0.891 23.4 6.06
1.40 0.199 0.800 20.4 5.89
2.11 0.280 0.720 5.99 5.14
2.81 0.369 0.631 12.3 4.52
3.43 0.449 0.551 9.43 3.96
4.16 0.546 0.454 5.92 3.03
4.85 0.634 0.366 2.90 1.84
5.54 0.741 0.259 0.98 0.88
6.18 0.879 0.121 0.10 0.19
Table III.3 CO2—DMF—Cu-Indo experimental results at 40°C.
Mole Fraction Pressure /
MPa CO2 DMF Cu-Indo /
x 10-6
Cu-Indo
Conc. / mg.g-1
(CO2 free
basis)
0.69 0.076 0.924 42.2 10.5
2.10 0.226 0.773 32.5 9.69
3.47 0.370 0.630 21.2 7.76
4.16 0.443 0.557 15.0 6.22
4.84 0.514 0.486 10.9 5.18
5.52 0.585 0.415 5.64 3.16
6.23 0.669 0.331 2.57 1.80
6.89 0.750 0.250 1.16 1.08
7.63 0.879 0.121 0.24 0.47

APPENDIX III
335
III.2. CO2—DMF—Cu-Acetate
Table III.4 CO2—DMF—Cu-Acetate experimental results at 25°C.
Mole Fraction Pressure /
MPa CO2 DMF Cu-Acetate /
x 10-3
Cu-Acetate
Conc. / mg.g-1
(CO2 free
basis)
0.00 0.000 0.981 18.7 51.9
0.79 0.103 0.877 20.6 60.4
1.37 0.184 0.796 19.8 63.5
2.10 0.294 0.688 18.04 66.8
2.79 0.400 0.584 15.6 68.0
3.59 0.466 0.521 12.1 59.8
4.14 0.555 0.439 5.90 35.4
4.83 0.665 0.332 3.14 25.2
5.52 0.854 0.147 4.03 7.45
5.86 0.946 0.054 1.46 7.38

APPENDIX III
336
III.3. CO2—DMF—Indomethacin
Table III.5 CO2—DMF—Indomethacin experimental results at 25°C.
Mole Fraction Pressure /
MPa CO2 DMF Indomethacin
Indomethacin /
mg.g-1 (CO2
free basis)
0 0.000 0.786 0.214 571
0.77 0.036 0.758 0.206 571
1.43 0.124 0.689 0.188 571
2.05 0.177 0.647 0.176 571
2.76 0.239 0.598 0.163 571
3.50 0.318 0.536 0.146 571
4.14 0.393 0.477 0.130 571
4.83 0.464 0.421 0.115 571
5.52 0.578 0.332 0.090 571
5.93 0.951 0.048 0.000 46.0

APPENDIX IV
337
IV. VOLUMETRIC EXPANSION EXPERIMENTAL RESULTS —
QUATERNARY DATA
IV.1. CO2—DMF—Cu-Indo—Cu-Acetate
Table IV.1 CO2—DMF—Cu-Indo—Cu-Acetate experimental results at 25°C.
(Both solutes added in excess)
Mole Fraction Concentration / mg.g-1
(CO2 free basis) Pressure /
MPa CO2 DMF
Cu-Indo
/ x 10-5
Cu-Acetate
/ x 10 -5 Cu-Indo Cu-Acetate
0.00 0.000 0.983 57.7 1692 12.9 44.4
1.47 0.220 0.764 56.2 1508 16.0 50.4
3.33 0.474 0.516 38.3 1032 16.1 51.0
4.09 0.579 0.411 30.7 925 16.1 57.0
5.28 0.803 0.191 6.67 85.0 11.2 11.6
5.81 0.924 0.076 0.74 4.64 2.26 1.66
Table IV.2 CO2—DMF—Cu-Indo—Cu-Acetate experimental results at 25°C. (Cu-
Indo added in excess, Cu-Acetate initial concentration 8 mg/g)
Mole Fraction Concentration / mg.g-1
(CO2 free basis) Pressure /
MPa CO2 DMF
Cu-Indo
/ x 10-5
Cu-Acetate
/ x 10 –5 Cu-Indo Cu-Acetate
1.02 0.123 0.874 99.4 262 25.6 7.92
2.16 0.292 0.706 80.5 196 25.7 7.35
3.47 0.479 0.520 42.4 111 18.5 5.70
4.48 0.635 0.364 24.9 66.3 15.6 4.88
5.16 0.765 0.234 6.36 35.1 6.25 4.05
5.82 0.917 0.083 0.13 0.86 0.37 0.28
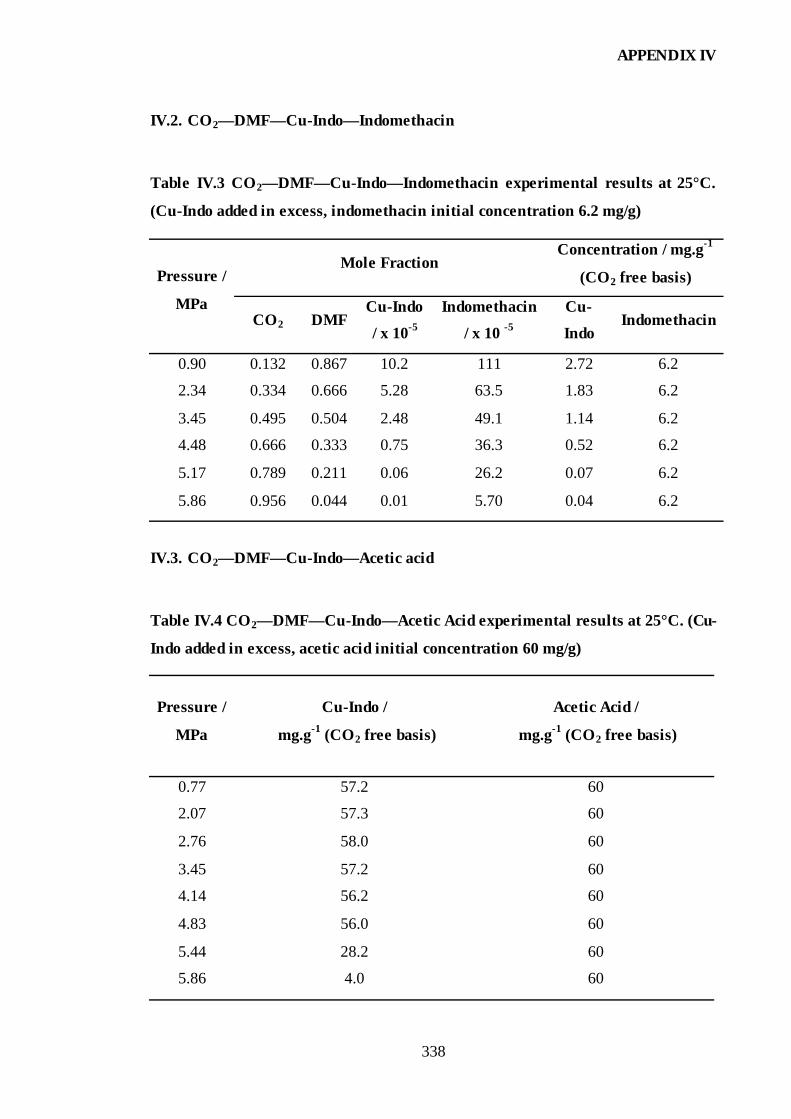
APPENDIX IV
338
IV.2. CO2—DMF—Cu-Indo—Indomethacin
Table IV.3 CO2—DMF—Cu-Indo—Indomethacin experimental results at 25°C.
(Cu-Indo added in excess, indomethacin initial concentration 6.2 mg/g)
Mole Fraction Concentration / mg.g-1
(CO2 free basis) Pressure /
MPa CO2 DMF
Cu-Indo
/ x 10-5
Indomethacin
/ x 10 -5
Cu-
Indo Indomethacin
0.90 0.132 0.867 10.2 111 2.72 6.2
2.34 0.334 0.666 5.28 63.5 1.83 6.2
3.45 0.495 0.504 2.48 49.1 1.14 6.2
4.48 0.666 0.333 0.75 36.3 0.52 6.2
5.17 0.789 0.211 0.06 26.2 0.07 6.2
5.86 0.956 0.044 0.01 5.70 0.04 6.2
IV.3. CO2—DMF—Cu-Indo—Acetic acid
Table IV.4 CO2—DMF—Cu-Indo—Acetic Acid experimental results at 25°C. (Cu-
Indo added in excess, acetic acid initial concentration 60 mg/g)
Pressure /
MPa
Cu-Indo /
mg.g-1 (CO2 free basis)
Acetic Acid /
mg.g-1 (CO2 free basis)
0.77 57.2 60
2.07 57.3 60
2.76 58.0 60
3.45 57.2 60
4.14 56.2 60
4.83 56.0 60
5.44 28.2 60
5.86 4.0 60

APPENDIX V
339
V. DISSOLUTION EXPERIMENTAL RESULTS
V.1. Dissolution of Micronised Cu-Indo
Table V.1 Dissolution of unprocessed and micronised Cu-Indo.
% Dissolution Time
/
min. Unprocessed Micronised
Amorphous
Micronised
Crystalline
10 3.57 12.55 20.10
20 3.19 30.52 38.00
30 5.45 43.62 48.01
40 — 52.15 56.26
45 8.46 — —
50 — 56.24 62.07
60 10.84 60.65 64.40
80 — 66.71 68.29
90 14.10 — —
100 — 67.42 72.97
120 18.32 72.75 75.82
150 19.85 — —
160 — 79.80 86.02
190 27.14 — —

APPENDIX V
340
V.2. Dissolution of PVP—Cu-Indo Co-Precipitates
Table V.2 Dissolution of PVP—Cu-Indo co-precipitates.
% Dissolution Time
/
min. 1:1
PVP:Cu-Indo
7:3
PVP:Cu-Indo
9:1
PVP:Cu-Indo
1:1
Physical Mix
10 27.81 41.67 27.82 2.81
15 — — — 5.68
20 46.98 54.39 34.98 6.54
25 — — — 6.54
30 61.41 65.85 41.80 7.40
40 — 68.48 47.15 —
45 — — — 10.26
50 69.18 72.71 50.48 —
60 74.19 75.40 56.93 15.99
80 80.62 79.17 63.19 —
100 84.71 83.16 71.25 —
120 87.44 86.12 73.29 —

APPENDIX VI
341
VI. SEM IMAGES OF COPPER INDOMETHACIN PARTICLES
PRODUCED BY THE GAS AND ASES PROCESSES VI.1. Particles Produced by the GAS Process
Figure VI.1 SEM image of Cu-Indo particles produced by the GAS process at 40°C
from a stirred 5 mg.g-1 solution of Cu-Indo in DMF with rapid expansion.
20 µm
Figure VI.2 SEM image of Cu-Indo particles produced by the GAS process at 25°C
from a stirred 5 mg.g-1 solution of Cu-Indo in NMP with slow expansion.
(b)
300 µm

APPENDIX VI
342
Figure VI.3 SEM image of Cu-Indo particles produced by the GAS process at 25°C
from a stirred 5 mg.g-1 solution of Cu-Indo in NMP with slow expansion.
10 µm
Figure VI.4 SEM image of Cu-Indo particles produced by the GAS process at 25°C
from a stirred 5 mg.g-1 solution of Cu-Indo in NMP with rapid expansion.
20 µm

APPENDIX VI
343
Figure VI.5 SEM image of Cu-Indo particles produced by the GAS process at 25°C
from a stirred 5 mg.g-1 solution of Cu-Indo in DMSO with slow expansion.
50 µm
Figure VI.6 SEM image of Cu-Indo particles produced by the GAS process at 25°C
from a stirred 5 mg.g-1 solution of Cu-Indo in DMSO with rapid expansion.
10 µm

APPENDIX VI
344
Figure VI.7 SEM image of Cu-Indo particles produced by the GAS process at 25°C
from a stirred 5 mg.g-1 solution of Cu-Indo in DMSO with rapid expansion.
4 µm
Figure VI.8 SEM image of Cu-Indo particles produced by the GAS process at 25°C
from a stirred 200 mg.g-1 solution of Cu-Indo in DMF with slow expansion.
5 µm
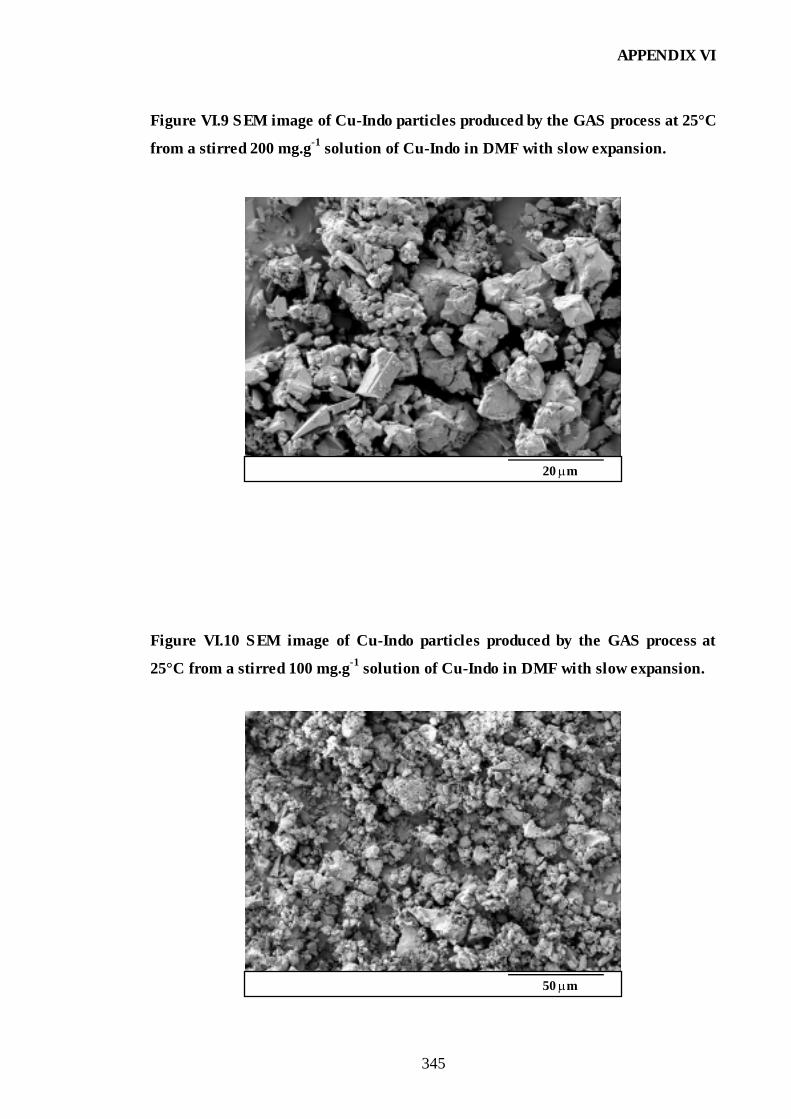
APPENDIX VI
345
Figure VI.9 SEM image of Cu-Indo particles produced by the GAS process at 25°C
from a stirred 200 mg.g-1 solution of Cu-Indo in DMF with slow expansion.
20 µm
Figure VI.10 SEM image of Cu-Indo particles produced by the GAS process at
25°C from a stirred 100 mg.g-1 solution of Cu-Indo in DMF with slow expansion.
50 µm

APPENDIX VI
346
Figure VI.11 SEM image of Cu-Indo particles produced by the GAS process at
25°C from a stirred 200 mg.g-1 solution of Cu-Indo in DMF with rapid expansion.
10 µm
Figure VI.12 SEM image of Cu-Indo particles produced by the GAS process at
25°C from a stirred 20 mg.g-1 solution of Cu-Indo in DMF with slow expansion.
75 µm

APPENDIX VI
347
VI.2. Particles Produced by the ASES Process
Figure VI.13 SEM images of Cu-Indo particles by the ASES process from 5 mg.g-1
solutions of Cu-Indo in DMF at 25°C and 6.89 MPa with a solution flow rate of 0.2
mL.min-1 and a nozzle diameter of 229 µm.
10 µm
Figure VI.14 SEM images of Cu-Indo particles by the ASES process from 5 mg.g-1
solutions of Cu-Indo in DMF at 40°C and 14.48 MPa with a solution flow rate of
0.2 mL.min-1 and a nozzle diameter of 1020 µm.
5 µm
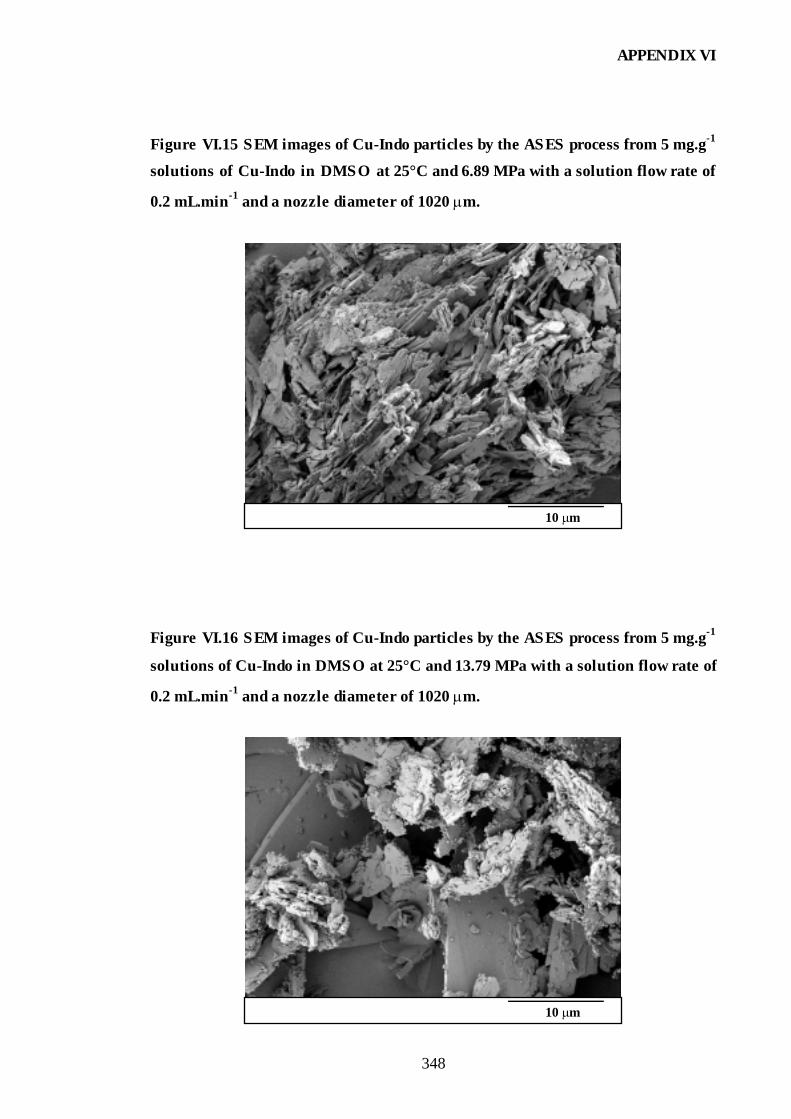
APPENDIX VI
348
Figure VI.15 SEM images of Cu-Indo particles by the ASES process from 5 mg.g-1
solutions of Cu-Indo in DMSO at 25°C and 6.89 MPa with a solution flow rate of
0.2 mL.min-1 and a nozzle diameter of 1020 µm.
10 µm
Figure VI.16 SEM images of Cu-Indo particles by the ASES process from 5 mg.g-1
solutions of Cu-Indo in DMSO at 25°C and 13.79 MPa with a solution flow rate of
0.2 mL.min-1 and a nozzle diameter of 1020 µm.
10 µm

APPENDIX VI
349
Figure VI.17 SEM images of Cu-Indo particles by the ASES process from 5 mg.g-1
solutions of Cu-Indo in NMP at 25°C and 13.79 MPa with a solution flow rate of
0.2 mL.min-1 and a nozzle diameter of 1020 µm.
10 µm
Figure VI.18 SEM images of Cu-Indo particles by the ASES process from 5 mg.g-1
solutions of Cu-Indo in DMF at 40°C and 14.48 MPa with a solution flow rate of
0.2 mL.min-1 and a nozzle diameter of 1020 µm.
5 µm

APPENDIX VI
350
Figure VI.19 SEM images of Cu-Indo particles by the ASES process from 100
mg.g-1 solutions of Cu-Indo in DMF at 25°C and 6.89 MPa with a solution flow rate
of 0.2 mL.min-1 and a nozzle diameter of 229 µm.
50 µm
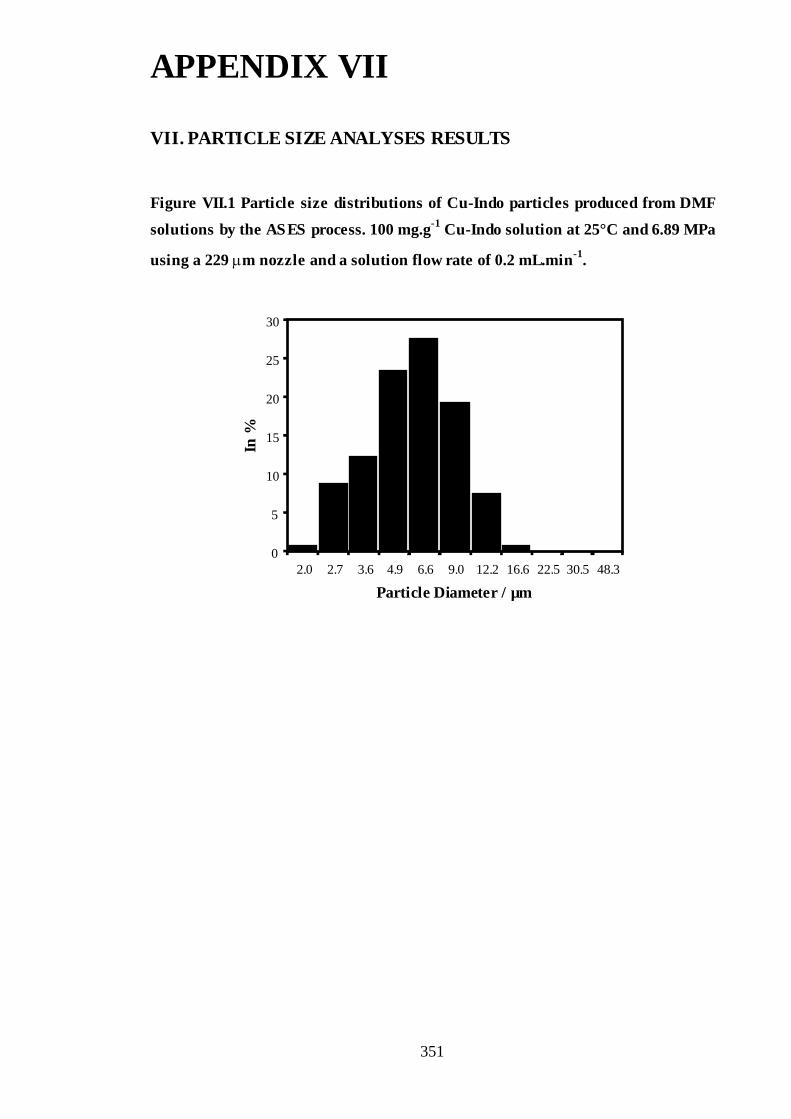
APPENDIX VII
351
VII. PARTICLE SIZE ANALYSES RESULTS
Figure VII.1 Particle size distributions of Cu-Indo particles produced from DMF
solutions by the ASES process. 100 mg.g-1 Cu-Indo solution at 25°C and 6.89 MPa
using a 229 µm nozzle and a solution flow rate of 0.2 mL.min-1.
0
5
10
15
20
25
30
2.0 2.7 3.6 4.9 6.6 9.0 12.2 16.6 22.5 30.5 48.3
Particle Diameter / µm
In %

APPENDIX VII
352
Figure VII.2 Particle size distributions of Cu-Indo particles produced from DMF
solutions by the ASES process. 100 mg.g-1 Cu-Indo solution at 25°C and 13.79 MPa
using a 229 µm nozzle and a solution flow rate of 0.2 mL.min-1.
0
5
10
15
20
25
30
2.0 2.7 3.6 4.9 6.6 9.0 12.2 16.6 22.5 30.5 48.3
Particle Diameter / µm
In %
Figure VII.3 Particle size distributions of Cu-Indo particles produced from DMF
solutions by the ASES process. 100 mg.g-1 Cu-Indo solution at 40°C and 14.48 MPa
using a 229 µm nozzle and a solution flow rate of 0.2 mL.min-1.
0
5
10
15
20
25
30
2.0 2.7 3.6 4.9 6.6 9.0 12.2 16.6 22.5 30.5 48.3
Particle Diameter / µm
In %

APPENDIX VII
353
Figure VII.4 Particle size distributions of Cu-Indo particles produced from DMF
solutions by the ASES process. 100 mg.g-1 Cu-Indo solution at 25°C and 6.89 MPa
using a 1020 µm nozzle and a solution flow rate of 0.2 mL.min-1.
0
5
10
15
20
25
30
35
40
2.0 2.7 3.6 4.9 6.6 9.0 12.2 16.6 22.5 30.5 48.3
Particle Diameter / µm
In %
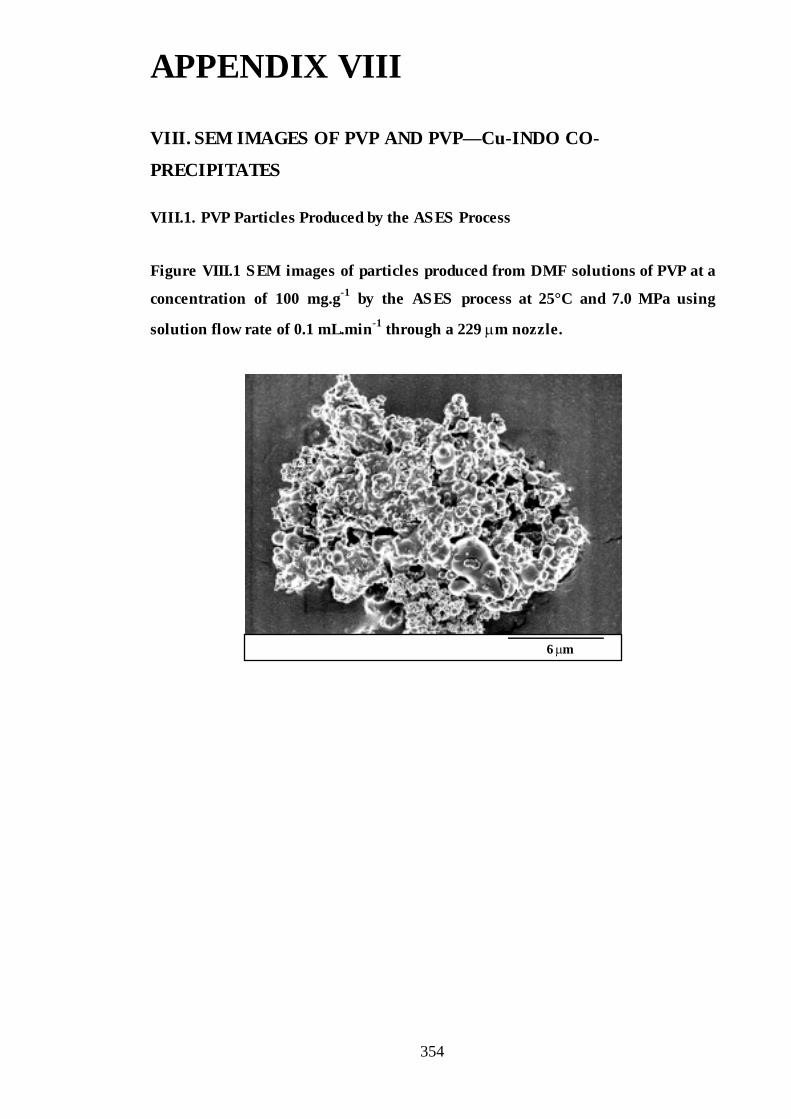
APPENDIX VIII
354
VIII. SEM IMAGES OF PVP AND PVP—Cu-INDO CO-
PRECIPITATES VIII.1. PVP Particles Produced by the ASES Process
Figure VIII.1 SEM images of particles produced from DMF solutions of PVP at a
concentration of 100 mg.g-1 by the ASES process at 25°C and 7.0 MPa using
solution flow rate of 0.1 mL.min-1 through a 229 µm nozzle.
6 µm

APPENDIX VIII
355
Figure VIII.2 SEM images of particles produced from DMF solutions of PVP at a
concentration of 100 mg.g-1 by the ASES process at 10°C and 5.5 MPa using
solution flow rate of 0.1 mL.min-1 through a 229 µm nozzle.
4 µm VIII.2. PVP—Cu-Indo Particles Produced by the ASES Process
Figure VIII.3 SEM images of the PVP—Cu-Indo particles produced from DMF
solutions with a solute concentration of 50 mg.g-1 by the ASES process at 25°C and
6.6 MPa using a solution flow rate of 0.1 mL.min-1 through a 229 µm nozzle. PVP
to Cu-Indo ratio 60:40.
3 µm

APPENDIX VIII
356
Figure VIII.4 SEM images of the PVP—Cu-Indo particles produced from DMF
solutions with a solute concentration of 50 mg.g-1 by the ASES process at 40°C and
19.0 MPa using a solution flow rate of 0.1 mL.min-1 through a 229 µm nozzle. PVP
to Cu-Indo ratio 60:40.
6 µm
Figure VIII.5 SEM images of the PVP—Cu-Indo particles produced from DMF
solutions with a solute concentration of 100 mg.g-1 by the ASES process at 25°C
and 10.39 MPa using a solution flow rate of 0.1 mL.min-1 through a 229 µm nozzle.
PVP to Cu-Indo ratio 90:10.
5 µm

APPENDIX VIII
357
Figure VIII.6 SEM images of the PVP—Cu-Indo particles produced from DMF
solutions with a solute concentration of 100 mg.g-1 by the ASES process at 25°C
and 14.0 MPa using a solution flow rate of 0.1 mL.min-1 through a 229 µm nozzle.
PVP to Cu-Indo ratio 70:30.
1 µm
Figure VIII.7 SEM images of the PVP—Cu-Indo particles produced from DMF
solutions with a solute concentration of 100 mg.g-1 by the ASES process at 25°C
and 14.0 MPa using a solution flow rate of 0.1 mL.min-1 through a 229 µm nozzle.
PVP to Cu-Indo ratio 90:10.
1 µm

LIST OF PUBLICATIONS
358
The following list of publications have resulted from the work conducted in this thesis.
1. Warwick, B.; Dehghani, F.; Foster, N. R.; Biffin, J. R.; Regtop, H. L., “Synthesis,
Purification, and Micronization of Pharmaceuticals Using the Gas Anti-Solvent
Technique., Ind. Eng. Chem. Res., 2000, 39(12), 4571-4579.
2. Foster, N. R.; Bezanehtak, K.; Charoenchaitrakool, M.; Combes, G.; Dehghani, F.;
Sze Tu, L.; Thiering, R.; Warwick, B.; Bustami, R. T.; Chan, H-K.; Processing
Pharmaceuticals Using Dense Gas Technology, In the Proceedings of the 5th
International Symposium of Supercritical Fluids, Atlanta, April 9-11, 2000.
3. Warwick,, B., Dehghani, F., Foster, N. R.; Biffin, J. R.; Regtop, H. L.; Synthesis,
Purification and Micronisation of Pharmaceuticals Using the Gas Antisolvent
Technique, In the Proceedings of the 5th International Symposium of Supercritical
Fluids, Atlanta, April 9-11, 2000.
4. Combes, G.; Warwick, B.; Dehghani, F.; Lucein, F.; Dillow, A.; Foster, N. R.;
“Dense Gas Solvent as Reaction Media”, Proceeding of CISF99-5th Conference on
Supercritical Fluids and their applications, 13-16 June, 1999, Garda (Verona), Italy.