syringe-borne virus transmission in russia: prevalence, behaviors, social factors and implications...
TRANSCRIPT

SYRINGE-BORNE VIRUS TRANSMISSION
IN RUSSIA:
PREVALENCE, BEHAVIORS, SOCIAL
FACTORS AND IMPLICATIONS FOR
EPIDEMIC CONTROL
Robert Heimer, Ph.D.Yale University School of Public Health
New Haven, CT, USAMay 2010

OUTLINE OF TALK
Background on emergence of drug use and HIV epidemics in Russia.
Differences in drug types across Russia. Has one form of the drug played a special role in
the epidemic of HIV? Focus on St. Petersburg
Estimation of IDU populationExpansion of HIV epidemicOpportunities for control

DEFINITIONS
Syndemic – the concentration of two or more diseases or other health conditions in which there is an interaction among them that magnifies the negative health effects of one or more of co-present diseases or health conditions.
Bridge Population – a group of individuals who are needed to move an epidemic from a high-risk group into the general population.
Force of Infection – the rate at which susceptible individuals become infected by a pathogen
SYNDEMICS IN RUSSIA
The epidemic of drug addiction began in the 1990s.Prior to Russia’s Afghan War (1979-89) abuse of opioid
and stimulant drugs was uncommon 1998: Federal Law on Narcotic Means and Psychotropic
Substances discouraged harm reduction and banned substitution therapy
Meanwhile, many Russian cities were experiencing expanding heroin markets
The epidemics of HIV, hepatitis C, and fatal opiate overdose among IDUs began in 1996 First noticed in Kaliningrad in (summer 1996)
DRUG PRODUCTION IN RUSSIA
There are an estimated 1.5-2.2 million injectors in Russia (total population, 145 million).
In addition to commercial heroin, home manufacture of heroin (chernaya), methamphetamine (vint), and methcathinone (jeff) is common in many location.
Drug availability varies widely, but generally speaking once a commercial heroin market is established, homemade drug production becomes uncommon except in times of heroin scarcity (e.g. in 2001-02 after Taliban crackdown and start of NATO’s Afghan War).
Some studies in single locations have linked homemade drug use to increased HIV prevalence.

CHERNAYA PRODUCTION I
Water is added to ground poppies and alkalinized, usually with sodium bicarbonate.
Photos by Kevin Irwin

CHERNAYA PRODUCTION II
Mixture is boiled and the liquid with extracted opiate alkaloids is filtered through a rough cloth, often a kitchen towel.
Used poppies can be saved for second extraction.

CHERNAYA PRODUCTION III
Alkaloids extracted into an organic solvent immiscible in water.
Alkaloids back-extracted into aqueous acid solution, usually sulfuric acid.
These steps reduce the volume of liquid.
This volume is further reduced by boiling off the acidic solution.

CHERNAYA PRODUCTION IV
Among the opiate alkaloids is morphine, which is reacted with acetic anhydride to yield heroin.

CHERNAYA PRODUCTION V
Mixture is again reduced by boiling and filtered.

ADDITIONAL PRODUCTION METHODS
Starting material can be hanka (opium gum, the sap of the poppy pod) rather than the pods.
Blood can be added, only if starting from plant rather than hanka.
Dimedrol, an antihistamine, is added.

CHERNAYA PRODUCTION VI
The final product is ready to be injected.
Alternatively, it can be stored for later use or sold, almost invariably as a liquid.

HOME PRODUCTION OF STIMULANTS The most common starting material is ephedrine.
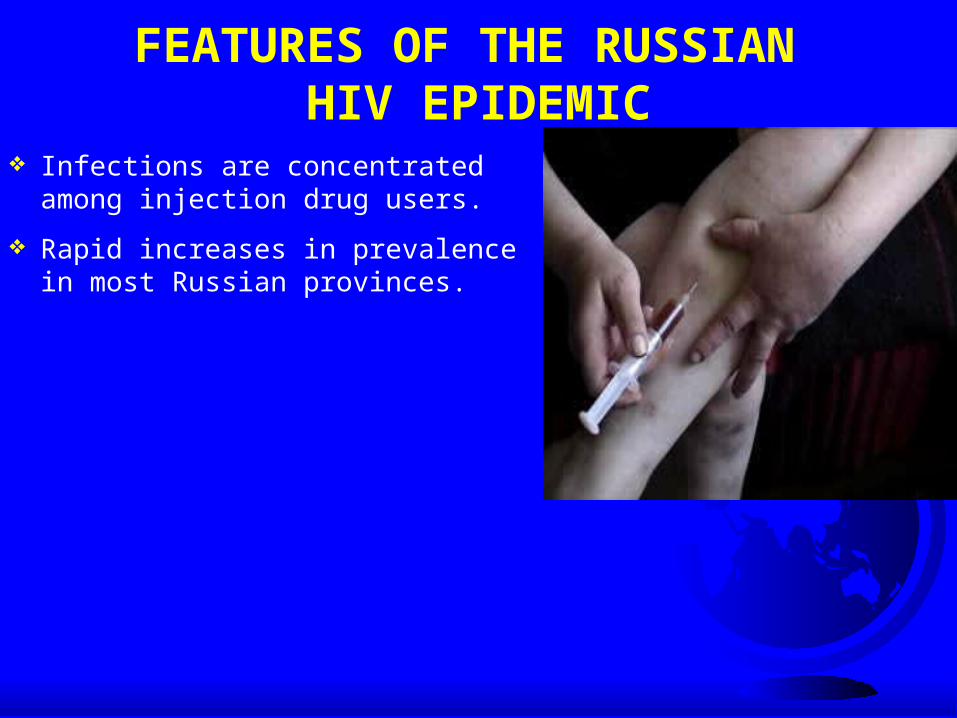
FEATURES OF THE RUSSIAN HIV EPIDEMIC
Infections are concentrated among injection drug users.
Rapid increases in prevalence in most Russian provinces.

HIV CASES IN THE RUSSIAN FEDERATION
CU
MU
LA
TIV
E C
AS
ES
NE
WL
Y D
IAG
NO
SE
D C
AS
ES
The epidemic is far from under control.
HOMEMADE DRUGS AND HIV
Rapidity and severity of the epidemic has led to an invocation of unusual causes.
Anecdotal reports of the use of blood during homemade heroin preparation has led to speculation that contaminated drugs may be fundamental to the epidemic.
Led to denigration of harm reduction -- if drugs themselves are transmitting the virus, then providing clean needles or safer injection equipment will not protect injectors.
HOMEMADE DRUGS AND HIV: RESEARCH QUESTIONS
Hypothesis #1: HIV-contaminated drug preparations contribute to the unique features of the epidemic in Russia.
Hypothesis #2: Behavioral features particular to homemade drug use throughout Russia are linked to the HIV epidemic.
SO HOW DOES HIV ENTER?
During Manufacture:
There are anecdotal reports that blood is added during the heating steps to help remove plant impurities.
If person providing blood is HIV+, then HIV is added.
During Storage:
When the product is stored in a used syringe that is contaminated with blood from an HIV-infected injector, then HIV is added.

LABORATORY REPLICATION OF CHERNAYA MANUFACTURE
Ethnographic observation, still photography, and videos used to elaborate protocol for “prototypical” chernaya production.
License from the U.S. Drug Enforcement Administration to manufacture heroin in the lab.
HIV-infected blood was prepared that contained HIV at titers common among infected people.

PRELIMINARY CONTROL EXPERIMENT
When chernaya was added to cultures of HIV and target cells, the titers of HIV were not significantly reduced. Target cells (in 1.5 ml culture) and HIV-infected blood
(0.2 ml) combined 0.3 ml of chernaya added
We concluded that chernaya at this dilution was not toxic to cells in which HIV replicated.

EFFECT OF ADDING BLOOD DURING CHERNAYA MANUFACTURE
1 ml of HIV-infected blood was added at the heating and filtration step prior to addition of acetic anhydride.
In none of the 11 preparations tested were we able to recover and propagate HIV from the chornaya.

EFFECTS OF CHERNAYA ON HIV IN CONTAMINATED SYRINGES
Syringes were loaded with ~20 µl of blood containing HIV.
While all control syringes flushed with saline yielded viable HIV, only 14 of 74 (19%) syringes flushed with chernaya did so (p<0.001).
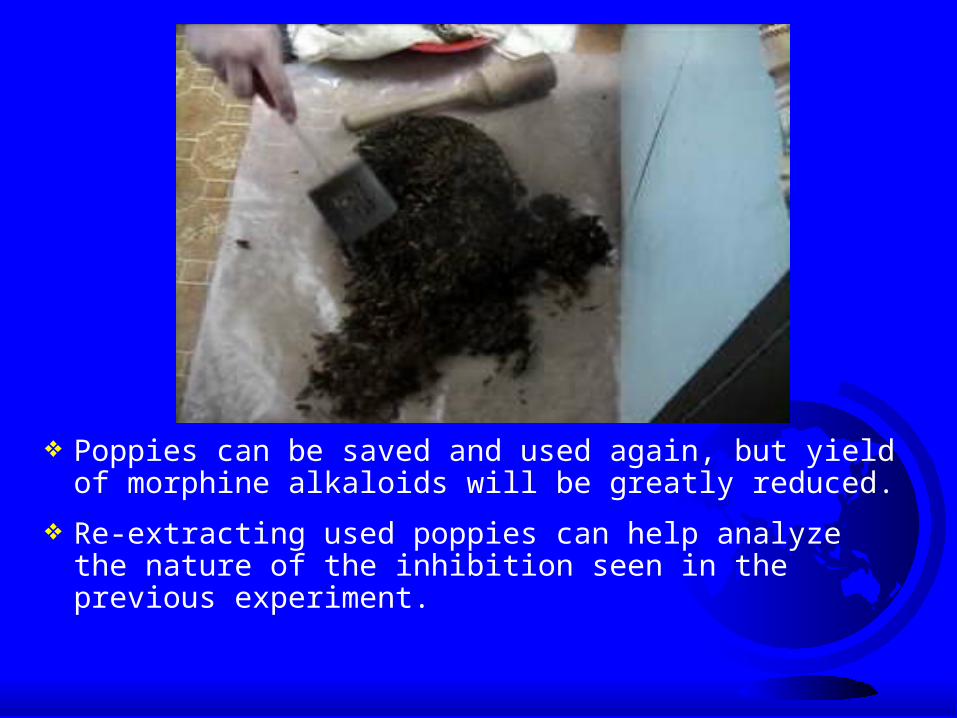
Poppies can be saved and used again, but yield of morphine alkaloids will be greatly reduced.
Re-extracting used poppies can help analyze the nature of the inhibition seen in the previous experiment.

SOURCE OF INHIBITION OF HIV PROLIFERATION
Re-extracting used pods and flushing syringes with this material resulted in recovery of viable HIV from 39 of 48 (81%) syringes.
This suggests that something in the poppies rather than the chemicals themselves reduced viability.
CONCLUSIONS ON CONTAMINATION OF DRUGS AND HIV TRANSMISSION
RISK Homemade opiates may actually act to reduce
HIV transmission.
The stimulant drugs themselves are not promoting HIV transmission.
If anything, the injection of methamphetamine is inhibiting it by reducing HIV viability.
The injection of methcathinone has less of an impact in reducing HIV transmissibility.

DOES THE USE OF HOMEMADE DRUGS INCREASE INJECTION RISK?
Homemade drug manufacture is often a social event that occurs in the kitchens of drug users.
Do these social aspects promote unsafe injection practices?

LIQUID DRUG STUDY CONDUCTED IN 11 CITIES ACROSS RUSSIA (2003-05)

QUANTITATIVE ANALYSIS OF INJECTION PRACTICES IN RUSSIA
826 injectors interviewed in 11 cities.Who injected (last 30 days) homemade versus commercial
opiates more frequently -- drug of choice?Who initiated injection with homemade or commercial
drugs?Who injected (last 30 days) ephedrine-based stimulants?
Compared the above groups to detect differences in
Sharing syringesSharing non-syringe injection paraphernalia Frequency of injecting with others

QUANTITATIVE ANALYSIS OF INJECTION PRACTICES IN RUSSIA
Based on current use:Commercial heroin users were significantly more likely to
share syringes.No significant differences were detected in paraphernalia
sharing, frequency of injecting with others, or unsafe sex
Based on initiation, there were no significant differences detected in any of the risky practices.
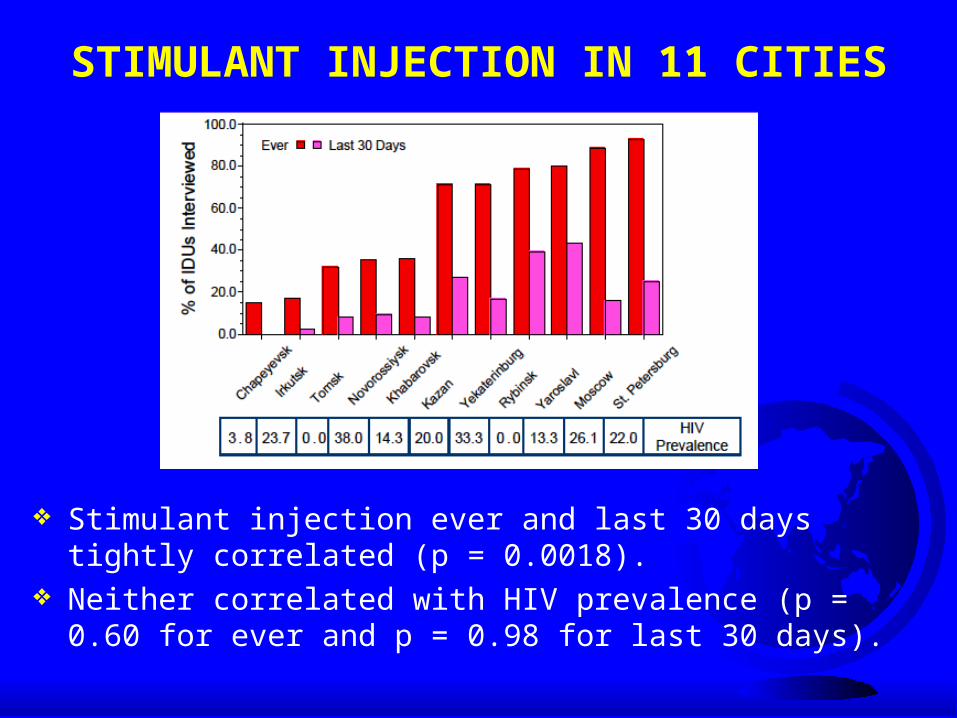
STIMULANT INJECTION IN 11 CITIES
Stimulant injection ever and last 30 days tightly correlated (p = 0.0018).
Neither correlated with HIV prevalence (p = 0.60 for ever and p = 0.98 for last 30 days).

SECOND GENERATION SURVEILLANCE
Behavioral and serological data collected in 2007 in 4 cities.
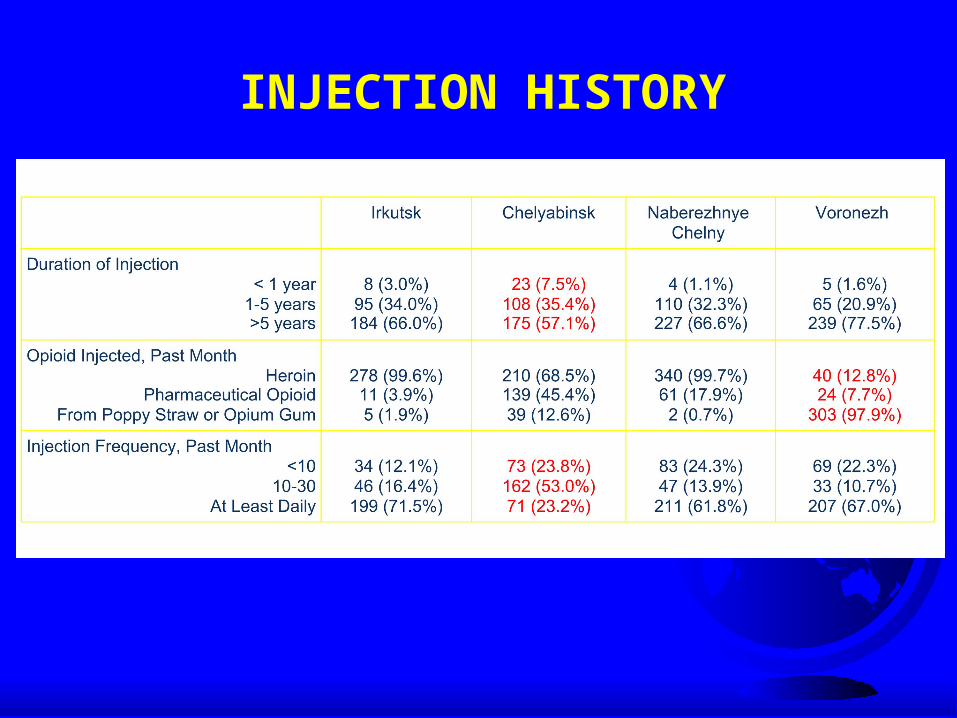
INJECTION HISTORY

INJECTION RISKS
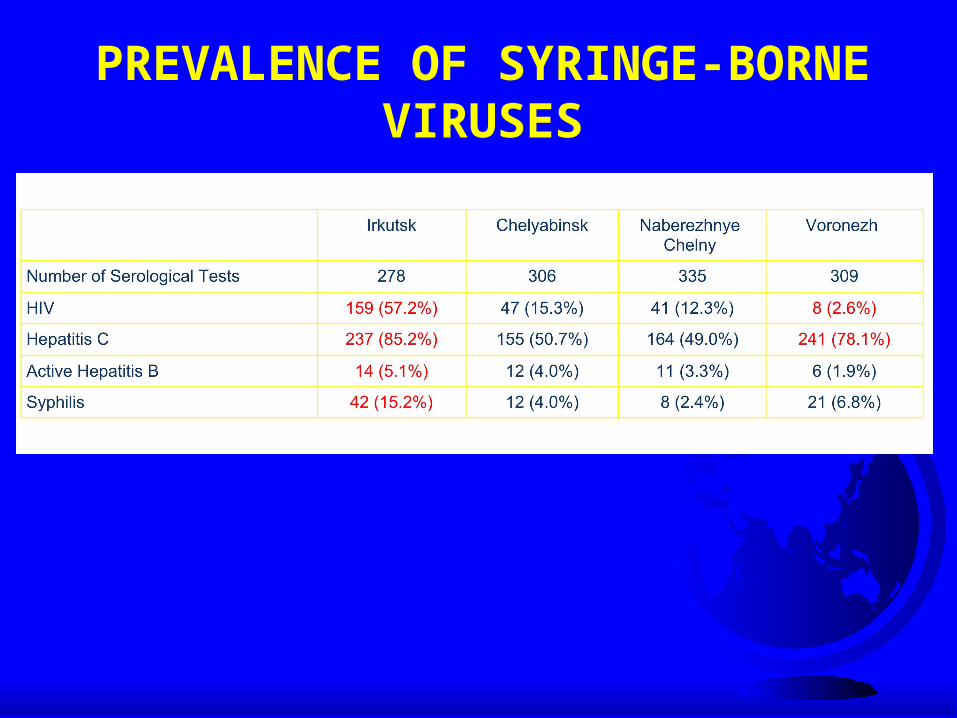
PREVALENCE OF SYRINGE-BORNE VIRUSES

ASSOCIATION OF INJECTION HISTORY AND RISKS WITH HIV PREVALENCE
In a multivariate model, lower HIV prevalence was associated with city (Voronezh) and the injection of homemade opiates.
In a multivariate model, lower HCV prevalence was associated with shorter duration of injection drug use and lower injection frequency.

HYPOTHESES NOT CONFIRMED
The drugs themselves are not promoting HIV transmission; if anything, they are inhibiting it.
Increases in risk behaviors are not associated with current or past use of homemade injectable drugs.
So, what then can explain the rapid increases in HIV among drug injectors in some cities?

City Predominant Opiate HIV Prevalence per 100K Rank
Voronezh Homemade 24 80
Pskov Homemade 50 64
Khabarovsk Homemade 77 51
Rostov Homemade 77 50
Rybinsk Homemade 81 48
Yaroslavl Commercial 81 48
Tomsk Homemade 86 46
Novorossiysk Homemade 104 42
Orel Homemade 108 41
Nizhny Novgorod Homemade 145 35
Volgograd Commercial 207 30
Kazan Commercial 220 27
Moscow Commercial 288 18
Saratov Commercial 293 16
Kaliningrad Commercial 457 11
Chelyabinsk Commercial 521 10
Ekaterinburg Commercial 735 6
St. Petersburg Commercial 769 5
Irkutsk Commercial 947 2
Chapayevsk Homemade 955 1
Togliatti Commercial 955 1

CONCLUSIONS AND NEXT STEPS
Cities that avoided a market transition to commercial heroin or instituted harm reduction early have maintained low HIV prevalence
Questions:Did the arrival of commercial heroin at the municipal
level coincide with the epidemic increases in HIV prevalence (temporal association)?
Did the arrival of commercial heroin coincide with dramatic increases in the number of drug injectors (increasing risk pool)?
Are these linked?

FOCUS ON ST. PETERSBURG
We have been conducting research on injection drug use, HIV, and hepatitis in St. Petersburg since 2000.
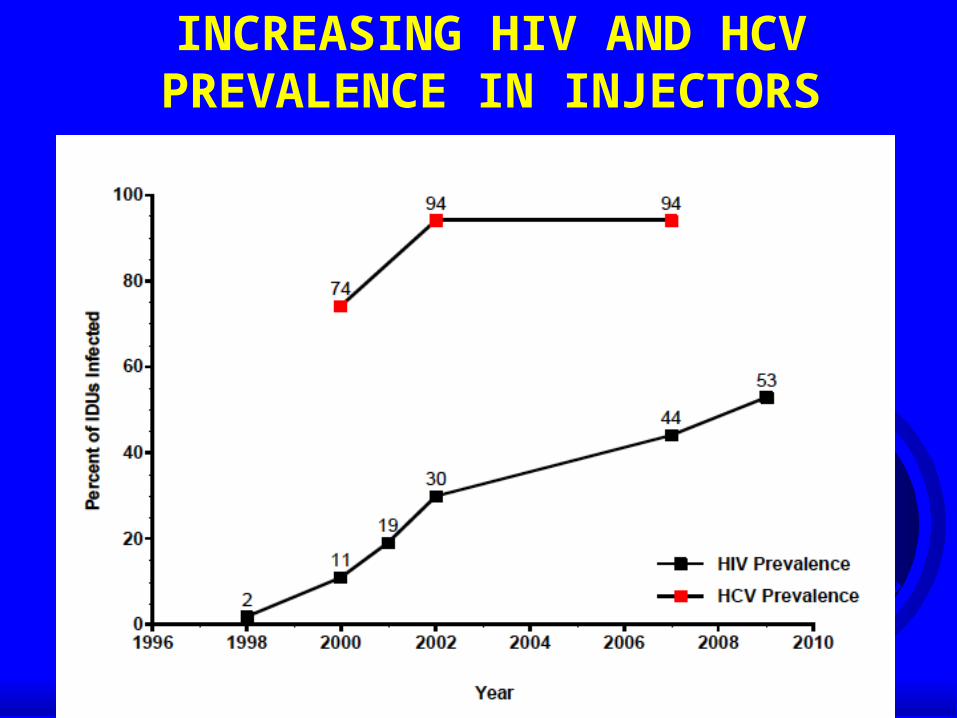
INCREASING HIV AND HCV PREVALENCE IN INJECTORS

SIZE OF THE IDU POPULATION
In St. Petersburg, according to local experts, the authorities have registered approximately 10 000 IDUs.
Is this accurate? What data are needed to get an accurate estimate?
We can use a “multiplier’ method if have enough information.
This approach has been used in Western Europe1, Australia2 and the US3.
1) Hartnoll R. Cross-validating at local level. In: European Monitoring Centre for Drugs and Drug Addiction. Estimating the prevalence of problem drug use in Europe. EMCDDA Scientific Monograph No. 1. 1997; 247-161.
2) Hall WD et al. How many dependent heroin users are there in Australia? The Medical Journal of Australia 2000; 173: 528-531.
3) Heimer R. Community coverage and HIV prevention: Assessing metrics for estimating HIV incidence through syringe exchange. International Journal of Drug Policy,2008; 19S:S65-S73.

CALCULATING HIV INFECTIONS AMONG DRUG INJECTIONS
For St. Petersburg, this number can be determined if we know:How many HIV infections have been detectedHow many are among IDUsWhat is the HIV prevalence among IDUs who have
been testedHow many IDUs have not yet been tested
Data for the first two numbers come from the City AIDS Center.
Data on testing come from our studies of active IDUs recruited between 2005 and 2008.
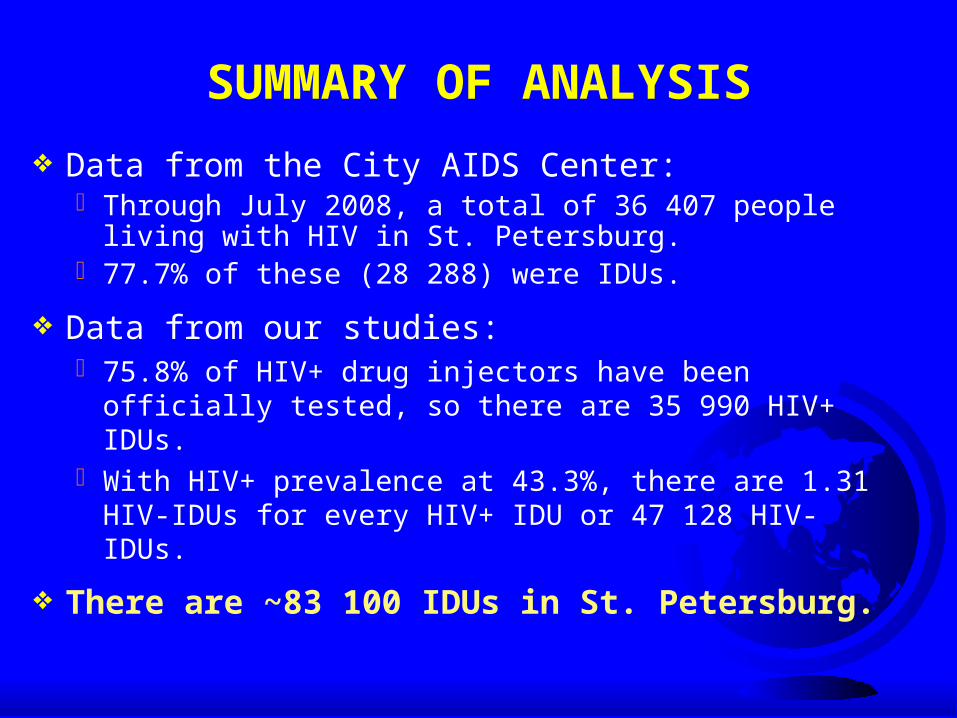
SUMMARY OF ANALYSIS
Data from the City AIDS Center: Through July 2008, a total of 36 407 people living with
HIV in St. Petersburg. 77.7% of these (28 288) were IDUs.
Data from our studies: 75.8% of HIV+ drug injectors have been officially
tested, so there are 35 990 HIV+ IDUs. With HIV+ prevalence at 43.3%, there are 1.31 HIV-
IDUs for every HIV+ IDU or 47 128 HIV- IDUs.
There are ~83 100 IDUs in St. Petersburg.
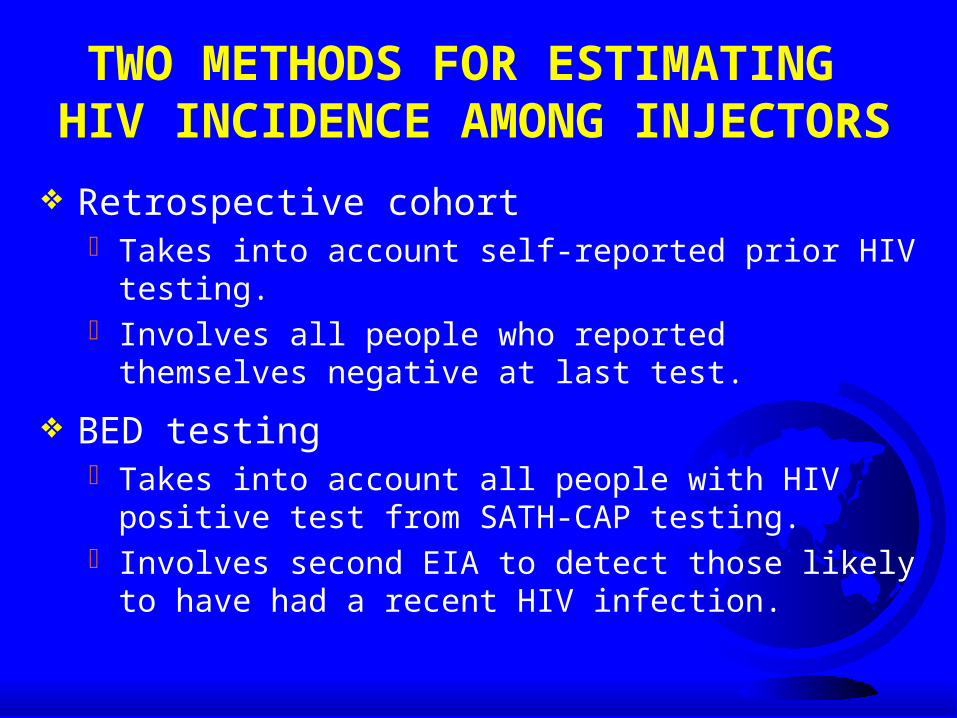
TWO METHODS FOR ESTIMATING HIV INCIDENCE AMONG INJECTORS
Retrospective cohort Takes into account self-reported prior HIV testing. Involves all people who reported themselves negative at
last test.
BED testing Takes into account all people with HIV positive test from
SATH-CAP testing. Involves second EIA to detect those likely to have had a
recent HIV infection.

ESTIMATING HIV INCIDENCE USING A RETROSPECTIVE COHORT METHOD
Disease-free group of individuals
n = 322
Total amount of retrospective follow-up time = 408.7 + (0.5) (102.4) = 459.9 PY
Disease-free
n = 257
Time since last HIV test: 408.7 PY
Acquire disease
n = 65
Time since last HIV test: 102.4 PY
Incidence rate = 65 new cases * 100 = 14.1 per 100 PY (10.7, 17.6) 459.9 PY
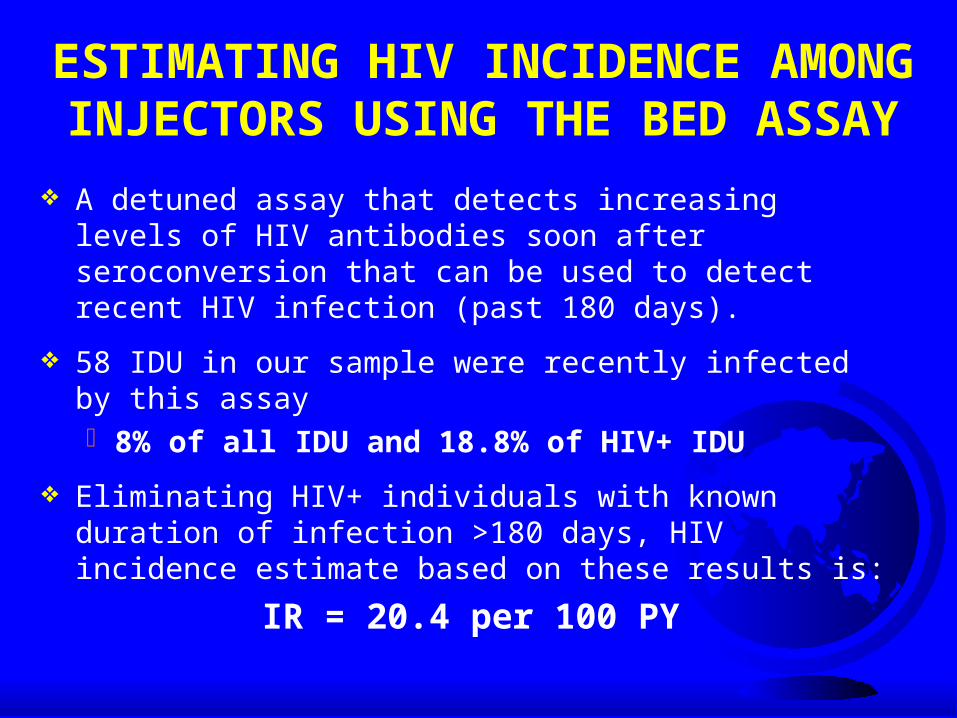
ESTIMATING HIV INCIDENCE AMONG INJECTORS USING THE BED ASSAY
A detuned assay that detects increasing levels of HIV antibodies soon after seroconversion that can be used to detect recent HIV infection (past 180 days).
58 IDU in our sample were recently infected by this assay 8% of all IDU and 18.8% of HIV+ IDU
Eliminating HIV+ individuals with known duration of infection >180 days, HIV incidence estimate based on these results is:
IR = 20.4 per 100 PY

900 injectors from all around the city were recruited and tested.
270 were found to be HIV positive (30%).
Cases were concentrated in several small areas of the city.
HIV and risk were co-localized.
WHERE WAS THE EPIDEMIC IN 2002?

WHERE IS THE EPIDEMIC NOW?
In 2002, HIV prevalence and incidence were concentrated in two city districts.
By 2006, it had spread to the north and southwest.
Recent infections (measured by BED or by retrospective analysis) are widespread.

WHO ARE THESE INJECTORS?
Most are 18-35 years old, median age is 29.
Almost 30% are women.
One-third are fully employed.
10% have a university education; another 25% have vocational training.
55% live with their parents.
Less than 15% engage in illegal activity for money to buy drugs.

SEXUAL “BRIDGES” FROM INJECTORS
INJECTORS
SEX PARTNERS
OF INJECTORS
OTHER NON- INJECTORS
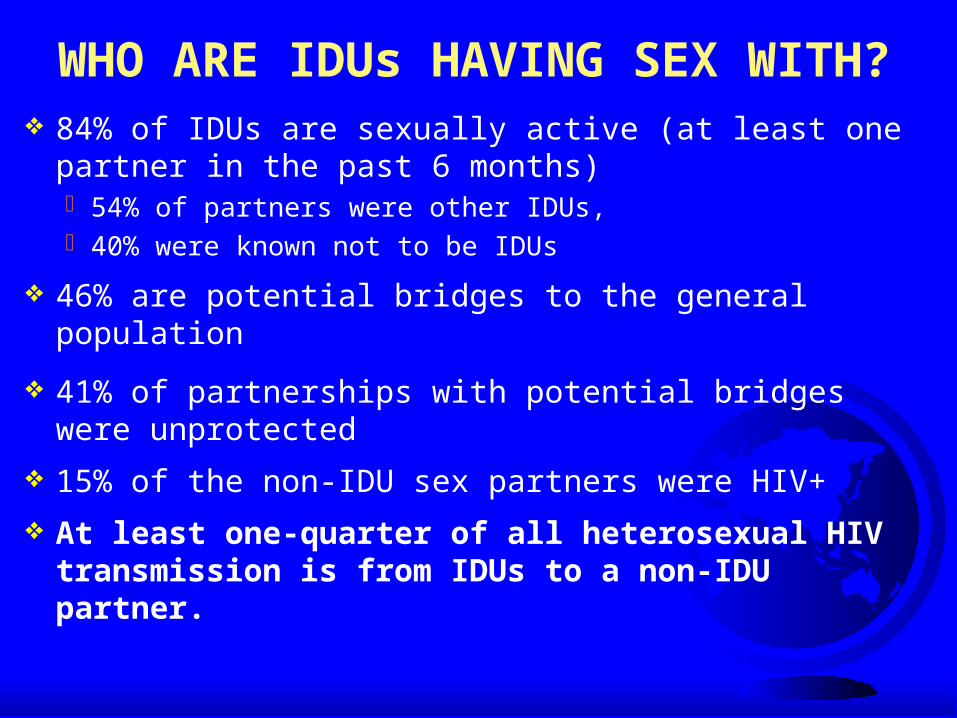
WHO ARE IDUs HAVING SEX WITH? 84% of IDUs are sexually active (at least one partner
in the past 6 months) 54% of partners were other IDUs, 40% were known not to be IDUs
46% are potential bridges to the general population
41% of partnerships with potential bridges were unprotected
15% of the non-IDU sex partners were HIV+
At least one-quarter of all heterosexual HIV transmission is from IDUs to a non-IDU partner.

“BRIDGES” FROM INJECTORS TO THE GENERAL POPULATION
INJECTORS
SEX PARTNERS
OF INJECTORS
OTHER NON- INJECTORS
54%
40% 32%

ESTIMATING PREVALENCE IN GENERAL POPULATION
Back calculation from city surveillance data.
Mathematical models using data collected from injectors, their non-injecting sex partners, and partners of the non-injecting sex partners.
Enhanced surveillance following HIV diagnoses.

SIMPLE BACK CALCULATION
Through 31 July 2008, there where 38,038 cases of HIV detected in St. Petersburg.Almost all were aged 18-45Of these, 22% were not among injectors = 8,482
Of these 8,482, two-thirds did not have sex with an injector. 5,687 detected in the general populationOnly 40% of people aged 18-45 has been tested =
14,200 cases
If there are 1.5 million people between 18-45, prevalence in the general population, excluding injectors, is nearing 1%.

MODELING HIV PREVALENCE IN THE GENERAL POPULATION
Mathematical model suggests the epidemic in the general population has grown slowly.
Estimated prevalence among people 18-45 was 0.8% in 2006.

“BRIDGES” FROM INJECTORS TO THE GENERAL POPULATION
INJECTORS
SEX PARTNERS
OF INJECTORS
OTHER NON- INJECTORS
50% HIV+
15% HIV+
0.8-1% HIV+
54%
40%

FORCE OF INFECTION IN ST. PETERSBURG
Drug injectors remain the force of infection in St. Petersburg.
Providing HAART to IDUs is the best way to control the epidemic.
Latest findings from studies in the Europe, the Americas, and Africa all agree that: by reducing individual-level viral load, sexual
transmission can be reduced by reducing the population-level viral, incidence rates
can be reduced in IDU-driven epidemics
CAN THE HIV EPIDEMIC IN ST. PETERSBURG BE REVERSED?
Requires targeted HIV prevention Basic principles:
Focus on populations that are driving the epidemicEngage with these populations by providing them with the
means and the motivation to change the behaviors that transmit the virus
For St. Petersburg, this means: Focus remains of drug injectors for the near futureMeans to change include better access to testing, clean
syringes, effective drug treatmentMotivation includes access to anti-HIV medications

ADVOCACY TO REVERSE THE HIV EPIDEMIC IN ST. PETERSBURG
Given the Russian context, scaling up prevention and treatment can only be accomplished by municipal government.Collaboration with a local NGO, Stellit, to identify,
inform, and provide expert guidance to appropriate officials
Study tours by local officials of US effortsCreation of a local panel of government officials who
receive guidance on evidence-driven HIV prevention

CAN AN ESTABLISHED HIV EPIDEMIC AMONG INJECTORS BE REVERSED?
New York City provides an excellent example suggesting that it can
HIV entered the population of drug users in the late 1970’s and rapidly spread
Similar to the Russian experience in Afghanistan, but 20 years earlier

REVERSING THE EPIDEMIC IN NEW YORK
Education of drug users about unsafe injection practices
Expanding access to clean syringes through community-based exchange programs and pharmacy sales
More resources to substitution-based drug treatment programs
Offering methadone treatment in the city jail

FOUR PILLARS DRUG STRATEGY Prevention
Treatment
Harm Reduction
Enforcement
Community support for the four-pillar approach: Three-quarters (74%) of Vancouver, Canada residents
say they support this strategy in dealing with drug problems.
Swiss residents have voted to incorporate this strategy into national health policy.