system management application - pega · chapter 9: administration describes tools for monitoring...
TRANSCRIPT

System Management Application
SMA Reference Guide
Version 6.3 SP1

Copyright 2012
Pegasystems Inc., Cambridge, MA
All rights reserved.
This document describes products and services of Pegasystems Inc. It may contain trade
secrets and proprietary information. The document and product are protected by copyright
and distributed under licenses restricting their use, copying distribution, or transmittal in
any form without prior written authorization of Pegasystems Inc.
This document is current as of the date of publication only. Changes in the document may
be made from time to time at the discretion of Pegasystems. This document remains the
property of Pegasystems and must be returned to it upon request. This document does not
imply any commitment to offer or deliver the products or services described.
This document may include references to Pegasystems product features that have not been
licensed by your company. If you have questions about whether a particular capability is
included in your installation, please consult your Pegasystems service consultant.
For Pegasystems trademarks and registered trademarks, all rights reserved. Other brand or
product names are trademarks of their respective holders.
Although Pegasystems Inc. strives for accuracy in its publications, any publication may
contain inaccuracies or typographical errors. This document or Help System could contain
technical inaccuracies or typographical errors. Changes are periodically added to the
information herein. Pegasystems Inc. may make improvements and/or changes in the
information described herein at any time.
This document is the property of:
Pegasystems Inc.
One Rogers Street
Cambridge, MA 02142-1590
Phone: (617) 374-9600
Fax: (617) 374-9620
www.pega.com
Document: System Management Application (SMA) Reference Guide
Software Version: Version 6.3 SP1
Updated: December 5, 2012
SMA Reference Guide Version 6.3 SP1
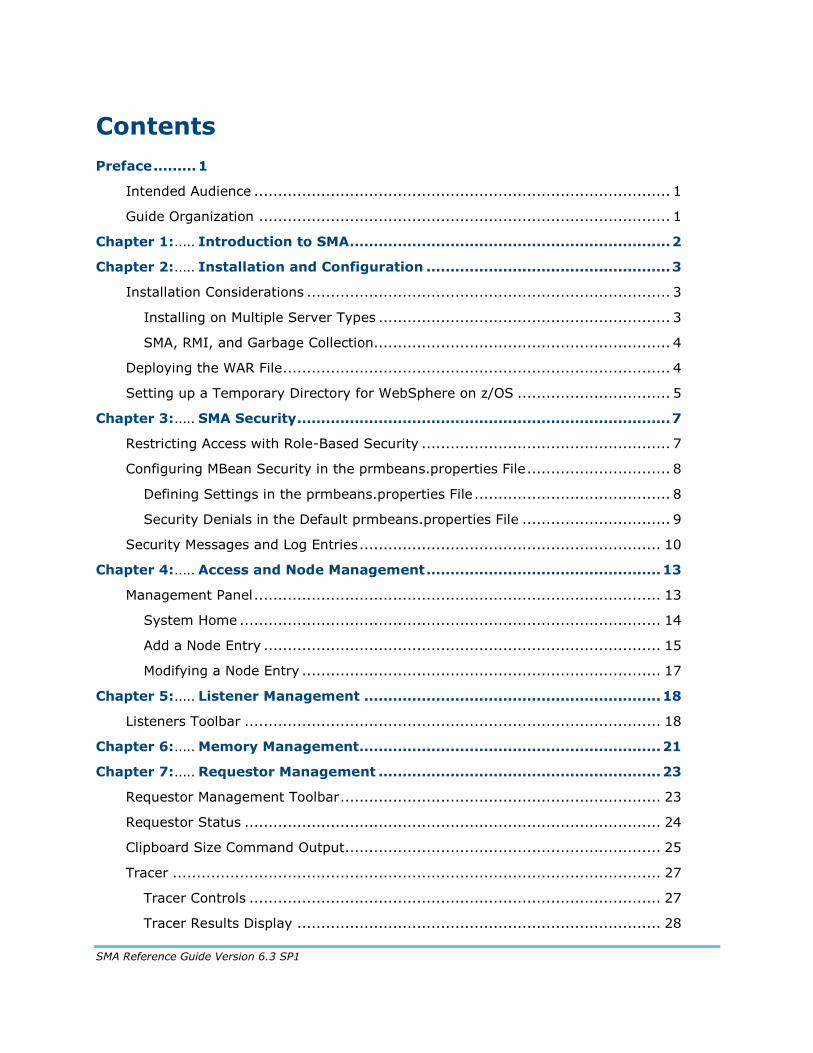
Contents
Preface ......... 1
Intended Audience ....................................................................................... 1
Guide Organization ...................................................................................... 1
Chapter 1: ..... Introduction to SMA ................................................................... 2
Chapter 2: ..... Installation and Configuration ................................................... 3
Installation Considerations ............................................................................ 3
Installing on Multiple Server Types ............................................................. 3
SMA, RMI, and Garbage Collection.............................................................. 4
Deploying the WAR File ................................................................................. 4
Setting up a Temporary Directory for WebSphere on z/OS ................................ 5
Chapter 3: ..... SMA Security .............................................................................. 7
Restricting Access with Role-Based Security .................................................... 7
Configuring MBean Security in the prmbeans.properties File .............................. 8
Defining Settings in the prmbeans.properties File ......................................... 8
Security Denials in the Default prmbeans.properties File ............................... 9
Security Messages and Log Entries ............................................................... 10
Chapter 4: ..... Access and Node Management ................................................. 13
Management Panel ..................................................................................... 13
System Home ........................................................................................ 14
Add a Node Entry ................................................................................... 15
Modifying a Node Entry ........................................................................... 17
Chapter 5: ..... Listener Management .............................................................. 18
Listeners Toolbar ....................................................................................... 18
Chapter 6: ..... Memory Management............................................................... 21
Chapter 7: ..... Requestor Management ........................................................... 23
Requestor Management Toolbar ................................................................... 23
Requestor Status ....................................................................................... 24
Clipboard Size Command Output .................................................................. 25
Tracer ...................................................................................................... 27
Tracer Controls ...................................................................................... 27
Tracer Results Display ............................................................................ 28

SMA Reference Guide Version 6.3 SP1
Interacting with Tracer Results ................................................................ 29
Performance Profiler Controls ...................................................................... 29
Stack Trace ............................................................................................... 31
DB Trace ................................................................................................... 31
Chapter 8: ..... System Management ................................................................ 33
System Management Toolbar ...................................................................... 33
System Summary Information ..................................................................... 34
Chapter 9: ..... Administration ......................................................................... 38
Configuration Management ......................................................................... 38
Index Management .................................................................................... 41
Pulse Status .............................................................................................. 42
Requestor Pools ......................................................................................... 44
ADP Related Data....................................................................................... 44
Requestor Pool Data ................................................................................... 45
Rule Utility Library Extractor ........................................................................ 46
System Settings ........................................................................................ 47
Chapter 10: .. Agent Management .................................................................. 49
General Information ................................................................................... 50
Agents Summary Report ............................................................................. 50
Agent Management Toolbar ......................................................................... 51
System Queue Management ........................................................................ 53
Chapter 11: .. Logging and Tracing ................................................................ 57
Garbage Collector and Log Usage ................................................................. 57
Garbage Collector and Log Usage Toolbar .................................................. 58
Garbage Collector Statistics ..................................................................... 59
Log Usage Statistics ............................................................................... 61
Comparing Garbage Collector and Log Usage Statistics ............................... 64
Global DB Trace Management ...................................................................... 65
Log Files ................................................................................................... 67
Logging Level Settings ................................................................................ 68
Remote Logging ......................................................................................... 69
Remote Tracing ......................................................................................... 71
Remote Tracing Toolbar .......................................................................... 72

SMA Reference Guide Version 6.3 SP1
User and Rule Watches ........................................................................... 72

SMA Reference Guide Version 6.3 SP1
1
Preface
This document describes the System Management Application (SMA) is set of utilities
distributed with PegaRULES Process Commander that enable system administrators and
developers to monitor and manage Process Commander nodes.
Intended Audience
This guide is intended for all users with administrative or management responsibilities for a
Process Commander system.
Guide Organization
Chapter 1: Introduction to SMA Provides an overview of the System Management
Application.
Chapter 2: Installation and Configuration Describes SMA installation and deployment.
Chapter 3: SMA Security Describes security considerations and the role of the
PegaDiagnosticUser.
Chapter 4: Access and Node Management Describes how to access SMA and use its management
panel, and how to add nodes to SMA’s management
environment.
Chapter 5: Listener Management Describes listener management.
Chapter 6: Memory Management A view of memory usage in the PRPC system.
Chapter7: Requestor Management Describes requestor management and how to access
the Profiler and Tracer tools.
Chapter 8: System Management Provides information on the node’s system, JVM, and
PRPC build.
Chapter 9: Administration Describes tools for monitoring PRPC configuration, pulse
status, requestor pools, and administrative system
settings.
Chapter 10: Agent Management Provides Displays information on running agents and
system queues; can be used to start and stop agents..
Chapter 11: Logging and Tracing Provides information on garbage collection, trace
management, log files and data, and remote logging
and tracing.
This document does not describe the SMA functions listed under Advanced on the SMA
commands menu.
For further information on the topics discussed in this document, consult the Developer
Help, and review the documents in the Performance area on the Pega Developer Network
(pdn.pega.com).

SMA Reference Guide Version 6.3 SP1
2
Chapter 1: Introduction to SMA
The System Management Application (SMA) is set of utilities distributed with PegaRULES
Process Commander that enable system administrators and developers to monitor and
manage Process Commander nodes. SMA is a standalone implementation and requires a
separate installation.
SMA is built on Java Management Extensions (JMX) interface and is instrumented using JMX
objects called Managed Beans (MBeans), which expose their management interfaces to the
SMA applications through a JMX agent. JMX provides a standard API to monitor and manage
resources either locally or via remote access.
There are two sets of utilities in SMA, a standard set with functionality suitable for all
administrative and support users, and an advanced set with functions that are intended for
developers as they build and debug new applications. The advanced tools might also be
used under the guidance of Pegasystems support.
SMA can be accessed through Process Commander, the application server’s administration
page, or directly through a browser.
Through Process Commander: Start PRPC as a developer. From the Pega button, select
System > Tools > System Management Application.
Through the application server: Navigate to your web server administration page and click the prsysmgt link.
Through the browser: Enter the URL and port number for SMA on the browser’s address bar.

SMA Reference Guide Version 6.3 SP1
3
Chapter 2: Installation and Configuration
SMA is installed as a standalone application, but does not need to be installed on every
node in a cluster. SMA installation and configuration is a three-step process:
Choose an SMA installation location.
Deploy the prsysmgmt.war file.
Add entries to the SMA configuration for each node that will be monitored.
Some application servers, in particular WebSphere on z/OS, may require the creation of a
temporary directory in a location that persists across sessions. Refer to Setting up a
Temporary Directory for WebSphere on z/OS on page 5 for instructions on setting up this
directory.
Installation Considerations
Since SMA’s function is to monitor Process Commander nodes, we recommend that you
install it on a server that is not running Process Commander. This precaution ensures that
SMA will continue to operate even if a Process Commander node fails. However, it does not
affect operations if Process Commander and SMA both reside on the same node.
In a small development or test system, it might be useful to have the SMA installed on the
same server to assist in application development. However, once that application goes into
production, reinstall SMA on a separate system.
Installing on Multiple Server Types
An SMA instance can only monitor Process Commander nodes running on a single server
type, for example only WebLogic servers or only WebSphere servers. SMA must be running
on the same type of application server as the nodes it is monitoring. If your Process
Commander installation includes five servers running WebSphere and five running
WebLogic, the installation requires two instances of SMA, one to monitor each application
server type.
In a single-node system, install both the Process Commander application and the SMA in the
same application server, and specify that the node will connect through the local JVM on the
node’s Configuration Details setup screen.
In a multi-node system, install the SMA in a JVM that is separate from the Process
Commander application, preferably on another node. Do not specify a local connection on any
of the nodes—specify a Server URL for the JMX server on the node’s Configuration Details setup screen instead. All nodes will then use RMI (Remote Method Invocation) to
communicate.

SMA Reference Guide Version 6.3 SP1
4
SMA in a Multi-Node System
SMA, RMI, and Garbage Collection
In a multi-node installation, JMX uses RMI to communicate with the other nodes being
monitored. In Java, explicit garbage collection is forced once per minute in any system
using RMI, although it is possible to configure the JVM to suppress this by disabling explicit
GC calls. If not suppressed, frequent garbage collection can lead to degraded system
performance.
If a Process Commander node and SMA are sharing a JVM on such a system, that system
will collect garbage once per minute, because of the system’s use of RMI. Again, it will
adversely affect Process Commander performance on that node.
This issue can affect all server types except WebSphere, which uses SOAP services for
intranode communications, not RMI.
A single-node installation connecting through the local JVM avoids RMI and the forced
garbage collection problem, and the attendant performance issues.
Deploying the WAR File
The prsysmgmt.war file is included as a component of all versions of Process Commander.
The SMA WAR file should be deployed at the same time as Process Commander. Refer to
the installation guide for your platform for details on deploying the WAR file.

SMA Reference Guide Version 6.3 SP1
5
Setting up a Temporary Directory for WebSphere on z/OS
Note: While the following instructions apply to all application servers on all operating systems,
this step is required only for WebSphere on z/OS, and is optional for other environments.
SMA requires as part of its operation a temporary directory in which to store configuration
information including the file Nodes.xml, the list of nodes being monitored.
When deploying SMA in a dynamic servants configuration with WebSphere and z/OS, the
application server may dynamically replicate the SMA instance in separate processes, and
each of these processes must be able to find and persist the set of nodes being monitored in
Nodes.xml. The temporary directory location specified here remains invariant between
sessions, and allows SMA to persist its state.
The temporary directory is defined as a new Java system property. Before defining the
property, first check that the directory exists. If necessary, create it with the appropriate
permissions. Start the server, then set the temporary directory location by defining the Java
system property com.pega.sma.tmpdir, using the -D command line option. Consult your
WebSphere documentation for details on how to set a system property.
For example, here are the steps needed for WebSphere 6.x, where SERVER_NAME is your
server and /SYSTEM/tmp/SMA is the temporary directory.
1. Create a folder where SMA can write the Nodes.xml file and authorize it:
mkdir /SYSTEM/tmp/SMA
chmod 770 /SYSTEM/tmp/SMA
chown ASSR1:WSCFG1 /SYSTEM/tmp/SMA
2. Set the property com.pega.sma.tmpdir on the WebSphere console. Navigate to your
server: Application Servers > Servers > SERVER_NAME.
3. Open Server Infrastructure > Java and Process Management > Process
Definition > Servant > Additional Properties > Java Virtual Machine. Under
Generic JVM arguments, add or replace the property:
–Dcom.pega.sma.tempdir=/SYSTEM/tmp/SMA
4. Recycle WebSphere and start SMA.
Java 2 Security and the Temporary Directory
If Java 2 Security is enabled, then the application’s security policy must grant permissions
to certain components of SMA for them to perform read and write operations on the
temporary directory. To do this on WebSphere, package the application in an EAR file, and
place a was.policy file in the META-INF directory of the EAR file that grants the following
permissions:
grant codeBase "file:${webComponent}" {
permission java.util.PropertyPermission "com.pega.sma.tmpdir", "read";
permission java.io.FilePermission "${com.pega.sma.tmpdir}${/}-", "read,write";
};
For other application servers, refer to the application server documentation for instructions
on where to place these permissions.
If the specified directory does not exist, or the permissions are not set correctly, SMA does
not start, and returns an error indicating that it could not find Nodes.xml.

SMA Reference Guide Version 6.3 SP1
6
If Tempdir Is Not Set
If the com.pega.sma.tmpdir system property is not specified, SMA will proceed as follows.
If there is a Nodes.xml file in the directory specified by the user.home system property,
that file is used. Otherwise, the system looks for Nodes.xml in the directory specified by the
javax.servlet.context.tempdir property retrieved from the ServletContext object, and
creates the file there if it does not exist. This directory is not guaranteed to be invariant
among multiple SMA sessions when SMA is deployed in dynamic servants mode on z/OS, so
using it in this case might lead to unexpected behavior.
SMA Reference Guide Version 6.3 SP1
7
Chapter 3: SMA Security
Sensitive data can be obtained through SMA, including the contents of the clipboard for a
given requestor. Due to the sensitivity of the data, Pegasystems provides an access control
mechanism for the System Management MBeans.
JMX security mechanisms vary among the different web servers. Tomcat provides the
functionality to set up role-based access to the MBeans in the SMA, but neither WebSphere
nor WebLogic have finalized their security mechanisms for individual MBeans. Therefore,
Pegasystems has added additional security through use of a properties file to control access
to the system management MBeans.
Restricting Access with Role-Based Security
If implementing role-based security, users who will access the SMA must be assigned the
PegaDiagnosticUser role in order to have complete access to SMA functions.
PegaDiagnosticUser is defined as a security constraint in the Process Commander’s
web.xml file (found, for example, at TOMCAT_HOME/webapps/prweb/WEB-INF/web.xml).
PegaDiagnosticUser is assigned to individual users in the application server’s user
definitions file (found, for example, at TOMCAT_HOME/conf/tomcat-users.xml).
If you do not want to restrict SMA access, remove the constraint with either of these
methods:
Edit the PegaRULES web.xml file and comment out the security constraint. If you make this
change in web.xml, you may need to redeploy the prweb application.
Certain application servers (such as WebSphere) allow roles to be mapped to all users, including unauthenticated users. If you want to map the PegaDiagnosticUser role to all
users, consult your application server’s documentation to see how to accomplish the
mapping.
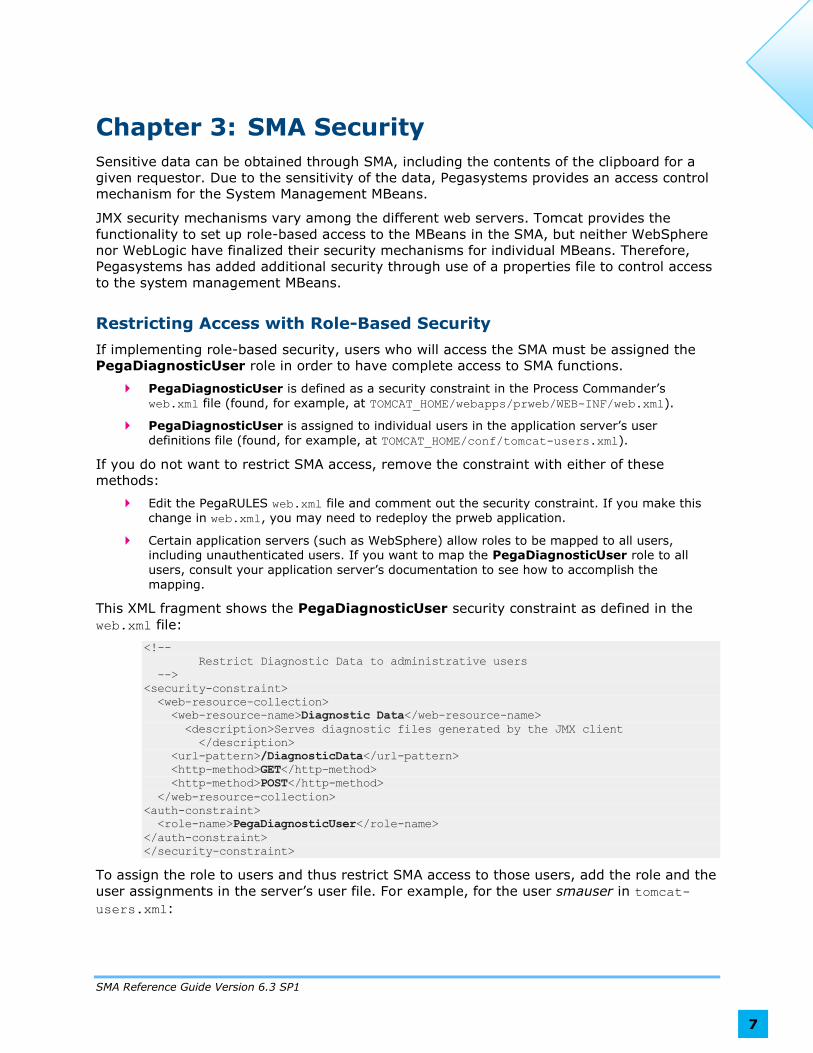
This XML fragment shows the PegaDiagnosticUser security constraint as defined in the
web.xml file:
<!--
Restrict Diagnostic Data to administrative users
-->
<security-constraint>
<web-resource-collection>
<web-resource-name>Diagnostic Data</web-resource-name>
<description>Serves diagnostic files generated by the JMX client
</description>
<url-pattern>/DiagnosticData</url-pattern>
<http-method>GET</http-method>
<http-method>POST</http-method>
</web-resource-collection>
<auth-constraint>
<role-name>PegaDiagnosticUser</role-name>
</auth-constraint>
</security-constraint>
To assign the role to users and thus restrict SMA access to those users, add the role and the
user assignments in the server’s user file. For example, for the user smauser in tomcat-
users.xml:

SMA Reference Guide Version 6.3 SP1
8
<tomcat-users>
<role rolename="PegaDiagnosticUser"/>
<user username="smauser" password="smauser" roles="PegaDiagnosticUser"/>
</tomcat-users>
Configuring MBean Security in the prmbeans.properties File
Process Commander denies access to one or more MBeans, MBean operations, or MBean
attributes through use of a Java properties file, prmbeans.properties. The file is located in
the same directory as prconfig.xml, for example on Tomcat in
TOMCAT_HOME/webapps/prweb/WEB-INF/classes.
The properties file describes a negative security policy, meaning that it contains information
only on actions that are explicitly denied. All other operations are allowed. This provides a
level of security for the MBeans, and ensures that there is a universal method of securing
MBean access across all web servers.
Upon startup, the settings in prmbeans.properties are read into memory. Each time that
an MBean attribute or operation is accessed by the SMA, the cached security settings for
that MBean are checked, and access is either allowed or denied to all users. The
PegaDiagnosticUser role setting for any given user is not pertinent to this security policy.
If access to an MBean is denied, it is denied to everyone. If access is denied, an error
message like this one is returned to the caller:
Access to the mBean operation/attribute
RequestorManagement.RequestorDetails[java.lang.String] has been denied. If you
believe that you should have access to this operation or attribute, please check
your mBean security settings or contact your system Administrator.
Note: The prmbeans.properties settings are read only on application startup. If you later change a
security setting in this file, stop and restart SMA for that change to be referenced.
If direct access to an MBean is denied, the error is fatal and the message returned is:
<?xml version="1.0" encoding="UTF-8"?>
<FatalError>
<PRmBeanError>Access to the mBean operation/attribute
RequestorManagement.Clipboard[java.lang.String] has been denied. If you believe
that you should have access to this operation or attribute, please check your mBean
security settings or contact your system Administrator.</PRmBeanError>
</FatalError>
Defining Settings in the prmbeans.properties File
MBean security access can be denied at four levels: to all MBeans, to individual MBeans, at
the attribute level, or at the operation level.
All examples shown in this section are valid in the prmbeans.properties file. The complete
list of MBean descriptors indicating what you can change is in the file
PRMBeanDescriptor.xml, in the jar file PRWEB_HOME/WEB-INF/lib/pega/prpublic.jar.

SMA Reference Guide Version 6.3 SP1
9
No Access
If access to all MBeans is denied, then no MBeans are registered with the JMX server, and
all other settings in the file are ignored. To deny access to all MBeans, enter:
deny = true
MBean Level Access
MBeans are registered in the JMX server unless specifically denied. If access to a named
MBean is denied, it is not available for use in SMA, and not listed in the navigation pane.
Any other file settings for this MBean are ignored.
Syntax: deny.mBeanName = true
Example: deny.RemoteTracing = true
MBean Attribute Level Access
Each MBean contains four attributes where access can be denied: name, major version,
minor version, and category.
Syntax: deny.mBeanName.AttributeName = true
Example: deny.RequestorManagement.Name = true
MBean Operation Level Access
If an MBean is only partially restricted, then it is registered with the JMX server, but access
to the restricted value is denied. This means that although a remote user can see that
restricted properties exist, their values cannot be accessed either programmatically or
through the SMA user interface.
If the MBean has multiple operations with the same name, but different signatures, this
entry in the prmbeans.properties denies access to all of them.
Syntax: deny.mBeanName.OperationName = true
Example: deny.RequestorManagement.Clipboard = true
MBean Operation Signature Level Access
If access to an MBean with the given operation and signature is denied, all other settings for
the given operation are ignored. More than one signature can be included in a comma-
separated list. Do not include spaces in the signature list, or the security rule will not match.
Syntax:
deny.mBeanName.OperationName[OperationSignature,…] = true
Example:
deny.HeapProfiling.Analyze[java.lang.String,java.lang.String] = true
Security Denials in the Default prmbeans.properties File
The default properties file on Tomcat is: TOMCAT_HOME/webapps/prweb/WEB-
INF/classes/prmbeans.properties. It includes three statements:

SMA Reference Guide Version 6.3 SP1
10
#Default mBean security configuration.
deny.DatabaseManagement.DatabaseConnectionDetails = true
deny.RequestorManagement.RequestorDetails = true
deny.RequestorManagement.Clipboard = true
The default settings deny access to three functions at the MBean operational level, as
described in this table. To enable that access, comment out this denial in
prmbeans.properties.
On SMA Screen Access Denied To What Is Denied
Requestor
Management
Details command Prevents display of a trace entry with details of
the requests sent by this requestor, including
specific database information.
Requestor
Management
Clipboard command Prevents display of clipboard data for that
requestor.
Database
Management (in
SMA Advanced)
Database Connection
Details command
Prevents the display of the managed
connections to the selected database (that is,
the running requestors), which in turn
prevents the display of all commands recently
executed by that requestor, including specific
database information.
Security Messages and Log Entries
If prmbeans.properties is left in the default state, the following messages are written to
the PEGA log during startup:
Located App Server independent MBean security configuration:
file:/D:/programs/tomcat5.5/webapps/prweb0601/WEB-INF/classes/prmbeans.properties
13:58:45,807 [ wabcdexp] ( priv.management.MBeanSecurity)
INFO - The following MBean security configuration has been applied:
deny.RequestorManagement.Clipboard=true
deny.RequestorManagement.RequestorDetails=true
deny.DatabaseManagement.DatabaseConnectionDetails=true
10:53:27,639 [ wabcdexp] (riv.management.mBeanManagement)
INFO - mBean Management (Web) initialized for DefaultDomain
If the system could not locate the prmbeans.properties file, then no security is applied to
the SMA, and all operations are allowed by default. The following messages are written to
the PEGA log:
Unable to locate App Server independent mBean security configuration after trying:
<properties>
abcde-prmbeans.properties
wabcdexp-prmbeans.properties
prmbeans.properties
11:36:08,264 [ wabcdexp] ( priv.management.mBeanSecurity)
WARN - mBean security configuration has not been defined. All mBean operations
will be allowed.
11:36:08,702 [ wabcdexp] (riv.management.mBeanManagement)
INFO - mBean Management (Web) initialized for DefaultDomain
If the default prmbeans.properties file was changed, and an entire MBean was disabled,
messages such as these are displayed at startup:
SMA Reference Guide Version 6.3 SP1
11
Located App Server independent mBean security configuration:
file:/D:/programs/tomcat5.5/webapps/prweb0601/WEB-INF/classes/prmbeans.properties
11:37:48,046 [ wabcdexp] ( priv.management.mBeanSecurity)
INFO - The following mBean security configuration has been applied:
deny.RequestorManagement.RequestorDetails=true
deny.RequestorManagement=true
deny.DatabaseManagement.DatabaseConnectionDetails=true
11:37:48,327 [ wabcdexp] (riv.management.mBeanManagement)
INFO - The mBean com.pega.pegarules.management.RequestorManagement has not been
registered due to the mBean security configuration.
11:37:48,405 [ wabcdexp] (riv.management.mBeanManagement)
INFO - mBean Management (Web) initialized for DefaultDomain
If the default prmbeans.properties file was changed, and all MBeans were disabled,
messages similar to the following will appear at startup:
11:38:44,358 [ wabcdexp] ( priv.management.mBeanSecurity)
INFO - The following mBean security configuration has been applied:
deny.RequestorManagement.RequestorDetails=true
deny.RequestorManagement=true
deny.DatabaseManagement.DatabaseConnectionDetails=true
deny=true
11:38:44,593 [ wabcdexp] (riv.management.mBeanManagement)
INFO - The mBean com.pega.pegarules.priv.management.web. ServletManagement has
not been registered due to the mBean security configuration.
11:38:44,593 [ wabcdexp] (riv.management.mBeanManagement)
INFO - The mBean com.pega.pegarules.management.HeapProfiling has not been
registered due to the mBean security configuration.
11:38:44,593 [ wabcdexp] (riv.management.mBeanManagement)
INFO - The mBean com.pega.pegarules.management.DatabaseTableInfo has not been
registered due to the mBean security configuration.
11:38:44,593 [ wabcdexp] (riv.management.mBeanManagement)
INFO - The mBean com.pega.pegarules.management.LogFileAccess has not been
registered due to the mBean security configuration.
11:38:44,593 [ wabcdexp] (riv.management.mBeanManagement)
INFO - The mBean com.pega.pegarules.management.ListenerManagement has not been
registered due to the mBean security configuration.
11:38:44,593 [ wabcdexp] (riv.management.mBeanManagement)
INFO - The mBean
com.pega.pegarules.priv.management.web.WebTierRuntimeEnvironment has not been
registered due to the mBean security configuration.
11:38:44,593 [ wabcdexp] (riv.management.mBeanManagement)
INFO - The mBean com.pega.pegarules.management.ClassLoaderManagement has not
been registered due to the mBean security configuration.
Tracking Access in the PEGA Log File
The messages described in the preceding section are written by default to the PEGA log file.
To have additional information on access to the SMA MBeans written to the log, set the
logging level for the class com.pega.pegarules.priv.management.mBeanSecurity to INFO,
so every use or attempted use of SMA is logged. Refer to Logging Level Settings for
information on changing the logging level.
Example PEGA log entries:

SMA Reference Guide Version 6.3 SP1
12
11:28:32,561 [tion(70)-10.60.51.54] ( priv.management.mBeanSecurity)
INFO - GRANTED access to mBean Operation. Relevant rule:
deny.RequestorManagement.RequestorList[]
11:28:37,624 [tion(70)-10.60.51.54] ( priv.management.mBeanSecurity)
INFO - DENIED access to mBean RequestorManagement. Relevant rule:
deny.RequestorManagement.Clipboard
The “relevant rule” refers to entries in the prmbeans.properties file. When access is
granted, the log file contains a message stating that the listed configuration setting was not
found in the properties file. When access is denied, the log message references the
configuration setting which denied access to the requested feature.
To record less detail in the PEGA log, disable INFO-level logging after SMA security is
configured satisfactorily.
SMA Reference Guide Version 6.3 SP1
13
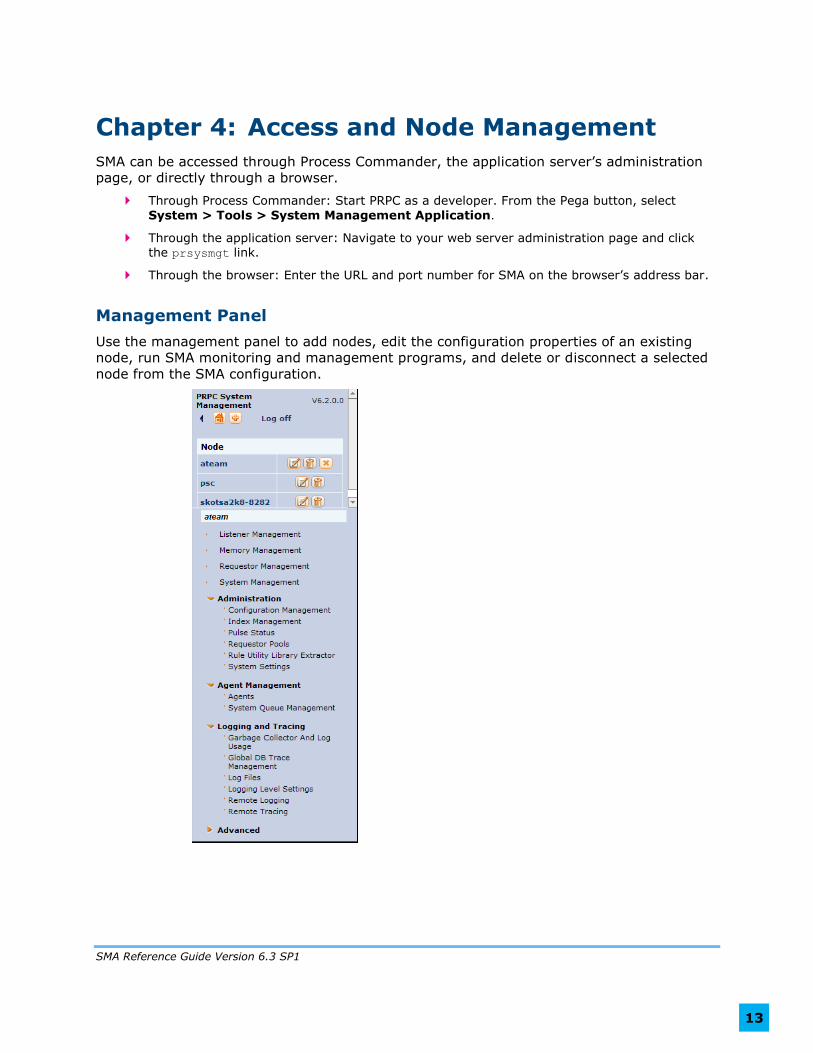
Chapter 4: Access and Node Management
SMA can be accessed through Process Commander, the application server’s administration
page, or directly through a browser.
Through Process Commander: Start PRPC as a developer. From the Pega button, select
System > Tools > System Management Application.
Through the application server: Navigate to your web server administration page and click the prsysmgt link.
Through the browser: Enter the URL and port number for SMA on the browser’s address bar.
Management Panel
Use the management panel to add nodes, edit the configuration properties of an existing
node, run SMA monitoring and management programs, and delete or disconnect a selected
node from the SMA configuration.

SMA Reference Guide Version 6.3 SP1
14
SMA Node Management Functions
Element Description
Displays a summary of all defined nodes. For each node, the
summary includes the node name, the system name, total
system memory in KB, number of requestors, number of agents,
number of listeners, and the PRPC version.
Opens the Enter Node Configuration Details setup screen to add a
new node.
Opens the Edit Node Configuration Details setup screen, which
displays the selected node’s current configuration.
Removes the selected node from the SMA configuration.
Disconnects the selected node from the SMA configuration. It
remains part of the SMA system but its data is not included in
system-wide summaries.
When SMA is first opened, the console lists only the node where SMA is running. Enter more
nodes to add them to the list. Selecting a node highlights its name and displays its System
Management summary. SMA functions will act on this selected node. To change nodes, click
on another node name.
System Home
Click to display a snapshot of all connected nodes in the system.
System Details Summary, All Nodes
Column Description
Node Name The name of the Process Commander node.
System Name The name of the server on which the named node runs. More than one
Process Commander node can run on one server.
Total Memory The current size of the JVM in bytes.
# Requestors The number of requestors in memory for this node. This number can
point to a load balancing situation in the cluster. If one node has many
requesters and others have only a few, users on the heavily loaded node
may experience performance slowdowns.
# Agents The number of agents defined on this node.
# Listeners The number of listeners defined on this node.
Version The Process Commander version being run on the node.

SMA Reference Guide Version 6.3 SP1
15
Add a Node Entry
To add a node entry, click to open the Enter Node Configuration Details setup
screen. SMA automatically completes as many fields as it can.
Add an entry for each node to be monitored. There are minor differences in the information
required for different server types, as noted in the Configuration Details table.
When all fields are complete, click Submit to add the node to the node list.
SMA Configuration Details Setup Screen Fields
Field Name Description
Current Server Version of the server to which this node connects. This field
is automatically filled by SMA.
Server Connection Type The type of server to which this node connects. This field is
automatically filled by SMA.
Node Name Required. A user-defined text name that identifies this
node in SMA and appears in the node list. Node names
must be unique within the SMA configuration. A node name
can be the same as a server name.
SMA Reference Guide Version 6.3 SP1
16
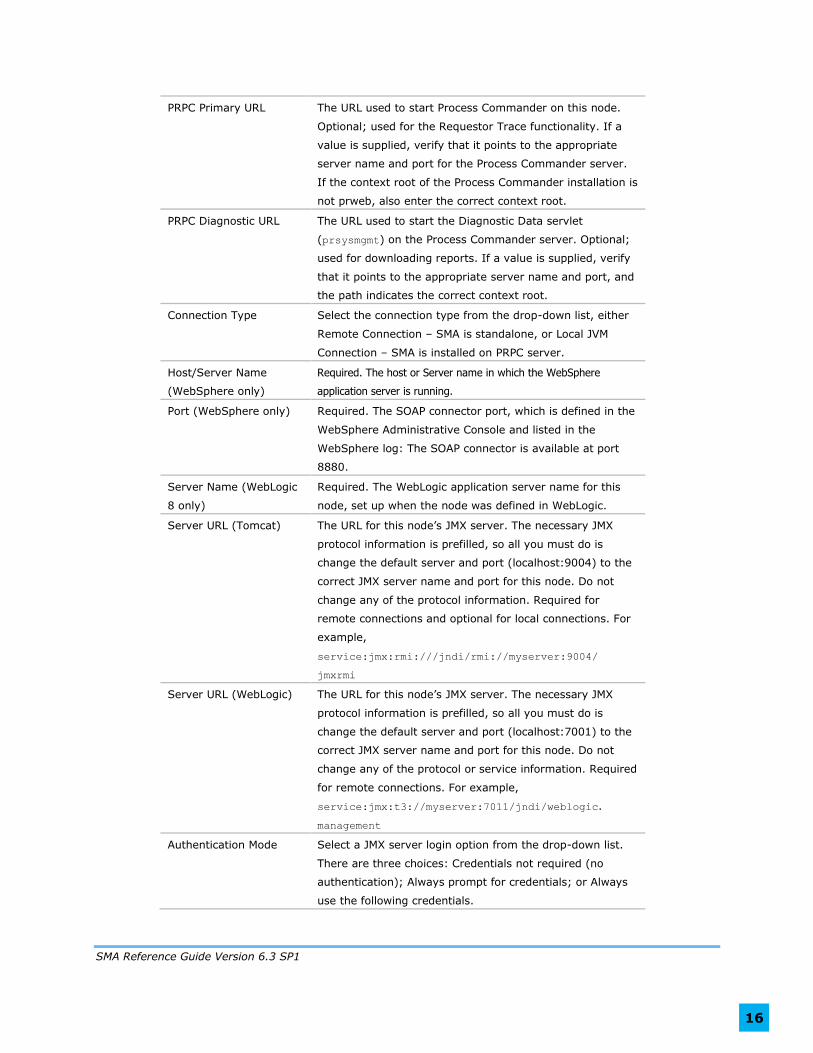
PRPC Primary URL The URL used to start Process Commander on this node.
Optional; used for the Requestor Trace functionality. If a
value is supplied, verify that it points to the appropriate
server name and port for the Process Commander server.
If the context root of the Process Commander installation is
not prweb, also enter the correct context root.
PRPC Diagnostic URL The URL used to start the Diagnostic Data servlet
(prsysmgmt) on the Process Commander server. Optional;
used for downloading reports. If a value is supplied, verify
that it points to the appropriate server name and port, and
the path indicates the correct context root.
Connection Type Select the connection type from the drop-down list, either
Remote Connection – SMA is standalone, or Local JVM
Connection – SMA is installed on PRPC server.
Host/Server Name
(WebSphere only)
Required. The host or Server name in which the WebSphere
application server is running.
Port (WebSphere only) Required. The SOAP connector port, which is defined in the
WebSphere Administrative Console and listed in the
WebSphere log: The SOAP connector is available at port
8880.
Server Name (WebLogic
8 only)
Required. The WebLogic application server name for this
node, set up when the node was defined in WebLogic.
Server URL (Tomcat) The URL for this node’s JMX server. The necessary JMX
protocol information is prefilled, so all you must do is
change the default server and port (localhost:9004) to the
correct JMX server name and port for this node. Do not
change any of the protocol information. Required for
remote connections and optional for local connections. For
example,
service:jmx:rmi:///jndi/rmi://myserver:9004/
jmxrmi
Server URL (WebLogic) The URL for this node’s JMX server. The necessary JMX
protocol information is prefilled, so all you must do is
change the default server and port (localhost:7001) to the
correct JMX server name and port for this node. Do not
change any of the protocol or service information. Required
for remote connections. For example,
service:jmx:t3://myserver:7011/jndi/weblogic.
management
Authentication Mode Select a JMX server login option from the drop-down list.
There are three choices: Credentials not required (no
authentication); Always prompt for credentials; or Always
use the following credentials.

SMA Reference Guide Version 6.3 SP1
17
Admin Username The username and password fields are shown only if you
selected the authentication mode Always use the following
credentials. Enter the name of the administrative user with
access rights to the JMX server.
Admin Password The JMX server administrator’s password.
Node ID Identifies this instance of PRPC. Used only when multiple
instances of PRPC operate on a single host and IDs are
needed to distinguish between them. The ID is a 32-bit
string and is the value of the property pxSystemNodeID.
You can obtain this value from the Clipboard, under the
pxProcess property.
Modifying a Node Entry
To edit the properties of a node already in the configuration, click to display the Modify
Node Configuration Details screen. Properties that can be modified include the node
name, primary and diagnostic URLs, connection type, remote server URL, node ID, and
administrative credentials. Click Submit to enter the data.

SMA Reference Guide Version 6.3 SP1
18
Chapter 5: Listener Management
The Listener Management function displays information about listeners on the selected
node. Its toolbar contains commands to start, stop, and restart listeners.
Click to refresh the displayed listener data.
The data display contains information on available and running listeners:
The Available Listeners drop-down lists all listeners defined in this Process Commander
system.
The Running Listeners report lists data on all listeners that are or were running in the
Process Commander system.
Listeners Toolbar
Available Group
Button Description
Start Starts a listener selected from the Available Listeners drop-down
and adds its information to the Running Listeners listing. Refresh
the screen to display the Listener information if necessary.
Running Group
Button Description
isAlive Shows whether the selected listener is enabled.
Query Displays information about the selected listener.
Listener Rule Data Data provided about this listener from the Data-Admin-
Connect- instance.
Restart Stops and then restarts the selected listener.
Stop Stops the selected listener and removes its information from the
Running Listeners list.

SMA Reference Guide Version 6.3 SP1
19
By Type Running Group
These commands affect all listeners of the same type as the selected listener in the Running
Listeners section. The listener types include Email, File, JMS, JMSMDB, and MQ. MQ listeners
are available only when Process Commander is deployed as a web application.
Button Description
RestartType Stops and then restarts all listeners of the specified type.
StopType Stops all listeners of the specified type.
All Running Group
These commands affect all listeners in the Running Listeners list. It is not necessary to
select a specific listener in order to use them.
Button Description
RestartAll Restarts all listeners on this node.
StopAll Stops all listeners on this node.
Available Listeners
A drop down list of all available listeners created in the PRPC node. To start a listener, select
it in this list and click Start in the Available group. When successfully started, the listener
appears in the Running listeners section.
Running Listeners Summary Fields
Heading Description
Listener ID A unique string assigned to the listener by the Listener manager.
The Listener ID does not exist until the listener is started.
Status The state of the listener. A listener can be running, sleeping
(waiting to run), or disabled.
Listener Class The name of the Process Commander class that defines this
listener (example: Data-Admin-Connect-EmailListener).
Listener Java Class The name of the Process Commander Java class that implements
the listener. All class names begin with
com.pega.pegarules.services. The classes include
EmailListener, file.FileListener, JMSListener,
JMSMDBListener, and MQListener.
Listener Name The name of the rule instance. For Email and MQ listeners, this
name is a concatenation of the two key fields for the rule instance,
the server name and the listener name, for example
DevServerCustomerEmail.
Time Started The date and time when this listener was started.
Last Access The time when this listener last woke from sleep mode to process
a request.
Request Count The number of requests this listener has processed.
Last Request The last time listener processing was requested.

SMA Reference Guide Version 6.3 SP1
20
Error Count The number of errors in requests for this listener.
Last Error The timestamp of the last error.

SMA Reference Guide Version 6.3 SP1
21
Chapter 6: Memory Management
The Memory Management function displays a statistical snapshot of memory-intensive
processes, including count and size information on requestors, caches, and class loaders.
Click to refresh the displayed data.
Count and Size Data for Requestor and Cache Objects in Memory
Type Description
Requestors Same as Summary of Requestors table on the Requestor
Management screen. The total count of the four requestor
types is the same as the Number of Requestors listed on
the System Management screen.
Caches/Rule Instance Same as the Instances count in the Rule Cache Summary
category on the Advanced > Rule Cache Management
screen.
Caches/Rule Assembly Same as the Count in the Rule Assembly Entries category
on the Advanced > Rule Assembly Cache Management
screen.
Caches/Declarative The sum of two fields on the Advanced > Declarative
Rules Management screen, Classes in the Global Network
category and Unique Networks in the RuleSet List Defined
Networks category.
Caches/Conclusion Summary of the results available in the Conclusion Cache
in Memory report generated from the Advanced >
Conclusion Cache screen.
The conclusion cache stores Java objects corresponding to
field value rules, properties (not property values), property

SMA Reference Guide Version 6.3 SP1
22
alias rules and class rules. These rule types are not stored
in the rule cache.
Caches/Class Map Class map information is not available on any other screen.
The class map describes class instances and their
relationships, including inheritance, keys, assembler
associations, and database tables where stored.
Class Loader Count and bytes are reported in the Current column in the
Class Summary table on the Advanced > Class Loader
Management screen.

SMA Reference Guide Version 6.3 SP1
23
Chapter 7: Requestor Management
The Requestor Management function displays information about the requestors (users)
running on this node. The toolbar also provides access to the Profiler and Tracer tools for
use with a specific requestor.
The Summary of Requestors shows the count for each of the four types of requestor on this
node —browser, batch, portal, and application. This count information is also made available
on the Memory Management screen. That screen also shows the size in memory of all
requestors of each type.
Requestor Management Toolbar
All Requestors Group
Button Description
Estimate Size The Data Size column in the Requestor Status table registers
zero for all requestors by default. Clicking Estimate Size
refreshes the table to show the estimated size in bytes for each
requestor.
Specific Requestors Group
To execute a command in the Specific Requestor group, select a requestor from the status
report.
Button Description
Clipboard Size Displays requestor data and the estimated data size in KB for this
requestor and all threads. The size estimate is further broken down by
size in KB per thread, and within each thread, by estimated size in KB
per page.
Clipboard Displays the data on the Clipboard for the selected requestor. If the
default security properties file is still in effect, clipboard access is denied.
Refer to publication PRKB-25011, Data Structures, for information on
the Clipboard.

SMA Reference Guide Version 6.3 SP1
24
Performance
Details
Displays PAL statistics for the selected requestor. Refer to PRKB-24177,
Overview of the Performance Tools (PAL), for information on these
statistics.
Details Displays a trace of the operations performed by the selected requestor.
This is a snapshot display that does not update in real time. Access is
denied if the default security properties file is still in effect.
Interrupt Stops the processing of the selected requestor at the beginning of the
next activity step. If the requestor is in an error condition, such as
executing a Java block that is in a loop, this command may be unable to
stop the requestor.
Stop Stops the requestor, removes it from the requestor status display, and
deletes it from the system.
Tracer Starts the Tracer for the selected requestor. Refer to the Tracer section for information.
Start Profiling Starts the Performance Profiler tool, which reports performance details
on activities, When conditions, stream instances, and model instances
for the selected requestor. Refer to Performance Profiler Controls for
information.
Stop Profiling Stops the Profiler.
Stack Trace Displays the stack trace of current active Java thread for the requestor
selected.
Start DB Trace Starts the DB trace for this requestor. The DB trace logs all DB
interactions for by the selected requestor with details like Sequence,
Interaction, Generated, Connection ID, Requestor ID, User, Time (s),
CPU Time (s), Operation, SQL etc.
Stop DB Trace Stops the current DB trace and returns the dump file with all the traced
information.
Requestor Status
Data for all requestors displays in the requestor status report, a portion of which is shown.
Requestor Status Summary Fields
Heading Description

SMA Reference Guide Version 6.3 SP1
25
Requestor Name The unique ID of the requestor. The first character of the name
indicates how the requestor is used: A indicates a listener or
service rule; B indicates a batch requestor, used by agent
processing; H indicates a user (an HTTP interaction); and P
indicates portlet support.
User Name The user ID associated with this requestor. “None” signifies that
this requestor is being used by an agent or other process, or that
the user is not currently logged in.
Application The rule application name—the container of RuleSet names and
versions in this user session.
Last Access The date and time the requestor last performed an operation.
Last Input The last activity or stream that was executed.
Last Thread The last PegaRULES thread in the requestor, such as Developer or
Desktop.
Threads Number of threads associated with this requestor.
Pages The number of named pages on the last thread.
Data Size The size in bytes of the requestor page and all its associated
thread-level pages.
Traced Whether Tracer is enabled for this requestor.
Profiling Whether the Profiler is enabled for this requestor.
Client Address The IP address of the machine sending the requestor information.
If User Name is none, the client address is a process.
Java Thread The thread ID of an active requestor, if the requestor is operating
in the context of a Java thread. The field can be empty if there is
no activity at the time of the snapshot. As one example, SMA on
WebSphere runs on a SOAP connector, and in that case the
thread number in the SOAP connector thread pool is shown in this
column.
Clipboard Size Command Output
The Clipboard Size command displays requestor data, and reports estimated data size in KB
for this requestor and all threads. The size estimate is further broken down by size in KB per
thread, and within each thread, by estimated size in KB per page. The Page column names
the primary page of the request, and the Class column identifies that page’s class. The
Creation Stack column is empty in this screen. Creation stack information is available in the
Clipboard Viewer.

SMA Reference Guide Version 6.3 SP1
26

SMA Reference Guide Version 6.3 SP1
27
Tracer
Use the Tracer to debug flows, activities, services, parse rules, and declarative rules. Use
the Tracer’s controls to configure the session and run the work you want to trace. The
Tracer lists the events of each type specified in your session configuration.
This screen continuously updates as the requestor performs more operations.
For more information on the Tracer, also refer to the Process Commander Help topic,
Debugging with the Tracer Tool.
Tracer Controls
Tracer configuration and operation is controlled from the menu bar. From left to right, the
controls are:
Pause/Play: Toggles between functions; pauses the session being traced, or resumes processing after you have paused it, or after a breakpoint event.
Clear: Clears all events from the tracer session.
Settings: Sets events to trace (for example starts and ends associated with activities or when condition rules), event types to trace (for example Declare Triggers or Stream Rules),
RuleSets to trace, and the maximum number of events to trace. If events exceed the
maximum number, the oldest events fall off the list as new ones are added.
Breakpoints: Sets or changes Applies-To class, activity, and where to break (on all steps or
at a selected step).

SMA Reference Guide Version 6.3 SP1
28
Watch: Watch Variables. Use the watch function to detect when the value of a property
changes, and use the Watch Variables configuration form to set or change the named page and the named property or message to watch.
Remote Tracer: Serves two functions, to display information on the current requestor such
as host or thread, and to select a new requestor from a drop-down list of requestors.
Save: Saves Tracer data as a CSV or XML file.
Tracer Results Display
The Tracer adds a row for each of the events selected in Trace Options and for activities
executing in the selected RuleSets.
Rows with a gray background identify activity processing. Rows with an orange background
identify events from flow, decision, or declarative rules if selected for tracing.
Tracer Output Fields
Column Description
Line Number of events traced, starting at 1 for the first (oldest).
Int The number of this client-server request/response interaction. An interaction can include many sequenced steps.
Rule # Count of distinct activity rules traced. This is not reset to
zero if you clear all the events. When a single activity is re-
executed later, the previously assigned number is
repeated. Rules other than activities are not assigned a
number.
Step Method For an activity, the method in this step. For a declarative
rule or decision rule, indicates the start or end of a
computation. For a when condition rule or Boolean
expression, identifies the rule name or (a portion of) the
expression.
Step Page Name of the step page, or =unnamed= if the Step Page
column of this step is blank.
Step Step number of this step. When two or more rows appear
with the same step number, an iteration is in process at
that step.
Status Status of the method in the step, from the
pxMethodStatus property, such as Good, Fail, or Warn. A
red background marks Fail steps that are not addressed by
a transition. Exit Iteration marks the end of an iteration
step.
In this context, a red Fail row indicates an unhandled
exception condition. If a method returns a Fail status but
the step contains a transition, the Tracer row displays the
status as Good and has a normal gray background. This is
consistent with the processing status passed to the next
activity step, which notes known error conditions.
Watch (Optional column.) Watch Variable properties.

SMA Reference Guide Version 6.3 SP1
29
Event Type Type of event or rule: Step Begin, Step End, Activity End,
Constraint, Expression, DecisionTree, MapValue, and so on.
When Begin and When End events identify the start of a
when condition rule or similar test, such as in a
precondition or transition.
Elapsed For Step End and Activity End rows, elapsed time in
seconds for the step. This time interval may be seriously
degraded by Tracer operation.
Name Full name of the rule being traced as a blue-text link,
showing all key parts.
RuleSet RuleSet and Version containing the rule being traced.
Interacting with Tracer Results
This window supports five types of interactions:
Click within the blue text in the Name field on any row to open the corresponding rule instance
in your portal workspace.
Click the Line, Rule # or Step fields to learn more about the event that caused the row to be displayed, including a Java stack trace if an exception occurred.
Click the Step Page value in a row to review properties on the step page as of the time this
step began.
From the Line display, click the blue ParameterPageName link to see the contents of the
parameter page.
From the Line display, click the blue PrimaryPageName link to see the contents of the primary page.
A blue arrow marks the row of your most recent interaction.
Performance Profiler Controls
The Start Profiling and Stop Profiling buttons control the Performance Profiler, which
produces a detailed trace of activity, when condition, model, and stream rule execution. The
Performance Profiler traces every execution in all threads of rules of these types in all
RuleSets.
This is the same tool that is accessed through the Pega button’s System > Performance >
Performance Profiler menu in the developer portal. To start the Profiler from the
Requestor Manager:
1. Click Start Profiling to initialize the data collector for the selected requestor and
begin data collection to a trace log.
2. Run the activities or other rules to be profiled.
3. Click Stop Profiling.
4. Save trace data to a CSV-formatted file in the PegaRULES temporary directory. Files
are named by the requestor identifier_thread name, for example:
HCF9AC2433F6D7C1FECACEB1F5EE8A0F9_STANDARD.csv.
The Performance Profiler lists items in the order they were completed, and therefore rows
might not be written to the trace file in the order the sequences were started. To see the

SMA Reference Guide Version 6.3 SP1
30
steps in consecutive order for a given interaction, sort on the Sequence column for that
interaction in the output table.

SMA Reference Guide Version 6.3 SP1
31
Performance Profiler Output File Contents
Column Name Description
Sequence Marks the beginning of an activity step.
Interaction The number of this client-server request/response
interaction. An interaction can include many sequenced
steps. Interaction numbers can be used to correlate Profiler
output with Performance Analyzer data.
Activity The internal key (pzInsKey) of the activity, When condition,
or model rule instance involved in this step.
Caller The internal key (pzInsKey) of the class calling the current
activity.
Step For activities, displays the step number. For model rules,
displays M. For stream rules, displays S. For when
conditions, displays W.
Method Name or When
Result
For activities, displays the step method. For when
conditions, displays the true/false status returned by this
call. For stream rules, displays Contributed-Length: n ,
where n is the number of bytes added to the stream by this
step. For model rules, is blank.
Inlined The true/false status returned depending on whether this
when condition or stream rule is inlined (is already rule-
resolved and its assembled Java code is included in the
assembly of a calling rule). The field is blank for activities
and models, which do not use inlined rules.
Total CPU Time Displays the CPU time in seconds for this step, including
calls to substeps.
CPU Time Without
Children
Displays the CPU time in seconds for this step, excluding
calls to substeps. This number is useful for isolating Java
steps which may perform other work in addition to calling
other activities.
Total Wall Time Displays the actual elapsed time in seconds required to
complete this step, including calls to substeps.
Wall Time Without
Children
Displays the actual elapsed time in seconds required to
complete this step, excluding calls to substeps. This number
is useful for isolating Java steps which may perform other
work in addition to calling other activities.
Stack Trace
Displays the Java stack trace of the current active Java thread of the requestor.
DB Trace

SMA Reference Guide Version 6.3 SP1
32
Use the Start DBTrace and Stop DBTrace buttons to control the DB trace for the selected
requestor. The trace produces a detailed record of every DB interaction for the requestor,
including details like interaction number, the actual SQL , the time taken to execute it, CPU
time etc. Like the performance profiler, the outupt is saved to CVS file in the temp directory
of server. The file is named by prefixing the requestor id, for example:
Administrator_pega.com_CC73E6D0C711E8435367EEDE3EA3A214_Developer_20121203T09
4115_029_GMT.txt.

SMA Reference Guide Version 6.3 SP1
33
Chapter 8: System Management
The System Management tool displays the management summary, key information about
the selected PegaRULES node, number of requestor starts, the PegaRULES build, and the
JVM. When calling Pega Support, have this information available for the Support Engineer.
Click to refresh the screen with the most recent information for the selected node.
System Management Toolbar
Click Retrieve System Info to package and prepare for download a zip archive containing
system data and log files. Log files include the date of retrieval in the file name.
This download requires HTTP authentication, and the user running this command must be
assigned the PegaDiagnosticUser role in order to create the zip archive. For information,
refer to the topic Restricting Access with Role-Based Security.
The SMA_INFO ZIP file returned by Retrieve System Info contains the following files.
Data Files Returned by Retrieve System Info Command
System Data File File Content
AgentStatus.xml Content reported on the Agent Management >
Agents summary.

SMA Reference Guide Version 6.3 SP1
34
AuthorizationReport.xml Content reported on the Advanced >
Authorization Management screen.
ClassLoaderSummary.xml Content reported on the Advanced > Class
Loader Management screen.
ConfigurationStatus.xml Content of the node’s prconfig.xml file, this file
is also shown on the Administration >
Configuration Management screen.
ETierRuntimeEnvironment.xml Content reported on the Advanced > ETier
Runtime Environment screen.
ListenerStatus.xml Content reported on the Listener Management
screen.
ModuleVersionReport.xml Content reported on the Advanced > Module
Version Report screen.
RequestorList.xml Content reported on the Requestor Status screen.
RuleAssemblyCacheSummary.xml Content reported on the Advanced > Rule
Assembly Cache Management screen.
RuleCacheSummary.xml Content reported on the Advanced > Rule
Cache Management screen.
RulesetVersionReport.xml A listing of all RuleSet version instances.
SystemSettings.xml
SystemStatus.xml Content reported on this System Status screen.
WebTierRuntimeEnvironment.xml Content reported on the Advanced > Web Tier
Runtime Environment screen.
PegaRULES-Date.log.txt The standard log file reporting system errors,
exceptions (with their stack trace statements),
debug statements, and any other messages not
specified as alerts.
PegaRULES-ALERT-Date.log.txt A log of messages that identify individual events
with adverse performance implications.
PegaRULES-ALERTSECURITY-
Date.log.txt
A log of messages generated when the security of
a Process Commander web node server is at risk.
PegaRULES-SERVICES-PAL-
Date.csv.txt
A trace of service requests and their PAL statistics
by requestor. This log is not created by default
and will not be included in the downloaded if it
was not created in prlogging.xml.
System Summary Information
PegaRULES Node Information
System Management: PegaRULES Node Information
Variable Description
System Name The name of the current node.

SMA Reference Guide Version 6.3 SP1
35
System Node Unique ID System-assigned ID for this node. The ID is a 32-character
string.
System Start Time The date and time that this node was started.
Pulse Last Run The date and time that the system pulse last ran on this
node.
Total Memory The maximum heap size being used by Java at the time of
this report snapshot.
Total Free Memory Within the total available memory, the amount not being
used by Java at the time of this report snapshot.
Production Level Identifies the functional purpose of a system in order to
control access to it. Value is an integer, and valid values are
1 for an experimental system, 2 for development, 3 for test,
4 for pre-production, and 5 for production. A value of 0 or a
blank field indicate that production level is not set on this
node.
Concurrent Sessions
Allowed
Specifies whether concurrent sessions are allowed under the
same user ID on this node. Valid values are None and
Unlimited. A login attempt is rejected if the setting is None
and the user already has an active session.
Number Active Threads The number of active Java threads for this node, as reported
as the number of threads on the Advanced > Web Tier
Thread Management screen.
Number Requestors The number of requestors currently in memory on this node.
Number Agents The number of agents defined for this node that are running,
as indicated by the green check marks on the Agent
Management screen.
Number Listeners The number of running listeners, as reported on the Listener
Management screen.
Number Database
Connections
The number of database connections currently open for this
node, as reported as Connection Counts in the Active
Database category on the Advanced > Database
Management screen.
System Wide Requestor Status
This section of the page tracks how many of each type of requestor have been created in
the system since it was started. There are four types of requestor: those initiated by portlet,
browser, batch, and service.
PegaRULES Build Information
System Management Build Information
Variable Description
Name The name of the build, including any service packs.
Date The date and time when the version was built.

SMA Reference Guide Version 6.3 SP1
36
Major Version The major point release version of the rules code that was installed
(“06” for Version 6.x).
Minor Version The minor point release version of the rules code that was installed
(“02” for Version 6.2).
Build Label The label that was defined for this build.
Java VM Information
Displays a subset of the current system properties for this node’s JVM returned by the
java.lang.System.getProperties() method. Not all properties are implemented by all
JVMs, so some fields might be empty on your System Management summary. In addition,
some fields might be empty if access to this method is restricted on your node.
System Management JVM Information
Property Description of Associated Value
java.version Java Runtime Environment version.
java.vendor Java Runtime Environment vendor.
java.fullversion Java Runtime Environment full version, which differs from
the value returned by java.version by appending a build
number.
java.home Java installation directory.
java.compiler Name of JIT compiler in use.
java.vm.version Java Virtual Machine implementation version.

SMA Reference Guide Version 6.3 SP1
37
java.vm.vendor Java Virtual Machine implementation vendor.
java.vm.info Java Virtual Machine sharing mode, for example mixed.
java.vm.name Java Virtual Machine implementation name.
java.vm.args Runtime environment settings for system properties (the
-Dname settings) and garbage collector options.
os.name Operating system name.
os.arch Operating system architecture.
os.version Operating system version.
file.encoding The character set identifier used in the JVM, for example
Cp1252.
SMA Reference Guide Version 6.3 SP1
38
Chapter 9: Administration
Administration tools include:
Configuration Management
Index Management
Pulse Status
Requestor Pools
Rule Utility Library Extractor
System Usage History
Configuration Management
In Process Commander versions prior to V6.2, this Configuration Management screen
displayed a copy of the prconfig.xml file. However, configuration settings are primarily
loaded from the database instead of prconfig, and as of V6.2 this screen lists configuration
settings, values, and the location where they are set in one table, and bootstrap settings
and values in a second table.
This screen still includes a link to enable the display of the prconfig.xml file.
Configuration Settings
Values for configuration settings are assigned in three different locations:
The prconfig.xml file for the selected node. Its location is
SERVER_HOME/webapps/prweb/WEB-INF/classes/prconfig.xml.
The Data-Admin-System-Settings class, from the database’s pr_data_admin table.
The PRPC engine API, which generates certain settings dynamically if it can’t find them
elsewhere. Examples are initialization parameters and some environment variables. Settings not documented in the Configuration Settings Reference Guide are internal, and should not be
overridden.
The specific settings displayed depend on the configuration settings in use on your system.
For full details on configuration settings, refer to the Configuration Settings Reference Guide
available on the PDN.

SMA Reference Guide Version 6.3 SP1
39
Bootstrap Settings
The second table on the CM screen lists bootstrap settings, which define how the database
is accessed for class loading. Most of these are set in the database, with the remainder set
in the prbootstrap.properties.

SMA Reference Guide Version 6.3 SP1
40
Bootstrap Properties
Setting Value
initialization.settingsource
Determines where the system will look for configuration entries. It
is set in prbootstrap.properties. It is assigned a value of
Merged or File:
Merged: The system checks for settings in both
prbootstrap.properties and the database (Data-Admin-
System-Settings). If a setting is found in both locations, the file
setting value takes precedence. Merged is the default for Version
6.2.
File: The system checks for settings only in
prbootstrap.properties and ignores any database values. File
is the default for Version 6.1 SP2.
com.pega.pegarules.bootstrap.codeset.version.CodeSetName
Specifies that a named CodeSet (a collection of JAR files) should
be available for PRPC use. Two of these are required and are
shown in the sample screen:
Pega-EngineCode: The PRPC Rules Engine.
Customer: The default location for manually developed code.
Others are optional, and are present in the default configuration
to facilitate the installation of PRPC frameworks:
PegaFW-ChannelServices
PegaFW-CPM
PegaFW-HealthCareSPM
PegaFW-Smart Investigate
com.pega.pegarules.bootstrap.allclasses.datasource
SMA Reference Guide Version 6.3 SP1
41
Connection method used to access engine and assembled classes
in the database. JDBC data sources are recommended and
java:comp/env/jdbc/PegaRULES is the default.
The alternative to JDBC is a bootstrap-managed connection for
database access, defined in prbootstrap.properties. If your
implementation uses such a connection, this screen lists additional
variables such as the database connect string, username,
password, and database driver.
propFileLocation Pathname to the prbootstrap.properties file. This is an internal
setting that should not be overridden.
maxActive The maximum number of active connections that can be allocated
from this pool at the same time. The default setting is 10. A
negative value indicates no limit. Ignored if DBCP is not in use.
maxIdle The maximum number of connections that can remain idle in the
pool without extra ones being released. The default is 5
connections. A negative value indicates no limit. Ignored if DBCP
is not in use.
maxWait The maximum number of milliseconds that the pool will wait for a
connection to be returned when MaxActive connections are
already busy before throwing an exception. Set to -1 to wait
indefinitely. The default is -1. Ignored if DBCP is not in use.
poolPreparedStatements Enable/disable prepared statement pooling for this pool. When
enabled, creates a statement pool for SQL PreparedStatements
for each connection. True enables statement pooling, False
disables it. The default is True. Ignored if DBCP is not in use.
Index Management
The Index Management tool identifies the host and node where the index was built.
Note Among the changes introduced in Process Commander’s Find tool in V6.1 were
changes to the process used to generate the initial Rule-, Work-, and Data- class indexes the tool
uses. Prior versions of Process Commander used this SMA Index Management utility to build the
initial indexes. In V6.1, the initial build process is automated, and any subsequent administration
can be performed within Process Commander itself. To open the relevant landing page from the
Pega button, navigate to System > Settings > Search. Documentation is available in the Help
system.
We recommend that you use the landing page in Process Commander for index management
rather than the build tools in this SMA utility.
SMA Reference Guide Version 6.3 SP1
42
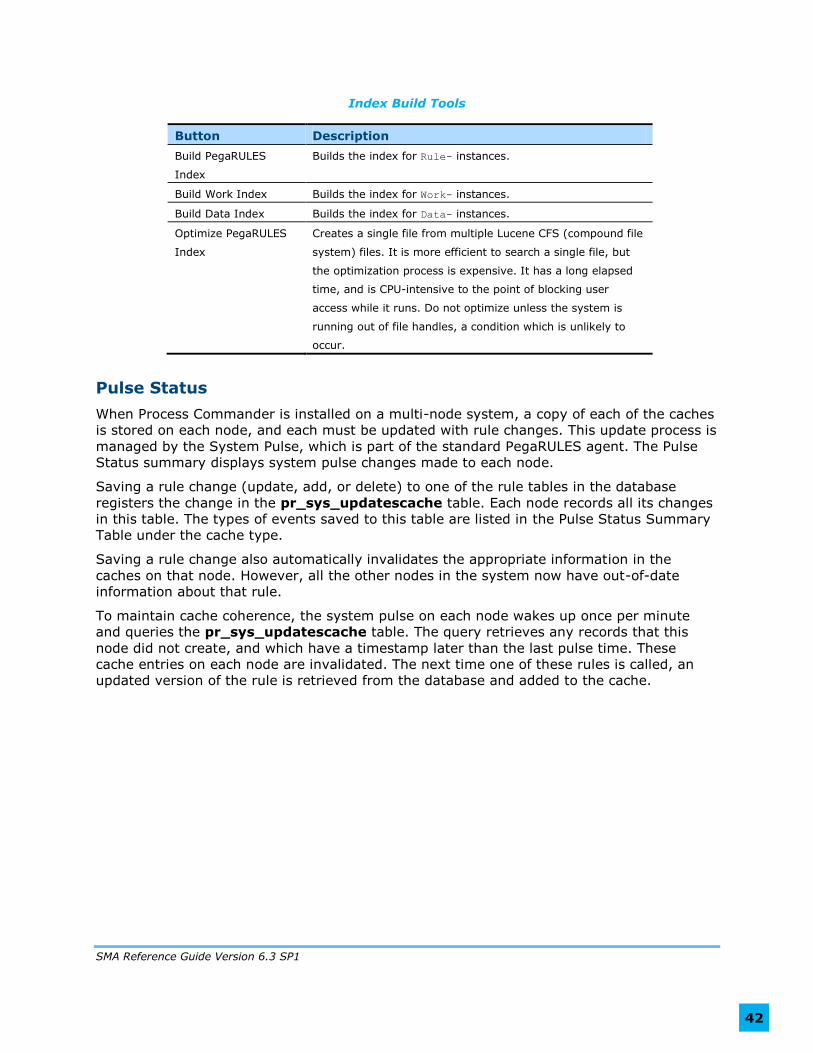
Index Build Tools
Button Description
Build PegaRULES
Index
Builds the index for Rule- instances.
Build Work Index Builds the index for Work- instances.
Build Data Index Builds the index for Data- instances.
Optimize PegaRULES
Index
Creates a single file from multiple Lucene CFS (compound file
system) files. It is more efficient to search a single file, but
the optimization process is expensive. It has a long elapsed
time, and is CPU-intensive to the point of blocking user
access while it runs. Do not optimize unless the system is
running out of file handles, a condition which is unlikely to
occur.
Pulse Status
When Process Commander is installed on a multi-node system, a copy of each of the caches
is stored on each node, and each must be updated with rule changes. This update process is
managed by the System Pulse, which is part of the standard PegaRULES agent. The Pulse
Status summary displays system pulse changes made to each node.
Saving a rule change (update, add, or delete) to one of the rule tables in the database
registers the change in the pr_sys_updatescache table. Each node records all its changes
in this table. The types of events saved to this table are listed in the Pulse Status Summary
Table under the cache type.
Saving a rule change also automatically invalidates the appropriate information in the
caches on that node. However, all the other nodes in the system now have out-of-date
information about that rule.
To maintain cache coherence, the system pulse on each node wakes up once per minute
and queries the pr_sys_updatescache table. The query retrieves any records that this
node did not create, and which have a timestamp later than the last pulse time. These
cache entries on each node are invalidated. The next time one of these rules is called, an
updated version of the rule is retrieved from the database and added to the cache.

SMA Reference Guide Version 6.3 SP1
43
Pulse Status Summary Table
Heading Description
Node Name Displays the node where the change being tracked by System
Pulse originated. The name listed is the unique identifier for each
node (pxProcess.pxNodeUniqueID).
Cache Type The type of event which the system pulse publishes to the system
nodes. The types include:
Cache – changes to the rule cache (that is, changes to the rules).
Index – changes to the indexes that support full-text search.
DELLC – when the lookuplist cache is deleted.
RFDEL – indicate rule-file- deletes.
ECHO – tells all nodes on the system to print a message to the
console.
Create Date/Time The date and time when each change was recorded.
Obj Class The class of the rule being changed. This may not be set for all
cache types, such as ECHO.
Key String The key string (pzInsKey) for the rule instance being changed.
This may be blank for some cache types.
Parameters Other change data which may apply for certain cache types.

SMA Reference Guide Version 6.3 SP1
44
Requestor Pools
In Process Commander, an unauthenticated stateless service uses a collection of requestors
called a requestor pool to handle its service requests. The Requestor Pools tool summarizes
information about existing requestor pools for each service package and provides data
related to Asynchronous Declare Pages (ADP).
Process Commander uses a single user account but may make multiple simultaneous
connections to each external database, on demand. Connections are shared among multiple
requestors, a technique known as connection pooling.
Use the Rules Explorer to review or create Data-Admin-ServicePackage instances (part of
the Integration-Resources category), or from the Pega button, navigate to the Integration >
Resources landing page and select Service Packages to browse service package instances.
Requestor pool information is available on the Service Packages form’s Pooling tab:
Maximum Idle Requestors, Maximum Active Requestors, and Maximum Wait.
ADP Related Data
Displays current data about the performance of Asynchronous Declare Pages enabled in the
system. For compete information about creating, administering, and tuning the performance
of ADP pages, see PDN article 43722: How to configure a non-blocking UI using
Asynchronous Declare Pages.

SMA Reference Guide Version 6.3 SP1
45
Max ADP load request wait time — indicates the maximum amount of time that
any ADP request waited for a requestor. A non-zero number indicates more requests
than requestors.
Max pending ADP request count — indicates the maximum number of ADP
requests waiting in the queue for a requestor, up to this point in time. This does not
apply to application servers that manage their own queue.
Requestor Pool Data
To clear all requestor IDs and reset the requestor count to zero, select a service package
and click Clear Requestor Pool. New requestors are then created as needed.
Service Requestor Pools Summary Fields
Heading Description
ServicePackage The name of the Data-Admin-ServicePackage instance, for
example JSR94Administration.
AccessGroup The Service Access Group specified on the Context tab of the
Data-Admin-ServicePackage instance, for example
PegaRULES:Unauthenticated.
LastAccess The date and time a requestor was last taken from the pool for this
service package.
Idle The number of requestors available for use at the time of the
snapshot.
ADP tuning: indicates how many more concurrent ADP can be
accommodated

SMA Reference Guide Version 6.3 SP1
46
Active The number of requestors currently in use at the time of the
snapshot.
ADP tuning: Indicates how many ADP are currently executing.
The combined value of the Idle and Active fields equals the value
of the Maximum Active Requestors on the AsyncDeclarativePool
Service Package Pooling tab.
MostIdle Over the life of the requestor pool, the greatest number of
requestors that were idle at one time.
ADP tuning: Indicates the minimum load on the system
MostActive Over the life of the requestor pool, the greatest number of
requestors in use at one time.
ADP tuning: Indicates the maximum load on system; the most
ADPs concurrently executing
MaxIdle The maximum number of idle requestors allowed in this requestor
pool. Specified on the Service Package Pooling tab.
ADP tuning: The value of Maximum Idle Requestors on the
AsyncDeclarativePool| Service Package Pooling tab
MaxActive The maximum number of requestors that may be in concurrent
use. Specified on the Service Package Pooling tab.
ADP tuning: The value of Maximum Active Requestors on the
AsyncDeclarativePool Service Package Pooling tab
MaxWait The maximum time in seconds that Process Commander will wait
for a requestor to become active when a service request is pending
and MaxActive requestors are already busy. Specified on the
Service Package Pooling tab.
LongestWait The longest time a service request waited for a requestor to
become available.
Timeouts The number of times the system timed out while waiting for a
requestor to become available.
The value of the following fields should be zero (0):
|Max Wait|
|Longest Wait|
|Timeouts|
A non-zero value in these fields indicates a configuration issue. For web containers that
support APIs for thread management, PRPC automatically sets the maximum threads to
the value of the Maximum Active Requestors specified on the AsyncDeclarativePool
Service Package *Pooling* tab. However, for application servers in which you manually set
the value of the maximum number of threads for the PRPC node, a configuration error, in
which the maximum number of threads is less than the Maximum Active Requestors, is
possible.
Rule Utility Library Extractor

SMA Reference Guide Version 6.3 SP1
47
When creating activities in PegaRULES, functions may be written for one activity that could
be used across many activities. Examples include mathematical, time, or date functions.
These are stored in the class Rule-Utility-Function, which allows custom Java code to be
included and referenced from activities and expressions throughout the system.
Functions are grouped into Java classes, according to the rule utility library in which each
function is defined. The libraries are extracted during PegaRULES startup and made
available to other users.
During some processes, such as importing, the contents of the libraries are not checked. If
the import brings in new rule functions, they may not be implemented, as the library has no
information about them. Therefore, for processes such as imports, it is important to
regenerate (or recompile) all the libraries.
The Rule Utility Library extractor extracts either one or all of the libraries in the node to the
file system. To do this on the Library Extractor screen, enter a RuleSet name, and the
library name for that RuleSet, and click Extract Libraries.
If the operation is successful, the Extractor displays a confirmation message. If either the
RuleSet or the Library Name are incorrect, the Status bar is red, and the Extractor reports it
failed to extract the library.
System Settings
There are two System Setting classes:
Dynamic System Settings: Instances of Data-Admin-System-Settings. They are typically created and set programmatically, and intended for use with autoconfigured data. They are
part of the shippable configuration and may be overridden explicitly by a customer on-site.
They are stored in the database’s pr_data_admin table.
System Settings: Rule-Admin-System-Settings are constants stored in rule instances. These
rules are stored in locked RuleSets that are included in the shippable configuration, and can
be overridden by a customer on-site by changing the rule and saving it into a higher-level RuleSet.
This System Settings screen provides a convenient read-only way for developers and
support personnel to view the current settings.
Only representative portions of the screen are shown here.
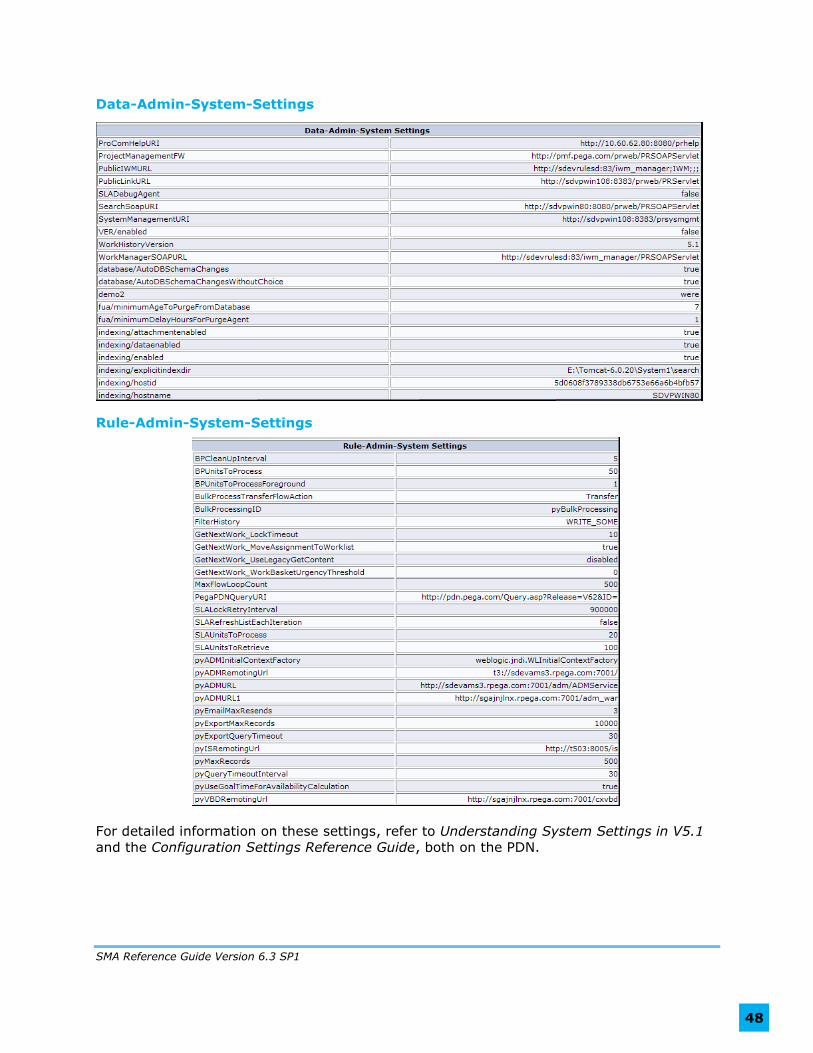
SMA Reference Guide Version 6.3 SP1
48
Data-Admin-System-Settings
Rule-Admin-System-Settings
For detailed information on these settings, refer to Understanding System Settings in V5.1
and the Configuration Settings Reference Guide, both on the PDN.

SMA Reference Guide Version 6.3 SP1
49
Chapter 10: Agent Management
The Agent Management tools collect information about all agents that are running on the
specified node. Note that when an agent is active, it may also be viewed as a requestor
(beginning with “B”) in the Requestor Management screen.
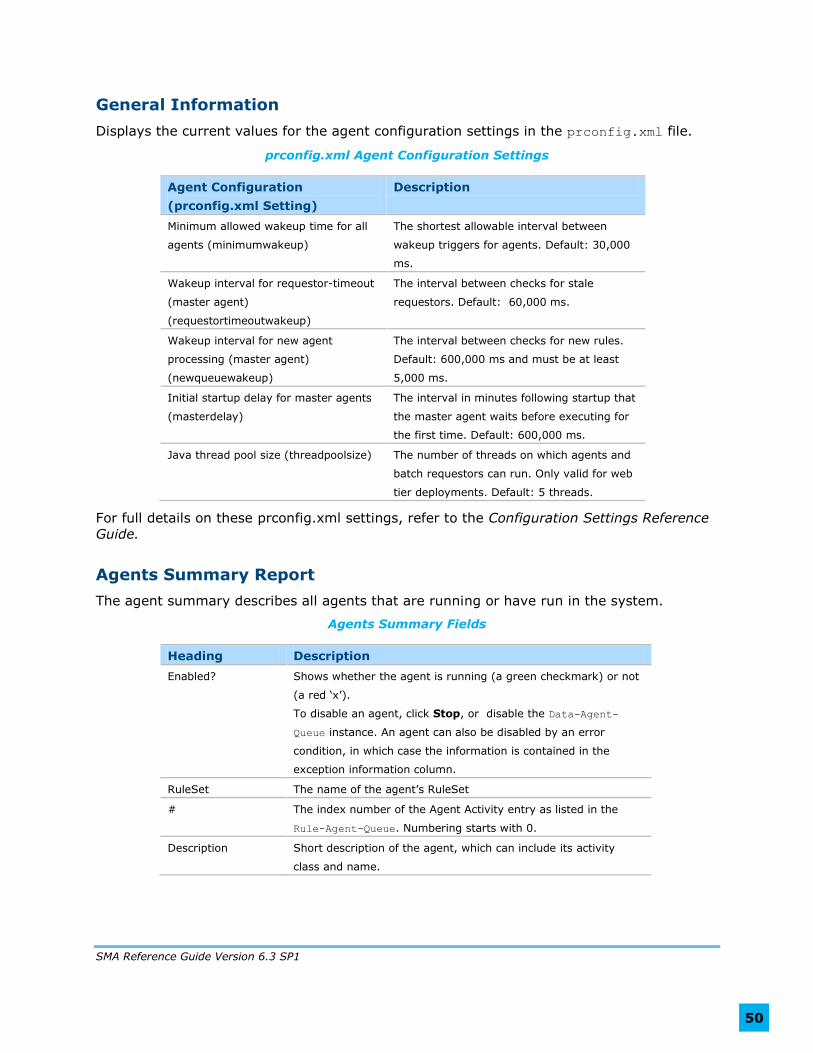
SMA Reference Guide Version 6.3 SP1
50
General Information
Displays the current values for the agent configuration settings in the prconfig.xml file.
prconfig.xml Agent Configuration Settings
Agent Configuration
(prconfig.xml Setting)
Description
Minimum allowed wakeup time for all
agents (minimumwakeup)
The shortest allowable interval between
wakeup triggers for agents. Default: 30,000
ms.
Wakeup interval for requestor-timeout
(master agent)
(requestortimeoutwakeup)
The interval between checks for stale
requestors. Default: 60,000 ms.
Wakeup interval for new agent
processing (master agent)
(newqueuewakeup)
The interval between checks for new rules.
Default: 600,000 ms and must be at least
5,000 ms.
Initial startup delay for master agents
(masterdelay)
The interval in minutes following startup that
the master agent waits before executing for
the first time. Default: 600,000 ms.
Java thread pool size (threadpoolsize) The number of threads on which agents and
batch requestors can run. Only valid for web
tier deployments. Default: 5 threads.
For full details on these prconfig.xml settings, refer to the Configuration Settings Reference
Guide.
Agents Summary Report
The agent summary describes all agents that are running or have run in the system.
Agents Summary Fields
Heading Description
Enabled? Shows whether the agent is running (a green checkmark) or not
(a red ‘x’).
To disable an agent, click Stop, or disable the Data-Agent-
Queue instance. An agent can also be disabled by an error
condition, in which case the information is contained in the
exception information column.
RuleSet The name of the agent’s RuleSet
# The index number of the Agent Activity entry as listed in the
Rule-Agent-Queue. Numbering starts with 0.
Description Short description of the agent, which can include its activity
class and name.
SMA Reference Guide Version 6.3 SP1
51
Mode The mode in which the agent is created. Indicates whether the
agent uses the agent queue capability (introduced in V5.4) to
process items from the agent queue. This feature allows the
agent to temporarily skip over items that fail — for example,
because a needed resource is locked — and try again later to
process the item later.
Legacy — Specifies that this is an agent that was
created in a version prior to V5.4 and has not yet been
updated. This option is not available for agents created
in V5.4 or later.
Standard — Specifies that this agent processes items
from an agent queue and that it relies on the system to
provide object locking and other transactional support.
Advanced — Specifies that this agent uses custom
queuing.
See PDN article 25044: How agent queues work.
Scheduling Displays either the current wakeup interval for the agent, in
milliseconds (for a periodic agent), or the description of settings
chosen for the next time the Agent Activity runs, which can be a
string like “daily, weekdays only” (for a recurring agent).
Last run start The start time of the last run for this Agent Activity.
Last run finish The end time of the last run for this Agent Activity.
Next run time The next time this Agent Activity is scheduled to run.
Exception
information
Any exception information that was generated when the Agent
Activity was disabled due to an error.
Agent Management Toolbar
Agent commands are listed in three groups, for working with a single activity, all activities,
and listing rules.
Single Activity in Queue
Single activity commands operate on a single agent. Select a RuleSet and a single agent, for
example Pega-ProCom and ServiceLevelEvents, and the command returns data describing
just that agent.
Button Description
Start Starts the selected agent activity.
Stop Stops an agent activity that is currently running; sets the
Enabled column to false, and prints an exception in the Exception
Info column
Restart Stops the selected agent activity and then restarts it.
isAlive Shows the RuleSet name, queue number, and enabled status
(true or false) for the selected agent activity.
SMA Reference Guide Version 6.3 SP1
52
Query Displays information on the selected agent activity. It shows the
same information as the complete summary, but it isolates it in
its own window on the bottom of the screen.
Delay Delays the next start of this activity to permit Tracer startup. The
execution of an Agent Activity can go by too fast to enable the
Tracer. This button sets the Agent Activity’s status to waiting.
When the Tracer is enabled, the activity can be started.
All Activities in Queue
The All Activities commands, which operate on all activities in a RuleSet’s queue, are
functionally similar to the single activity commands. Selecting any single activity in effect
selects all activities for that RuleSet queue. Select a RuleSet and a single agent, for example
Pega-ProCom and ServiceLevelEvents, and the command returns data describing all Pega-
ProCom agents, and not just the selected one.
Button Description
Start Starts all agent activities in a RuleSet queue.
Stop Stops all agent activities in a queue or RuleSet that are currently
running; for each activity in the RuleSet, sets the Enabled column
to false, and prints an exception in the Exception Info column
Restart Stops and then restarts all agent activities in a queue or RuleSet.
isAlive Shows for a selected agent activity whether all queued agent
activities for that RuleSet are enabled or disabled.
Query Displays information on all agent activities in a queue or RuleSet.
For example, selecting one activity in the Pega-RULES queue (in this case, 1) and executing
the All Activities in Queue > Query command splits the screen. All activities, enabled or
disabled, are included.

SMA Reference Guide Version 6.3 SP1
53
Other Commands
The Query RuleSets command lists the names of all RuleSets for all agents. Scanning this
list is a quick way to see whether there is a problem with agents from a particular RuleSet.
If there are no agents from one RuleSet, there may have been an issue with that Rule.
System Queue Management
A system queue is a queue of work to be done by an agent. System-Queue- is the queue
base class. Items sent to a queue are added to the database table pr_sys_queues. Entries
for all agent tasks are stored in this queue, and identified by the agent RuleSet (which is
also the name of the Agents rule) and the agent name. Items in the queue are assigned one
of five statuses.

SMA Reference Guide Version 6.3 SP1
54
Use the System Queue Management tool to diagnose agent processing problems, for
example to follow the life cycle of items when developing a new agent.
System Queue Status Values
Queue State Description
Scheduled An item has been created by a flow, activity, etc. and sent to
the queue, where it is waiting to be processed. No action has
been taken yet.
Broken-Process The agent tried to process an item but encountered an error.
The item is moved to Broken-Process for analysis.
Immediate An item has been created and sent to the queue, for
processing by a queued integration service component.
Now-Processing The item is locked and being worked on by an agent.
Success Item processing completed. Normally this status is not used in
production, as the general practice is to discard completed
items rather than save them in the database .
System Queues Summary
Column Description
Item Count Queue size for this status.
Queue Classes Number of classes represented by the queued items.
Oldest Item Time the first item was added to the queue.
Newest Item Time the last item was added to the queue.
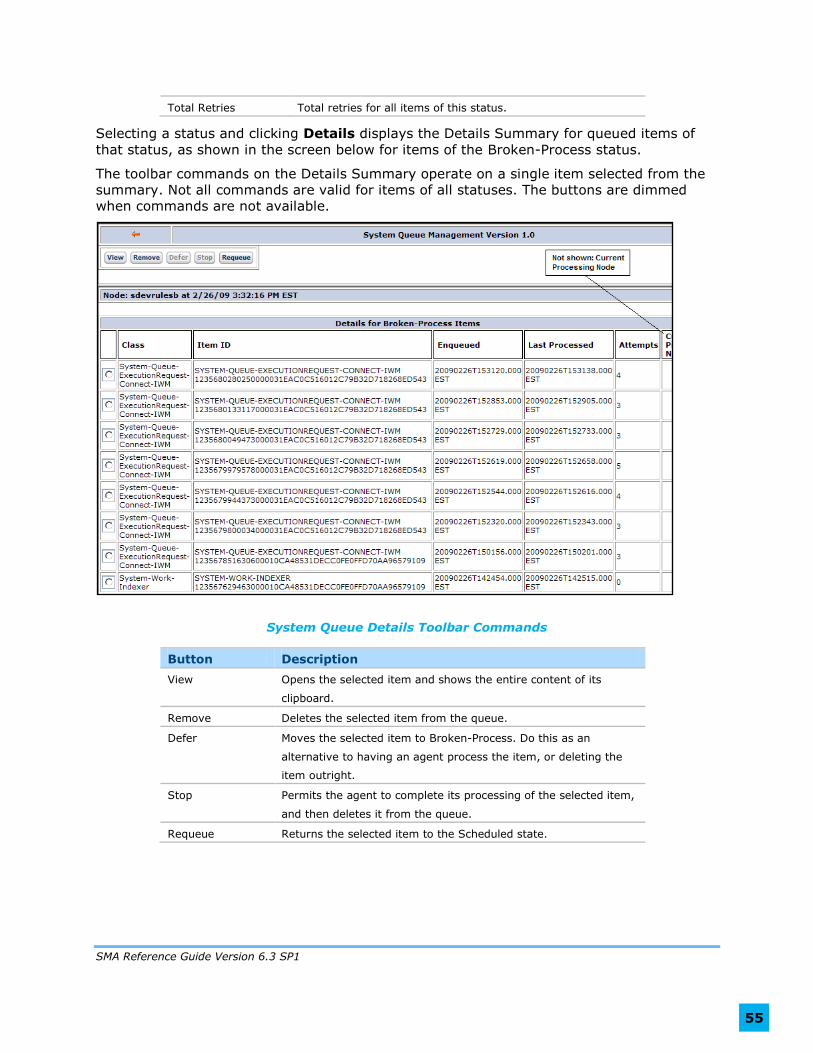
SMA Reference Guide Version 6.3 SP1
55
Total Retries Total retries for all items of this status.
Selecting a status and clicking Details displays the Details Summary for queued items of
that status, as shown in the screen below for items of the Broken-Process status.
The toolbar commands on the Details Summary operate on a single item selected from the
summary. Not all commands are valid for items of all statuses. The buttons are dimmed
when commands are not available.
System Queue Details Toolbar Commands
Button Description
View Opens the selected item and shows the entire content of its
clipboard.
Remove Deletes the selected item from the queue.
Defer Moves the selected item to Broken-Process. Do this as an
alternative to having an agent process the item, or deleting the
item outright.
Stop Permits the agent to complete its processing of the selected item,
and then deletes it from the queue.
Requeue Returns the selected item to the Scheduled state.

SMA Reference Guide Version 6.3 SP1
56
Queue Details for a Single Status
Column Description
Class Class of the queued item.
Item ID Program-assigned item ID.
Enqueued Time the item was created in the database table
pr_sys_queues.
Last Processed Last time this item was processed.
Attempts Number of times the agent has attempted to complete this
process.
Current Processing
Node
Valid only for items in the Now-Processing state; the ID of the
node doing the work.
SMA Reference Guide Version 6.3 SP1
57
Chapter 11: Logging and Tracing
Logging and tracing functions include:
Garbage Collector and Log Usage
Global DB Trace Management
Log Files
Logging Level Settings
Remote Logging
Remote Tracing
Garbage Collector and Log Usage
How a system handles garbage collection is a key function to check when troubleshooting
performance. If symptoms are non-specific (“the system is slow”), start with this
examination of garbage collection and log usage statistics to see the system’s overall
behavior.
Garbage collection time is essentially CPU processing time, and the garbage collection
process can consume all CPU resources and force the system to actually suspend user
processing in the meantime. The impact on performance can be significant.
You can view your system’s garbage collection settings in the Java VM section of SMA’s
System Management screen.
Key Concepts for Garbage Collection
Garbage collection removes objects from memory which are no longer referenced. When the
garbage collector runs, it reclaims the memory allocated to these objects.
As a process, garbage collection is done either concurrently with other processing, or by
superseding all other processing with the “stop-the-world” method. “Stop-the-world”
garbage collection is more efficient, and is the default in most JVMs.
Sun JVMs have two sections of memory:
Major, for objects which have a long lifetime (tenured, or permanent, objects).
Minor, for objects which have a short lifetime (new objects).
Starting with IBM Java 5, an optional generational concurrent garbage collector is available
that splits memory into a nursery and tenured area. IBM JVMs do not differentiate between
objects for garbage collection.
Minor garbage collections are frequent in systems that perform them. They are fast and
inexpensive in terms of system resources. A major (full) garbage collection takes more time
and consumes more system resources.
To gather worthwhile GC data, turn on the verbose option and direct the output to a file in
your location of choice. For an Oracle/Sun JVM, add the timestamp and details options.
Recommended garbage collection switches for this JVM include:

SMA Reference Guide Version 6.3 SP1
58
-XX:+PrintGCTimeStamps –XX:+PrintGCDetails –Xloggc:pathToLog –verbose:gc
Example:
-XX:+PrintGCTimeStamps –XX:+PrintGCDetails –Xloggc:d:\pr_temp\gc.log
–verbose:gc
An IBM JVM requires fewer options than Oracle/Sun:
–Xverbosegclog:pathToLog –verbose:gc
For more information, refer to the Oracle/Sun and IBM JVM websites:
http://www.oracle.com/technetwork/java/javase/downloads/index.html
http://www.ibm.com/developerworks/java/jdk/docs.html
Garbage Collector and Log Usage Toolbar
Setting up garbage collection and log usage statistics collections entails identifying log file
names and start and stop times for the collection.
Garbage Collector and Log Usage Toolbar Commands
Button Description
View Displays the data in the time slice requested.
Collect Forces an explicit garbage collection. We recommend you use this
function for debugging only, as it is generally preferable for the
JVM to perform garbage collection on its own. Collect is used
only with garbage collections, and is dimmed when Log Usage
Statistics is chosen.
CSV Creates a CSV file of the requested data for download.

SMA Reference Guide Version 6.3 SP1
59
To set up a collection define a start and end time, and specify a GC log file and/or a node ID
or host name.
GC Log File: The full path to the garbage collection log output file. If the location of the log file is included in the JVM options specified when starting the application server, this setting will
default to that log file path.
Node ID or Host Name: Select either a single node or a host (server), if multiple nodes are running on the same server and you want the cumulative value for all nodes. SMA auto-fills
these fields for the current instance.
JVM Start Time: The start time of the system JVM. SMA automatically inserts the start time in this field.
Start Time: The start time of this data collection. SMA automatically inserts the JVM start time
in this field.
Stop Time: The end time of this data collection. SMA automatically inserts the time the form
was displayed in this field.
Garbage Collector Statistics
Clicking View organizes data in the log file that is generated by the –verbose:gc JVM
parameter in hourly segments. The verbose:gc output must be enabled in the JVM.
Garbage Collector Statistics
GC Statistic Description
JVMStartTime The system JVM start time.
StartTime The data collection start time.
StopTime The data collection end time.

SMA Reference Guide Version 6.3 SP1
60
TotalNumberOfCollections The total of all garbage collections on this JVM/node
over the specified time period.
TotalNumberOfMajorCollects The number of major (full) garbage collections on this
JVM/node over the specified time period.
TotalNumberOfMinorCollects The number of minor garbage collections on this
JVM/node over the specified time period.
TotalStorageFreed The space in bytes released in this JVM/node by all
garbage collections in the specified time period.
MajorStorageFreed The space in bytes released in this JVM/node by
major garbage collections in the specified time
period.
MinorStorageFreed The space in bytes released in this JVM/node by
minor garbage collections done in the specified time
period.
TotalCollectionTime The time in seconds required by all garbage
collections in this JVM/node in the specified time
period.
MajorCollectionTime The time in seconds required to do the major garbage
collections in this JVM/node in the specified time
period.
MinorCollectionTime The time in seconds required by minor garbage
collections in this JVM/node in the specified time
period.
ElapsedTime The time in seconds in the time slice specified.
FinalCollectTime The time of the last garbage collection in this
JVM/node.
CollectionElapsedTime Percentage A comparison of the elapsed time to the total collect
time. If the system spends more than three percent
of its processing time on garbage collection, it is
considered excessive, and a problem exists
somewhere in the system setup. Check this
measurement, and if it is high, look at the other
collection times to see the collection pattern.
The aggregated Hourly Garbage Collection Statistics show the pattern of garbage collection
over time. If the workload on the system is consistent, then the garbage collection should
also be consistent. If the workload is consistent but there is a spike in the garbage
collection, that should be investigated to see what kind of processing caused the spike.
Hourly Garbage Collection Statistics
Heading Description
Hour The hour (or portion of the hour) included in the specified time
period.
Number of GC The Total Number of Collections performed during this hour.
Amount The Total Storage Freed, in bytes, for this hour.
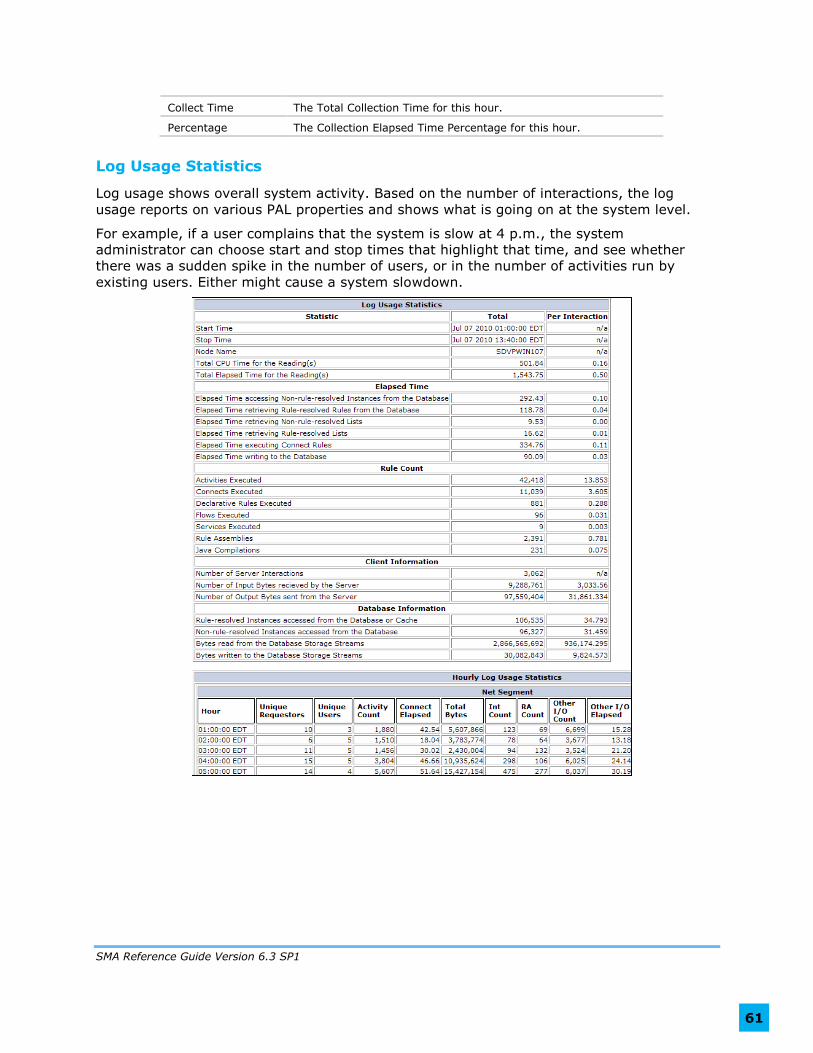
SMA Reference Guide Version 6.3 SP1
61
Collect Time The Total Collection Time for this hour.
Percentage The Collection Elapsed Time Percentage for this hour.
Log Usage Statistics
Log usage shows overall system activity. Based on the number of interactions, the log
usage reports on various PAL properties and shows what is going on at the system level.
For example, if a user complains that the system is slow at 4 p.m., the system
administrator can choose start and stop times that highlight that time, and see whether
there was a sudden spike in the number of users, or in the number of activities run by
existing users. Either might cause a system slowdown.
SMA Reference Guide Version 6.3 SP1
62
Log Usage Cumulative and Per Interaction Statistics
Heading Description
StartTime The data collection start time.
StopTime The data collection end time.
Node Name Node name.
Total CPU Time for the
Reading(s)
Time in seconds required for actual statistics
collection. The underlying property is pxTotalReqCPU.
Total Elapsed Time for the
Reading(s)
Time in seconds in between the start and stop times.
The underlying property is pxTotalReqTime.
Elapsed time accessing non-rule-
resolved instances from the
database
Indicates the total time Process Commander spent
performing immediate commit database operations
(such as delete, save, or open) for all non-rule-
resolved instances. The underlying property is
pxOtherIOElapsed.
Elapsed time retrieving rule-
resolved Rules from the database
Reports the total time spent opening rules for the
Rule Resolution process, which includes getting all
versions of the Rules, and determining the best rule
for use. The underlying property is pxRuleIOElapsed.
Elapsed Time retrieving Non-rule-
resolved Lists
Measures the elapsed time spent generating lists of
objects which descend from classes other than Rule-.
The underlying property is pxOtherBrowseElapsed.
Elapsed Time retrieving Rule-
resolved Lists
Measures the elapsed time spent generating lists of
instances of classes that descend from Rule-. The
underlying property is pxRuleBrowseElapsed.
Elapsed time executing Connect
Rules
Tracks the total time spent waiting for a response
from an external system (time spent during Rule-
Connects). The underlying property is
pxConnectElapsed.
Elapsed time writing to the
Database
Tracks the total time spent on deferred (explicit)
commit operations including saves and deletes. The
underlying property is pxCommitElapsed.
Activities executed Indicates the number of Activities started by a given
Requestor. This count is incremented when any
Activity has started. The underlying property is
pxActivityCount.
Connects executed Indicates the number integration services connections
(Rule-Connect- instances) to external systems that
were attempted. The underlying property is
pxConnectCount.

SMA Reference Guide Version 6.3 SP1
63
Declarative Rules executed Indicates the number of times that any Declarative
rules were invoked, or that a chaining rule was
executed (an Expression was computed, a Constraint
was run, an OnChange Activity was run). The
underlying property is
pxDeclarativeRulesInvokedCount.
Flows executed Indicates the number of flows started by a given
requestor. This count is incremented when any flow
has started. The underlying property is pxFlowCount.
Services executed Indicates the number of times a Rule-Service- rule is
activated from outside the system. The underlying
property is pxServiceCount.
Rule assemblies Indicates the number of times that a Java class was
generated (assembled) for this requestor. The
underlying property is pxJavaAssembleCount.
Java compilations Indicates the number of times that Java classes were
compiled for rules assembly. The underlying property
is pxJavaCompileCount.
Number of Server Interactions Indicates the number of requests made to the server
by this requestor in this session. The underlying
property is pxInteractions.
Number of Input Bytes Received
by the Server
Reports the uncompressed size in bytes of the HTML
data sent to the PegaRULES servlet (PRServlet) on
the server from the client requestor (user’s browser)
via HTTP. The underlying property is pxInputBytes.
Number of Output Bytes sent
from the Server
Reports the uncompressed size in bytes of the HTML
and XML data sent from the PegaRULES servlet
(PRServlet) on the server to the user’s browser (the
client or requestor) via HTTP. This does not include
data sent as static content, such as image files or
Javascript. The underlying property is
pxOutputBytes.
Rule-resolved Instances accessed
from the Database or Cache
Tracks the number of attempts made to open a Rule
during Rule-Resolution processing. The underlying
property is pxRuleCount.
Non-rule-resolved instances
accessed from the database
Tracks the number of times that Process Commander
performs a database operation (such as delete, save,
or open) for all non-rule-resolved instances. The
underlying property is pxOtherIOCount.
Bytes read from database
Storage Streams
Reports the size in bytes, after decompression, of all
data read-in from the Storage Stream column
(pzPVStream) in the database. The underlying
property is pxDBInputBytes.

SMA Reference Guide Version 6.3 SP1
64
Bytes written to database
Storage Streams
Reports the size in bytes, before compression, of all
data written to the Storage Stream column
(pzPVStream) in the database. The underlying
property is pxDBOutputBytes.
The hourly log usage statistics shown in the hourly usage panel are based on the same
properties as the cumulative statistics, broken down by hour.
Hourly Log Usage Statistics
Heading Description
Activity Count Same as Activities Executed, from the Cumulative
Statistics table.
Connect Elapsed Same as Elapsed Time Executing Connect Rules, from
the Cumulative Statistics table.
Total Bytes Total I/O on the client browser: Same as the Number
of Input Bytes Received by the Server plus the
Number of Output Bytes sent from the Server, from
the Cumulative Statistics table.
Int Count Same as the Number of Server Interactions, from the
Cumulative Statistics table.
RA Count Same as Rule Assemblies, from the Cumulative
Statistics table.
Other I/O Count Same as Non-rule-resolved instances accessed from
the database, from the Cumulative Statistics table.
Other I/O Elapsed Same as Elapsed time accessing non-rule-resolved
instances from the database, from the Cumulative
Statistics table.
Rule Count Same as Rule-resolved Instances accessed from the
Database or Cache, from the Cumulative Statistics
table.
Rule I/O Elapsed Same as Elapsed Time Retrieving Rule-Resolved
Rules from the Database, from the Cumulative
Statistics table.
Total CPU Same as Total CPU Time for the Readings, from the
Cumulative Statistics table
Total Elapsed Same as Total Elapsed Time for the Readings, from
the Cumulative Statistics table.
Unique Requestors Number of unique requestors active during this hour.
Comparing Garbage Collector and Log Usage Statistics
The combined view of garbage collector and log usage statistics allows a comparison of the
two sets of statistics and how they relate to each other. Use the data to determine how the
level of garbage collection relates to activities being run, whether a spike in garbage
collection is paralleled by a spike in processing, or whether growth rates across the two
areas are consistent or divergent.

SMA Reference Guide Version 6.3 SP1
65
The only unique data provided on the combined view are the Score Card values. The score
card ratios defined in the following table are per-interaction indicators.
Garbage Collection/Log Usage Per Interaction Score Card Summaries
Heading Description
Interactions Total client-server request/response interactions in
this collection period.
Server Response per Interaction Server response time per server interaction.
Traffic with Browser per
Interaction
A measure of client traffic: the Number of Input Bytes
Received by the Server plus the Number of Output
Bytes sent from the Server, from the Cumulative
Statistics table, divided by 1024 to derive the traffic
total in Kbytes, divided by the Number of Server
Interactions.
CPU per interaction Amount of CPU time per server interaction.
GC per interaction Number of garbage collections per server interaction.
DB commit per interaction Number of Pega-explicit database commits per server
interaction.
Global DB Trace Management
Prior to Process Commander V6.2, running a DBTrace on every requestor in the system
entailed editing the prconfig.xml file to add the necessary settings, and restarting the
system. This functionality was added to SMA in V6.2, eliminating the need to edit
prconfig.xml for this purpose.
SMA Global DB Trace Management consolidates the functions of three database settings
used in prconfig.xml: and documented in the Configuration Settings Reference Guide:
database/dumpStats: turns the trace on and off, directs output to the tracer file.
database/traceEvents: selects the database events to trace.
database/dumpStackTrace: selects the database events for a stack trace, which captures the
sequence of functions being called each time the selected events occur.
The Global Database Trace Events screen lists events that can be logged or included in a
stack trace. The screen shot shows a representative portion of the screen, while the table
following it lists all traceable events.
To run a global DB trace or generate a stack trace of events,
1. Select the events you want to trace by checking or unchecking the boxes.
2. Click Start Global DB Tracing.
3. Return to your application and run the process to be traced. The specified data are
directed to the trace file.
4. When process execution is complete, return to this SMA screen and stop the trace.
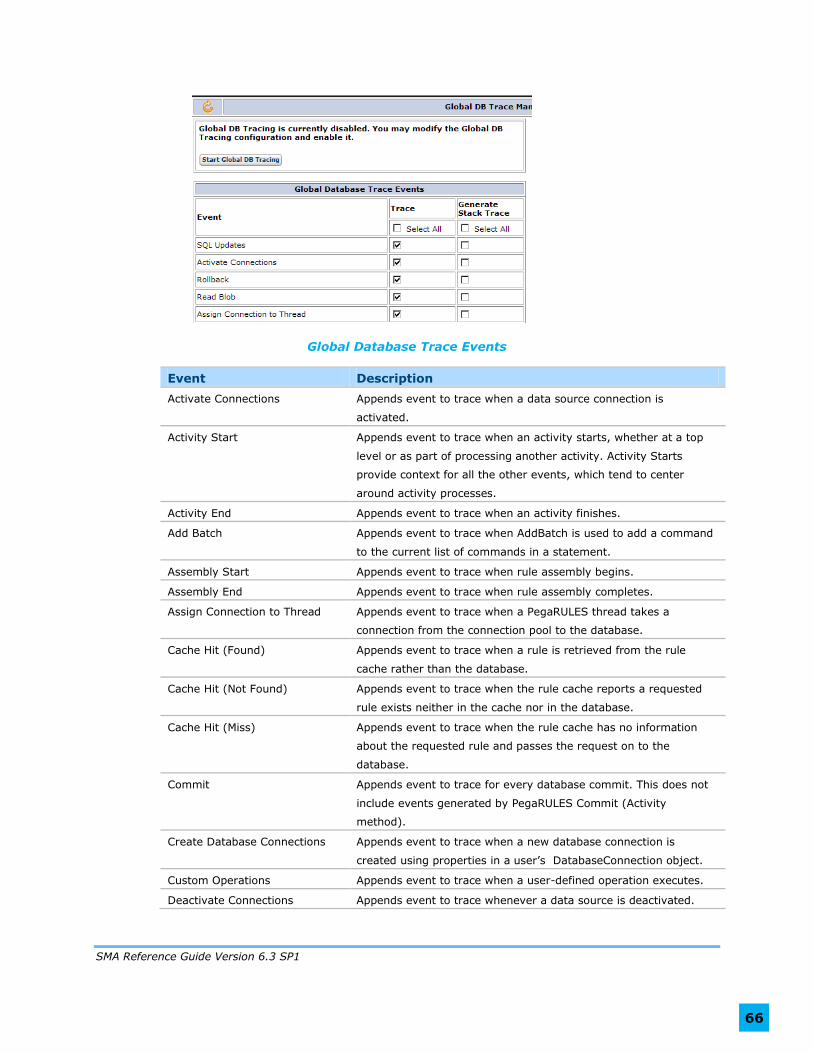
SMA Reference Guide Version 6.3 SP1
66
Global Database Trace Events
Event Description
Activate Connections Appends event to trace when a data source connection is
activated.
Activity Start Appends event to trace when an activity starts, whether at a top
level or as part of processing another activity. Activity Starts
provide context for all the other events, which tend to center
around activity processes.
Activity End Appends event to trace when an activity finishes.
Add Batch Appends event to trace when AddBatch is used to add a command
to the current list of commands in a statement.
Assembly Start Appends event to trace when rule assembly begins.
Assembly End Appends event to trace when rule assembly completes.
Assign Connection to Thread Appends event to trace when a PegaRULES thread takes a
connection from the connection pool to the database.
Cache Hit (Found) Appends event to trace when a rule is retrieved from the rule
cache rather than the database.
Cache Hit (Not Found) Appends event to trace when the rule cache reports a requested
rule exists neither in the cache nor in the database.
Cache Hit (Miss) Appends event to trace when the rule cache has no information
about the requested rule and passes the request on to the
database.
Commit Appends event to trace for every database commit. This does not
include events generated by PegaRULES Commit (Activity
method).
Create Database Connections Appends event to trace when a new database connection is
created using properties in a user’s DatabaseConnection object.
Custom Operations Appends event to trace when a user-defined operation executes.
Deactivate Connections Appends event to trace whenever a data source is deactivated.

SMA Reference Guide Version 6.3 SP1
67
Get Database Metadata Appends event to trace when the database is queried specifically
for table metadata. When a database table is queried, the cache
WHICH CACHE? is checked to see if metadata describing the table
(exposed columns, existence of Blob column, etc.) are available,
and if not, the database is queried for it. In a running system,
most of the table information should be cached, and many events
of this type in the DBTrace could indicate a caching issue.
List Result Count Appends a message to the trace file that reports the number of
results returned by calling Obj-List.
Package Results Appends event to trace when a database package returns a result
set.
Read Blob Appends event to trace when a blob column entry (the Storage
Stream) is read from the database. This event also reports the size
of the compressed data in the Storage Stream.
Return Database Connections Appends event to trace when a database connection is released.
Reuse Database Connections Appends event to trace when a database connection is reused.
Rollback Appends event to trace when an error occurs during a PegaRULES
commit and the transaction is rolled back.
Run List Appends event to trace when the Obj-List rule is called. This rule
corresponds to the listAPI method in Java.
SQL Appends event to trace when a SQL prepared statement is
executed.
SQL Queries Appends event to trace when a SQL query statement is executed.
SQL Updates Appends event to trace when a SQL table update statement is
executed.
Write Blob Appends event to trace when a blob column entry is written to the
database. This event also reports the size of the compressed data
in the Storage Stream.
Output is written to a file in the ServiceExport directory, using the naming convention of
dbOperations_datetime.txt, for example dbOperations_20110726T172956_473_GMT.txt.
The location of the ServiceExport directory varies by server type. For example, for Tomcat
the pathname is:
/Tomcat_Home/work/Catalina/localhost/prweb/StaticContent/global/ServiceExport.
Stack traces produce large volumes of information and can affect performance, and should
be used sparingly. Collecting stack traces for all events will degrade performance to
unusable levels.
Log Files
There are four PegaRULES log files:
PegaRULES-Date.log contains information on system startup and shutdown, as well as fatal
error messages.

SMA Reference Guide Version 6.3 SP1
68
PegaRULES-ALERT-Date.log contains messages which identify individual performance-related
problems in the PegaRULES system, for example that a threshold was exceeded, a process failed to start or a query took too long to return. Performance alerts in this file are named
PEGAnnnn.
PegaRULES-ALERTSECURITY-Date.log contains security alerts that are generated when the security of a Process Commander web node server is at risk. Alerts in this file are named
SECUnnnn.
PegaRULES-SERVICES-PAL-Date.csv is a trace of service requests and their PAL statistics by requestor, to assist developers in debugging services. This log is not created by default. Use
the SERVICES-PAL file appender in the prlogging.xml file to create this log file and set its
logging level.
In these filenames, the date format is yyyy-mmm-dd.
The prlogging.xml file determines what information goes into which log.
To download log files, choose either text or zip format to start the download. Selecting the
zip for all logs adds all three log files to a zip archive and starts the download.
Logging Level Settings
Process Commander uses the logging scheme developed for the Apache log4j project, with
an additional Process Commander-specific logging level added. Logging level defaults are
specified in the prlogging.xml file, but the logging configuration can be reset at runtime
using this Logging Level Settings tool.
Logging can be set for a specific Java class, for a rule instance, or for a rule type.
To set the logging level:
1. In the Logger field, choose the Java class or rule to be logged. The example sets the
level for the JVM Notification Manager.
2. The dropdown list in the Logger field shows only the classes which are currently
instantiated. If the item to be logged is not listed here, enter it manually.
3. Click Get Current Level to see the current level setting for that logger. The level is
displayed in a screen message as shown.
4. Choose a new level from the drop-down list and click Set Level.
Logging level can also be set on the Developer portal’s Tools menu, Logging Level Settings.
ResetAll resets logging to the defaults specified in the prlogging.xml file.

SMA Reference Guide Version 6.3 SP1
69
The priority levels, in decreasing order of severity, are:
OFF: Turns off all logging for a specific logger.
FATAL: Severe errors that can lead the application to abort.
ERROR: Serious errors that might allow the application to continue running.
ALERT: Pega-specific messages that indicate a preset performance threshold has been
exceeded, or that an event has occurred that has an adverse performance implication.
WARN: Designate potentially harmful situations.
INFO: Informational messages describing the application at coarse-grained level.
DEBUG: Fine-grained informational events useful in debugging.
ALL: Turns on all logging for a specific logger.
Messages at or above the specified priority are included in the output. For example,
specifying ERROR logs all messages of priority levels ERROR and FATAL.
If the logging level for a rule or Java class is neither specified in the prlogging.xml file nor
set at runtime, the logger assigns it the default root log setting of ALERT.
Remote Logging
Remote Logging uses LogFactor5, a log4j socket server, to direct the standard PEGA log
messages to an SMA node before writing them to a file. It allows an administrator to see
messages in real time, while a service or process is being run.
To set up remote logging, it is necessary to download, install, and run the LogFactor5 socket
server.
1. Click Remote Logging if necessary to see a screen like that shown below.
2. Click the download link (“click here”), circled in red.
3. Save the file (SocketServer.jar) to your local drive and unzip it. It contains a jar
file, properties file, and command file, and they can reside in the same directory.
Make a note of the extract directory so you can locate the startSocketServer.cmd
file. This file starts the LogFactor5 window that displays the contents of the log.

SMA Reference Guide Version 6.3 SP1
70
4. Create a shortcut for the startSocketServer.cmd file and place it on your desktop,
and start LogFactor5 with the shortcut.
Start LogFactor5 before adding your node to the active logger list. To add the node:
1. Enter the name of node you want to monitor in the Remote host field.
2. In the Remote port field, enter the TCP/IP port number on the node where log4j will
listen. The default port is 8887.
3. The Filter string is optional. For example, you can define a server name as the filter
string to display only those messages involving the named server.
4. Click Add.
The node name and port number are listed as an active logger, will remain there until the
Process Commander system is restarted.
The LogFactor5 window shown here does not show the actual log message, which is located
on the far right side of the display.
LogFactor5 Log Record Attributes
Heading Description
Date Message timestamp.
Thread The thread where the message was generated, for example,
http-8080-1, or PegaRULES-MasterAgent.
Number Message number in the queue.

SMA Reference Guide Version 6.3 SP1
71
Level The log4j logging level. As the PegaRULES ALERT level is not
defined by log4j, PegaRULES alerts are reported as WARN
messages.
NDC The Nested Diagnostic Content value used to differentiate
messages from multiple active loggers. This is the filter string
entered on the Remote Logging setup screen.
Category The message level in the Logger Explorer hierarchy.
Message Log message content. A Pega ALERT message can be
identified by the content of this field; the identifier appears
early in the message, for example:
2009-03-04 21:43:39,908 GMT*6*PEGA0005
Location The method that is logging the message.
Thrown Lists any Java exception thrown.
To enable remote logging for all nodes in a system, select each in turn and add it to the
active logger list. One or more loggers can be removed with the Remove or RemoveAll
commands.
Remote Tracing
The Tracer tool monitors an individual requestor session, tracking the execution of rules.
When testing a connector rule, you can start the Tracer for that requestor session before
running the connector, so the Tracer can capture session information about the connector’s
actions from the moment it starts. Because a connector runs in a requestor session, Tracer
is started from the Requestor Management utility.
A service usually runs in a new requestor session with a requestor ID that is not created
until the service begins processing. Therefore, it can be difficult to trace a service from its
starting point; by the time the requestor appears on the Requestor Management list, the
service has finished executing.
If the service is set up to use an authenticated user ID (an authenticated service), that user
ID can be traced with a user watch.
If a service is unauthenticated, it cannot be identified by either a requestor ID or a user ID,
but the service rule can be traced using a rule watch.
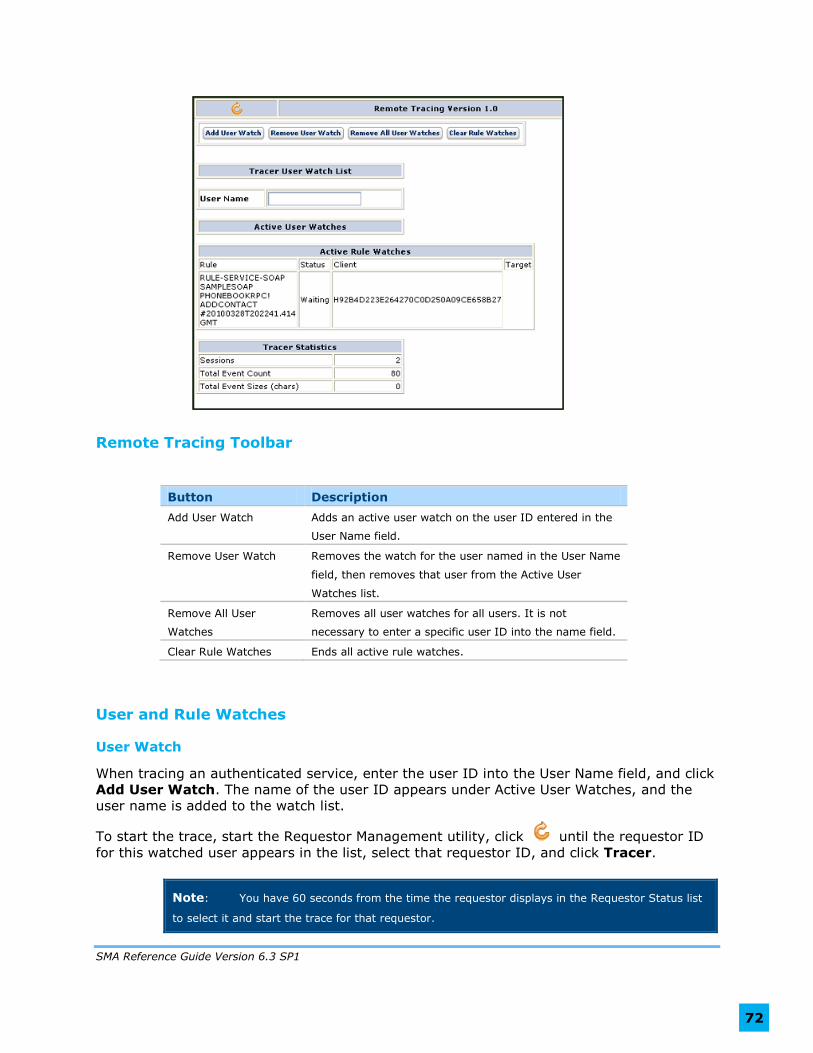
SMA Reference Guide Version 6.3 SP1
72
Remote Tracing Toolbar
Button Description
Add User Watch Adds an active user watch on the user ID entered in the
User Name field.
Remove User Watch Removes the watch for the user named in the User Name
field, then removes that user from the Active User
Watches list.
Remove All User
Watches
Removes all user watches for all users. It is not
necessary to enter a specific user ID into the name field.
Clear Rule Watches Ends all active rule watches.
User and Rule Watches
User Watch
When tracing an authenticated service, enter the user ID into the User Name field, and click
Add User Watch. The name of the user ID appears under Active User Watches, and the
user name is added to the watch list.
To start the trace, start the Requestor Management utility, click until the requestor ID
for this watched user appears in the list, select that requestor ID, and click Tracer.
Note: You have 60 seconds from the time the requestor displays in the Requestor Status list
to select it and start the trace for that requestor.

SMA Reference Guide Version 6.3 SP1
73
Rule Watch
Unlike the User Watch, you start the Rule Watch in Process Commander. Choose the
instance of the rule to be watched, and then from the menu, choose Run > Trace Open
Rule.
This starts the Rule Watch and opens the Tracer screen, and lists the open rule in the Active
Rule Watches section of the Remote Tracing screen.
Active Rule Watches
Heading Description
Rule The rule identifier (pzInsKey value).
Status The status of the watched rule. Valid status values include Waiting,
Activated (the rule is being traced), and Deactivated (rule execution
is complete, and the watch is reset).
Client The ID of the requestor tracing the rule.
Target The ID of the requestor executing the rule being watched.
Click Clear Rule Watches to clears all watched rules from the Active Rule Watches section.
In addition, with the Rule Watch cleared, if the Tracer screen is open, a Tracer session error
message says to restart the Tracer because the session for this ID no longer exists. Click OK
to close this error, and then close the Tracer.
Tracer Statistics
Field Description
Sessions The number of sessions currently being traced for the node.
Total Event Count The number of events in all trace sessions currently in system
memory. Note that running many traces can affect system
performance.
Total Event Sizes
(chars)
The number of characters for all the events in all trace sessions
currently in system memory.