systematic review for the 2017...
TRANSCRIPT
Reboussin DM, et al. 2017 High Blood Pressure Systematic Review
Page 1
Systematic Review for the 2017 ACC/AHA/AAPA/ABC/ACPM/AGS/APhA/ASH/ASPC/NMA/PCNA Guideline for the Prevention, Detection, Evaluation, and Management of High Blood Pressure in
Adults
A Report of the American College of Cardiology/American Heart Association Task Force on Clinical Practice Guidelines
EVIDENCE REVIEW COMMITTEE MEMBERS
David M. Reboussin, PhD, Chair Norrina B. Allen, PhD, MPH, FAHA* Daniel T. Lackland, DrPH, FAHA, FASH* Michael E. Griswold, PhD* Edgar (Pete) R. Miller III, PhD, MD* Eliseo Guallar, MD* Tamar Polonsky, MD, MSCI* Yuling Hong, MD, MSc, PhD, FAHA*† Angela M. Thompson-Paul, PhD, MSPH*†
Suma Vupputuri, PhD, MPH, FAHA*
ACC/AHA TASK FORCE MEMBERS Glenn N. Levine, MD, FACC, FAHA, Chair
Patrick T. O’Gara, MD, FACC, FAHA, Chair-Elect Jonathan L. Halperin, MD, FACC, FAHA, Immediate Past Chair‡
Sana M. Al-Khatib, MD, MHS, FACC, FAHA Federico Gentile, MD, FACC Joshua A. Beckman, MD, MS, FAHA Samuel Gidding, MD, FAHA† Kim K. Birtcher, MS, PharmD, AACC Zachary D. Goldberger, MD, MS, FACC, FAHA Biykem Bozkurt, MD, PhD, FACC, FAHA† Mark A. Hlatky, MD, FACC, FAHA Ralph G. Brindis, MD, MPH, MACC† John Ikonomidis, MD, PhD, FAHA Joaquin E. Cigarroa, MD, FACC José A. Joglar, MD, FACC, FAHA Lesley H. Curtis, PhD, FAHA† Laura Mauri, MD, MSc, FAHA Anita Deswal, MD, MPH, FACC, FAHA Susan J. Pressler, PhD, RN, FAHA† Lee A. Fleisher, MD, FACC, FAHA Barbara Riegel, PhD, RN, FAHA
Duminda N. Wijeysundera, MD, PhD *These members of the evidence review committee are listed alphabetically, and all participated equally in the process. †The findings and conclusions in this report are those of the authors and do not necessarily represent the official position of the Centers for Disease Control and Prevention. ‡Former Task Force member; current member during the writing effort. This document was approved by the American College of Cardiology Clinical Policy Approval Committee and the American Heart Association Science Advisory and Coordinating Committee in September 2017 and by the American Heart Association Executive Committee in October 2017. The Comprehensive RWI Data Supplement table is available with this article at http://hyper.ahajournals.org/lookup/suppl/doi:10.1161/HYP.0000000000000067/-/DC1. The online Data Supplement is available with this article at http://hyper.ahajournals.org/lookup/suppl/doi:10.1161/HYP.0000000000000067/-/DC2. The American Heart Association requests that this document be cited as follows: Reboussin DM, Allen NB, Griswold ME, Guallar E, Hong Y, Lackland DT, Miller ER 3rd, Polonsky T, Thompson-Paul AM, Vupputuri S. Systematic review for the 2017 ACC/AHA/AAPA/ABC/ACPM/AGS/APhA/ASH/ASPC/NMA/PCNA guideline for the prevention, detection,
by guest on May 6, 2018
http://hyper.ahajournals.org/D
ownloaded from
by guest on M
ay 6, 2018http://hyper.ahajournals.org/
Dow
nloaded from
by guest on May 6, 2018
http://hyper.ahajournals.org/D
ownloaded from
by guest on M
ay 6, 2018http://hyper.ahajournals.org/
Dow
nloaded from
by guest on May 6, 2018
http://hyper.ahajournals.org/D
ownloaded from
by guest on M
ay 6, 2018http://hyper.ahajournals.org/
Dow
nloaded from
by guest on May 6, 2018
http://hyper.ahajournals.org/D
ownloaded from
by guest on M
ay 6, 2018http://hyper.ahajournals.org/
Dow
nloaded from
by guest on May 6, 2018
http://hyper.ahajournals.org/D
ownloaded from
by guest on M
ay 6, 2018http://hyper.ahajournals.org/
Dow
nloaded from
by guest on May 6, 2018
http://hyper.ahajournals.org/D
ownloaded from
by guest on M
ay 6, 2018http://hyper.ahajournals.org/
Dow
nloaded from
by guest on May 6, 2018
http://hyper.ahajournals.org/D
ownloaded from
by guest on M
ay 6, 2018http://hyper.ahajournals.org/
Dow
nloaded from
by guest on May 6, 2018
http://hyper.ahajournals.org/D
ownloaded from
by guest on M
ay 6, 2018http://hyper.ahajournals.org/
Dow
nloaded from
by guest on May 6, 2018
http://hyper.ahajournals.org/D
ownloaded from
by guest on M
ay 6, 2018http://hyper.ahajournals.org/
Dow
nloaded from
by guest on May 6, 2018
http://hyper.ahajournals.org/D
ownloaded from
by guest on M
ay 6, 2018http://hyper.ahajournals.org/
Dow
nloaded from
by guest on May 6, 2018
http://hyper.ahajournals.org/D
ownloaded from
by guest on M
ay 6, 2018http://hyper.ahajournals.org/
Dow
nloaded from
by guest on May 6, 2018
http://hyper.ahajournals.org/D
ownloaded from
by guest on M
ay 6, 2018http://hyper.ahajournals.org/
Dow
nloaded from
by guest on May 6, 2018
http://hyper.ahajournals.org/D
ownloaded from
by guest on M
ay 6, 2018http://hyper.ahajournals.org/
Dow
nloaded from
by guest on May 6, 2018
http://hyper.ahajournals.org/D
ownloaded from
by guest on M
ay 6, 2018http://hyper.ahajournals.org/
Dow
nloaded from
by guest on May 6, 2018
http://hyper.ahajournals.org/D
ownloaded from
by guest on M
ay 6, 2018http://hyper.ahajournals.org/
Dow
nloaded from
by guest on May 6, 2018
http://hyper.ahajournals.org/D
ownloaded from
by guest on M
ay 6, 2018http://hyper.ahajournals.org/
Dow
nloaded from
by guest on May 6, 2018
http://hyper.ahajournals.org/D
ownloaded from
by guest on M
ay 6, 2018http://hyper.ahajournals.org/
Dow
nloaded from
by guest on May 6, 2018
http://hyper.ahajournals.org/D
ownloaded from
by guest on M
ay 6, 2018http://hyper.ahajournals.org/
Dow
nloaded from
by guest on May 6, 2018
http://hyper.ahajournals.org/D
ownloaded from
by guest on M
ay 6, 2018http://hyper.ahajournals.org/
Dow
nloaded from
by guest on May 6, 2018
http://hyper.ahajournals.org/D
ownloaded from
by guest on M
ay 6, 2018http://hyper.ahajournals.org/
Dow
nloaded from
by guest on May 6, 2018
http://hyper.ahajournals.org/D
ownloaded from
by guest on M
ay 6, 2018http://hyper.ahajournals.org/
Dow
nloaded from
by guest on May 6, 2018
http://hyper.ahajournals.org/D
ownloaded from
by guest on M
ay 6, 2018http://hyper.ahajournals.org/
Dow
nloaded from
by guest on May 6, 2018
http://hyper.ahajournals.org/D
ownloaded from
by guest on M
ay 6, 2018http://hyper.ahajournals.org/
Dow
nloaded from
by guest on May 6, 2018
http://hyper.ahajournals.org/D
ownloaded from
by guest on M
ay 6, 2018http://hyper.ahajournals.org/
Dow
nloaded from
by guest on May 6, 2018
http://hyper.ahajournals.org/D
ownloaded from
by guest on M
ay 6, 2018http://hyper.ahajournals.org/
Dow
nloaded from
by guest on May 6, 2018
http://hyper.ahajournals.org/D
ownloaded from
by guest on M
ay 6, 2018http://hyper.ahajournals.org/
Dow
nloaded from
by guest on May 6, 2018
http://hyper.ahajournals.org/D
ownloaded from
by guest on M
ay 6, 2018http://hyper.ahajournals.org/
Dow
nloaded from
by guest on May 6, 2018
http://hyper.ahajournals.org/D
ownloaded from
by guest on M
ay 6, 2018http://hyper.ahajournals.org/
Dow
nloaded from
by guest on May 6, 2018
http://hyper.ahajournals.org/D
ownloaded from
by guest on M
ay 6, 2018http://hyper.ahajournals.org/
Dow
nloaded from
by guest on May 6, 2018
http://hyper.ahajournals.org/D
ownloaded from
by guest on M
ay 6, 2018http://hyper.ahajournals.org/
Dow
nloaded from
by guest on May 6, 2018
http://hyper.ahajournals.org/D
ownloaded from
by guest on M
ay 6, 2018http://hyper.ahajournals.org/
Dow
nloaded from
by guest on May 6, 2018
http://hyper.ahajournals.org/D
ownloaded from
by guest on M
ay 6, 2018http://hyper.ahajournals.org/
Dow
nloaded from
by guest on May 6, 2018
http://hyper.ahajournals.org/D
ownloaded from
by guest on M
ay 6, 2018http://hyper.ahajournals.org/
Dow
nloaded from
by guest on May 6, 2018
http://hyper.ahajournals.org/D
ownloaded from
by guest on M
ay 6, 2018http://hyper.ahajournals.org/
Dow
nloaded from
by guest on May 6, 2018
http://hyper.ahajournals.org/D
ownloaded from
by guest on M
ay 6, 2018http://hyper.ahajournals.org/
Dow
nloaded from
by guest on May 6, 2018
http://hyper.ahajournals.org/D
ownloaded from
by guest on M
ay 6, 2018http://hyper.ahajournals.org/
Dow
nloaded from
by guest on May 6, 2018
http://hyper.ahajournals.org/D
ownloaded from
by guest on M
ay 6, 2018http://hyper.ahajournals.org/
Dow
nloaded from
by guest on May 6, 2018
http://hyper.ahajournals.org/D
ownloaded from
by guest on M
ay 6, 2018http://hyper.ahajournals.org/
Dow
nloaded from
by guest on May 6, 2018
http://hyper.ahajournals.org/D
ownloaded from
by guest on M
ay 6, 2018http://hyper.ahajournals.org/
Dow
nloaded from
by guest on May 6, 2018
http://hyper.ahajournals.org/D
ownloaded from
by guest on M
ay 6, 2018http://hyper.ahajournals.org/
Dow
nloaded from
by guest on May 6, 2018
http://hyper.ahajournals.org/D
ownloaded from
by guest on M
ay 6, 2018http://hyper.ahajournals.org/
Dow
nloaded from
by guest on May 6, 2018
http://hyper.ahajournals.org/D
ownloaded from
by guest on M
ay 6, 2018http://hyper.ahajournals.org/
Dow
nloaded from
by guest on May 6, 2018
http://hyper.ahajournals.org/D
ownloaded from
by guest on M
ay 6, 2018http://hyper.ahajournals.org/
Dow
nloaded from
by guest on May 6, 2018
http://hyper.ahajournals.org/D
ownloaded from
by guest on M
ay 6, 2018http://hyper.ahajournals.org/
Dow
nloaded from
by guest on May 6, 2018
http://hyper.ahajournals.org/D
ownloaded from
by guest on M
ay 6, 2018http://hyper.ahajournals.org/
Dow
nloaded from
by guest on May 6, 2018
http://hyper.ahajournals.org/D
ownloaded from
by guest on M
ay 6, 2018http://hyper.ahajournals.org/
Dow
nloaded from
by guest on May 6, 2018
http://hyper.ahajournals.org/D
ownloaded from
by guest on M
ay 6, 2018http://hyper.ahajournals.org/
Dow
nloaded from
by guest on May 6, 2018
http://hyper.ahajournals.org/D
ownloaded from
by guest on M
ay 6, 2018http://hyper.ahajournals.org/
Dow
nloaded from
by guest on May 6, 2018
http://hyper.ahajournals.org/D
ownloaded from
by guest on M
ay 6, 2018http://hyper.ahajournals.org/
Dow
nloaded from
by guest on May 6, 2018
http://hyper.ahajournals.org/D
ownloaded from
by guest on M
ay 6, 2018http://hyper.ahajournals.org/
Dow
nloaded from
by guest on May 6, 2018
http://hyper.ahajournals.org/D
ownloaded from
by guest on M
ay 6, 2018http://hyper.ahajournals.org/
Dow
nloaded from
by guest on May 6, 2018
http://hyper.ahajournals.org/D
ownloaded from
by guest on M
ay 6, 2018http://hyper.ahajournals.org/
Dow
nloaded from
by guest on May 6, 2018
http://hyper.ahajournals.org/D
ownloaded from
by guest on M
ay 6, 2018http://hyper.ahajournals.org/
Dow
nloaded from
by guest on May 6, 2018
http://hyper.ahajournals.org/D
ownloaded from
by guest on M
ay 6, 2018http://hyper.ahajournals.org/
Dow
nloaded from
by guest on May 6, 2018
http://hyper.ahajournals.org/D
ownloaded from
by guest on M
ay 6, 2018http://hyper.ahajournals.org/
Dow
nloaded from
by guest on May 6, 2018
http://hyper.ahajournals.org/D
ownloaded from
by guest on M
ay 6, 2018http://hyper.ahajournals.org/
Dow
nloaded from
by guest on May 6, 2018
http://hyper.ahajournals.org/D
ownloaded from
by guest on M
ay 6, 2018http://hyper.ahajournals.org/
Dow
nloaded from
by guest on May 6, 2018
http://hyper.ahajournals.org/D
ownloaded from
by guest on M
ay 6, 2018http://hyper.ahajournals.org/
Dow
nloaded from
by guest on May 6, 2018
http://hyper.ahajournals.org/D
ownloaded from
by guest on M
ay 6, 2018http://hyper.ahajournals.org/
Dow
nloaded from
by guest on May 6, 2018
http://hyper.ahajournals.org/D
ownloaded from
by guest on M
ay 6, 2018http://hyper.ahajournals.org/
Dow
nloaded from
by guest on May 6, 2018
http://hyper.ahajournals.org/D
ownloaded from

Reboussin DM, et al. 2017 High Blood Pressure Systematic Review
Page 2
evaluation, and management of high blood pressure in adults: a report of the American College of Cardiology Foundation/American Heart Association Task Force on Clinical Practice Guidelines. Hypertension. 2017;:e–e. This article has been copublished in the Journal of the American College of Cardiology. Copies: This document is available on the websites of the American College of Cardiology (www.acc.org) and the American Heart Association (professional.heart.org). A copy of the document is available at http://professional.heart.org/statements by using either “Search for Guidelines & Statements” or the “Browse by Topic” area. To purchase additional reprints, call 843-216-2533 or e-mail [email protected]. Expert peer review of AHA Scientific Statements is conducted by the AHA Office of Science Operations. For more on AHA statements and guidelines development, visit http://professional.heart.org/statements. Select the “Guidelines & Statements” drop-down menu, then click “Publication Development.” Permissions: Multiple copies, modification, alteration, enhancement, and/or distribution of this document are not permitted without the express permission of the American Heart Association. Instructions for obtaining permission are located at http://www.heart.org/HEARTORG/General/Copyright-Permission-Guidelines_UCM_300404_Article.jsp. A link to the “Copyright Permissions Request Form” appears on the right side of the page. (Hypertension. 2017;00:e000-e000.) © 2017 by the American College of Cardiology Foundation and the American Heart Association, Inc. Hypertension is available at http://hyper.ahajournals.org
by guest on May 6, 2018
http://hyper.ahajournals.org/D
ownloaded from
Reboussin DM, et al. 2017 High Blood Pressure Systematic Review
Page 3
Table of Contents
Abstract .................................................................................................................................................. 5 Preamble ................................................................................................................................................ 6 Part 1: Self-Measured Versus Office-Based Measurement of Blood Pressure in the Management of Adults
With Hypertension .................................................................................................................................. 7 Introduction: Part 1 ................................................................................................................................. 7 Methods: Part 1 ...................................................................................................................................... 7 Search Strategy: Part 1 ............................................................................................................................ 8
Eligibility Criteria .............................................................................................................................................. 8 Methods of Review .......................................................................................................................................... 8 Statistical Analysis ........................................................................................................................................... 9
Results: Part 1 ......................................................................................................................................... 9 Study Characteristics ....................................................................................................................................... 9 Study Outcomes: Office Systolic BP ................................................................................................................. 9 AMBP indicates ambulatory blood pressure monitoring; BP, blood pressure; and PRISMA, Preferred Reporting Items for Systematic Reviews and Meta-Analyses ....................................................................... 11 Study Outcomes: Percent Achieving Target BP ............................................................................................. 12 Additional Outcomes ..................................................................................................................................... 12
Clinical Events ............................................................................................................................................ 12 Medication Requirement: Number of Medications .................................................................................. 12 Adherence and Pill Counts......................................................................................................................... 12 Summary of Other Outcomes .................................................................................................................... 12
Risk of Bias ..................................................................................................................................................... 12 Discussion: Part 1 ................................................................................................................................... 13 Limitations: Part 1 .................................................................................................................................. 14 Conclusions: Part 1 ................................................................................................................................. 14 Part 2: Targets for Blood Pressure Lowering During Antihypertensive Therapy in Adults .......................... 15 Introduction: Part 2 ................................................................................................................................ 15 Methods: Part 2 ..................................................................................................................................... 15
Search Strategy and Information Sources ..................................................................................................... 15 Eligibility Criteria ............................................................................................................................................ 15 Study Selection .............................................................................................................................................. 16 Data Extraction and Quality Assessment ...................................................................................................... 16 Data Synthesis and Analysis .......................................................................................................................... 16
Results: Part 2 ........................................................................................................................................ 17 Study Selection .............................................................................................................................................. 17 Study Characteristics ..................................................................................................................................... 17 Risk of Bias Within and Across Studies .......................................................................................................... 18 Data Synthesis and Analysis of Results .......................................................................................................... 18 Sensitivity Analyses ....................................................................................................................................... 18
Discussion: Part 2 ................................................................................................................................... 21 Conclusions: Part 2 ................................................................................................................................. 22 Part 3: First-Line Antihypertensive Drug Class Comparisons in Adults ....................................................... 23 Introduction: Part 3 ................................................................................................................................ 23 Methods: Part 3 ..................................................................................................................................... 23
Search Strategy and Information Sources ..................................................................................................... 23 Eligibility Criteria ............................................................................................................................................ 23 Study Selection .............................................................................................................................................. 24
by guest on May 6, 2018
http://hyper.ahajournals.org/D
ownloaded from
Reboussin DM, et al. 2017 High Blood Pressure Systematic Review
Page 4
Data Extraction and Quality Assessment ...................................................................................................... 24 Data Synthesis and Analysis .......................................................................................................................... 24
Results: Part 3 ........................................................................................................................................ 25 Discussion: Part 3 ................................................................................................................................... 27 Appendix 1. Evidence Review Committee Relationships With Industry and Other Entities (Relevant) ....... 31 Appendix 2. Abbreviations ...................................................................................................................... 33 References ............................................................................................................................................. 34
by guest on May 6, 2018
http://hyper.ahajournals.org/D
ownloaded from
Reboussin DM, et al. 2017 High Blood Pressure Systematic Review
Page 5
Abstract Objective: To review the literature systematically and perform meta-analyses to address these questions: 1) Is there evidence that self-measured blood pressure (BP) without other augmentation is superior to office-based measurement of BP for achieving better BP control or for preventing adverse clinical outcomes that are related to elevated BP? 2) What is the optimal target for BP lowering during antihypertensive therapy in adults? 3) In adults with hypertension, how do various antihypertensive drug classes differ in their benefits and harms compared with each other as first-line therapy?
Methods: Electronic literature searches were performed by Doctor Evidence, a global medical evidence software and services company, across PubMed and EMBASE from 1966 to 2015 using key words and relevant subject headings for randomized controlled trials that met eligibility criteria defined for each question. We performed analyses using traditional frequentist statistical and Bayesian approaches, including random-effects Bayesian network meta-analyses.
Results: Our results suggest that: 1) There is a modest but significant improvement in systolic BP in randomized controlled trials of self-measured BP versus usual care at 6 but not 12 months, and for selected patients and their providers self-measured BP may be a helpful adjunct to routine office care. 2) systolic BP lowering to a target of <130 mm Hg may reduce the risk of several important outcomes including risk of myocardial infarction, stroke, heart failure, and major cardiovascular events. No class of medications (i.e., angiotensin-converting enzyme inhibitors, angiotensin-receptor blockers, calcium channel blockers, or beta blockers) was significantly better than thiazides and thiazide-like diuretics as a first-line therapy for any outcome.
by guest on May 6, 2018
http://hyper.ahajournals.org/D
ownloaded from
Reboussin DM, et al. 2017 High Blood Pressure Systematic Review
Page 6
Preamble Since 1980, the American College of Cardiology (ACC) and American Heart Association (AHA) have translated scientific evidence into clinical practice guidelines with recommendations to improve cardiovascular health. These guidelines, based on systematic methods to evaluate and classify evidence, provide a cornerstone of quality cardiovascular care. In response to reports from the Institute of Medicine (1, 2) and a mandate to evaluate new knowledge and maintain relevance at the point of care, the ACC/AHA Task Force on Clinical Practice Guidelines (Task Force) modified its methodology (3-5).
Evidence Review The Task Force recognizes the need for objective, independent evidence review committees (ERCs) that include methodologists, epidemiologists, clinicians, and biostatisticians who systematically survey, abstract, and assess the evidence to address systematic review questions posed in the PICOTS format (P=population, I=intervention, C=comparator, O=outcome, T=timing, S=setting) (2, 4-6). Practical considerations, including time and resource constraints, limit the ERCs to evidence that is relevant to key clinical questions and lends itself to systematic review and analysis that could affect the strength of corresponding recommendations. Recommendations developed by the writing committee on the basis of the systematic review are marked “SR”.
Relationships With Industry and Other Entities The ACC and AHA sponsor the guidelines without commercial support, and members volunteer their time. The Task Force avoids actual, potential, or perceived conflicts of interest that might arise through relationships with industry or other entities (RWI). All ERC members are required to disclose current industry relationships or personal interests, from 12 months before initiation of the writing effort. The ERC chair and all ERC members may not have any relevant RWI (Appendix 1). For transparency, ERC members’ comprehensive disclosure information is available online (http://hyper.ahajournals.org/lookup/suppl/doi:10.1161/HYP.0000000000000067/-/DC1). Comprehensive disclosure information for the Task Force is available at http://www.acc.org/guidelines/about-guidelines-and-clinical-documents/guidelines-and-documents-task-forces.
Glenn N. Levine, MD, FACC, FAHA, Chair Chair, ACC/AHA Task Force on Clinical Practice Guidelines
by guest on May 6, 2018
http://hyper.ahajournals.org/D
ownloaded from

Reboussin DM, et al. 2017 High Blood Pressure Systematic Review
Page 7
Part 1: Self-Measured Versus Office-Based Measurement of Blood Pressure in the Management of Adults With Hypertension
Introduction: Part 1 Although the awareness and treatment of hypertension has increased steadily over the past decade, it is estimated that approximately 50% of patients are still not adequately controlled (7). The AHA, together with the American Society of Hypertension and the Preventive Cardiovascular Nurses Association, published a scientific statement in 2008 supporting the use of self-measured blood pressure (BP) to help monitor response to medication, and to confirm suspected diagnoses of white coat or masked hypertension (8). Additional indications for self-measured BP cited in the “2013 European Society of Hypertension/ European Society of Cardiology Guidelines for the Management of Arterial Hypertension” included characterization of episodic hypotension, and identification of true- and false-resistant hypertension (9). There are several potential advantages to self-measured BP, such as raising patient awareness of how their BP responds to medication or dietary changes, decreasing physician intertia to adjust medication when the office-measured BP is high, and decreasing costs related to office visits for BP management (9, 10).
When patients are trained about proper technique and use appropriately sized BP cuffs, the information provided by self-measured BP has strong prognostic significance. Observational studies suggest that the association of self-measured BP with target organ damage, such as left ventricular hypertrophy, is comparable to ambulatory blood pressure monitoring (ABPM), and superior to office-measured BP (11, 12). Self-measure BP is also more strongly associated with cardiovascular morbidity and mortality than office-measured BP (13).
Several randomized controlled trials (RCTs) have examined whether the use of self-measured BP is associated with an improvement in clinical outcomes compared with usual care (14-29). There is substantial heterogeneity among studies, as many focused on self-measured BP alone, whereas others included varying degrees of additional support (e.g., education, counseling, telemedicine). A systematic review and meta-analysis by Uhlig et al. in 2013 demonstrated that self-measured BP monitoring alone versus usual care conferred a modest reduction in systolic and diastolic BPs, (-3.9 mm Hg and -2.4 mm Hg, respectively) (14). However, although the benefit was seen at 6 months, it did not extend to 12 months.
Since the 2013 analysis by Uhlig et al., 2 studies were published that compared self-measure BP versus office-measured BP (19, 29). In addition, not all of the studies examined reported enough detail about the variability of the reported BP estimates. The Task Force recognized the need for a subsequent review of self-measured BP by an independent ERC to inform recommendations about its potential use in the evaluation and management of patients with hypertension.
Methods: Part 1 The ERC conducted this meta-analysis to address these clinical questions posed by the writing committee: 1. Is there evidence that self-measured BP without other augmentation is superior to office-measured BP
for achieving better BP control? 2. Is there evidence that self-measured BP without other augmentation is superior to office-measured BP
for preventing adverse clinical outcomes that are related to elevated BP?
This meta-analysis complied with the PRISMA (Preferred Reporting Items for Systematic Reviews and Meta-Analyses) statement (30) and with the recommendations of the “ACCF/AHA Clinical Practice Guideline Methodology Summit Report” (5).
by guest on May 6, 2018
http://hyper.ahajournals.org/D
ownloaded from

Reboussin DM, et al. 2017 High Blood Pressure Systematic Review
Page 8
Search Strategy: Part 1 Eligible studies were identified by employees of Doctor Evidence using PubMed and EMBASE. Doctor Evidence is a global medical evidence software and services company. RCTs published in English from January 1, 1966, through February 12, 2015, were included. The search strategy is found in Table 1.1 in the Online Data Supplement.
Eligibility Criteria RCTs were included that compared self-measured BP alone to usual care in adults (≥18 years of age) who were being evaluated and/or treated for hypertension. All studies had a minimum of 6 months follow-up. Studies of adults with end-stage renal disease and pregnant women were excluded, as were studies in which (ABPM) was the only form of self-monitoring. Studies that used self-measured BP plus additional support had substantial heterogeneity in study design; therefore, we restricted the analyses to self-measured BP interventions that were not augmented. Interventions were considered augmented if the trial protocol required additional direct feedback from the study staff to the participants randomized to self-measured BP based on their home BP measurements, beyond what was given in the usual care arm. Studies that required adjustment of the medical regimen between clinic visits in response to self-measured BP results were also considered augmented. Contact between the study participants and staff that was optional or required only for safety concerns was not considered augmentation.
The prespecified primary outcome was change in systolic BP at 6 and 12 months. Additional outcomes that were measured included the proportion of the study population whose office-measured BP was controlled (<140/90 mm Hg), medication adherence, number of medications prescribed or mean doses of medication, and incidence rates for myocardial infarction (MI), stroke, acute decompensated heart failure, and coronary or peripheral revascularization. Outcomes were required to be reported at ≥6 months with enough detail to determine the variability of estimates (e.g., standard error, standard deviation, or confidence intervals [CI]). Outcomes at ≥14 months were rare and not included in the analysis.
Methods of Review To determine eligibility for inclusion in the meta-analysis, 2 members of the ERC independently reviewed each study. Disagreements were resolved by consensus or by discussion with the remaining members of the ERC. Data extraction was performed using the DOC Data 2.0 software platform (Doctor Evidence. 2016. DOC Data, Version 2.0. Santa Monica, CA: Doctor Evidence, LLC) using a standard template for predefined data points. Included studies were single-extracted by an evidence analyst with software validation/data entry error prevention. Each data point was verified against the source article by a quality control analyst (single extraction with sequential quality control). Discrepancies were resolved by the project methodologist and/or the chief medical officer. Subsequent dataset-level quality control (to identify outliers and ensure consistency of data across studies) was performed by an evidence audit specialist. An ontology specialist managed the naming of outcomes based on author-reported names and definitions.
Abstracted data from each study included the authors, year of publication, sample size, inclusion and exclusion criteria, study design, participant characteristics, duration of follow-up, systolic and diastolic BP at baseline and end-of study, change in BP, proportion of the study population whose BP was controlled, secondary outcomes including medication adherence, number and classes of medications prescribed, and cardiovascular event rates. The Cochrane Collaboration Risk of Bias Tool was used to evaluate risk of bias (31). A study was given an overall rating of low-to-intermediate risk of bias if the RCT was not thought to be at high risk of bias for any domain of study quality.
by guest on May 6, 2018
http://hyper.ahajournals.org/D
ownloaded from

Reboussin DM, et al. 2017 High Blood Pressure Systematic Review
Page 9
Statistical Analysis We performed a random-effects meta-analysis using the DerSimonion-Laird method for outcomes adequately reported by ≥4 studies. When available, the intervention effect on change in systolic BP from baseline was used for analysis, unadjusted if that was reported. Otherwise, the intervention effect on follow-up systolic BP was used, again unadjusted if that was reported. If intervention effects were not reported, but change from baseline in each group was reported with sample sizes and estimated variability, those estimates were used to estimate the intervention effect. If only follow-up values were reported with sample sizes and estimates of variability, those values were used to estimate the intervention effect. CIs were used as estimates of variability if standard deviations or standard errors were not reported. Studies that did not report estimates of variability were excluded. We adjusted for follow-up because some studies reported results after only 6, 9, or 12 months, and 2 studies reported results after both 6 and 12 months.
Results: Part 1
Study Characteristics We screened 181 abstracts, evaluated 43 full-text articles, and included 13 RCTs. The 13 RCTs contributed data from 4021 participants, with sample sizes ranging from 62 to 552 participants. The characteristics of the studies and the participants are presented in the Online Data Supplement Part 1 (Table 1.2 ). The mean age ranged from 47 to 69 years, and approximately 50% of particpants were women. Of the 13 studies, 6 contributed data for 12 months of follow-up, 1 for 9 months of follow-up, 4 for 6 months of follow-up, and 2 reported outcomes at both 6 and 12 months of follow-up. Given the nature of the studies, none of the participants were blinded. Two trials were excluded from the analyses (1 study because only 9-month systolic BP was reported (26) and the other because SBP variability was not reported (25)) but were included in the analyses related to the proportion of participants achieving BP control. All of the studies recruited participants with an elevated office-measured BP, typically defined as ≥140/90 mm Hg. However, the severity and type of hypertension differed across studies. For example, 1 study recruited patients who had been diagnosed with hypertension for at least 1 year and did not further restrict based on severity (18). However, >70% of the participants were already controlled on medication at study initiation. Another study restricted enrollment to adults who had already been treated for hypertension and were not at goal (21). An additional study screened all eligible patients with ABPM (19). Potential participants whose mean ambulatory systolic BP was <135/85 mm Hg were excluded, thus minmizing the number of participants with white coat hypertension. In contrast, another study excluded adults who were on >2 BP medications at baseline (16).
Study Outcomes: Office Systolic BP Ten trials were included for the analysis of office-measured BP (see Online Data Supplement Part 1, Table 1.2; Figure 1). Two trials contributed both 6- and 12-month outcomes, 2 contributed only 6-month outcomes, and 6 contributed only 12-month outcomes. We fit an adjustment for length of follow-up (6 or 12 months). We did not adjust for the within-study variation (2 studies included both 6- and 12-month measurements (21, 23)), but sensitivity analyses limiting all studies to a single measurement were not qualitatively different.
The association of self-measured BP with systolic BP varied across the studies. The results are provided in Online Data Supplement Part 1; Figure 1. Two of the studies were associated with a statistically significant worsening of systolic BP, 5 studies reported a significant improvement in systolic BP, and 5 reported no significant difference in systolic BP between self-measured BP and office-measured BP. Effect sizes ranged from a 7.4 mm Hg worsening of systolic BP to a 6.5 mm Hg improvement in systolic BP with self-measured BP compared with office-measured BP.
by guest on May 6, 2018
http://hyper.ahajournals.org/D
ownloaded from

Reboussin DM, et al. 2017 High Blood Pressure Systematic Review
Page 10
In the full meta-analysis, self-measured BP was associated with a 4.9 mm Hg (95% CI: 1.3–8.6 mm Hg) greater reduction in office systolic BP at 6 months compared with office-measured BP . However, the effect diminished by 12 months to 0.1 mm Hg (95% CI: –2.54 to 2.8 mm Hg), which was not statistically significant. The funnel plot for residuals from the adjusted model showed modest evidence of heterogeneity (see Online Data Supplement Part 1, Figure 1.2). There may be some bias against publication of null and negative studies. Participants randomized to self-measured BP were asked to measure their BP at home 1 to 5 times a week, depending on the study. Subsequent decisions regarding medical therapy were left to participants’ clinicians in most of the studies. For example, in 1 study, participants mailed their BP logs to the study investigators, who then forwarded the results to the participants’ providers (17). Treating physicians were encouraged to use their patients’ BP logs for monitoring rather than seeing them in the office but were still free to decide the frequency of office visits. In another study, participants randomized to self-measured BP were asked to measure their BP weekly (19). The data were transmitted automatically to a website where participants could track their readings. Participants’ providers were encouraged, but not mandated, to access the website weekly. How frequently providers accessed the website was not reported. In contrast, in other studies, providers whose patients participated were expected to follow a specific protocol in response to BP measurements (16). Participants in both arms were expected to be seen in the office 1 and 2 months after the baseline visit, and then every 2 months thereafter. Medication decisions were based on a target diastolic BP of 80 to 89 mm Hg. When the diastolic BP was >89 mm Hg, providers were given a stepped protocol dictating how to titrate medication. When the diastolic BP was <80 mm Hg, providers withdrew medication. As a result, 25.6% of the self-measured BP participants versus 11.3% office-measured BP participants permanently stopped treatment, suggesting that many of the participants had white coat hypertension. However, of the 55 participants randomized to self-measured BP who stopped medication for a diastolic BP <80 mm Hg, only 64.7% maintained a diastolic BP <85 mm Hg for the remainder of the study.
by guest on May 6, 2018
http://hyper.ahajournals.org/D
ownloaded from

Reboussin DM, et al. 2017 High Blood Pressure Systematic Review
Page 11
Figure 1. PRISMA Diagram of the Manuscripts Included in the Analyses
2003 Records identified through database search (MEDLINE/EMBASE)
2003 Titles/Abstracts screened
181 Full-text articles assessed for eligibility
43 Studies included in database
13 Studies used in meta-analysis
1822 Records excluded
138 Full-text articles excluded Reasons for exclusion: • 65 Interventions not of interest • 27 Populations not of interest • 14 Outcomes not of interest • 7 Study design not of interest • 7 Comparison not of interest • 5 Missing outcome • 5 Nonclinical study • 2 Duplicate publication • 1 Outcome stratification not of
interest
30 Articles excluded from analysis Reasons for exclusion: • 6 Incomplete data • 3 Different BP targets between
comparison groups • 1 Subgroup analysis of prior trial • 1 Outcome not of interest • 8 Study duration <6 months • 8 Augmented intervention • 2 Used only ABPM • 1 Patient population not of
interest
Scre
enin
g Id
entif
icat
ion
Met
a-an
alys
is
Incl
uded
El
igib
ility
AMBP indicates ambulatory blood pressure monitoring; BP, blood pressure; and PRISMA, Preferred Reporting Items for Systematic Reviews and Meta-Analyses
by guest on May 6, 2018
http://hyper.ahajournals.org/D
ownloaded from

Reboussin DM, et al. 2017 High Blood Pressure Systematic Review
Page 12
Study Outcomes: Percent Achieving Target BP Of the 6 studies reporting the proportion of participants achieving their target BP, 1 study was excluded because the percent achieving target in the intervention arm was determined using self-measurements, while the percent achieving target in the control arm was determined using office measurements (22). For the grouped analysis, only end of study values were used.
Results from the 5 remaining studies were similar (see Online Data Supplement Part 1, Figure 1.3). None reported a significant intervention effect. Consistent with the office-measure BP results, there was a slightly more positive response at 6 months than 12 months, but neither was significant. One study was heavily weighted, as its regression model produced an estimate with relatively narrow confidence limits (18).
Additional Outcomes Other outcomes included clinical events and medication usage.
Clinical Events Events, including stroke, MI, total mortality and cardiovascular mortality were considered for possible analysis. Except for total mortality, no data on any specific clinical event were reported by ≥4 studies and no analysis was attempted. Total mortality was reported by 4 studies, but the number of events was small and details of how mortality data were ascertained were unclear. None of the 4 studies reported a significant difference, and the overall risk ratio was not different from 1.0.
Medication Requirement: Number of Medications Assessment of BP medication requirements was heterogeneous among trials reporting this outcome. Five studies reported either the number of medications, the number of “defined doses,” or a medication score: these were combined in an outcome labeled “number of medications” for analysis. Two indicated more medication for the control arm (16, 22), 1 for the intervention arm (19), and 2 were equal (23, 29).
Adherence and Pill Counts Adherence was assessed in several ways, including self-report, pill counts, and monitoring events medication system; however, because the measures were qualitatively different, and some did not have associated measures of variability, they could not be combined in a meta-analysis.
Summary of Other Outcomes No conclusions could be made regarding clinical events. For medication requirement, data from 4 studies indicated no effect on the mean number of medications at 6 months. The data for adherence were not reported in way that allowed reliable quantitative assessment.
Risk of Bias Assessment of the funnel plots showed no heterogeneity among the studies reporting 6-month outcomes, but some heterogeneity among studies with 12-month outcomes. The results suggest a possible publication bias against studies with longer follow-up and null findings (see Online Data Supplement Part 1, Figure 1.2) . It was not possible to blind the participants to their treatment allocation. Given the objective nature of the study outcomes, it is less likely that this would lead to bias.
by guest on May 6, 2018
http://hyper.ahajournals.org/D
ownloaded from

Reboussin DM, et al. 2017 High Blood Pressure Systematic Review
Page 13
Several studies reported >20% loss to follow-up (15, 18, 20, 22, 25, 26). The loss to follow-up was balanced between the 2 treatment arms, although was of borderline significance with greater loss to follow-up in the self-measured BP versus control arm in 1 of the studies (p=0.08) (18).
Discussion: Part 1 In this meta-analysis of 13 RCTs, we found that self-measured BP without additional support versus office-measured BP was associated with a modest improvement in systolic BP at 6 months, but no difference in systolic BP at 12 months. In our analysis of 5 RCTs, we found no significant difference in the proportion of participants whose BP was controlled between the self-measured BP and office-measured BP arms.
Taken together, the results suggest that self-measured BP without additional support provides only a modest and short-term improvement in BP control. Our results are similar to a previously published meta-analysis (14), which reported that systolic BP was 3.9 mm Hg lower among adults randomized to self-measured BP compared with office-measured BP. We included several of the same studies as this meta-analysis; however, we also excluded several studies from this analysis that were not published in English or did not adequately report BP variability. In addition, 2 studies (19, 29) were published after the 2013 report. We found insufficient data to draw conclusions about the association of self-measured BP with clinical events. Measurement and reporting of other secondary outcomes such as medication prescription and adherence was inconsistent. Variations in study design may have diminished a potential association between self-measured BP and improved BP control and should be considered. For example, in 1 study, a substantially higher proportion of adults who were randomized to self-measured BP versus office-measured BP permanently discontinued medication for a diastolic BP <80 mm Hg (per study protocol), suggesting that many of the participants likely had white coat hypertension and would be less likely to derive any benefit from ongoing self-measured BP (16). In contrast, another study—which reported a 4.3-mm Hg improvement in systolic BP with self-measured BP—used a more rigorous screening strategy by performing ABPM in all potentially eligible participants, and only including adults whose systolic BP remained elevated (19). We found that the modest benefit of self-measured BP was seen only at 6 months and not at 12 months. Study design, rather than a diminished effect of self-measured BP over time, is likely the primary explanation for our findings. Of all the studies included in the analysis, only 2 showed significantly less favorable control with self-measured BP that office-measured BP, and both were in the group with 12-month outcomes (16, 24). As previously mentioned, in 1 of these studies, BP treatment was determined by a stepped protocol, so that medication was discontinued when the diastolic BP was <80 mm Hg (16). Such a limited definition of BP control resulted in significantly more participants in the self-measured BP arm being taken off their medication. The difference in BP between the 2 treatment arms was similar at 6 and 12 months. Another study reported a nonsiginficant trend toward less favorable BP control with self-measured BP than office-measured BP and had also used a strict dosing protocol (22). As a result, patients in the self-measured BP arm were taking on average 1 fewer medications than in the office-measured BP arm. In contrast, in a study where adults randomized to self-measured BP mailed their BP logs to their physicians but often did not receive feedback on their results (24), adults randomized to the office-measured BP group had significantly more extra visits (5.3 versus 1.4) to see their physicians, which may have improved factors such as medication adherence. In the remaining group of studies that reported 12-month outcomes, all but 1 study one showed either a significant benefit or at least a trend toward improved control with self-measured BP (Figure 1). BP control rates in both arms of some studies were remarkably low. Therefore, it is difficult to know whether provider and/or patient inertia may explain the only modest benefit seen with self-measured BP, rather than inherent limitations of self-measured BP itself. For example, in 1 study, 52% and 46% of the self-measured BP and office-measured BP participants, respectively, were still not on medication by the end of the study, despite a mean office BP of 151/93 mm Hg (24). In another study, <20% of participants in both arms
by guest on May 6, 2018
http://hyper.ahajournals.org/D
ownloaded from

Reboussin DM, et al. 2017 High Blood Pressure Systematic Review
Page 14
were started on medication despite having a mean systolic BP >140 mm Hg (20). For those started on medication, it took an average of 6 months for medication to be initiated after an abnormal BP reading.
However, several studies that combined self-measured BP with additional support, and thus were not included in this meta-analysis, have reported meaningful and sustained improvements in BP control. For example, 1 study randomized 450 patients with uncontrolled BP at baseline to office-measured BP versus a program with home BP telemonitoring with pharmacist management (27). Adults randomized to the intervention experienced an additional 6.6 mm Hg lowering of systolic BP compared with usual care, which was maintained for 6 months after the intervention ended. A second study also demonstrated a substantial improvement in BP control among adults randomized to a pharmacist-led, telemonitoring program compared with office-measured BP; those randomized to the intervention experienced a –12.4 mm Hg (95% CI: –16.3 to –8.6%) larger reduction in systolic BP (28). Importantly, the results were even more pronounced among adults with diabetes mellitus or chronic kidney disease (CKD) (–15.4 mm Hg larger decrease; 95% CI: –21 to –9.8). In addition, the intervention arm had more email and telephone contacts and greater medication intensification than the office-measured BP arm. The results suggest that self-measured BP can serve as a valuable component of a multidisciplinary approach to the treatment of hypertension. As a result, the Centers for Disease Control and Prevention encourages the use of self-measured BP with additional support (32).
Limitations: Part 1 This meta-analysis has several limtations. As with any meta-analysis, we may be limited by unpublished data. There were differences in study design even among the studies that used only self-measured BP, which may have limited our ability to detect more substantial improvements in BP control with self-measured BP. We were also limited by our inability to comment on outcomes other than systolic BP, such as medication adherence, or clinical outcomes, such as end-organ damage or clinical events.
Conclusions: Part 1 In summary, we found a modest but significant improvement in systolic BP in RCTs of self-measured BP versus office-based BP . However, the improvement was not sustained for longer than 6 months. Well-run studies of self-measured BP, in conjunction with additional support, have demonstrated more substantial improvements in BP control, but study design is highly variable. Our results suggest that, for selected patients and their providers, self-measured BP may be a helpful adjunct to routine office care.
by guest on May 6, 2018
http://hyper.ahajournals.org/D
ownloaded from

Reboussin DM, et al. 2017 High Blood Pressure Systematic Review
Part 2: Targets for Blood Pressure Lowering During Antihypertensive Therapy in Adults
Introduction: Part 2 High BP has been long recognized as the single most common risk factor for cardiovascular disease burden (33-36). The treatment and management of hypertension has been documented to significantly reduce morbidity and mortality (37-40) and is also among the most common reasons for ambulatory clinic visits among adults worldwide (41). Thus, clinical practice guidelines represent an essential component of management and control of high BP, and such guidelines with recommended target BP levels have been associated with shift in popluation BP to lower levels and disease risks (42). It is also essential that such guidelines are based on current and clear evidence from clincal studies and should be based on rigorous systematic evidence reviews for specific critical questions for the interpretation of the the evidence and the crafting of the specific clinical recommendations as recommended by the 2011 report from the Institute of Medicine on the development of trustworthy clinical guidelines (1). The goals of the ACC/AHA writing committee include the development of guidelines, standards, and policies that promote optimal patient care and cardiovascular health.
There have been 8 recent meta-analyses addressing the issues of BP reduction and target BP levels for the treatment of hypertension (37-39, 43-47). Although treatment of hypertension was associated with improved outcomes in all 8 meta-analyses, the optimal target BP remains unclear. In the current systematic review and meta-analysis, we sought to determine the optimal targets for BP lowering during antihypertensive therapy in adults.
Methods: Part 2 This systematic review adhered to the Preferred Reporting Items for Systematic Reviews and Meta-Analyses statement and to recommendations of the “ACCF/AHA Clinical Practice Guideline Methodology Summit Report” (5, 30)
Search Strategy and Information Sources An electronic literature search was performed by Doctor Evidence, a global medical evidence software and services company, across PubMed and EMBASE from 1966 to April 13, 2015, using key words and relevant subject headings for “hypertension” combined with terms for the interventions of interest (see Online Data Supplement Part 2, Table 2.1). An additional PubMed search was performed through May 6, 2015. SPRINT (Systolic Blood Pressure Intervention Trial) was included in November 2015, and SPS3 (Secondary Prevention of Small Subcortical Strokes Trial) was included in April 2016 at the request of the ERC (48, 49). The ERC also searched bibliographies of recent, relevant meta analyses (37-39, 50).
Eligibility Criteria RCTs were considered for inclusion if they met the following eligibility criteria (see Online Data Supplement Part 2, Table 2.2): included adults (≥18 years of age) with primary hypertension or hypertension due to CKD; if the intervention included a target BP that was more “intensive” or “lower” than a “standard” or “higher” target BP in the comparator arm; and outcomes included all-cause mortality, cardiovascular mortality, major cardiovascular events, MI, stroke, heart failure, or renal outcomes. Trials were excluded if the primary intent of the study was not specifically to treat or lower BP, were observational studies, or included <100 randomized
by guest on May 6, 2018
http://hyper.ahajournals.org/D
ownloaded from

Reboussin DM, et al. 2017 High Blood Pressure Systematic Review
participants or <400 person years of follow-up, and a minimum of 12 months of follow-up. Relevant studies were excluded if they did not report outcomes of interest with enough detail to estimate variability.
Study Selection A trained medical librarian screened the titles and abstracts of studies against predefined selection criteria using a software environment with features such as color coding and ranking of relevant key words. A second medical librarian also performed quality control using these tools. The chief medical officer and the project methodologist reviewed all included abstracts and a random sample of excluded abstracts, managed discrepancies between librarians, and decided on studies of uncertain eligibility. Members of the ERC were divided into pairs and performed dual independent review of full text articles in the DOC Library software platform (Doctor Evidence. 2016. DOC Library. Santa Monica, CA: Doctor Evidence, LLC). Disagreements were resolved by consensus between the 2 reviewers and the ERC chair.
Data Extraction and Quality Assessment Data extraction was performed using the DOC Data 2.0 (Doctor Evidence. 2016. DOC Data, Version 2.0. Santa Monica, CA: Doctor Evidence, LLC.) software platform using a standard template for predefined data points. Included studies were single-extracted by an evidence analyst with software validation/data entry error prevention and with each data point verified against the source article by a quality control analyst (single extraction with sequential quality control). Discrepancies were resolved by the project methodologist and/or chief medical officer. Subsequent dataset-level quality control (to identify outliers and ensure consistency of data across studies) was performed by an evidence audit specialist. An ontology specialist managed the naming of outcomes based on author-reported names and definitions.
For each included study, this information was abstracted: study design, participant characteristics (age, race andethnicity, sex, comorbid conditions), and duration of follow-up. Risk of bias was assessed for each study included using the Cochrane Risk of Bias tool (31), which examines 7 sources of bias (randomization, allocation concealment, blinding of participants and personnel, blinding of outcome assessment, completeness of outcome data, selective outcome reporting, and other potential biases). Studies were considered to have low risk of bias if there was low risk of bias for all domains or plausible bias was unlikely to alter results. Studies were considered to have high risk of bias if there was high risk of bias for ≥1 key domains and the plausible bias seriously weakened confidence in results.
Data Synthesis and Analysis We extracted study results based on target BP and examined them based on intent-to-treat analysis. BP-lowering targets varied by study but, for this meta-analysis, participants assigned to the lower BP target composed the lower BP target group and the higher BP target composed the standard therapy group. Major cardiovascular events were included in the analysis only if defined and reported by the trial as a composite outcome and included events such as cardiovascular death, stroke, MI, and heart failure. Heart failure definitions varied but included these measures: acute decompensated heart failure, revascularization or hospitalization for congestive heart failure (CHF) or death due to heart failure, CHF of New York Heart Association class II or higher, CHF of New York Heart Association class III or IV requiring admission to hospital, CHF of New York Heart Association class III or higher or echocardiography determining left ventricular ejection fraction <40%, or hospitalization for CHF necessitating therapy with an ionotropic agent, vasodilator, angiotension-converting enzyme inhibitor (ACEI), increased dose of diuretic, ultrafiltration, or dialysis. Fatal and nonfatal events were included in the outcomes for MI and stroke. Renal events include these composite of outcomes: end-stage renal disease or death secondary to end-stage renal disease, doubling of serum creatinine, 50% reduction in glomerular filtration rate, long-term dialysis, kidney transplantation, progression of CKD, renal failure, and renal failure in absence of acute reversible cause.
by guest on May 6, 2018
http://hyper.ahajournals.org/D
ownloaded from
Reboussin DM, et al. 2017 High Blood Pressure Systematic Review
For each outcome, we calculated the relative risk (RR) and 95% CI from the number of events and participants. First, we examined risk of each outcome for any lower BP target versus any standard BP target, then we examined the effect of a lower systolic BP target <130 mm Hg versus any higher BP target for all outcomes. In prior guidelines, there was insufficient evidence to demonstrate benefit of a BP goal <140/90 mm Hg (80). Given the completion of additional studies with lower target BP goals, we examined available evidence to determine whether a lower BP goal conferred additional benefit either in the general population or in a specific subpopulation. The lower goal of 130 mm Hg was selected because it was the lower limit of high-normal BP and was the goal BP set by other guidelines for certain subpopulations. There were an adequate number of studies with a BP target of ≤130 mm Hg to study the question.
We performed random-effects meta-analysis using the DerSimonion-Laird method for outcomes adequately reported by ≥3 studies. The percentage of variability across studies, which was attributable to heterogeneity rather than chance, was measured using the I2 statistic, where I2 <30% was considered low heterogeneity and >50% was considerable heterogeneity (51, 52). The presence of publication bias was assessed using funnel plots for each outcome. We used the Begg rank correlation test to calculate Kendall’s Tau and p value to examine funnel plot asymmetry (53). The Egger weighted linear regression method uses the effect size and standard error to quantify bias (54). Predefined subgroups of interest included sex, race and ethnicity, age, and comorbidity. Although many of the included studies reported subgroup results, no subgroup of interest was reported by at least 3 studies for any of the 7 outcomes examined in the current meta-analysis; therefore, subgroup meta-analyses were not conducted. We compiled and reviewed published subgroup findings for the 7 outcomes in the present study. To further understand the effect of a lower target BP versus any higher target BP on subgroups of interest, we conducted sensitivity analyses to limit the number of studies included and examined the effect in studies, which included 1) only patients with diabetes mellitus, 2) only patients with CKD, or 3) a study population with mean age ≥60 years at baseline.
All analyses were performed using an online platform (Doctor Evidence. 2016. DOC Data, Version 2.0. Santa Monica, CA: Doctor Evidence, LLC) that incorporated R statistical software using Metafor (55).
Results: Part 2 See the Online Data Supplement (http://hyper.ahajournals.org/lookup/suppl/doi:10.1161/HYP.0000000000000067/-/DC2) for detailed information.
Study Selection A total of 33 publications from 15 studies were considered for inclusion (Figure 2). Fourteen of the publications were subsequently excluded from the primary analyses for these reasons: outcomes reported in another publication, outcome presented by subgroup, no outcome of interest, no in-trial results presented, intent-to-treat analysis not presented (per protocol results only), or event counts unavailable (see Online Data Supplement Part 2, Table 2.3).
Study Characteristics Online Data Supplement Part 2, Table 2.4 describes the inclusion and exclusion criteria and BP targets for each of the trials included in the present meta-analysis. Publication dates ranged from 1998 through 2015. Target BPs varied for the lower and standard BP groups with 9 studies having a systolic BP target <130 mm Hg for the lower therapy group (48, 49, 56-64). Many of the studies included patients with comorbid conditions such as diabetes mellitus, CKD, or were at high risk for cardiovascular disease or progression to end-stage renal disease. Most studies excluded those with prior or recent MI or stroke, secondary hypertension, CHF, or other serious illnesses.
by guest on May 6, 2018
http://hyper.ahajournals.org/D
ownloaded from
Reboussin DM, et al. 2017 High Blood Pressure Systematic Review
Mean follow-up time ranged from 1.6 to 8.4 years (Online Data Supplement Part 2, Table 2.5). The proportion of male participants in each study ranged from 37.5% to 75.0%, and proportion of nonwhite participants ranged from 7.3% to 100% among 10 studies reporting race and ethnicity. Mean age at baseline ranged from 36.3 years to 76.6 years, and 8 studies reported mean participant age of ≥60 years at baseline. In 3 studies each, all participants had diabetes mellitus or CKD.
Study protocols were summarized and compared in the Online Data Supplement, Part 2, Table 2.6 The frequency of participant contact during follow up differed by study with many studies including more frequent visits in the months post randomization, then decreasing in frequency after reaching a designated time such as 4 or 6 months. With the exception of ACCORD (Action to Control Cardiovascular Risk in Diabetes) trial, which had more frequent visits for participants in the lower BP target group initially, studies maintained similar frequency of contact for participants in the lower and standard BP target groups.
Risk of Bias Within and Across Studies Overall, the studies included in the analyses showed low or unclear risk of bias. Of the 15 included trials, 12 showed high risk of bias for the blinding of study participants and personnel because blinding was not possible or performed (49, 56-62, 64-70), 1 study showed unclear risk of bias, and 2 studies had low risk of bias in this domain because they used identical placebo tablets for the randomized groups (71, 72). Two studies showed high risk of bias due to inadequately addressing incomplete outcome data (57, 58, 60). Included studies showed low or unclear risk of bias for all other domains.
Data Synthesis and Analysis of Results When we examined results for the 7 outcomes for trials of any lower BP target versus any standard or higher BP target (Online Data Supplement Part 2, Table 2.7), we found that greater BP lowering significantly reduced the risk of major cardiovascular events (RR: 0.81; 95% CI: 0.70–0.94), MI (RR: 0.86; 95% CI: 0.76–0.99), stroke (RR: 0.77; 95% CI: 0.65–0.91), and heart failure (RR: 0.75; 95% CI: 0.56–0.99), with a marginally significant reduction in all-cause mortality (RR: 0.89; 95% CI: 0.77–1.02). Heterogeneity between studies was lowest for MI and renal events but there was significant heterogeneity found between all studies for all-cause mortality. There were no indications for publication bias as measures of funnel plot asymmetry did not reach significance for any of the outcomes.
When we limited our analyses to RCTs with a systolic BP target <130 mm Hg in the lower BP target group compared with any higher BP target (Online Data Supplement Part 2,, Table 2.8), the risk reductions were modestly attenuated but remained significant for major cardiovascular events (RR: 0.84; 95% CI: 0.73–0.99) and stroke (RR: 0.82; 95% CI: 0.70–0.96) and marginally significant for MI (RR: 0.85; 95% CI: 0.73–1.00) and all-cause mortality (RR: 0.92; 95% CI: 0.79–1.06). Heterogeneity between studies was lowest for MI, stroke, and renal events and highest for major cardiovascular events and heart failure although it was not statistically significant. There were no indications of publication bias as measures of funnel plot asymmetry did not reach significance for any of the outcomes. Additional details about individual studies included for each outcome can be found in the Online Data Supplement Part 2, Tables 2.9–2.16. These supplemental tables show the calculated relative risk for all studies included for each outcome, as well as information about the sensitivity analyses such as studies included and heterogeneity statistics.
Sensitivity Analyses Three studies had populations comprised of patients with diabetes mellitus, 3 study populations were comprised of patients with CKD, and 8 trials had study populations with a mean age ≥60 years. We found similar estimates of effect for all sensitivity analyses (see Online Data Supplement Part 2, Table 2.17). The strongest effect was seen among patients with diabetes mellitus where greater BP lowering reduced the risk of stroke by 44% (RR: 0.56; 95% CI: 0.42–0.74). Although there was no indication of heterogeneity between
by guest on May 6, 2018
http://hyper.ahajournals.org/D
ownloaded from

Reboussin DM, et al. 2017 High Blood Pressure Systematic Review
studies, Egger’s Regression Test indicated significant funnel plot asymmetry (p=0.04). Among studies with a mean age ≥60 years, the lower BP target resulted in findings similar to the overall results with significant reductions in major cardiovascular events, stroke, heart failure, and marginally significant reduction in MI.
A summary table of effect estimates and subgroup analyses reported by each study for the 7 outcomes reported in this meta-analysis have been compiled (see Online Data Supplement Part 2, Table 2.18). However, subgroup results could not be pooled in a meaningful way. Among the subgroup analyses reported by individual studies, there were no significant findings.
by guest on May 6, 2018
http://hyper.ahajournals.org/D
ownloaded from
Reboussin DM, et al. 2017 High Blood Pressure Systematic Review
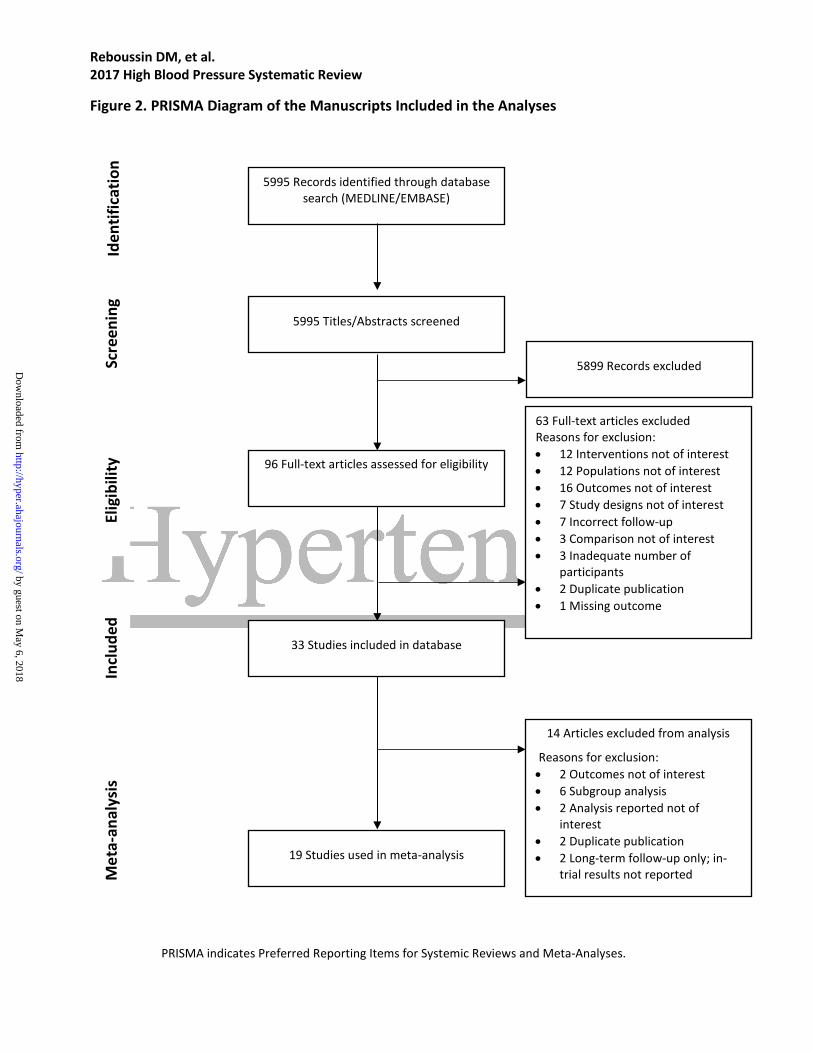
Figure 2. PRISMA Diagram of the Manuscripts Included in the Analyses
PRISMA indicates Preferred Reporting Items for Systemic Reviews and Meta-Analyses.
5995 Records identified through database search (MEDLINE/EMBASE)
5995 Titles/Abstracts screened
96 Full-text articles assessed for eligibility
33 Studies included in database
19 Studies used in meta-analysis
5899 Records excluded
63 Full-text articles excluded Reasons for exclusion: • 12 Interventions not of interest • 12 Populations not of interest • 16 Outcomes not of interest • 7 Study designs not of interest • 7 Incorrect follow-up • 3 Comparison not of interest • 3 Inadequate number of
participants • 2 Duplicate publication • 1 Missing outcome
14 Articles excluded from analysis
Reasons for exclusion: • 2 Outcomes not of interest • 6 Subgroup analysis • 2 Analysis reported not of
interest • 2 Duplicate publication • 2 Long-term follow-up only; in-
trial results not reported
Scre
enin
g Id
entif
icat
ion
Met
a-an
alys
is
Incl
uded
El
igib
ility
by guest on May 6, 2018
http://hyper.ahajournals.org/D
ownloaded from

Reboussin DM, et al. 2017 High Blood Pressure Systematic Review
Discussion: Part 2 In this meta-analysis, we examined the reduction in risk of morbidity and mortality for 7 outcomes, comparing results from trials that randomly assigned individuals to lower targets versus standard targets for BP reduction. We found that greater BP lowering significantly reduced the risk of major cardiovascular events, MI, stroke, and heart failure. To determine whether an optimal target for BP reduction could be identified, we also examined reduction in risk of these outcomes for RCTs with a systolic BP target <130 mm Hg in the lower BP target group and again found a reduced risk of stroke and major cardiovascular events with marginally significant reductions in risk of MI and all-cause mortality. Limiting the analyses to studies that included only participants with diabetes mellitus or CKD or with a mean participant age ≥60 years had little impact on the findings. Our results are largely in agreement with the findings of other recent meta-analyses (see Online Data Supplement Part 2, Table 2.19) (37-39, 43-47, 50). The studies used various methodological techniques to examine the extent to which the benefits of BP-lowering treatments for prevention of cardiovascular disease differed by baseline BP level (39) or among subgroups such as people with diabetes mellitus (44) or older adults (45, 48).
There was agreement across meta-analyses that greater BP lowering appears to be most beneficial for the reduction in risk of major cardiovascular events, MI, stroke, and heart failure. Two studies reported a significant reduction in the risk of all-cause mortality (39, 46), 3 studies reported reduction in cardiovascular mortality (37, 44, 47), but no meta-analysis found a significant reduction in the risk of renal events for the lower BP target group compared with a higher BP target group.
Identifying the most appropriate targets for BP to reduce cardiovascular morbidity and mortality has been elusive. In 2007, an National Heart, Lung, and Blood Institute expert panel concluded that it would be important to test the hypothesis that a lower systolic BP goal could reduce clinical events more than a standard BP reduction goal. Several large recent RCTs sought to answer that question by selecting systolic BP treatment targets of <120 mm Hg (49, 61, 63, 64) or <130 mm Hg (48, 56-60, 62). The results of our meta-analysis have shown that BP lowering to a target of <130 mm Hg may significantly reduce the risk of several important outcomes. The results appear to have similar benefits for people regardless of comorbid conditions and age.
This meta-analysis has several limitations that should be acknowledged. First, as is the case with many meta-analyses, the results may be limited by unpublished data. Additionally, there are differences in time periods during which the studies were conducted as well as differences in study designs including differences in the BP reduction targets and differences in hypertension treatment protocols that may have limited our ability to detect benefits of BP lowering. Outcome definition also varied by study. Finally, although a lower BP target did not result in additional benefit beyond what was seen for the general population for populations with diabetes mellitus or CKD, or in studies with a mean study population age ≥60 years, it is possible that we have an incomplete understanding. Due to variable reporting of subgroup findings, we were unable to pool reported subgroup findings from published reports in a meaningful way and the previously reported subgroup analyses summarized in the Online Data Supplement Part 2, Table 2.18) should be interpreted with caution as they may represent the findings from only 1 study for a given outcome and subgroup.
The consideration of target systolic BP for the treatment of high BP represents a critical clinical question of the management of hypertension, but also a parameter of controversy. The 2014 report from the panel members appointed to the Eighth Joint National Committee included a rigorous evidence-based methodology for assessing the results of randomized controlled trials identifying strong support for treating hypertensive persons aged ≥60 years to a BP goal of <150/90 mm Hg (73), as opposed to the traditional 140/90 mm Hg from other recommendations during the same time period (40, 74). Because the panel only used a systematic review of original studies, systematic reviews and meta-analyses were not included in the formal evidence review. Thus, the systematic review of the evidence by the different groups identified different target BP levels and subsequent confusion in clinical recommendations (75, 76). The current systematic review
by guest on May 6, 2018
http://hyper.ahajournals.org/D
ownloaded from
Reboussin DM, et al. 2017 High Blood Pressure Systematic Review
includes new evidence from clinical studies and presents the results in a rigorous meta-analysis. Likewise, the recent clinical practice guideline from the American College of Physicians and the American Academy of Family Physicians restricted the evidence to patients aged ≥60 years with a recommended less aggressive approach to start treatment for patients who have persistent systolic BP ≥150 mm Hg to achieve a target of <150 mm Hg to reduce risk for stroke, cardiac events, and death in individuals ≥60 years of age (77). Further, the “2017 ACC/AHA/HFSA Focused Update of the 2013 ACCF/AHA Guideline for the Management of Heart Failure” recommends a BP goal of <130/80 mm Hg for patients with hypertension and at increased risk of developing cardiovascular disease (78). The recommendation is based on evidence of new RCT data and the fact that BP measurements as generally taken in the office setting are typically 5 to 10 mm Hg higher than research measurements. Our current meta-analysis includes the extensive body of evidence from additional patients supporting the benefit of more aggressive control in the prevention of cardiovascular disease and stroke.
Conclusions: Part 2 Proper treatment of high BP is critical due to the health risks associated with uncontrolled or insufficiently controlled BP. The results of our meta-analysis are consistent with other recent meta-analyses which demonstrate that BP lowering significantly reduced the risk of cardiovascular morbidity and mortality regardless of meta-analytic method, comorbid condition, or mean age of study participant. Additionally, we have shown that BP lowering to a target of <130 mm Hg may reduce the risk of several important outcomes including risk of MI, stroke, heart failure, and major cardiovascular events.
by guest on May 6, 2018
http://hyper.ahajournals.org/D
ownloaded from
Reboussin DM, et al. 2017 High Blood Pressure Systematic Review
Page 23
Part 3: First-Line Antihypertensive Drug Class Comparisons in Adults
Introduction: Part 3 Hypertension is a leading cause of death worldwide, and its prevalence has increased dramatically over the past 2 decades (34). Elevated BP levels contribute to more than two thirds of the burden of stroke and half the burden of ischemic heart disease (79). Antihypertensive therapies have established benefits in reducing the risk for major cardiovascular events; however, the benefits of any one class of antihypertensive therapies as a first-line therapy, relative to other classes, is still debated. Several meta-analyses have examined these questions, but additional contemporary trials not included in prior publications may provide an improved understanding of the relative benefits for each class of antihypertensive therapies. We conducted a network meta-analysis of trials that compared any 2 classes of antihypertensive therapies used as first-line pharmacotherapy for high BP including thiazide and thiazide-like diuretics (THZs), ACEIs, angiotensin-receptor blockers (ARBs), calcium channel blockers (CCBs), and beta blockers. Our objective was to examine the comparative benefits and harms of different antihypertensive classes in adults with hypertension.
Methods: Part 3 This systematic review adhered to the Preferred Reporting Items for Systematic Reviews and Meta-Analyses statement and to recommendations of the “ACCF/AHA Clinical Practice Guideline Methodology Summit Report” (5, 30).
Search Strategy and Information Sources An electronic literature search was performed by Doctor Evidence, a global medical evidence software and services company, across PubMed and EMBASE from 1966 to March 30, 2015, using key words and relevant subject headings for “hypertension” combined with terms for the interventions of interest Online Data Supplement Part 3, Table 3.1.
Eligibility Criteria RCTs were considered for inclusion if they met the eligibility criteria outlined in the Online Data Supplement (Part 3, Table 3.1.1; Figure 3) according to the systematic review question framework. Study population criteria required that study participants be adults ≥18 years of age with primary hypertension or hypertension due to CKD. The study interventions must have used as first-line therapy for hypertension: THZs, ACEIs, ARBs, CCBs, or beta blockers. Comparators were the same as described for the interventions as long as they represented a different class of antihypertensive medication than the intervention. There were 8 outcome criteria that we established including: all-cause mortality, cardiovascular mortality, heart failure, stroke, MI, composite cardiovascular events, major adverse cardiac events, and renal outcomes. Outcomes must have occurred after at least 48 weeks of follow-up. Heart failure, stroke, and MI outcomes included fatal and nonfatal events; composite cardiovascular outcomes included MI, stroke, CHF, acute coronary syndrome, peripheral artery disease, angina, and/or coronary revascularizaion; major adverse cardiac events included cardiovascular outcomes and mortality; and renal outcomes included end-stage renal disease, dialysis, doubling of creatinine, halving of estimated glomerular filtration rate, and/or dialysis. The definition of some outcomes varied across studies; however, within trials, the outcomes were the same across treatments.
by guest on May 6, 2018
http://hyper.ahajournals.org/D
ownloaded from

Reboussin DM, et al. 2017 High Blood Pressure Systematic Review
Page 24
Additional criteria required that studies include at least 100 randomized patients or at least 400 patient years of follow-up to ensure adequate sample size. These are commonly used thresholds for restricting randomized controlled trials in systematic reviews (80). Studies of combination therapy were allowed as long as the combinations contained ≥1 drug of the classes listed previously and ≥2 classes were compared.
Study Selection A trained medical librarian screened the titles and abstracts of studies against predefined selection criteria using a software environment with features such as color coding and ranking of relevant key words across PubMed and EMBASE from 1966 to March 30, 2015. A second medical librarian performed quality control using the same tools. The chief medical officer and the project methodologist reviewed all included abstracts and a random sample of excluded abstracts, managed discrepancies between librarians, and decided on studies of uncertain eligibility. Members of the ERC were divided into pairs and performed dual independent review of full-text articles in the DOC Library software platform (Doctor Evidence. 2016. DOC Library. Santa Monica, CA: Doctor Evidence, LLC) Disagreements were resolved through discussion between the 2 reviewers and the ERC chair.
Data Extraction and Quality Assessment Data extraction was performed using the DOC Data 2.0 (Doctor Evidence. 2016. DOC Data, Version 2.0. Santa Monica, CA: Doctor Evidence, LLC) software platform using a standard template for predefined data points. Authors were contacted regarding discrepancies and missing information. Included studies were single extracted by an evidence analyst with software validation and data entry error prevention and with each data point verified against the source article by a quality control analyst (single extraction with sequential quality control). Discrepancies were resolved by the project methodologist and/or the chief medical officer. Subsequent dataset-level quality control (to identify outliers and ensure consistency of data across studies) was performed by an evidence audit specialist. An ontology specialist managed the naming of outcomes based on author-reported names and definitions. Although a systematic assessment of the quality of studies was not conducted, assessment of bias, using Cochrane’s collaboration tool for assessing risk of bias, was used selectively on individual studies when/if needed during the analytic process. Because of the large number of studies and the extent of heterogeneity associated with other factors (which will be assessed), a comprehensive review of risk of bias was impractical.
Data Synthesis and Analysis Random-effects Bayesian network meta-analyses were conducted to compare multiple antihypertensive treatments within the same statistical model. The unit of analysis was at the individual study level. We conducted a network meta-analysis where the randomization of comparisons within trials are maintained (the direct comparisons), while simultaneously, all available comparisons of treatments across trials are also used (indirect comparisons) (80). The network meta-analysis allows us to combine all available direct and indirect comparisons of antihypertension medication classes (rather than be limited to a standard meta-analysis reporting only direct pairwise comparisons). For dichotomous outcomes the logarithm of the RR for each trial and its standard error was calculated. We fit a linear mixed model to the log RRs from each trial with a random effect specific to each pair of treatments. Pooled network estimates were reported at RR and 95% credible intervals (CrI). Model fit and model comparisons was assessed using convergence, residual deviance, leverage, deviance information criteria, and analysis of heterogeneity (81).
We conducted stratified analysis among population subgroups including those with and without diabetes mellitus, men, women, blacks, and age-strata (≥65 years of age). The number of studies for the subgroup analyses was limited and, in some cases, there were not enough data to run the network analysis and report pooled network risk estimates for a particular outcome and subgroup. Although many of the
by guest on May 6, 2018
http://hyper.ahajournals.org/D
ownloaded from

Reboussin DM, et al. 2017 High Blood Pressure Systematic Review
Page 25
individual studies may report risk estimates for subgroup analyses, if they do not also report the binary data then we did not include them in our analyses.
Analyses were performed using an online platform (Doctor Evidence. 2016. DOC Data, Version 2.0. Santa Monica, CA: Doctor Evidence, LLC) using the integrated R Project for Statistical Computing package gemtc.
Results: Part 3 A total of 144 publications were considered for inclusion in this study as shown in Figure 3. Eighty-six publications were subsquently excluded from the primary analyses. Most were excluded because they did not include an outcome of interest, but others were excluded for these reasons: outcomes reported in another publication, outcome presented by subgroup only, intent-to-treat analysis not presented (per protocol results only), or results were provided as rates and event counts were unavailable. The network diagrams for each of the outcomes show the geometry of the relationships between classes (see Online Data Supplement Part 3, Figures 3.1, 3.2, 3.3, 3.4, 3.5, 3.6, 3.7, and 3.8). They show which classes (nodes) have been compared head to head in randomized controlled trials and which have been compared indirectly by having been compared in separate trials to common comparators. Depending on the outcome, the indirect comparisons contributing to the pooled network estimates used information from 3 to 40 studies. In each of the network diagrams, the trials that are included in each pairwise comparison are labeled above the arrow, while the pooled pairwise RR (95% CI) for the direct comparison are shown below the arrow. For example, in the first network diagram for all-cause mortality (see Online Data Supplement Part 3, Figure 3.1), ACEIs are common comparator for ARBs, CCBs, THZs, and beta blockers. For each pair-wise comparison, the arrowhead points to the class of antihypertensive medication for which a higher RR would reflect an increased risk of the outcome.
Online Data Supplement Part 3, Table 3.2, presents a summary of the trials and the demographic and clinical characteristics of the participants. A total of 152,379 patients are included in these meta-analyses with an average of 3.5 years of follow-up. Studies were published between 1985 and 2014. The number of patients randomized per trial ranged from 102 to 33,357, with the largest being ALLHAT (Antihypertensive and Lipid-Lowering Treatment to Prevent Heart Attack Trial). Many of the studies were conducted among individuals with comorbid conditions including diabetes mellitus, end-stage renal disease, patients on dialysis, or with stage 3 CKD (i.e., those with an estimated glomerular filtration rate <60 mL/min/m2). Fourteen trials included a THZ arm, 25 had an ACEI arm, 9 had an ARB arm, 28 had a CCB arm, and 10 had a beta blockers arm. Each trial’s class-to-class comparisons are shown in the network diagrams for each outcome. Online Data Supplement Part 3, Table 3.3, reports the number of study participants and all-cause mortality events in each of the included trials by antihypertensive medication class. ALLHAT contributed the largest number of trial participants in the CCB, ACEI, and THZ classes for all of our outcomes. The ASCOT-BPLA (Anglo-Scandinavian Cardiac Outcomes Trial-Blood Pressure Lowering Arm trial contributed the largest number of participants randomized to beta blockers for all-cause mortality, cardiovascular mortality, MI, and heart failure; with the Losartan Intervention For Endpoint reduction study (82) contributing the largest number of participants in the beta blockers group for stroke and cardiovascular composite events.
The pooled network risk estimates (which incorporates estimates from both direct and indirect comparisons) associated with all-cause mortality are provided in Online Data Supplement Part 3, Figure 3.9. These results show all the relative treatment effect estimates of each of the antihypertensive medication class compared to THZ. Online Data Supplement Part 3, Figure 3.9.1 shows the pooled network relative risks associated with each of the first line antihypertensive medication classes compared to THZ for all of the outcomes.. The RRs of all-cause mortality were 1.0 (95% CrI: 0.95–1.1) for ACEIs; 0.99 (95% CrI: 0.88–1.1) for ARBs; 1.1 (95% CrI: 0.98–1.2) for beta blockers; and 0.97 (95% CrI: 0.90–1.1) for CCBs, compared with THZs (see Online Data Supplement Part 3, Figure 3.9). The RRs of cardiovascular mortality were 1.1 (95% CrI: 0.92–1.3) for ACEIs; 1.1 (95% CrI: 0.87–1.5) for ARBs; 1.2 (95% CrI: 0.98–1.4) for beta blockers; and 1.0 (95% CrI:
by guest on May 6, 2018
http://hyper.ahajournals.org/D
ownloaded from
Reboussin DM, et al. 2017 High Blood Pressure Systematic Review
Page 26
0.86–1.2) for CCBs, compared with THZ (see Online Data Supplement Part 3, Figure 3.10). Only the 20% increased risk of cardiovascular mortality associated with of beta blockers compared with THZ was (borderline) significant. Also, the risk of cardiovascular mortality was higher (and borderline significant) for beta blockers compared with CCBs with a RR of 1.2 (95% CrI: 0.98–1.4; see Online Data Supplement Part 3, Table 3.4).
The RRs of CHF were 1.2 (95% CrI: 0.91–1.5) for ACEIs; 1.1 (95% CrI: 0.79–1.6) for ARBs; 1.3 (95% CrI: 0.94–1.7) for beta blockers; and 1.3 (95% CrI: 1.0–1.6) for CCBs, compared with THZs (see Online Data Supplement Part 3, Figure 3.11). Patients on CCBs had a 30% greater risk of CHF compared with those on THZs. The RRs of stroke were 1.1 (95% CrI: 0.98–1.4) for ACEIs; 1.1 (95% CrI: 0.88–1.4) for ARBs; 1.3 (95% CrI: 1.1–1.6) for beta blockers; and 0.96 (95% CrI: 0.83–1.2), for CCB, compared with THZs (see Online Data Supplement Part 3, Figure 3.12). There was also a borderline significant increased risk of stroke for ACEIs and beta blockers compared with CCBs with RRs of 1.2 (95% CrI: 1–1.4) and 1.4 (95% CrI: 1.1–1.7), respectively (see Online Data Supplement Part 3, Table 3.5). The RRs of cardiovascular events were 1.1 (95% CrI: 0.96–1.3) for ACEIs; 1 (95% CrI: 0.89–1.2) for ARBs; 1.2 (95% CrI: 1–1.4) for beta blockers; and 1.1 (95% CrI: 0.98–1.2) for CCBs, compared with THZs (see Online Data Supplement Part 3, Figure 3.13). The risk of cardiovascular events was reduced (and borderline significant) for ARBs compared with beta blockers with a RR of 0.88 (95% CrI: 0.78–1.0; see Online Data Supplement Part 3, Table 3.6). There were no significant risks of all-cause mortality, MI, or renal outcomes for any of the antihypertensive medication class to class comparisons.
To investigate whether these results were consistent by race, we conducted stratified analyses among studies with predominantly black study populations (defined as studies reporting subgroup analysis in blacks or having populations with at least 85% black) or which published race-specific analyses. We observed no significant differences in all-cause mortality, cardiovascular mortality, MI, CHF, cardiovascular events, or renal outcomes among blacks for any of the class-by-class comparisons. For all-cause mortality, there were 4 studies among blacks (ALLHAT, African American Study of Kidney Disease and Hypertension [AASK], Agarwal, and Sareli; see Online Data Supplement Part 3, Table 3.7). The RRs of all-cause mortality among blacks were 1.1 (95% CrI: 0.96–1.2) for ACEIs; 1.3 (95% CrI: 0.87–2.0) for beta blockers; and 0.98 (95% CrI: 0.88–1.1) for CCBs, compared with THZs (see Online Data Supplement Part 3, Figure 3.14). For cardiovascular mortality, there were also 4 studies among blacks (ALLHAT, AASK, Losartan Intervention For Endpoint reduction [LIFE], and Agarwal; see Online Data Supplement Part 3, Table 3.8). The RRs of cardiovascular mortality among blacks were 1.0 (95% CrI: 0.68–1.6) for ACEIs; 1.2 (95% CrI: 0.40–3.5) for ARBs; 0.81 (95% CrI: 0.35–1.8) for beta blockers; and 1.0 (95% CrI: 0.65–1.5) for CCBs, compared with THZs (see Online Data Supplement Part 3, Figure 3.15). For MI, there were 3 studies among blacks (ALLHAT, LIFE, and Agarwal; see Online Data Supplement Part 3, Table 3.9). The RRs of MI among blacks were 1.1 (95% CrI: 0.42–2.7) for ACEIs; 1.4 (95% CrI: 0.1–20) for ARBs; 0.62 (95% CrI: 0.06–5.9) for beta blockers; and 1.0 (95% CrI: 0.39–2.6) for CCBs, compared with THZs (see Online Data Supplement Part 3, Figure 3.16). For CHF, there were 3 studies among blacks (ALLHAT, AASK, and Agarwal; see Online Data Supplement Part 3, Table 3.10). The RR of CHF among blacks were 1.4 (95% CrI: 0.68–3.2) for ACEIs; 1.2 (95% CrI: 0.44–3.2) for beta blockers; and 1.4 (95% CrI: 0.60–2.8) for CCBs, compared with THZs (see Online Data Supplement Part 3, Figure 3.17). For stroke, there were 4 studies among blacks (ALLHAT, AASK, LIFE, and Agarwal; see Online Data Supplement Part 3, Table 3.11). The RR of stroke among blacks was 1.4 (95% CrI: 0.70–2.8) for ACEIs; 2.5 (95% CrI: 0.72–9.2) for ARBs; 1.2 (95% CrI: 0.48–3.0) for beta blockers; and 0.94 (95% CrI: 0.48–1.9) for CCBs, compared with THZs (see Online Data Supplement Part 3, Figure 3.18). For composite cardiovascular events, there were 4 studies among blacks (ALLHAT, AASK, LIFE, and Agarwal; see Online Data Supplement Part 3, Table 3.12). The RR of composite cardiovascular events among blacks were 1.2 (95% CrI: 0.64–2.2) for ACEIs; 1.42 (95% CrI: 0.52–4.6) for ARBs; 0.90 (95% CrI: 0.42–2.1) for beta blockers; and 1.0 (95% CrI: 0.52–1.8) for CCBs, compared with THZs (see Online Data Supplement Part 3, Figure 3.19). For renal events, there were only 2 studies among blacks (ALLHAT and AASK), and there were insufficient comparisons to calculate the analysis of heterogenity.
At the request of the writing committee, we also examined effects by multiple subgroups of interest including age, race, sex, and diabetes mellitus status. Additional findings for each of the outcomes assessed
by guest on May 6, 2018
http://hyper.ahajournals.org/D
ownloaded from
Reboussin DM, et al. 2017 High Blood Pressure Systematic Review
Page 27
(which are not discussed or referenced in the text) can be found in the Online Data Supplement Part 3 (Tables 3.13 through 3.65; and Figures 3.20 through 3.34). However, we found no significant effects—likely due to the relatively few studies for each class-to-class comparison with published data available for these analyses—thus these findings should be interpreted with caution.
Discussion: Part 3 In this meta-analysis, we found that no class of medications (i.e., ACEIs, ARBs, CCBs, or beta blockers) was significantly better than THZs as a first-line therapy for any outcome. THZs were associated with a significantly lower risk of stroke and cardiovascular events as compared to beta blockers and a lower risk of heart failure compared with CCBs. THZs also tended to be associated (that is, with credible intervals that excluded 0.95) with a lower risk of cardiovascular events and stroke compared with ACEIs, a lower risk of all-cause mortality and cardiovascular mortality compared with beta blockers, and a lower risk of cardiovascular events compared with CCBs. No significant differences were noted in analyses stratified by race, sex, age or diabetes mellitus status; however, given the relatively few numbers of studies and/or little overlap in comparison groups for all of the outcomes, these findings from subgroup analyses should be interpreted with caution. Our findings are generally consistent with prior meta-analyses (80, 83, 84). Network meta-analyses methods have been introduced relatively recently and provide many methodological advantages, compared with running individual meta-analyses for each class-to-class comparison. The network meta-analysis allowed us to make many comparisons of antihypertensive drug classes that were not studied in trials as direct head-to-head comparisons by generating a network of trials where each trial has at least 1 antihypertensive drug class in common with another. In doing so, the network meta-analysis incorporates all available evidence (strengthening the evidence base); allows the comparisons of antihypertensive drug classes with the same base comparator; consists of a simultaneous analysis of all treatmens; and finally, it allows for more potential subgroup analysis. To our knowledge, only 1 publication, prior to this one, has used these methods (80). Consistent with our findings, this study by Psaty et al (80) found that diuretics were associated with a lower risk of cardiovascular events and stroke compared with ACEIs They also found that as compared to ACEIs, diuretics were associated with a 26% lower risk of heart failure. Although we found no significant association of THZs compared with ACEIs with heart failure, this may be attributable to differences in the number of studies included and the additional inclusion in this study of more contemporary trials in which heart failure is more commonly assessed. For example, the previous findings included trials that compared antihypertensive medication classes to placebo controls, while in our study, we excluded placebo-controlled trials (80). This may be the reason why the Psaty et al study demonstated risk estimates of greater magnitude that we did; however, the direction of risk across class-to-class comparisons were generally the same. Consistent with the Psaty et al study, we found that diuretics compared with beta blockers were associated with a lower risk of cardiovascular events. We additionally found that they were associated with a lower risk of cardiovascular mortality. When diuretics were compared with CCBs, they have been found to be consistently associated with a lower risk of heart failure. Although in contrast to the study by Psaty et al (80), we found no association with cardiovascular events. Prior traditional meta-analyses have been relatively consistent with the findings from our network meta-analyses. One study found that diuretics were associated with a lower risk of heart failure and stroke, although this was borderline in overall results (37). Similar to our findings, CCBs have previously been found to be associated with higher risk of heart failure and beta blockers with a higher risk of stroke (37, 83, 85). Understanding the benefits of one antihypertensive drug class versus another is of critical importance in determining which first-line medication should be recommended and informing clinical treatment decisions. Network meta-analytic methods allow us to incorporate direct and indirect evidence, thus using all available trial data to provide a valid estimate of the risks or benefits associated with one class of first-line medications versus another. Our findings support prior studies that have demonstrated a lower risk of many major cardiovascular events among individuals taking THZs versus other classes (80, 83, 84).
by guest on May 6, 2018
http://hyper.ahajournals.org/D
ownloaded from
Reboussin DM, et al. 2017 High Blood Pressure Systematic Review
Page 28
This systematic review has many strengths including a rigourous protocol that was strictly followed and use of sophisticated network meta-analytic methods that took advantage of all of the data available. However, there are some limitations that must be acknowledged. Our study only included published data. The trials we included had differences in study designs, specific drugs (within each class) being compared, and outcomes definitions. In summary, we found that THZs were associated with a lower risk of many cardivoascular outcomes compared with other antihypertensive drug classes. This large and contemporary network meta-analysis supports prior findings that recommend THZs as the choice for first-line antihypertensive treatment among individuals with uncomplicated hypertension. Future studies should continue to examine whether these results are consistent across subgroups that vary by demographic or clinical characteristics.
by guest on May 6, 2018
http://hyper.ahajournals.org/D
ownloaded from

Reboussin DM, et al. 2017 High Blood Pressure Systematic Review
Page 29
Figure 3. PRISMA Diagram of the Manuscripts Included in the Analyses
8929 Records identified through database search (MEDLINE/EMBASE)
8929 Titles/Abstracts screened
715 Full-text articles assessed for eligibility
58 Studies used in meta-analysis
8214 Records excluded
571 Full-text articles excluded Reasons for exclusion: • 27 Populations not of interest • 33 Interventions not of interest • 21 Nonclinical study • 36 Inadequate number of
participants • 70 Overlapping data • 104 Outcomes not of interest • 117 Incorrect follow-up • 86 Comparison not of interest • 59 Study design not of interest • 16 Outcome stratification not of
interest • 2 Journal retraction
86 Articles excluded from analysis Reason for exclusion:
Methodologic inconsistencies
Iden
tific
atio
n Sc
reen
ing
Elig
ibili
ty
Incl
uded
M
eta-
anal
ysis
144 Studies included in database
PRISMA indicates Preferred Reporting Items for Systemic Reviews and Meta-Analyses
by guest on May 6, 2018
http://hyper.ahajournals.org/D
ownloaded from
Reboussin DM, et al. 2017 High Blood Pressure Systematic Review
Page 30
Presidents and Staff American College of Cardiology Mary Norine Walsh, MD, FACC, President Shalom Jacobovitz, Chief Executive Officer William J. Oetgen, MD, MBA, FACC, Executive Vice President, Science, Education, Quality, and Publishing Amelia Scholtz, PhD, Publications Manager, Science, Education, Quality, and Publishing American College of Cardiology/American Heart Association Katherine Sheehan, PhD, Director, Guideline Strategy and Operations Abdul R. Abdullah, MD, Science and Medicine Advisor Naira Tahir, MPH, Guideline Advisor American Heart Association John J. Warner, MD, President Nancy Brown, Chief Executive Officer Rose Marie Robertson, MD, FAHA, Chief Science and Medicine Officer Gayle R. Whitman, PhD, RN, FAHA, FAAN, Senior Vice President, Office of Science Operations Jody Hundley, Production Manager, Scientific Publications, Office of Science Operations Key Words: ACC/AHA Clinical Practice Guidelines ■ Evidence Review Committee ■ meta-analysis ■ blood pressure ■ hypertension ■ home blood pressure monitoring ■ blood pressure ■ targets ■ antihypertensive drug class ■ risk reduction ■ treatment outcomes ■ cardiovascular disease
by guest on May 6, 2018
http://hyper.ahajournals.org/D
ownloaded from
Reboussin DM, et al. 2017 High Blood Pressure Systematic Review
Page 31
Appendix 1. Evidence Review Committee Relationships With Industry and Other Entities (Relevant)—Systematic Review for the 2017 ACC/AHA/AAPA/ABC/ACPM/AGS/APhA/ASH/ASPC/NMA/PCNA Guideline for the Prevention, Detection, Evaluation, and Management of High Blood Pressure in Adults
Committee Member Employment Consultant
Speakers Bureau
Ownership/ Partnership/ Principal
Personal Research
Institutional, Organizational or Other Financial Benefit Expert Witness
David M. Reboussin (Chair)
Wake Forest School of Medicine—Professor, Department of Biostatistics
None None None None None None
Norrina B. Allen
Northwestern University Feinberg School of Medicine—Assistant Professor, Department of Preventive Medicine
None None None None None None
Michael E. Griswold
University of Mississippi Medical Center—Professor & Chair, Department of Data Science
None None None None None None
Eliseo Guallar
Johns Hopkins Bloomberg School of Public Health—Professor, Department of Epidemiology
None None None None None None
Yuling Hong Centers for Disease Control and Prevention, National Center for Chronic Disease Prevention and Health Promotion—Associate Director of Science, Division for Heart Disease and Stroke Prevention
None None None None None None
Daniel T. Lackland
Medical University of South Carolina—Professor of Epidemiology, Department of Neurology; Director, Division of Translational Neurosciences and Population Studies
None None None None None None
Edgar (Pete) R. Miller III
Johns Hopkins University—Professor of Medicine
None None None None None None
Tamar Polonsky
University of Chicago—Assistant Professor, Section of Cardiology
None None None None None None
by guest on May 6, 2018
http://hyper.ahajournals.org/D
ownloaded from

Reboussin DM, et al. 2017 High Blood Pressure Systematic Review
Page 32
Angela M. Thompson-Paul
Centers for Disease Control and Prevention, National Center for Chronic Disease Prevention and Health Promotion —Epidemiologist, Division of Heart Disease and Stroke Prevention
None None None None None None
Suma Vupputuri
Kaiser Permanente Mid-Atlantic States—Research Scientist, Mid-Atlantic Permanente Research Institute
None None None None • Sanofi*† None
This table represents all relationships of ERC members with industry and other entities that were reported by authors, including those not deemed to be relevant to this document, at the time this document was under development. The table does not necessarily reflect relationships with industry at the time of publication. A person is deemed to have a significant interest in a business if the interest represents ownership of ≥5% of the voting stock or share of the business entity, or ownership of ≥$5,000 of the fair market value of the business entity; or if funds received by the person from the business entity exceed 5% of the person’s gross income for the previous year. Relationships that exist with no financial benefit are also included for the purpose of transparency. Relationships in this table are modest unless otherwise noted. Please refer to http://www.acc.org/guidelines/about-guidelines-and-clinical-documents/relationships-with-industry-policy for definitions of disclosure categories or additional information about the ACC/AHA Disclosure Policy for Writing Committees. *Indicates significant relationship. †Dr. Vupputuri entered into a relationship as a subcontracted co-investigator on July 5, 2017, via the MidAtlantic Permanente Research Institute and the Center for Health Research at Kaiser Permanente Northwest, as part of a retrospective cohort study funded by Sanofi. The contract itself was between the MidAtlantic Permanente Research Institute and the Center for Health Research at Kaiser Permanente Northwest. Although funding was processes via two research organizations, this was still considered to be “RWI” and is thus listed in the disclosure table. At this time, the ERC had already worked approximately three years, and all data gathering, analyses, and conclusions had already been formulated. Nevertheless, relevant analyses and sections of the ERC report were independently scientifically reviewed by David M. Reboussin, Norrina B. Allen, Daniel T. Lackland, Michael E. Griswold, Edgar (Pete) R. Miller III, Eliseo Guallar, Tamar Polonsky, Yuling Hong, and Angela M. Thompson-Paul, and this review and the finalized ERC report were then re-vetted and voted on for endorsement by the ERC and the hypertension guideline writing committee. AAPA indicates American Academy of Physician Assistants; ABC, Association of Black Cardiologists; ACC, indicates American College of Cardiology; ACPM, American College of Preventive Medicine; AGS, American Geriatrics Society; AHA, American Heart Association; APhA, American Pharmacists Association; ASH, American Society of Hypertension; ASPC, American Society for Preventive Cardiology; ERC, evidence review committee; NMA, National Medical Association; and PCNA, Preventive Cardiovascular Nurses Association.
by guest on May 6, 2018
http://hyper.ahajournals.org/D
ownloaded from

Reboussin DM, et al. 2017 High Blood Pressure Systematic Review
Page 33
Appendix 2. Abbreviations ABPM = ambulatory blood pressure monitoring ACEI = angiotensin-converting enzyme inhibitors ARB = angiotensin-receptor blockers BP = blood pressure CCB = calcium channel blockers CHF = congestive heart failure CI = confidence interval CKD = chronic kidney disease CrI = credible interval ERC = evidence review committee MI = myocardial infarction RCT = randomized controlled trial RR = relative risk THZ = thiazide and thiazide-like diuretics
by guest on May 6, 2018
http://hyper.ahajournals.org/D
ownloaded from
Reboussin DM, et al. 2017 High Blood Pressure Systematic Review
Page 34
References
1. Committee on Standards for Developing Trustworthy Clinical Practice Guidelines, Institute of Medicine (U.S.). Clinical Practice Guidelines We Can Trust. Washington, DC: National Academies Press; 2011.
2. Committee on Standards for Systematic Reviews of Comparative Effectiveness Research, Institute of Medicine (U.S.). Finding What Works in Health Care: Standards for Systematic Reviews. Washington, DC: National Academies Press; 2011.
3. ACCF/AHA Task Force on Practice Guidelines. Methodology Manual and Policies From the ACCF/AHA Task Force on Practice Guidelines. American College of Cardiology and American Heart Association, 2010. Available at: http://assets.cardiosource.com/Methodology_Manual_for_ACC_AHA_Writing_Committees.pdf and http://professional.heart.org/idc/groups/ahamah-public/@wcm/@sop/documents/downloadable/ucm_319826.pdf. Accessed September 15, 2017.
4. Halperin JL, Levine GN, Al-Khatib SM, et al. Further evolution of the ACC/AHA clinical practice guideline recommendation classification system: a report of the American College of Cardiology/American Heart Association Task Force on Clinical Practice Guidelines. Circulation. 2016;133:1426-28.
5. Jacobs AK, Kushner FG, Ettinger SM, et al. ACCF/AHA clinical practice guideline methodology summit report: a report of the American College of Cardiology Foundation/American Heart Association Task Force on Practice Guidelines. Circulation. 2013;127:268–310.
6. Jacobs AK, Anderson JL, Halperin JL. The evolution and future of ACC/AHA clinical practice guidelines: a 30-year journey: a report of the American College of Cardiology/American Heart Association Task Force on Practice Guidelines. Circulation. 2014;130:1208–17.
7. Mozaffarian D, Benjamin EJ, Go AS, et al. Heart disease and stroke statistics--2016 update: a report from the American Heart Association. Circulation. 2016;133:e38-360.
8. Pickering TG, Miller NH, Ogedegbe G, et al. Call to action on use and reimbursement for home blood pressure monitoring: a joint scientific statement from the American Heart Association, American Society of Hypertension, and Preventive Cardiovascular Nurses Association. Hypertension. 2008;52:10-29.
9. Mancia G, Fagard R, Narkiewicz K, et al. 2013 ESH/ESC guidelines for the management of arterial hypertension: the Task Force for the Management of Arterial Hypertension of the European Society of Hypertension (ESH) and of the European Society of Cardiology (ESC). Eur Heart J. 2013;34:2159-219.
10. Fujiwara T, Nishimura T, Ohkuko T, et al. Rationale and design of HOMED-BP Study: hypertension objective treatment based on measurement by electrical devices of blood pressure study. Blood Press Monit. 2002;7:77-82.
11. Bliziotis IA, Destounis A, Stergiou GS. Home versus ambulatory and office blood pressure in predicting target organ damage in hypertension: a systematic review and meta-analysis. J Hypertens. 2012;30:1289-99.
12. Gaborieau V, Delarche N, Gosse P. Ambulatory blood pressure monitoring versus self-measurement of blood pressure at home: correlation with target organ damage. J Hypertens. 2008;26:1919-27.
13. Ward AM, Takahashi O, Stevens R, et al. Home measurement of blood pressure and cardiovascular disease: systematic review and meta-analysis of prospective studies. J Hypertens. 2012;30:449-56.
14. Uhlig K, Patel K, Ip S, et al. Self-measured blood pressure monitoring in the management of hypertension: a systematic review and meta-analysis. Ann Intern Med. 2013;159:185-94.
15. Marquez-Contreras E, Martell-Claros N, Gil-Guillen V, et al. Efficacy of a home blood pressure monitoring programme on therapeutic compliance in hypertension: the EAPACUM-HTA study. J Hypertens. 2006;24:169-75.
16. Staessen JA, Den Hond E, Celis H, et al. Antihypertensive treatment based on blood pressure measurement at home or in the physician's office: a randomized controlled trial. JAMA. 2004;291:955-64.
by guest on May 6, 2018
http://hyper.ahajournals.org/D
ownloaded from

Reboussin DM, et al. 2017 High Blood Pressure Systematic Review
Page 35
17. Soghikian K, Casper SM, Fireman BH, et al. Home blood pressure monitoring. Effect on use of medical services and medical care costs. Med Care. 1992;30:855-65.
18. Bosworth HB, Olsen MK, Grubber JM, et al. Two self-management interventions to improve hypertension control: a randomized trial. Ann Intern Med. 2009;151:687-95.
19. McKinstry B, Hanley J, Wild S, et al. Telemonitoring based service redesign for the management of uncontrolled hypertension: multicentre randomised controlled trial. BMJ. 2013;346:f3030.
20. Midanik LT, Resnick B, Hurley LB, et al. Home blood pressure monitoring for mild hypertensives. Public Health Rep. 1991;106:85-9.
21. Godwin M, Lam M, Birtwhistle R, et al. A primary care pragmatic cluster randomized trial of the use of home blood pressure monitoring on blood pressure levels in hypertensive patients with above target blood pressure. Fam Pract. 2010;27:135-42.
22. Verberk WJ, Kroon AA, Lenders JWM, et al. Self-measurement of blood pressure at home reduces the need for antihypertensive drugs: a randomized, controlled trial. Hypertension. 2007; 50:1019-25.
23. McManus RJ, Mant J, Roalfe A, et al. Targets and self monitoring in hypertension: randomised controlled trial and cost effectiveness analysis. BMJ. 2005;331:493.
24. Varis J, Kantola I. The choice of home blood pressure result reporting method is essential: results mailed to physicians did not improve hypertension control compared with ordinary office-based blood pressure treatment. Blood Press. 2010;19:319-24.
25. Oliver S, Jones J, Leonard D, et al. Improving adherence with amlodipine/atorvastatin therapy: IMPACT study. J Clin Hypertens (Greenwich). 2011;13:598-604.
26. Hebert PL, Sisk JE, Tuzzio L, et al. Nurse-led disease management for hypertension control in a diverse urban community: a randomized trial. J Gen Intern Med. 2012;27:630-9.
27. Margolis KL, Asche SE, Bergdall AR, et al. Effect of home blood pressure telemonitoring and pharmacist management on blood pressure control: a cluster randomized clinical trial. JAMA. 2013;310:46-56.
28. Magid DJ, Olson KL, Billups SJ, et al. A pharmacist-led, American Heart Association Heart 360 Web-enabled home blood pressure monitoring program. Circ Cardiovasc Qual Outcomes. 2013;6:157-63.
29. Hosseininasab M, Jahangard-Rafsanjani Z, Mohagheghi A, et al. Self-monitoring of blood pressure for improving adherence to antihypertensive medicines and blood pressure control: a randomized controlled trial. Am J Hypertens. 2014;27:1339-45.
30. Liberati A, Altman DG, Tetzlaff J, et al. The PRISMA statement for reporting systematic reviews and meta-analyses of studies that evaluate healthcare interventions: explanation and elaboration. BMJ. 2009;339:b2700.
31. Higgins JPT, Altman DG, Gotzsche PC, et al. The Cochrane Collaboration's tool for assessing risk of bias in randomised trials. Br Med J (Clin Res Ed). 2011;343:d5928.
32. Centers for Disease Control and Prevention. Self-Measured Blood Pressure Monitoring: Action Steps for Clinicians. Atlanta, GA: Centers for Disease Control and Prevention, U.S. Dept of Health and Human Services; 2014:3-10.
33. Xu W, Goldberg SI, Shubina M, et al. Optimal systolic blood pressure target, time to intensification, and time to follow-up in treatment of hypertension: population based retrospective cohort study. BMJ. 2015;350:h158.
34. GBD 2013 Risk Factors Collaborators, Forouzanfar MH, Alexander L, et al. Global, regional, and national comparative risk assessment of 79 behavioural, environmental and occupational, and metabolic risks or clusters of risks in 188 countries, 1990-2013: a systematic analysis for the Global Burden of Disease Study 2013. Lancet. 2015;386:2287-323.
35. Danaei G, Finucane MM, Lin JK, et al. National, regional, and global trends in systolic blood pressure since 1980: systematic analysis of health examination surveys and epidemiological studies with 786 country-years and 5.4 million participants. Lancet. 2011;377:568-77.
by guest on May 6, 2018
http://hyper.ahajournals.org/D
ownloaded from
Reboussin DM, et al. 2017 High Blood Pressure Systematic Review
Page 36
36. Lim SS, Vos T, Flaxman AD, et al. A comparative risk assessment of burden of disease and injury attributable to 67 risk factors and risk factor clusters in 21 regions, 1990-2010: a systematic analysis for the Global Burden of Disease Study 2010. Lancet. 2012;380:2224-60.
37. Thomopoulos C, Parati G, Zanchetti A. Effects of blood pressure lowering on outcome incidence in hypertension: 7. Effects of more vs. less intensive blood pressure lowering and different achieved blood pressure levels - updated overview and meta-analyses of randomized trials. J Hypertens. 2016;34:613-22.
38. Xie X, Atkins E, Lv J, et al. Effects of intensive blood pressure lowering on cardiovascular and renal outcomes: updated systematic review and meta-analysis. Lancet. 2016;387:435-43.
39. Ettehad D, Emdin CA, Kiran A, et al. Blood pressure lowering for prevention of cardiovascular disease and death: a systematic review and meta-analysis. Lancet. 2016;387:957-67.
40. Rosendorff C, Lackland DT, Allison M, et al. Treatment of hypertension in patients with coronary artery disease: a scientific statement from the American Heart Association, American College of Cardiology, and American Society of Hypertension. J Am Coll Cardiol. 2015;65:1998-2038.
41. National Clinical Guideline Centre (UK). Hypertension: The Clinical Management of Primary Hypertension in Adults: Update of Clinical Guidelines 18 and 34. London, UK: Royal College of Physicians (UK); 2011.
42. Lackland DT, Roccella EJ, Deutsch AF, et al. Factors influencing the decline in stroke mortality: a statement from the American Heart Association/American Stroke Association. Stroke. 2014;45:315-53.
43. Bangalore S, Toklu B, Gianos E, et al. Optimal systolic blood pressure target after SPRINT: insights from a network meta-analysis of randomized trials. Am J Med. 2017;130:707-19.e8.
44. Bavishi C, Bangalore S, Messerli FH. Outcomes of intensive blood pressure lowering in older hypertensive patients. J Am Coll Cardiol. 2017;69:486-93.
45. Brunstrom M, Carlberg B. Effect of antihypertensive treatment at different blood pressure levels in patients with diabetes mellitus: systematic review and meta-analyses. BMJ. 2016;352:i717.
46. Weiss J, Freeman M, Low A, et al. Benefits and harms of intensive blood pressure treatment in adults aged 60 years or older: a systematic review and meta-analysis. Ann Intern Med. 2017;166:419-29.
47. Verdecchia P, Angeli F, Gentile G, et al. More versus less intensive blood pressure–lowering strategy: novelty and significance. Hypertension. 2016;68:642-53.
48. Benavente OR, Coffey CS, Conwit R, et al. Blood-pressure targets in patients with recent lacunar stroke: the SPS3 randomised trial. SPS3 Study Group. Lancet. 2013;382:507-15.
49. Wright JT Jr, Williamson JD, Whelton PK, et al. A randomized trial of intensive versus standard blood-pressure control. SPRINT Research Group. N Engl J Med. 2015;373:2103-16.
50. Lv J, Neal B, Ehteshami P, et al. Effects of intensive blood pressure lowering on cardiovascular and renal outcomes: a systematic review and meta-analysis. PLoS Med. 2012;9:e1001293.
51. Higgins JPT, Thompson SG, Deeks JJ, et al. Measuring inconsistency in meta-analyses. Br Med J (Clin Res Ed). 2003;327:557-60.
52. Higgins JPT, Thompson SG. Quantifying heterogeneity in a meta-analysis. Stat Med. 2002;21:1539-58. 53. Begg CB, Mazumdar M. Operating characteristics of a rank correlation test for publication bias.
Biometrics. 1994;50:1088-101. 54. Egger M, Davey Smith G, Schneider M, et al. Bias in meta-analysis detected by a simple, graphical test.
BMJ. 1997;315:629-34. 55. Viechtbauer W. Conducting a meta-analysis in R with the metafor package. J Statistical Software.
2010;36. 56. Sarnak MJ, Greene T, Wang X, et al. The effect of a lower target blood pressure on the progression of
kidney disease: long-term follow-up of the modification of diet in renal disease study. Ann Intern Med. 2005;142:342-51.
57. Norris K, Bourgoigne J, Gassman J, et al. Cardiovascular outcomes in the African American Study of Kidney Disease and Hypertension (AASK) Trial. Am J Kidney Dis. 2006;48:739-51.
by guest on May 6, 2018
http://hyper.ahajournals.org/D
ownloaded from
Reboussin DM, et al. 2017 High Blood Pressure Systematic Review
Page 37
58. Wright JT Jr, Bakris G, Greene T, et al. Effect of blood pressure lowering and antihypertensive drug class on progression of hypertensive kidney disease: results from the AASK trial. JAMA. 2002;288:2421-31.
59. Ruggenenti P, Perna A, Loriga G, et al. Blood-pressure control for renoprotection in patients with non-diabetic chronic renal disease (REIN-2): multicentre, randomised controlled trial. Lancet. 2005;365:939-46.
60. Asayama K, Ohkubo T, Metoki H, et al. Cardiovascular outcomes in the first trial of antihypertensive therapy guided by self-measured home blood pressure. Hypertens Res. 2012;35:1102-10.
61. Schrier RW, Abebe KZ, Perrone RD, et al. Blood pressure in early autosomal dominant polycystic kidney disease. N Engl J Med. 2014;371:2255-66.
62. Verdecchia P, Staessen JA, Angeli F, et al. Usual versus tight control of systolic blood pressure in non-diabetic patients with hypertension (Cardio-Sis): an open-label randomised trial. Lancet. 2009;374:525-33.
63. Ismail-Beigi F, Craven TE, O'Connor PJ, et al. Combined intensive blood pressure and glycemic control does not produce an additive benefit on microvascular outcomes in type 2 diabetic patients. Kidney Int. 2012;81:586-94.
64. Cushman WC, Evans GW, Byington RP, et al. Effects of intensive blood-pressure control in type 2 diabetes mellitus. ACCORD Study Group. N Engl J Med. 2010;362:1575-85.
65. Tight blood pressure control and risk of macrovascular and microvascular complications in type 2 diabetes: UKPDS 38. UK Prospective Diabetes Study Group. BMJ. 1998;317:703-13.
66. Davis EM, Appel LJ, Wang X, et al. Limitations of analyses based on achieved blood pressure: lessons from the African American Study of Kidney Disease and Hypertension Trial. Hypertension. 2011;57:1061-8.
67. JATOS Study Group. Principal results of the Japanese trial to assess optimal systolic blood pressure in elderly hypertensive patients (JATOS). Hypertens Res. 2008;31:2115-27.
68. Hayashi K, Saruta T, Goto Y, et al. Impact of renal function on cardiovascular events in elderly hypertensive patients treated with efonidipine. Hypertens Res. 2010;33:1211-20.
69. Ogihara T, Saruta T, Matsuoka H, et al. Valsartan in elderly isolated systolic hypertension (VALISH) study: rationale and design. Hypertens Res. 2004;27:657-61.
70. Wei Y, Jin Z, Shen G, et al. Effects of intensive antihypertensive treatment on Chinese hypertensive patients older than 70 years. J Clin Hypertens (Greenwich). 2013;15:420-7.
71. Hansson L, Zanchetti A, Carruthers SG, et al. Effects of intensive blood-pressure lowering and low-dose aspirin in patients with hypertension: principal results of the Hypertension Optimal Treatment (HOT) randomised trial. HOT Study Group. Lancet. 1998;351:1755-62.
72. Schrier RW, Estacio RO, Esler A, et al. Effects of aggressive blood pressure control in normotensive type 2 diabetic patients on albuminuria, retinopathy and strokes. Kidney Int. 2002;61:1086-97.
73. James PA, Oparil S, Carter BL, et al. 2014 evidence-based guideline for the management of high blood pressure in adults: report from the panel members appointed to the Eighth Joint National Committee (JNC 8). JAMA. 2014;311:507-20.
74. Wright JT Jr, Fine LJ, Lackland DT, et al. Evidence supporting a systolic blood pressure goal of less than 150 mm Hg in patients aged 60 years or older: the minority view. Ann Intern Med. 2014;160:499-503.
75. Chobanian AV. Guidelines for the management of hypertension. Med Clin North Am. 2017;101:219-27. 76. Kovell LC, Ahmed HM, Misra S, et al. US hypertension management guidelines: a review of the recent
past and recommendations for the future. J Am Heart Assoc. 2015;4:e002315. 77. Qaseem A, Wilt TJ, Rich R, et al. Pharmacologic treatment of hypertension in adults aged 60 years or
older to higher versus lower blood pressure targets: a clinical practice guideline from the American College of Physicians and the American Academy of Family Physicians. Ann Intern Med. 2017;166:430-7.
78. Yancy CW, Jessup M, Bozkurt B, et al. 2017 ACC/AHA/HFSA focused update of the 2013 ACCF/AHA guideline for the management of heart failure: a report of the American College of Cardiology/American
by guest on May 6, 2018
http://hyper.ahajournals.org/D
ownloaded from

Reboussin DM, et al. 2017 High Blood Pressure Systematic Review
Page 38
Heart Association Task Force on Clinical Practice Guidelines and the Heart Failure Society of America. Circulation. 2017;136:e137-61.
79. Guilbert JJ. The world health report 2002--reducing risks, promoting healthy life. Educ Health (Abingdon). 2003;16:230.
80. Psaty BM, Lumley T, Furberg CD, et al. Health outcomes associated with various antihypertensive therapies used as first-line agents: a network meta-analysis. JAMA. 2003;289:2534-44.
81. Dias S, Sutton AJ, Ades AE, et al. Evidence synthesis for decision making 2: a generalized linear modeling framework for pairwise and network meta-analysis of randomized controlled trials. Med Decis Making. 2013;33:607-17.
82. Dahlof B, Devereux RB, Kjeldsen SE, et al. Cardiovascular morbidity and mortality in the Losartan Intervention For Endpoint reduction in hypertension study (LIFE): a randomised trial against atenolol. Lancet. 2002;359:995-1003.
83. Chen N, Zhou M, Yang M, et al. Calcium channel blockers versus other classes of drugs for hypertension. Cochrane Database Syst Rev. 2010;Cd003654.
84. Turnbull F, Blood Pressure Lowering Treatment Trialists' Collaboration. Effects of different blood-pressure-lowering regimens on major cardiovascular events: results of prospectively-designed overviews of randomised trials. Lancet. 2003;362:1527-35.
85. Law MR, Morris JK, Wald NJ. Use of blood pressure lowering drugs in the prevention of cardiovascular disease: meta-analysis of 147 randomised trials in the context of expectations from prospective epidemiological studies. BMJ. 2009;338:b1665.
by guest on May 6, 2018
http://hyper.ahajournals.org/D
ownloaded from
VupputuriLackland, Edgar (Pete) R. Miller III, Tamar Polonsky, Angela M. Thompson-Paul and Suma
David M. Reboussin, Norrina B. Allen, Michael E. Griswold, Eliseo Guallar, Yuling Hong, Daniel T.Clinical Practice Guidelines
Report of the American College of Cardiology/American Heart Association Task Force on Prevention, Detection, Evaluation, and Management of High Blood Pressure in Adults: AACC/AHA/AAPA/ABC/ACPM/AGS/APhA/ASH/ASPC/NMA/PCNA Guideline for the
Systematic Review for the 2017
Print ISSN: 0194-911X. Online ISSN: 1524-4563 Copyright © 2017 American Heart Association, Inc. All rights reserved.
is published by the American Heart Association, 7272 Greenville Avenue, Dallas, TX 75231Hypertension published online November 13, 2017;Hypertension.
http://hyper.ahajournals.org/content/early/2017/11/10/HYP.0000000000000067World Wide Web at:
The online version of this article, along with updated information and services, is located on the
http://hyper.ahajournals.org/content/suppl/2017/11/13/HYP.0000000000000067.DC2 http://hyper.ahajournals.org/content/suppl/2017/11/13/HYP.0000000000000067.DC1
Data Supplement (unedited) at:
http://hyper.ahajournals.org//subscriptions/
is online at: Hypertension Information about subscribing to Subscriptions:
http://www.lww.com/reprints Information about reprints can be found online at: Reprints:
document. Permissions and Rights Question and Answer available in the
Permissions in the middle column of the Web page under Services. Further information about this process isOnce the online version of the published article for which permission is being requested is located, click Request
can be obtained via RightsLink, a service of the Copyright Clearance Center, not the Editorial Office.Hypertension Requests for permissions to reproduce figures, tables, or portions of articles originally published inPermissions:
by guest on May 6, 2018
http://hyper.ahajournals.org/D
ownloaded from
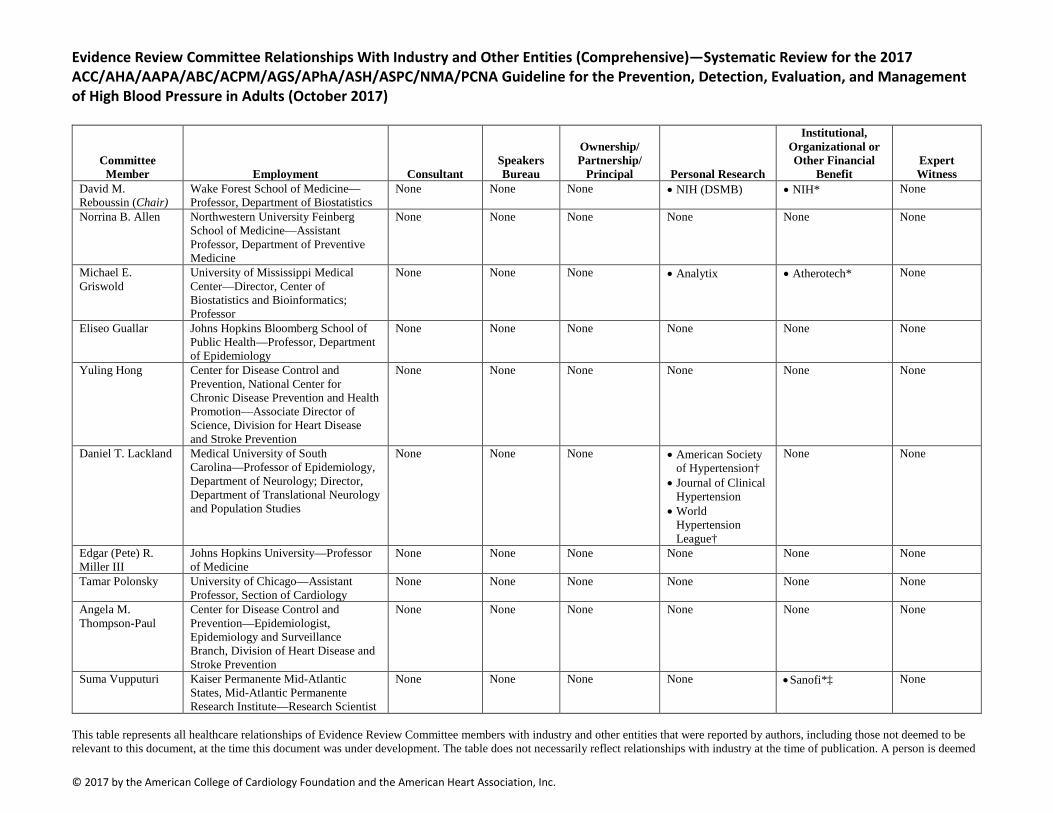
© 2017 by the American College of Cardiology Foundation and the American Heart Association, Inc.
Evidence Review Committee Relationships With Industry and Other Entities (Comprehensive)—Systematic Review for the 2017 ACC/AHA/AAPA/ABC/ACPM/AGS/APhA/ASH/ASPC/NMA/PCNA Guideline for the Prevention, Detection, Evaluation, and Management of High Blood Pressure in Adults (October 2017)
Committee Member Employment Consultant
Speakers Bureau
Ownership/ Partnership/
Principal Personal Research
Institutional, Organizational or Other Financial
Benefit Expert Witness
David M. Reboussin (Chair)
Wake Forest School of Medicine—Professor, Department of Biostatistics
None None None • NIH (DSMB) • NIH* None
Norrina B. Allen Northwestern University Feinberg School of Medicine—Assistant Professor, Department of Preventive Medicine
None None None None None None
Michael E. Griswold
University of Mississippi Medical Center—Director, Center of Biostatistics and Bioinformatics; Professor
None None None • Analytix • Atherotech* None
Eliseo Guallar Johns Hopkins Bloomberg School of Public Health—Professor, Department of Epidemiology
None None None None None None
Yuling Hong Center for Disease Control and Prevention, National Center for Chronic Disease Prevention and Health Promotion—Associate Director of Science, Division for Heart Disease and Stroke Prevention
None None None None None None
Daniel T. Lackland Medical University of South Carolina—Professor of Epidemiology, Department of Neurology; Director, Department of Translational Neurology and Population Studies
None None None • American Society of Hypertension†
• Journal of Clinical Hypertension
• World Hypertension League†
None None
Edgar (Pete) R. Miller III
Johns Hopkins University—Professor of Medicine
None None None None None None
Tamar Polonsky University of Chicago—Assistant Professor, Section of Cardiology
None None None None None None
Angela M. Thompson-Paul
Center for Disease Control and Prevention—Epidemiologist, Epidemiology and Surveillance Branch, Division of Heart Disease and Stroke Prevention
None None None None None None
Suma Vupputuri Kaiser Permanente Mid-Atlantic States, Mid-Atlantic Permanente Research Institute—Research Scientist
None None None None • Sanofi*‡ None
This table represents all healthcare relationships of Evidence Review Committee members with industry and other entities that were reported by authors, including those not deemed to be relevant to this document, at the time this document was under development. The table does not necessarily reflect relationships with industry at the time of publication. A person is deemed

© 2017 by the American College of Cardiology Foundation and the American Heart Association, Inc.
to have a significant interest in a business if the interest represents ownership of ≥5% of the voting stock or share of the business entity, or ownership of ≥$5,000 of the fair market value of the business entity; or if funds received by the person from the business entity exceed 5% of the person’s gross income for the previous year. Relationships that exist with no financial benefit are also included for the purpose of transparency. Relationships in this table are modest unless otherwise noted. Please refer to http://www.acc.org/guidelines/about-guidelines-and-clinical-documents/relationships-with-industry-policy for definitions of disclosure categories or additional information about for definitions of disclosure categories or additional information about the ACC/AHA Disclosure Policy for Writing Committees. *Indicates significant relationship. †No financial benefit. ‡Dr. Vupputuri entered into a relationship as a subcontracted co-investigator on July 5, 2017, via the MidAtlantic Permanente Research Institute and the Center for Health Research at Kaiser Permanente Northwest, as part of a retrospective cohort study funded by Sanofi. The contract itself was between the MidAtlantic Permanente Research Institute and the Center for Health Research at Kaiser Permanente Northwest. Although funding was processes via two research organizations, this was still considered to be “RWI” and is thus listed in the disclosure table. At this time, the ERC had already worked approximately three years, and all data gathering, analyses, and conclusions had already been formulated. Nevertheless, relevant analyses and sections of the ERC report were independently scientifically reviewed by David M. Reboussin, Norrina B. Allen, Daniel T. Lackland, Michael E. Griswold, Edgar (Pete) R. Miller III, Eliseo Guallar, Tamar Polonsky, Yuling Hong, and Angela M. Thompson-Paul, and this review and the finalized ERC report were then re-vetted and voted on for endorsement by the ERC and the hypertension guideline writing committee. AAPA indicates American Academy of Physician Assistants; ABC, Association of Black Cardiologists; ACC, American College of Cardiology; ACPM, American College of Preventive Medicine; AGS, American Geriatrics Society; AHA, American Heart Association; APhA, American Pharmacists Association; ASH, American Society of Hypertension; ASPC, American Society for Preventive Cardiology; DSMB, data safety monitoring board; NIH, National Institutes of Health; NMA, National Medical Association; and PCNA, Preventive Cardiovascular Nurses Association.
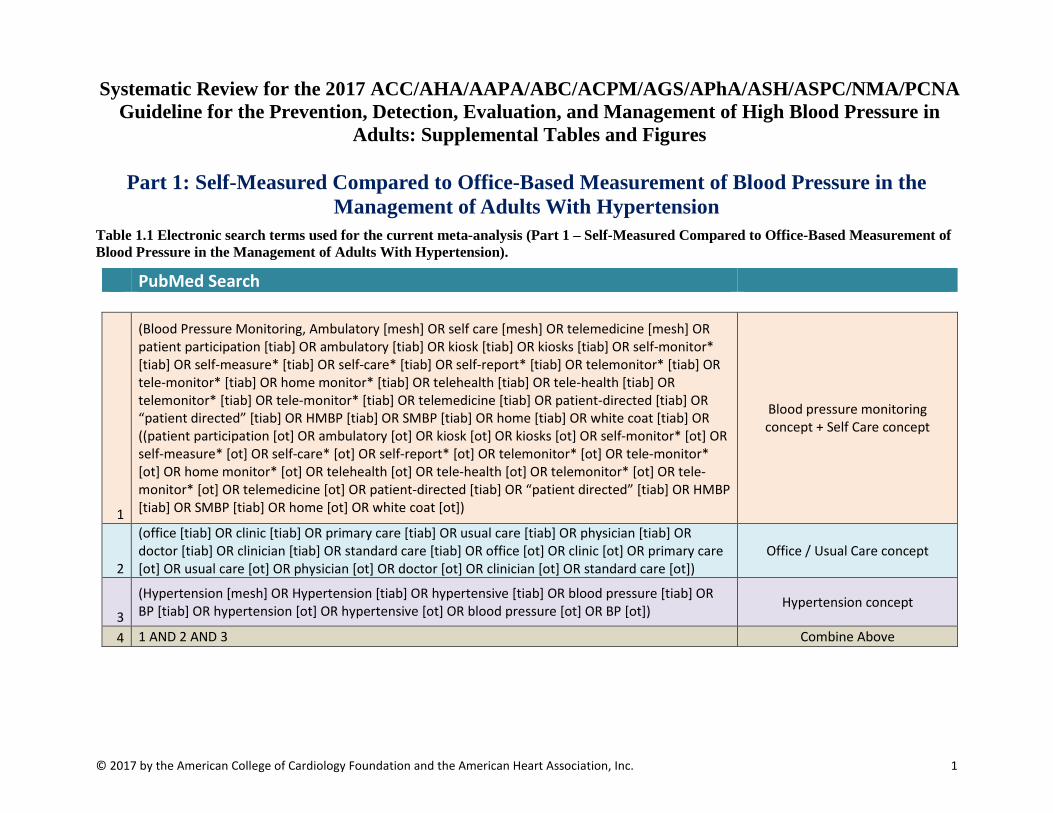
© 2017 by the American College of Cardiology Foundation and the American Heart Association, Inc. 1
Systematic Review for the 2017 ACC/AHA/AAPA/ABC/ACPM/AGS/APhA/ASH/ASPC/NMA/PCNA Guideline for the Prevention, Detection, Evaluation, and Management of High Blood Pressure in
Adults: Supplemental Tables and Figures
Part 1: Self-Measured Compared to Office-Based Measurement of Blood Pressure in the Management of Adults With Hypertension
Table 1.1 Electronic search terms used for the current meta-analysis (Part 1 – Self-Measured Compared to Office-Based Measurement of Blood Pressure in the Management of Adults With Hypertension).
PubMed Search
1
(Blood Pressure Monitoring, Ambulatory [mesh] OR self care [mesh] OR telemedicine [mesh] OR patient participation [tiab] OR ambulatory [tiab] OR kiosk [tiab] OR kiosks [tiab] OR self-monitor* [tiab] OR self-measure* [tiab] OR self-care* [tiab] OR self-report* [tiab] OR telemonitor* [tiab] OR tele-monitor* [tiab] OR home monitor* [tiab] OR telehealth [tiab] OR tele-health [tiab] OR telemonitor* [tiab] OR tele-monitor* [tiab] OR telemedicine [tiab] OR patient-directed [tiab] OR “patient directed” [tiab] OR HMBP [tiab] OR SMBP [tiab] OR home [tiab] OR white coat [tiab] OR ((patient participation [ot] OR ambulatory [ot] OR kiosk [ot] OR kiosks [ot] OR self-monitor* [ot] OR self-measure* [ot] OR self-care* [ot] OR self-report* [ot] OR telemonitor* [ot] OR tele-monitor* [ot] OR home monitor* [ot] OR telehealth [ot] OR tele-health [ot] OR telemonitor* [ot] OR tele-monitor* [ot] OR telemedicine [ot] OR patient-directed [tiab] OR “patient directed” [tiab] OR HMBP [tiab] OR SMBP [tiab] OR home [ot] OR white coat [ot])
Blood pressure monitoring concept + Self Care concept
2
(office [tiab] OR clinic [tiab] OR primary care [tiab] OR usual care [tiab] OR physician [tiab] OR doctor [tiab] OR clinician [tiab] OR standard care [tiab] OR office [ot] OR clinic [ot] OR primary care [ot] OR usual care [ot] OR physician [ot] OR doctor [ot] OR clinician [ot] OR standard care [ot])
Office / Usual Care concept
3
(Hypertension [mesh] OR Hypertension [tiab] OR hypertensive [tiab] OR blood pressure [tiab] OR BP [tiab] OR hypertension [ot] OR hypertensive [ot] OR blood pressure [ot] OR BP [ot]) Hypertension concept
4 1 AND 2 AND 3 Combine Above
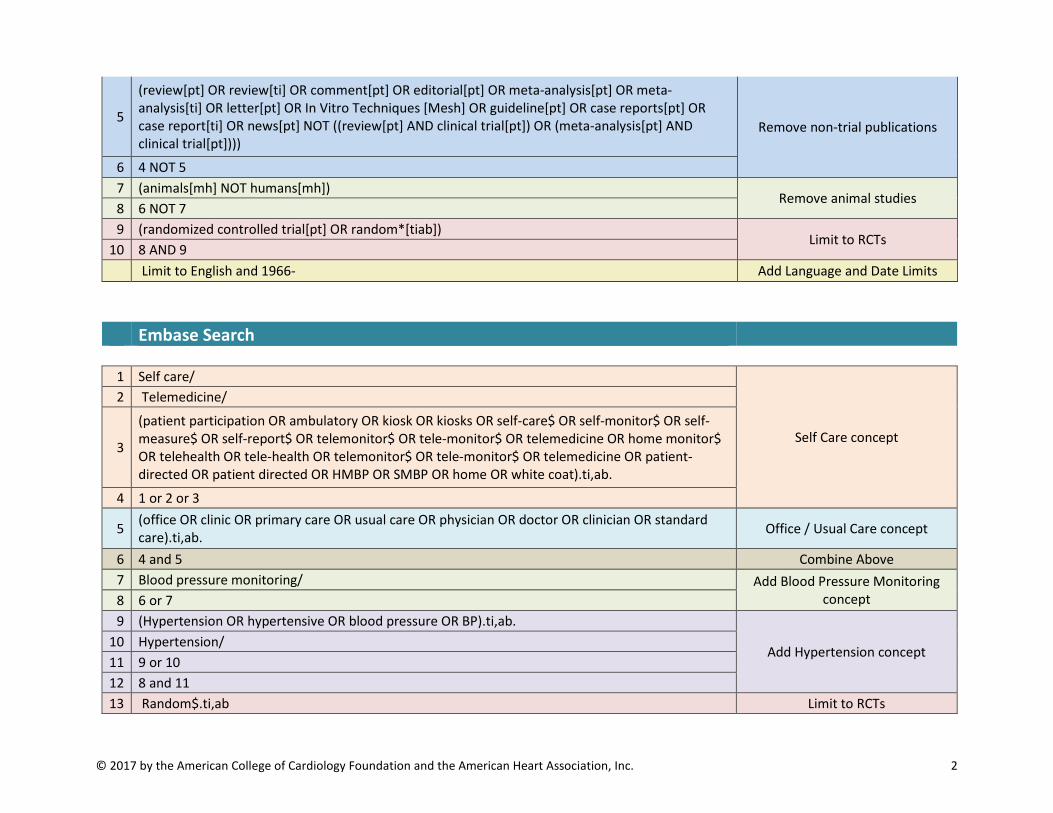
© 2017 by the American College of Cardiology Foundation and the American Heart Association, Inc. 2
5
(review[pt] OR review[ti] OR comment[pt] OR editorial[pt] OR meta-analysis[pt] OR meta-analysis[ti] OR letter[pt] OR In Vitro Techniques [Mesh] OR guideline[pt] OR case reports[pt] OR case report[ti] OR news[pt] NOT ((review[pt] AND clinical trial[pt]) OR (meta-analysis[pt] AND clinical trial[pt])))
Remove non-trial publications
6 4 NOT 5 7 (animals[mh] NOT humans[mh])
Remove animal studies 8 6 NOT 7 9 (randomized controlled trial[pt] OR random*[tiab])
Limit to RCTs 10 8 AND 9 Limit to English and 1966- Add Language and Date Limits
Embase Search
1 Self care/
Self Care concept
2 Telemedicine/
3
(patient participation OR ambulatory OR kiosk OR kiosks OR self-care$ OR self-monitor$ OR self-measure$ OR self-report$ OR telemonitor$ OR tele-monitor$ OR telemedicine OR home monitor$ OR telehealth OR tele-health OR telemonitor$ OR tele-monitor$ OR telemedicine OR patient-directed OR patient directed OR HMBP OR SMBP OR home OR white coat).ti,ab.
4 1 or 2 or 3
5 (office OR clinic OR primary care OR usual care OR physician OR doctor OR clinician OR standard care).ti,ab. Office / Usual Care concept
6 4 and 5 Combine Above 7 Blood pressure monitoring/ Add Blood Pressure Monitoring
concept 8 6 or 7 9 (Hypertension OR hypertensive OR blood pressure OR BP).ti,ab.
Add Hypertension concept 10 Hypertension/ 11 9 or 10 12 8 and 11 13 Random$.ti,ab Limit to RCTs

© 2017 by the American College of Cardiology Foundation and the American Heart Association, Inc. 3
14 Randomized controlled trial/ 15 13 or 14 16 12 and 15
17 (book or book series or conference abstract or conference paper or conference proceeding or "conference review" or editorial or letter or note or "review").pt. Remove non-trial publications
18 16 NOT 17 19 limit 18 to (human and english language and exclude medline journals and yr="1966 -Current) Add Limits
Table 1.2. Summary of included studies Study
(Author, year) Inclusion criteria Exclusion criteria Sample size Participant characteristics Protocol
Midanik et al. 1991(1) Untreated mild hypertension (average of 2 consecutive office SBP <180 mm Hg and DBP 90-99 mmHg
none 204 Mean age 47 52% women 48% black Mean baseline SBP 144.4 (15.7) mm Hg Mean baseline DBP 91.3 (9.1) mm Hg
- SMBP participants asked to measure BP twice a week, send their logs to study every 4 weeks - told to contact their providers if SBP>220, DBP>120 or <50 mm Hg
Soghikhian et al, 1992(2)
Adults being treated for HTN or with office BP >140/90 mm Hg
Cardiovascular complications (not further defined)
430 Mean age 54 50% women 39% black Mean baseline SBP 137.4 (1.2) mm Hg Mean baseline DBP 86.1 (0.6) mm Hg
- Participants in SMBP arm asked to check their BP twice a week, then mail a log once a month to study investigators. - Investigators mailed the log to patients’ physicians
Staessen et al., 2004(3) Office DBP >95 mm Hg untreated or on no more than 2 BP medications
Heart failure, unstable angina, stage 3-4 hypertensive retinopathy, severe comorbid illness, serum creatinine>2 mg/dl, MI or stroke within 1 year
400 Mean age 54 52% women Mean baseline SBP 160.8 (18.6) mm Hg Mean baseline DBP 101.8 (7.4) mm Hg
-follow-up visits scheduled for both groups at 1 and 2 months, then every 2 months until 1 year -SMBP group measured home BP twice a day for 1 week prior to each visit -goal DBP for both groups 80-89 mm Hg

© 2017 by the American College of Cardiology Foundation and the American Heart Association, Inc. 4
-medication titrated according to protocol by study investigators -office BP used for control group, home BP used for SMBP group -if DBP<80 mm Hg then medication decreased, if 80-89 mm Hg no change, if ≥90 mm Hg then increased
McManus et al., 2005(4)
Adults ages 35-75 on treatment for HTN Office BP between140/85 and 200/100 mm Hg
none 441 Mean age 62 48% women 4% black Mean baseline SBP 157.9 (15.7) mm Hg Mean baseline DBP 88.7 (7.3) mm Hg
-SMBP asked to measure their BP in the primary care doctor’s office once a month -instructed to contact their physicians for BP outside of range -control group had visits at primary doctor’s discretion
Marquez-Contreras et al. 2006(5)
Age 18-80 Newly diagnosed HTN or already on medication but not controlled
Requiring ≥2 medications to control BP, living with someone taking the same medication
200 Mean age 59 49% women Mean baseline SBP 159 (16.6) mm Hg Mean baseline DBP 92.4 (10.8) mm Hg
-SMBP participants asked to measure BP 3 times a week -SMBP and control groups had study visits at 4, 12, and 24 weeks for medication titration - both groups used a monitoring events medication system (MEMS) to track adherence
Verberk et al., 2007(6) Office SBP >139 mm Hg and/or DBP >89 mm Hg
none 430 Mean age 55 45% women Mean baseline SBP 166.2 (19.3) mm Hg Mean baseline DBP 97.1 (9.9) mm Hg
-SMBP participants asked to measure their BP daily for 7 days prior to each clinic visit -medication for SMBP and control patients determined based on stepped titration protocol

© 2017 by the American College of Cardiology Foundation and the American Heart Association, Inc. 5
-treating physicians blinded to patients’ groups, told only mean BP from study staff
Bosworth et al., 2009 (7)
Diagnosis of HTN and treatment at least 12 months prior
Comorbidities that would interfere with self-measurement of BP
317 (an additional 319 were randomized to either behavioral intervention or behavioral intervention plus SMBP)
Mean age 62 66% women 49% black Mean baseline BP 125/71
- Patients randomized to SMBP asked to measure BP 3 days a week - mailed BP logs to study team every 2 months - clinic visits for both arms every 6 months
Godwin et al., 2010(8) On antihypertensive medication but not controlled (SBP≥140 mm Hg or DBP≥90 mm Hg), then underwent ABPM, required SBP≥135 mmHg or DBP 85 mmHg
none 552 Mean age 68.8 51% women Mean baseline SBP 147.3 (9.0) mm Hg Mean baseline DBP 81.2 (8.2) mm Hg
-SMBP participants asked to measure their BP weekly and to bring their log to regularly scheduled visits with their primary doctor
Varis et al., 2010(9) Initial eligibility based on office BP>140/90 mm Hg, Then all eligible patients measured home BPx3 weeks, those on medication had a washout period. Final eligibility based on home DBP 85-110 mm Hg
malignant hypertension, mean home DBP>110 mmHg during the washout period, stroke or MI within 12 months prior to randomization, unstable angina, uncontrolled or symptomatic CHF, insulin-treated diabetes mellitus, serious hepatic failure (liver enzymes 2x normal values), renal insufficiency (fS-creatinine >140 mol/l), atrial fibrillation or having
189 Mean age not reported 61% women Mean baseline SBP 159.4 (18.3) mm Hg Mean baseline DBP 97.4 (8.9) mm Hg
-SMBP measured BP 3 times a week, mailed results to their doctors every 5 weeks
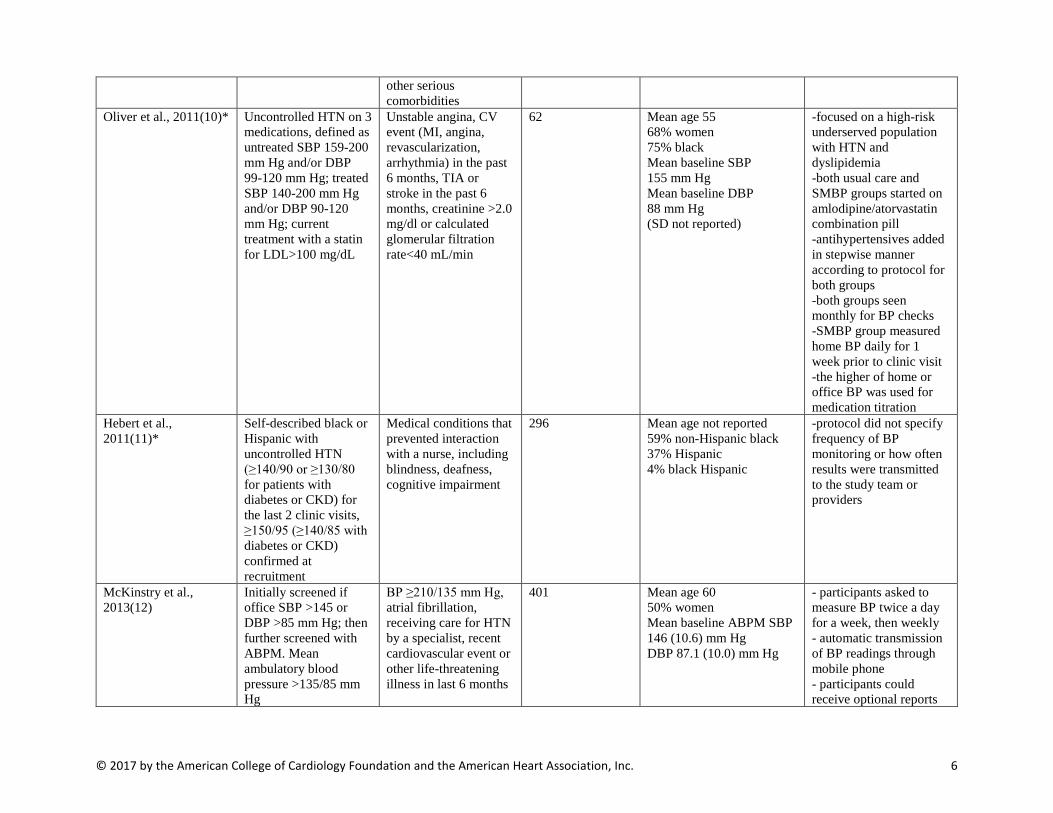
© 2017 by the American College of Cardiology Foundation and the American Heart Association, Inc. 6
other serious comorbidities
Oliver et al., 2011(10)* Uncontrolled HTN on 3 medications, defined as untreated SBP 159-200 mm Hg and/or DBP 99-120 mm Hg; treated SBP 140-200 mm Hg and/or DBP 90-120 mm Hg; current treatment with a statin for LDL>100 mg/dL
Unstable angina, CV event (MI, angina, revascularization, arrhythmia) in the past 6 months, TIA or stroke in the past 6 months, creatinine >2.0 mg/dl or calculated glomerular filtration rate<40 mL/min
62 Mean age 55 68% women 75% black Mean baseline SBP 155 mm Hg Mean baseline DBP 88 mm Hg (SD not reported)
-focused on a high-risk underserved population with HTN and dyslipidemia -both usual care and SMBP groups started on amlodipine/atorvastatin combination pill -antihypertensives added in stepwise manner according to protocol for both groups -both groups seen monthly for BP checks -SMBP group measured home BP daily for 1 week prior to clinic visit -the higher of home or office BP was used for medication titration
Hebert et al., 2011(11)*
Self-described black or Hispanic with uncontrolled HTN (≥140/90 or ≥130/80 for patients with diabetes or CKD) for the last 2 clinic visits, ≥150/95 (≥140/85 with diabetes or CKD) confirmed at recruitment
Medical conditions that prevented interaction with a nurse, including blindness, deafness, cognitive impairment
296 Mean age not reported 59% non-Hispanic black 37% Hispanic 4% black Hispanic
-protocol did not specify frequency of BP monitoring or how often results were transmitted to the study team or providers
McKinstry et al., 2013(12)
Initially screened if office SBP >145 or DBP >85 mm Hg; then further screened with ABPM. Mean ambulatory blood pressure >135/85 mm Hg
BP ≥210/135 mm Hg, atrial fibrillation, receiving care for HTN by a specialist, recent cardiovascular event or other life-threatening illness in last 6 months
401 Mean age 60 50% women Mean baseline ABPM SBP 146 (10.6) mm Hg DBP 87.1 (10.0) mm Hg
- participants asked to measure BP twice a day for a week, then weekly - automatic transmission of BP readings through mobile phone - participants could receive optional reports

© 2017 by the American College of Cardiology Foundation and the American Heart Association, Inc. 7
based on the last 10 BP readings with feedback on the readings - MDs given access to patients’ BP logs, and encouraged to check weekly
Hosseininasab et al. 2014 (13)*
Age>18 Office SBP 140/90–159/99 mm Hg without medication or those already on antihypertensive treatment but not controlled
Severe cardiovascular comorbidities, serum creatinine >1.5 mg/dl
196 Mean age 60 60% women Mean baseline SBP 144.4 (7.4) mm Hg DBP 85.5 (6.9) mm Hg
-participants asked to measure their BP once daily -clinic visits for all participants at 4, 12 and 24 weeks - pill counts performed at each visit
BP indicates blood pressure; HTN, hypertension; SMBP, self-monitored blood pressure; MI, myocardial infarction; CHF, congestive heart failure; TIA, transient ischemic attack; CV, cardiovascular; CKD, chronic kidney disease *studies were excluded from the primary analysis of mean SBP because blood pressure variability was not reported

© 2017 by the American College of Cardiology Foundation and the American Heart Association, Inc. 8
Figure 1.1. All data for systolic blood pressure, adjusted for study duration*
Office-measured BP better Difference in systolic Self measured BP better blood pressure

© 2017 by the American College of Cardiology Foundation and the American Heart Association, Inc. 9
Figure 1.2 Funnel plot for differences in systolic blood pressure among studies with a 6- vs 12-month
duration
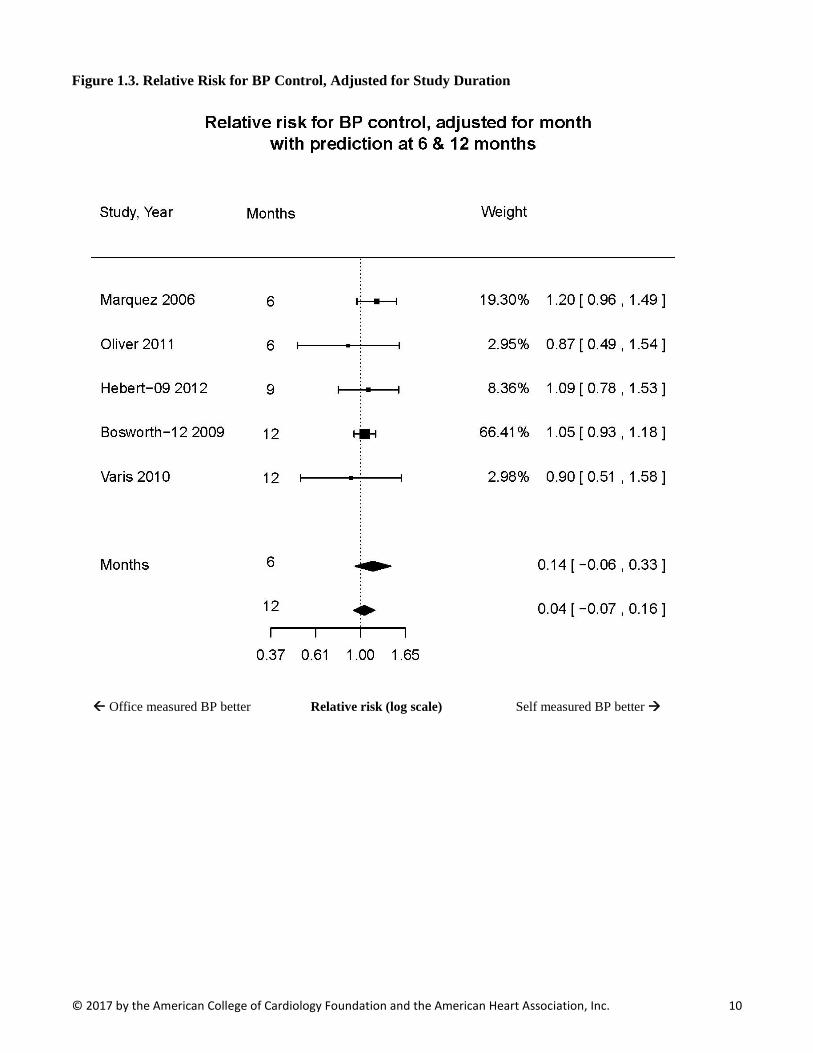
© 2017 by the American College of Cardiology Foundation and the American Heart Association, Inc. 10
Figure 1.3. Relative Risk for BP Control, Adjusted for Study Duration
Office measured BP better Relative risk (log scale) Self measured BP better
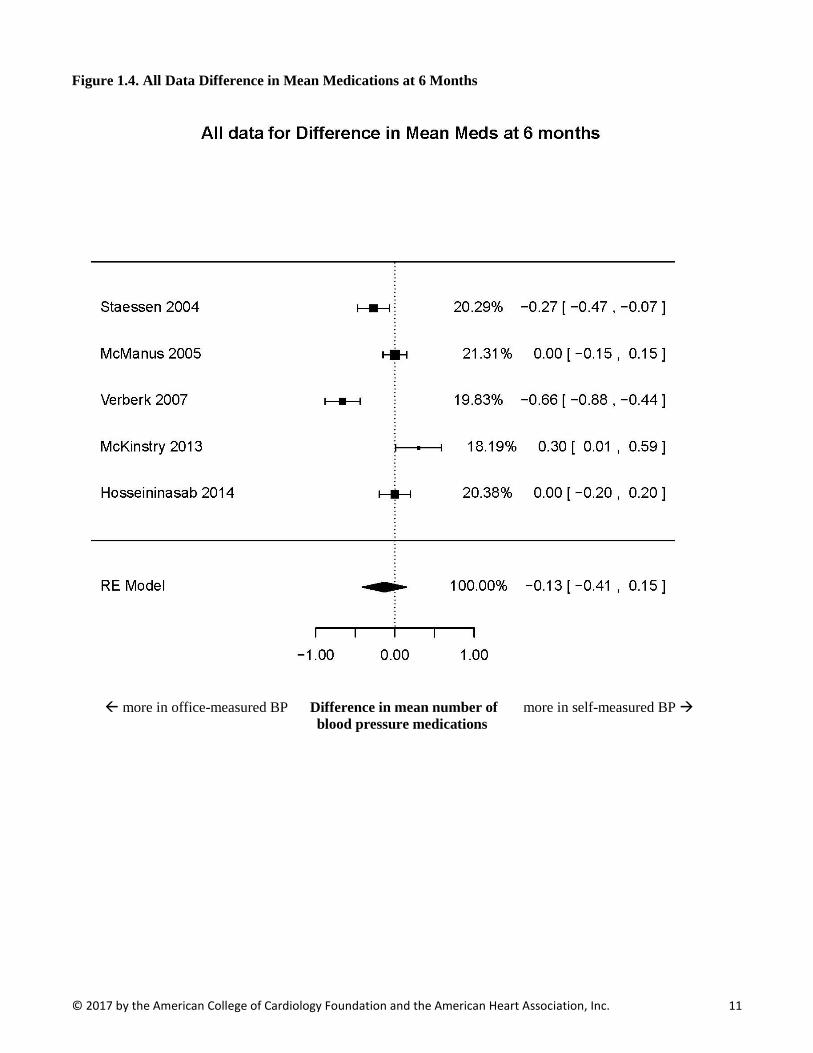
© 2017 by the American College of Cardiology Foundation and the American Heart Association, Inc. 11
Figure 1.4. All Data Difference in Mean Medications at 6 Months
more in office-measured BP Difference in mean number of more in self-measured BP blood pressure medications
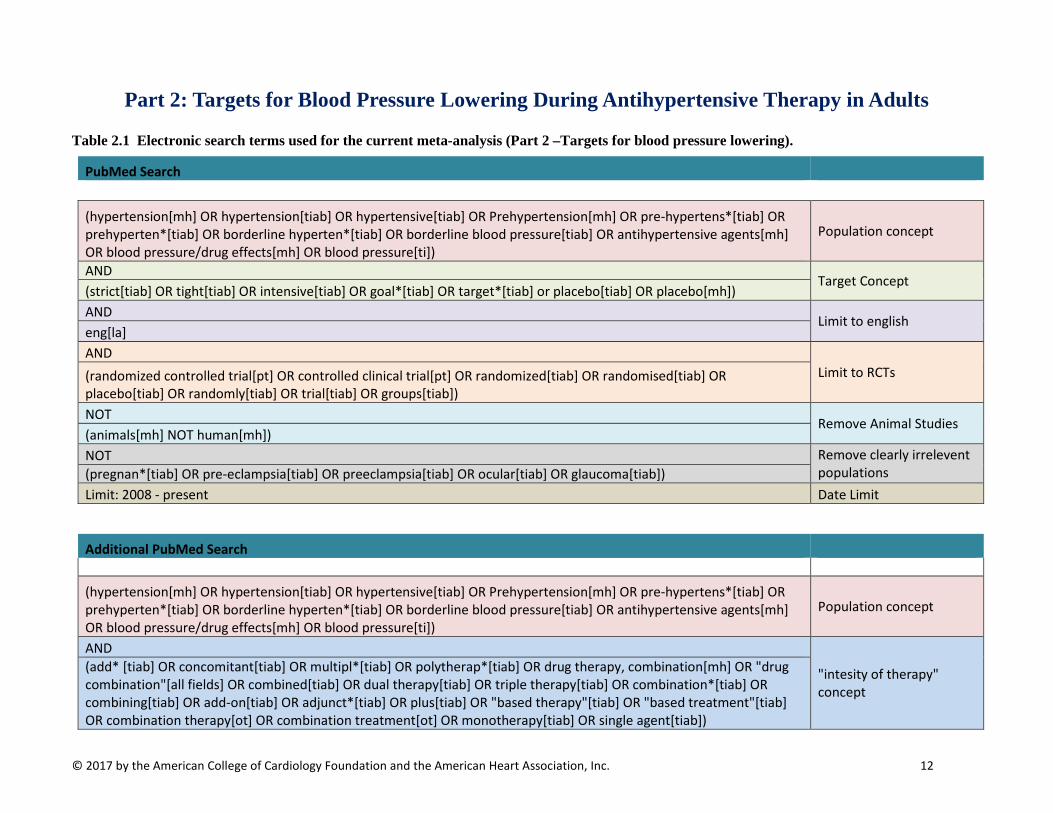
© 2017 by the American College of Cardiology Foundation and the American Heart Association, Inc. 12
Part 2: Targets for Blood Pressure Lowering During Antihypertensive Therapy in Adults
Table 2.1 Electronic search terms used for the current meta-analysis (Part 2 –Targets for blood pressure lowering).
PubMed Search
(hypertension[mh] OR hypertension[tiab] OR hypertensive[tiab] OR Prehypertension[mh] OR pre-hypertens*[tiab] OR prehyperten*[tiab] OR borderline hyperten*[tiab] OR borderline blood pressure[tiab] OR antihypertensive agents[mh] OR blood pressure/drug effects[mh] OR blood pressure[ti])
Population concept
AND Target Concept
(strict[tiab] OR tight[tiab] OR intensive[tiab] OR goal*[tiab] OR target*[tiab] or placebo[tiab] OR placebo[mh]) AND Limit to english eng[la] AND
Limit to RCTs (randomized controlled trial[pt] OR controlled clinical trial[pt] OR randomized[tiab] OR randomised[tiab] OR placebo[tiab] OR randomly[tiab] OR trial[tiab] OR groups[tiab]) NOT Remove Animal Studies (animals[mh] NOT human[mh]) NOT Remove clearly irrelevent
populations (pregnan*[tiab] OR pre-eclampsia[tiab] OR preeclampsia[tiab] OR ocular[tiab] OR glaucoma[tiab]) Limit: 2008 - present Date Limit
Additional PubMed Search
(hypertension[mh] OR hypertension[tiab] OR hypertensive[tiab] OR Prehypertension[mh] OR pre-hypertens*[tiab] OR prehyperten*[tiab] OR borderline hyperten*[tiab] OR borderline blood pressure[tiab] OR antihypertensive agents[mh] OR blood pressure/drug effects[mh] OR blood pressure[ti])
Population concept
AND
"intesity of therapy" concept
(add* [tiab] OR concomitant[tiab] OR multipl*[tiab] OR polytherap*[tiab] OR drug therapy, combination[mh] OR "drug combination"[all fields] OR combined[tiab] OR dual therapy[tiab] OR triple therapy[tiab] OR combination*[tiab] OR combining[tiab] OR add-on[tiab] OR adjunct*[tiab] OR plus[tiab] OR "based therapy"[tiab] OR "based treatment"[tiab] OR combination therapy[ot] OR combination treatment[ot] OR monotherapy[tiab] OR single agent[tiab])
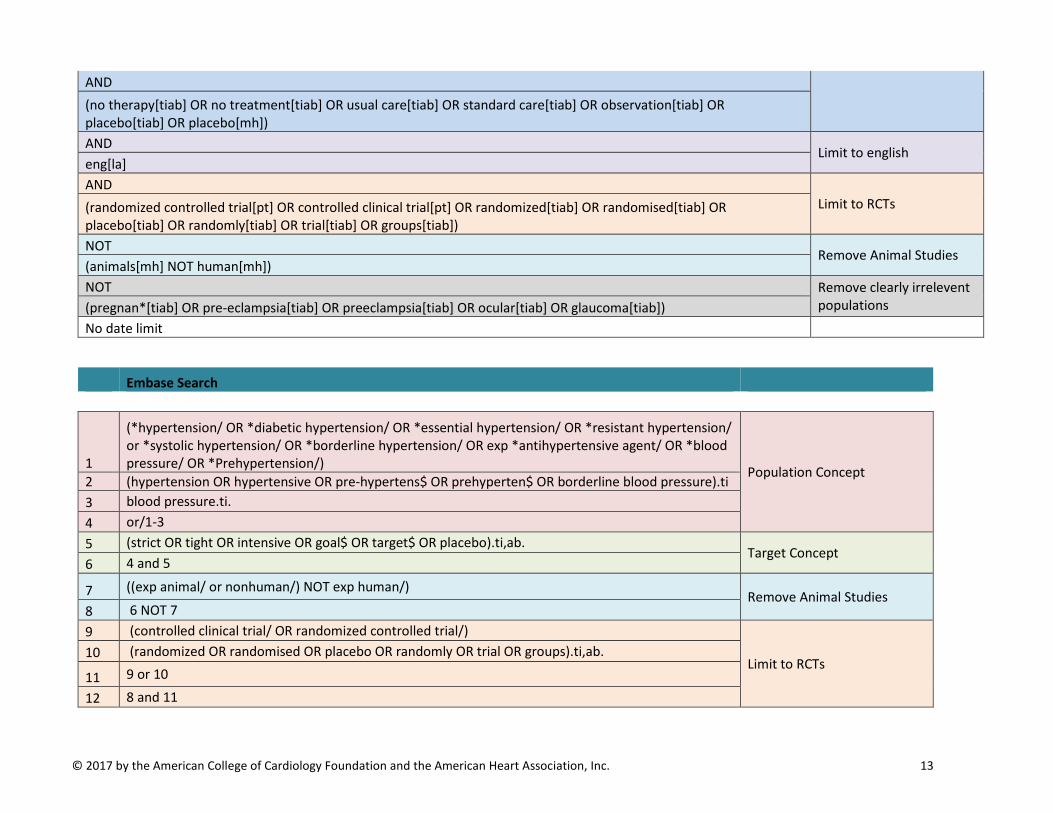
© 2017 by the American College of Cardiology Foundation and the American Heart Association, Inc. 13
AND (no therapy[tiab] OR no treatment[tiab] OR usual care[tiab] OR standard care[tiab] OR observation[tiab] OR placebo[tiab] OR placebo[mh]) AND Limit to english eng[la] AND
Limit to RCTs (randomized controlled trial[pt] OR controlled clinical trial[pt] OR randomized[tiab] OR randomised[tiab] OR placebo[tiab] OR randomly[tiab] OR trial[tiab] OR groups[tiab]) NOT Remove Animal Studies (animals[mh] NOT human[mh]) NOT Remove clearly irrelevent
populations (pregnan*[tiab] OR pre-eclampsia[tiab] OR preeclampsia[tiab] OR ocular[tiab] OR glaucoma[tiab]) No date limit
Embase Search
1
(*hypertension/ OR *diabetic hypertension/ OR *essential hypertension/ OR *resistant hypertension/ or *systolic hypertension/ OR *borderline hypertension/ OR exp *antihypertensive agent/ OR *blood pressure/ OR *Prehypertension/) Population Concept
2 (hypertension OR hypertensive OR pre-hypertens$ OR prehyperten$ OR borderline blood pressure).ti 3 blood pressure.ti. 4 or/1-3 5 (strict OR tight OR intensive OR goal$ OR target$ OR placebo).ti,ab.
Target Concept 6 4 and 5
7 ((exp animal/ or nonhuman/) NOT exp human/) Remove Animal Studies
8 6 NOT 7 9 (controlled clinical trial/ OR randomized controlled trial/)
Limit to RCTs 10 (randomized OR randomised OR placebo OR randomly OR trial OR groups).ti,ab.
11 9 or 10
12 8 and 11

© 2017 by the American College of Cardiology Foundation and the American Heart Association, Inc. 14
13 (pregnan$ OR pre-eclampsia OR preeclampsia OR ocular OR glaucoma).ti,ab. Remove clearly irrelevent
populations 14 12 not 13
2008 - present date limit Date Limit

© 2017 by the American College of Cardiology Foundation and the American Heart Association, Inc. 15
Table 2.2 PICO(TSS) FRAMEWORK (Part 2–Targets for blood pressure lowering)
Inclusion Criteria Exclusion criteria
Participants/ population
Adults (>=18 years) with Primary Hypertension or Hypertension due to Chronic Kidney Disease. Trials will not be limited by concomitant or comorbid disease (i.e., studies of persons with hypertension and diabetes will be included).
Interventions/ exposure
“Lower” target systolic/diastolic/mean arterial blood pressure
Studies in which the primary intent of the treatment (and target blood pressure randomization) was not specifically to treat or lower blood pressure (e.g., use of ACE/ARB to treat or prevent heart failure)
Comparators/ control “Standard” or “higher” target systolic/diastolic/mean arterial blood pressure
Outcomes
Mortality All-Cause Cardiovascular Chronic Kidney Disease Myocardial Infarction (MI) Stroke Heart Failure Renal Outcomes End-Stage Renal Disease (ESRD) Doubling of Creatinine Halving of eGFR
All other outcomes Outcomes only reported at < 12 months or without enough detail to estimate variability
Timing (of outcomes) Any Any Setting/context Any NA Study design Randomized Controlled Trials Observational Studies
Additional criteria >=100 randomized patients or >=400 person-years of follow-up
<100 randomized patients or <400 person-years of follow-up
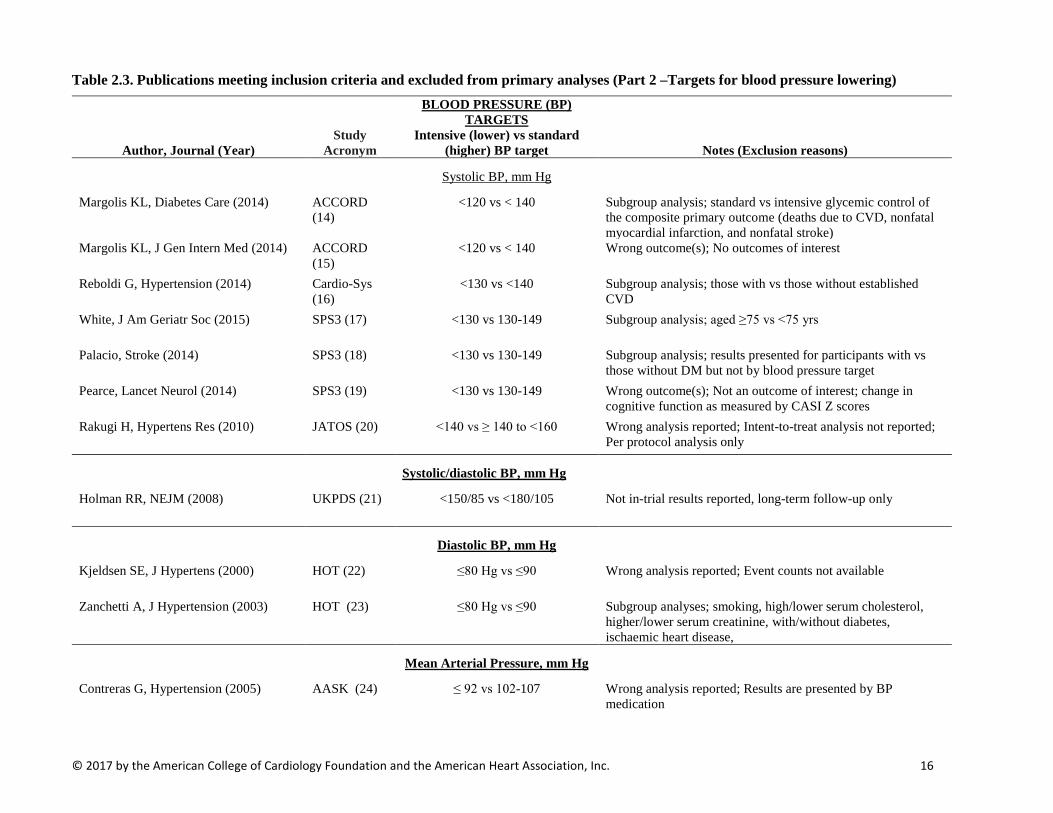
© 2017 by the American College of Cardiology Foundation and the American Heart Association, Inc. 16
Table 2.3. Publications meeting inclusion criteria and excluded from primary analyses (Part 2 –Targets for blood pressure lowering)
Author, Journal (Year) Study
Acronym
BLOOD PRESSURE (BP) TARGETS
Intensive (lower) vs standard (higher) BP target Notes (Exclusion reasons)
Systolic BP, mm Hg
Margolis KL, Diabetes Care (2014) ACCORD (14)
<120 vs < 140 Subgroup analysis; standard vs intensive glycemic control of the composite primary outcome (deaths due to CVD, nonfatal myocardial infarction, and nonfatal stroke)
Margolis KL, J Gen Intern Med (2014) ACCORD (15)
<120 vs < 140 Wrong outcome(s); No outcomes of interest
Reboldi G, Hypertension (2014) Cardio-Sys (16)
<130 vs <140 Subgroup analysis; those with vs those without established CVD
White, J Am Geriatr Soc (2015)
SPS3 (17) <130 vs 130-149 Subgroup analysis; aged ≥75 vs <75 yrs
Palacio, Stroke (2014) SPS3 (18) <130 vs 130-149 Subgroup analysis; results presented for participants with vs those without DM but not by blood pressure target
Pearce, Lancet Neurol (2014) SPS3 (19) <130 vs 130-149 Wrong outcome(s); Not an outcome of interest; change in cognitive function as measured by CASI Z scores
Rakugi H, Hypertens Res (2010) JATOS (20) <140 vs ≥ 140 to <160 Wrong analysis reported; Intent-to-treat analysis not reported; Per protocol analysis only
Systolic/diastolic BP, mm Hg
Holman RR, NEJM (2008) UKPDS (21) <150/85 vs <180/105 Not in-trial results reported, long-term follow-up only
Diastolic BP, mm Hg
Kjeldsen SE, J Hypertens (2000) HOT (22) ≤80 Hg vs ≤90 Wrong analysis reported; Event counts not available
Zanchetti A, J Hypertension (2003) HOT (23) ≤80 Hg vs ≤90 Subgroup analyses; smoking, high/lower serum cholesterol, higher/lower serum creatinine, with/without diabetes, ischaemic heart disease,
Mean Arterial Pressure, mm Hg
Contreras G, Hypertension (2005) AASK (24) ≤ 92 vs 102-107 Wrong analysis reported; Results are presented by BP medication
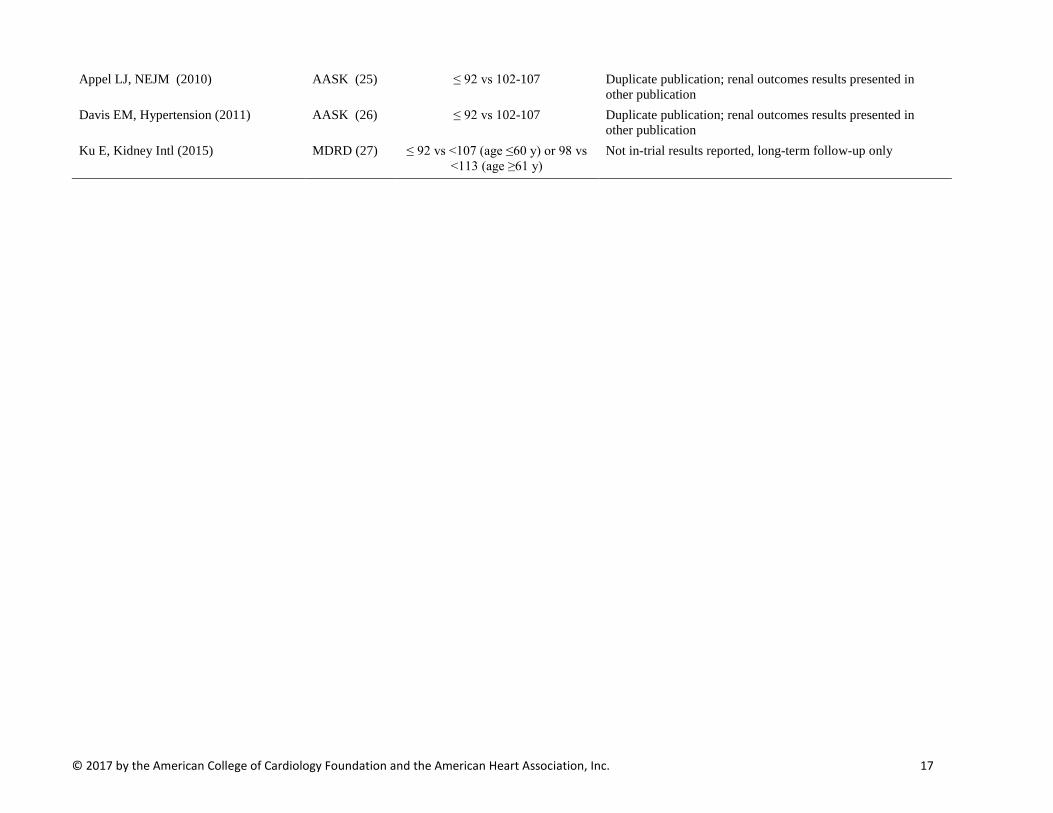
© 2017 by the American College of Cardiology Foundation and the American Heart Association, Inc. 17
Appel LJ, NEJM (2010) AASK (25) ≤ 92 vs 102-107 Duplicate publication; renal outcomes results presented in other publication
Davis EM, Hypertension (2011) AASK (26) ≤ 92 vs 102-107 Duplicate publication; renal outcomes results presented in other publication
Ku E, Kidney Intl (2015) MDRD (27) ≤ 92 vs <107 (age ≤60 y) or 98 vs <113 (age ≥61 y)
Not in-trial results reported, long-term follow-up only
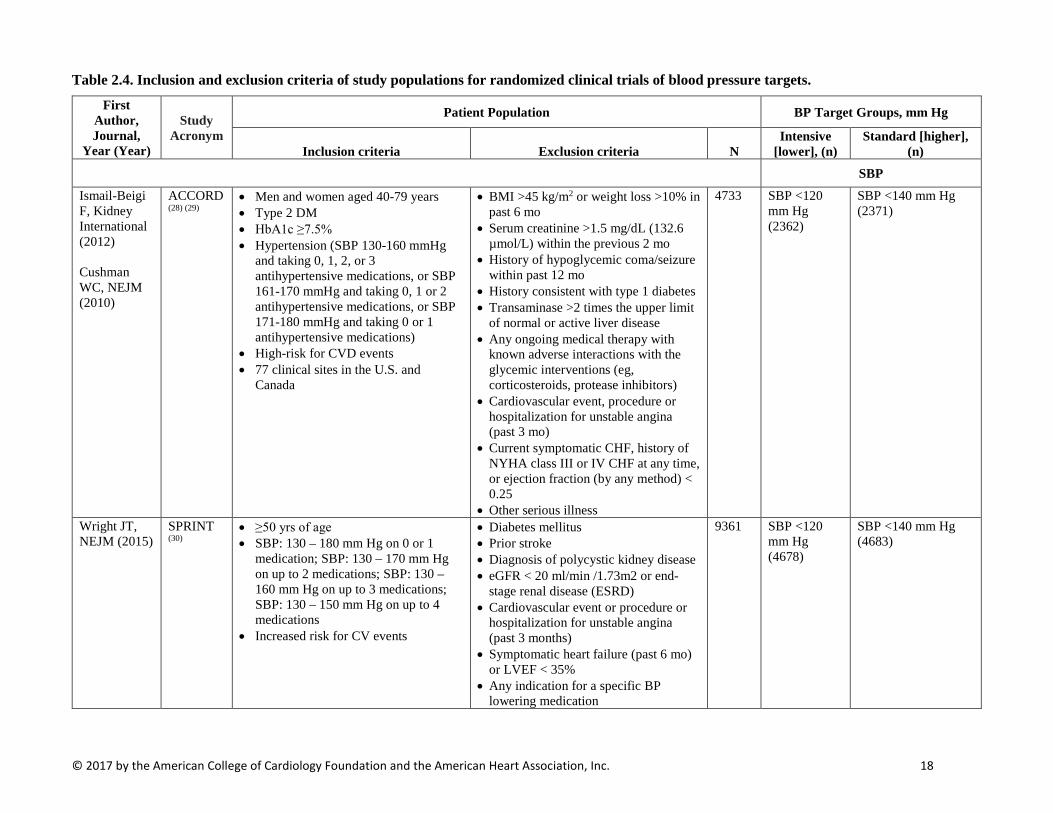
© 2017 by the American College of Cardiology Foundation and the American Heart Association, Inc. 18
Table 2.4. Inclusion and exclusion criteria of study populations for randomized clinical trials of blood pressure targets.
First Author, Journal,
Year (Year)
Study Acronym
Patient Population BP Target Groups, mm Hg
Inclusion criteria Exclusion criteria N Intensive
[lower], (n) Standard [higher],
(n) SBP
Ismail-Beigi F, Kidney International (2012) Cushman WC, NEJM (2010)
ACCORD (28) (29)
• Men and women aged 40-79 years • Type 2 DM • HbA1c ≥7.5% • Hypertension (SBP 130-160 mmHg
and taking 0, 1, 2, or 3 antihypertensive medications, or SBP 161-170 mmHg and taking 0, 1 or 2 antihypertensive medications, or SBP 171-180 mmHg and taking 0 or 1 antihypertensive medications)
• High-risk for CVD events • 77 clinical sites in the U.S. and
Canada
• BMI >45 kg/m2 or weight loss >10% in past 6 mo
• Serum creatinine >1.5 mg/dL (132.6 µmol/L) within the previous 2 mo
• History of hypoglycemic coma/seizure within past 12 mo
• History consistent with type 1 diabetes • Transaminase >2 times the upper limit
of normal or active liver disease • Any ongoing medical therapy with
known adverse interactions with the glycemic interventions (eg, corticosteroids, protease inhibitors)
• Cardiovascular event, procedure or hospitalization for unstable angina (past 3 mo)
• Current symptomatic CHF, history of NYHA class III or IV CHF at any time, or ejection fraction (by any method) < 0.25
• Other serious illness
4733 SBP <120 mm Hg (2362)
SBP <140 mm Hg (2371)
Wright JT, NEJM (2015)
SPRINT (30)
• ≥50 yrs of age • SBP: 130 – 180 mm Hg on 0 or 1
medication; SBP: 130 – 170 mm Hg on up to 2 medications; SBP: 130 – 160 mm Hg on up to 3 medications; SBP: 130 – 150 mm Hg on up to 4 medications
• Increased risk for CV events
• Diabetes mellitus • Prior stroke • Diagnosis of polycystic kidney disease • eGFR < 20 ml/min /1.73m2 or end-
stage renal disease (ESRD) • Cardiovascular event or procedure or
hospitalization for unstable angina (past 3 months)
• Symptomatic heart failure (past 6 mo) or LVEF < 35%
• Any indication for a specific BP lowering medication
9361 SBP <120 mm Hg (4678)
SBP <140 mm Hg (4683)
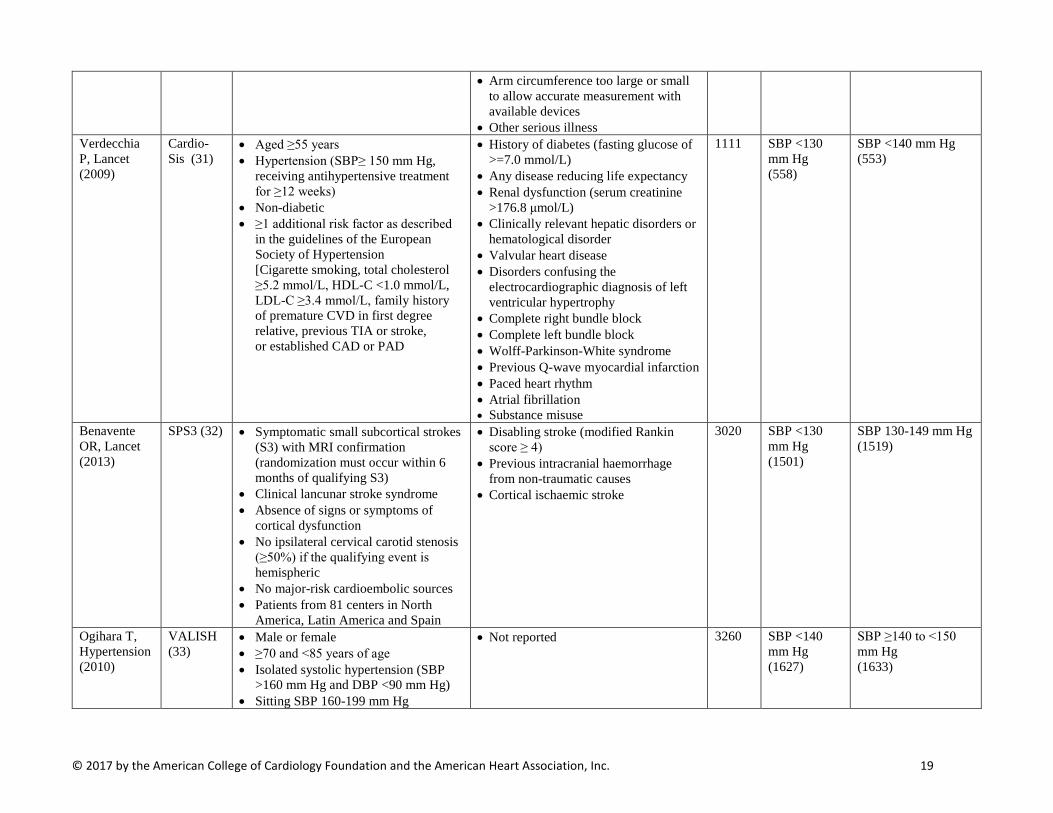
© 2017 by the American College of Cardiology Foundation and the American Heart Association, Inc. 19
• Arm circumference too large or small to allow accurate measurement with available devices
• Other serious illness Verdecchia P, Lancet (2009)
Cardio-Sis (31)
• Aged ≥55 years • Hypertension (SBP≥ 150 mm Hg,
receiving antihypertensive treatment for ≥12 weeks)
• Non-diabetic • ≥1 additional risk factor as described
in the guidelines of the European Society of Hypertension [Cigarette smoking, total cholesterol ≥5.2 mmol/L, HDL-C <1.0 mmol/L, LDL-C ≥3.4 mmol/L, family history of premature CVD in first degree relative, previous TIA or stroke, or established CAD or PAD
• History of diabetes (fasting glucose of >=7.0 mmol/L)
• Any disease reducing life expectancy • Renal dysfunction (serum creatinine
>176.8 μmol/L) • Clinically relevant hepatic disorders or
hematological disorder • Valvular heart disease • Disorders confusing the
electrocardiographic diagnosis of left ventricular hypertrophy
• Complete right bundle block • Complete left bundle block • Wolff-Parkinson-White syndrome • Previous Q-wave myocardial infarction • Paced heart rhythm • Atrial fibrillation • Substance misuse
1111 SBP <130 mm Hg (558)
SBP <140 mm Hg (553)
Benavente OR, Lancet (2013)
SPS3 (32) • Symptomatic small subcortical strokes (S3) with MRI confirmation (randomization must occur within 6 months of qualifying S3)
• Clinical lancunar stroke syndrome • Absence of signs or symptoms of
cortical dysfunction • No ipsilateral cervical carotid stenosis
(≥50%) if the qualifying event is hemispheric
• No major-risk cardioembolic sources • Patients from 81 centers in North
America, Latin America and Spain
• Disabling stroke (modified Rankin score ≥ 4)
• Previous intracranial haemorrhage from non-traumatic causes
• Cortical ischaemic stroke
3020 SBP <130 mm Hg (1501)
SBP 130-149 mm Hg (1519)
Ogihara T, Hypertension (2010)
VALISH (33)
• Male or female • ≥70 and <85 years of age • Isolated systolic hypertension (SBP
>160 mm Hg and DBP <90 mm Hg) • Sitting SBP 160-199 mm Hg
• Not reported 3260 SBP <140 mm Hg (1627)
SBP ≥140 to <150 mm Hg (1633)
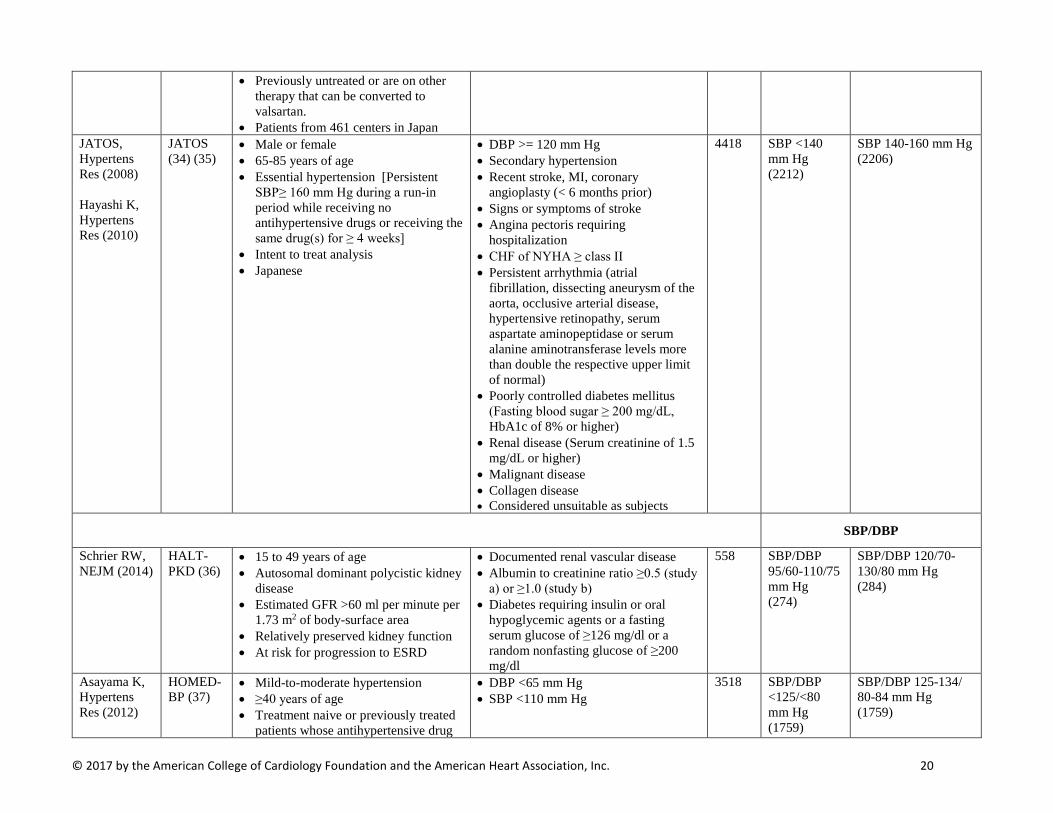
© 2017 by the American College of Cardiology Foundation and the American Heart Association, Inc. 20
• Previously untreated or are on other therapy that can be converted to valsartan.
• Patients from 461 centers in Japan JATOS, Hypertens Res (2008) Hayashi K, Hypertens Res (2010)
JATOS (34) (35)
• Male or female • 65-85 years of age • Essential hypertension [Persistent
SBP≥ 160 mm Hg during a run-in period while receiving no antihypertensive drugs or receiving the same drug(s) for ≥ 4 weeks]
• Intent to treat analysis • Japanese
• DBP >= 120 mm Hg • Secondary hypertension • Recent stroke, MI, coronary
angioplasty (< 6 months prior) • Signs or symptoms of stroke • Angina pectoris requiring
hospitalization • CHF of NYHA ≥ class II • Persistent arrhythmia (atrial
fibrillation, dissecting aneurysm of the aorta, occlusive arterial disease, hypertensive retinopathy, serum aspartate aminopeptidase or serum alanine aminotransferase levels more than double the respective upper limit of normal)
• Poorly controlled diabetes mellitus (Fasting blood sugar ≥ 200 mg/dL, HbA1c of 8% or higher)
• Renal disease (Serum creatinine of 1.5 mg/dL or higher)
• Malignant disease • Collagen disease • Considered unsuitable as subjects
4418 SBP <140 mm Hg (2212)
SBP 140-160 mm Hg (2206)
SBP/DBP
Schrier RW, NEJM (2014)
HALT-PKD (36)
• 15 to 49 years of age • Autosomal dominant polycistic kidney
disease • Estimated GFR >60 ml per minute per
1.73 m2 of body-surface area • Relatively preserved kidney function • At risk for progression to ESRD
• Documented renal vascular disease • Albumin to creatinine ratio ≥0.5 (study
a) or ≥1.0 (study b) • Diabetes requiring insulin or oral
hypoglycemic agents or a fasting serum glucose of ≥126 mg/dl or a random nonfasting glucose of ≥200 mg/dl
558 SBP/DBP 95/60-110/75 mm Hg (274)
SBP/DBP 120/70-130/80 mm Hg (284)
Asayama K, Hypertens Res (2012)
HOMED-BP (37)
• Mild-to-moderate hypertension • ≥40 years of age • Treatment naive or previously treated
patients whose antihypertensive drug
• DBP <65 mm Hg • SBP <110 mm Hg
3518 SBP/DBP <125/<80 mm Hg (1759)
SBP/DBP 125-134/ 80-84 mm Hg (1759)

© 2017 by the American College of Cardiology Foundation and the American Heart Association, Inc. 21
treatment could be discontinued for ≥2 weeks
• Maintained self-measured home BP of 135-179 mm Hg SBP or 85-119 mm Hg DBP off treatment
• Clinic BP off treatment: <220 mm Hg SBP and <125 mm Hg DBP
Ruggenenti P, Lancet (2005)
REIN-2 (38)
• Men or Women • Age 18-70 years • Non-diabetic nephropathy • Persistent proteinuria • Urinary protein excretion exceeding 1
g per 24 h for at least 3 months without evidence of urinary-tract infection or overt heart failure (NYHA Class III-IV).
• Had not received ACE-I therapy for ≥ 6 weeks
• Proteinuria of 1-3 g per 24 h with creatinine clearance < 45 mL/min per 1.73m2 or proteinuria of ≥3g per 24 h with creatinine clearance <70 ml/min per 1.73m^2
• Treatment with corticosteroids, NSAIDs, immunosuppressive drugs
• Acute MI or cerebrovascular accident (in the previous 6 months)
• Severe uncontrolled hypertension • Suspicion or evidence of renovascular
disease • Obstructive uropathy • Comorbid conditions including: Type 1
diabetes mellitus, collagen disease, cancer
• Higher serum aminotransferase concentrations
• Chronic cough or history of allergy • Poor tolerance to ACEI, or
dihydropyridine CCB • Drug or alcohol abuse • Pregnancy or breastfeeding • Ineffective contraception
338 SBP/DBP <130/80 mm Hg (169)
DBP <90 mm Hg (169)
Wei Y, J Clin Hypertens (2013)
NR (39) • 70 years of age • Hypertensive (SBP ≥150 mm Hg
and/or DBP ≥90 mm Hg, measured twice in different days) or diagnosed with hypertension and currently receiving antihypertensive treatment
• Chinese
• Secondary hypertension • Valvular heart disease • Chronic kidney dysfunction • Serum creatinine >=3.0 mg/dL • Recent stroke or MI (previous 6
months) • ≥NYHA class III CHF or • Echocardiography determining left
ventricular ejection fraction (LVEF) <40%
• Hepatic dysfunction • Autoimmune disorders • Malignant tumor • Alzheimer’s disease
724 SBP/DBP ≤140/90 mm Hg (363)
SBP/DBP ≤150/90 mm Hg (361)

© 2017 by the American College of Cardiology Foundation and the American Heart Association, Inc. 22
• Non-cardiovascular diseases potentially causing death before the end of the study
UKPDS Group, BMJ (1998)
UKPDS (40)
• Type 2 diabetes • Aged 25-65 years • Hypertension (SBP/DBP ≥160/90 mm
Hg or ≥150/85 mm Hg if the patient was receiving antihypertensive treatment)
• Ketonuria >3 mmol/l • Recent MI (previous year) • Current angina or heart failure one major vascular episode • Serum creatinine concentration >175
µmol/l • Retinopathy requiring laser treatment • Malignant hypertension • Uncorrected endocrine abnormality • Occupation which would preclude
insulin treatment or as heavy goods vehicle driver
• Severe concurrent illness likely to limit life or to require extensive systemic treatment
• Inadequate understanding or unwillingness to enter the study
SBP/DBP <150/85 mm Hg (798)
SBP/DBP <180/105 mm Hg (390)
DBP Estacio RO, Diabetes Care (2000)
ABCD – Hypertensive cohort (41)
• Hypertensive (DBP ≥ 90 mm Hg) • Off all antihypertensive medications • Type 2 diabetes • Ages 40-74 years at the time of
recruitment
• Known allergy to dihydropyridines or ACEIs
• Recent MI, CVA, or unstable angina pectoris (previous 6 months) or CABG surgery (previous 3 months)
• CHF ≥ Class III NYHA • Demonstrated an absolute need for
ACE inhibitors or CCBs • Received hemodialysis or • peritoneal dialysis • Serum creatinine level >3 mg/dl
DBP 75 mm Hg (237)
DBP 80-89 mm Hg (233)
Schrier RW, Kidney Intl (2002) Savage, J Curr Clin Trials (1993)
ABCD – Normotensive cohort (42) (43)
• Normotensive (DBP 80-89 mm Hg) • Type 2 diabetic subjects • Ages of 40-74 years at the time of
recruitment • Not receiving antihypertensive
medications at the randomization visit
• Known allergy to dihydropyridines or ACEIs
• Recent MI, CVA, or unstable angina pectoris (previous 6 months) or CABG surgery (previous 3 months)
• CHF ≥ Class III NYHA • Demonstrated an absolute need for
ACE inhibitors or CCBs • Received hemodialysis or • peritoneal dialysis
DBP 10 mm Hg Decrease (237)
DBP 80-89 mm Hg (243)

© 2017 by the American College of Cardiology Foundation and the American Heart Association, Inc. 23
• Serum creatinine level >3 mg/dl Hannson L, Lancet (1998)
HOT (44) • Aged 50-80 years • Hypertension • DBP 100 - 115 mm Hg
• Not reported DBP ≤80 mm Hg (6262)
DBP ≤90 mm Hg (6264) ≤85 mm Hg (6264)
MAP
Wright JT Jr., JAMA (2002) Norris K, Am J Kidney Dis (2006)
AASK (45, 46)
• Aged 18 to 70 years • African Americans (self-identified) • Hypertensive CKD • GFR 20- 65 mL/min per 1.73 m2 • No other identified causes of renal
insufficiency
• DBP < 95 mm Hg • Known history of diabetes mellitus
(Fasting glucose >=140 mg/dL, Random glucose >200 mg/dL, Urinary protein to creatinine ratio > 2.5)
• Accelerated or malignant hypertension within 6 months
• Secondary hypertension • Non–BP-related causes of CKD • Serious systemic disease • Clinical CHF • Specific indication for or
contraindication to a study drug or study procedure
MAP ≤92 mm Hg (equivalent to a BP <125/75 mmHg) (540)
MAP 102-107 mm Hg (equivalent to a BP < 140/90 mm Hg) (554)
Sarnak MJ, Ann Intern Med (2005)
MDRD (47)
• Age 18 to 70 years • Chronic kidney disease • Serum creatinine concentration of
123.8-618.8 µmol/L (1.4- 7.0 mg/dL) in men or 106.1- 618.8 µmol/L (1.2- 7.0 mg/dL) in women
• GFR 13-55 mL/min/1.73 m2
• Diabetes requiring therapy with insulin • CHF of ≥ NYHA Class III • Renal artery stenosis • History of kidney transplantation • Frequent hospitalizations
MAP <92 mm Hg (Age ≤60; equivalent to a BP <125/75 mmHg) & <98 mm Hg (Age ≥61) (432)
107 mm Hg (Age ≤ 60; equivalent to a BP < 140/90 mm Hg) & <113 mm Hg (Age ≥61)
Abbreviations: AASK: African American Study of Kidney Disease and Hypertension Trial; ABCD, Appropriate Blood Pressure Control in Diabetes Trial; ACCORD: Action to Control Cardiovascular Risk in Diabetes Trial; ACEI, angiotensin-converting-enzyme inhibitor, BP, blood pressure; CABG, Coronary artery bypass graft; CAD, coronary artery disease; Cardio-Sis, Studio Italiano Sugli Effetti CARDIOvascolari del Controllo della Pressione Arteriosa SIStolica; CCB, calcium channel blocker; CHF, congestive heart failure; CKD, Chronic kidney disease; CV, cardiovascular; CVA, cerebral vascular accident; CVD, cardiovascular disease; DBP, diastolic blood pressure; DM, diabetes mellitus; GFR, Glomerular Filtration Rate; HALT-PDK, Halt Progression of Polycystic Kidney Disease Study; HbA1c, Glycated hemoglobin level; HDL-C, density lipoprotein cholesterol; HOME-BP, Hypertension Objective Treatment Based on Measurement by Electrical Devices of Blood Pressure; HOT, Hypertension Optimal Treatment Study; JATOS, Japanese Trial to Assess Optimal Systolic Blood Pressure in Elderly Hypertensive Patients; LDL-C, low density lipoprotein cholesterol; MAP, mean arterial pressure; MDRD, Modification of Diet in Renal Disease Trial; MI, myocardial infarction; NR, Study name Not Reported; NYHA, New York Heart Association; NSAID, non-steroidal anti-inflammatory drug; PAD, peripheral artery disease; REIN-2, Rampiril Efficacy in Nephropathy-2; SBP, systolic blood pressure; SPRINT, Systolic Blood Pressure Intervetion Trial; TIA, transient ischemic attack; UKPDS, United Kingdom Prospective Diabetes Study; VALISH, Valsartan in Elderly Isolated Systolic Hypertension Study; WHO, World Health Organization.
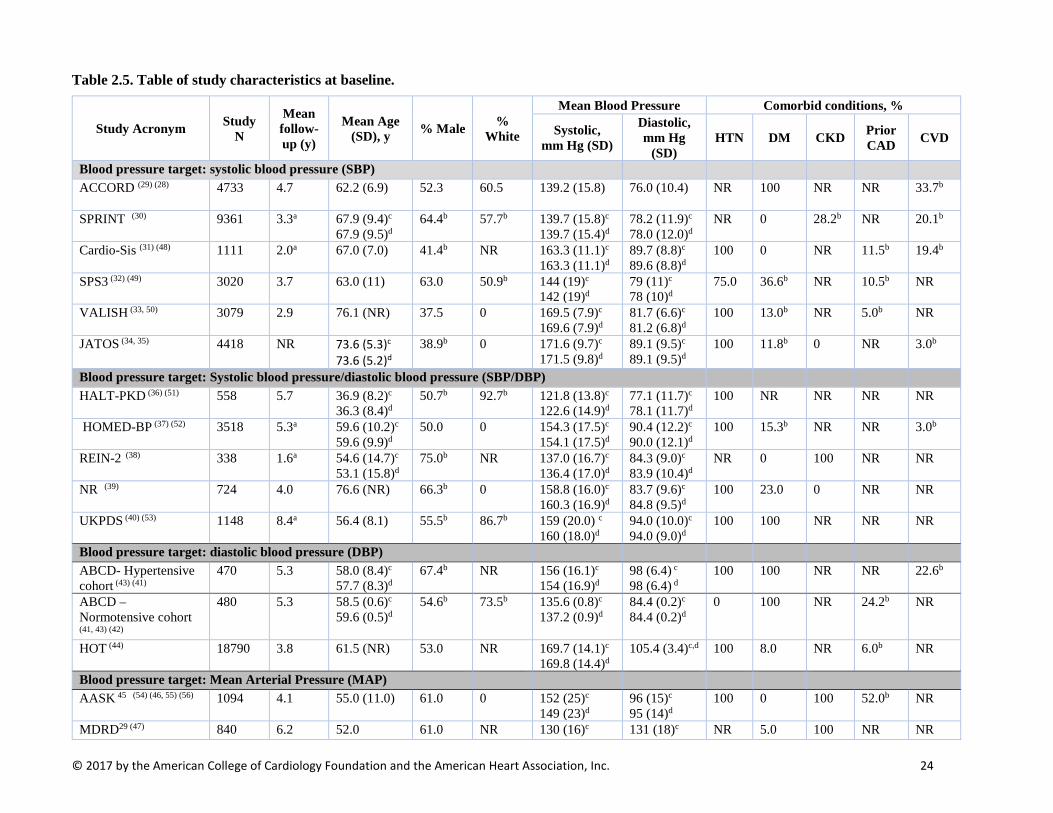
© 2017 by the American College of Cardiology Foundation and the American Heart Association, Inc. 24
Table 2.5. Table of study characteristics at baseline.
Study Acronym Study N
Mean follow-up (y)
Mean Age (SD), y % Male %
White
Mean Blood Pressure Comorbid conditions, %
Systolic, mm Hg (SD)
Diastolic, mm Hg
(SD) HTN DM CKD Prior
CAD CVD
Blood pressure target: systolic blood pressure (SBP) ACCORD (29) (28) 4733 4.7 62.2 (6.9) 52.3 60.5 139.2 (15.8)
76.0 (10.4) NR 100 NR NR 33.7b
SPRINT (30) 9361 3.3a 67.9 (9.4)c 67.9 (9.5)d
64.4b 57.7b 139.7 (15.8)c
139.7 (15.4)d 78.2 (11.9)c 78.0 (12.0)d
NR 0 28.2b NR 20.1b
Cardio-Sis (31) (48) 1111 2.0a 67.0 (7.0) 41.4b NR 163.3 (11.1)c 163.3 (11.1)d
89.7 (8.8)c 89.6 (8.8)d
100 0 NR 11.5b 19.4b
SPS3 (32) (49) 3020 3.7 63.0 (11) 63.0 50.9b 144 (19)c 142 (19)d
79 (11)c 78 (10)d
75.0 36.6b NR 10.5b NR
VALISH (33, 50) 3079 2.9 76.1 (NR) 37.5 0 169.5 (7.9)c 169.6 (7.9)d
81.7 (6.6)c 81.2 (6.8)d
100 13.0b NR 5.0b NR
JATOS (34, 35) 4418 NR 73.6 (5.3)c 73.6 (5.2)d
38.9b 0 171.6 (9.7)c 171.5 (9.8)d
89.1 (9.5)c 89.1 (9.5)d
100 11.8b 0 NR 3.0b
Blood pressure target: Systolic blood pressure/diastolic blood pressure (SBP/DBP) HALT-PKD (36) (51) 558 5.7 36.9 (8.2)c
36.3 (8.4)d 50.7b 92.7b 121.8 (13.8)c
122.6 (14.9)d 77.1 (11.7)c 78.1 (11.7)d
100 NR NR NR NR
HOMED-BP (37) (52) 3518 5.3a 59.6 (10.2)c 59.6 (9.9)d
50.0 0 154.3 (17.5)c 154.1 (17.5)d
90.4 (12.2)c 90.0 (12.1)d
100 15.3b NR NR 3.0b
REIN-2 (38) 338 1.6a 54.6 (14.7)c 53.1 (15.8)d
75.0b NR 137.0 (16.7)c 136.4 (17.0)d
84.3 (9.0)c 83.9 (10.4)d
NR 0 100 NR NR
NR (39) 724 4.0 76.6 (NR) 66.3b 0 158.8 (16.0)c 160.3 (16.9)d
83.7 (9.6)c 84.8 (9.5)d
100 23.0 0 NR NR
UKPDS (40) (53) 1148 8.4a 56.4 (8.1) 55.5b 86.7b 159 (20.0) c 160 (18.0)d
94.0 (10.0)c 94.0 (9.0)d
100 100 NR NR NR
Blood pressure target: diastolic blood pressure (DBP) ABCD- Hypertensive cohort (43) (41)
470 5.3 58.0 (8.4)c
57.7 (8.3)d 67.4b NR 156 (16.1)c
154 (16.9)d 98 (6.4) c
98 (6.4) d 100 100 NR NR 22.6b
ABCD – Normotensive cohort
(41, 43) (42)
480 5.3 58.5 (0.6)c 59.6 (0.5)d
54.6b 73.5b 135.6 (0.8)c 137.2 (0.9)d
84.4 (0.2)c 84.4 (0.2)d
0 100 NR 24.2b NR
HOT (44) 18790 3.8 61.5 (NR) 53.0 NR 169.7 (14.1)c 169.8 (14.4)d
105.4 (3.4)c,d
100 8.0 NR 6.0b NR
Blood pressure target: Mean Arterial Pressure (MAP) AASK 45 (54) (46, 55) (56) 1094 4.1 55.0 (11.0) 61.0 0 152 (25)c
149 (23)d 96 (15)c 95 (14)d
100 0 100 52.0b NR
MDRD29 (47) 840 6.2 52.0 61.0 NR 130 (16)c 131 (18)c NR 5.0 100 NR NR
© 2017 by the American College of Cardiology Foundation and the American Heart Association, Inc. 25
80 (10)d 80 (10)d a. Median value b. Total population data calculated from BP target group data. c. Intensive [lower] target blood pressure group d. Standard [higher] target blood pressure group. Abbreviations: CAD, coronary artery disease; CKD, chronic kidney disease; CVD, cardiovascular disease; DM, diabetes mellitus; HTN, hypertension; NR, not reported.

© 2017 by the American College of Cardiology Foundation and the American Heart Association, Inc. 26
Table 2.6. Comparison of protocols across studies (Part 2 –Targets for blood pressure lowering).
Study Acronym
Blood Pressure Measurement
Frequency of contact during follow up (monitoring and/or changes in antihypertensive medication treatment)
Intensive BP Goal [lower BP target]
Standard BP Goal [higher BP target]
Notes on medication management
Blood pressure target: systolic blood pressure (SBP)
ACCORD (28,
29) BP and glycemic treatments begin at
randomization At least monthly visits until month 4 and achieving BP goal then every 2 months. “Milepost” visits at 4-month intervals for 2 years then annually. Action required at each milepost for participants who remain above SBP goal of <120 mmHg. Between designated visits, therapy may be intensified for those not at goal.
BP and glycemic treatments begin at randomization Clinical visits months 1, 4, and every 4 months thereafter. Medication dose titration or the addition of another drug is indicated if systolic blood pressure is ≥160 mm Hg at a single visit or ≥140 mm Hg at 2 successive visits Down titration permitted if SBP <135 mmHg at 2 successive clinic visits or <130 mmHg at any single visit
Medication doses may be decreased or changed whenever an ACCORD therapist considers it clinically indicated, such as when symptoms are reported that could be secondary to an antihypertensive medication
SPRINT (30) Seated BP measured at each clinic visit using an automated measurement system (Model 907, Omron Healthcare)
Post-randomization visits at months 1,2, 3, 6, and every 3 months thereafter 2 or 3 drug therapy using a combination of thiazide-type diuretic, and/or an ACEI, or ARB (but not both) and/or a CCB initiated at randomization (an ACE inhibitor or ARB plus a CCB initiated if diuretic contraindicated or not tolerated) Drug doses increased and/or additional antihypertensive medications added at each visit (usually monthly intervals) until participant's SBP goal of <120 mmHg had been reached or the investigator decided no further antihypertensive medications may be added
Post-randomization visits at months 1,2, 3, 6, and every 3 months thereafter Participants may not be on ≥1 antihypertensive medications Use of thiazide-type diuretic initially if antihypertensive medication indicated Treatment should not be intensified at the randomization visit unless SBP ≥160 mm Hg or there was a compelling reason to add medication Medications were adjusted to target SBP of 135 - 139 mmHg, and dose reduced if SBP was <130 mmHg on a single visit or < 135 mmHg on two consecutive visits
Study physician may add, increase or reduce the dose, stop, or change antihypertensive drugs (temporarily or permanently) in the interest of participant safety
Cardio-Sis
(31) Seated BP through standard mercury sphygmomano-meter
After randomization, visits every 4 months for 2 years Anti-hypertensive therapy was open-label and tailored to the single subjects One or more SBP >130 mmHg is enough to intensify treatment
After randomization, visits every 4 months for 2 years Anti-hypertensive therapy was open-label and tailored to the single subjects
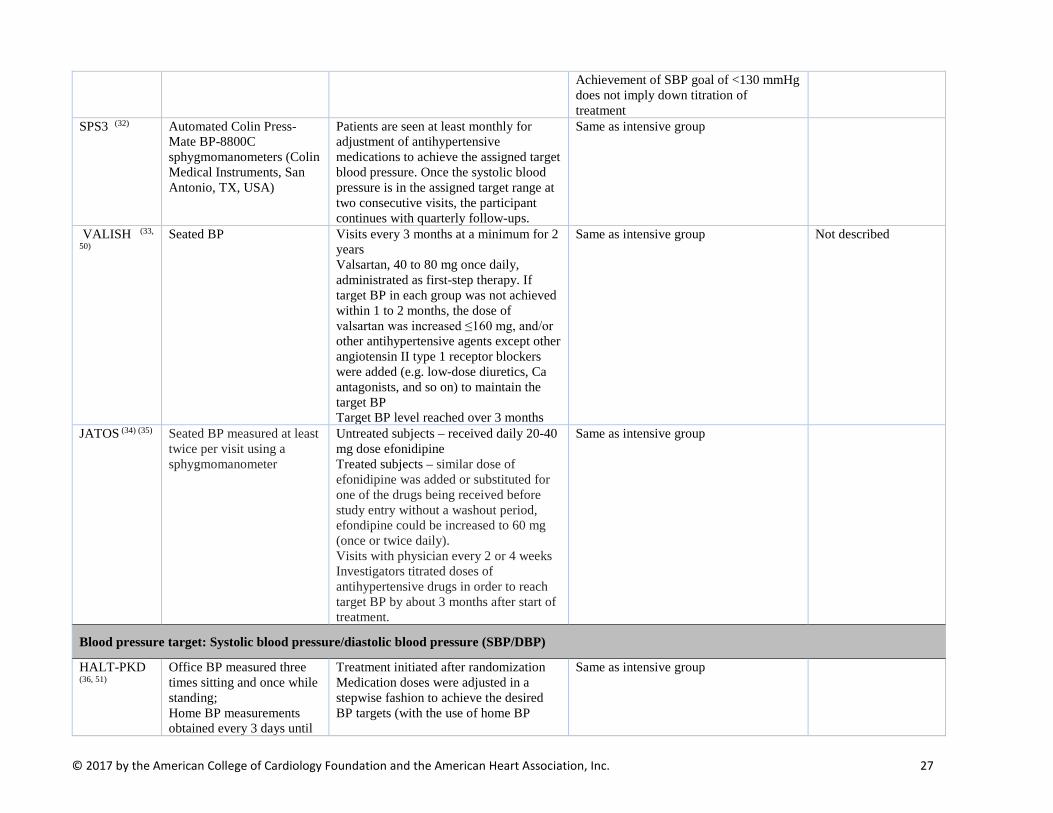
© 2017 by the American College of Cardiology Foundation and the American Heart Association, Inc. 27
Achievement of SBP goal of <130 mmHg does not imply down titration of treatment
SPS3 (32) Automated Colin Press-Mate BP-8800C sphygmomanometers (Colin Medical Instruments, San Antonio, TX, USA)
Patients are seen at least monthly for adjustment of antihypertensive medications to achieve the assigned target blood pressure. Once the systolic blood pressure is in the assigned target range at two consecutive visits, the participant continues with quarterly follow-ups.
Same as intensive group
VALISH (33,
50) Seated BP Visits every 3 months at a minimum for 2
years Valsartan, 40 to 80 mg once daily, administrated as first-step therapy. If target BP in each group was not achieved within 1 to 2 months, the dose of valsartan was increased ≤160 mg, and/or other antihypertensive agents except other angiotensin II type 1 receptor blockers were added (e.g. low-dose diuretics, Ca antagonists, and so on) to maintain the target BP Target BP level reached over 3 months
Same as intensive group Not described
JATOS (34) (35) Seated BP measured at least twice per visit using a sphygmomanometer
Untreated subjects – received daily 20-40 mg dose efonidipine Treated subjects – similar dose of efonidipine was added or substituted for one of the drugs being received before study entry without a washout period, efondipine could be increased to 60 mg (once or twice daily). Visits with physician every 2 or 4 weeks Investigators titrated doses of antihypertensive drugs in order to reach target BP by about 3 months after start of treatment.
Same as intensive group
Blood pressure target: Systolic blood pressure/diastolic blood pressure (SBP/DBP)
HALT-PKD
(36, 51) Office BP measured three times sitting and once while standing; Home BP measurements obtained every 3 days until
Treatment initiated after randomization Medication doses were adjusted in a stepwise fashion to achieve the desired BP targets (with the use of home BP
Same as intensive group
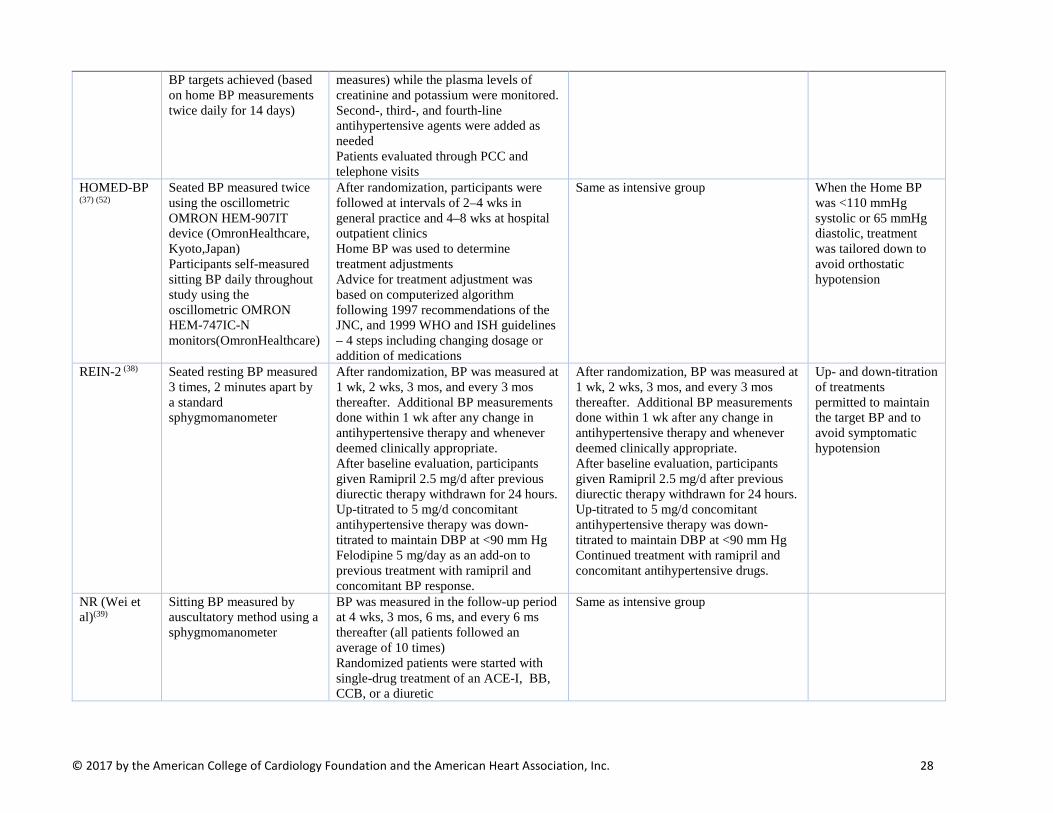
© 2017 by the American College of Cardiology Foundation and the American Heart Association, Inc. 28
BP targets achieved (based on home BP measurements twice daily for 14 days)
measures) while the plasma levels of creatinine and potassium were monitored. Second-, third-, and fourth-line antihypertensive agents were added as needed Patients evaluated through PCC and telephone visits
HOMED-BP
(37) (52) Seated BP measured twice using the oscillometric OMRON HEM-907IT device (OmronHealthcare, Kyoto,Japan) Participants self-measured sitting BP daily throughout study using the oscillometric OMRON HEM-747IC-N monitors(OmronHealthcare)
After randomization, participants were followed at intervals of 2–4 wks in general practice and 4–8 wks at hospital outpatient clinics Home BP was used to determine treatment adjustments Advice for treatment adjustment was based on computerized algorithm following 1997 recommendations of the JNC, and 1999 WHO and ISH guidelines – 4 steps including changing dosage or addition of medications
Same as intensive group When the Home BP was <110 mmHg systolic or 65 mmHg diastolic, treatment was tailored down to avoid orthostatic hypotension
REIN-2 (38) Seated resting BP measured 3 times, 2 minutes apart by a standard sphygmomanometer
After randomization, BP was measured at 1 wk, 2 wks, 3 mos, and every 3 mos thereafter. Additional BP measurements done within 1 wk after any change in antihypertensive therapy and whenever deemed clinically appropriate. After baseline evaluation, participants given Ramipril 2.5 mg/d after previous diurectic therapy withdrawn for 24 hours. Up-titrated to 5 mg/d concomitant antihypertensive therapy was down-titrated to maintain DBP at <90 mm Hg Felodipine 5 mg/day as an add-on to previous treatment with ramipril and concomitant BP response.
After randomization, BP was measured at 1 wk, 2 wks, 3 mos, and every 3 mos thereafter. Additional BP measurements done within 1 wk after any change in antihypertensive therapy and whenever deemed clinically appropriate. After baseline evaluation, participants given Ramipril 2.5 mg/d after previous diurectic therapy withdrawn for 24 hours. Up-titrated to 5 mg/d concomitant antihypertensive therapy was down-titrated to maintain DBP at <90 mm Hg Continued treatment with ramipril and concomitant antihypertensive drugs.
Up- and down-titration of treatments permitted to maintain the target BP and to avoid symptomatic hypotension
NR (Wei et al)(39)
Sitting BP measured by auscultatory method using a sphygmomanometer
BP was measured in the follow-up period at 4 wks, 3 mos, 6 ms, and every 6 ms thereafter (all patients followed an average of 10 times) Randomized patients were started with single-drug treatment of an ACE-I, BB, CCB, or a diuretic
Same as intensive group
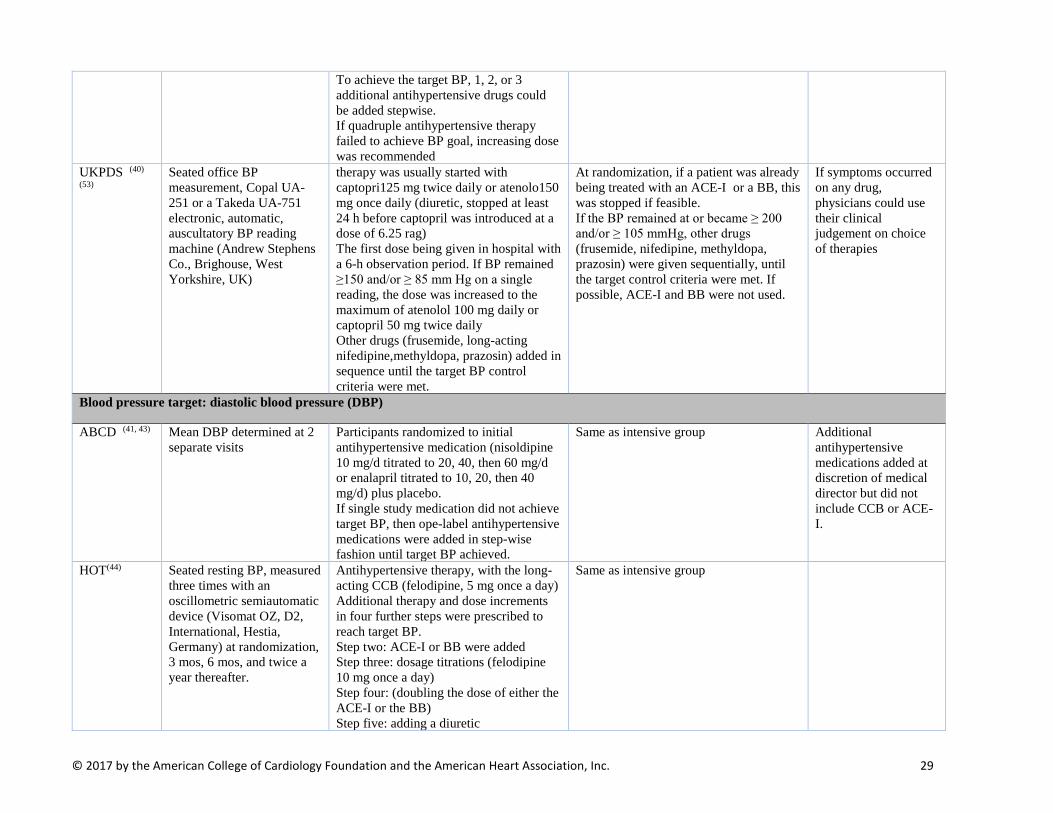
© 2017 by the American College of Cardiology Foundation and the American Heart Association, Inc. 29
To achieve the target BP, 1, 2, or 3 additional antihypertensive drugs could be added stepwise. If quadruple antihypertensive therapy failed to achieve BP goal, increasing dose was recommended
UKPDS (40)
(53) Seated office BP measurement, Copal UA-251 or a Takeda UA-751 electronic, automatic, auscultatory BP reading machine (Andrew Stephens Co., Brighouse, West Yorkshire, UK)
therapy was usually started with captopri125 mg twice daily or atenolo150 mg once daily (diuretic, stopped at least 24 h before captopril was introduced at a dose of 6.25 rag) The first dose being given in hospital with a 6-h observation period. If BP remained ≥150 and/or ≥ 85 mm Hg on a single reading, the dose was increased to the maximum of atenolol 100 mg daily or captopril 50 mg twice daily Other drugs (frusemide, long-acting nifedipine,methyldopa, prazosin) added in sequence until the target BP control criteria were met.
At randomization, if a patient was already being treated with an ACE-I or a BB, this was stopped if feasible. If the BP remained at or became ≥ 200 and/or ≥ 105 mmHg, other drugs (frusemide, nifedipine, methyldopa, prazosin) were given sequentially, until the target control criteria were met. If possible, ACE-I and BB were not used.
If symptoms occurred on any drug, physicians could use their clinical judgement on choice of therapies
Blood pressure target: diastolic blood pressure (DBP) ABCD (41, 43) Mean DBP determined at 2
separate visits Participants randomized to initial antihypertensive medication (nisoldipine 10 mg/d titrated to 20, 40, then 60 mg/d or enalapril titrated to 10, 20, then 40 mg/d) plus placebo. If single study medication did not achieve target BP, then ope-label antihypertensive medications were added in step-wise fashion until target BP achieved.
Same as intensive group Additional antihypertensive medications added at discretion of medical director but did not include CCB or ACE-I.
HOT(44) Seated resting BP, measured three times with an oscillometric semiautomatic device (Visomat OZ, D2, International, Hestia, Germany) at randomization, 3 mos, 6 mos, and twice a year thereafter.
Antihypertensive therapy, with the long-acting CCB (felodipine, 5 mg once a day) Additional therapy and dose increments in four further steps were prescribed to reach target BP. Step two: ACE-I or BB were added Step three: dosage titrations (felodipine 10 mg once a day) Step four: (doubling the dose of either the ACE-I or the BB) Step five: adding a diuretic
Same as intensive group

© 2017 by the American College of Cardiology Foundation and the American Heart Association, Inc. 30
Blood pressure target: Mean Arterial Pressure (MAP)
AASK (45, 56) Seated resting BP measured 3 times using Hawksley random zero sphygmomanometer
Treatment with 1 of 3 antihypertenstive study drugs – sustained release BB (metoprolol 50 to 200 mg/d), ACE-I (ramapril, 2.5 to 10 mg/d), CCB (amlodipine, 5 to 10 mg/d) If target BP not achieved on study drug, additional unmasked drugs added. The dosage of each drug was increased to maximum tolerated dose before adding a subsequent agent.
Same as intensive group.
MDRD (47) BP measured monthly using random-zero mercury sphygmomanometer
After randomization, Nonpharmacologic therapy consisted of recommendations for exercise and weight loss and reductions in intake of dietary sodium and alcohol For pharmacologic therapy, use of all agents was allowed, to achieve BP goals. ACEI and CCB, both with or without diuretic, were encouraged as first choice and second choice agents respectively.
Same as intensive group.
Abbreviations: ACE-I, angiotensin-converting enzyme inhibitor; BB, beta blocker; BP, blood pressure; CCB, calcium channel blocker; ISH, International Society of Hypertension; JNC, Joint National Committee; PCC, participating clinical center; WHO, World Health Organization.

© 2017 by the American College of Cardiology Foundation and the American Heart Association, Inc. 31
Table 2.7. Relative Risk (95% Confidence Interval) for a Given Outcome for any Intensive [Lower] Blood Pressure Target Versus any Standard [Higher] Blood Pressure Target.
Outcome Studies
included, N
Study participants included, N
Events, N (%)
RR (95% CI)
Heterogeneity Funnel Plot Asymmetry
Intensive BP target
Standard BP target I2 (%) P-value
P-value for Kendall’s
Τau
P-value for Egger’s
Regression Test
All-cause mortality 15 49,934 952 (4.0) 1,001 (4.3) 0.89 (0.77, 1.02) 49.30 0.02 0.24 0.50
CVD mortality 10 40,266 268 (1.3) 504 (2.5) 0.86 (0.67, 1.12) 46.44 0.06 0.38 0.38
Major Cardiovascular Disease Events
7a 23,617 682 (5.8) 828 (7.0) 0.81 (0.70, 0.94) 41.34 0.12 0.56 0.55
Fatal or non-fatal myocardial infarction
11 31,926 415 (2.6) 419 (2.7) 0.86 (0.76, 0.99) 0.00 0.99 0.76 0.28
Fatal or non-fatal stroke 12 33,018 389 (2.3) 475 (2.9) 0.77 (0.65, 0.91) 26.43 0.18 0.74 0.41
Fatal or non-fatal heart failure
8 23,066 222 (1.9) 278 (2.4) 0.75 (0.56, 0.99) 49.12 0.06 0.55 0.72
Renal Events 8b 18,286 334 (3.8) 353 (4.2) 1.01 (0.89, 1.15) 0.00 0.80 1.00 0.68
Note: Detailed information about studies included for each specific outcome may be found in Tables 2.9-2.15. a. Major cardiovascular disease events were included in the analysis only if defined and reported as a composite outcome by each trial, it included cardiovascular death, stroke, myocardial infarction, and heart failure. b. Renal events include the following: doubling of serum creatinine, end stage renal disease, a decline in glomerular filtration rates >50% or 25 mL/min per 1.73 m^2 reduction in GFR from baseline, progression of chronic kidney disease (CKD), renal failure, renal failure in absence of acute reversible cause.
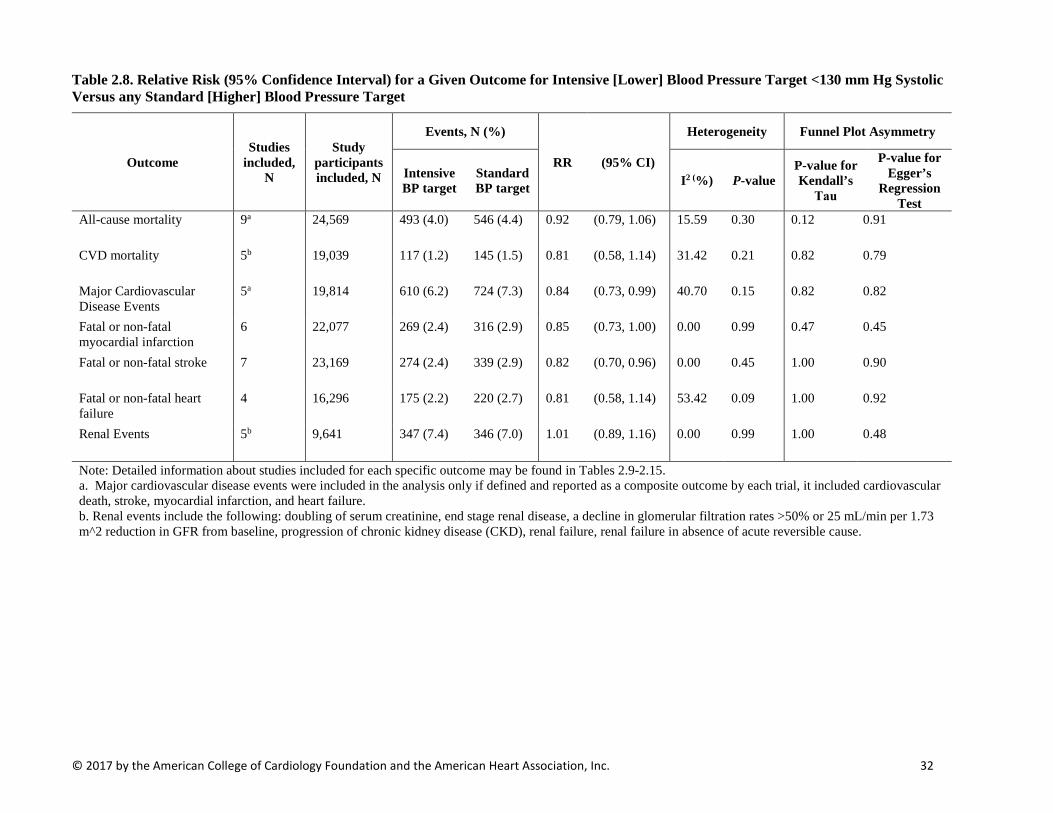
© 2017 by the American College of Cardiology Foundation and the American Heart Association, Inc. 32
Table 2.8. Relative Risk (95% Confidence Interval) for a Given Outcome for Intensive [Lower] Blood Pressure Target <130 mm Hg Systolic Versus any Standard [Higher] Blood Pressure Target
Outcome Studies
included, N
Study participants included, N
Events, N (%)
RR (95% CI)
Heterogeneity Funnel Plot Asymmetry
Intensive BP target
Standard BP target I2 (%) P-value
P-value for Kendall’s
Τau
P-value for Egger’s
Regression Test
All-cause mortality 9a 24,569 493 (4.0) 546 (4.4) 0.92 (0.79, 1.06) 15.59 0.30 0.12 0.91
CVD mortality 5b 19,039 117 (1.2) 145 (1.5) 0.81 (0.58, 1.14) 31.42 0.21 0.82 0.79
Major Cardiovascular Disease Events
5a 19,814 610 (6.2) 724 (7.3) 0.84 (0.73, 0.99) 40.70 0.15 0.82 0.82
Fatal or non-fatal myocardial infarction
6 22,077 269 (2.4) 316 (2.9) 0.85 (0.73, 1.00) 0.00 0.99 0.47 0.45
Fatal or non-fatal stroke 7 23,169 274 (2.4) 339 (2.9) 0.82 (0.70, 0.96) 0.00 0.45 1.00 0.90
Fatal or non-fatal heart failure
4 16,296 175 (2.2) 220 (2.7) 0.81 (0.58, 1.14) 53.42 0.09 1.00 0.92
Renal Events 5b 9,641 347 (7.4) 346 (7.0) 1.01 (0.89, 1.16) 0.00 0.99 1.00 0.48
Note: Detailed information about studies included for each specific outcome may be found in Tables 2.9-2.15. a. Major cardiovascular disease events were included in the analysis only if defined and reported as a composite outcome by each trial, it included cardiovascular death, stroke, myocardial infarction, and heart failure. b. Renal events include the following: doubling of serum creatinine, end stage renal disease, a decline in glomerular filtration rates >50% or 25 mL/min per 1.73 m^2 reduction in GFR from baseline, progression of chronic kidney disease (CKD), renal failure, renal failure in absence of acute reversible cause.
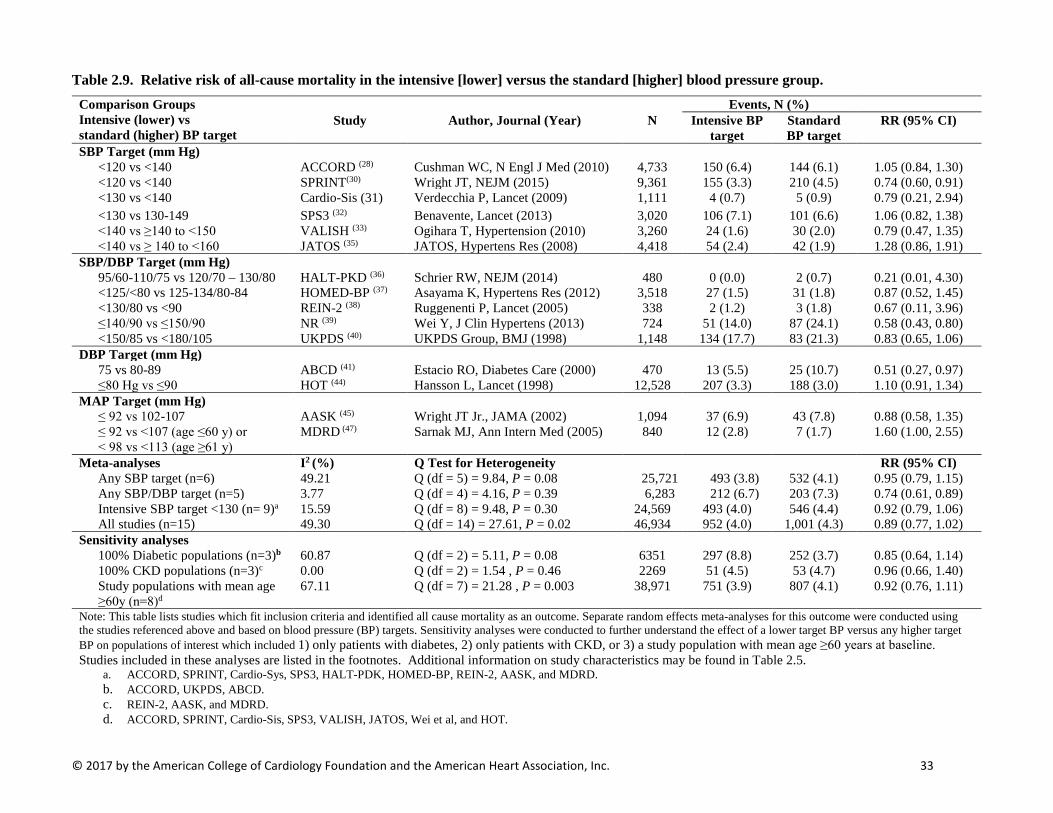
© 2017 by the American College of Cardiology Foundation and the American Heart Association, Inc. 33
Table 2.9. Relative risk of all-cause mortality in the intensive [lower] versus the standard [higher] blood pressure group. Comparison Groups Intensive (lower) vs standard (higher) BP target
Events, N (%) Study Author, Journal (Year) N Intensive BP
target Standard BP target
RR (95% CI)
SBP Target (mm Hg) <120 vs <140 ACCORD (28) Cushman WC, N Engl J Med (2010) 4,733 150 (6.4) 144 (6.1) 1.05 (0.84, 1.30) <120 vs <140 SPRINT(30) Wright JT, NEJM (2015) 9,361 155 (3.3) 210 (4.5) 0.74 (0.60, 0.91) <130 vs <140 Cardio-Sis (31) Verdecchia P, Lancet (2009) 1,111 4 (0.7) 5 (0.9) 0.79 (0.21, 2.94) <130 vs 130-149 SPS3 (32) Benavente, Lancet (2013) 3,020 106 (7.1) 101 (6.6) 1.06 (0.82, 1.38) <140 vs ≥140 to <150 VALISH (33) Ogihara T, Hypertension (2010) 3,260 24 (1.6) 30 (2.0) 0.79 (0.47, 1.35) <140 vs ≥ 140 to <160 JATOS (35) JATOS, Hypertens Res (2008) 4,418 54 (2.4) 42 (1.9) 1.28 (0.86, 1.91)
SBP/DBP Target (mm Hg) 95/60-110/75 vs 120/70 – 130/80 HALT-PKD (36) Schrier RW, NEJM (2014) 480 0 (0.0) 2 (0.7) 0.21 (0.01, 4.30) <125/<80 vs 125-134/80-84 HOMED-BP (37) Asayama K, Hypertens Res (2012) 3,518 27 (1.5) 31 (1.8) 0.87 (0.52, 1.45) <130/80 vs <90 REIN-2 (38) Ruggenenti P, Lancet (2005) 338 2 (1.2) 3 (1.8) 0.67 (0.11, 3.96) ≤140/90 vs ≤150/90 NR (39) Wei Y, J Clin Hypertens (2013) 724 51 (14.0) 87 (24.1) 0.58 (0.43, 0.80) <150/85 vs <180/105 UKPDS (40) UKPDS Group, BMJ (1998) 1,148 134 (17.7) 83 (21.3) 0.83 (0.65, 1.06)
DBP Target (mm Hg) 75 vs 80-89 ABCD (41) Estacio RO, Diabetes Care (2000) 470 13 (5.5) 25 (10.7) 0.51 (0.27, 0.97) ≤80 Hg vs ≤90 HOT (44) Hansson L, Lancet (1998) 12,528 207 (3.3) 188 (3.0) 1.10 (0.91, 1.34)
MAP Target (mm Hg) ≤ 92 vs 102-107 AASK (45) Wright JT Jr., JAMA (2002) 1,094 37 (6.9) 43 (7.8) 0.88 (0.58, 1.35) ≤ 92 vs <107 (age ≤60 y) or < 98 vs <113 (age ≥61 y)
MDRD (47) Sarnak MJ, Ann Intern Med (2005) 840 12 (2.8) 7 (1.7) 1.60 (1.00, 2.55)
Meta-analyses I2 (%) Q Test for Heterogeneity RR (95% CI) Any SBP target (n=6) 49.21 Q (df = 5) = 9.84, P = 0.08 25,721 493 (3.8) 532 (4.1) 0.95 (0.79, 1.15) Any SBP/DBP target (n=5) 3.77 Q (df = 4) = 4.16, P = 0.39 6,283 212 (6.7) 203 (7.3) 0.74 (0.61, 0.89) Intensive SBP target <130 (n= 9)a 15.59 Q (df = 8) = 9.48, P = 0.30 24,569 493 (4.0) 546 (4.4) 0.92 (0.79, 1.06) All studies (n=15) 49.30 Q (df = 14) = 27.61, P = 0.02 46,934 952 (4.0) 1,001 (4.3) 0.89 (0.77, 1.02)
Sensitivity analyses 100% Diabetic populations (n=3)b 60.87 Q (df = 2) = 5.11, P = 0.08 6351 297 (8.8) 252 (3.7) 0.85 (0.64, 1.14) 100% CKD populations (n=3)c 0.00 Q (df = 2) = 1.54 , P = 0.46 2269 51 (4.5) 53 (4.7) 0.96 (0.66, 1.40) Study populations with mean age ≥60y (n=8)d
67.11 Q (df = 7) = 21.28 , P = 0.003 38,971 751 (3.9) 807 (4.1) 0.92 (0.76, 1.11)
Note: This table lists studies which fit inclusion criteria and identified all cause mortality as an outcome. Separate random effects meta-analyses for this outcome were conducted using the studies referenced above and based on blood pressure (BP) targets. Sensitivity analyses were conducted to further understand the effect of a lower target BP versus any higher target BP on populations of interest which included 1) only patients with diabetes, 2) only patients with CKD, or 3) a study population with mean age ≥60 years at baseline. Studies included in these analyses are listed in the footnotes. Additional information on study characteristics may be found in Table 2.5.
a. ACCORD, SPRINT, Cardio-Sys, SPS3, HALT-PDK, HOMED-BP, REIN-2, AASK, and MDRD. b. ACCORD, UKPDS, ABCD. c. REIN-2, AASK, and MDRD. d. ACCORD, SPRINT, Cardio-Sis, SPS3, VALISH, JATOS, Wei et al, and HOT.

© 2017 by the American College of Cardiology Foundation and the American Heart Association, Inc. 34
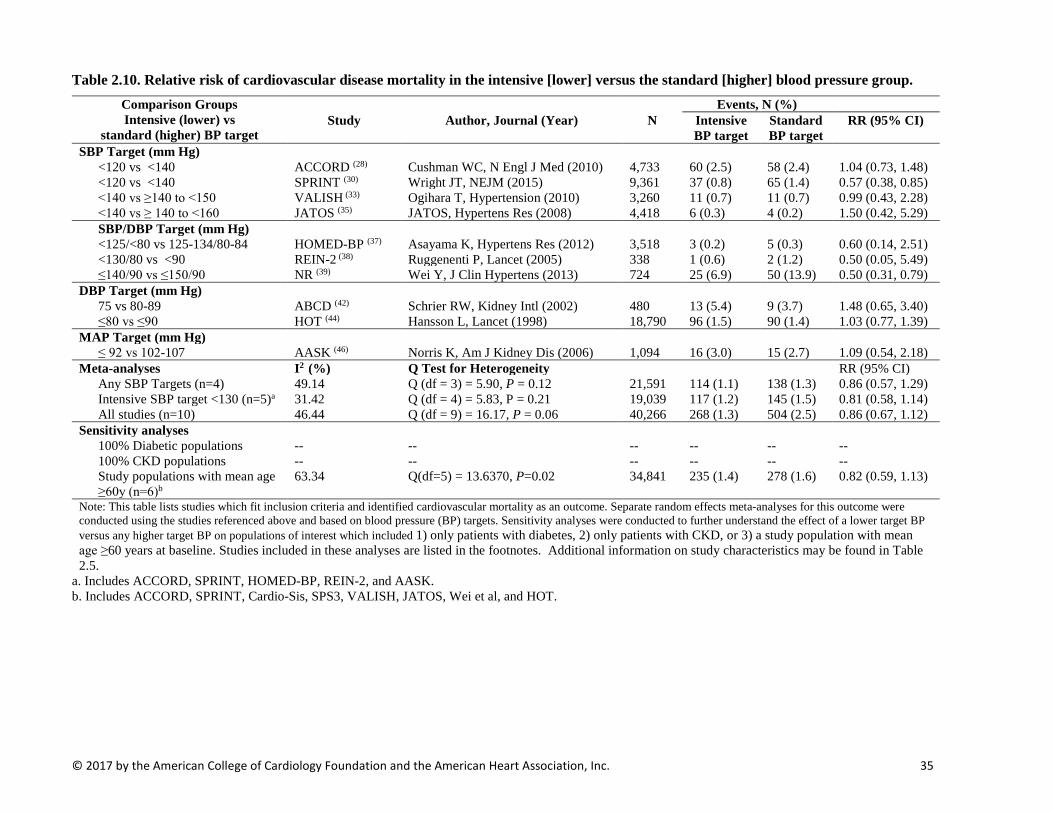
© 2017 by the American College of Cardiology Foundation and the American Heart Association, Inc. 35
Table 2.10. Relative risk of cardiovascular disease mortality in the intensive [lower] versus the standard [higher] blood pressure group. Comparison Groups Intensive (lower) vs
standard (higher) BP target
Events, N (%) Study Author, Journal (Year) N Intensive
BP target Standard BP target
RR (95% CI)
SBP Target (mm Hg) <120 vs <140 ACCORD (28) Cushman WC, N Engl J Med (2010) 4,733 60 (2.5) 58 (2.4) 1.04 (0.73, 1.48) <120 vs <140 SPRINT (30) Wright JT, NEJM (2015) 9,361 37 (0.8) 65 (1.4) 0.57 (0.38, 0.85) <140 vs ≥140 to <150 VALISH (33) Ogihara T, Hypertension (2010) 3,260 11 (0.7) 11 (0.7) 0.99 (0.43, 2.28) <140 vs ≥ 140 to <160 JATOS (35) JATOS, Hypertens Res (2008) 4,418 6 (0.3) 4 (0.2) 1.50 (0.42, 5.29) SBP/DBP Target (mm Hg) <125/<80 vs 125-134/80-84 HOMED-BP (37) Asayama K, Hypertens Res (2012) 3,518 3 (0.2) 5 (0.3) 0.60 (0.14, 2.51) <130/80 vs <90 REIN-2 (38) Ruggenenti P, Lancet (2005) 338 1 (0.6) 2 (1.2) 0.50 (0.05, 5.49) ≤140/90 vs ≤150/90 NR (39) Wei Y, J Clin Hypertens (2013) 724 25 (6.9) 50 (13.9) 0.50 (0.31, 0.79)
DBP Target (mm Hg) 75 vs 80-89 ABCD (42) Schrier RW, Kidney Intl (2002) 480 13 (5.4) 9 (3.7) 1.48 (0.65, 3.40) ≤80 vs ≤90 HOT (44) Hansson L, Lancet (1998) 18,790 96 (1.5) 90 (1.4) 1.03 (0.77, 1.39)
MAP Target (mm Hg) ≤ 92 vs 102-107 AASK (46) Norris K, Am J Kidney Dis (2006) 1,094 16 (3.0) 15 (2.7) 1.09 (0.54, 2.18)
Meta-analyses I2 (%) Q Test for Heterogeneity RR (95% CI) Any SBP Targets (n=4) 49.14 Q (df = 3) = 5.90, P = 0.12 21,591 114 (1.1) 138 (1.3) 0.86 (0.57, 1.29) Intensive SBP target <130 (n=5)a 31.42 Q (df = 4) = 5.83, P = 0.21 19,039 117 (1.2) 145 (1.5) 0.81 (0.58, 1.14) All studies (n=10) 46.44 Q (df = 9) = 16.17, P = 0.06 40,266 268 (1.3) 504 (2.5) 0.86 (0.67, 1.12)
Sensitivity analyses 100% Diabetic populations -- -- -- -- -- -- 100% CKD populations -- -- -- -- -- -- Study populations with mean age ≥60y (n=6)b
63.34 Q(df=5) = 13.6370, P=0.02 34,841 235 (1.4) 278 (1.6) 0.82 (0.59, 1.13)
Note: This table lists studies which fit inclusion criteria and identified cardiovascular mortality as an outcome. Separate random effects meta-analyses for this outcome were conducted using the studies referenced above and based on blood pressure (BP) targets. Sensitivity analyses were conducted to further understand the effect of a lower target BP versus any higher target BP on populations of interest which included 1) only patients with diabetes, 2) only patients with CKD, or 3) a study population with mean age ≥60 years at baseline. Studies included in these analyses are listed in the footnotes. Additional information on study characteristics may be found in Table 2.5.
a. Includes ACCORD, SPRINT, HOMED-BP, REIN-2, and AASK. b. Includes ACCORD, SPRINT, Cardio-Sis, SPS3, VALISH, JATOS, Wei et al, and HOT.

© 2017 by the American College of Cardiology Foundation and the American Heart Association, Inc. 36
Table 2.11. Relative risk of major cardiovascular diseasea event in the intensive [lower] versus the standard [higher] blood pressure group.
Comparison Groups Intensive (lower) vs
standard (higher) BP target
Events, N (%)
Study Author, Journal (Year) N Intensive BP target
Standard BP target
RR (95% CI)
SBP Target (mm Hg) <120 vs <140 ACCORD (28) Cushman WC, N Engl J Med (2010) 4,733 253 (10.7) 270 (11.4) 0.94 (0.80, 1.11) <120 vs <140 SPRINT (30) Wright JT, NEJM (2015) 9,361 243 (5.2) 319 (6.8) 0.76 (0.65, 0.90) <130 vs <140 Cardio-Sis (31) Verdecchia P, Lancet (2009) 1,111 17 (3.0) 32 (5.8) 0.79 (0.21, 2.94) <140 vs ≥140 to <150 VALISH (33) Ogihara T, Hypertension (2010) 3,260 32 (2.1) 37 (2.4) 0.86 (0.54, 1.37)
SBP/DBP Target (mm Hg) <125/<80 vs 125-134/80-84 HOMED-BP (37) Asayama K, Hypertens Res (2012) 3,518 26 (1.5) 25 (1.4) 1.04 (0.60, 1.79) ≤140/90 vs ≤150/90 NR (39) Wei Y, J Clin Hypertens (2013) 724 40 (11.0) 67 (18.6) 0.59 (0.41,0.85)
MAP Target (mm Hg) ≤ 92 vs 102-107 AASK (46) Norris K, Am J Kidney Dis (2006) 1,094 71 (13.1) 78 (14.1) 0.93 (0.69, 1.25) Meta-analyses I2 (%) Q Test for Heterogeneity RR (95% CI)
Any SBP Target (n=4) 47.76 Q (df = 3) = 5.74, P = 0.12 18,283 545 (6.0) 658 (7.2) 0.81 (0.68, 0.98) Intensive SBP target <130 (n= 5)b 40.70 Q (df = 4) = 6.75, P = 0.15 19,814 610 (6.2) 724 (7.3) 0.85 (0.73, 0.99) All studies (n=7) 41.43 Q (df = 6) = 10.23, P = 0.12 23,617 682 (5.8) 828 (7.0) 0.81 (0.70, 0.94)
Sensitivity analyses 100% Diabetic populations (n=1) -- -- -- -- -- -- 100% CKD populations (n=2) -- -- -- -- -- -- Study populations with mean age ≥60y (n=5)c
54.59 Q (df=4)= 8.81, P=0.07 19,007 585 (6.2) 725 (7.6) 0.77 (0.64, 0.93)
Note: This table lists studies which fit inclusion criteria and identified major cardiovascular disease as an outcome. Separate random effects meta-analyses for this outcome were conducted using the studies referenced above and based on blood pressure (BP) targets. Sensitivity analyses were conducted to further understand the effect of a lower target BP versus any higher target BP on populations of interest which included 1) only patients with diabetes, 2) only patients with CKD, or 3) a study population with mean age ≥60 years at baseline. Studies included in these analyses are listed in the footnotes. Additional information on study characteristics may be found in Table 2.5. a. Major cardiovascular disease events were included in the analysis only if defined and reported as a composite outcome by each trial, it included cardiovascular death, stroke, myocardial infarction, and heart failure. b. Includes ACCORD, SPRINT, Cardio-Sis, HOMED-BP, and AASK. c. Includes ACCORD, SPRINT, VALISH, JATOS, and Wei et al.

© 2017 by the American College of Cardiology Foundation and the American Heart Association, Inc. 37
Table 2.12. Relative risk of fatal or non-fatal myocardial infarction in the intensive [lower] versus the standard [higher] blood pressure group. Comparison Groups Intensive (lower) vs
standard (higher) BP target
Events, N (%) Study Author, Journal (Year) N Intensive
BP target Standard BP target
RR (95% CI)
SBP Target (mm Hg) <120 vs <140 ACCORD (28) Cushman WC, N Engl J Med (2010) 4,733 126 (5.3) 146 (6.2) 0.87 (0.69, 1.09) <120 vs <140 SPRINT (30) Wright JT, NEJM (2015) 9,361 97 (2.1) 116 (2.5) 0.84 (0.64, 1.09) <130 vs <140 Cardio-Sis (31) Verdecchia P, Lancet (2009) 1,110 4 (0.7) 6 (1.1) 0.66 (0.19, 2.33) <130 vs <140 SPS3 (32) Benavente, Lancet (2013) 3,020 36 (2.4) 40 (2.6) 0.91 (0.58, 1.42) <140 vs ≥140 to <150 VALISH (33) Ogihara T, Hypertension (2010) 3,079 5 (0.3) 4 (0.3) 1.24 (0.33, 4.61) <140 vs ≥ 140 to <160 JATOS (35) JATOS, Hypertens Res (2008) 4,418 6 (0.3) 6 (0.3) 1.00 (0.32, 3.09)
SBP/DBP Target (mm Hg) <125/<80 vs 125-134/80-84 HOMED-BP (37) Asayama K, Hypertens Res (2012) 3,518 5 (0.3) 7 (0.4) 0.71 (0.23, 2.25) <130/80 vs <90 REIN-2 (38) Ruggenenti P, Lancet (2005) 338 1 (0.6) 1 (0.6) 1.01 (0.06, 16.0) ≤140/90 vs ≤150/90 NR (39) Wei Y, J Clin Hypertens (2013) 724 9 (2.5) 9 (2.5) 0.99 (0.40, 2.48) <150/85 vs <180/105 UKPDS (40) UKPDS Group, BMJ (1998) a 1,148 107 (14.1) 69 (17.7) 0.80 (0.60, 1.05)
DBP Target (mm Hg) 75 vs 80-89 ABCD (42) Schrier RW, Kidney Intl (2002) 480 19 (8.0) 15 (6.2) 1.30 (0.68, 2.49)
Meta-analyses I2 (%) Q Test for Heterogeneity RR (95% CI) Any SBP target (n=6) 0.00 Q (df = 5) = 0.63, P = 0.99 25,721 274 (2.1) 318 (2.5) 0.86 (0.74, 1.01) Intensive SBP target <130 (n=6) b 0.00 Q (df = 5) = 0.38, P = 0.99 22,077 269 (2.4) 316 (2.9) 0.85 (0.73, 1.00) All studies (n=11) 0.00 Q (df = 10) = 2.66, P = 0.99 31,926 415 (2.6) 419 (2.7) 0.86 (0.76, 0.99)
Sensitivity analyses 100% Diabetic populations (n=3) c 0.00 Q (df = 2) = 1.82, P = 0.40 6351 252 (7.5) 230 (7.7) 0.86 (0.73, 1.02) 100% CKD populations (n=1) -- -- -- -- -- -- Study populations with mean age ≥60y (n=7) d
0.00 Q(df=6) = 0.72, P= 0.99 26,445 283 (2.1) 327 (2.5) 0.87 (0.74, 1.01)
Note: This table lists studies which fit inclusion criteria and identified fatal or nonfatal myocardial infarction as an outcome. Separate random effects meta-analyses for this outcome were conducted using the studies referenced above and based on blood pressure (BP) targets. Sensitivity analyses were conducted to further understand the effect of a lower target BP versus any higher target BP on populations of interest which included 1) only patients with diabetes, 2) only patients with CKD, or 3) a study population with mean age ≥60 years at baseline. Studies included in these analyses are listed in the footnotes. Additional information on study characteristics may be found in Table 2.5. a. Includes fatal or non-fatal myocardial infarction or sudden death. b. Includes ACCORD, SPRINT, Cardio-Sys, SPS 3, HOMED-BP, and REIN-2. c. Includes ACCORD, UKPDS, ABCD. d. Includes ACCORD, SPRINT, Cardio-Sis, SPS3, VALISH, JATOS, and Wei et al.

© 2017 by the American College of Cardiology Foundation and the American Heart Association, Inc. 38
Table 2.13. Relative risk of fatal or non-fatal stroke in in the intensive [lower] versus the standard [higher] blood pressure group. Comparison Groups Intensive (lower) vs
standard (higher) BP target
Events, N (%) Study Author, Journal (Year) N Intensive
BP target Standard BP target
RR (95% CI)
SBP Target (mm Hg) <120 vs <140 ACCORD (28) Cushman WC, N Engl J Med (2010) 4,733 36 (1.5) 62 (2.6) 0.58 (0.39, 0.88) <120 vs <140 SPRINT (30) Wright JT, NEJM (2015) 9,361 62 (1.3) 70 (1.5) 0.89 (0.63, 1.24) <130 vs <140 Cardio-Sis (31) Verdecchia P, Lancet (2009) a 1,111 4 (0.7) 9 (1.6) 0.44 (0.14, 1.42) <130 vs <140 SPS3 (32) Benavente, Lancet (2013) 3,020 125 (8.3) 152 (10.0) 0.83 (0.66, 1.04) <140 vs ≥140 to <150 VALISH (33) Ogihara T, Hypertension (2010) 3,260 16 (1.0) 23 (1.5) 0.69 (0.37, 1.30) <140 vs ≥ 140 to <160 JATOS (35) JATOS, Hypertens Res (2008) 4,418 36 (1.6) 30 (1.4) 1.20 (0.74, 1.94)
SBP/DBP Target (mm Hg) <125/<80 vs 125-134/80-84 HOMED-BP (37) Asayama K, Hypertens Res (2012) b 3,518 20 (1.1) 16 (0.9) 1.25 (0.65, 2.40) <130/80 vs <90 REIN-2 (38) Ruggenenti P, Lancet (2005) c 338 1 (0.6) 1 (0.6) 1.01 (0.06, 15.95) ≤140/90 vs ≤150/90 NR (39) Wei Y, J Clin Hypertens (2013) 724 21 (5.8) 36 (10.0) 0.58 (0.35, 0.97) <150/85 vs <180/105 UKPDS (40) UKPDS Group, BMJ (1998) 1,148 38 (5.0) 34 (8.7) 0.42 (0.18, 1.01)
DBP Target (mm Hg) 75 vs 80-89 ABCD (42) Schrier RW, Kidney Intl (2002) 480 4 (1.7) 13 (5.4) 0.32 (0.10, 0.95)
MAP Target (mm Hg) ≤ 92 vs 102-107 AASK (46) Norris K, Am J Kidney Dis (2006) 1,094 26 (4.8) 29 (5.3) 0.92 (0.55, 1.54)
Meta-analyses I2 (%) Q Test for Heterogeneity RR (95% CI) Any SBP target (n=6) 24.76 Q (df = 5) = 6.65, P = 0.25 25,721 279 (2.2) 346 (2.7) 0.81 (0.66, 0.98) Intensive SBP target <130 (n=7) d 0.00 Q (df = 6) = 5.79, P = 0.45 23,169 274 (2.4) 339 (2.9) 0.82 (0.70, 0.96) All studies (n=12) 26.43 Q (df = 11) = 14.95, P = 0.18 33,018 389 (2.3) 475 (2.9) 0.77 (0.65, 0.91)
Sensitivity analyses 100% Diabetic populations (n=3) e 0.00 Q (df = 2) = 1.08, P = 0.58 6361 78 (2.3) 109 (3.6) 0.56 (0.42, 0.74) 100% CKD populations (n=2) -- -- -- -- -- -- Study populations with mean age ≥60y (n=7) f 26.35 Q(df=6) = 8.15, P=0.23 26,445 300 (2.3) 382 (2.9) 0.78 (0.64, 0.94)
Note: This table lists studies which fit inclusion criteria and identified fatal or nonfatal stroke as an outcome. Separate random effects meta-analyses for this outcome were conducted using the studies referenced above and based on blood pressure (BP) targets. Sensitivity analyses were conducted to further understand the effect of a lower target BP versus any higher target BP on populations of interest which included 1) only patients with diabetes, 2) only patients with CKD, or 3) a study population with mean age ≥≥60 years at baseline. Studies included in these analyses are listed in the footnotes. Additional information on study characteristics may be found in Table 2.5. a. Composite outcome included fatal or non-fatal stroke or transient ischemic attack. b. Non-fatal stroke only. c. Fatal stroke only. d. Includes ACCORD, SPRINT, Cardio-Sys, HOMED-BP, REIN-2, AASK, and SPS3. e. Includes ACCORD, UKPDS, and ABCD. f. Includes ACCORD, SPRINT, Cardio-Sis, SPS3, VALISH, JATOS, and Wei et al.

© 2017 by the American College of Cardiology Foundation and the American Heart Association, Inc. 39
Table 2.14. Relative risk of fatal or non-fatal heart failure in the intensive [lower] versus the standard [higher] blood pressure group. Comparison Groups Intensive (lower) vs
standard (higher) BP target
Events, N (%)
Study Author, Journal (Year) N Intensive BP target
Standard BP target
RR (95% CI)
SBP Target (mm Hg) <120 vs <140 ACCORD (28) Cushman WC, N Engl J Med (2010) 4,733 83 (3.5) 90 (3.8) 0.93 (0.69, 1.24) <120 vs <140 SPRINT (30) Wright JT, NEJM (2015) 9,361 62 (1.3) 100 (2.1) 0.62 (0.45, 0.85) <130 vs <140 Cardio-Sis (31) Verdecchia P, Lancet (2009) 1,111 3 (0.5) 7 (1.3) 0.43 (0.11, 1.64) <140 vs ≥ 140 to <160 JATOS (35) JATOS, Hypertens Res (2008) 4,418 8 (0.4) 7 (0.3) 1.14 (0.41, 3.14)
SBP/DBP Target (mm Hg) ≤140/90 vs ≤150/90 NR (39) Wei Y, J Clin Hypertens (2013) 724 6 (1.7) 16 (4.4) 0.37 (0.15, 0.94) <150/85 vs <180/105 UKPDS (40) UKPDS Group, BMJ (1998) 1,148 21 (2.8) 24 (2.6) 0.45 (0.25, 0.80)
DBP Target (mm Hg) 10 mm Hg below baseline vs 80-89 ABCD (42) Schrier RW, Kidney Intl (2002) 480 12 (5.1) 11 (4.5) 1.12 (0.50, 2.49)
MAP Target (mm Hg) ≤ 92 vs 102-107 AASK (46) Norris K, Am J Kidney Dis (2006) 1,094 27 (5.0) 23 (4.2) 1.20 (0.70, 2.07)
Meta-analyses I2 (%) Q Test for Heterogeneity RR (95% CI) Any SBP target (n=4) 35.48 Q(df = 3) = 4.65, P = 0.20 19,622 156 (1.6) 204 (2.1) 0.77 (0.56, 1.04) Intensive SBP target <130 (n=4)a 53.42 Q(df = 3) = 6.44, P = 0.09 16,296 175 (2.2) 220 (2.7) 0.81 (0.58, 1.14) All studies (n=8) 49.12 Q(df = 7) = 13.76, P = 0.06 23,066 222 (1.9) 278 (2.4) 0.75 (0.56, 0.99)
Sensitivity analyses 100% Diabetic populations (n=3)b 63.30 Q(df = 2) = 5.45, P = 0.07 6361 116 (3.3) 125 (4.2) 0.77 (0.46, 1.28) 100% CKD populations (n=2) -- -- -- -- -- -- Study populations with mean age ≥60y (n=5)c
41.98 Q(df= 4) = 6.8937, P=0.14 20,346 162 (1.6) 220 (2.2) 0.71 (0.51, 0.99)
Note: This table lists studies which fit inclusion criteria and identified fatal or nonfatal heart failure as an outcome. Separate random effects meta-analyses for this outcome were conducted using the studies referenced above and based on blood pressure (BP) targets. Sensitivity analyses were conducted to further understand the effect of a lower target BP versus any higher target BP on populations of interest which included 1) only patients with diabetes, 2) only patients with CKD, or 3) a study population with mean age ≥60 years at baseline. Studies included in these analyses are listed in the footnotes. Additional information on study characteristics may be found in Table 2.5. a. Includes ACCORD, SPRINT, Cardio-Sys, and AASK. b. Includes ACCORD, UKPDS, and ABCD. c. Includes ACCORD, SPRINT, Cardio-Sis, JATOS, and Wei et al.
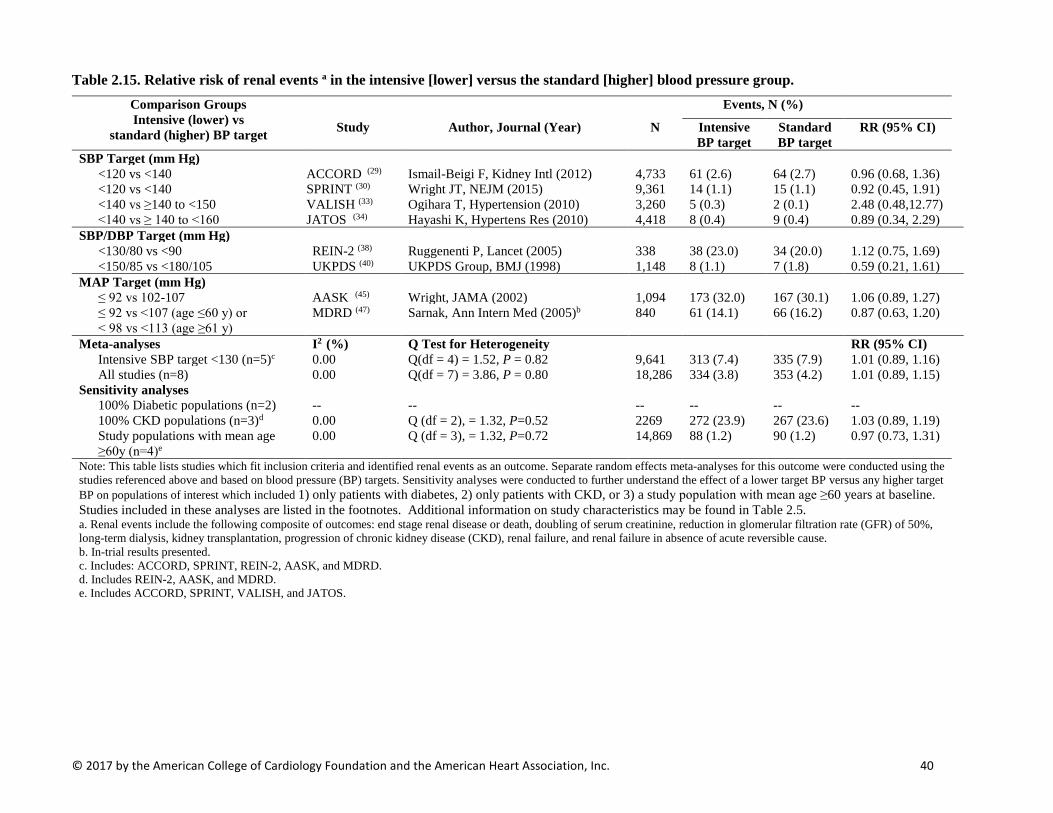
© 2017 by the American College of Cardiology Foundation and the American Heart Association, Inc. 40
Table 2.15. Relative risk of renal events a in the intensive [lower] versus the standard [higher] blood pressure group. Comparison Groups Intensive (lower) vs
standard (higher) BP target
Events, N (%)
Study Author, Journal (Year) N Intensive BP target
Standard BP target
RR (95% CI)
SBP Target (mm Hg) <120 vs <140 ACCORD (29) Ismail-Beigi F, Kidney Intl (2012) 4,733 61 (2.6) 64 (2.7) 0.96 (0.68, 1.36) <120 vs <140 SPRINT (30) Wright JT, NEJM (2015) 9,361 14 (1.1) 15 (1.1) 0.92 (0.45, 1.91) <140 vs ≥140 to <150 VALISH (33) Ogihara T, Hypertension (2010) 3,260 5 (0.3) 2 (0.1) 2.48 (0.48,12.77) <140 vs ≥ 140 to <160 JATOS (34) Hayashi K, Hypertens Res (2010) 4,418 8 (0.4) 9 (0.4) 0.89 (0.34, 2.29)
SBP/DBP Target (mm Hg) <130/80 vs <90 REIN-2 (38) Ruggenenti P, Lancet (2005) 338 38 (23.0) 34 (20.0) 1.12 (0.75, 1.69) <150/85 vs <180/105 UKPDS (40) UKPDS Group, BMJ (1998) 1,148 8 (1.1) 7 (1.8) 0.59 (0.21, 1.61)
MAP Target (mm Hg) ≤ 92 vs 102-107 AASK (45) Wright, JAMA (2002) 1,094 173 (32.0) 167 (30.1) 1.06 (0.89, 1.27) ≤ 92 vs <107 (age ≤60 y) or < 98 vs <113 (age ≥61 y)
MDRD (47) Sarnak, Ann Intern Med (2005)b 840 61 (14.1) 66 (16.2) 0.87 (0.63, 1.20)
Meta-analyses I2 (%) Q Test for Heterogeneity RR (95% CI) Intensive SBP target <130 (n=5)c 0.00 Q(df = 4) = 1.52, P = 0.82 9,641 313 (7.4) 335 (7.9) 1.01 (0.89, 1.16) All studies (n=8) 0.00 Q(df = 7) = 3.86, P = 0.80 18,286 334 (3.8) 353 (4.2) 1.01 (0.89, 1.15)
Sensitivity analyses 100% Diabetic populations (n=2) -- -- -- -- -- -- 100% CKD populations (n=3)d 0.00 Q (df = 2), = 1.32, P=0.52 2269 272 (23.9) 267 (23.6) 1.03 (0.89, 1.19) Study populations with mean age ≥60y (n=4)e
0.00 Q (df = 3), = 1.32, P=0.72 14,869 88 (1.2) 90 (1.2) 0.97 (0.73, 1.31)
Note: This table lists studies which fit inclusion criteria and identified renal events as an outcome. Separate random effects meta-analyses for this outcome were conducted using the studies referenced above and based on blood pressure (BP) targets. Sensitivity analyses were conducted to further understand the effect of a lower target BP versus any higher target BP on populations of interest which included 1) only patients with diabetes, 2) only patients with CKD, or 3) a study population with mean age ≥60 years at baseline. Studies included in these analyses are listed in the footnotes. Additional information on study characteristics may be found in Table 2.5. a. Renal events include the following composite of outcomes: end stage renal disease or death, doubling of serum creatinine, reduction in glomerular filtration rate (GFR) of 50%, long-term dialysis, kidney transplantation, progression of chronic kidney disease (CKD), renal failure, and renal failure in absence of acute reversible cause. b. In-trial results presented. c. Includes: ACCORD, SPRINT, REIN-2, AASK, and MDRD. d. Includes REIN-2, AASK, and MDRD. e. Includes ACCORD, SPRINT, VALISH, and JATOS.
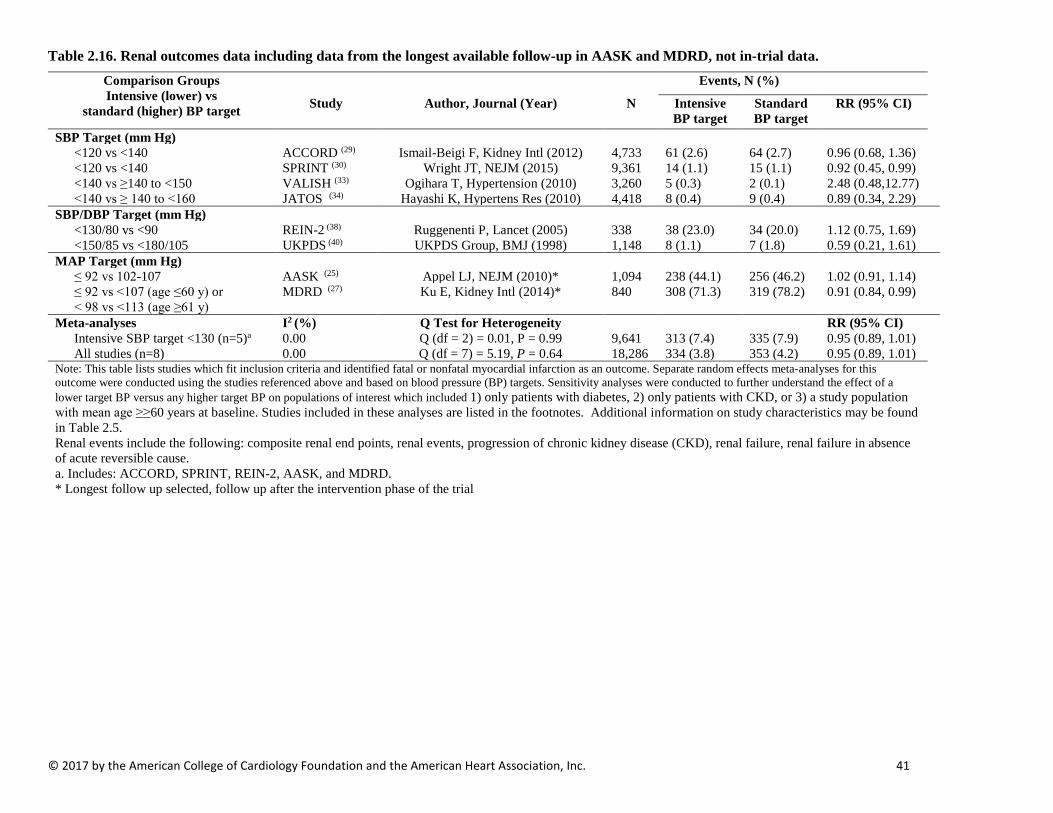
© 2017 by the American College of Cardiology Foundation and the American Heart Association, Inc. 41
Table 2.16. Renal outcomes data including data from the longest available follow-up in AASK and MDRD, not in-trial data. Comparison Groups Intensive (lower) vs
standard (higher) BP target
Events, N (%)
Study Author, Journal (Year) N Intensive BP target
Standard BP target
RR (95% CI)
SBP Target (mm Hg) <120 vs <140 ACCORD (29) Ismail-Beigi F, Kidney Intl (2012) 4,733 61 (2.6) 64 (2.7) 0.96 (0.68, 1.36) <120 vs <140 SPRINT (30) Wright JT, NEJM (2015) 9,361 14 (1.1) 15 (1.1) 0.92 (0.45, 0.99) <140 vs ≥140 to <150 VALISH (33) Ogihara T, Hypertension (2010) 3,260 5 (0.3) 2 (0.1) 2.48 (0.48,12.77) <140 vs ≥ 140 to <160 JATOS (34) Hayashi K, Hypertens Res (2010) 4,418 8 (0.4) 9 (0.4) 0.89 (0.34, 2.29)
SBP/DBP Target (mm Hg) <130/80 vs <90 REIN-2 (38) Ruggenenti P, Lancet (2005) 338 38 (23.0) 34 (20.0) 1.12 (0.75, 1.69) <150/85 vs <180/105 UKPDS (40) UKPDS Group, BMJ (1998) 1,148 8 (1.1) 7 (1.8) 0.59 (0.21, 1.61)
MAP Target (mm Hg) ≤ 92 vs 102-107 AASK (25) Appel LJ, NEJM (2010)* 1,094 238 (44.1) 256 (46.2) 1.02 (0.91, 1.14) ≤ 92 vs <107 (age ≤60 y) or < 98 vs <113 (age ≥61 y)
MDRD (27) Ku E, Kidney Intl (2014)* 840 308 (71.3) 319 (78.2) 0.91 (0.84, 0.99)
Meta-analyses I2 (%) Q Test for Heterogeneity RR (95% CI) Intensive SBP target <130 (n=5)a 0.00 Q (df = 2) = 0.01, P = 0.99 9,641 313 (7.4) 335 (7.9) 0.95 (0.89, 1.01) All studies (n=8) 0.00 Q (df = 7) = 5.19, P = 0.64 18,286 334 (3.8) 353 (4.2) 0.95 (0.89, 1.01)
Note: This table lists studies which fit inclusion criteria and identified fatal or nonfatal myocardial infarction as an outcome. Separate random effects meta-analyses for this outcome were conducted using the studies referenced above and based on blood pressure (BP) targets. Sensitivity analyses were conducted to further understand the effect of a lower target BP versus any higher target BP on populations of interest which included 1) only patients with diabetes, 2) only patients with CKD, or 3) a study population with mean age ≥≥60 years at baseline. Studies included in these analyses are listed in the footnotes. Additional information on study characteristics may be found in Table 2.5. Renal events include the following: composite renal end points, renal events, progression of chronic kidney disease (CKD), renal failure, renal failure in absence of acute reversible cause. a. Includes: ACCORD, SPRINT, REIN-2, AASK, and MDRD. * Longest follow up selected, follow up after the intervention phase of the trial

© 2017 by the American College of Cardiology Foundation and the American Heart Association, Inc. 42
Table 2.17. Sensitivity Analyses Examining the Relative Risk (95% Confidence Interval) for a Given Outcome for Intensive [Lower] Blood Pressure Target Versus any Standard [Higher] Blood Pressure Target Outcomes Among Studies in Patients with Diabetes Mellitus, Chronic Kidney Disease, or Mean Population Age ≥60 Years.
Outcome Subpopulation of interest
Studies included,
N
Study participants included, N
Events, N (%)
RR (95% CI)
Heterogeneity Funnel Plot Asymmetry
Intensive BP target
Standard BP target I2 (%) P-value
P-value for Kendall’s Τau
(rank correlation)
P-value for Egger’s
Regression Test
All-cause mortality 100% diabetes 3 6351 297 (8.8) 252 (3.7) 0.85 (0.64, 1.14) 60.87 0.08 0.33 0.34
100% CKD 3 2269 51 (4.5) 53 (4.7) 0.96 (0.66, 1.40) 0.00 0.46 1.00 0.82 Mean age ≥60y 8 38,971 751 (3.9) 807 (4.1) 0.92 (0.76, 1.11) 67.11 0.003 0.55 0.80 CVD mortality 100% diabetes 2 -- -- -- -- -- -- -- -- -- 100% CKD 2 -- -- -- -- -- -- -- -- -- Mean age ≥60y 6 34,841 235 (1.4) 278 (1.6) 0.82 (0.59, 1.13) 63.34 0.02 0.47 0.89 Major Cardiovascular Disease Events
100% diabetes 1 -- -- -- -- -- -- -- -- --
100% CKD 2 -- -- -- -- -- -- -- -- -- Mean age ≥60y 5 19,007 585 (6.2) 725 (7.6) 0.77 (0.64, 0.93) 54.59 0.07 0.48 0.29
Fatal or non-fatal myocardial infarction
100% diabetes 3 6351 252 (7.5) 230 (7.7) 0.86 (0.73, 1.02) 0.00 0.40 1.00 0.35 100% CKD 1 -- -- -- -- -- -- -- -- -- Mean age ≥60y 7 26,445 283 (2.1) 327 (2.5) 0.87 (0.74, 1.01) 0.00 0.99 0.38 0.32 Fatal or non-fatal stroke 100% diabetes 3 6351 78 (2.3) 109 (3.6) 0.56 (0.42, 0.74) 0.00 0.58 0.33 0.04 100% CKD 2 -- -- -- -- -- -- -- -- -- Mean age ≥60y 7 26,445 300 (2.3) 382 (2.9) 0.78 (0.64, 0.94) 26.35 0.23 0.77 0.37 Fatal or non-fatal heart failure
100% diabetes 3 6351 116 (3.3) 125 (4.2) 0.77 (0.46, 1.28) 63.30 0.07 1.00 0.78 100% CKD 1 -- -- -- -- -- -- -- -- -- Mean age ≥60y 5 20,346 162 (1.6) 220 (2.2) 0.71 (0.51, 0.99) 41.98 0.14 0.84 0.55 Renal Events 100% diabetes 2 -- -- -- -- -- -- -- -- --

© 2017 by the American College of Cardiology Foundation and the American Heart Association, Inc. 43
100% CKD 3 2269 272 (23.9) 267 (23.6) 1.03 (0.89, 1.19) 0.00 0.52 1.00 0.81 Mean age ≥60y 4 14,869 88 (1.2) 90 (1.2) 0.97 (0.73, 1.31) 0.00 0.72 0.75 0.41 Note: Sensitivity analyses were conducted to further understand the effect of a lower target BP versus any higher target BP on populations of interest which included 1) only patients with diabetes, 2) only patients with CKD, or 3) a study population with mean age ≥60 years at baseline. Sensitivity analyses were conducted if three or more studies included the outcome and population of interest. Studies included in these analyses are listed in the footnotes. Additional information on study characteristics may be found in Table 2.5.
a. ACCORD (28), UKPDS (40), and ABCD (41). b. REIN-2 (38), AASK (54), and MDRD (47) c. ACCORD (28), SPRINT (30), Cardio-Sis (31), SPS3 (32), VALISH (33), JATOS (35), Wei et al (39), and HOT (44). d. ACCORD (28), SPRINT (30), VALISH (33), JATOS (35), and Wei et al (39). e. ACCORD (28), SPRINT (30), Cardio-Sis (31), VALISH (33), and Wei et al (39). f. ACCORD (28), SPRINT (30), Cardio-Sis (31), SPS3 (32), VALISH (33), JATOS (35), and Wei et al (39). g. ACCORD (28), SPRINT (30), JATOS (35), and Wei et al (39). h. ACCORD (34), SPRINT (30), VALISH (33), and JATOS (34).
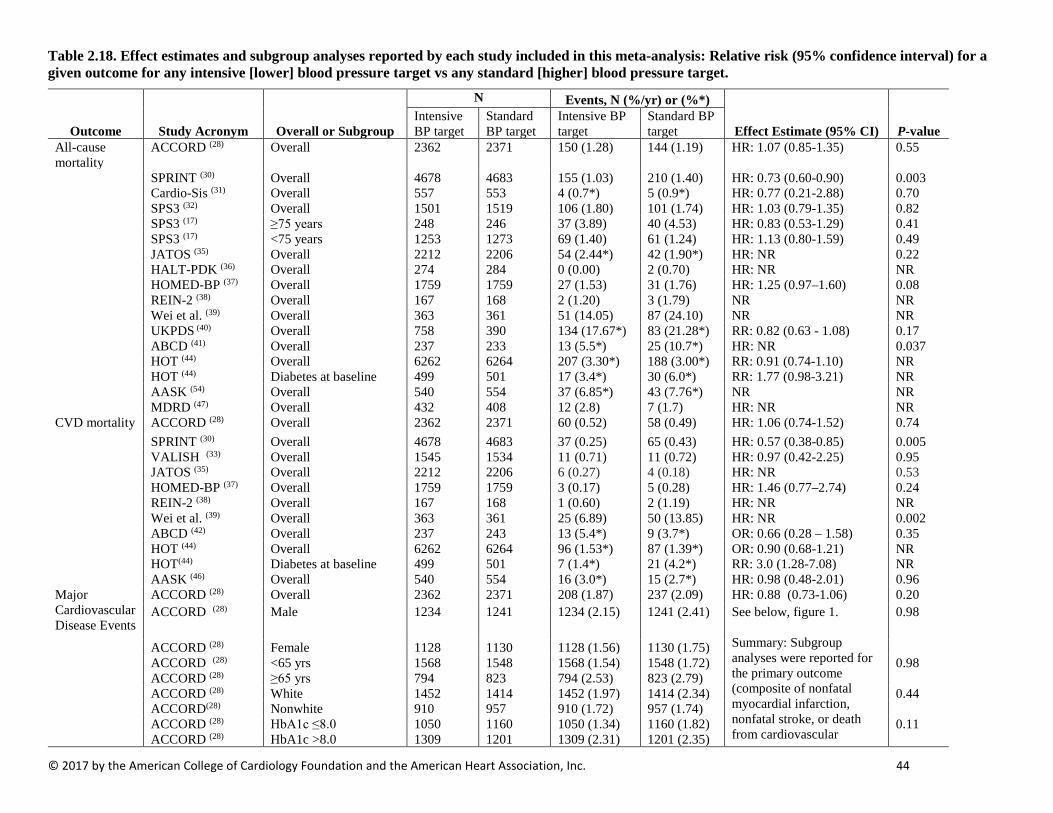
© 2017 by the American College of Cardiology Foundation and the American Heart Association, Inc. 44
Table 2.18. Effect estimates and subgroup analyses reported by each study included in this meta-analysis: Relative risk (95% confidence interval) for a given outcome for any intensive [lower] blood pressure target vs any standard [higher] blood pressure target.
Outcome Study Acronym Overall or Subgroup
N Events, N (%/yr) or (%*)
Effect Estimate (95% CI) P-value Intensive BP target
Standard BP target
Intensive BP target
Standard BP target
All-cause mortality
ACCORD (28) Overall 2362 2371 150 (1.28) 144 (1.19) HR: 1.07 (0.85-1.35) 0.55
SPRINT (30) Overall 4678 4683 155 (1.03) 210 (1.40) HR: 0.73 (0.60-0.90) 0.003 Cardio-Sis (31) Overall 557 553 4 (0.7*) 5 (0.9*) HR: 0.77 (0.21-2.88) 0.70 SPS3 (32) Overall 1501 1519 106 (1.80) 101 (1.74) HR: 1.03 (0.79-1.35) 0.82 SPS3 (17) ≥75 years 248 246 37 (3.89) 40 (4.53) HR: 0.83 (0.53-1.29) 0.41 SPS3 (17) <75 years 1253 1273 69 (1.40) 61 (1.24) HR: 1.13 (0.80-1.59) 0.49 JATOS (35) Overall 2212 2206 54 (2.44*) 42 (1.90*) HR: NR 0.22 HALT-PDK (36) Overall 274 284 0 (0.00) 2 (0.70) HR: NR NR HOMED-BP (37) Overall 1759 1759 27 (1.53) 31 (1.76) HR: 1.25 (0.97–1.60) 0.08 REIN-2 (38) Overall 167 168 2 (1.20) 3 (1.79) NR NR Wei et al. (39) Overall 363 361 51 (14.05) 87 (24.10) NR NR UKPDS (40) Overall 758 390 134 (17.67*) 83 (21.28*) RR: 0.82 (0.63 - 1.08) 0.17 ABCD (41) Overall 237 233 13 (5.5*) 25 (10.7*) HR: NR 0.037 HOT (44) Overall 6262 6264 207 (3.30*) 188 (3.00*) RR: 0.91 (0.74-1.10) NR HOT (44) Diabetes at baseline 499 501 17 (3.4*) 30 (6.0*) RR: 1.77 (0.98-3.21) NR AASK (54) Overall 540 554 37 (6.85*) 43 (7.76*) NR NR MDRD (47) Overall 432 408 12 (2.8) 7 (1.7) HR: NR NR CVD mortality ACCORD (28) Overall 2362 2371 60 (0.52) 58 (0.49) HR: 1.06 (0.74-1.52) 0.74 SPRINT (30) Overall 4678 4683 37 (0.25) 65 (0.43) HR: 0.57 (0.38-0.85) 0.005 VALISH (33) Overall 1545 1534 11 (0.71) 11 (0.72) HR: 0.97 (0.42-2.25) 0.95 JATOS (35) Overall 2212 2206 6 (0.27) 4 (0.18) HR: NR 0.53 HOMED-BP (37) Overall 1759 1759 3 (0.17) 5 (0.28) HR: 1.46 (0.77–2.74) 0.24 REIN-2 (38) Overall 167 168 1 (0.60) 2 (1.19) HR: NR NR Wei et al. (39) Overall 363 361 25 (6.89) 50 (13.85) HR: NR 0.002 ABCD (42) Overall 237 243 13 (5.4*) 9 (3.7*) OR: 0.66 (0.28 – 1.58) 0.35 HOT (44) Overall 6262 6264 96 (1.53*) 87 (1.39*) OR: 0.90 (0.68-1.21) NR HOT(44) Diabetes at baseline 499 501 7 (1.4*) 21 (4.2*) RR: 3.0 (1.28-7.08) NR AASK (46) Overall 540 554 16 (3.0*) 15 (2.7*) HR: 0.98 (0.48-2.01) 0.96 Major Cardiovascular Disease Events
ACCORD (28) Overall 2362 2371 208 (1.87) 237 (2.09) HR: 0.88 (0.73-1.06) 0.20 ACCORD (28) Male 1234
1241
1234 (2.15)
1241 (2.41)
See below, figure 1. Summary: Subgroup analyses were reported for the primary outcome (composite of nonfatal myocardial infarction, nonfatal stroke, or death from cardiovascular
0.98
ACCORD (28) Female 1128 1130 1128 (1.56) 1130 (1.75) ACCORD (28) <65 yrs 1568 1548 1568 (1.54) 1548 (1.72) 0.98 ACCORD (28) ≥65 yrs 794 823 794 (2.53) 823 (2.79) ACCORD (28) White 1452 1414 1452 (1.97) 1414 (2.34) 0.44 ACCORD(28) Nonwhite 910 957 910 (1.72) 957 (1.74) ACCORD (28) HbA1c ≤8.0 1050 1160 1050 (1.34) 1160 (1.82) 0.11 ACCORD (28) HbA1c >8.0 1309 1201 1309 (2.31) 1201 (2.35)
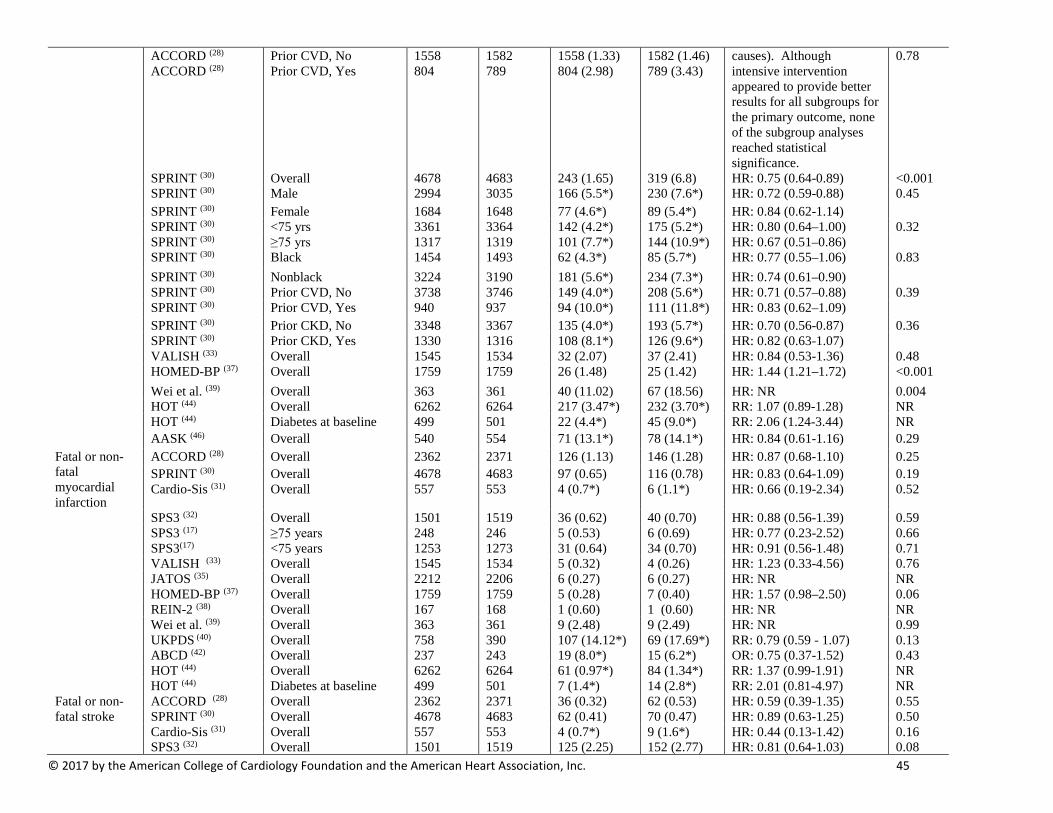
© 2017 by the American College of Cardiology Foundation and the American Heart Association, Inc. 45
ACCORD (28) Prior CVD, No 1558 1582 1558 (1.33) 1582 (1.46) causes). Although intensive intervention appeared to provide better results for all subgroups for the primary outcome, none of the subgroup analyses reached statistical significance.
0.78 ACCORD (28) Prior CVD, Yes 804 789 804 (2.98) 789 (3.43)
SPRINT (30) Overall 4678 4683 243 (1.65) 319 (6.8) HR: 0.75 (0.64-0.89) <0.001 SPRINT (30) Male 2994 3035 166 (5.5*) 230 (7.6*) HR: 0.72 (0.59-0.88) 0.45 SPRINT (30) Female 1684 1648 77 (4.6*) 89 (5.4*) HR: 0.84 (0.62-1.14) SPRINT (30) <75 yrs 3361 3364 142 (4.2*) 175 (5.2*) HR: 0.80 (0.64–1.00) 0.32 SPRINT (30) ≥75 yrs 1317 1319 101 (7.7*) 144 (10.9*) HR: 0.67 (0.51–0.86) SPRINT (30) Black 1454 1493 62 (4.3*) 85 (5.7*) HR: 0.77 (0.55–1.06) 0.83 SPRINT (30) Nonblack 3224 3190 181 (5.6*) 234 (7.3*) HR: 0.74 (0.61–0.90) SPRINT (30) Prior CVD, No 3738 3746 149 (4.0*) 208 (5.6*) HR: 0.71 (0.57–0.88) 0.39 SPRINT (30) Prior CVD, Yes 940 937 94 (10.0*) 111 (11.8*) HR: 0.83 (0.62–1.09) SPRINT (30) Prior CKD, No 3348 3367 135 (4.0*) 193 (5.7*) HR: 0.70 (0.56-0.87) 0.36 SPRINT (30) Prior CKD, Yes 1330 1316 108 (8.1*) 126 (9.6*) HR: 0.82 (0.63-1.07) VALISH (33) Overall 1545 1534 32 (2.07) 37 (2.41) HR: 0.84 (0.53-1.36) 0.48 HOMED-BP (37) Overall 1759 1759 26 (1.48) 25 (1.42) HR: 1.44 (1.21–1.72) <0.001 Wei et al. (39) Overall 363 361 40 (11.02) 67 (18.56) HR: NR 0.004 HOT (44) Overall 6262 6264 217 (3.47*) 232 (3.70*) RR: 1.07 (0.89-1.28) NR HOT (44) Diabetes at baseline 499 501 22 (4.4*) 45 (9.0*) RR: 2.06 (1.24-3.44) NR AASK (46) Overall 540 554 71 (13.1*) 78 (14.1*) HR: 0.84 (0.61-1.16) 0.29 Fatal or non-fatal myocardial infarction
ACCORD (28) Overall 2362 2371 126 (1.13) 146 (1.28) HR: 0.87 (0.68-1.10) 0.25 SPRINT (30) Overall 4678 4683 97 (0.65) 116 (0.78) HR: 0.83 (0.64-1.09) 0.19 Cardio-Sis (31) Overall 557 553 4 (0.7*) 6 (1.1*) HR: 0.66 (0.19-2.34) 0.52
SPS3 (32) Overall 1501 1519 36 (0.62) 40 (0.70) HR: 0.88 (0.56-1.39) 0.59 SPS3 (17) ≥75 years 248 246 5 (0.53) 6 (0.69) HR: 0.77 (0.23-2.52) 0.66 SPS3(17) <75 years 1253 1273 31 (0.64) 34 (0.70) HR: 0.91 (0.56-1.48) 0.71 VALISH (33) Overall 1545 1534 5 (0.32) 4 (0.26) HR: 1.23 (0.33-4.56) 0.76 JATOS (35) Overall 2212 2206 6 (0.27) 6 (0.27) HR: NR NR HOMED-BP (37) Overall 1759 1759 5 (0.28) 7 (0.40) HR: 1.57 (0.98–2.50) 0.06 REIN-2 (38) Overall 167 168 1 (0.60) 1 (0.60) HR: NR NR Wei et al. (39) Overall 363 361 9 (2.48) 9 (2.49) HR: NR 0.99 UKPDS (40) Overall 758 390 107 (14.12*) 69 (17.69*) RR: 0.79 (0.59 - 1.07) 0.13 ABCD (42) Overall 237 243 19 (8.0*) 15 (6.2*) OR: 0.75 (0.37-1.52) 0.43 HOT (44) Overall 6262 6264 61 (0.97*) 84 (1.34*) RR: 1.37 (0.99-1.91) NR HOT (44) Diabetes at baseline 499 501 7 (1.4*) 14 (2.8*) RR: 2.01 (0.81-4.97) NR Fatal or non-fatal stroke
ACCORD (28) Overall 2362 2371 36 (0.32) 62 (0.53) HR: 0.59 (0.39-1.35) 0.55 SPRINT (30) Overall 4678 4683 62 (0.41) 70 (0.47) HR: 0.89 (0.63-1.25) 0.50
Cardio-Sis (31) Overall 557 553 4 (0.7*) 9 (1.6*) HR: 0.44 (0.13-1.42) 0.16 SPS3 (32) Overall 1501 1519 125 (2.25) 152 (2.77) HR: 0.81 (0.64-1.03) 0.08
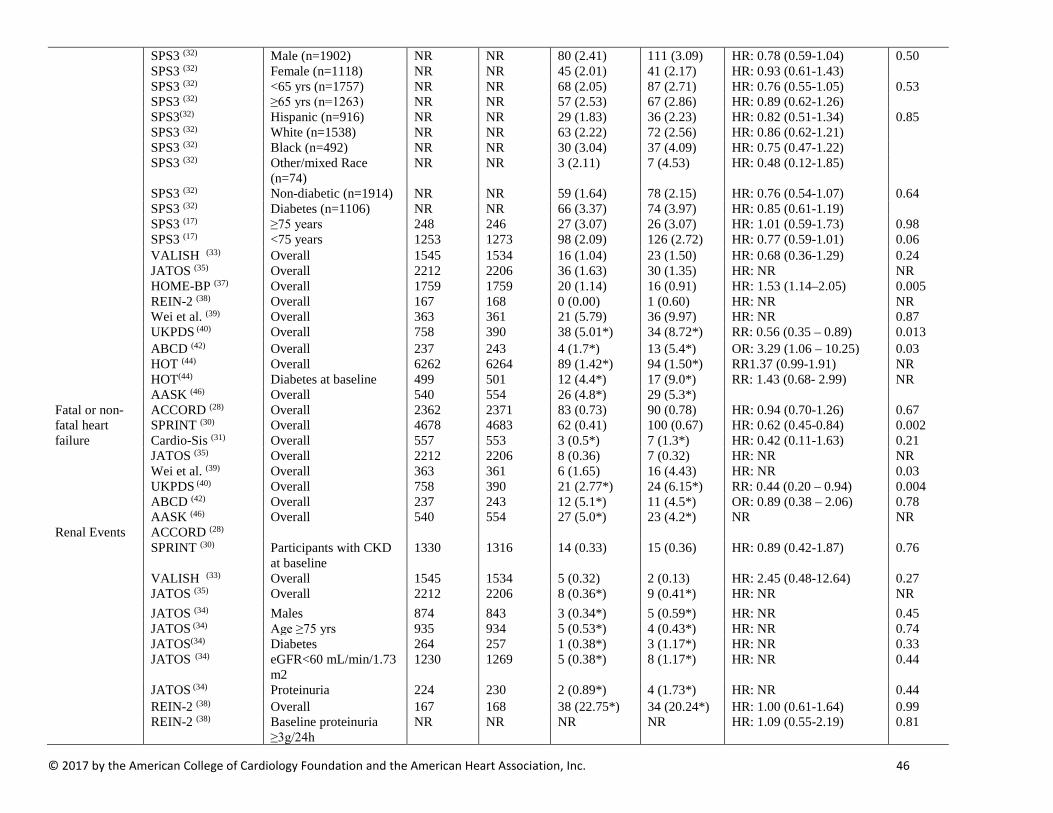
© 2017 by the American College of Cardiology Foundation and the American Heart Association, Inc. 46
SPS3 (32) Male (n=1902) NR NR 80 (2.41) 111 (3.09) HR: 0.78 (0.59-1.04) 0.50 SPS3 (32) Female (n=1118) NR NR 45 (2.01) 41 (2.17) HR: 0.93 (0.61-1.43) SPS3 (32) <65 yrs (n=1757) NR NR 68 (2.05) 87 (2.71) HR: 0.76 (0.55-1.05) 0.53 SPS3 (32) ≥65 yrs (n=1263) NR NR 57 (2.53) 67 (2.86) HR: 0.89 (0.62-1.26) SPS3(32) Hispanic (n=916) NR NR 29 (1.83) 36 (2.23) HR: 0.82 (0.51-1.34) 0.85 SPS3 (32) White (n=1538) NR NR 63 (2.22) 72 (2.56) HR: 0.86 (0.62-1.21) SPS3 (32) Black (n=492) NR NR 30 (3.04) 37 (4.09) HR: 0.75 (0.47-1.22) SPS3 (32) Other/mixed Race
(n=74) NR NR 3 (2.11) 7 (4.53) HR: 0.48 (0.12-1.85)
SPS3 (32) Non-diabetic (n=1914) NR NR 59 (1.64) 78 (2.15) HR: 0.76 (0.54-1.07) 0.64 SPS3 (32) Diabetes (n=1106) NR NR 66 (3.37) 74 (3.97) HR: 0.85 (0.61-1.19) SPS3 (17) ≥75 years 248 246 27 (3.07) 26 (3.07) HR: 1.01 (0.59-1.73) 0.98 SPS3 (17) <75 years 1253 1273 98 (2.09) 126 (2.72) HR: 0.77 (0.59-1.01) 0.06 VALISH (33) Overall 1545 1534 16 (1.04) 23 (1.50) HR: 0.68 (0.36-1.29) 0.24 JATOS (35) Overall 2212 2206 36 (1.63) 30 (1.35) HR: NR NR HOME-BP (37) Overall 1759 1759 20 (1.14) 16 (0.91) HR: 1.53 (1.14–2.05) 0.005 REIN-2 (38) Overall 167 168 0 (0.00) 1 (0.60) HR: NR NR Wei et al. (39) Overall 363 361 21 (5.79) 36 (9.97) HR: NR 0.87 UKPDS (40) Overall 758 390 38 (5.01*) 34 (8.72*) RR: 0.56 (0.35 – 0.89) 0.013 ABCD (42) Overall 237 243 4 (1.7*) 13 (5.4*) OR: 3.29 (1.06 – 10.25) 0.03 HOT (44) Overall 6262 6264 89 (1.42*) 94 (1.50*) RR1.37 (0.99-1.91) NR HOT(44) Diabetes at baseline 499 501 12 (4.4*) 17 (9.0*) RR: 1.43 (0.68- 2.99) NR AASK (46) Overall 540 554 26 (4.8*) 29 (5.3*) Fatal or non-fatal heart failure
ACCORD (28) Overall 2362 2371 83 (0.73) 90 (0.78) HR: 0.94 (0.70-1.26) 0.67 SPRINT (30) Overall 4678 4683 62 (0.41) 100 (0.67) HR: 0.62 (0.45-0.84) 0.002 Cardio-Sis (31) Overall 557 553 3 (0.5*) 7 (1.3*) HR: 0.42 (0.11-1.63) 0.21
JATOS (35) Overall 2212 2206 8 (0.36) 7 (0.32) HR: NR NR Wei et al. (39) Overall 363 361 6 (1.65) 16 (4.43) HR: NR 0.03 UKPDS (40) Overall 758 390 21 (2.77*) 24 (6.15*) RR: 0.44 (0.20 – 0.94) 0.004 ABCD (42) Overall 237 243 12 (5.1*) 11 (4.5*) OR: 0.89 (0.38 – 2.06) 0.78 AASK (46) Overall 540 554 27 (5.0*) 23 (4.2*) NR NR Renal Events ACCORD (28) SPRINT (30) Participants with CKD
at baseline 1330 1316 14 (0.33) 15 (0.36) HR: 0.89 (0.42-1.87) 0.76
VALISH (33) Overall 1545 1534 5 (0.32) 2 (0.13) HR: 2.45 (0.48-12.64) 0.27 JATOS (35) Overall 2212 2206 8 (0.36*) 9 (0.41*) HR: NR NR JATOS (34) Males 874 843 3 (0.34*) 5 (0.59*) HR: NR 0.45 JATOS (34) Age ≥75 yrs 935 934 5 (0.53*) 4 (0.43*) HR: NR 0.74 JATOS(34) Diabetes 264 257 1 (0.38*) 3 (1.17*) HR: NR 0.33 JATOS (34) eGFR<60 mL/min/1.73
m2 1230 1269 5 (0.38*) 8 (1.17*) HR: NR 0.44
JATOS (34) Proteinuria 224 230 2 (0.89*) 4 (1.73*) HR: NR 0.44 REIN-2 (38) Overall 167 168 38 (22.75*) 34 (20.24*) HR: 1.00 (0.61-1.64) 0.99 REIN-2 (38) Baseline proteinuria
≥3g/24h NR NR NR NR HR: 1.09 (0.55-2.19) 0.81

© 2017 by the American College of Cardiology Foundation and the American Heart Association, Inc. 47
REIN-2 (38) Baseline proteinuria of 1-3g/24hr
NR NR NR NR HR: 1.06 (0.51-2.20) 0.81
UKPDS (40) Overall 758 390 8 (1.06*) 7 (1.79*) RR: 0.58 (0.15 – 2.21) 0.29 AASK (46) Overall 540 554 173 (32.0*) 167 (30.1*) % Risk Reduction:
2 (-22 to 21) 0.85
MDRD (47) Overall 432 408 61 (14.1*) 66 (16.2*) HR: 0.78 (0.66–0.93) 0.0056 Note: Effect estimates and subgroup analyses reported by each study included in this meta-analysis are shown in the table above for each outcome for any intensive [lower] blood pressure target vs any standard [higher] blood pressure target
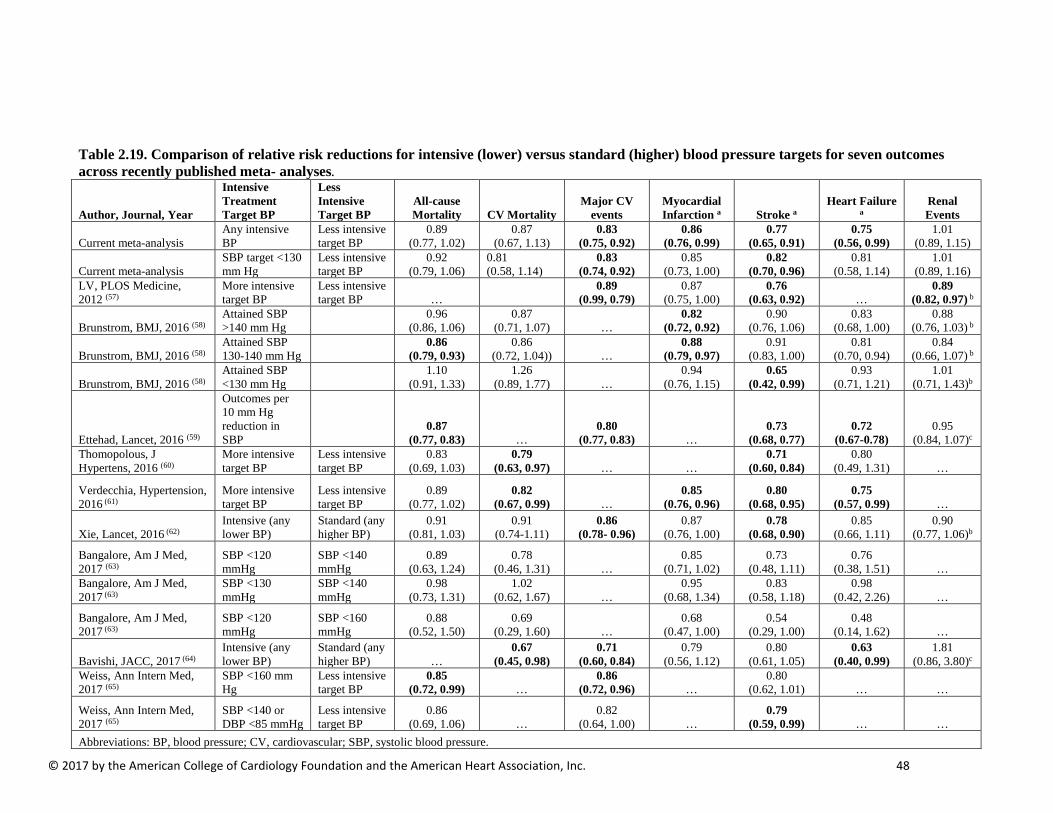
© 2017 by the American College of Cardiology Foundation and the American Heart Association, Inc. 48
Table 2.19. Comparison of relative risk reductions for intensive (lower) versus standard (higher) blood pressure targets for seven outcomes across recently published meta- analyses.
Author, Journal, Year
Intensive Treatment Target BP
Less Intensive Target BP
All-cause Mortality CV Mortality
Major CV events
Myocardial Infarction a Stroke a
Heart Failure a
Renal Events
Current meta-analysis Any intensive BP
Less intensive target BP
0.89 (0.77, 1.02)
0.87 (0.67, 1.13)
0.83 (0.75, 0.92)
0.86 (0.76, 0.99)
0.77 (0.65, 0.91)
0.75 (0.56, 0.99)
1.01 (0.89, 1.15)
Current meta-analysis SBP target <130 mm Hg
Less intensive target BP
0.92 (0.79, 1.06)
0.81 (0.58, 1.14)
0.83 (0.74, 0.92)
0.85 (0.73, 1.00)
0.82 (0.70, 0.96)
0.81 (0.58, 1.14)
1.01 (0.89, 1.16)
LV, PLOS Medicine, 2012 (57)
More intensive target BP
Less intensive target BP …
0.89 (0.99, 0.79)
0.87 (0.75, 1.00)
0.76 (0.63, 0.92) …
0.89 (0.82, 0.97) b
Brunstrom, BMJ, 2016 (58) Attained SBP >140 mm Hg
0.96 (0.86, 1.06)
0.87 (0.71, 1.07) …
0.82 (0.72, 0.92)
0.90 (0.76, 1.06)
0.83 (0.68, 1.00)
0.88 (0.76, 1.03) b
Brunstrom, BMJ, 2016 (58) Attained SBP 130-140 mm Hg
0.86 (0.79, 0.93)
0.86 (0.72, 1.04)) …
0.88 (0.79, 0.97)
0.91 (0.83, 1.00)
0.81 (0.70, 0.94)
0.84 (0.66, 1.07) b
Brunstrom, BMJ, 2016 (58) Attained SBP <130 mm Hg
1.10 (0.91, 1.33)
1.26 (0.89, 1.77) …
0.94 (0.76, 1.15)
0.65 (0.42, 0.99)
0.93 (0.71, 1.21)
1.01 (0.71, 1.43)b
Ettehad, Lancet, 2016 (59)
Outcomes per 10 mm Hg reduction in SBP
0.87 (0.77, 0.83) …
0.80 (0.77, 0.83) …
0.73 (0.68, 0.77)
0.72 (0.67-0.78)
0.95 (0.84, 1.07)c
Thomopolous, J Hypertens, 2016 (60)
More intensive target BP
Less intensive target BP
0.83 (0.69, 1.03)
0.79 (0.63, 0.97) … …
0.71 (0.60, 0.84)
0.80 (0.49, 1.31) …
Verdecchia, Hypertension, 2016 (61)
More intensive target BP
Less intensive target BP
0.89 (0.77, 1.02)
0.82 (0.67, 0.99) …
0.85 (0.76, 0.96)
0.80 (0.68, 0.95)
0.75 (0.57, 0.99) …
Xie, Lancet, 2016 (62) Intensive (any lower BP)
Standard (any higher BP)
0.91 (0.81, 1.03)
0.91 (0.74-1.11)
0.86 (0.78- 0.96)
0.87 (0.76, 1.00)
0.78 (0.68, 0.90)
0.85 (0.66, 1.11)
0.90 (0.77, 1.06)b
Bangalore, Am J Med, 2017 (63)
SBP <120 mmHg
SBP <140 mmHg
0.89 (0.63, 1.24)
0.78 (0.46, 1.31) …
0.85 (0.71, 1.02)
0.73 (0.48, 1.11)
0.76 (0.38, 1.51) …
Bangalore, Am J Med, 2017 (63)
SBP <130 mmHg
SBP <140 mmHg
0.98 (0.73, 1.31)
1.02 (0.62, 1.67) …
0.95 (0.68, 1.34)
0.83 (0.58, 1.18)
0.98 (0.42, 2.26) …
Bangalore, Am J Med, 2017 (63)
SBP <120 mmHg
SBP <160 mmHg
0.88 (0.52, 1.50)
0.69 (0.29, 1.60) …
0.68 (0.47, 1.00)
0.54 (0.29, 1.00)
0.48 (0.14, 1.62) …
Bavishi, JACC, 2017 (64) Intensive (any lower BP)
Standard (any higher BP) …
0.67 (0.45, 0.98)
0.71 (0.60, 0.84)
0.79 (0.56, 1.12)
0.80 (0.61, 1.05)
0.63 (0.40, 0.99)
1.81 (0.86, 3.80)c
Weiss, Ann Intern Med, 2017 (65)
SBP <160 mm Hg
Less intensive target BP
0.85 (0.72, 0.99) …
0.86 (0.72, 0.96) …
0.80 (0.62, 1.01) … …
Weiss, Ann Intern Med, 2017 (65)
SBP <140 or DBP <85 mmHg
Less intensive target BP
0.86 (0.69, 1.06) …
0.82 (0.64, 1.00) …
0.79 (0.59, 0.99) … …
Abbreviations: BP, blood pressure; CV, cardiovascular; SBP, systolic blood pressure.
© 2017 by the American College of Cardiology Foundation and the American Heart Association, Inc. 49
a. Fatal or nonfatal. b. End-stage renal disease c. Renal failure
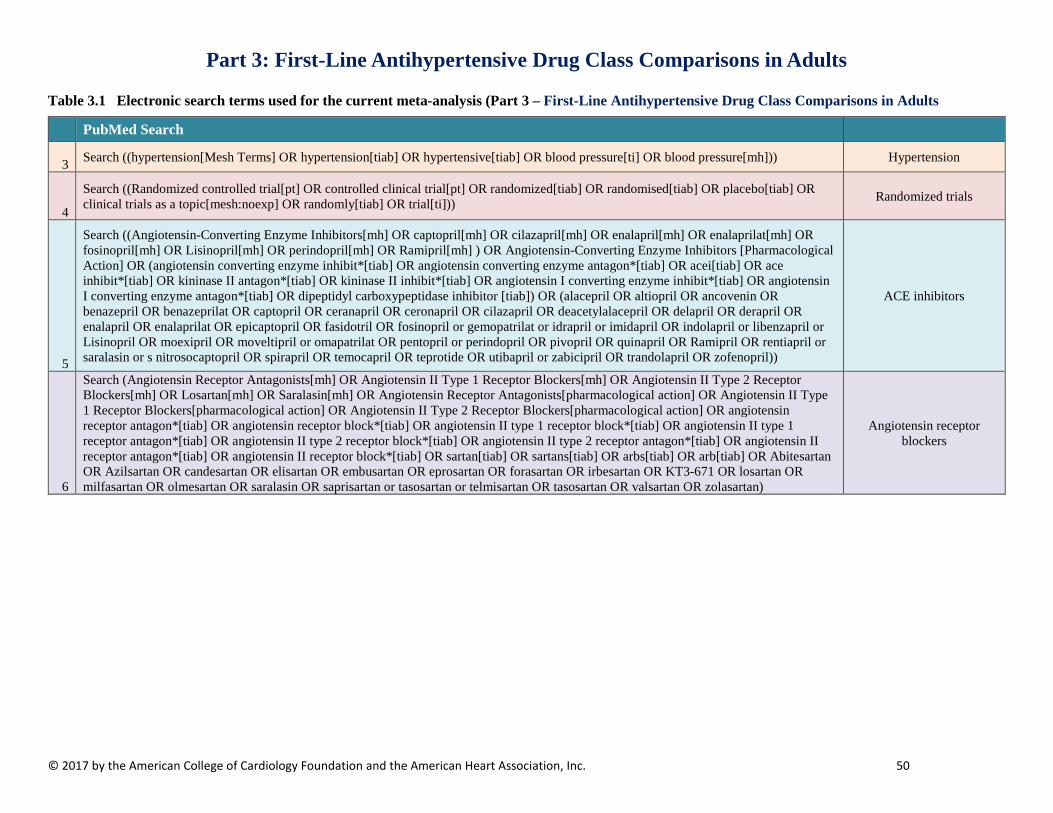
© 2017 by the American College of Cardiology Foundation and the American Heart Association, Inc. 50
Part 3: First-Line Antihypertensive Drug Class Comparisons in Adults
Table 3.1 Electronic search terms used for the current meta-analysis (Part 3 – First-Line Antihypertensive Drug Class Comparisons in Adults
PubMed Search
3 Search ((hypertension[Mesh Terms] OR hypertension[tiab] OR hypertensive[tiab] OR blood pressure[ti] OR blood pressure[mh])) Hypertension
4
Search ((Randomized controlled trial[pt] OR controlled clinical trial[pt] OR randomized[tiab] OR randomised[tiab] OR placebo[tiab] OR clinical trials as a topic[mesh:noexp] OR randomly[tiab] OR trial[ti])) Randomized trials
5
Search ((Angiotensin-Converting Enzyme Inhibitors[mh] OR captopril[mh] OR cilazapril[mh] OR enalapril[mh] OR enalaprilat[mh] OR fosinopril[mh] OR Lisinopril[mh] OR perindopril[mh] OR Ramipril[mh] ) OR Angiotensin-Converting Enzyme Inhibitors [Pharmacological Action] OR (angiotensin converting enzyme inhibit*[tiab] OR angiotensin converting enzyme antagon*[tiab] OR acei[tiab] OR ace inhibit*[tiab] OR kininase II antagon*[tiab] OR kininase II inhibit*[tiab] OR angiotensin I converting enzyme inhibit*[tiab] OR angiotensin I converting enzyme antagon*[tiab] OR dipeptidyl carboxypeptidase inhibitor [tiab]) OR (alacepril OR altiopril OR ancovenin OR benazepril OR benazeprilat OR captopril OR ceranapril OR ceronapril OR cilazapril OR deacetylalacepril OR delapril OR derapril OR enalapril OR enalaprilat OR epicaptopril OR fasidotril OR fosinopril or gemopatrilat or idrapril or imidapril OR indolapril or libenzapril or Lisinopril OR moexipril OR moveltipril or omapatrilat OR pentopril or perindopril OR pivopril OR quinapril OR Ramipril OR rentiapril or saralasin or s nitrosocaptopril OR spirapril OR temocapril OR teprotide OR utibapril or zabicipril OR trandolapril OR zofenopril))
ACE inhibitors
6
Search (Angiotensin Receptor Antagonists[mh] OR Angiotensin II Type 1 Receptor Blockers[mh] OR Angiotensin II Type 2 Receptor Blockers[mh] OR Losartan[mh] OR Saralasin[mh] OR Angiotensin Receptor Antagonists[pharmacological action] OR Angiotensin II Type 1 Receptor Blockers[pharmacological action] OR Angiotensin II Type 2 Receptor Blockers[pharmacological action] OR angiotensin receptor antagon*[tiab] OR angiotensin receptor block*[tiab] OR angiotensin II type 1 receptor block*[tiab] OR angiotensin II type 1 receptor antagon*[tiab] OR angiotensin II type 2 receptor block*[tiab] OR angiotensin II type 2 receptor antagon*[tiab] OR angiotensin II receptor antagon*[tiab] OR angiotensin II receptor block*[tiab] OR sartan[tiab] OR sartans[tiab] OR arbs[tiab] OR arb[tiab] OR Abitesartan OR Azilsartan OR candesartan OR elisartan OR embusartan OR eprosartan OR forasartan OR irbesartan OR KT3-671 OR losartan OR milfasartan OR olmesartan OR saralasin OR saprisartan or tasosartan or telmisartan OR tasosartan OR valsartan OR zolasartan)
Angiotensin receptor blockers
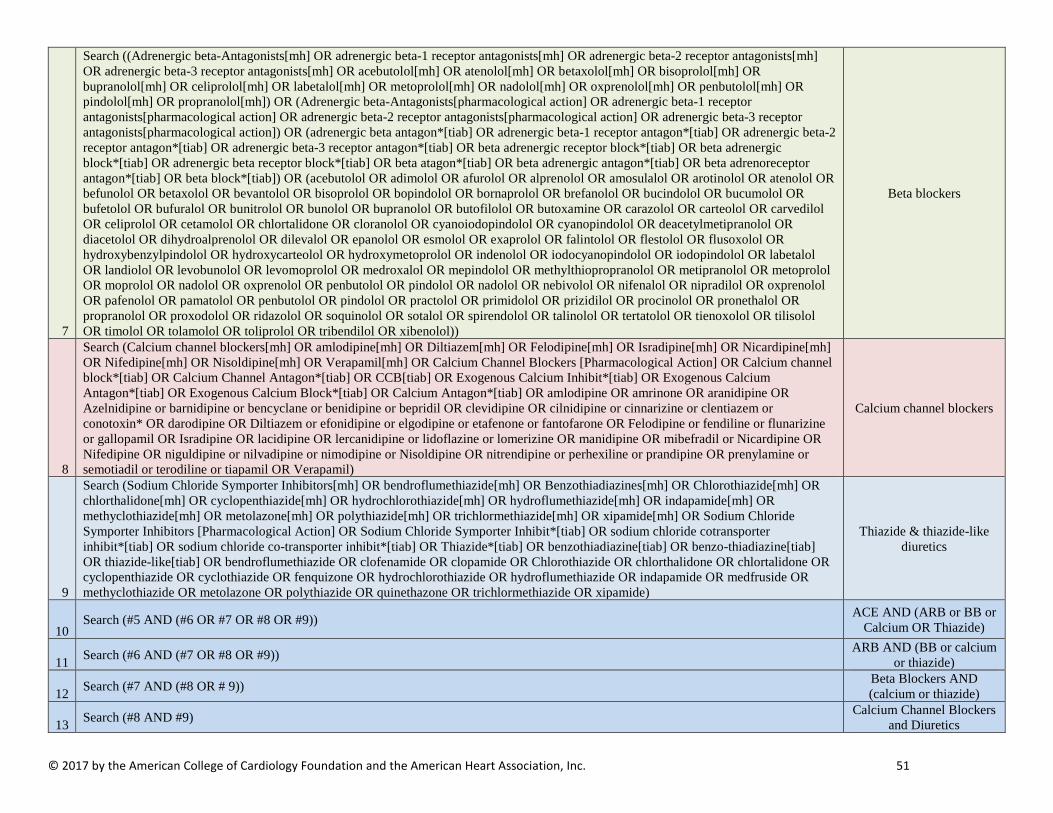
© 2017 by the American College of Cardiology Foundation and the American Heart Association, Inc. 51
7
Search ((Adrenergic beta-Antagonists[mh] OR adrenergic beta-1 receptor antagonists[mh] OR adrenergic beta-2 receptor antagonists[mh] OR adrenergic beta-3 receptor antagonists[mh] OR acebutolol[mh] OR atenolol[mh] OR betaxolol[mh] OR bisoprolol[mh] OR bupranolol[mh] OR celiprolol[mh] OR labetalol[mh] OR metoprolol[mh] OR nadolol[mh] OR oxprenolol[mh] OR penbutolol[mh] OR pindolol[mh] OR propranolol[mh]) OR (Adrenergic beta-Antagonists[pharmacological action] OR adrenergic beta-1 receptor antagonists[pharmacological action] OR adrenergic beta-2 receptor antagonists[pharmacological action] OR adrenergic beta-3 receptor antagonists[pharmacological action]) OR (adrenergic beta antagon*[tiab] OR adrenergic beta-1 receptor antagon*[tiab] OR adrenergic beta-2 receptor antagon*[tiab] OR adrenergic beta-3 receptor antagon*[tiab] OR beta adrenergic receptor block*[tiab] OR beta adrenergic block*[tiab] OR adrenergic beta receptor block*[tiab] OR beta atagon*[tiab] OR beta adrenergic antagon*[tiab] OR beta adrenoreceptor antagon*[tiab] OR beta block*[tiab]) OR (acebutolol OR adimolol OR afurolol OR alprenolol OR amosulalol OR arotinolol OR atenolol OR befunolol OR betaxolol OR bevantolol OR bisoprolol OR bopindolol OR bornaprolol OR brefanolol OR bucindolol OR bucumolol OR bufetolol OR bufuralol OR bunitrolol OR bunolol OR bupranolol OR butofilolol OR butoxamine OR carazolol OR carteolol OR carvedilol OR celiprolol OR cetamolol OR chlortalidone OR cloranolol OR cyanoiodopindolol OR cyanopindolol OR deacetylmetipranolol OR diacetolol OR dihydroalprenolol OR dilevalol OR epanolol OR esmolol OR exaprolol OR falintolol OR flestolol OR flusoxolol OR hydroxybenzylpindolol OR hydroxycarteolol OR hydroxymetoprolol OR indenolol OR iodocyanopindolol OR iodopindolol OR labetalol OR landiolol OR levobunolol OR levomoprolol OR medroxalol OR mepindolol OR methylthiopropranolol OR metipranolol OR metoprolol OR moprolol OR nadolol OR oxprenolol OR penbutolol OR pindolol OR nadolol OR nebivolol OR nifenalol OR nipradilol OR oxprenolol OR pafenolol OR pamatolol OR penbutolol OR pindolol OR practolol OR primidolol OR prizidilol OR procinolol OR pronethalol OR propranolol OR proxodolol OR ridazolol OR soquinolol OR sotalol OR spirendolol OR talinolol OR tertatolol OR tienoxolol OR tilisolol OR timolol OR tolamolol OR toliprolol OR tribendilol OR xibenolol))
Beta blockers
8
Search (Calcium channel blockers[mh] OR amlodipine[mh] OR Diltiazem[mh] OR Felodipine[mh] OR Isradipine[mh] OR Nicardipine[mh] OR Nifedipine[mh] OR Nisoldipine[mh] OR Verapamil[mh] OR Calcium Channel Blockers [Pharmacological Action] OR Calcium channel block*[tiab] OR Calcium Channel Antagon*[tiab] OR CCB[tiab] OR Exogenous Calcium Inhibit*[tiab] OR Exogenous Calcium Antagon*[tiab] OR Exogenous Calcium Block*[tiab] OR Calcium Antagon*[tiab] OR amlodipine OR amrinone OR aranidipine OR Azelnidipine or barnidipine or bencyclane or benidipine or bepridil OR clevidipine OR cilnidipine or cinnarizine or clentiazem or conotoxin* OR darodipine OR Diltiazem or efonidipine or elgodipine or etafenone or fantofarone OR Felodipine or fendiline or flunarizine or gallopamil OR Isradipine OR lacidipine OR lercanidipine or lidoflazine or lomerizine OR manidipine OR mibefradil or Nicardipine OR Nifedipine OR niguldipine or nilvadipine or nimodipine or Nisoldipine OR nitrendipine or perhexiline or prandipine OR prenylamine or semotiadil or terodiline or tiapamil OR Verapamil)
Calcium channel blockers
9
Search (Sodium Chloride Symporter Inhibitors[mh] OR bendroflumethiazide[mh] OR Benzothiadiazines[mh] OR Chlorothiazide[mh] OR chlorthalidone[mh] OR cyclopenthiazide[mh] OR hydrochlorothiazide[mh] OR hydroflumethiazide[mh] OR indapamide[mh] OR methyclothiazide[mh] OR metolazone[mh] OR polythiazide[mh] OR trichlormethiazide[mh] OR xipamide[mh] OR Sodium Chloride Symporter Inhibitors [Pharmacological Action] OR Sodium Chloride Symporter Inhibit*[tiab] OR sodium chloride cotransporter inhibit*[tiab] OR sodium chloride co-transporter inhibit*[tiab] OR Thiazide*[tiab] OR benzothiadiazine[tiab] OR benzo-thiadiazine[tiab] OR thiazide-like[tiab] OR bendroflumethiazide OR clofenamide OR clopamide OR Chlorothiazide OR chlorthalidone OR chlortalidone OR cyclopenthiazide OR cyclothiazide OR fenquizone OR hydrochlorothiazide OR hydroflumethiazide OR indapamide OR medfruside OR methyclothiazide OR metolazone OR polythiazide OR quinethazone OR trichlormethiazide OR xipamide)
Thiazide & thiazide-like diuretics
10 Search (#5 AND (#6 OR #7 OR #8 OR #9)) ACE AND (ARB or BB or
Calcium OR Thiazide)
11 Search (#6 AND (#7 OR #8 OR #9)) ARB AND (BB or calcium or thiazide)
12 Search (#7 AND (#8 OR # 9)) Beta Blockers AND (calcium or thiazide)
13 Search (#8 AND #9) Calcium Channel Blockers and Diuretics

© 2017 by the American College of Cardiology Foundation and the American Heart Association, Inc. 52
14 Search (#10 OR #11 OR #12 OR #13) All drug pairings together
15 Search (#14 AND #3 AND #4) Htn + drug pairings + randomized
16 Search (#15 AND eng[la] NOT (animals[mh] NOT human[mh])) Remove animal studies + limit to English
17
Search (#16 NOT (review[pt] OR review[ti] OR comment[pt] OR editorial[pt] OR meta-analysis[pt] OR meta-analysis[ti] OR letter[pt] OR in vitro techniques[mh] OR guideline[pt] OR case reports[pt] OR case report[ti] OR news[pt] NOT ((review[pt] AND clinical trial[pt]) OR (meta-analysis[pt] AND clinical trial[pt]) OR (case reports[pt] AND (clinical trial[pt] OR series[tiab])))))
Remove obvious non-trial publications
18 Search (#17 NOT (pregnan*[tw] OR ocular hypertension[tw] OR preeclampsia[tw] OR pre-eclampsia[tw]))
Remove pregnancy-induced hypertension and
ocular hypertension
Embase Search 1 exp hypertension/
Hypertension Concept 2 (hypertension or hypertensive).ti,ab.
3 Blood pressure.ti. 4 1 or 2 or 3 5 exp dipeptidyl carboxypeptidase inhibitor/
ACE Inhibitors
6
(angiotensin converting enzyme inhibit$ or angiotensin converting enzyme antagon$ or acei or ace inhibit$ or kininase II antagon$ or kininase II inhibit$ or angiotensin I converting enzyme inhibit$ or angiotensin I converting enzyme antagon$ or dipeptidyl carboxypeptidase inhibit$).ti,ab.
7
(alacepril or altiopril or ancovenin or benazepril or benazeprilat or captopril or ceranapril or ceronapril or cilazapril or deacetylalacepril or delapril or derapril or enalapril or enalaprilat or epicaptopril or fasidotril or fosinopril or gemopatrilat or idrapril or imidapril or indolapril or libenzapril or Lisinopril or moexipril or moveltipril or omapatrilat or pentopril or perindopril or pivopril or quinapril or Ramipril or rentiapril or saralasin or s nitrosocaptopril or spirapril or temocapril or teprotide or utibapril or zabicipril or trandolapril or zofenopril).ti,ab.
8 5 or 6 or 7
9 exp Angiotensin Receptor Antagonist/ or Saralasin/
Angiotensin receptor blockers 10
(angiotensin receptor antagon$ or angiotensin receptor block$ or angiotensin II type 1 receptor block$ or angiotensin II type 1 receptor antagon$ or angiotensin II type 2 receptor block$ or angiotensin II type 2 receptor antagon$ or angiotensin II receptor antagon$ or angiotensin II receptor block$ or sartanOR sartansOR arbs or arb).ti,ab.
11
(Abitesartan or Azilsartan or candesartan or elisartan or embusartan or eprosartan or forasartan or irbesartan or KT3-671 or losartan or milfasartan or olmesartan or saralasin or saprisartan or tasosartan or telmisartan or tasosartan or valsartan or zolasartan).ti,ab.
12 9 or 10 or 11
13 exp beta adrenergic receptor blocking agent/
Beta Blockers
14
(adrenergic beta antagon$ or adrenergic beta 1 receptor antagon$ or adrenergic beta 2 receptor antagon$ or adrenergic beta 3 receptor antagon$ or beta adrenergic receptor block$ or beta adrenergic block$ or adrenergic beta receptor block$ or beta atagon$ or beta adrenergic antagon$ or beta adrenoreceptor antagon$ or beta block$).ti,ab.
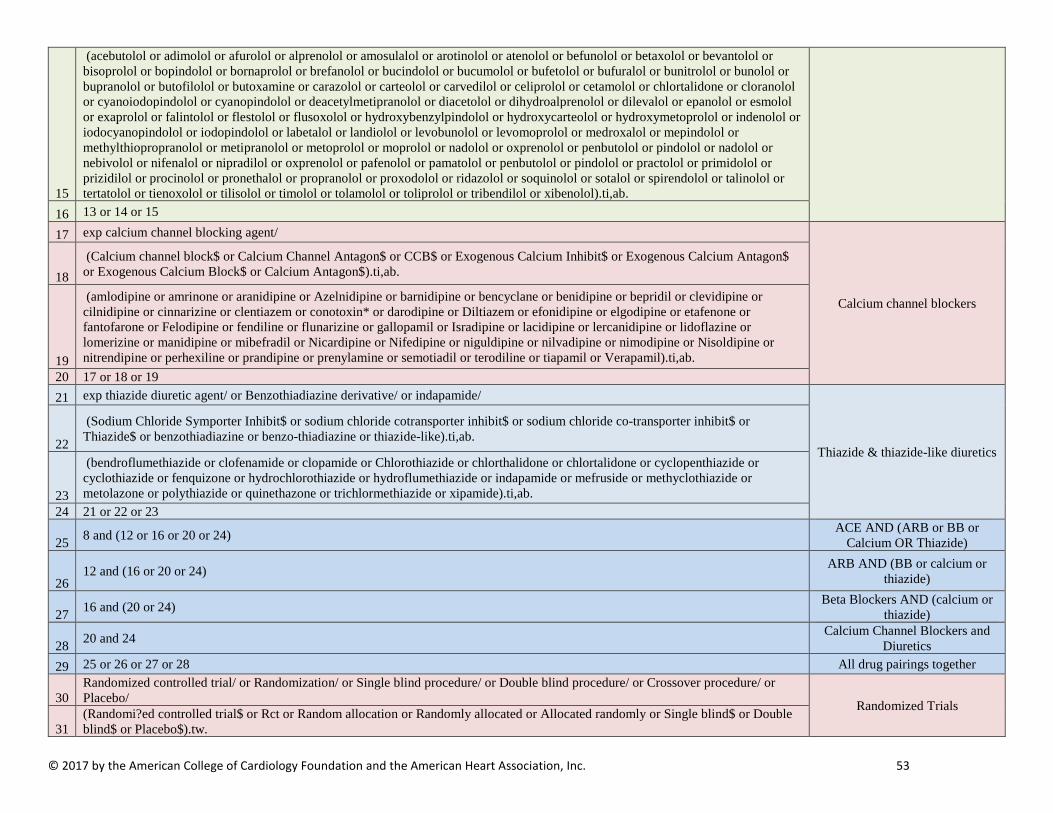
© 2017 by the American College of Cardiology Foundation and the American Heart Association, Inc. 53
15
(acebutolol or adimolol or afurolol or alprenolol or amosulalol or arotinolol or atenolol or befunolol or betaxolol or bevantolol or bisoprolol or bopindolol or bornaprolol or brefanolol or bucindolol or bucumolol or bufetolol or bufuralol or bunitrolol or bunolol or bupranolol or butofilolol or butoxamine or carazolol or carteolol or carvedilol or celiprolol or cetamolol or chlortalidone or cloranolol or cyanoiodopindolol or cyanopindolol or deacetylmetipranolol or diacetolol or dihydroalprenolol or dilevalol or epanolol or esmolol or exaprolol or falintolol or flestolol or flusoxolol or hydroxybenzylpindolol or hydroxycarteolol or hydroxymetoprolol or indenolol or iodocyanopindolol or iodopindolol or labetalol or landiolol or levobunolol or levomoprolol or medroxalol or mepindolol or methylthiopropranolol or metipranolol or metoprolol or moprolol or nadolol or oxprenolol or penbutolol or pindolol or nadolol or nebivolol or nifenalol or nipradilol or oxprenolol or pafenolol or pamatolol or penbutolol or pindolol or practolol or primidolol or prizidilol or procinolol or pronethalol or propranolol or proxodolol or ridazolol or soquinolol or sotalol or spirendolol or talinolol or tertatolol or tienoxolol or tilisolol or timolol or tolamolol or toliprolol or tribendilol or xibenolol).ti,ab.
16 13 or 14 or 15
17 exp calcium channel blocking agent/
Calcium channel blockers
18 (Calcium channel block$ or Calcium Channel Antagon$ or CCB$ or Exogenous Calcium Inhibit$ or Exogenous Calcium Antagon$ or Exogenous Calcium Block$ or Calcium Antagon$).ti,ab.
19
(amlodipine or amrinone or aranidipine or Azelnidipine or barnidipine or bencyclane or benidipine or bepridil or clevidipine or cilnidipine or cinnarizine or clentiazem or conotoxin* or darodipine or Diltiazem or efonidipine or elgodipine or etafenone or fantofarone or Felodipine or fendiline or flunarizine or gallopamil or Isradipine or lacidipine or lercanidipine or lidoflazine or lomerizine or manidipine or mibefradil or Nicardipine or Nifedipine or niguldipine or nilvadipine or nimodipine or Nisoldipine or nitrendipine or perhexiline or prandipine or prenylamine or semotiadil or terodiline or tiapamil or Verapamil).ti,ab.
20 17 or 18 or 19 21 exp thiazide diuretic agent/ or Benzothiadiazine derivative/ or indapamide/
Thiazide & thiazide-like diuretics 22
(Sodium Chloride Symporter Inhibit$ or sodium chloride cotransporter inhibit$ or sodium chloride co-transporter inhibit$ or Thiazide$ or benzothiadiazine or benzo-thiadiazine or thiazide-like).ti,ab.
23
(bendroflumethiazide or clofenamide or clopamide or Chlorothiazide or chlorthalidone or chlortalidone or cyclopenthiazide or cyclothiazide or fenquizone or hydrochlorothiazide or hydroflumethiazide or indapamide or mefruside or methyclothiazide or metolazone or polythiazide or quinethazone or trichlormethiazide or xipamide).ti,ab.
24 21 or 22 or 23
25 8 and (12 or 16 or 20 or 24) ACE AND (ARB or BB or Calcium OR Thiazide)
26 12 and (16 or 20 or 24) ARB AND (BB or calcium or
thiazide)
27 16 and (20 or 24) Beta Blockers AND (calcium or thiazide)
28 20 and 24 Calcium Channel Blockers and Diuretics
29 25 or 26 or 27 or 28 All drug pairings together
30 Randomized controlled trial/ or Randomization/ or Single blind procedure/ or Double blind procedure/ or Crossover procedure/ or Placebo/ Randomized Trials
31 (Randomi?ed controlled trial$ or Rct or Random allocation or Randomly allocated or Allocated randomly or Single blind$ or Double blind$ or Placebo$).tw.
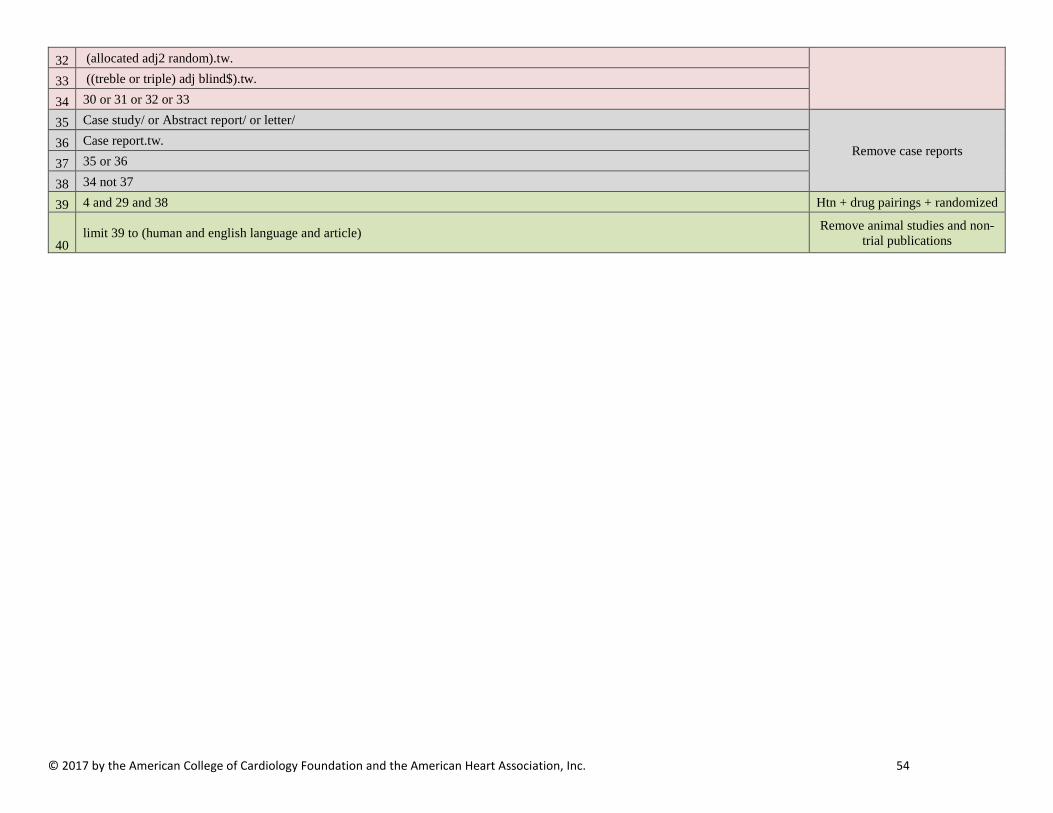
© 2017 by the American College of Cardiology Foundation and the American Heart Association, Inc. 54
32 (allocated adj2 random).tw.
33 ((treble or triple) adj blind$).tw.
34 30 or 31 or 32 or 33
35 Case study/ or Abstract report/ or letter/
Remove case reports 36 Case report.tw.
37 35 or 36
38 34 not 37
39 4 and 29 and 38 Htn + drug pairings + randomized
40 limit 39 to (human and english language and article) Remove animal studies and non-
trial publications
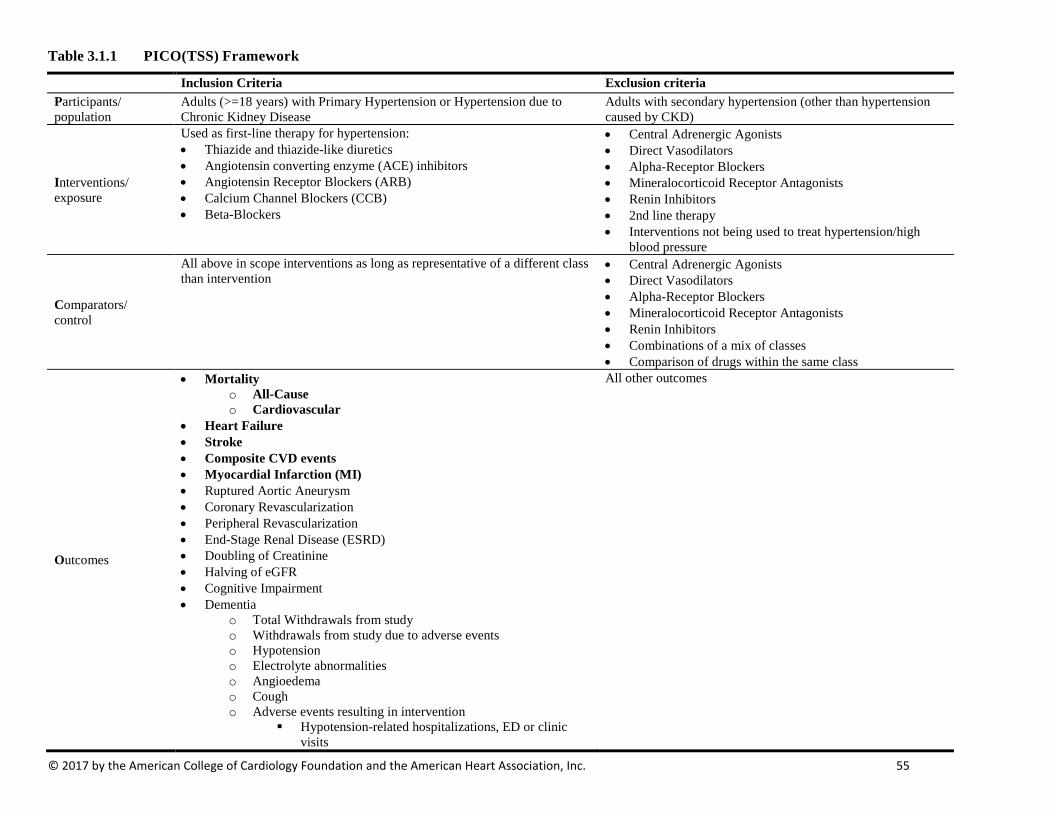
© 2017 by the American College of Cardiology Foundation and the American Heart Association, Inc. 55
Table 3.1.1 PICO(TSS) Framework
Inclusion Criteria Exclusion criteria Participants/ population
Adults (>=18 years) with Primary Hypertension or Hypertension due to Chronic Kidney Disease
Adults with secondary hypertension (other than hypertension caused by CKD)
Interventions/ exposure
Used as first-line therapy for hypertension: • Thiazide and thiazide-like diuretics • Angiotensin converting enzyme (ACE) inhibitors • Angiotensin Receptor Blockers (ARB) • Calcium Channel Blockers (CCB) • Beta-Blockers
• Central Adrenergic Agonists • Direct Vasodilators • Alpha-Receptor Blockers • Mineralocorticoid Receptor Antagonists • Renin Inhibitors • 2nd line therapy • Interventions not being used to treat hypertension/high
blood pressure
Comparators/ control
All above in scope interventions as long as representative of a different class than intervention
• Central Adrenergic Agonists • Direct Vasodilators • Alpha-Receptor Blockers • Mineralocorticoid Receptor Antagonists • Renin Inhibitors • Combinations of a mix of classes • Comparison of drugs within the same class
Outcomes
• Mortality o All-Cause o Cardiovascular
• Heart Failure • Stroke • Composite CVD events • Myocardial Infarction (MI) • Ruptured Aortic Aneurysm • Coronary Revascularization • Peripheral Revascularization • End-Stage Renal Disease (ESRD) • Doubling of Creatinine • Halving of eGFR • Cognitive Impairment • Dementia
o Total Withdrawals from study o Withdrawals from study due to adverse events o Hypotension o Electrolyte abnormalities o Angioedema o Cough o Adverse events resulting in intervention
Hypotension-related hospitalizations, ED or clinic visits
All other outcomes

© 2017 by the American College of Cardiology Foundation and the American Heart Association, Inc. 56
AEs resulting in discontinuation of medication • Achieved mean level of BP change • Proportion of patients achieving a target blood pressure • of hypertension • Dysglycemia including development of new-onset DM
Timing (of outcomes)
≥48 weeks of follow-up <48 weeks of follow-up
Setting/context Any NA Study design Randomized Controlled Trials Observational Studies Additional criteria ≥100 randomized patients or >=400 patient-years of follow-up <100 randomized patients or ≥400 patient-years of follow-up
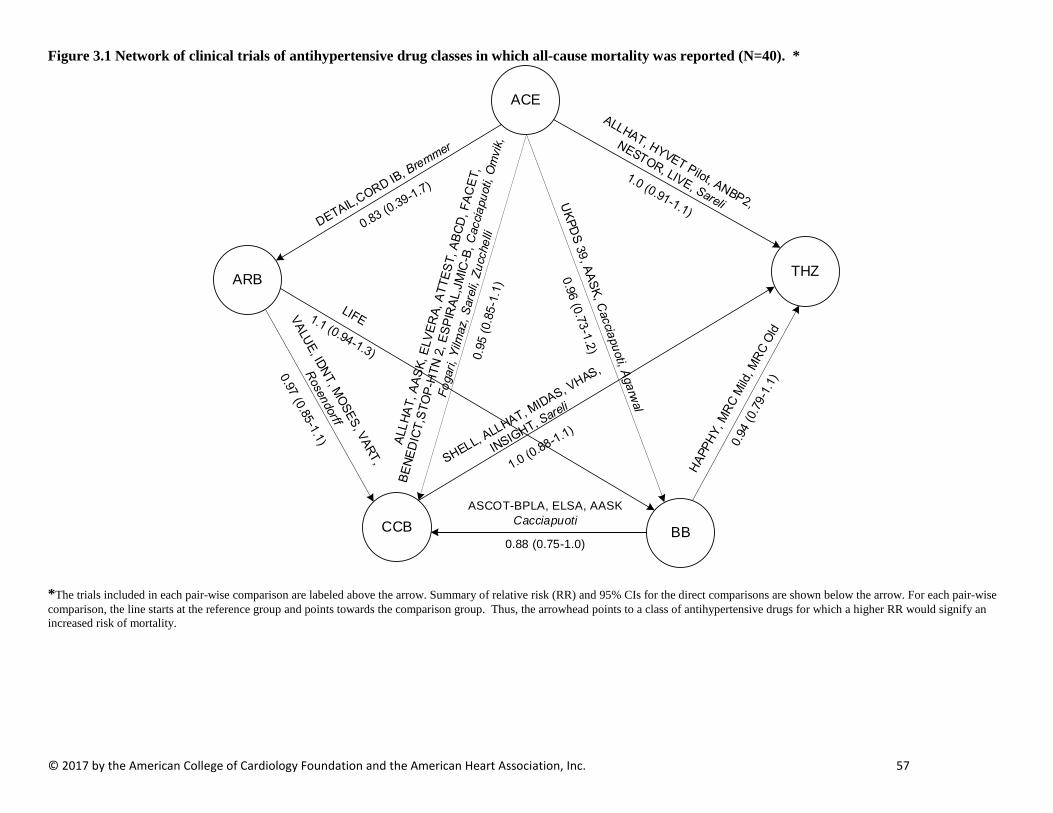
© 2017 by the American College of Cardiology Foundation and the American Heart Association, Inc. 57
Figure 3.1 Network of clinical trials of antihypertensive drug classes in which all-cause mortality was reported (N=40). *
*The trials included in each pair-wise comparison are labeled above the arrow. Summary of relative risk (RR) and 95% CIs for the direct comparisons are shown below the arrow. For each pair-wise comparison, the line starts at the reference group and points towards the comparison group. Thus, the arrowhead points to a class of antihypertensive drugs for which a higher RR would signify an increased risk of mortality.
ACE
THZARB
CCB BB
ASCOT-BPLA, ELSA, AASK Cacciapuoti
0.88 (0.75-1.0)

© 2017 by the American College of Cardiology Foundation and the American Heart Association, Inc. 58
Figure 3.2 Network of clinical trials of antihypertensive drug classes in which CV mortality was reported (N=25 ) *
ACE
THZARB
CCB BBASCOT-BPLA, ELSA, AASK
0.76 (0.59-0.96)
*. *The trials included in each pair-wise comparison are labeled above the arrow. Summary of relative risk (RR) and 95% CIs for the direct comparisons are shown below the arrow. For each pair-wise comparison, the line starts at the reference group and points towards the comparison group. Thus, the arrowhead points to a class of antihypertensive drugs for which a higher RR would signify an increased risk of CV mortality.
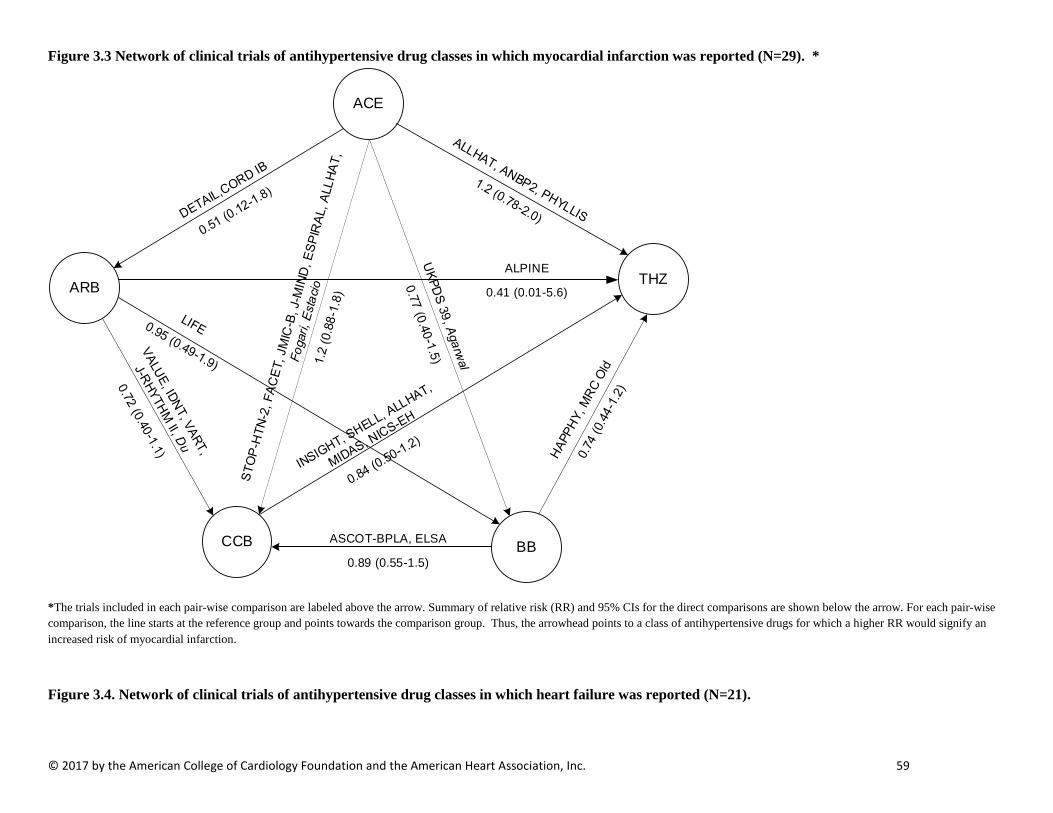
© 2017 by the American College of Cardiology Foundation and the American Heart Association, Inc. 59
Figure 3.3 Network of clinical trials of antihypertensive drug classes in which myocardial infarction was reported (N=29). *
ACE
THZARB
CCB BBASCOT-BPLA, ELSA
0.89 (0.55-1.5)
ALPINE
0.41 (0.01-5.6)
*The trials included in each pair-wise comparison are labeled above the arrow. Summary of relative risk (RR) and 95% CIs for the direct comparisons are shown below the arrow. For each pair-wise comparison, the line starts at the reference group and points towards the comparison group. Thus, the arrowhead points to a class of antihypertensive drugs for which a higher RR would signify an increased risk of myocardial infarction.
Figure 3.4. Network of clinical trials of antihypertensive drug classes in which heart failure was reported (N=21).

© 2017 by the American College of Cardiology Foundation and the American Heart Association, Inc. 60
ACE
THZARB
CCB BBASCOT-BPLA, AASK
0.82 (0.58-1.1)
* The trials included in each pair-wise comparison are labeled above the arrow. Summary of relative risk (RR) and 95% CIs for the direct comparisons are shown below the arrow. For each pair-wise comparison, the line starts at the reference group and points towards the comparison group. Thus, the arrowhead points to a class of antihypertensive drugs for which a higher RR would signify an increased risk of heart failure.

© 2017 by the American College of Cardiology Foundation and the American Heart Association, Inc. 61
Figure 3.5 Network of clinical trials of antihypertensive drug classes in which fatal and non-fatal stroke outcomes were reported (N=30)*
*The trials included in each pair-wise comparison are labeled above the arrow. Summary of relative risk (RR) and 95% CIs for the direct comparisons are shown below the arrow. For each pair-wise comparison, the line starts at the reference group and points towards the comparison group. Thus, the arrowhead points to a class of antihypertensive drugs for which a higher RR would signify an increased risk of stroke outcomes. † The dash represents the relative risk for THZ and ARB, which was extreme due to zeros. The value could not be calculated based on a direct comparison.
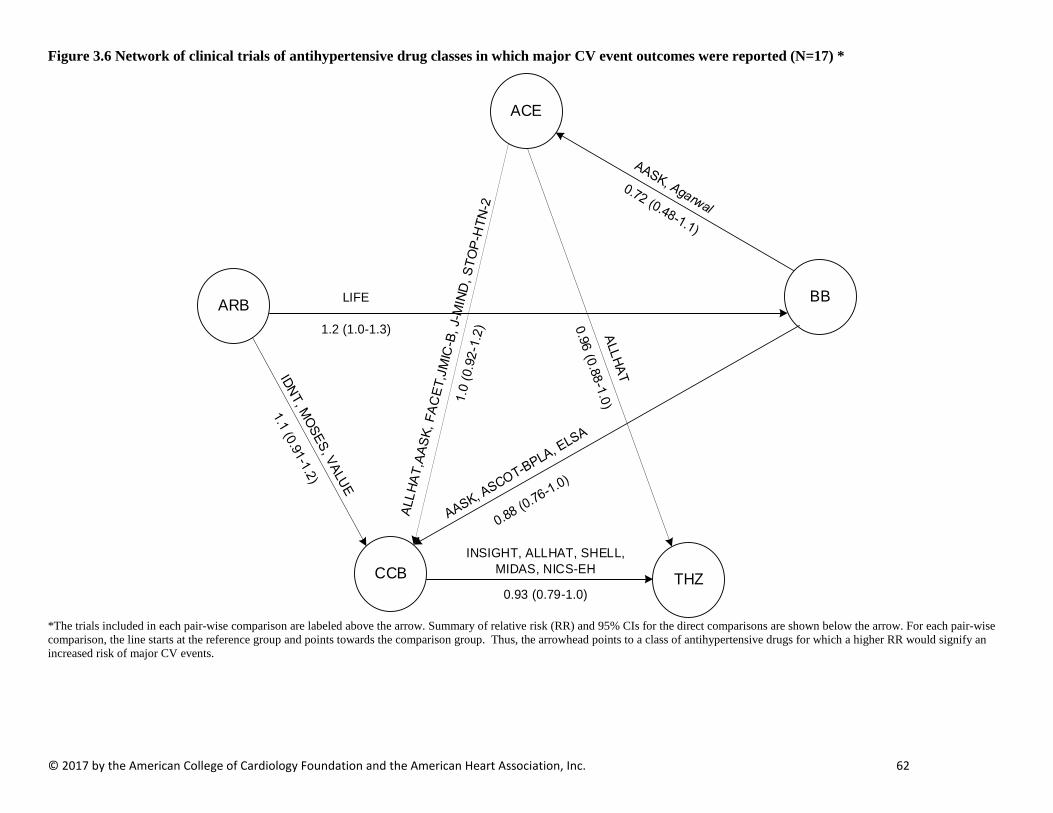
© 2017 by the American College of Cardiology Foundation and the American Heart Association, Inc. 62
Figure 3.6 Network of clinical trials of antihypertensive drug classes in which major CV event outcomes were reported (N=17) *
ACE
BBARB
CCB THZ
INSIGHT, ALLHAT, SHELL, MIDAS, NICS-EH
0.93 (0.79-1.0)
LIFE
1.2 (1.0-1.3)
*The trials included in each pair-wise comparison are labeled above the arrow. Summary of relative risk (RR) and 95% CIs for the direct comparisons are shown below the arrow. For each pair-wise comparison, the line starts at the reference group and points towards the comparison group. Thus, the arrowhead points to a class of antihypertensive drugs for which a higher RR would signify an increased risk of major CV events.

© 2017 by the American College of Cardiology Foundation and the American Heart Association, Inc. 63
Figure 3.7 Network of clinical trials of antihypertensive drug classes in which MACE was reported (N=3). *
ACE
THZ
CCB
*The trials included in each pair-wise comparison are labeled above the arrow. Summary of relative risk (RR) and 95% CIs for the direct comparisons are shown below the arrow. For each pair-wise comparison, the line starts at the reference group and points towards the comparison group. Thus, the arrowhead points to a class of antihypertensive drugs for which a higher RR would signify an increased risk of MACE.

© 2017 by the American College of Cardiology Foundation and the American Heart Association, Inc. 64
Figure 3.8. Network of clinical trials of antihypertensive drug classes in which renal event outcomes were reported (N=5) *
ACE
THZARB
CCB BBAASK
1.0 (0.28-3.9)
*The trials included in each pair-wise comparison are labeled above the arrow. Summary of relative risk (RR) and 95% CIs for the direct comparisons are shown below the arrow. For each pair-wise comparison, the line starts at the reference group and points towards the comparison group. Thus, the arrowhead points to a class of antihypertensive drugs for which a higher RR would signify an increased risk of renal outcomes.

© 2017 by the American College of Cardiology Foundation and the American Heart Association, Inc. 65
Table 3.2 Characteristics of studies Acronym Author Year Patient
status /condition
Tx Comparison
Follow-up (years)
Random-ized
Age (yrs)
% Female
% Caucasian
% African-American
% Asian
% Race, Other
% Hispanic
BMI % DM
% CKD
% CHD
% Cerebrovascular Disease
% Prior MI
AASK Wright Jr. J.T. (45)
2002 CKD, Non-Diabetic
ACE vs. CCB vs. BB
6.4 1094 54.6 38.8 0 100 0 0 NR NR 0 100 NR NR NR
ABCD Estacio RO. (66, 67)
1998 Diabetic CCB vs. ACE
5.0 470 57.5 32.6 83.6 13.8 0 2.6 66.8 31.6 100 NR NR NR 7
ALLHAT ALLHAT Res Grp (68)
2002 Hypertensive THZ vs. CCB vs. ACE
8.0 33357 67 47.0 59.7 35.4 0 4.9 19 29.8 36 NR 25.2 NR NR
ANBP2 Wing LM. (69)
2003 Hypertensive ACE vs. THZ
4.1 6083 71.9 51.0 95 NR NR NR NR 27 7 NR 8 5 NR
ASCOT-BPLA
Dahlof B. (70) 2005 Hypertensive CCB vs. BB
5.5 19257 63 23.4 95.3 NR NR NR NR 28.7 26.7 NR NR NR 0
BENEDICT Ruggenenti P (71)
2004 DM CCB vs. ACE
3.6 1209 62.1 46.9 NR NR NR NR NR 29.3 100 NR NR NR NR
CORD IB Spinar J (72) 2009 Hypertensive ACE vs. ARB
1.0 3813 60.5 50.5 NR NR NR NR NR NR 29.3 NR NR NR 11.7
DETAIL Barnett AH
(73) 2004 DM ARB vs.
ACE 5.0 250 60.6 27.2 98.4 NR NR NR NR 30.7 100 NR NR NR NR
ELSA Zanchetti A (74)
2002 Hypertensive BB vs. CCB
4.1 2334 56 39.4 98.2 NR NR NR NR 27.2 NR NR NR NR NR
ELVERA Terpstra W.F. (75)
2004 Non-DM CCB vs. ACE
2.0 166 67 44.6 NR NR NR NR NR 28 0 NR 0 NR NR
ESPIRAL Marin R (76) 2001 Non-DM ACE vs. CCB
3.1 241 56 41.0 NR NR NR NR NR NR 0 NR NR NR NR
FACET Tatti P. (77) 1998 DM ACE vs. CCB
3.5 380 63.1 40.5 NR NR NR NR NR 30.6 100 NR 0 0* NR
HAPPHY Wilhelmsen L (78)
1987 Non-DM THZ vs. BB
3.8 6569 52.2 0 99 NR NR NR NR 27.2 0 NR NR 0* 0
HYVET-Pilot
Bulpitt CJ (79) 2003 Elderly THZ vs. ACE
1.1 1283 83.8 63.5 $ NR NR NR NR NR 25.4 $
NR NR NR 4.5* 3
IDNT Lewis EJ (80) 2001 DM ARB vs. CCB
2.6 1715 59.2 $ 33.5 $ 72.2 $ 13.1 $ 5.1 $ 4.7 $ 5 $ 31 $ 100 NR NR NR NR
JMIC-B Yui Y (81, 82) 2004 Hypertensive CCB vs. ACE
3.0 1650 65 31.2 NR NR NR NR NR 24.05
22.5 NR NR NR 2.5
LIFE Dahlof B. (83) 2002 LV Hypertrophy
ARB vs. BB
4.8 9193 66.9 54 92 6 0.5 0.2 1 28 13 NR 16 8 NR
LIVE Gosse P (84) 2000 Non-DM THZ vs. ACE
1.0 505 54.5 43.6 77.8 NR NR NR NR 26.7 0 NR 0 NR NR
MOSES Schrader J (85)
2005 Hypertensive ARB vs. CCB
4.0 1405 67.9 45.8 NR NR NR NR NR 27.6 36.8 NR 26.3 61* 8.1
MRC MRC Working Party (86)
1985 Non-DM THZ vs. BB
5.5 17354 51.9 47.9 NR NR NR NR NR NR 0 NR NR NR NR
MRC Old MRC Working Party (87)
1992 Elderly THZ vs. BB
5.8 4396 NR 58 $ NR NR NR NR NR NR NR NR NR NR NR
INSIGHT Brown MJ
(88) 2000 Hypertensive CCB vs
THZ 3.5 6321 65 53.7 NR NR NR NR NR 28.2 20.6 NR 6.4 $ NR 6.1 $

© 2017 by the American College of Cardiology Foundation and the American Heart Association, Inc. 66
Acronym Author Year Patient status /condition
Tx Comparison
Follow-up (years)
Random-ized
Age (yrs)
% Female
% Caucasian
% African-American
% Asian
% Race, Other
% Hispanic
BMI % DM
% CKD
% CHD
% Cerebrovascular Disease
% Prior MI
Fogari R (89) 2002 DM CCB vs.
ACE 4.1 309 62.8 $ 43.4 NR NR NR NR NR 27.7 100 NR 0* 0 NR
Rosendorff C (90)
2009 LV Hypertrophy
ARB vs CCB
1.1 102 63.9 1 10.8 71.6 0 2.9 14.7 NR 16.7 NR NR 5.9* 3.9
Cacciapuoti F (91)
1993 Non-DM CCB vs. ACE vs. BB
5.0 237 48 29.1 NR NR NR NR NR NR 0 NR 0 NR NR
Zucchelli P (92)
1995 Non-DM ACE vs. CCB
4.0 121 55 40.5 NR NR NR NR NR NR 0 NR NR NR NR
Yilmaz R (93) 2010 End Stage Renal Disease
ACE vs. CCB
1.0 112 51.5 46.4 NR NR NR NR NR 22.6 NR NR 0 NR 0
Agarwal R (94)
2014 End Stage Renal Disease, LV Hypertrophy
BB vs. ACE
1.0 200 52.7 34.5 NR 86 NR NR 0.5 27.9 NR NR 26.5 16.5 NR
Omvik P (95) 1993 Hypertensive CCB vs.
ACE 1.1 461 54.4 48.2 NR NR NR NR NR NR NR NR NR NR NR
Bremner AD (96)
1997 Hypertensive ARB vs. ACE
1.0 501 71.8 55.4 99 0.4 0.6 0.4 NR NR NR NR NR NR NR
Sareli P (97) 2001 African-American
CCB_NIF vs. CCB_VER vs. THZ vs. ACE
1.1 409 53.3 77.0 0 100 0 0 NR 31.2 NR NR NR NR NR
NESTOR Marre Michel (98)
2004 DM THZ vs. ACE
1.1 570 60 36 85.6 4.4 2.5 8.6 NR 29.5 100 NR NR NR NR
SHELL Malacco E (99)
2003 Hypertensive THZ vs. CCB
5.0 1882 72.3 61.3 NR NR NR NR NR NR 13.2 NR NR NR NR
STOP-HTN-2
Hansson L
(100) 1999 Hypertensive ACE vs.
CCB 5.0 6614 76 66.8 NR NR NR NR NR 26.7 10.9 NR 8 3.9 3.1
UKPDS 39 UKPDS 39 (101)
1998 DM ACE vs. BB
9.0 1148 56 45.0 85.9 8 5 1 NR 29.8 100 NR NR NR NR
VALUE Julius S (102) 2004 Hypertensive ARB vs. CCB
6.0 15245 67.2 53 89.3 4.2 3.5 3 NR 28.6 NR NR 45.8 19.8* 4.5
VART Narumi H (103)
2011 Asian ARB vs. CCB
NR 1021 60 42.8 0 0 100 0 NR 24.5 8.1 NR 3.4 0 NR
VHAS Rosei E.A. (104)
1997 Non-DM THZ vs. CCB
2.1 1414 53.2 51 NR NR NR NR NR 27.1 0 NR NR NR NR
MIDAS Borhani N.O. (105)
1996 Non-DM CCB vs. THZ
3.2 883 58.5 22.2 72 22 0 6 NR 27.8 0 NR NR NR 1.9
ATTEST Katayama S
(106) 2008 DM CCB vs.
ACE 1.2 223 59.3 31.4 NR NR NR NR NR 26.1
4 100 NR NR NR 0
SHELL Malacco E (99)
2003 Hypertensive THZ vs. CCB
5.0 1882 72.3 61.3 NR NR NR NR NR NR 13.2 NR NR NR NR
NR= not reported, tx=treatment, BMI=body mass index, DM=diabetes mellitus, CKD=chronic kidney disease, CHD=coronary heart disease $ Study reported additional groups that were not in scope. Data was calculated using interventions of interest. * Stroke was used as surrogate for Cerebrovascular Disease
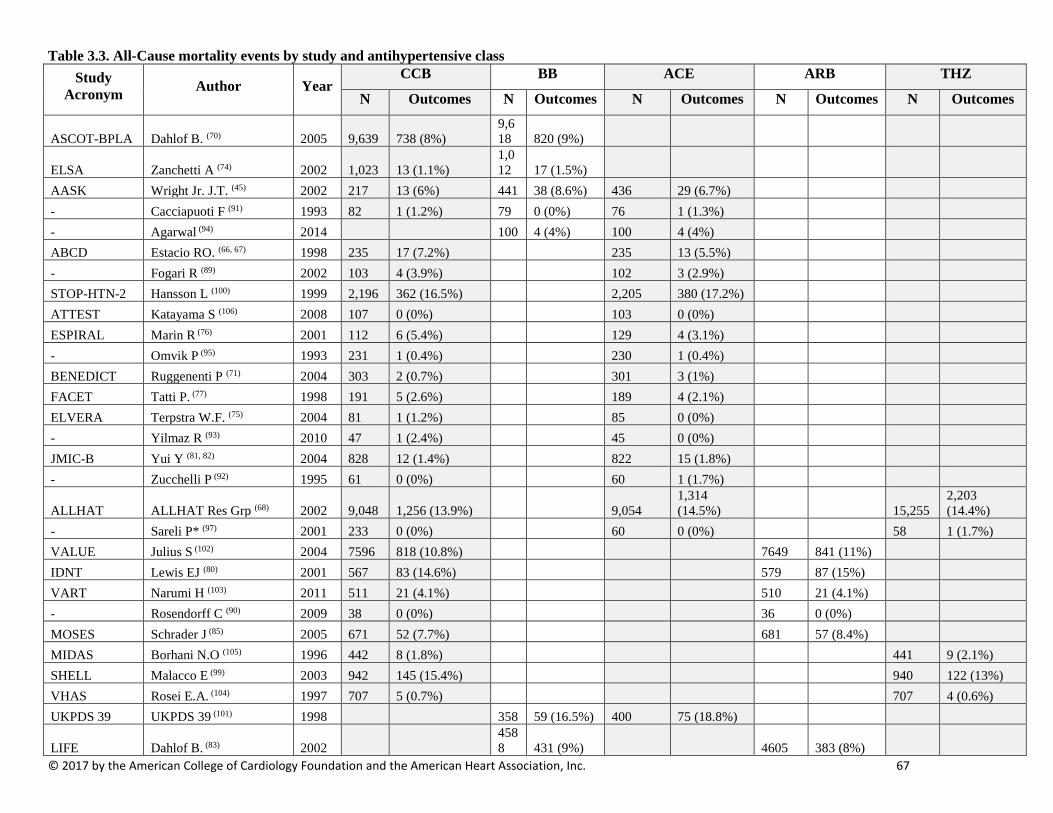
© 2017 by the American College of Cardiology Foundation and the American Heart Association, Inc. 67
Table 3.3. All-Cause mortality events by study and antihypertensive class Study
Acronym Author Year CCB BB ACE ARB THZ
N Outcomes N Outcomes N Outcomes N Outcomes N Outcomes
ASCOT-BPLA Dahlof B. (70) 2005 9,639 738 (8%) 9,618 820 (9%)
ELSA Zanchetti A (74) 2002 1,023 13 (1.1%) 1,012 17 (1.5%)
AASK Wright Jr. J.T. (45) 2002 217 13 (6%) 441 38 (8.6%) 436 29 (6.7%) - Cacciapuoti F (91) 1993 82 1 (1.2%) 79 0 (0%) 76 1 (1.3%) - Agarwal (94) 2014 100 4 (4%) 100 4 (4%) ABCD Estacio RO. (66, 67) 1998 235 17 (7.2%) 235 13 (5.5%) - Fogari R (89) 2002 103 4 (3.9%) 102 3 (2.9%) STOP-HTN-2 Hansson L (100) 1999 2,196 362 (16.5%) 2,205 380 (17.2%) ATTEST Katayama S (106) 2008 107 0 (0%) 103 0 (0%) ESPIRAL Marin R (76) 2001 112 6 (5.4%) 129 4 (3.1%) - Omvik P (95) 1993 231 1 (0.4%) 230 1 (0.4%) BENEDICT Ruggenenti P (71) 2004 303 2 (0.7%) 301 3 (1%) FACET Tatti P. (77) 1998 191 5 (2.6%) 189 4 (2.1%) ELVERA Terpstra W.F. (75) 2004 81 1 (1.2%) 85 0 (0%) - Yilmaz R (93) 2010 47 1 (2.4%) 45 0 (0%) JMIC-B Yui Y (81, 82) 2004 828 12 (1.4%) 822 15 (1.8%) - Zucchelli P (92) 1995 61 0 (0%) 60 1 (1.7%)
ALLHAT ALLHAT Res Grp (68) 2002 9,048 1,256 (13.9%) 9,054 1,314 (14.5%) 15,255
2,203 (14.4%)
- Sareli P* (97) 2001 233 0 (0%) 60 0 (0%) 58 1 (1.7%) VALUE Julius S (102) 2004 7596 818 (10.8%) 7649 841 (11%) IDNT Lewis EJ (80) 2001 567 83 (14.6%) 579 87 (15%) VART Narumi H (103) 2011 511 21 (4.1%) 510 21 (4.1%) - Rosendorff C (90) 2009 38 0 (0%) 36 0 (0%) MOSES Schrader J (85) 2005 671 52 (7.7%) 681 57 (8.4%) MIDAS Borhani N.O (105) 1996 442 8 (1.8%) 441 9 (2.1%) SHELL Malacco E (99) 2003 942 145 (15.4%) 940 122 (13%) VHAS Rosei E.A. (104) 1997 707 5 (0.7%) 707 4 (0.6%) UKPDS 39 UKPDS 39 (101) 1998 358 59 (16.5%) 400 75 (18.8%)
LIFE Dahlof B. (83) 2002 4588 431 (9%) 4605 383 (8%)
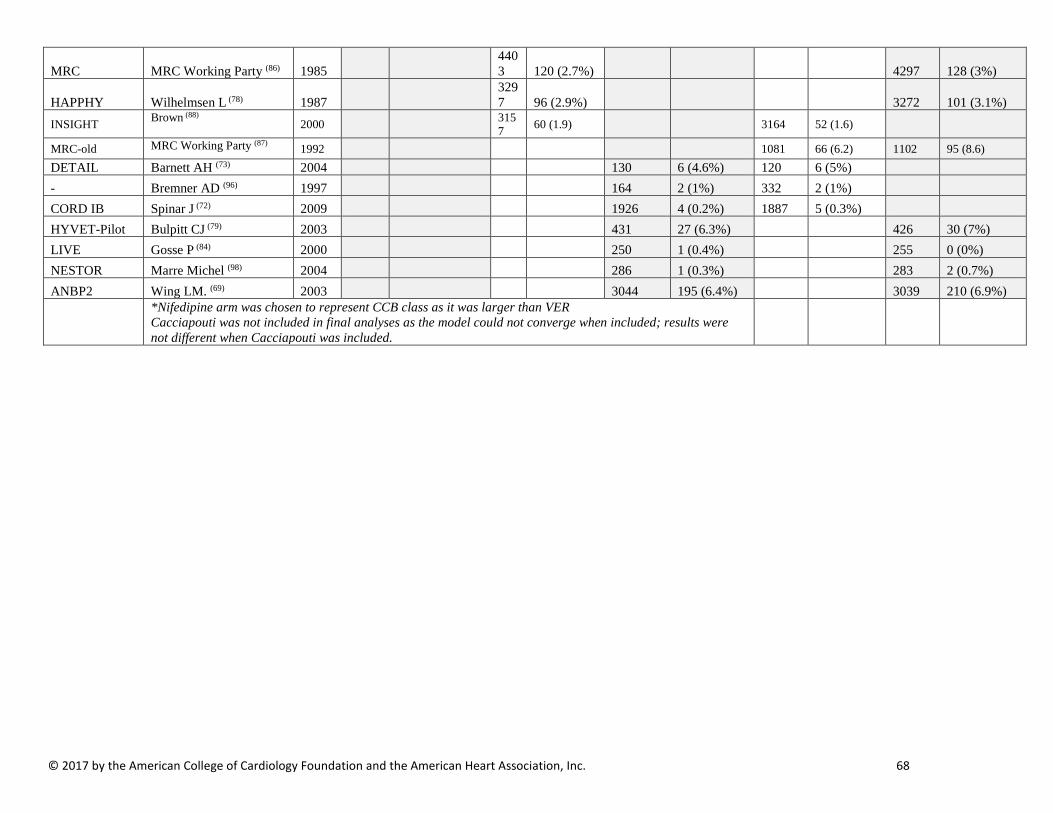
© 2017 by the American College of Cardiology Foundation and the American Heart Association, Inc. 68
MRC MRC Working Party (86) 1985 4403 120 (2.7%) 4297 128 (3%)
HAPPHY Wilhelmsen L (78) 1987 3297 96 (2.9%) 3272 101 (3.1%)
INSIGHT Brown (88) 2000 3157 60 (1.9) 3164 52 (1.6)
MRC-old MRC Working Party (87) 1992 1081 66 (6.2) 1102 95 (8.6) DETAIL Barnett AH (73) 2004 130 6 (4.6%) 120 6 (5%) - Bremner AD (96) 1997 164 2 (1%) 332 2 (1%) CORD IB Spinar J (72) 2009 1926 4 (0.2%) 1887 5 (0.3%) HYVET-Pilot Bulpitt CJ (79) 2003 431 27 (6.3%) 426 30 (7%) LIVE Gosse P (84) 2000 250 1 (0.4%) 255 0 (0%) NESTOR Marre Michel (98) 2004 286 1 (0.3%) 283 2 (0.7%) ANBP2 Wing LM. (69) 2003 3044 195 (6.4%) 3039 210 (6.9%)
*Nifedipine arm was chosen to represent CCB class as it was larger than VER Cacciapouti was not included in final analyses as the model could not converge when included; results were not different when Cacciapouti was included.
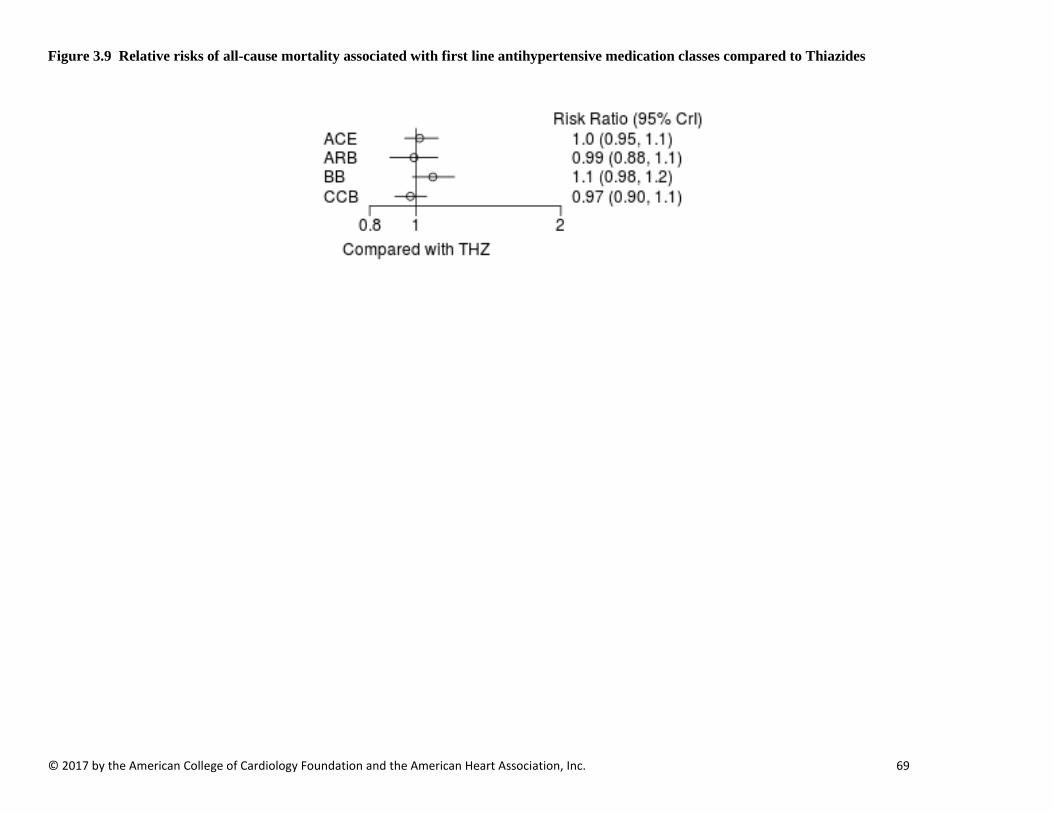
© 2017 by the American College of Cardiology Foundation and the American Heart Association, Inc. 69
Figure 3.9 Relative risks of all-cause mortality associated with first line antihypertensive medication classes compared to Thiazides

© 2017 by the American College of Cardiology Foundation and the American Heart Association, Inc. 70
Figure 3.9.1 Pooled Network Relative risks associated with first line antihypertensive medication classes compared to THZ
-0.4 -0.2 0 0.2 0.4 0.6 0.8 1 1.2 1.4
Panel A: ARB vs THZ Outcome RR (95% CI)
All-Cause Mortal ity 0.99 (0.88-1.10) CV Mortali ty 1.10 (0.87-1.50)
Myocardial In farction 1.40 (0.95-2.10) Heart Failure 1.10 (0.79-1.60) Stroke 1.10 (0.88-1.40) CV Composite 1.00 (0.89-1.20) Renal 0.76 (0.09-5.60)
-0.4 -0.2 0 0.2 0.4 0.6 0.8 1 1.2 1.4
Panel B: BB vs THZ Outcome RR (95% CI)
All-Cause Mortal ity 1.10 (0.98-1.20) CV Mortali ty 1.20 (0.98-1.40)
Myocardial In farction 1.20 (0.89-1.60) Heart Failure 1.30 (0.94-1.70) Stroke 1.30 (1.10-1.60) CV Composite 1.20 (1.00-1.40) Renal 0.98 (0.29-3.30)
-0.4 -0.2 0 0.2 0.4 0.6 0.8 1 1.2 1.4
Favors ARB Favors THZ Favors BB Favors THZ
Panel C: CCB vs THZ
Outcome RR (95% CI)
All-Cause Mortal ity 0.97 (0.90-1.10) CV Mortali ty 1.00 (0.86-1.20)
Myocardial In farction 1.10 (0.89-1.60) Heart Failure 1.30 (1.00-1.60) Stroke 0.96 (0.83-1.20) CV Composite 1.10 (0.98-1.20) Renal 1.00 (0.46-2.50)
Favors CCB Favors THZ
-0.4 -0.2 0 0.2 0.4 0.6 0.8 1 1.2 1.4
Panel D: ACE vs THZ Outcome RR (95% CI)
All-Cause Mortal ity 1.00 (0.95-1.10) CV Mortali ty 1.10 (0.92-1.30)
Myocardial In farction 0.98 (0.75-1.40) Heart Failure 1.20 (0.91-1.50) Stroke 1.10 (0.98-1.40) CV Composite 1.10 (0.96-1.30) Renal 0.86 (0.37-1.90)
Favors ACE Favors THZ
Relat ive Risk Relat ive Risk
Relat ive Risk Relat ive Risk
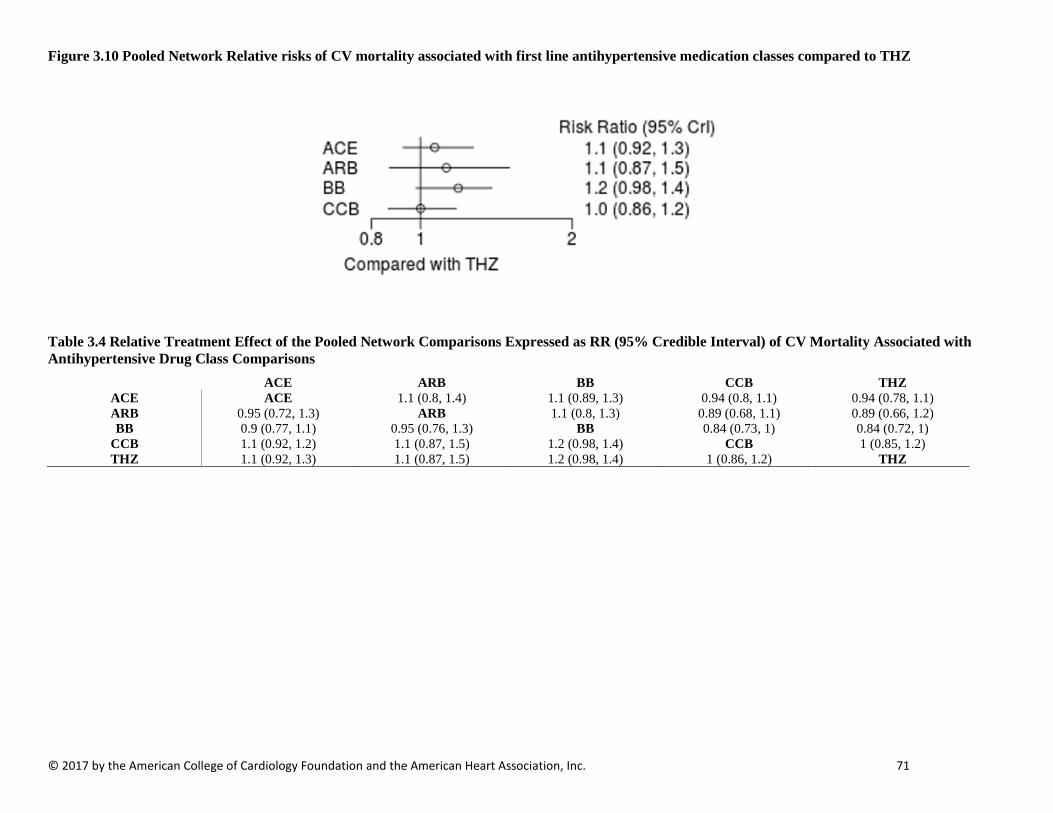
© 2017 by the American College of Cardiology Foundation and the American Heart Association, Inc. 71
Figure 3.10 Pooled Network Relative risks of CV mortality associated with first line antihypertensive medication classes compared to THZ
Table 3.4 Relative Treatment Effect of the Pooled Network Comparisons Expressed as RR (95% Credible Interval) of CV Mortality Associated with Antihypertensive Drug Class Comparisons
ACE ARB BB CCB THZ ACE ACE 1.1 (0.8, 1.4) 1.1 (0.89, 1.3) 0.94 (0.8, 1.1) 0.94 (0.78, 1.1) ARB 0.95 (0.72, 1.3) ARB 1.1 (0.8, 1.3) 0.89 (0.68, 1.1) 0.89 (0.66, 1.2) BB 0.9 (0.77, 1.1) 0.95 (0.76, 1.3) BB 0.84 (0.73, 1) 0.84 (0.72, 1)
CCB 1.1 (0.92, 1.2) 1.1 (0.87, 1.5) 1.2 (0.98, 1.4) CCB 1 (0.85, 1.2) THZ 1.1 (0.92, 1.3) 1.1 (0.87, 1.5) 1.2 (0.98, 1.4) 1 (0.86, 1.2) THZ
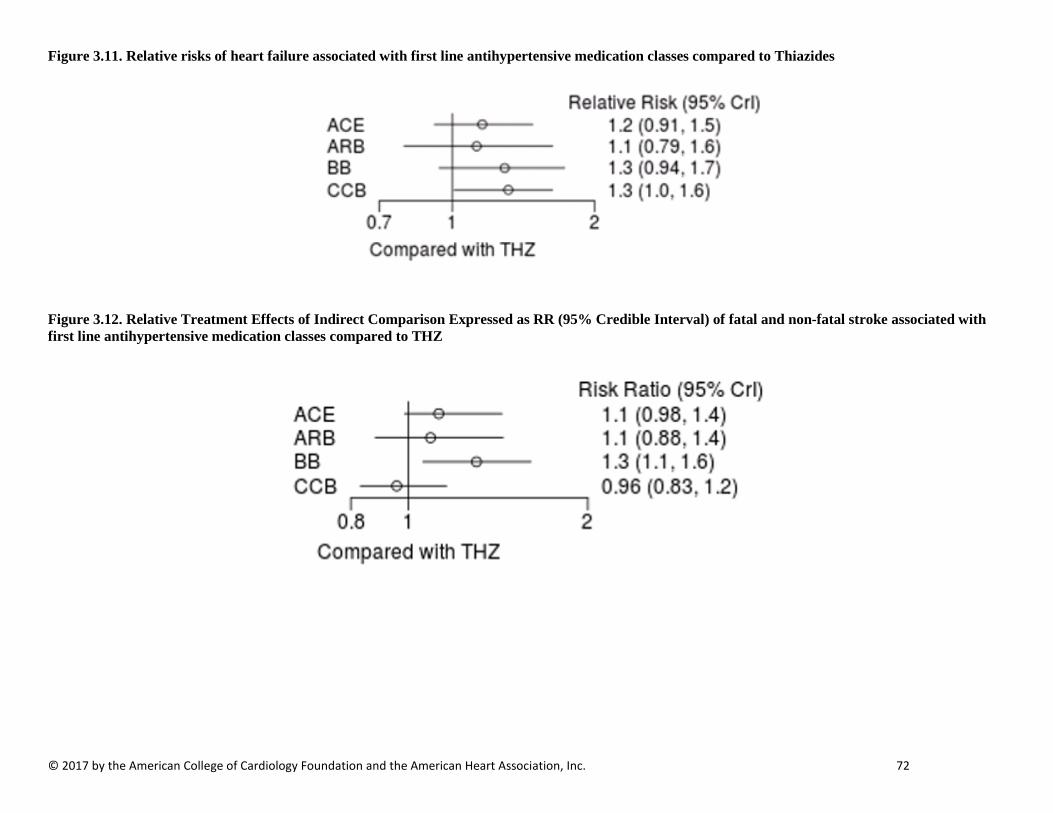
© 2017 by the American College of Cardiology Foundation and the American Heart Association, Inc. 72
Figure 3.11. Relative risks of heart failure associated with first line antihypertensive medication classes compared to Thiazides
Figure 3.12. Relative Treatment Effects of Indirect Comparison Expressed as RR (95% Credible Interval) of fatal and non-fatal stroke associated with first line antihypertensive medication classes compared to THZ

© 2017 by the American College of Cardiology Foundation and the American Heart Association, Inc. 73
Table 3.5 Relative Treatment Effect of Pooled Network Comparisons Expressed as RR (95% Credible Interval) of Stroke Associated with Antihypertensive Drug Class Comparisons
ACE ARB BB CCB THZ ACE ACE 0.97 (0.76, 1.2) 1.2 (0.88, 1.4) 0.85 (0.71, 0.98) 0.89 (0.7, 1) ARB 1 (0.83, 1.3) ARB 1.2 (0.91, 1.5) 0.88 (0.71, 1.1) 0.92 (0.69, 1.1) BB 0.86 (0.71, 1.1) 0.84 (0.68, 1.1) BB 0.73 (0.6, 0.93) 0.77 (0.62, 0.95) CCB 1.2 ( 1, 1.4) 1.1 (0.93, 1.4) 1.4 (1.1, 1.7) CCB 1 (0.86, 1.2) THZ 1.1 (0.98, 1.4) 1.1 (0.88, 1.4) 1.3 (1.1, 1.6) 0.96 (0.83, 1.2) THZ
Figure 3.13 Relative Treatment Effects of Indirect Comparison Expressed as RR (95% Credible Interval) of major CV events associated with first line antihypertensive medication classes compared to THZ
Table 3.6 Relative Treatment Effect of Pooled Network Comparisons Expressed as RR (95% Credible Interval) of Major CV Events Associated with Antihypertensive Drug Class Comparisons
ACE ARB BB CCB THZ ACE ACE 0.98 (0.82, 1.1) 1.1 (0.92, 1.3) 1 (0.91, 1.1) 0.94 (0.79, 1) ARB 1 (0.9, 1.2) ARB 1.1 (0.98, 1.3) 1 (0.94, 1.2) 0.96 (0.81, 1.1) BB 0.9 (0.8, 1.1) 0.88 (0.78, 1) BB 0.91 (0.83, 1.1) 0.84 (0.72, 0.99) CCB 0.99 (0.89, 1.1) 0.97 (0.85, 1.1) 1.1 (0.95, 1.2) CCB 0.93 (0.8, 1) THZ 1.1 (0.96, 1.3) 1 (0.89, 1.2) 1.2 ( 1, 1.4) 1.1 (0.98, 1.2) THZ

© 2017 by the American College of Cardiology Foundation and the American Heart Association, Inc. 74
Table 3.7. All-Cause mortality events by study and antihypertensive class among Blacks
Study Acronym Author Year
CCB BB ACE ARB THZ
N Outcomes N Outcomes N Outcomes N Outcomes N Outcomes
ALLHAT Wright JT (107) 2005 3213 481 (15%) 3210 520 (16.2%) 5369 821 (15.3%) --- Agarwal R (94) 2014 100 4 (4%) 100 4 (4%) AASK Wright Jr. J.T. (45) 2002 217 13 (6%) 441 38 (8.6%) 436 29 (6.7%) --- Sareli P (97) 2001 233 0 (0%) 60 0 (0%) 58 1 (1.7%)
Table 3.8 Cardiovascular mortality outcomes among Blacks by antihypertensive class and study
Study Acronym Author Year
ACE CCB ARB THZ BB
N Outcome N (%) N Outcome
N (%) N Outcome N (%) N Outcome
N (%) N Outcome N (%)
AASK Norris K (46) 2006 436 12 (2.8) 217 7 (3.2) 441 12 (2.7) LIFE Julius S (108) 2004 270 22 (8.1) 263 15 (5.7) ALLHAT Wright (107) 2005 3210 224 (7.0) 3213 215 (6.7) 5369 362 (6.7) - Agarwal (94) 2014 100 3 (3.0) 100 2 (2.0)
Table 3.9 MI outcomes among Blacks by antihypertensive class and study
Study Acronym Author Year
ACE CCB ARB THZ BB
N Outcome N (%) N Outcome
N (%) N Outcome N (%) N Outcome
N (%) N Outcome N (%)
LIFE Julius S (108) 2004 270 13 (4.8) 263 6 (2.3) ALLHAT Wright (107) 2005 3210 260 (8.1) 3213 243 (7.6) 5369 400 (7.5) - Agarwal (94) 2014 100 3 (3.0) 100 2 (2.0)
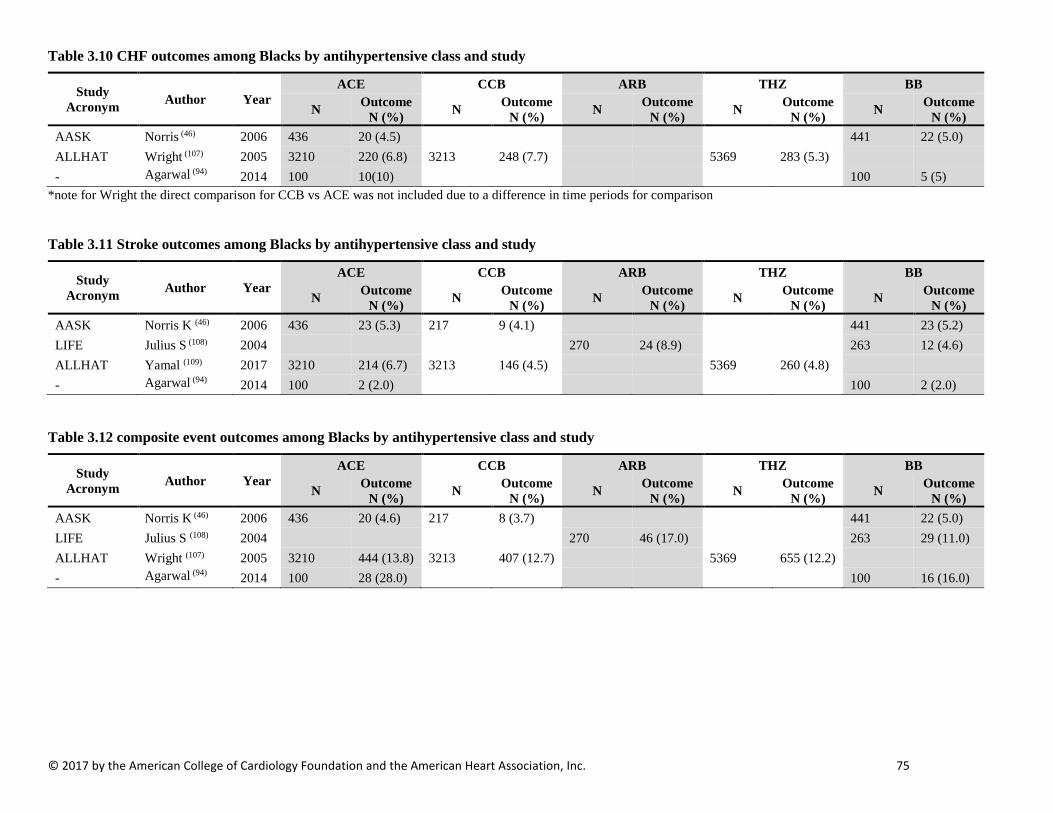
© 2017 by the American College of Cardiology Foundation and the American Heart Association, Inc. 75
Table 3.10 CHF outcomes among Blacks by antihypertensive class and study
Study Acronym Author Year
ACE CCB ARB THZ BB
N Outcome N (%) N Outcome
N (%) N Outcome N (%) N Outcome
N (%) N Outcome N (%)
AASK Norris (46) 2006 436 20 (4.5) 441 22 (5.0) ALLHAT Wright (107) 2005 3210 220 (6.8) 3213 248 (7.7) 5369 283 (5.3) - Agarwal (94) 2014 100 10(10) 100 5 (5)
*note for Wright the direct comparison for CCB vs ACE was not included due to a difference in time periods for comparison
Table 3.11 Stroke outcomes among Blacks by antihypertensive class and study
Study Acronym Author Year
ACE CCB ARB THZ BB
N Outcome N (%) N Outcome
N (%) N Outcome N (%) N Outcome
N (%) N Outcome N (%)
AASK Norris K (46) 2006 436 23 (5.3) 217 9 (4.1) 441 23 (5.2) LIFE Julius S (108) 2004 270 24 (8.9) 263 12 (4.6) ALLHAT Yamal (109) 2017 3210 214 (6.7) 3213 146 (4.5) 5369 260 (4.8) - Agarwal (94) 2014 100 2 (2.0) 100 2 (2.0)
Table 3.12 composite event outcomes among Blacks by antihypertensive class and study
Study Acronym Author Year
ACE CCB ARB THZ BB
N Outcome N (%) N Outcome
N (%) N Outcome N (%) N Outcome
N (%) N Outcome N (%)
AASK Norris K (46) 2006 436 20 (4.6) 217 8 (3.7) 441 22 (5.0) LIFE Julius S (108) 2004 270 46 (17.0) 263 29 (11.0) ALLHAT Wright (107) 2005 3210 444 (13.8) 3213 407 (12.7) 5369 655 (12.2) - Agarwal (94) 2014 100 28 (28.0) 100 16 (16.0)
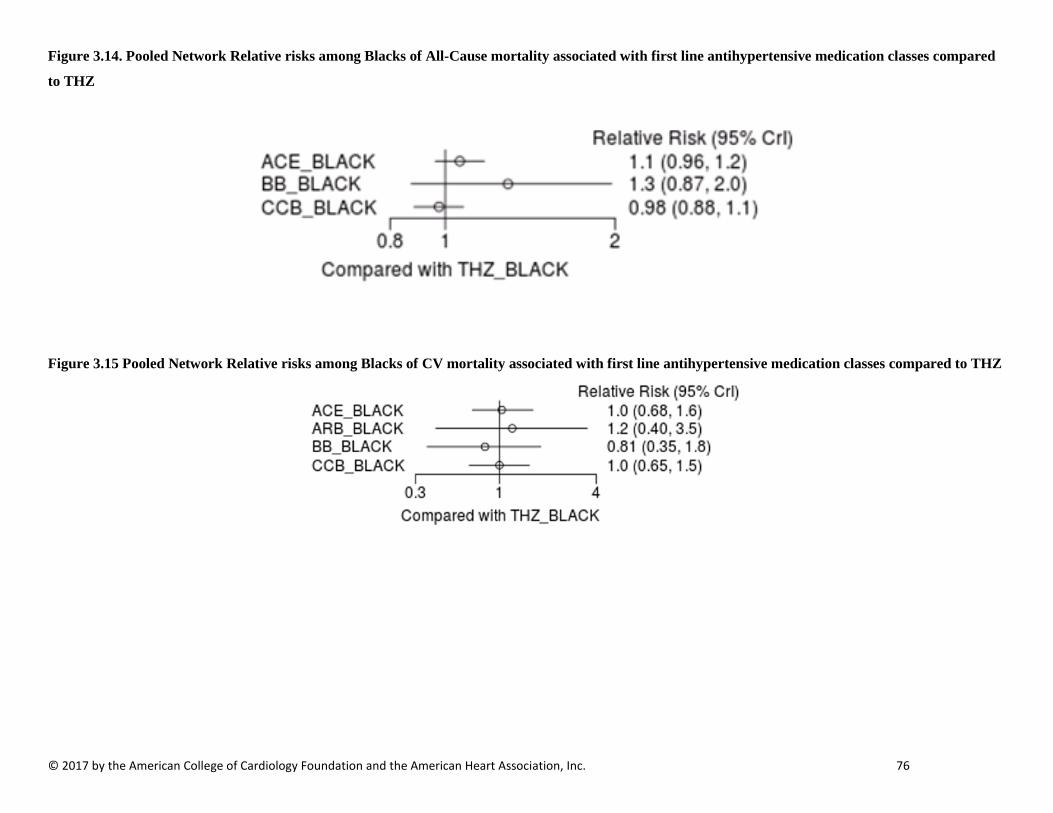
© 2017 by the American College of Cardiology Foundation and the American Heart Association, Inc. 76
Figure 3.14. Pooled Network Relative risks among Blacks of All-Cause mortality associated with first line antihypertensive medication classes compared
to THZ
Figure 3.15 Pooled Network Relative risks among Blacks of CV mortality associated with first line antihypertensive medication classes compared to THZ
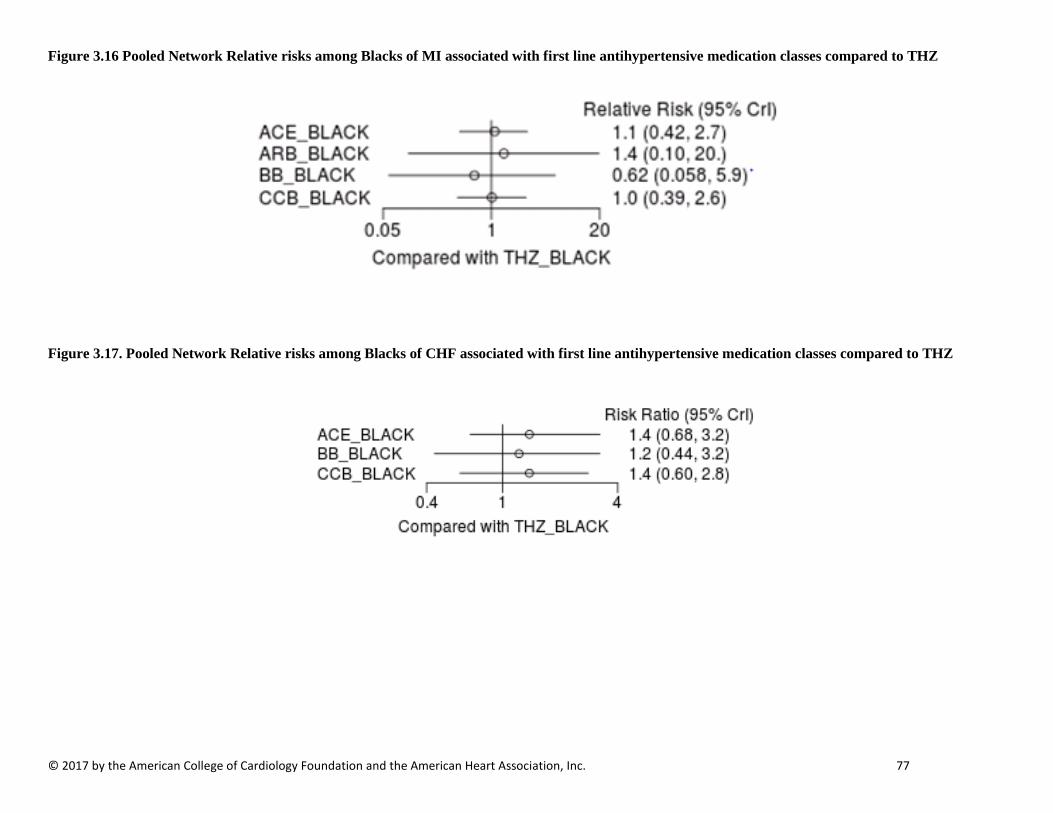
© 2017 by the American College of Cardiology Foundation and the American Heart Association, Inc. 77
Figure 3.16 Pooled Network Relative risks among Blacks of MI associated with first line antihypertensive medication classes compared to THZ
Figure 3.17. Pooled Network Relative risks among Blacks of CHF associated with first line antihypertensive medication classes compared to THZ

© 2017 by the American College of Cardiology Foundation and the American Heart Association, Inc. 78
Figure 3. 18 Pooled Network Relative risks among Blacks of fatal or non-fatal stroke associated with first line antihypertensive medication classes compared to THZ
Figure 3.19 Pooled Network Relative risks among Blacks of CV events associated with first line antihypertensive medication classes compared to THZ

© 2017 by the American College of Cardiology Foundation and the American Heart Association, Inc. 79
ADDITIONAL TABLES NOT REFERENCED IN THE TEXT (BY OUTCOME) FOR PART 3: FIRST-LINE ANTIHYPERTENSIVE DRUG CLASS COMPARISONS IN ADULTS
ALL-CAUSE MORTALITY OUTCOMES
Table 3.13 Relative Treatment Effect of Pairwise Comparisons Expressed as RR (95% Credible Interval) of All-Cause Mortality Associated with Antihypertensive Drug Class Comparisons (read top to left) ACE ARB BB CCB THZ ACE ACE 0.97 (0.86, 1.1) 1.1 (0.96, 1.2) 0.96 (0.88, 1) 0.98 (0.9, 1.1) ARB 1 (0.92, 1.2) ARB 1.1 (0.99, 1.2) 0.98 (0.9, 1.1) 1 (0.9, 1.1) BB 0.94 (0.84, 1) 0.91 (0.82, 1) BB 0.9 (0.82, 0.97) 0.92 (0.83, 1) CCB 1 (0.97, 1.1) 1 (0.93, 1.1) 1.1 ( 1, 1.2) CCB 1 (0.95, 1.1) THZ 1 (0.95, 1.1) 0.99 (0.88, 1.1) 1.1 (0.98, 1.2) 0.97 (0.9, 1.1) THZ
Table 3.14 All-Cause mortality events by study and antihypertensive class among Blacks
Study Acronym Author Year
CCB BB ACE ARB THZ
N Outcomes N Outcomes N Outcomes N Outcomes N Outcomes
ALLHAT Wright JT (107) 2005 3213 481 (15%) 3210 520 (16.2%) 5369 821 (15.3%) Agarwal R (94) 2014 100 4 (4%) 100 4 (4%) AASK Wright Jr. J.T. (45) 2002 217 13 (6%) 441 38 (8.6%) 436 29 (6.7%) - Sareli P (97) 2001 233 0 (0%) 60 0 (0%) 58 1 (1.7%) Table 3.15 Relative Treatment Effect of the Pooled Network Comparisons Among Blacks Expressed as RR (95% Credible Interval) of All-Cause Mortality Associated with Antihypertensive Drug Class Comparisons
ACE_BLACK BB_BLACK CCB_BLACK THZ_BLACK ACE_BLACK ACE_BLACK 1.22 (0.824, 1.85) 0.918 (0.819, 1.02) 0.942 (0.852, 1.04) BB_BLACK 0.82 (0.539, 1.21) BB_BLACK 0.754 (0.493, 1.12) 0.774 (0.507, 1.15)
CCB_BLACK 1.09 (0.977, 1.22) 1.33 (0.891, 2.03) CCB_BLACK 1.03 (0.927, 1.14) THZ_BLACK 1.06 (0.961, 1.17) 1.29 (0.87, 1.97) 0.976 (0.881, 1.08) THZ_BLACK

© 2017 by the American College of Cardiology Foundation and the American Heart Association, Inc. 80
Table 3.16 All-Cause mortality events by study and antihypertensive class among Men
Study Acronym Author Year
CCB BB ACE ARB THZ
N Outcomes N Outcomes N Outcomes N Outcomes N Outcomes
ALLHAT Oparil (110) 2013 4768 763 (16%) 4867 797 (16.4%) 8084 1345 (16.6%)
MRC Mild MRC Working Group (86) 1985 2285 75 (3.3%) 2238 82 (3.7%)
LIFE Os (111) 2008 2112 224 (10.6%) 2118 224 (10.6%) HAPPHY Wilhelmsen (78) 1987 3297 285 (8.6%) 3272 299 (9.1%)
Table 3.17 Relative Treatment Effect of the Pooled Network Comparisons Among Men Expressed as RR (95% Credible Interval) of All-Cause Mortality Associated with Antihypertensive Drug Class Comparisons
ACE_MALE ARB_MALE BB_MALE CCB_MALE THZ_MALE ACE_MALE ACE_MALE 0.96 (0.7, 1.3) 0.95 (0.77, 1.2) 0.97 (0.83, 1.1) 1 (0.87, 1.2) ARB_MALE 1 (0.77, 1.4) ARB_MALE 1 (0.8, 1.2) 1 (0.75, 1.4) 1.1 (0.81, 1.4) BB_MALE 1 (0.83, 1.3) 1 (0.81, 1.2) BB_MALE 1 (0.82, 1.3) 1.1 (0.9, 1.3)
CCB_MALE 1 (0.87, 1.2) 0.99 (0.72, 1.3) 0.98 (0.78, 1.2) CCB_MALE 1 (0.89, 1.2) THZ_MALE 0.99 (0.85, 1.1) 0.95 (0.72, 1.2) 0.94 (0.79, 1.1) 0.96 (0.83, 1.1) THZ_MALE
Figure 3.20 Pooled Network Relative risks among Men of All-Cause mortality associated with first line antihypertensive medication classes compared to THZ

© 2017 by the American College of Cardiology Foundation and the American Heart Association, Inc. 81
Table 3.18 All-Cause mortality events by study and antihypertensive class among Women
Study Acronym Author Year
CCB BB ACE ARB THZ
N Outcomes N Outcomes N Outcomes N Outcomes N Outcomes
ALLHAT Oparil (110) 2013 4280 491 (11.5%) 4187 499 (11.9%) 7171 867 (12.1%) LIFE Os (111) 2008 2476 207 (8.4%) 2487 159 (6.4%)
MRC Mild MRC Working Party (86) 1985 2118 45 (2.1%) 2059 46 (2.1%)
Table 3.19 Relative Treatment Effect of the Pooled Network Comparisons Among Women Expressed as RR (95% Credible Interval) of All-Cause Mortality Associated with Antihypertensive Drug Class Comparisons
ACE_FEMALE ARB_FEMALE BB_FEMALE CCB_FEMALE THZ_FEMALE ACE_FEMALE ACE_FEMALE 0.76 (0.37, 1.6) 0.98 (0.54, 1.9) 0.96 (0.67, 1.4) 1 (0.72, 1.4) ARB_FEMALE 1.3 (0.64, 2.7) ARB_FEMALE 1.3 (0.89, 1.9) 1.3 (0.62, 2.5) 1.3 (0.71, 2.5) BB_FEMALE 1 (0.54, 1.9) 0.77 (0.53, 1.1) BB_FEMALE 0.97 (0.52, 1.8) 1 (0.62, 1.7)
CCB_FEMALE 1 (0.74, 1.5) 0.79 (0.39, 1.6) 1 (0.55, 1.9) CCB_FEMALE 1.1 (0.74, 1.5) THZ_FEMALE 0.99 (0.7, 1.4) 0.75 (0.4, 1.4) 0.98 (0.58, 1.6) 0.95 (0.66, 1.3) THZ_FEMALE
Figure 3.21 Pooled Network Relative risks among Women of All-Cause mortality associated with first line antihypertensive medication classes compared to THZ
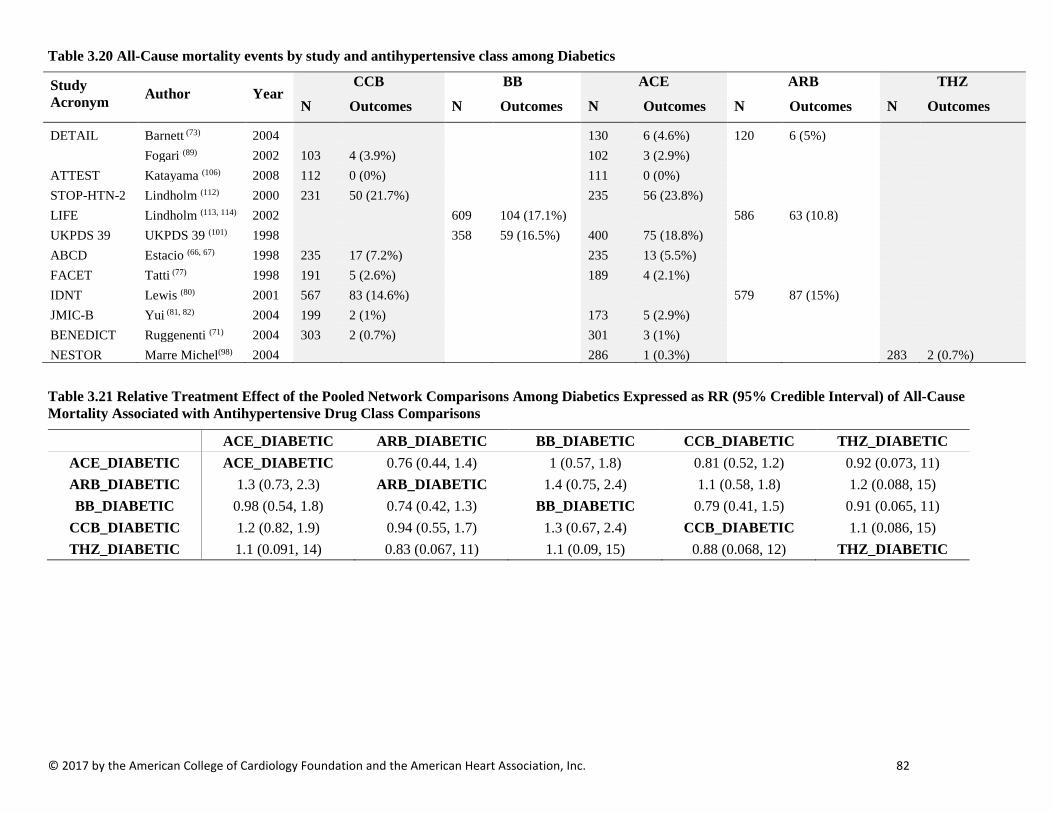
© 2017 by the American College of Cardiology Foundation and the American Heart Association, Inc. 82
Table 3.20 All-Cause mortality events by study and antihypertensive class among Diabetics
Study Acronym Author Year
CCB BB ACE ARB THZ
N Outcomes N Outcomes N Outcomes N Outcomes N Outcomes
DETAIL Barnett (73) 2004 130 6 (4.6%) 120 6 (5%) Fogari (89) 2002 103 4 (3.9%) 102 3 (2.9%) ATTEST Katayama (106) 2008 112 0 (0%) 111 0 (0%) STOP-HTN-2 Lindholm (112) 2000 231 50 (21.7%) 235 56 (23.8%) LIFE Lindholm (113, 114) 2002 609 104 (17.1%) 586 63 (10.8) UKPDS 39 UKPDS 39 (101) 1998 358 59 (16.5%) 400 75 (18.8%) ABCD Estacio (66, 67) 1998 235 17 (7.2%) 235 13 (5.5%) FACET Tatti (77) 1998 191 5 (2.6%) 189 4 (2.1%) IDNT Lewis (80) 2001 567 83 (14.6%) 579 87 (15%) JMIC-B Yui (81, 82) 2004 199 2 (1%) 173 5 (2.9%) BENEDICT Ruggenenti (71) 2004 303 2 (0.7%) 301 3 (1%) NESTOR Marre Michel(98) 2004 286 1 (0.3%) 283 2 (0.7%)
Table 3.21 Relative Treatment Effect of the Pooled Network Comparisons Among Diabetics Expressed as RR (95% Credible Interval) of All-Cause Mortality Associated with Antihypertensive Drug Class Comparisons
ACE_DIABETIC ARB_DIABETIC BB_DIABETIC CCB_DIABETIC THZ_DIABETIC ACE_DIABETIC ACE_DIABETIC 0.76 (0.44, 1.4) 1 (0.57, 1.8) 0.81 (0.52, 1.2) 0.92 (0.073, 11) ARB_DIABETIC 1.3 (0.73, 2.3) ARB_DIABETIC 1.4 (0.75, 2.4) 1.1 (0.58, 1.8) 1.2 (0.088, 15) BB_DIABETIC 0.98 (0.54, 1.8) 0.74 (0.42, 1.3) BB_DIABETIC 0.79 (0.41, 1.5) 0.91 (0.065, 11)
CCB_DIABETIC 1.2 (0.82, 1.9) 0.94 (0.55, 1.7) 1.3 (0.67, 2.4) CCB_DIABETIC 1.1 (0.086, 15) THZ_DIABETIC 1.1 (0.091, 14) 0.83 (0.067, 11) 1.1 (0.09, 15) 0.88 (0.068, 12) THZ_DIABETIC
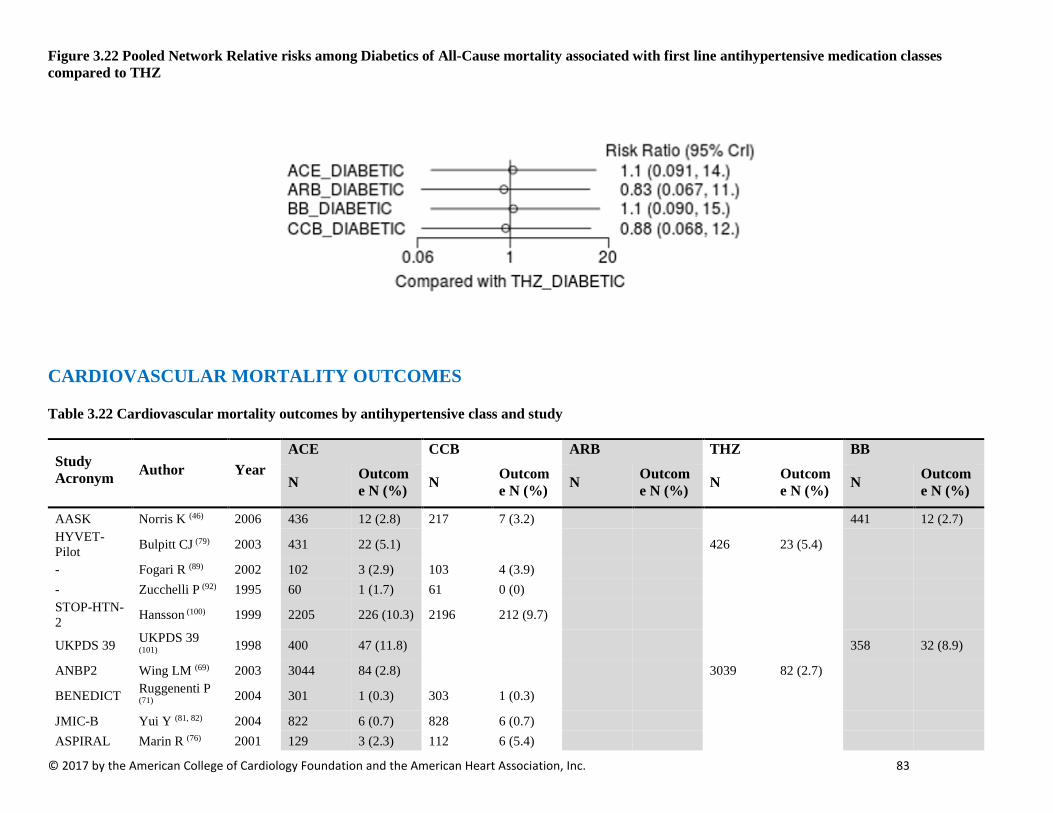
© 2017 by the American College of Cardiology Foundation and the American Heart Association, Inc. 83
Figure 3.22 Pooled Network Relative risks among Diabetics of All-Cause mortality associated with first line antihypertensive medication classes compared to THZ
CARDIOVASCULAR MORTALITY OUTCOMES
Table 3.22 Cardiovascular mortality outcomes by antihypertensive class and study
Study Acronym Author Year
ACE CCB ARB THZ BB
N Outcome N (%) N Outcom
e N (%) N Outcome N (%) N Outcom
e N (%) N Outcome N (%)
AASK Norris K (46) 2006 436 12 (2.8) 217 7 (3.2) 441 12 (2.7) HYVET-Pilot Bulpitt CJ (79) 2003 431 22 (5.1) 426 23 (5.4)
- Fogari R (89) 2002 102 3 (2.9) 103 4 (3.9) - Zucchelli P (92) 1995 60 1 (1.7) 61 0 (0) STOP-HTN-2 Hansson (100) 1999 2205 226 (10.3) 2196 212 (9.7)
UKPDS 39 UKPDS 39 (101) 1998 400 47 (11.8) 358 32 (8.9)
ANBP2 Wing LM (69) 2003 3044 84 (2.8) 3039 82 (2.7)
BENEDICT Ruggenenti P (71) 2004 301 1 (0.3) 303 1 (0.3)
JMIC-B Yui Y (81, 82) 2004 822 6 (0.7) 828 6 (0.7) ASPIRAL Marin R (76) 2001 129 3 (2.3) 112 6 (5.4)

© 2017 by the American College of Cardiology Foundation and the American Heart Association, Inc. 84
- Agarwal (94) 2014 100 3 (3.0) 100 2 (2.0)
ALLHAT ALLHAT Res Grp (68) 2002 9054 618 (6.8) 9048 603 (6.7) 15255 996 (6.5)
DETAIL Barnett AH (73) 2004 130 2 (1.5) 120 3 (2.5) ASCOT-BPLA Dahlof B (70) 2005 9639 263 (2.7) 4605 204 (4.4) 9618 342 (3.6)
IDNT Berl T. (115) 2003 567 37 (6.5) 579 52 (8.9) ELSA Zanchetti (74) 2002 1177 4 (0.3) 1157 8 (0.7) J-RHYTHM II
Yamashita T (116) 2001 160 0 (0) 158 0 (0.0)
- Du Y (117) 2013 75 0 (0) 74 0 (0.0)
NICS-EH Kuramoto K (118) 1999 204 2 (1.0) 210 0 (0.0)
VHAS Rosei EA (104) 1997 707 5 (0.7) 707 4 (0.6)
HAPPHY Wilhelmsen L (78) 1987 3272 60 (1.8) 3297 57 (1.7)
MRC MRC Working Party (86) 1985 4297 69 (1.6) 4403 65 (1.5)
LIFE Dahlof (83) 2002 4605 204 (4.4) 4588 234 (5.1) INSIGHT Brown (88) 2000 3157 153 (4.8) 3164 152 (4.8)
MRC-old MRC Working Party (87) 1992 1081 134 (12.4) 1102 167 (15.2)

© 2017 by the American College of Cardiology Foundation and the American Heart Association, Inc. 85
Table 3.23 Cardiovascular mortality outcomes among Blacks by antihypertensive class and study
Study Acronym Author Year
ACE CCB ARB THZ BB
N Outcome N (%) N Outcome
N (%) N Outcome N (%) N Outcome
N (%) N Outcome N (%)
AASK Norris K (46) 2006 436 12 (2.8) 217 7 (3.2) 441 12 (2.7) LIFE Julius S (108) 2004 270 22 (8.1) 263 15 (5.7) ALLHAT Wright (107) 2005 3210 224 (7.0) 3213 215 (6.7) 5369 362 (6.7) - Agarwal (94) 2014 100 3 (3.0) 100 2 (2.0)
Table 3.24 Relative Treatment Effect of the Pooled Network Comparisons Among Blacks Expressed as RR (95% Credible Interval) of CV Mortality Associated with Antihypertensive Drug Class Comparisons
ACE_BLACK ARB_BLACK BB_BLACK CCB_BLACK THZ_BLACK ACE_BLACK ACE_BLACK 1.17 (0.421, 3.27) 0.785 (0.365, 1.58) 0.971 (0.658, 1.41) 0.968 (0.618, 1.48) ARB_BLACK 0.855 (0.306, 2.38) ARB_BLACK 0.675 (0.325, 1.44) 0.831 (0.292, 2.45) 0.833 (0.284, 2.49) BB_BLACK 1.27 (0.634, 2.74) 1.48 (0.695, 3.07) BB_BLACK 1.23 (0.587, 2.78) 1.23 (0.552, 2.83) CCB_BLACK 1.03 (0.708, 1.52) 1.2 (0.408, 3.42) 0.811 (0.359, 1.7) CCB_BLACK 1 (0.651, 1.55) THZ_BLACK 1.03 (0.677, 1.62) 1.2 (0.401, 3.53) 0.812 (0.353, 1.81) 0.999 (0.647, 1.54) THZ_BLACK
Table 3.25 CV mortality events by study and antihypertensive class among Men
Study Acronym Author Year
ACE CCB ARB THZ BB
N Outcome N (%) N Outcome
N (%) N Outcome N (%) N Outcome
N (%) N Outcome N (%)
HAPPY Wilhelmsen (78) 1987 3272 60 (1.8) 3297 57 (1.7)
LIFE Os (111) 2008 2118 116 (5.5) 2112 130 (6.2) ALLHAT Oparil (110) 2013 4867 362 (7.4) 4768 370 (7.8) 8084 581 (7.2)
Table 3.26 Relative Treatment Effect of the Pooled Network Comparisons Among Men Expressed as RR (95% Credible Interval) of CV Mortality Associated with Antihypertensive Drug Class Comparisons
ACE_MALE ARB_MALE BB_MALE CCB_MALE THZ_MALE ACE_MALE ACE_MALE 0.82 (0.49, 1.4) 0.91 (0.6, 1.4) 1 (0.85, 1.3) 0.96 (0.8, 1.2) ARB_MALE 1.2 (0.74, 2) ARB_MALE 1.1 (0.85, 1.5) 1.3 (0.76, 2.1) 1.2 (0.73, 1.9) BB_MALE 1.1 (0.72, 1.7) 0.9 (0.68, 1.2) BB_MALE 1.1 (0.74, 1.7) 1.1 (0.73, 1.5) CCB_MALE 0.96 (0.79, 1.2) 0.79 (0.48, 1.3) 0.88 (0.58, 1.4) CCB_MALE 0.93 (0.77, 1.1) THZ_MALE 1 (0.85, 1.2) 0.85 (0.53, 1.4) 0.95 (0.66, 1.4) 1.1 (0.89, 1.3) THZ_MALE
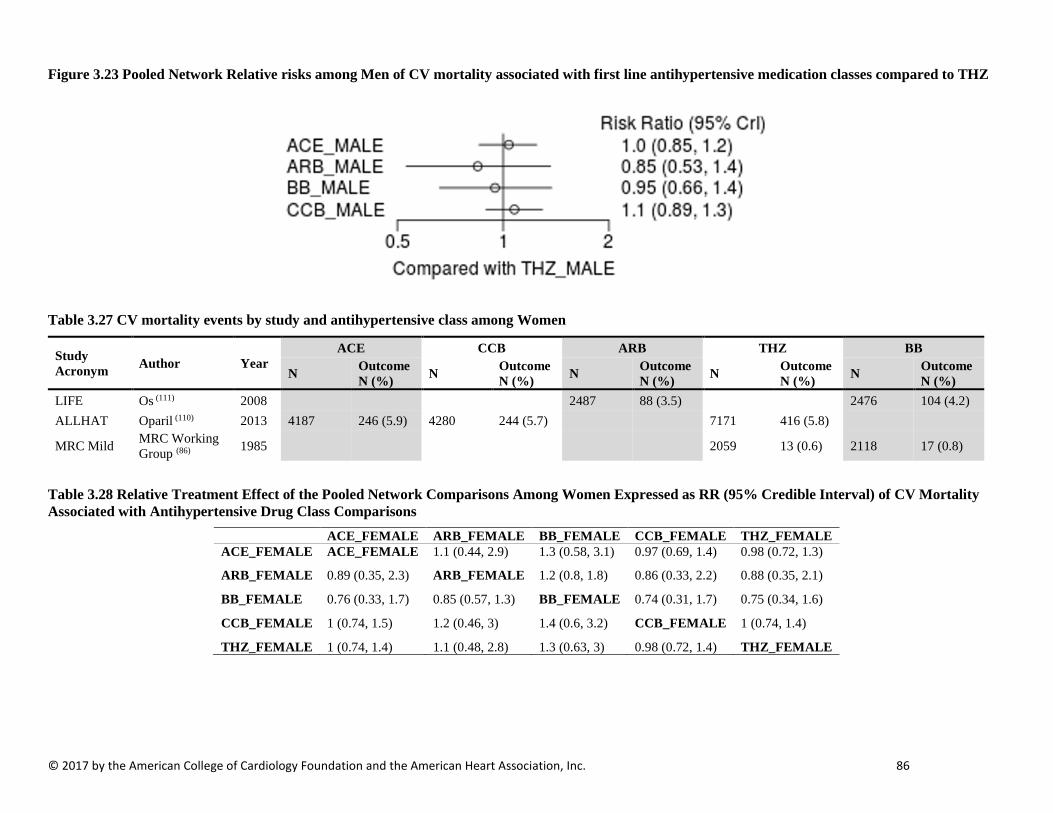
© 2017 by the American College of Cardiology Foundation and the American Heart Association, Inc. 86
Figure 3.23 Pooled Network Relative risks among Men of CV mortality associated with first line antihypertensive medication classes compared to THZ
Table 3.27 CV mortality events by study and antihypertensive class among Women
Study Acronym Author Year
ACE CCB ARB THZ BB
N Outcome N (%) N Outcome
N (%) N Outcome N (%) N Outcome
N (%) N Outcome N (%)
LIFE Os (111) 2008 2487 88 (3.5) 2476 104 (4.2) ALLHAT Oparil (110) 2013 4187 246 (5.9) 4280 244 (5.7) 7171 416 (5.8)
MRC Mild MRC Working Group (86) 1985 2059 13 (0.6) 2118 17 (0.8)
Table 3.28 Relative Treatment Effect of the Pooled Network Comparisons Among Women Expressed as RR (95% Credible Interval) of CV Mortality Associated with Antihypertensive Drug Class Comparisons
ACE_FEMALE ARB_FEMALE BB_FEMALE CCB_FEMALE THZ_FEMALE ACE_FEMALE ACE_FEMALE 1.1 (0.44, 2.9) 1.3 (0.58, 3.1) 0.97 (0.69, 1.4) 0.98 (0.72, 1.3)
ARB_FEMALE 0.89 (0.35, 2.3) ARB_FEMALE 1.2 (0.8, 1.8) 0.86 (0.33, 2.2) 0.88 (0.35, 2.1)
BB_FEMALE 0.76 (0.33, 1.7) 0.85 (0.57, 1.3) BB_FEMALE 0.74 (0.31, 1.7) 0.75 (0.34, 1.6)
CCB_FEMALE 1 (0.74, 1.5) 1.2 (0.46, 3) 1.4 (0.6, 3.2) CCB_FEMALE 1 (0.74, 1.4)
THZ_FEMALE 1 (0.74, 1.4) 1.1 (0.48, 2.8) 1.3 (0.63, 3) 0.98 (0.72, 1.4) THZ_FEMALE

© 2017 by the American College of Cardiology Foundation and the American Heart Association, Inc. 87
Figure 3.24 Pooled Network Relative risks among Women of CV mortality associated with first line antihypertensive medication classes compared to THZ
Table 3.29 CV mortality events by study and antihypertensive class among persons with Diabetes
Study Acronym Author Year
ACE CCB ARB THZ BB
N Outcome N (%) N Outcome N (%) N Outcome N (%) N Outcome N (%) N Outcome N (%)
DETAIL Barnett (73) 2004 130 2 (1.5) 120 3 (2.5) -- Fogari (89) 2002 102 3 (2.9) 103 4 (3.9)
STOP-HTN-2 Lindholm (112) 2000 235 39 (16.6) 231 33 (14.3)
LIFE Lindholm (113, 114) 2002 586 38 (6.5) 609 61 (10.0) UKPDS UKPDS 39 (101) 1998 400 47 (11.8) 358 32 (8.9) IDNT Berl (115) 2003 567 37 (6.5) 579 52 (9.0) JMIC-B Yui (81, 82) 2004 173 3 (1.7) 199 1 (0.5) BENEDICT Ruggenenti (71) 2004 301 1 (0.3) 303 1 (0.3) ABCD Estacio (66, 67) 1998

© 2017 by the American College of Cardiology Foundation and the American Heart Association, Inc. 88
Table 3.30 Relative Treatment Effect of the Pooled Network Comparisons Among Persons with Diabetes Expressed as RR (95% Credible Interval) of CV Mortality Associated with Antihypertensive Drug Class Comparisons
ACE_DIABETIC ARB_DIABETIC BB_DIABETIC CCB_DIABETIC ACE_DIABETIC ACE_DIABETIC 0.86 (0.36, 2.2) 1 (0.41, 2.5) 0.78 (0.41, 1.5) ARB_DIABETIC 1.2 (0.46, 2.8) ARB_DIABETIC 1.2 (0.47, 2.9) 0.9 (0.36, 2.2) BB_DIABETIC 1 (0.39, 2.4) 0.87 (0.35, 2.1) BB_DIABETIC 0.78 (0.28, 2.1)
CCB_DIABETIC 1.3 (0.67, 2.4) 1.1 (0.46, 2.7) 1.3 (0.47, 3.6) CCB_DIABETIC
Figure 3.25 Pooled Network Relative risks among Persons with Diabetes of CV mortality associated with first line antihypertensive medication classes compared to THZ
MYOCARDIAL INFARCTION OUTCOMES
Table 3.31 Myocardial Infarction events by study and antihypertensive class
Study Acronym Author Year
CCB BB ACE ARB THZ N Outcomes N Outcomes N Outcomes N Outcomes N Outcomes
DETAIL Barnett (73) 2004 130 2 (1.5%) 120 1 (0.8%) Fogari (89) 2002 103 1 (1.9%) 102 1 (1.0%) STOP-HTN-2 Hansson (100) 1999 2,196 59 (2.7%) 2,205 48 (2.2%) ALPINE Lindholm (119) 2003 196 1 (0.5%) 196 1 (0.5%) VALUE Julius (102) 2004 7,596 313 (4.1%) 7,649 369 (4.8%) UKPDS UKPDS (101) 1998 358 46 (12.9%) 400 61 (15.3%) ANBP2 Wing (69) 2003 3,044 58 (1.9%) 3,039 82 (2.7%) LIFE Dahlof (83) 2002 4,588 188 (4.1%) 4,605 198 (4.3%) FACET Tatti (77) 1998 191 13 (6.8%) 189 10 (5.4%) IDNT Berl (115) 2003 567 27 (4.8%) 579 44 (7.6%)

© 2017 by the American College of Cardiology Foundation and the American Heart Association, Inc. 89
Estacio (66) 1998 235 25 (10.6%) 235 5 (2.1%) PHYLISS Zanchetti (120) 2004 127 0 (0%) 127 3 (2.4%) HAPPHY Wilhelmsen (78) 1987 3,297 84 (2.5%) 3,272 75 (2.3%) JMIC-B Yui (82) 2004 828 16 (1.9%) 822 13 (1.6%) J-MIND Baba (121) 2001 228 1 (0.4%) 208 1 (0.5%) CORD IB Spinar (72) 2009 1,926 4 (0.2%) 1,887 3 (0.2%) ESPIRAL Marin (76) 2001 112 1 (0.9%) 129 2 (1.6%) ASCOT-BPLA Collier (122) 2011 9,639 390 (4.0%) 9,618 444 (4.6%) J-RHYTHM II Yamashita (116) 2011 160 0 (0%) 158 0 (0%) VART Narumi (103) 2011 511 1 (0.2%) 510 2 (0.4%) Agarwal (94) 2014 100 2 (2%) 100 3 (3%) SHELL Malacco (99) 2003 942 12 (1.3%) 940 14 (1.5%) Du (117) 2013 75 0 (0%) 74 0 (0%)
ALLHAT ALLHAT Res Grp (68) 2002 9,048 798 (8.8%) 9,054 796 (8.8%) 15,255 1,362 (8.9%)
MIDAS Borhani (105) 1996 442 6 (1.4%) 441 5 (1.1%) NICS-EH Kuramoto (118) 1999 204 2 (1.0%) 210 2 (1.0%) INSIGHT Brown (88) 2000 3157 16 (0.51%) 3164 5 (0.16%)
MRC old* MRC Working Party (87) 1992 1102 80 (7.3%) 1081 48 (4.4%)
ELSA Zanchetti (74) 2002 1,177 18 (1.5%) 1,157 17 (1.5%) *included all CHD event
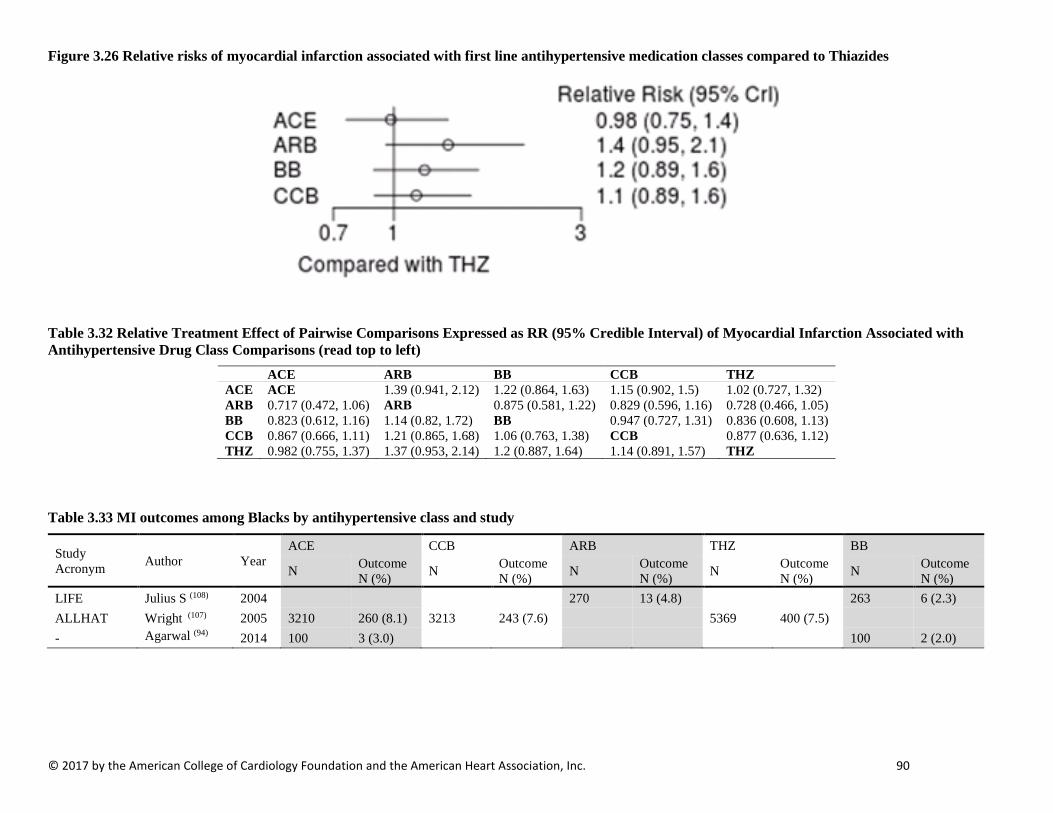
© 2017 by the American College of Cardiology Foundation and the American Heart Association, Inc. 90
Figure 3.26 Relative risks of myocardial infarction associated with first line antihypertensive medication classes compared to Thiazides
Table 3.32 Relative Treatment Effect of Pairwise Comparisons Expressed as RR (95% Credible Interval) of Myocardial Infarction Associated with Antihypertensive Drug Class Comparisons (read top to left)
ACE ARB BB CCB THZ ACE ACE 1.39 (0.941, 2.12) 1.22 (0.864, 1.63) 1.15 (0.902, 1.5) 1.02 (0.727, 1.32) ARB 0.717 (0.472, 1.06) ARB 0.875 (0.581, 1.22) 0.829 (0.596, 1.16) 0.728 (0.466, 1.05) BB 0.823 (0.612, 1.16) 1.14 (0.82, 1.72) BB 0.947 (0.727, 1.31) 0.836 (0.608, 1.13) CCB 0.867 (0.666, 1.11) 1.21 (0.865, 1.68) 1.06 (0.763, 1.38) CCB 0.877 (0.636, 1.12) THZ 0.982 (0.755, 1.37) 1.37 (0.953, 2.14) 1.2 (0.887, 1.64) 1.14 (0.891, 1.57) THZ
Table 3.33 MI outcomes among Blacks by antihypertensive class and study
Study Acronym Author Year
ACE CCB ARB THZ BB
N Outcome N (%) N Outcome
N (%) N Outcome N (%) N Outcome
N (%) N Outcome N (%)
LIFE Julius S (108) 2004 270 13 (4.8) 263 6 (2.3) ALLHAT Wright (107) 2005 3210 260 (8.1) 3213 243 (7.6) 5369 400 (7.5) - Agarwal (94) 2014 100 3 (3.0) 100 2 (2.0)
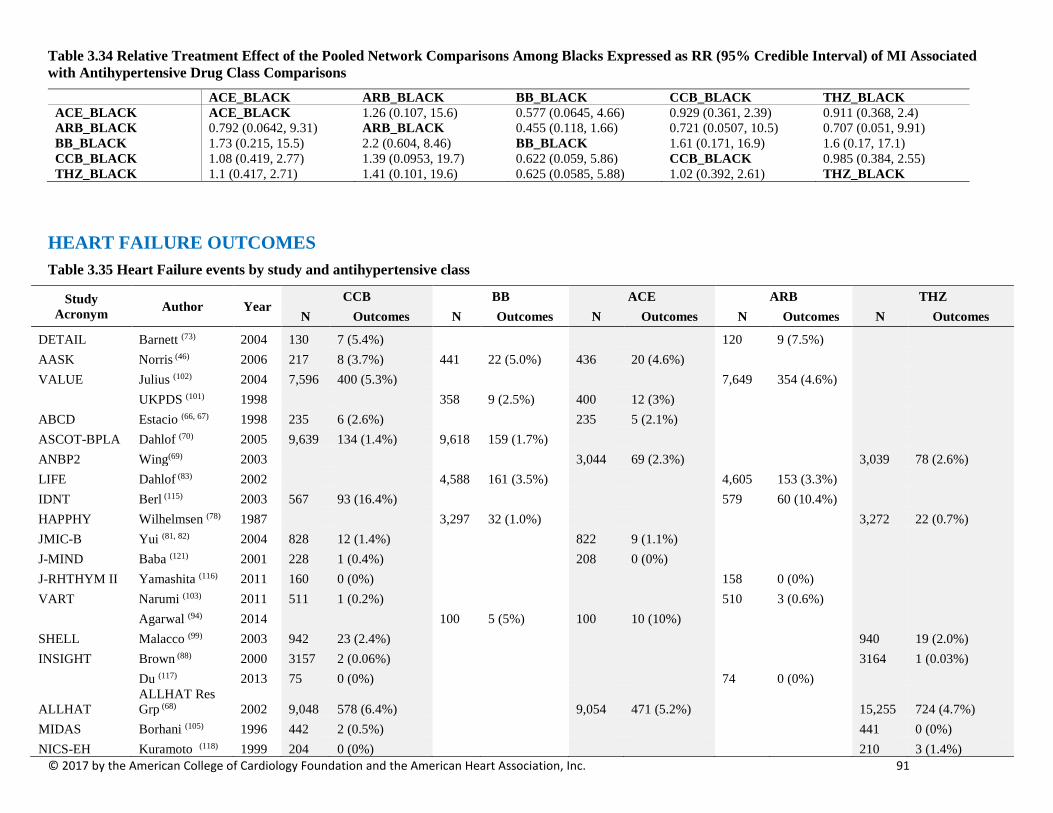
© 2017 by the American College of Cardiology Foundation and the American Heart Association, Inc. 91
Table 3.34 Relative Treatment Effect of the Pooled Network Comparisons Among Blacks Expressed as RR (95% Credible Interval) of MI Associated with Antihypertensive Drug Class Comparisons
ACE_BLACK ARB_BLACK BB_BLACK CCB_BLACK THZ_BLACK ACE_BLACK ACE_BLACK 1.26 (0.107, 15.6) 0.577 (0.0645, 4.66) 0.929 (0.361, 2.39) 0.911 (0.368, 2.4) ARB_BLACK 0.792 (0.0642, 9.31) ARB_BLACK 0.455 (0.118, 1.66) 0.721 (0.0507, 10.5) 0.707 (0.051, 9.91) BB_BLACK 1.73 (0.215, 15.5) 2.2 (0.604, 8.46) BB_BLACK 1.61 (0.171, 16.9) 1.6 (0.17, 17.1) CCB_BLACK 1.08 (0.419, 2.77) 1.39 (0.0953, 19.7) 0.622 (0.059, 5.86) CCB_BLACK 0.985 (0.384, 2.55) THZ_BLACK 1.1 (0.417, 2.71) 1.41 (0.101, 19.6) 0.625 (0.0585, 5.88) 1.02 (0.392, 2.61) THZ_BLACK
HEART FAILURE OUTCOMES Table 3.35 Heart Failure events by study and antihypertensive class
Study Acronym Author Year
CCB BB ACE ARB THZ N Outcomes N Outcomes N Outcomes N Outcomes N Outcomes
DETAIL Barnett (73) 2004 130 7 (5.4%) 120 9 (7.5%) AASK Norris (46) 2006 217 8 (3.7%) 441 22 (5.0%) 436 20 (4.6%) VALUE Julius (102) 2004 7,596 400 (5.3%) 7,649 354 (4.6%) UKPDS (101) 1998 358 9 (2.5%) 400 12 (3%) ABCD Estacio (66, 67) 1998 235 6 (2.6%) 235 5 (2.1%) ASCOT-BPLA Dahlof (70) 2005 9,639 134 (1.4%) 9,618 159 (1.7%) ANBP2 Wing(69) 2003 3,044 69 (2.3%) 3,039 78 (2.6%) LIFE Dahlof (83) 2002 4,588 161 (3.5%) 4,605 153 (3.3%) IDNT Berl (115) 2003 567 93 (16.4%) 579 60 (10.4%) HAPPHY Wilhelmsen (78) 1987 3,297 32 (1.0%) 3,272 22 (0.7%) JMIC-B Yui (81, 82) 2004 828 12 (1.4%) 822 9 (1.1%) J-MIND Baba (121) 2001 228 1 (0.4%) 208 0 (0%) J-RHTHYM II Yamashita (116) 2011 160 0 (0%) 158 0 (0%) VART Narumi (103) 2011 511 1 (0.2%) 510 3 (0.6%) Agarwal (94) 2014 100 5 (5%) 100 10 (10%) SHELL Malacco (99) 2003 942 23 (2.4%) 940 19 (2.0%) INSIGHT Brown (88) 2000 3157 2 (0.06%) 3164 1 (0.03%) Du (117) 2013 75 0 (0%) 74 0 (0%)
ALLHAT ALLHAT Res Grp (68) 2002 9,048 578 (6.4%) 9,054 471 (5.2%) 15,255 724 (4.7%)
MIDAS Borhani (105) 1996 442 2 (0.5%) 441 0 (0%) NICS-EH Kuramoto (118) 1999 204 0 (0%) 210 3 (1.4%)
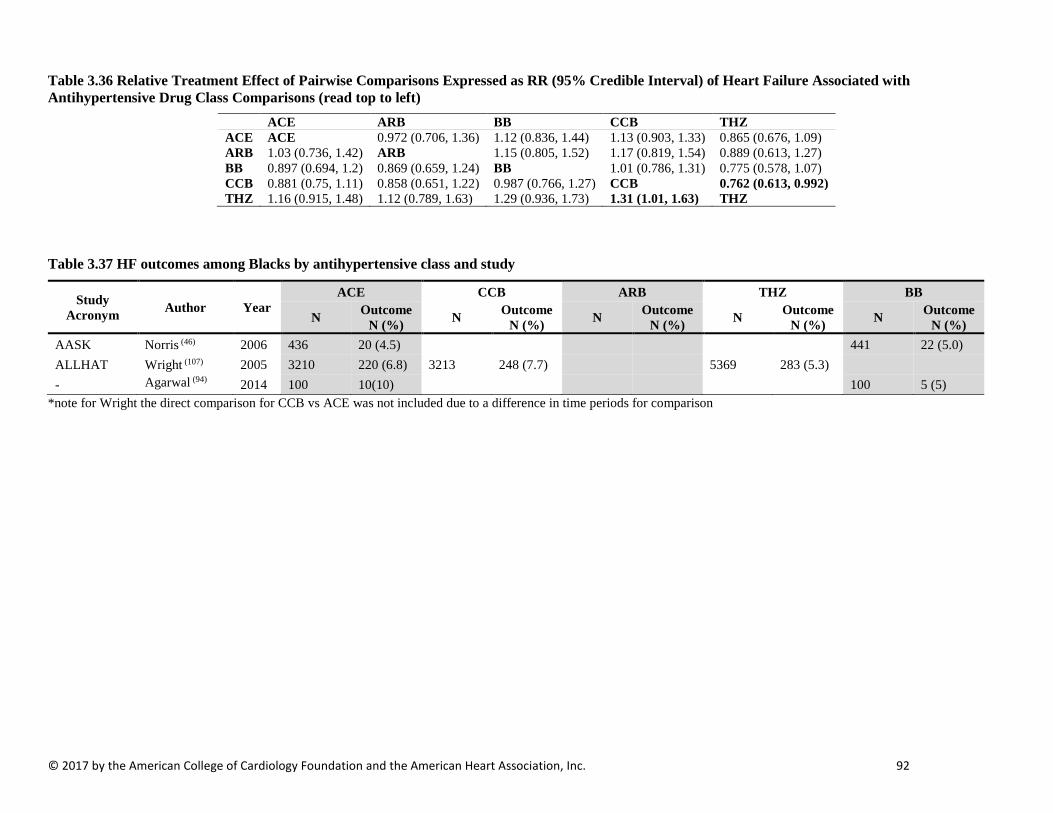
© 2017 by the American College of Cardiology Foundation and the American Heart Association, Inc. 92
Table 3.36 Relative Treatment Effect of Pairwise Comparisons Expressed as RR (95% Credible Interval) of Heart Failure Associated with Antihypertensive Drug Class Comparisons (read top to left)
ACE ARB BB CCB THZ ACE ACE 0.972 (0.706, 1.36) 1.12 (0.836, 1.44) 1.13 (0.903, 1.33) 0.865 (0.676, 1.09) ARB 1.03 (0.736, 1.42) ARB 1.15 (0.805, 1.52) 1.17 (0.819, 1.54) 0.889 (0.613, 1.27) BB 0.897 (0.694, 1.2) 0.869 (0.659, 1.24) BB 1.01 (0.786, 1.31) 0.775 (0.578, 1.07) CCB 0.881 (0.75, 1.11) 0.858 (0.651, 1.22) 0.987 (0.766, 1.27) CCB 0.762 (0.613, 0.992) THZ 1.16 (0.915, 1.48) 1.12 (0.789, 1.63) 1.29 (0.936, 1.73) 1.31 (1.01, 1.63) THZ
Table 3.37 HF outcomes among Blacks by antihypertensive class and study
Study Acronym Author Year
ACE CCB ARB THZ BB
N Outcome N (%) N Outcome
N (%) N Outcome N (%) N Outcome
N (%) N Outcome N (%)
AASK Norris (46) 2006 436 20 (4.5) 441 22 (5.0) ALLHAT Wright (107) 2005 3210 220 (6.8) 3213 248 (7.7) 5369 283 (5.3) - Agarwal (94) 2014 100 10(10) 100 5 (5)
*note for Wright the direct comparison for CCB vs ACE was not included due to a difference in time periods for comparison

© 2017 by the American College of Cardiology Foundation and the American Heart Association, Inc. 93
Table 3.38 Relative Treatment Effect of the Pooled Network Comparisons Among Blacks Expressed as RR (95% Credible Interval) of HF Associated with Antihypertensive Drug Class Comparisons
ACE_BLACK BB_BLACK CCB_BLACK THZ_BLACK ACE_BLACK ACE_BLACK 0.87 (0.4, 1.7) 1 (0.47, 1.7) 0.72 (0.31, 1.5) BB_BLACK 1.1 (0.59, 2.5) BB_BLACK 1.1 (0.48, 2.5) 0.82 (0.31, 2.3) CCB_BLACK 1 (0.6, 2.1) 0.89 (0.4, 2.1) CCB_BLACK 0.72 (0.36, 1.7) THZ_BLACK 1.4 (0.68, 3.2) 1.2 (0.44, 3.2) 1.4 (0.6, 2.8) THZ_BLACK
Table 3.39 HF events by study and antihypertensive class among Men
Study Acronym Author Year
CCB BB ACE ARB THZ N Outcomes N Outcomes N Outcomes N Outcomes N Outcomes
ALLHAT Oparil (110) 2013 4768 38 (0.8%) 4867 33 (0.7%) 8084 51 (0.6%)
LIFE Os (111) 2008 2112 81 (3.8%) 2118 78 (3.7%)
HAPPHY Wilhelmsen (78) 1987 3297 32 (1%) 3272 22 (0.7%)
Table 3.40 Relative Treatment Effect of the Pooled Network Comparisons Among Men Expressed as RR (95% Credible Interval) of HF Associated with Antihypertensive Drug Class Comparisons
ACE_MALE ARB_MALE BB_MALE CCB_MALE THZ_MALE ACE_MALE ACE_MALE 1.3 (0.47, 3.8) 1.4 (0.55, 3.4) 1.1 (0.61, 2.1) 0.91 (0.49, 1.6) ARB_MALE 0.75 (0.26, 2.1) ARB_MALE 1 (0.6, 1.7) 0.86 (0.3, 2.4) 0.68 (0.29, 1.6) BB_MALE 0.74 (0.3, 1.8) 0.98 (0.58, 1.7) BB_MALE 0.84 (0.34, 2) 0.67 (0.34, 1.3) CCB_MALE 0.88 (0.47, 1.6) 1.2 (0.41, 3.3) 1.2 (0.49, 3) CCB_MALE 0.79 (0.44, 1.4) THZ_MALE 1.1 (0.61, 2) 1.5 (0.62, 3.5) 1.5 (0.76, 3) 1.3 (0.7, 2.3) THZ_MALE
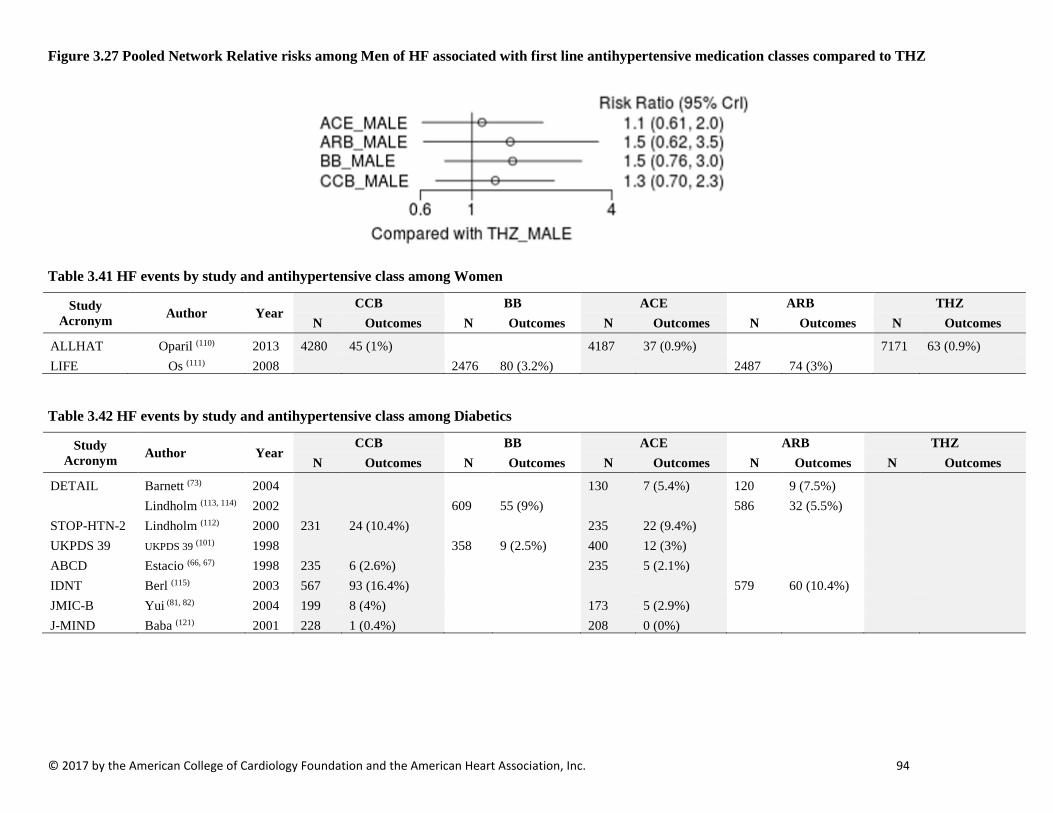
© 2017 by the American College of Cardiology Foundation and the American Heart Association, Inc. 94
Figure 3.27 Pooled Network Relative risks among Men of HF associated with first line antihypertensive medication classes compared to THZ
Table 3.41 HF events by study and antihypertensive class among Women
Study Acronym Author Year
CCB BB ACE ARB THZ N Outcomes N Outcomes N Outcomes N Outcomes N Outcomes
ALLHAT Oparil (110) 2013 4280 45 (1%) 4187 37 (0.9%) 7171 63 (0.9%) LIFE Os (111) 2008 2476 80 (3.2%) 2487 74 (3%)
Table 3.42 HF events by study and antihypertensive class among Diabetics
Study Acronym Author Year
CCB BB ACE ARB THZ N Outcomes N Outcomes N Outcomes N Outcomes N Outcomes
DETAIL Barnett (73) 2004 130 7 (5.4%) 120 9 (7.5%) Lindholm (113, 114) 2002 609 55 (9%) 586 32 (5.5%) STOP-HTN-2 Lindholm (112) 2000 231 24 (10.4%) 235 22 (9.4%) UKPDS 39 UKPDS 39 (101) 1998 358 9 (2.5%) 400 12 (3%) ABCD Estacio (66, 67) 1998 235 6 (2.6%) 235 5 (2.1%) IDNT Berl (115) 2003 567 93 (16.4%) 579 60 (10.4%) JMIC-B Yui (81, 82) 2004 199 8 (4%) 173 5 (2.9%) J-MIND Baba (121) 2001 228 1 (0.4%) 208 0 (0%)
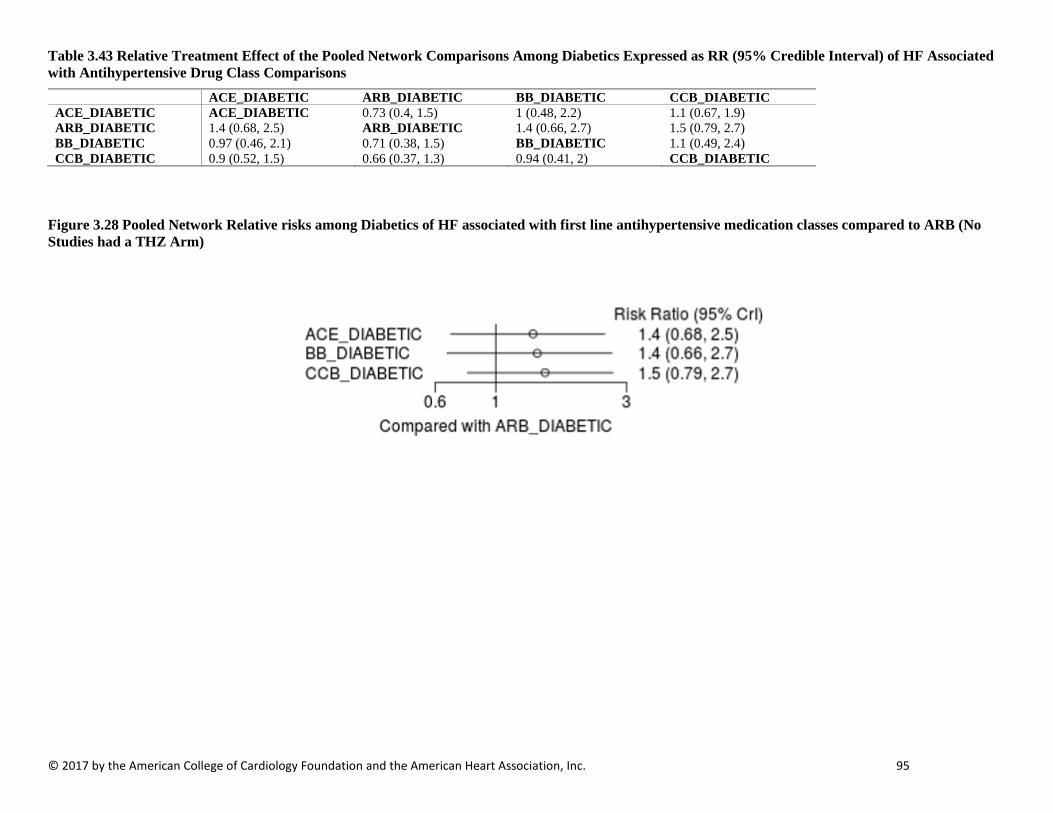
© 2017 by the American College of Cardiology Foundation and the American Heart Association, Inc. 95
Table 3.43 Relative Treatment Effect of the Pooled Network Comparisons Among Diabetics Expressed as RR (95% Credible Interval) of HF Associated with Antihypertensive Drug Class Comparisons
ACE_DIABETIC ARB_DIABETIC BB_DIABETIC CCB_DIABETIC ACE_DIABETIC ACE_DIABETIC 0.73 (0.4, 1.5) 1 (0.48, 2.2) 1.1 (0.67, 1.9) ARB_DIABETIC 1.4 (0.68, 2.5) ARB_DIABETIC 1.4 (0.66, 2.7) 1.5 (0.79, 2.7) BB_DIABETIC 0.97 (0.46, 2.1) 0.71 (0.38, 1.5) BB_DIABETIC 1.1 (0.49, 2.4) CCB_DIABETIC 0.9 (0.52, 1.5) 0.66 (0.37, 1.3) 0.94 (0.41, 2) CCB_DIABETIC
Figure 3.28 Pooled Network Relative risks among Diabetics of HF associated with first line antihypertensive medication classes compared to ARB (No Studies had a THZ Arm)

© 2017 by the American College of Cardiology Foundation and the American Heart Association, Inc. 96
STROKE OUTCOMES Table 3.44 Fatal and non-fatal stroke outcomes by antihypertensive class and study
Study Acronym Author Year
ACE CCB ARB THZ BB
N Stroke N (%) N Stroke
N (%) N Stroke N (%) N Stroke
N (%) N Stroke N (%)
DETAIL Barnett AH (73) 2004 130 6 (4.6) 120 6 (5.0) AASK Norris K (46) 2006 436 23 (5.3) 217 9 (4.1) 441 23 (5.2) HYVET-Pilot Bulpitt CJ (79) 2003 431 7 (1.6) 426 6 (1.4) -- Fogari R (89) 2002 102 1 (0.98) 103 0 (0.0) STOP-HTN-2 Hansson L (100) 1999 2205 50 (2.3) 2196 46 (2.1) UKPDS UKPDS 39 (101) 1998 400 21 (5.3) 358 17 (4.7) ABCD Estacio RO (66, 67) 1998 235 7 (3.0) 235 11 (4.7) ANBP2 Wing LM (69) 2003 3044 112 (3.7) 3039 107 (3.5) PHYLLIS Zanchetti A (102) 2004 127 0 (0.0) 127 0 (0.0) JMIC-B Yui Y (81, 82) 2004 822 16 (1.9) 828 16 (1.9) J-MIND Baba S (121) 2001 208 5 (2.4) 228 2 (0.88) CORD IB Spinar J (72) 2009 1926 8 (0.42) 1887 9 (0.48) ESPIRAL Marin R (76) 2001 129 0 (0.0) 112 2 (1.8) -- Agarwal R (94) 2014 100 2 (2.0) 100 2 (2.0) ALLHAT Yamal JM (109) 2014 9054 460 (5.1) 9048 382 (4.2) 15255 683 (4.5) ALPINE Lindholm LH (119) 2003 196 0 (0.0) 196 0 (0.0) VALUE Julius S (28, 102) 2004 7596 281 (3.7) 7649 322 (4.2) LIFE Dahlof B (83) 2002 4605 232 (5.0) 4588 309 (6.7) IDNT Berl T (115) 2003 567 15 (2.6) 579 28 (4.8) J-RHYTHM II Yamashita T (116) 2011 160 3 (1.9) 158 0 (0.0) VART Narumi H (103) 2011 511 10 (2.0) 510 10 (2.0) -- Du H (117) 2013 75 0 (0.0) 74 1 (1.4) ELSA Zanchetti A (74) 2002 1177 9 (0.76) 1157 14 (1.2) HAPPHY Wilhelmsen L (78) 1987 3272 41 (1.3) 3297 32 (0.97) SHELL Malacco E (99) 2003 942 37 (3.9) 940 38 (4.0) MIDAS Borhani N.O (105) 1996 442 6 (1.4) 441 3 (0.68) NICS-EH Kuramoto K (118) 1999 204 12 (5.9) 210 8 (3.8) INSIGHT Brown (88) 2000 3157 55 (1.7) 3164 63 (2.0)
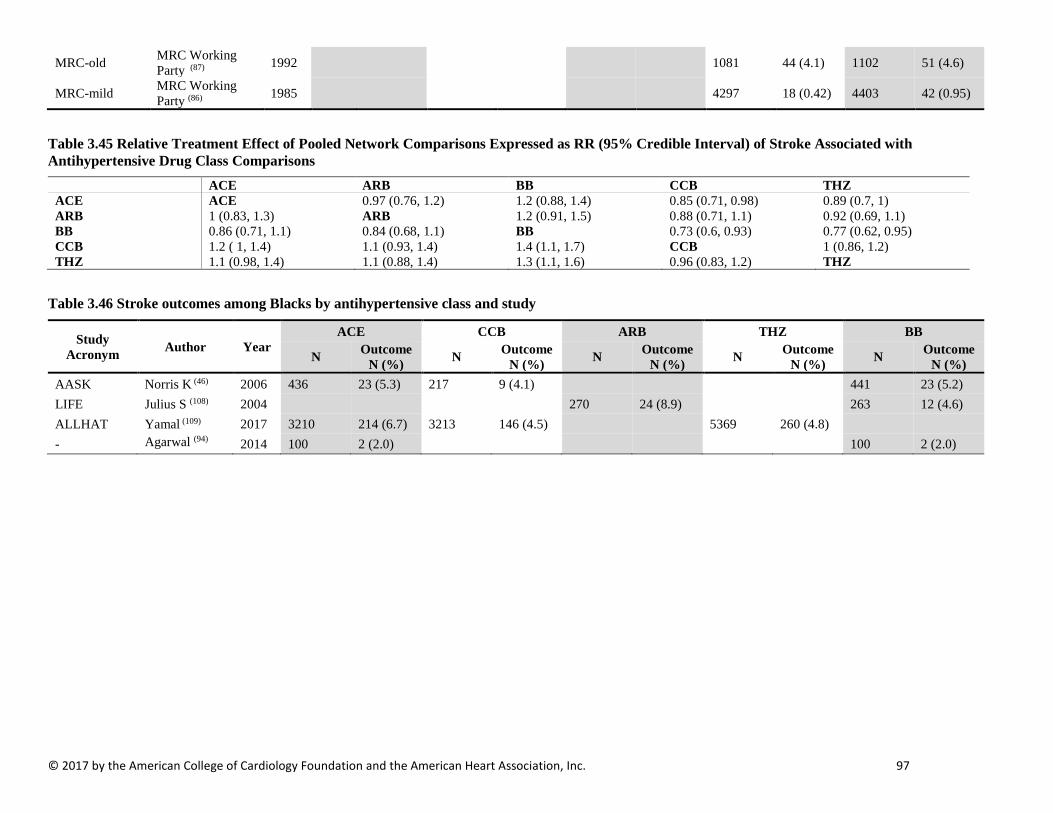
© 2017 by the American College of Cardiology Foundation and the American Heart Association, Inc. 97
MRC-old MRC Working Party (87) 1992 1081 44 (4.1) 1102 51 (4.6)
MRC-mild MRC Working Party (86) 1985 4297 18 (0.42) 4403 42 (0.95)
Table 3.45 Relative Treatment Effect of Pooled Network Comparisons Expressed as RR (95% Credible Interval) of Stroke Associated with Antihypertensive Drug Class Comparisons
ACE ARB BB CCB THZ ACE ACE 0.97 (0.76, 1.2) 1.2 (0.88, 1.4) 0.85 (0.71, 0.98) 0.89 (0.7, 1) ARB 1 (0.83, 1.3) ARB 1.2 (0.91, 1.5) 0.88 (0.71, 1.1) 0.92 (0.69, 1.1) BB 0.86 (0.71, 1.1) 0.84 (0.68, 1.1) BB 0.73 (0.6, 0.93) 0.77 (0.62, 0.95) CCB 1.2 ( 1, 1.4) 1.1 (0.93, 1.4) 1.4 (1.1, 1.7) CCB 1 (0.86, 1.2) THZ 1.1 (0.98, 1.4) 1.1 (0.88, 1.4) 1.3 (1.1, 1.6) 0.96 (0.83, 1.2) THZ
Table 3.46 Stroke outcomes among Blacks by antihypertensive class and study
Study Acronym Author Year
ACE CCB ARB THZ BB
N Outcome N (%) N Outcome
N (%) N Outcome N (%) N Outcome
N (%) N Outcome N (%)
AASK Norris K (46) 2006 436 23 (5.3) 217 9 (4.1) 441 23 (5.2) LIFE Julius S (108) 2004 270 24 (8.9) 263 12 (4.6) ALLHAT Yamal (109) 2017 3210 214 (6.7) 3213 146 (4.5) 5369 260 (4.8) - Agarwal (94) 2014 100 2 (2.0) 100 2 (2.0)

© 2017 by the American College of Cardiology Foundation and the American Heart Association, Inc. 98
Table 3.47 Relative Treatment Effect of the Pooled Network Comparisons Among Blacks Expressed as RR (95% Credible Interval) of Fatal or Non-Fatal Stroke Associated with Antihypertensive Drug Class Comparisons
ACE_BLACK ARB_BLACK BB_BLACK CCB_BLACK THZ_BLACK
ACE_BLACK ACE_BLACK 1.83 (0.574, 5.84) 0.886 (0.433, 1.78) 0.691 (0.383, 1.2) 0.727 (0.362, 1.43)
ARB_BLACK 0.548 (0.171, 1.74) ARB_BLACK 0.486 (0.187, 1.26) 0.374 (0.114, 1.23) 0.395 (0.108, 1.39)
BB_BLACK 1.13 (0.561, 2.31) 2.06 (0.792, 5.34) BB_BLACK 0.778 (0.353, 1.77) 0.823 (0.33, 2.1)
CCB_BLACK 1.45 (0.836, 2.61) 2.68 (0.814, 8.79) 1.29 (0.565, 2.83) CCB_BLACK 1.06 (0.529, 2.1)
THZ_BLACK 1.37 (0.698, 2.76) 2.53 (0.719, 9.24) 1.22 (0.475, 3.03) 0.944 (0.477, 1.89) THZ_BLACK
Table 3.48 Stroke events by study and antihypertensive class among Men
Study Acronym Author Year
ACE CCB ARB THZ BB
N Outcome N (%) N Outcome
N (%) N Outcome N (%) N Outcome
N (%) N Outcome N (%)
HAPPY Wilhelmsen (78) 1987 3272 41 (1.3) 3297 32 (1.0)
LIFE Os (111) 2008 2118 123 (5.8) 2112 155 (7.3) ALLHAT Yamal (109) 2014 4867 259 (5.3) 4768 237 (5.0) 8084 395 (4.9)
MRC Mild MRC Working Group (123) 1987 2238 11 (0.5) 2285 26 (1.1)
Table 3.49 Relative Treatment Effect of the Pooled Network Comparisons Among Men Expressed as RR (95% Credible Interval) of Stroke Associated with Antihypertensive Drug Class Comparisons
ACE_MALE ARB_MALE BB_MALE CCB_MALE THZ_MALE ACE_MALE ACE_MALE 0.93 (0.15, 6.3) 1.2 (0.27, 5.4) 0.93 (0.28, 3) 0.9 (0.27, 2.9) ARB_MALE 1.1 (0.16, 6.6) ARB_MALE 1.2 (0.39, 3.9) 0.99 (0.15, 5.8) 0.98 (0.21, 4) BB_MALE 0.86 (0.19, 3.7) 0.8 (0.26, 2.6) BB_MALE 0.81 (0.18, 3.3) 0.79 (0.3, 1.8) CCB_MALE 1.1 (0.34, 3.5) 1 (0.17, 6.5) 1.2 (0.3, 5.6) CCB_MALE 0.99 (0.31, 3) THZ_MALE 1.1 (0.35, 3.7) 1 (0.25, 4.7) 1.3 (0.56, 3.3) 1 (0.33, 3.2) THZ_MALE

© 2017 by the American College of Cardiology Foundation and the American Heart Association, Inc. 99
Figure 3.29 Pooled Network Relative risks among Men of Stroke associated with first line antihypertensive medication classes compared to THZ
Table 3.50 Stroke events by study and antihypertensive class among Women
Study Acronym Author Year
ACE CCB ARB THZ BB
N Outcome N (%) N Outcome
N (%) N Outcome N (%) N Outcome
N (%) N Outcome N (%)
LIFE Os (111) 2008 2487 109 (4.4) 2476 154 (6.2) ALLHAT Yamal (109) 2014 4187 201 (4.8) 4280 145 (3.4) 7171 288 (4.0)
MRC Mild MRC Working Group (86) 1985 2059 14 (0.7) 2118 25 (1.1)
Table 3.51 Relative Treatment Effect of the Pooled Network Comparisons Among Women Expressed as RR (95% Credible Interval) of Stroke Associated with Antihypertensive Drug Class Comparisons
ACE_FEMALE ARB_FEMALE BB_FEMALE CCB_FEMALE THZ_FEMALE ACE_FEMALE ACE_FEMALE 1.1 (0.28, 3.9) 1.5 (0.49, 4.7) 0.7 (0.33, 1.4) 0.83 (0.41, 1.7) ARB_FEMALE 0.93 (0.26, 3.6) ARB_FEMALE 1.4 (0.7, 2.9) 0.65 (0.18, 2.5) 0.77 (0.26, 2.5) BB_FEMALE 0.65 (0.21, 2) 0.71 (0.35, 1.4) BB_FEMALE 0.46 (0.15, 1.5) 0.55 (0.21, 1.4) CCB_FEMALE 1.4 (0.71, 3) 1.5 (0.4, 5.6) 2.2 (0.68, 6.9) CCB_FEMALE 1.2 (0.59, 2.4) THZ_FEMALE 1.2 (0.59, 2.4) 1.3 (0.4, 3.9) 1.8 (0.73, 4.7) 0.85 (0.42, 1.7) THZ_FEMALE
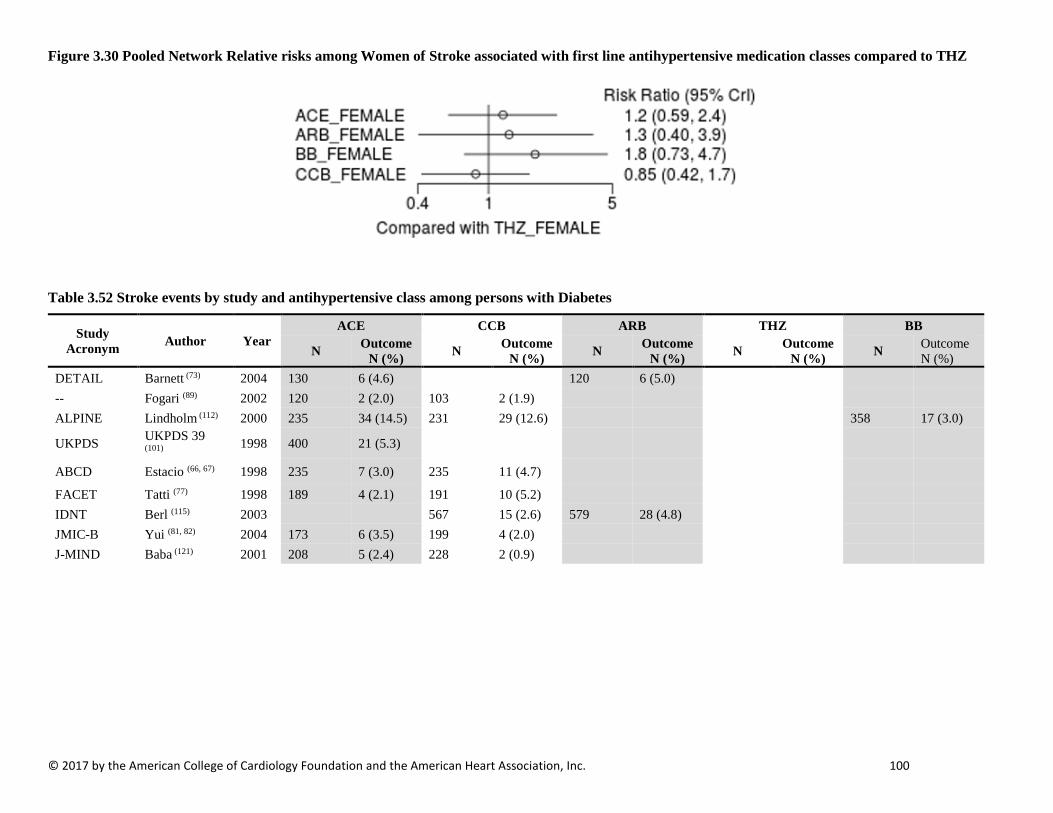
© 2017 by the American College of Cardiology Foundation and the American Heart Association, Inc. 100
Figure 3.30 Pooled Network Relative risks among Women of Stroke associated with first line antihypertensive medication classes compared to THZ
Table 3.52 Stroke events by study and antihypertensive class among persons with Diabetes
Study Acronym Author Year
ACE CCB ARB THZ BB
N Outcome N (%) N Outcome
N (%) N Outcome N (%) N Outcome
N (%) N Outcome N (%)
DETAIL Barnett (73) 2004 130 6 (4.6) 120 6 (5.0) -- Fogari (89) 2002 120 2 (2.0) 103 2 (1.9) ALPINE Lindholm (112) 2000 235 34 (14.5) 231 29 (12.6) 358 17 (3.0)
UKPDS UKPDS 39 (101) 1998 400 21 (5.3)
ABCD Estacio (66, 67) 1998 235 7 (3.0) 235 11 (4.7)
FACET Tatti (77) 1998 189 4 (2.1) 191 10 (5.2) IDNT Berl (115) 2003 567 15 (2.6) 579 28 (4.8) JMIC-B Yui (81, 82) 2004 173 6 (3.5) 199 4 (2.0) J-MIND Baba (121) 2001 208 5 (2.4) 228 2 (0.9)
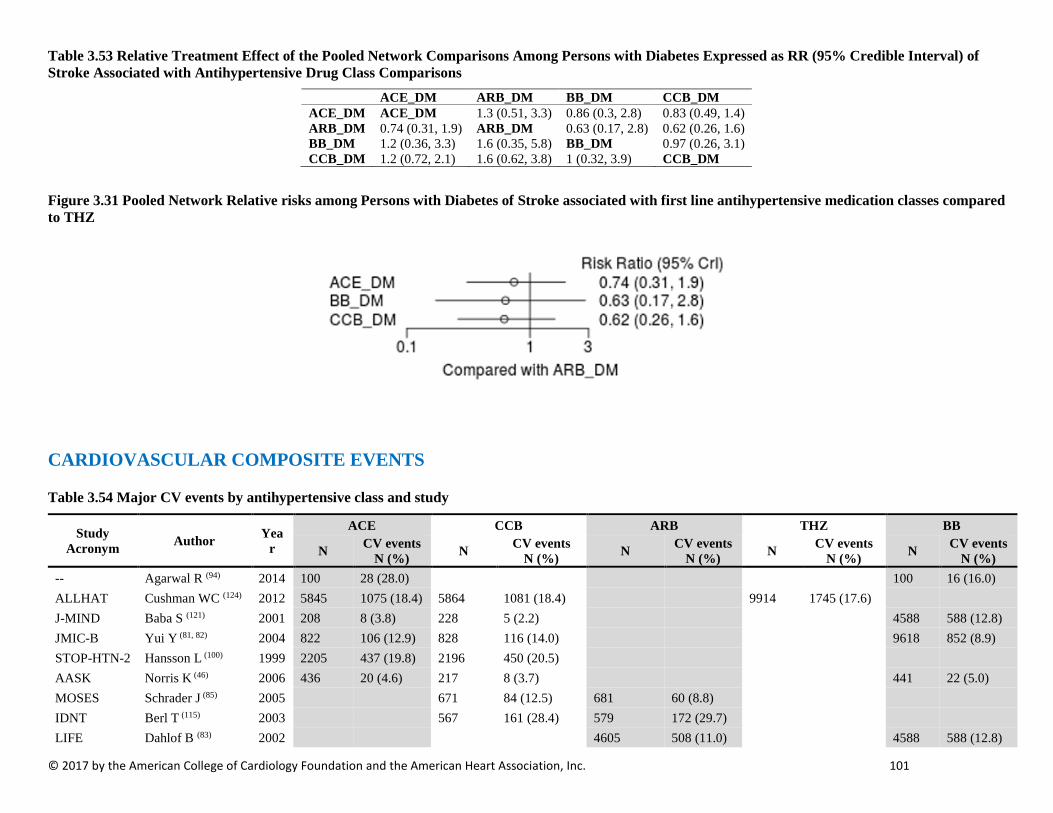
© 2017 by the American College of Cardiology Foundation and the American Heart Association, Inc. 101
Table 3.53 Relative Treatment Effect of the Pooled Network Comparisons Among Persons with Diabetes Expressed as RR (95% Credible Interval) of Stroke Associated with Antihypertensive Drug Class Comparisons
ACE_DM ARB_DM BB_DM CCB_DM ACE_DM ACE_DM 1.3 (0.51, 3.3) 0.86 (0.3, 2.8) 0.83 (0.49, 1.4) ARB_DM 0.74 (0.31, 1.9) ARB_DM 0.63 (0.17, 2.8) 0.62 (0.26, 1.6) BB_DM 1.2 (0.36, 3.3) 1.6 (0.35, 5.8) BB_DM 0.97 (0.26, 3.1) CCB_DM 1.2 (0.72, 2.1) 1.6 (0.62, 3.8) 1 (0.32, 3.9) CCB_DM
Figure 3.31 Pooled Network Relative risks among Persons with Diabetes of Stroke associated with first line antihypertensive medication classes compared to THZ
CARDIOVASCULAR COMPOSITE EVENTS
Table 3.54 Major CV events by antihypertensive class and study
Study Acronym Author Yea
r
ACE CCB ARB THZ BB
N CV events N (%) N CV events
N (%) N CV events N (%) N CV events
N (%) N CV events N (%)
-- Agarwal R (94) 2014 100 28 (28.0) 100 16 (16.0) ALLHAT Cushman WC (124) 2012 5845 1075 (18.4) 5864 1081 (18.4) 9914 1745 (17.6) J-MIND Baba S (121) 2001 208 8 (3.8) 228 5 (2.2) 4588 588 (12.8) JMIC-B Yui Y (81, 82) 2004 822 106 (12.9) 828 116 (14.0) 9618 852 (8.9) STOP-HTN-2 Hansson L (100) 1999 2205 437 (19.8) 2196 450 (20.5) AASK Norris K (46) 2006 436 20 (4.6) 217 8 (3.7) 441 22 (5.0) MOSES Schrader J (85) 2005 671 84 (12.5) 681 60 (8.8) IDNT Berl T (115) 2003 567 161 (28.4) 579 172 (29.7) LIFE Dahlof B (83) 2002 4605 508 (11.0) 4588 588 (12.8)

© 2017 by the American College of Cardiology Foundation and the American Heart Association, Inc. 102
NICS-EH Kuramoto K 1999 204 21 (10.3) 210 18 (8.6)
MIDAS (118)
Borhani N.O. (105) 1996 442 54 (12.2) 441 33 (7.5)
SHELL Malacco E (99) 2003 942 90 (9.6) 940 88 (9.4) ELSA Zanchetti A (74) 2002 1177 69 (5.9) 1157 73 (6.3) ASCOT-BPLA Dahlof B (70) 2005 9639 753 (7.8)
VALUE Julius S (102) 2004 7596 578 (7.6) 7649 586 (7.7) INSIGHT Brown MJ (88) 2000 3157 383 (12.1) 3164 397 (12.6) FACET Tatti P (77) 1998 189 14 (7.4) 191 27 (14.1)
Table 3.55 Outcome names for composite CV event outcomes
Study Acronym Author Year Outcome Name
-- Agarwal R (94) 2014 Composite, Myocardial Infarction or Composite, Stroke or Composite, Heart Failure, Congestive or Composite, Angina or Composite, Arrhythmia or Composite, Cardiac Arrest or Composite, Coronary Revascularization or Composite, Heart Valve Replacement
ALLHAT Cushman WC (124) 2012 Composite, Mortality, Cardiovascular or Composite, Myocardial Infarction, Non-Fatal, Requiring Hospitalization or Composite, Stroke, Non-Fatal, Requiring Hospitalization or Composite, Heart Failure, Non-Fatal, Requiring Hospitalization
J-MIND Baba S (121) 2001 Composite, Stroke, Ischemic or Composite, Angina or Composite, Myocardial Infarction or Composite, Heart Failure or Composite, Atrial Fibrillation
JMIC-B Yui Y (81, 82) 2004 Composite, Mortality, Cardiovascular or Composite, Mortality, Sudden Death or Composite, Myocardial Infarction, Non-Fatal or Composite, Angina, Requiring Hospitalization or Composite, Heart Failure, Non-Fatal, Requiring Hospitalization or Composite, Arrhythmia, Serious or Composite, Coronary Revascularization
STOP-HTN-2 Hansson L (100) 1999 Composite, Stroke, Fatal or Non-Fatal or Composite, Myocardial Infarction, Fatal or Non-Fatal or Composite, Mortality, Cardiovascular, Other
AASK Norris K (46) 2006 Composite, Mortality, Cardiovascular or Composite, Hospitalization, Cardiovascular, First
MOSES Schrader J (85) 2005 Composite, Acute Coronary Syndrome, First or Composite, Heart Failure, Fatal or Non-Fatal, First or Composite, Arrhythmia, Fatal, First or Composite, Embolism, Pulmonary, Fatal or Non-Fatal, First or Composite, Myocardial Infarction, Fatal or Non-Fatal, First
IDNT Berl T (115) 2003 Composite, Mortality, Cardiovascular or Composite, Myocardial Infarction, Non-Fatal or Composite, Heart Failure, Congestive, Non-Fatal or Composite, Stroke, Non-Fatal or Composite, Coronary Revascularization
LIFE Dahlof B (83) 2002 Composite, Mortality, Cardiovascular or Composite, Stroke, Non-Fatal or Composite, Myocardial Infarction, Non-Fatal
NICS-EH Kuramoto K (118) 1999 Composite, Myocardial Infarction, Non-Fatal or Composite, Angina or Composite, Heart Failure, Non-Fatal or Composite, Arrhythmia
MIDAS Borhani N.O. (105) 1996
Composite, Stroke, Fatal or Non-Fatal or Composite, Myocardial Infarction, Fatal or Non-Fatal or Composite, Mortality, Sudden Death or Composite, Heart Failure, Congestive, Fatal or Non-Fatal or Composite, Angina or Composite, Mortality, Cardiovascular, Other or Composite, Coronary Revascularization or Composite, Stroke, Transient Ischemic Attack, Non-Fatal or Composite, Atrial Fibrillation or Composite, Premature Ventricular
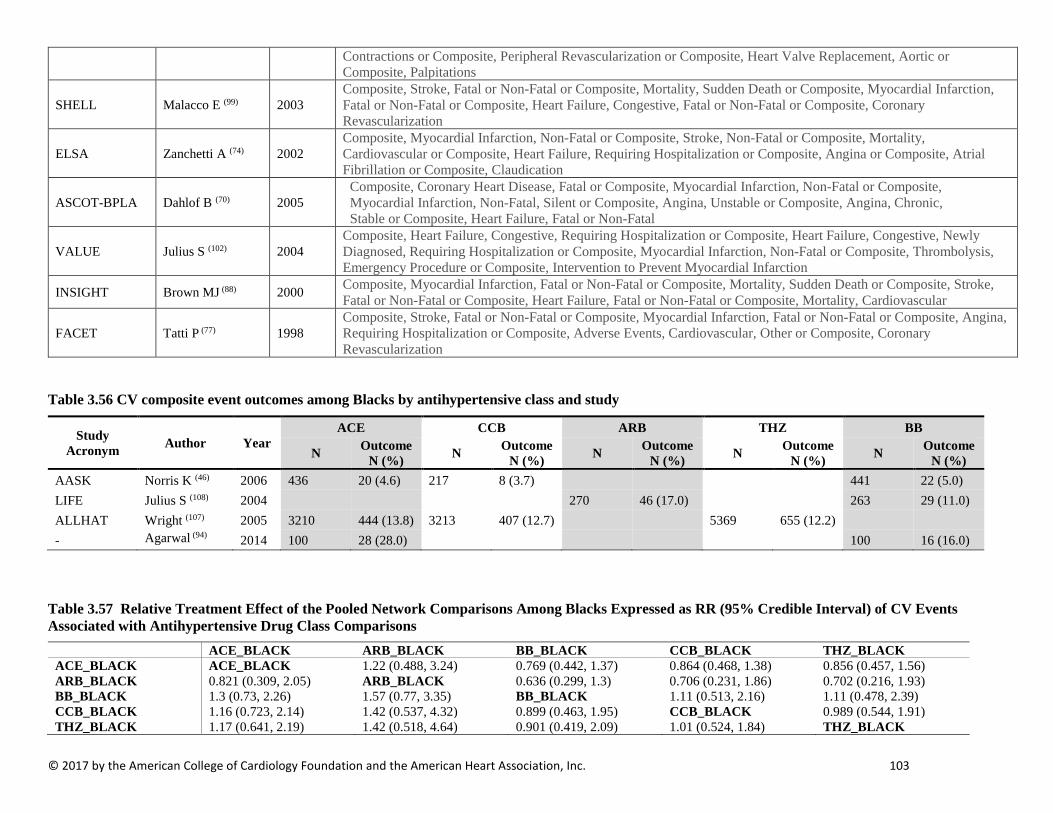
© 2017 by the American College of Cardiology Foundation and the American Heart Association, Inc. 103
Contractions or Composite, Peripheral Revascularization or Composite, Heart Valve Replacement, Aortic or Composite, Palpitations
SHELL Malacco E (99) 2003 Composite, Stroke, Fatal or Non-Fatal or Composite, Mortality, Sudden Death or Composite, Myocardial Infarction, Fatal or Non-Fatal or Composite, Heart Failure, Congestive, Fatal or Non-Fatal or Composite, Coronary Revascularization
ELSA Zanchetti A (74) 2002 Composite, Myocardial Infarction, Non-Fatal or Composite, Stroke, Non-Fatal or Composite, Mortality, Cardiovascular or Composite, Heart Failure, Requiring Hospitalization or Composite, Angina or Composite, Atrial Fibrillation or Composite, Claudication
ASCOT-BPLA Dahlof B (70) 2005 Composite, Coronary Heart Disease, Fatal or Composite, Myocardial Infarction, Non-Fatal or Composite, Myocardial Infarction, Non-Fatal, Silent or Composite, Angina, Unstable or Composite, Angina, Chronic, Stable or Composite, Heart Failure, Fatal or Non-Fatal
VALUE Julius S (102) 2004 Composite, Heart Failure, Congestive, Requiring Hospitalization or Composite, Heart Failure, Congestive, Newly Diagnosed, Requiring Hospitalization or Composite, Myocardial Infarction, Non-Fatal or Composite, Thrombolysis, Emergency Procedure or Composite, Intervention to Prevent Myocardial Infarction
INSIGHT Brown MJ (88) 2000 Composite, Myocardial Infarction, Fatal or Non-Fatal or Composite, Mortality, Sudden Death or Composite, Stroke, Fatal or Non-Fatal or Composite, Heart Failure, Fatal or Non-Fatal or Composite, Mortality, Cardiovascular
FACET Tatti P (77) 1998 Composite, Stroke, Fatal or Non-Fatal or Composite, Myocardial Infarction, Fatal or Non-Fatal or Composite, Angina, Requiring Hospitalization or Composite, Adverse Events, Cardiovascular, Other or Composite, Coronary Revascularization
Table 3.56 CV composite event outcomes among Blacks by antihypertensive class and study
Study Acronym Author Year
ACE CCB ARB THZ BB
N Outcome N (%) N Outcome
N (%) N Outcome N (%) N Outcome
N (%) N Outcome N (%)
AASK Norris K (46) 2006 436 20 (4.6) 217 8 (3.7) 441 22 (5.0) LIFE Julius S (108) 2004 270 46 (17.0) 263 29 (11.0) ALLHAT Wright (107) 2005 3210 444 (13.8) 3213 407 (12.7) 5369 655 (12.2) - Agarwal (94) 2014 100 28 (28.0) 100 16 (16.0)
Table 3.57 Relative Treatment Effect of the Pooled Network Comparisons Among Blacks Expressed as RR (95% Credible Interval) of CV Events Associated with Antihypertensive Drug Class Comparisons
ACE_BLACK ARB_BLACK BB_BLACK CCB_BLACK THZ_BLACK ACE_BLACK ACE_BLACK 1.22 (0.488, 3.24) 0.769 (0.442, 1.37) 0.864 (0.468, 1.38) 0.856 (0.457, 1.56) ARB_BLACK 0.821 (0.309, 2.05) ARB_BLACK 0.636 (0.299, 1.3) 0.706 (0.231, 1.86) 0.702 (0.216, 1.93) BB_BLACK 1.3 (0.73, 2.26) 1.57 (0.77, 3.35) BB_BLACK 1.11 (0.513, 2.16) 1.11 (0.478, 2.39) CCB_BLACK 1.16 (0.723, 2.14) 1.42 (0.537, 4.32) 0.899 (0.463, 1.95) CCB_BLACK 0.989 (0.544, 1.91) THZ_BLACK 1.17 (0.641, 2.19) 1.42 (0.518, 4.64) 0.901 (0.419, 2.09) 1.01 (0.524, 1.84) THZ_BLACK
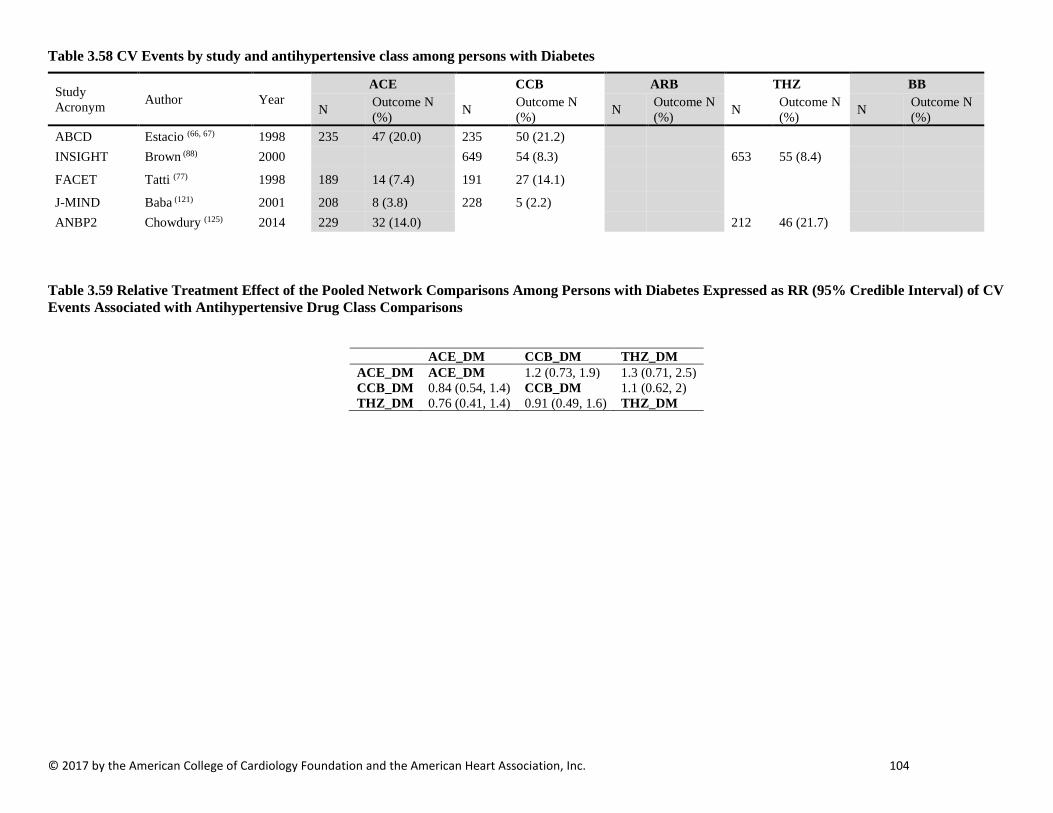
© 2017 by the American College of Cardiology Foundation and the American Heart Association, Inc. 104
Table 3.58 CV Events by study and antihypertensive class among persons with Diabetes
Study Acronym Author Year
ACE CCB ARB THZ BB
N Outcome N (%) N Outcome N
(%) N Outcome N (%) N Outcome N
(%) N Outcome N (%)
ABCD Estacio (66, 67) 1998 235 47 (20.0) 235 50 (21.2) INSIGHT Brown (88) 2000 649 54 (8.3) 653 55 (8.4)
FACET Tatti (77) 1998 189 14 (7.4) 191 27 (14.1)
J-MIND Baba (121) 2001 208 8 (3.8) 228 5 (2.2) ANBP2 Chowdury (125) 2014 229 32 (14.0) 212 46 (21.7)
Table 3.59 Relative Treatment Effect of the Pooled Network Comparisons Among Persons with Diabetes Expressed as RR (95% Credible Interval) of CV Events Associated with Antihypertensive Drug Class Comparisons
ACE_DM CCB_DM THZ_DM ACE_DM ACE_DM 1.2 (0.73, 1.9) 1.3 (0.71, 2.5) CCB_DM 0.84 (0.54, 1.4) CCB_DM 1.1 (0.62, 2) THZ_DM 0.76 (0.41, 1.4) 0.91 (0.49, 1.6) THZ_DM
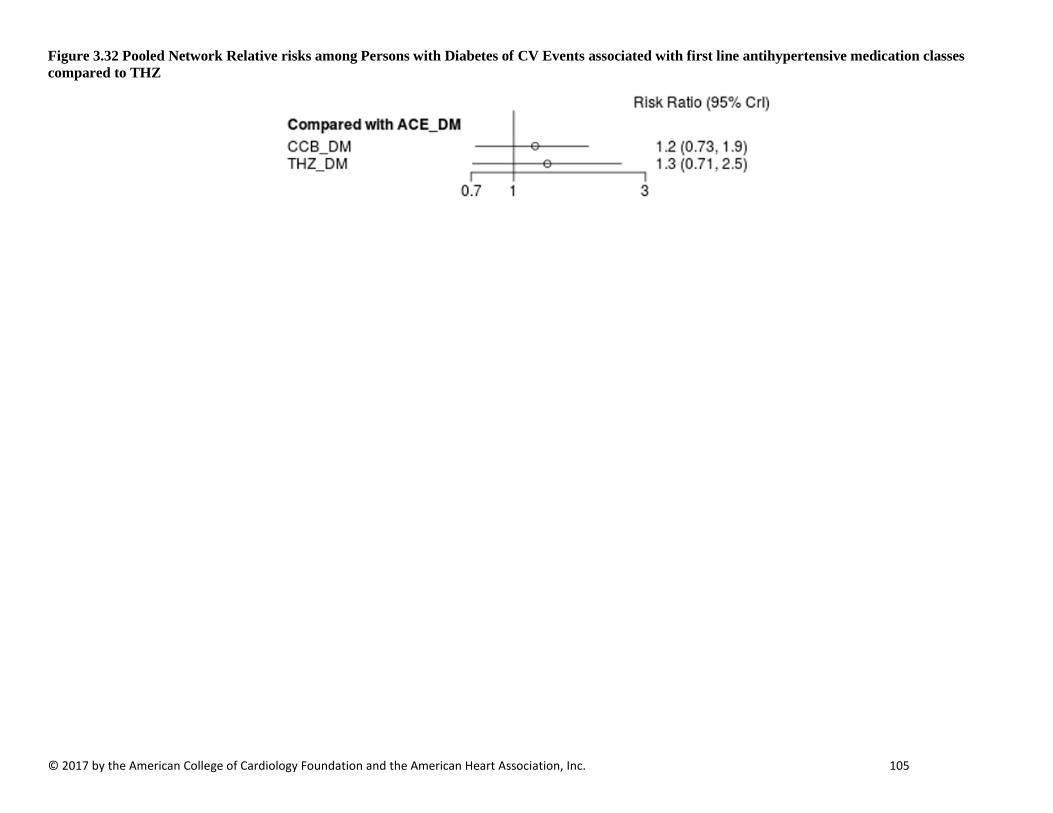
© 2017 by the American College of Cardiology Foundation and the American Heart Association, Inc. 105
Figure 3.32 Pooled Network Relative risks among Persons with Diabetes of CV Events associated with first line antihypertensive medication classes compared to THZ
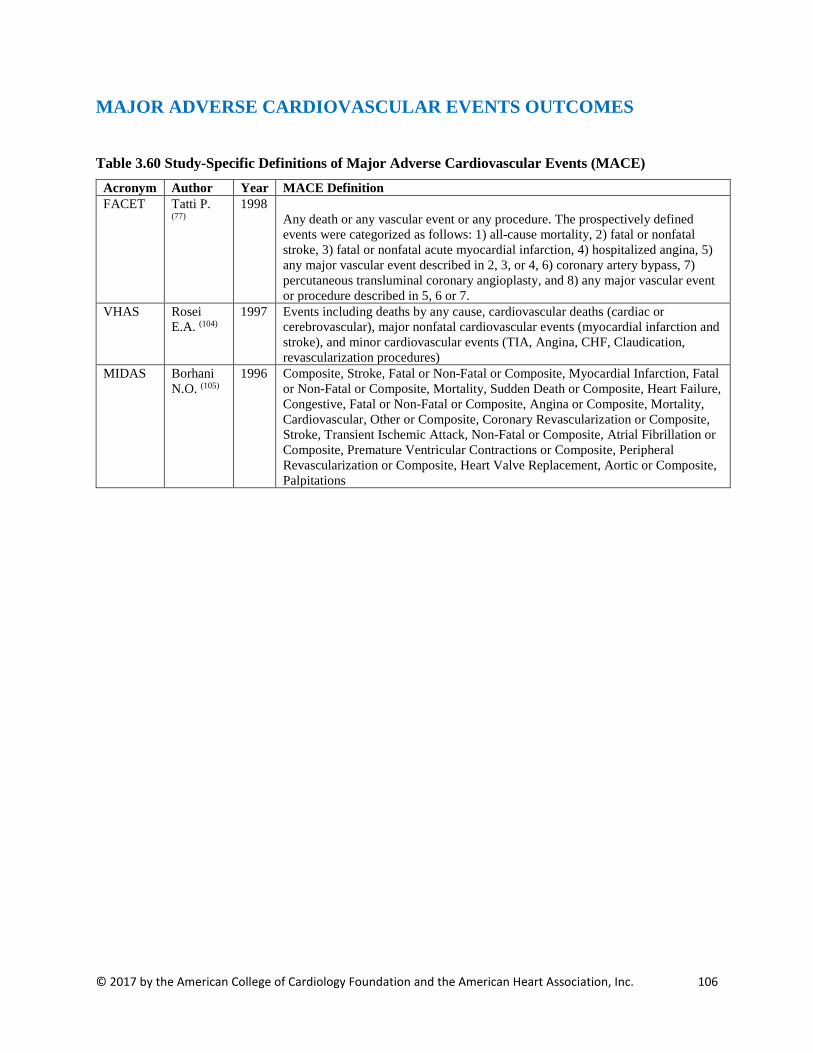
© 2017 by the American College of Cardiology Foundation and the American Heart Association, Inc. 106
MAJOR ADVERSE CARDIOVASCULAR EVENTS OUTCOMES Table 3.60 Study-Specific Definitions of Major Adverse Cardiovascular Events (MACE)
Acronym Author Year MACE Definition FACET Tatti P.
(77) 1998
Any death or any vascular event or any procedure. The prospectively defined events were categorized as follows: 1) all-cause mortality, 2) fatal or nonfatal stroke, 3) fatal or nonfatal acute myocardial infarction, 4) hospitalized angina, 5) any major vascular event described in 2, 3, or 4, 6) coronary artery bypass, 7) percutaneous transluminal coronary angioplasty, and 8) any major vascular event or procedure described in 5, 6 or 7.
VHAS Rosei E.A. (104)
1997 Events including deaths by any cause, cardiovascular deaths (cardiac or cerebrovascular), major nonfatal cardiovascular events (myocardial infarction and stroke), and minor cardiovascular events (TIA, Angina, CHF, Claudication, revascularization procedures)
MIDAS Borhani N.O. (105)
1996 Composite, Stroke, Fatal or Non-Fatal or Composite, Myocardial Infarction, Fatal or Non-Fatal or Composite, Mortality, Sudden Death or Composite, Heart Failure, Congestive, Fatal or Non-Fatal or Composite, Angina or Composite, Mortality, Cardiovascular, Other or Composite, Coronary Revascularization or Composite, Stroke, Transient Ischemic Attack, Non-Fatal or Composite, Atrial Fibrillation or Composite, Premature Ventricular Contractions or Composite, Peripheral Revascularization or Composite, Heart Valve Replacement, Aortic or Composite, Palpitations
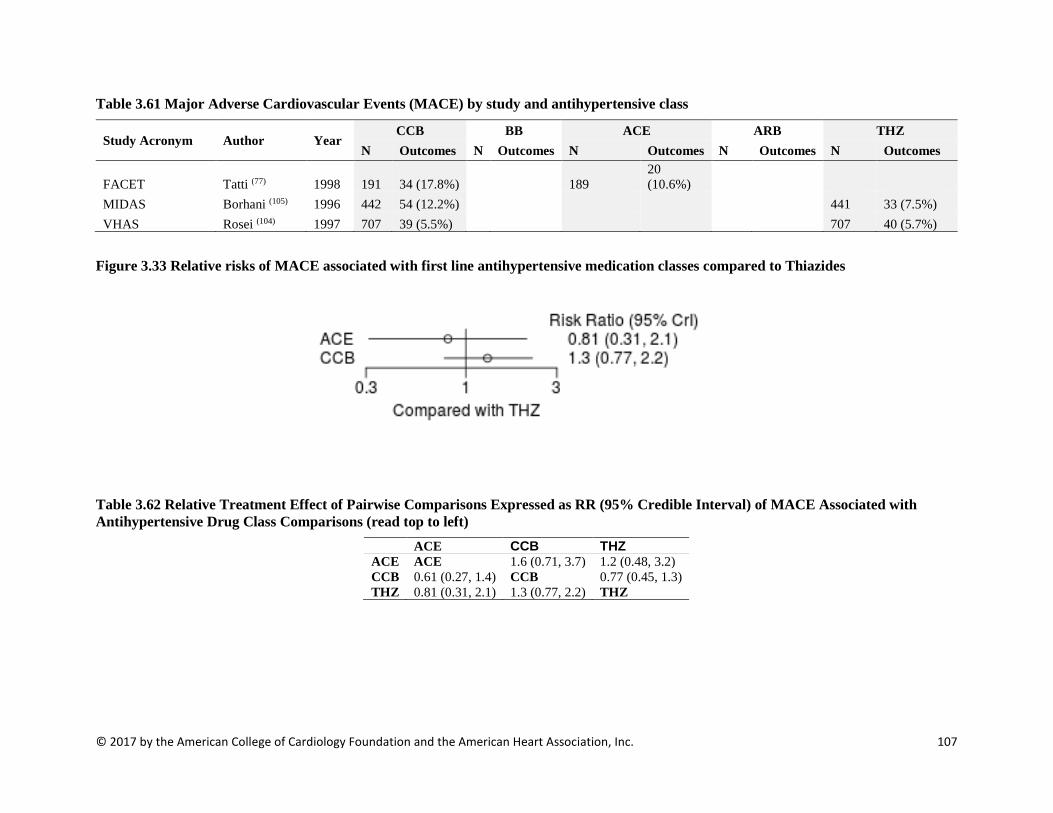
© 2017 by the American College of Cardiology Foundation and the American Heart Association, Inc. 107
Table 3.61 Major Adverse Cardiovascular Events (MACE) by study and antihypertensive class
Study Acronym Author Year CCB BB ACE ARB THZ
N Outcomes N Outcomes N Outcomes N Outcomes N Outcomes
FACET Tatti (77) 1998 191 34 (17.8%) 189 20 (10.6%)
MIDAS Borhani (105) 1996 442 54 (12.2%) 441 33 (7.5%) VHAS Rosei (104) 1997 707 39 (5.5%) 707 40 (5.7%)
Figure 3.33 Relative risks of MACE associated with first line antihypertensive medication classes compared to Thiazides
Table 3.62 Relative Treatment Effect of Pairwise Comparisons Expressed as RR (95% Credible Interval) of MACE Associated with Antihypertensive Drug Class Comparisons (read top to left)
ACE CCB THZ ACE ACE 1.6 (0.71, 3.7) 1.2 (0.48, 3.2) CCB 0.61 (0.27, 1.4) CCB 0.77 (0.45, 1.3) THZ 0.81 (0.31, 2.1) 1.3 (0.77, 2.2) THZ
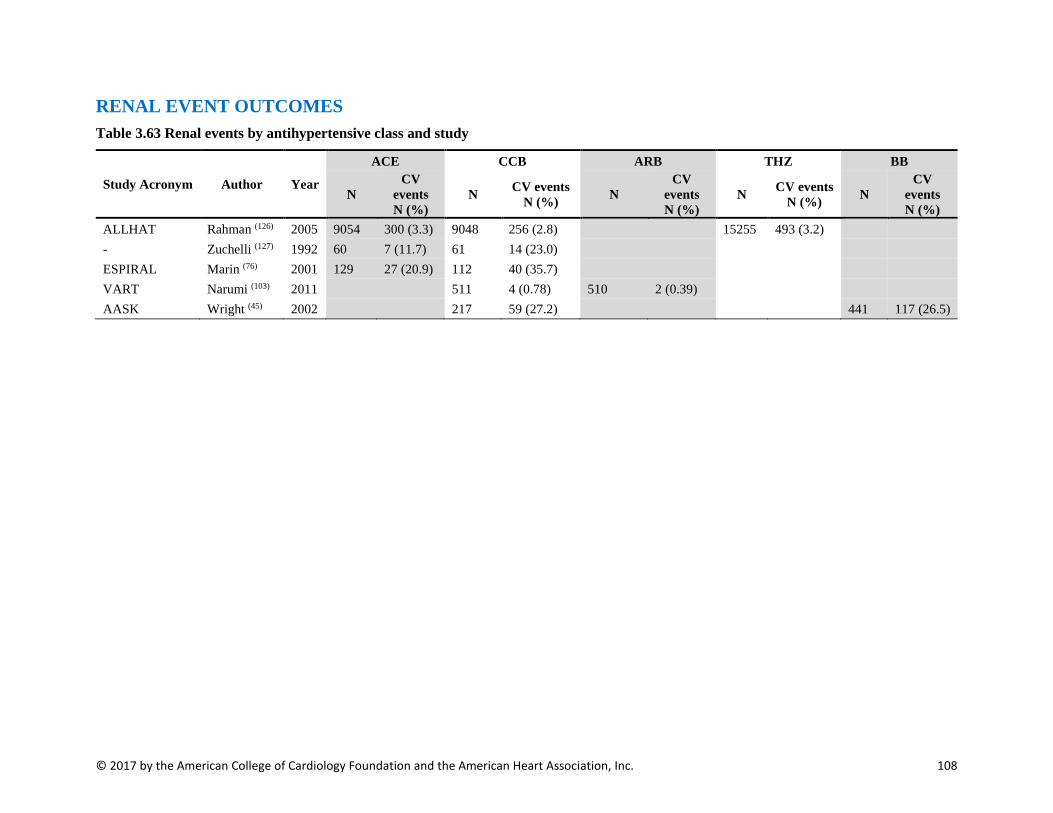
© 2017 by the American College of Cardiology Foundation and the American Heart Association, Inc. 108
RENAL EVENT OUTCOMES Table 3.63 Renal events by antihypertensive class and study
Study Acronym Author Year
ACE CCB ARB THZ BB
N CV
events N (%)
N CV events N (%) N
CV events N (%)
N CV events N (%) N
CV events N (%)
ALLHAT Rahman (126) 2005 9054 300 (3.3) 9048 256 (2.8) 15255 493 (3.2) - Zuchelli (127) 1992 60 7 (11.7) 61 14 (23.0) ESPIRAL Marin (76) 2001 129 27 (20.9) 112 40 (35.7) VART Narumi (103) 2011 511 4 (0.78) 510 2 (0.39) AASK Wright (45) 2002 217 59 (27.2) 441 117 (26.5)

© 2017 by the American College of Cardiology Foundation and the American Heart Association, Inc. 109
Table 3.64 Outcome descriptions for renal events Study Acronym Author Year Outcome Name
ALLHAT Rahman (126) 2005 Composite, End-Stage Renal Disease or Composite, Halving of Estimated Glomerular Filtration Rate
- Zuchelli (127) 1992 Dialysis
ESPIRAL Marin (76) 2001 Composite, Doubling of Creatinine Levels or Composite, Dialysis
VART Narumi (103) 2011 Composite, Doubling of Creatinine Levels or Composite, Dialysis
AASK Wright (45) 2002
Composite, Halving of Estimated Glomerular Filtration Rate or Composite, Glomerular Filtration Rate 25 mL/min/1.73m², Decrease or Composite, End-Stage Renal Disease or Composite, Mortality, All-Cause
Table 3.65 Relative Treatment Effect of Pooled Network Comparisons Expressed as RR (95% Credible Interval) of Major CV Events Associated with Antihypertensive Drug Class Comparisons
ACE ARB BB CCB THZ ACE ACE 0.9 (0.12, 6.2) 1.1 (0.47, 2.9) 1.2 (0.72, 2.2) 1.2 (0.53, 2.7) ARB 1.1 (0.16, 8.7) ARB 1.3 (0.16, 12) 1.4 (0.22, 9.9) 1.3 (0.18, 11) BB 0.87 (0.34, 2.1) 0.79 (0.082, 6.4) BB 1.1 (0.37, 3.1) 1 (0.3, 3.5) CCB 0.81 (0.45, 1.4) 0.73 (0.1, 4.4) 0.94 (0.32, 2.7) CCB 0.95 (0.41, 2.2) THZ 0.86 (0.37, 1.9) 0.76 (0.091, 5.6) 0.98 (0.29, 3.3) 1 (0.46, 2.5) THZ
Figure 3.34 Relative Treatment Effects of Indirect Comparison Expressed as RR (95% Credible Interval) of major CV events associated with first line antihypertensive medication classes compared to THZ

© 2017 by the American College of Cardiology Foundation and the American Heart Association, Inc. 110
References 1. Midanik LT, Resnick B, Hurley LB, et al. Home blood pressure monitoring for mild hypertensives. Public Health Rep. 1991; 106:85-9. 2. Soghikian K, Casper SM, Fireman BH, et al. Home blood pressure monitoring. Effect on use of medical services and medical care costs. Med Care. 1992; 30:855-65. 3. Staessen JA, Den Hond E, Celis H, et al. Antihypertensive treatment based on blood pressure measurement at home or in the physician's office: a randomized controlled trial. JAMA. 2004; 291:955-64. 4. McManus RJ, Mant J, Roalfe A, et al. Targets and self monitoring in hypertension: randomised controlled trial and cost effectiveness analysis. BMJ (Clinical research ed.). 2005; 331:493. 5. Marquez-Contreras E, Martell-Claros N, Gil-Guillen V, et al. Efficacy of a home blood pressure monitoring programme on therapeutic compliance in hypertension: the EAPACUM-HTA study. Journal of hypertension. 2006; 24:169-75. 6. Verberk WJ, Kroon AA, Lenders JW, et al. Self-measurement of blood pressure at home reduces the need for antihypertensive drugs: a randomized, controlled trial. Hypertension (Dallas, Tex. : 1979). 2007; 50:1019-25. 7. Bosworth HB, Olsen MK, Grubber JM, et al. Two self-management interventions to improve hypertension control: a randomized trial. Ann Intern Med. 2009; 151:687-95. 8. Godwin M, Lam M, Birtwhistle R, et al. A primary care pragmatic cluster randomized trial of the use of home blood pressure monitoring on blood pressure levels in hypertensive patients with above target blood pressure. Fam Pract. 2010; 27:135-42. 9. Varis J and Kantola I. The choice of home blood pressure result reporting method is essential: Results mailed to physicians did not improve hypertension control compared with ordinary office-based blood pressure treatment. Blood Press. 2010; 19:319-24. 10. Oliver S, Jones J, Leonard D, et al. Improving adherence with amlodipine/atorvastatin therapy: IMPACT study. J Clin Hypertens (Greenwich). 2011; 13:598-604. 11. Hebert PL, Sisk JE, Tuzzio L, et al. Nurse-led disease management for hypertension control in a diverse urban community: a randomized trial. Journal of general internal medicine. 2012; 27:630-9. 12. McKinstry B, Hanley J, Wild S, et al. Telemonitoring based service redesign for the management of uncontrolled hypertension: multicentre randomised controlled trial. BMJ (Clinical research ed.). 2013; 346:f3030. 13. Hosseininasab M, Jahangard-Rafsanjani Z, Mohagheghi A, et al. Self-monitoring of blood pressure for improving adherence to antihypertensive medicines and blood pressure control: a randomized controlled trial. Am J Hypertens. 2014; 27:1339-45. 14. Margolis KL, O'Connor PJ, Morgan TM, et al. Outcomes of combined cardiovascular risk factor management strategies in type 2 diabetes: the ACCORD randomized trial. Diabetes care. 2014; 37:1721-8. 15. Margolis KL, Palermo L, Vittinghoff E, et al. Intensive blood pressure control, falls, and fractures in patients with type 2 diabetes: the ACCORD trial. Journal of general internal medicine. 2014; 29:1599-606. 16. Reboldi G, Angeli F, de Simone G, et al. Tight versus standard blood pressure control in patients with hypertension with and without cardiovascular disease. Hypertension (Dallas, Tex. : 1979). 2014; 63:475-82. 17. White CL, Szychowski JM, Pergola PE, et al. Can blood pressure be lowered safely in older adults with lacunar stroke? The Secondary Prevention of Small Subcortical Strokes study experience. Journal of the American Geriatrics Society. 2015; 63:722-9. 18. Palacio S, McClure LA, Benavente OR, et al. Lacunar strokes in patients with diabetes mellitus: risk factors, infarct location, and prognosis: the secondary prevention of small subcortical strokes study. Stroke. 2014; 45:2689-94.
© 2017 by the American College of Cardiology Foundation and the American Heart Association, Inc. 111
19. Pearce LA, McClure LA, Anderson DC, et al. Effects of long-term blood pressure lowering and dual antiplatelet treatment on cognitive function in patients with recent lacunar stroke: a secondary analysis from the SPS3 randomised trial. The Lancet. Neurology. 2014; 13:1177-85. 20. Rakugi H, Ogihara T, Goto Y, et al. Comparison of strict- and mild-blood pressure control in elderly hypertensive patients: a per-protocol analysis of JATOS. Hypertension research : official journal of the Japanese Society of Hypertension. 2010; 33:1124-8. 21. Holman RR, Paul SK, Bethel MA, et al. Long-term follow-up after tight control of blood pressure in type 2 diabetes. The New England journal of medicine. 2008; 359:1565-76. 22. Kjeldsen SE, Kolloch RE, Leonetti G, et al. Influence of gender and age on preventing cardiovascular disease by antihypertensive treatment and acetylsalicylic acid. The HOT study. Hypertension Optimal Treatment. Journal of hypertension. 2000; 18:629-42. 23. Zanchetti A, Hansson L, Clement D, et al. Benefits and risks of more intensive blood pressure lowering in hypertensive patients of the HOT study with different risk profiles: does a J-shaped curve exist in smokers? Journal of hypertension. 2003; 21:797-804. 24. Contreras G, Greene T, Agodoa LY, et al. Blood pressure control, drug therapy, and kidney disease. Hypertension (Dallas, Tex. : 1979). 2005; 46:44-50. 25. Appel LJ, Wright JT, Jr., Greene T, et al. Intensive blood-pressure control in hypertensive chronic kidney disease. The New England journal of medicine. 2010; 363:918-29. 26. Davis EM, Appel LJ, Wang X, et al. Limitations of analyses based on achieved blood pressure: lessons from the African American study of kidney disease and hypertension trial. Hypertension (Dallas, Tex. : 1979). 2011; 57:1061-8. 27. Ku E, Glidden DV, Johansen KL, et al. Association between strict blood pressure control during chronic kidney disease and lower mortality after onset of end-stage renal disease. Kidney international. 2015; 87:1055-60. 28. Cushman WC, Evans GW, Byington RP, et al. Effects of intensive blood-pressure control in type 2 diabetes mellitus: ACCORD. The New England journal of medicine. 2010; 362:1575-85. 29. Ismail-Beigi F, Craven TE, O'Connor PJ, et al. Combined intensive blood pressure and glycemic control does not produce an additive benefit on microvascular outcomes in type 2 diabetic patients. Kidney international. 2012; 81:586-94. 30. Wright JT, Jr., Williamson JD, Whelton PK, et al. A Randomized Trial of Intensive versus Standard Blood-Pressure Control. The New England journal of medicine. 2015; 373:2103-16. 31. Verdecchia P, Staessen JA, Angeli F, et al. Usual versus tight control of systolic blood pressure in non-diabetic patients with hypertension (Cardio-Sis): an open-label randomised trial. Lancet (London, England). 2009; 374:525-33. 32. Benavente OR, Coffey CS, Conwit R, et al. Blood-pressure targets in patients with recent lacunar stroke: the SPS3 randomised trial. Lancet (London, England). 2013; 382:507-15. 33. Ogihara T, Saruta T, Rakugi H, et al. Target blood pressure for treatment of isolated systolic hypertension in the elderly: valsartan in elderly isolated systolic hypertension study. Hypertension (Dallas, Tex. : 1979). 2010; 56:196-202. 34. Hayashi K, Saruta T, Goto Y, et al. Impact of renal function on cardiovascular events in elderly hypertensive patients treated with efonidipine. Hypertension research : official journal of the Japanese Society of Hypertension. 2010; 33:1211-20. 35. Jatos Study Group. Principal results of the Japanese trial to assess optimal systolic blood pressure in elderly hypertensive patients (JATOS). Hypertension research : official journal of the Japanese Society of Hypertension. 2008; 31:2115-27. 36. Schrier RW, Abebe KZ, Perrone RD, et al. Blood pressure in early autosomal dominant polycystic kidney disease. The New England journal of medicine. 2014; 371:2255-66. 37. Asayama K, Ohkubo T, Metoki H, et al. Cardiovascular outcomes in the first trial of antihypertensive therapy guided by self-measured home blood pressure. Hypertension research : official journal of the Japanese Society of Hypertension. 2012; 35:1102-10.

© 2017 by the American College of Cardiology Foundation and the American Heart Association, Inc. 112
38. Ruggenenti P, Perna A, Loriga G, et al. Blood-pressure control for renoprotection in patients with non-diabetic chronic renal disease (REIN-2): multicentre, randomised controlled trial. Lancet (London, England). 2005; 365:939-46. 39. Wei Y, Jin Z, Shen G, et al. Effects of intensive antihypertensive treatment on Chinese hypertensive patients older than 70 years. J Clin Hypertens (Greenwich). 2013; 15:420-7. 40. Tight blood pressure control and risk of macrovascular and microvascular complications in type 2 diabetes: UKPDS 38. UK Prospective Diabetes Study Group. BMJ (Clinical research ed.). 1998; 317:703-13. 41. Estacio RO, Jeffers BW, Gifford N, et al. Effect of blood pressure control on diabetic microvascular complications in patients with hypertension and type 2 diabetes. Diabetes care. 2000; 23 Suppl 2:B54-64. 42. Schrier RW, Estacio RO, Esler A, et al. Effects of aggressive blood pressure control in normotensive type 2 diabetic patients on albuminuria, retinopathy and strokes. Kidney international. 2002; 61:1086-97. 43. Savage S, Johnson Nagel N, Estacio RO, et al. The ABCD (Appropriate Blood Pressure Control in Diabetes) trial. Rationale and design of a trial of hypertension control (moderate or intensive) in type II diabetes. Online J Curr Clin Trials. 1993; Doc No 104:[6250 words; 128 paragraphs]. 44. Hansson L, Zanchetti A, Carruthers SG, et al. Effects of intensive blood-pressure lowering and low-dose aspirin in patients with hypertension: principal results of the Hypertension Optimal Treatment (HOT) randomised trial. HOT Study Group. Lancet (London, England). 1998; 351:1755-62. 45. Wright JT, Jr., Bakris G, Greene T, et al. Effect of blood pressure lowering and antihypertensive drug class on progression of hypertensive kidney disease: results from the AASK trial. Jama. 2002; 288:2421-31. 46. Norris K, Bourgoigne J, Gassman J, et al. Cardiovascular outcomes in the African American Study of Kidney Disease and Hypertension (AASK) Trial. Am J Kidney Dis. 2006; 48:739-51. 47. Sarnak MJ, Greene T, Wang X, et al. The effect of a lower target blood pressure on the progression of kidney disease: long-term follow-up of the modification of diet in renal disease study. Ann Intern Med. 2005; 142:342-51. 48. Cardio-Sis Study G. Randomized study of traditional versus aggressive systolic blood pressure control (Cardio-Sis): rationale, design and characteristics of the study population. J Hum Hypertens. 2008; 22:243-51. 49. Benavente OR, White CL, Pearce L, et al. The Secondary Prevention of Small Subcortical Strokes (SPS3) study. Int J Stroke. 2011; 6:164-75. 50. Ogihara T, Saruta T, Matsuoka H, et al. valsartan in elderly isolated systolic hypertension (VALISH) study: rationale and design. Hypertension research : official journal of the Japanese Society of Hypertension. 2004; 27:657-61. 51. Chapman AB, Torres VE, Perrone RD, et al. The HALT polycystic kidney disease trials: design and implementation. Clin J Am Soc Nephrol. 2010; 5:102-9. 52. Fujiwara T, Nishimura T, Ohkuko T, et al. Rationale and design of HOMED-BP Study: hypertension objective treatment based on measurement by electrical devices of blood pressure study. Blood Press Monit. 2002; 7:77-82. 53. UK Prospective Diabetes Study (UKPDS). VIII. Study design, progress and performance. Diabetologia. 1991; 34:877-90. 54. Wright JT, Jr., Bakris G, Greene T, et al. Effect of blood pressure lowering and antihypertensive drug class on progression of hypertensive kidney disease: results from the AASK trial. JAMA. 2002; 288:2421-31. 55. Davis EM, Appel LJ, Wang X, et al. Limitations of analyses based on achieved blood pressure: lessons from the African American study of kidney disease and hypertension trial. Hypertension (Dallas, Tex. : 1979). 2011; 57:1061-8. 56. Agodoa LY, Appel L, Bakris GL, et al. Effect of ramipril vs amlodipine on renal outcomes in hypertensive nephrosclerosis: a randomized controlled trial. Jama. 2001; 285:2719-28.
© 2017 by the American College of Cardiology Foundation and the American Heart Association, Inc. 113
57. Lv J, Neal B, Ehteshami P, et al. Effects of intensive blood pressure lowering on cardiovascular and renal outcomes: a systematic review and meta-analysis. PLoS Med. 2012; 9:e1001293. 58. Brunstrom M and Carlberg B. Effect of antihypertensive treatment at different blood pressure levels in patients with diabetes mellitus: systematic review and meta-analyses. BMJ (Clinical research ed.). 2016; 352:i717. 59. Ettehad D, Emdin CA, Kiran A, et al. Blood pressure lowering for prevention of cardiovascular disease and death: a systematic review and meta-analysis. Lancet (London, England). 2016; 387:957-67. 60. Thomopoulos C, Parati G and Zanchetti A. Effects of blood pressure lowering on outcome incidence in hypertension: 7. Effects of more vs. less intensive blood pressure lowering and different achieved blood pressure levels - updated overview and meta-analyses of randomized trials. Journal of hypertension. 2016; 34:613-22. 61. Verdecchia P, Angeli F, Gentile G, et al. More Versus Less Intensive Blood Pressure–Lowering StrategyNovelty and Significance. Hypertension (Dallas, Tex. : 1979). 2016; 68:642-53. 62. Xie X, Atkins E, Lv J, et al. Effects of intensive blood pressure lowering on cardiovascular and renal outcomes: updated systematic review and meta-analysis. Lancet (London, England). 2016; 387:435-43. 63. Bangalore S, Toklu B, Gianos E, et al. Optimal systolic blood pressure target after SPRINT: insights from a network meta-analysis of randomized trials. Am J Med. 2017; 130:707-19.e8. 64. Bavishi C, Bangalore S and Messerli FH. Outcomes of intensive blood pressure lowering in older hypertensive patients. Journal of the American College of Cardiology. 2017; 69:486-93. 65. Weiss J, Freeman M, Low A, et al. Benefits and Harms of Intensive Blood Pressure Treatment in Adults Aged 60 Years or Older: A Systematic Review and Meta-analysis. Ann Intern Med. 2017. 66. Estacio RO, Jeffers BW, Hiatt WR, et al. The Effect of Nisoldipine as Compared with Enalapril on Cardiovascular Outcomes in Patients with Non-Insulin-Dependent Diabetes and Hypertension. New England Journal of Medicine. 1998; 338:645-52. 67. Estacio RO and Schrier RW. Antihypertensive therapy in type 2 diabetes: implications of the appropriate blood pressure control in diabetes (ABCD) trial. Am J Cardiol. 1998; 82:9r-14r. 68. Major outcomes in high-risk hypertensive patients randomized to angiotensin-converting enzyme inhibitor or calcium channel blocker vs diuretic: The Antihypertensive and Lipid-Lowering Treatment to Prevent Heart Attack Trial (ALLHAT). Jama. 2002; 288:2981-97. 69. Wing LM, Reid CM, Ryan P, et al. A comparison of outcomes with angiotensin-converting--enzyme inhibitors and diuretics for hypertension in the elderly. The New England journal of medicine. 2003; 348:583-92. 70. Dahlof B, Sever PS, Poulter NR, et al. Prevention of cardiovascular events with an antihypertensive regimen of amlodipine adding perindopril as required versus atenolol adding bendroflumethiazide as required, in the Anglo-Scandinavian Cardiac Outcomes Trial-Blood Pressure Lowering Arm (ASCOT-BPLA): a multicentre randomised controlled trial. Lancet (London, England). 2005; 366:895-906. 71. Ruggenenti P, Fassi A, Ilieva AP, et al. Preventing Microalbuminuria in Type 2 Diabetes. New England Journal of Medicine. 2004; 351:1941-51. 72. Spinar J, Vitovec J, Soucek M, et al. CORD: COmparsion of Recommended Doses of ACE inhibitors and angiotensin II receptor blockers. Vnitr Lek. 2009; 55:481-8. 73. Barnett AH, Bain SC, Bouter P, et al. Angiotensin-Receptor Blockade versus Converting–Enzyme Inhibition in Type 2 Diabetes and Nephropathy. New England Journal of Medicine. 2004; 351:1952-61. 74. Zanchetti A, Bond MG, Hennig M, et al. Calcium antagonist lacidipine slows down progression of asymptomatic carotid atherosclerosis: principal results of the European Lacidipine Study on Atherosclerosis (ELSA), a randomized, double-blind, long-term trial. Circulation. 2002; 106:2422-7. 75. Terpstra WF, May JF, Smit AJ, et al. Effects of amlodipine and lisinopril on intima-media thickness in previously untreated, elderly hypertensive patients (the ELVERA trial). Journal of hypertension. 2004; 22:1309-16.
© 2017 by the American College of Cardiology Foundation and the American Heart Association, Inc. 114
76. Marin R, Ruilope LM, Aljama P, et al. A random comparison of fosinopril and nifedipine GITS in patients with primary renal disease. Journal of hypertension. 2001; 19:1871-6. 77. Tatti P, Pahor M, Byington RP, et al. Outcome results of the Fosinopril Versus Amlodipine Cardiovascular Events Randomized Trial (FACET) in patients with hypertension and NIDDM. Diabetes care. 1998; 21:597-603. 78. Wilhelmsen L, Berglund G, Elmfeldt D, et al. Beta-blockers versus diuretics in hypertensive men: main results from the HAPPHY trial. Journal of hypertension. 1987; 5:561-72. 79. Bulpitt CJ, Beckett NS, Cooke J, et al. Results of the pilot study for the Hypertension in the Very Elderly Trial. Journal of hypertension. 2003; 21:2409-17. 80. Lewis EJ, Hunsicker LG, Clarke WR, et al. Renoprotective Effect of the Angiotensin-Receptor Antagonist Irbesartan in Patients with Nephropathy Due to Type 2 Diabetes. New England Journal of Medicine. 2001; 345:851-60. 81. Yui Y, Sumiyoshi T, Kodama K, et al. Nifedipine retard was as effective as angiotensin converting enzyme inhibitors in preventing cardiac events in high-risk hypertensive patients with diabetes and coronary artery disease: the Japan Multicenter Investigation for Cardiovascular Diseases-B (JMIC-B) subgroup analysis. Hypertension research : official journal of the Japanese Society of Hypertension. 2004; 27:449-56. 82. Yui Y, Sumiyoshi T, Kodama K, et al. Comparison of nifedipine retard with angiotensin converting enzyme inhibitors in Japanese hypertensive patients with coronary artery disease: the Japan Multicenter Investigation for Cardiovascular Diseases-B (JMIC-B) randomized trial. Hypertension research : official journal of the Japanese Society of Hypertension. 2004; 27:181-91. 83. Dahlof B, Devereux RB, Kjeldsen SE, et al. Cardiovascular morbidity and mortality in the Losartan Intervention For Endpoint reduction in hypertension study (LIFE): a randomised trial against atenolol. Lancet (London, England). 2002; 359:995-1003. 84. Gosse P, Sheridan DJ, Zannad F, et al. Regression of left ventricular hypertrophy in hypertensive patients treated with indapamide SR 1.5 mg versus enalapril 20 mg: the LIVE study. Journal of hypertension. 2000; 18:1465-75. 85. Schrader J, Luders S, Kulschewski A, et al. Morbidity and Mortality After Stroke, Eprosartan Compared with Nitrendipine for Secondary Prevention: principal results of a prospective randomized controlled study (MOSES). Stroke. 2005; 36:1218-26. 86. MRC trial of treatment of mild hypertension: principal results. Medical Research Council Working Party. British medical journal (Clinical research ed.). 1985; 291:97-104. 87. Medical Research Council trial of treatment of hypertension in older adults: principal results. MRC Working Party. BMJ (Clinical research ed.). 1992; 304:405-12. 88. Brown MJ, Palmer CR, Castaigne A, et al. Morbidity and mortality in patients randomised to double-blind treatment with a long-acting calcium-channel blocker or diuretic in the International Nifedipine GITS study: Intervention as a Goal in Hypertension Treatment (INSIGHT). Lancet (London, England). 2000; 356:366-72. 89. Fogari R, Preti P, Zoppi A, et al. Effects of amlodipine fosinopril combination on microalbuminuria in hypertensive type 2 diabetic patients. Am J Hypertens. 2002; 15:1042-9. 90. Rosendorff C, Dubiel R, Xu J, et al. Comparison of olmesartan medoxomil versus amlodipine besylate on regression of ventricular and vascular hypertrophy. Am J Cardiol. 2009; 104:359-65. 91. Cacciapuoti F, Perrone N, Diaspro R, et al. Slowing of mitral valve annular calcium in systemic hypertension by nifedipine and comparisons with enalapril and atenolol. Am J Cardiol. 1993; 72:1038-42. 92. Zucchelli P, Zuccala A and Gaggi R. Comparison of the effects of ACE inhibitors and calcium channel blockers on the progression of renal failure. Nephrol Dial Transplant. 1995; 10 Suppl 9:46-51. 93. Yilmaz R, Altun B, Kahraman S, et al. Impact of amlodipine or ramipril treatment on left ventricular mass and carotid intima-media thickness in nondiabetic hemodialysis patients. Ren Fail. 2010; 32:903-12. 94. Agarwal R, Sinha AD, Pappas MK, et al. Hypertension in hemodialysis patients treated with atenolol or lisinopril: a randomized controlled trial. Nephrol Dial Transplant. 2014; 29:672-81.

© 2017 by the American College of Cardiology Foundation and the American Heart Association, Inc. 115
95. Omvik P, Thaulow E, Herland OB, et al. Double-blind, parallel, comparative study on quality of life during treatment with amlodipine or enalapril in mild or moderate hypertensive patients: a multicentre study. Journal of hypertension. 1993; 11:103-13. 96. Bremner AD, Baur M, Oddou-Stock P, et al. Valsartan: long-term efficacy and tolerability compared to lisinopril in elderly patients with essential hypertension. Clin Exp Hypertens. 1997; 19:1263-85. 97. Sareli P, Radevski IV, Valtchanova ZP, et al. Efficacy of different drug classes used to initiate antihypertensive treatment in black subjects: results of a randomized trial in Johannesburg, South Africa. Arch Intern Med. 2001; 161:965-71. 98. Marre M, Puig JG, Kokot F, et al. Equivalence of indapamide SR and enalapril on microalbuminuria reduction in hypertensive patients with type 2 diabetes: the NESTOR Study. Journal of hypertension. 2004; 22:1613-22. 99. Malacco E, Mancia G, Rappelli A, et al. Treatment of isolated systolic hypertension: the SHELL study results. Blood Press. 2003; 12:160-7. 100. Hansson L, Lindholm LH, Ekbom T, et al. Randomised trial of old and new antihypertensive drugs in elderly patients: cardiovascular mortality and morbidity the Swedish Trial in Old Patients with Hypertension-2 study. Lancet (London, England). 1999; 354:1751-6. 101. Efficacy of atenolol and captopril in reducing risk of macrovascular and microvascular complications in type 2 diabetes: UKPDS 39. UK Prospective Diabetes Study Group. BMJ (Clinical research ed.). 1998; 317:713-20. 102. Julius S, Kjeldsen SE, Weber M, et al. Outcomes in hypertensive patients at high cardiovascular risk treated with regimens based on valsartan or amlodipine: the VALUE randomised trial. Lancet (London, England). 2004; 363:2022-31. 103. Narumi H, Takano H, Shindo S, et al. Effects of valsartan and amlodipine on cardiorenal protection in Japanese hypertensive patients: the Valsartan Amlodipine Randomized Trial. Hypertension research : official journal of the Japanese Society of Hypertension. 2011; 34:62-9. 104. Rosei EA, Dal Palu C, Leonetti G, et al. Clinical results of the Verapamil inHypertension and Atherosclerosis Study. VHAS Investigators. Journal of hypertension. 1997; 15:1337-44. 105. Borhani NO, Mercuri M, Borhani PA, et al. Final outcome results of the Multicenter Isradipine Diuretic Atherosclerosis Study (MIDAS). A randomized controlled trial. Jama. 1996; 276:785-91. 106. Katayama S, Kawamori R, Iwamoto Y, et al. In half of hypertensive diabetics, co-administration of a calcium channel blocker and an angiotensin-converting enzyme inhibitor achieved a target blood pressure of <130/80 mmHg: the azelnidipine and temocapril in hypertensive patients with type 2 diabetes (ATTEST) study. Hypertension research : official journal of the Japanese Society of Hypertension. 2008; 31:1499-508. 107. Wright JT, Jr., Dunn JK, Cutler JA, et al. Outcomes in hypertensive black and nonblack patients treated with chlorthalidone, amlodipine, and lisinopril. Jama. 2005; 293:1595-608. 108. Julius S, Alderman MH, Beevers G, et al. Cardiovascular risk reduction in hypertensive black patients with left ventricular hypertrophy: the LIFE study. Journal of the American College of Cardiology. 2004; 43:1047-55. 109. Yamal JM, Oparil S, Davis BR, et al. Stroke outcomes among participants randomized to chlorthalidone, amlodipine or lisinopril in ALLHAT. J Am Soc Hypertens. 2014; 8:808-19. 110. Oparil S, Davis BR, Cushman WC, et al. Mortality and morbidity during and after ALLHAT: Results by gender. Hypertension (Dallas, Tex. : 1979). 2013; 61:977-86. 111. Os I, Franco V, Kjeldsen SE, et al. Effects of losartan in women with hypertension and left ventricular hypertrophy: results from the Losartan Intervention for Endpoint Reduction in Hypertension Study. Hypertension (Dallas, Tex. : 1979). 2008; 51:1103-8. 112. Lindholm LH, Hansson L, Ekbom T, et al. Comparison of antihypertensive treatments in preventing cardiovascular events in elderly diabetic patients: results from the Swedish Trial in Old Patients with Hypertension-2. STOP Hypertension-2 Study Group. Journal of hypertension. 2000; 18:1671-5.
© 2017 by the American College of Cardiology Foundation and the American Heart Association, Inc. 116
113. Lindholm LH, Ibsen H, Borch-Johnsen K, et al. Risk of new-onset diabetes in the Losartan Intervention For Endpoint reduction in hypertension study. Journal of hypertension. 2002; 20:1879-86. 114. Lindholm LH, Ibsen H, Dahlof B, et al. Cardiovascular morbidity and mortality in patients with diabetes in the Losartan Intervention For Endpoint reduction in hypertension study (LIFE): a randomised trial against atenolol. Lancet (London, England). 2002; 359:1004-10. 115. Berl T, Hunsicker LG, Lewis JB, et al. Cardiovascular outcomes in the Irbesartan Diabetic Nephropathy Trial of patients with type 2 diabetes and overt nephropathy. Ann Intern Med. 2003; 138:542-9. 116. Yamashita T, Inoue H, Okumura K, et al. Randomized trial of angiotensin II-receptor blocker vs. dihydropiridine calcium channel blocker in the treatment of paroxysmal atrial fibrillation with hypertension (J-RHYTHM II study). Europace. 2011; 13:473-9. 117. Du H, Fan J, Ling Z, et al. Effect of nifedipine versus telmisartan on prevention of atrial fibrillation recurrence in hypertensive patients. Hypertension (Dallas, Tex. : 1979). 2013; 61:786-92. 118. Randomized double-blind comparison of a calcium antagonist and a diuretic in elderly hypertensives. National Intervention Cooperative Study in Elderly Hypertensives Study Group. Hypertension (Dallas, Tex. : 1979). 1999; 34:1129-33. 119. Lindholm LH, Persson M, Alaupovic P, et al. Metabolic outcome during 1 year in newly detected hypertensives: results of the Antihypertensive Treatment and Lipid Profile in a North of Sweden Efficacy Evaluation (ALPINE study). Journal of hypertension. 2003; 21:1563-74. 120. Zanchetti A, Crepaldi G, Bond MG, et al. Different effects of antihypertensive regimens based on fosinopril or hydrochlorothiazide with or without lipid lowering by pravastatin on progression of asymptomatic carotid atherosclerosis: principal results of PHYLLIS--a randomized double-blind trial. Stroke. 2004; 35:2807-12. 121. Baba S. Nifedipine and enalapril equally reduce the progression of nephropathy in hypertensive type 2 diabetics. Diabetes Res Clin Pract. 2001; 54:191-201. 122. Collier DJ, Poulter NR, Dahlof B, et al. Impact of amlodipine-based therapy among older and younger patients in the Anglo-Scandinavian Cardiac Outcomes Trial-Blood Pressure Lowering Arm (ASCOT-BPLA). Journal of hypertension. 2011; 29:583-91. 123. Peart S. Results of MRC (UK) trial of drug therapy for mild hypertension. Clin Invest Med. 1987; 10:616-20. 124. Cushman WC, Davis BR, Pressel SL, et al. Mortality and morbidity during and after the Antihypertensive and Lipid-Lowering Treatment to Prevent Heart Attack Trial. J Clin Hypertens (Greenwich). 2012; 14:20-31. 125. Chowdhury EK, Owen A, Ademi Z, et al. Short- and Long-Term Survival in Treated Elderly Hypertensive Patients With or Without Diabetes: Findings From the Second Australian National Blood Pressure Study. American Journal of Hypertension. 2014; 27:199-206. 126. Rahman M, Pressel S, Davis BR, et al. Renal outcomes in high-risk hypertensive patients treated with an angiotensin-converting enzyme inhibitor or a calcium channel blocker vs a diuretic: a report from the Antihypertensive and Lipid-Lowering Treatment to Prevent Heart Attack Trial (ALLHAT). Arch Intern Med. 2005; 165:936-46. 127. Zucchelli P, Zuccala A, Borghi M, et al. Long-term comparison between captopril and nifedipine in the progression of renal insufficiency. Kidney international. 1992; 42:452-8.