systematics, taxonomy, & phylogenetics david l. reed, mammalogy class august 27, 2002
TRANSCRIPT

Systematics, Taxonomy, Systematics, Taxonomy, &&
PhylogeneticsPhylogeneticsDavid L. Reed, David L. Reed,
Mammalogy ClassMammalogy Class August 27, 2002 August 27, 2002
• Systematics is the study of the diversity Systematics is the study of the diversity of organisms and the relationships of organisms and the relationships among these organisms.among these organisms.
• It provides the framework for studies of It provides the framework for studies of biological diversity & evolutionbiological diversity & evolution
SystematicsSystematics is …. is ….

• ClassificationClassification - ordering of organisms into - ordering of organisms into groups (pigeon-holing) groups (pigeon-holing)
• NomenclatureNomenclature - the naming of organisms - the naming of organisms
• IdentificationIdentification- placement of a new organism - placement of a new organism into a previously described groupinto a previously described group
Systematics comprises:Systematics comprises:
Linnaeus’ Binomial NomenclatureLinnaeus’ Binomial Nomenclature• Domain, Kingdom, Phylum, Class, Order, Domain, Kingdom, Phylum, Class, Order,
Family, Genus, and SpeciesFamily, Genus, and Species
• Latin binomial (Latin binomial (GenusGenus speciesspecies))
• Hierarchical structureHierarchical structure
• Very flexible when changes need to be madeVery flexible when changes need to be made
• Book outlining all the rules for nomenclatureBook outlining all the rules for nomenclature
• Work an exampleWork an example
ClassificationsClassifications
• PheneticPhenetic– Based on overall similarity (Phenetic)Based on overall similarity (Phenetic)– Pros-- easy to see similarity, intuitivePros-- easy to see similarity, intuitive– Cons--doesn’t account for evolutionary historyCons--doesn’t account for evolutionary history
• PhylogeneticPhylogenetic– Based on shared derived charactersBased on shared derived characters– Pros--contains evolutionary historyPros--contains evolutionary history– Cons--computationally harderCons--computationally harder
• Phenetic classification (grade-level Phenetic classification (grade-level classification) is based upon overall classification) is based upon overall similarity (Numerical Taxomony) similarity (Numerical Taxomony)
• Phenogram: a branching diagram (tree) Phenogram: a branching diagram (tree) that links taxa by estimates of overall that links taxa by estimates of overall similaritysimilarity
Phenetic Classification:Phenetic Classification:

Phenetic GroupingsPhenetic Groupings
• Kangaroos with kangaroo mice (jumping legs)Kangaroos with kangaroo mice (jumping legs)
• Sugar gliders with flying squirrels (gliding Sugar gliders with flying squirrels (gliding membrane)membrane)
• Bats with birds (wings)Bats with birds (wings)
House cat
Mountain Lion
Domestic dog
Grey Fox
Bobcat
Grey Wolf
African Lion

Downfall of PheneticsDownfall of Phenetics
• Overall similarity misled biologists into Overall similarity misled biologists into putting things in non-natural groups (i.e. putting things in non-natural groups (i.e. Ungulata-Artiodactyls + Perrisodactyls)Ungulata-Artiodactyls + Perrisodactyls)
• Better to use characters that are Better to use characters that are evolutionarily shared among group evolutionarily shared among group members (synapomorphic characters)members (synapomorphic characters)

• Based upon evolutionary relationships (i.e. upon Based upon evolutionary relationships (i.e. upon common ancestry)common ancestry)
• Would put all marsupials together because of the Would put all marsupials together because of the synapomorphic pouchsynapomorphic pouch
• Separates birds and bats because they have Separates birds and bats because they have unique evolutionary origins for their wingsunique evolutionary origins for their wings
Phylogenetic classification Phylogenetic classification (cladistics):(cladistics):

Diagrams for Cladistic AnalysesDiagrams for Cladistic Analyses
• Cladogram Cladogram is a tree diagram is a tree diagram which depicts a hypothesised which depicts a hypothesised evolutionary historyevolutionary history
• A PhylogramA Phylogram is a tree which is a tree which indicates by branch length the indicates by branch length the degree of change believed to have degree of change believed to have occurred along each lineageoccurred along each lineage

Bacteria 1
Bacteria 3
Bacteria 2
Eukaryote 1
Eukaryote 4
Eukaryote 3
Eukaryote 2
Bacteria 1
Bacteria 3Bacteria 2
Eukaryote 1
Eukaryote 4Eukaryote 3
Eukaryote 2
Phylograms show branch order and branch lengths
Cladograms and phylogramsCladograms and phylograms
Cladograms show branching order - branch lengths are meaningless
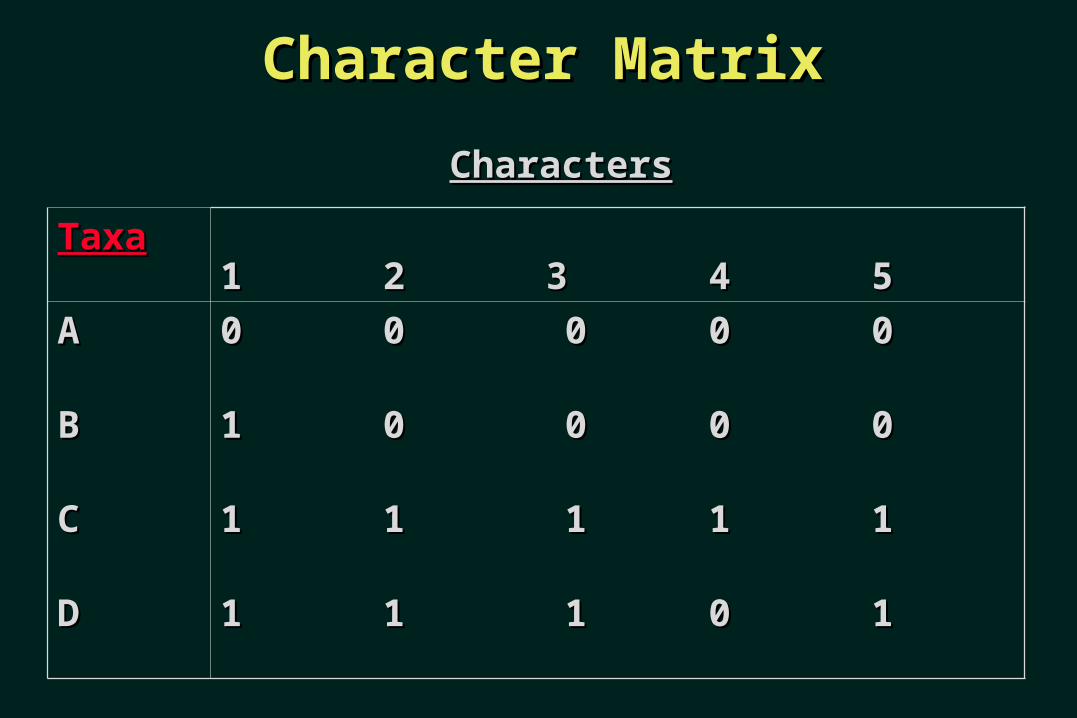
Character MatrixCharacter Matrix
TaxaTaxa11 22 33 44 55
AA 00 00 00 00 00
BB 11 00 00 00 00
CC 11 11 11 11 11
DD 11 11 11 00 11
CharactersCharacters

Unrooted CladogramUnrooted Cladogram
A
B
C
D

Character MatrixCharacter Matrix
TaxaTaxa11 22 33 44 55
A (out)A (out) 00 00 00 00 00
BB 11 11 00 00 00
CC 11 11 11 11 00
DD 11 11 11 11 11
Characters
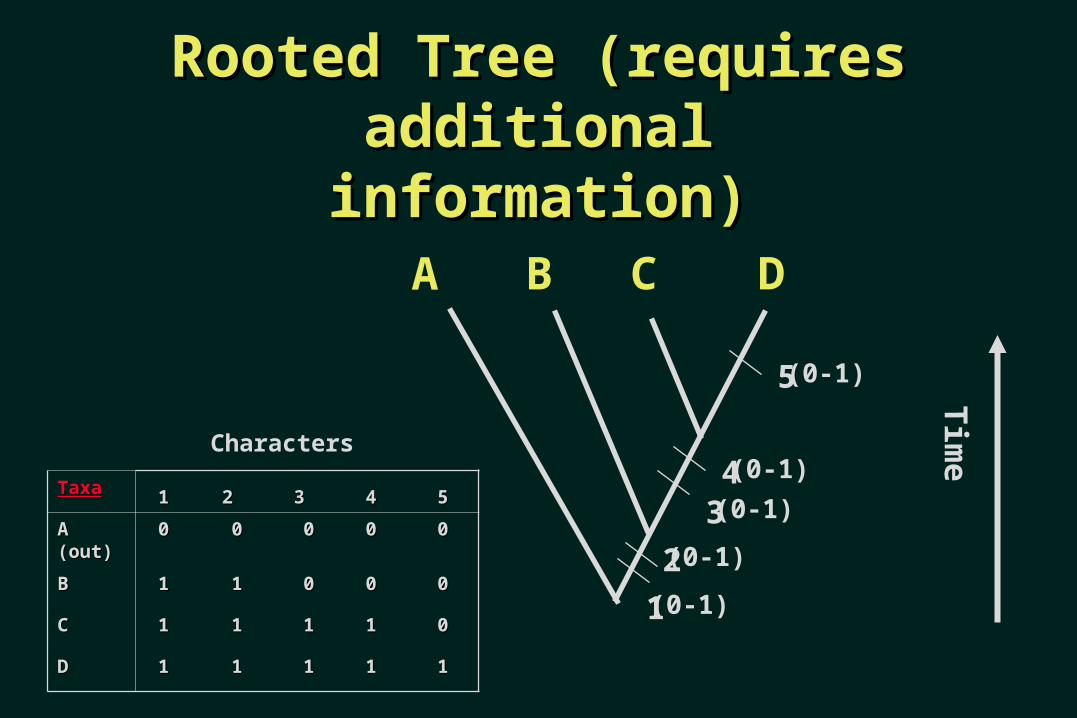
Rooted Tree (requires Rooted Tree (requires additional information)additional information)
DB CA
Tim
e
1
2
34
5
TaxaTaxa 11 22 33 44 55
A (out)A (out) 00 00 00 00 00
BB 11 11 00 00 00
CC 11 11 11 11 00
DD 11 11 11 11 11
Characters
(0-1)
(0-1)
(0-1)
(0-1)
(0-1)

Character MatrixCharacter Matrix
TaxaTaxa11 22 33 44 55
A (out)A (out) 00 00 00 00 00
BB 11 11 11 00 11
CC 11 11 11 00 00
DD 11 00 00 11 00
EE 11 00 00 11 11
CharactersCharacters

Rooted topologyRooted topology
TaxaTaxa 11 22 33 44 55
A (out)A (out) 00 00 00 00 00
BB 11 11 11 00 11
CC 11 11 11 00 00
DD 11 00 00 11 00
EE 11 00 00 11 11
DB CA E
1
(0-1)
2
3
4
5
(0-1)
(0-1)
(0-1)
(0-1)
5


TaxaTaxa No. of Possible Unrooted TreesNo. of Possible Unrooted Trees
44 33
55 1515
66 105105
77 945945
88 10,39510,395
99 135,135135,135
1010 2,027,0252,027,025
1111 34,459,42534,459,425
1212 654,729,075654,729,075
1313 13,749,310,57513,749,310,575
1414 316,234,143,225316,234,143,225
1515 7,905,853,580,6257,905,853,580,625
1616 213,458,046,676,875213,458,046,676,875
1717 6,190,283,353,629,3756,190,283,353,629,375
1818 191,898,783,962,510,625191,898,783,962,510,625
1919 6,332,659,870,762,850,6256,332,659,870,762,850,625
2020 221,643,095,476,699,771,875221,643,095,476,699,771,875
2121 8,200,794,532,637,891,559,375 8,200,794,532,637,891,559,375 <-------(2.5 Billion years to compute!!!!!!!!!!!!!)<-------(2.5 Billion years to compute!!!!!!!!!!!!!)

What about Fossils?What about Fossils?
• Fossils often have far fewer characters to Fossils often have far fewer characters to measuremeasure
• DNA sequencing usually isn’t possibleDNA sequencing usually isn’t possible
• Result is that paleontology still uses Result is that paleontology still uses phenetic classification, sometimesphenetic classification, sometimes
• However, phylogenetic analyses can still However, phylogenetic analyses can still be done when data are availablebe done when data are available

• Uses tree diagrams to portray Uses tree diagrams to portray relationships based upon common ancestryrelationships based upon common ancestry
• Monophyletic groups (clades) - contain Monophyletic groups (clades) - contain species which are more closely related to species which are more closely related to each other than to any outside of the groupeach other than to any outside of the group
Phylogenetic systematicsPhylogenetic systematics

Fox
Coyote Wolf
Cougar
Lion
Domestic Cat
Bobcat
Rodent outgroup
monophyletic groups(clades)
Monophyletic groupsMonophyletic groups

Paraphyly and PolyphylyParaphyly and Polyphyly
Wolf
Fox
Cougar
Dog
Domestic Cat
Bobcat
Rodent outgroup
Canidae (polyphyletic)
Felidae (paraphyletic)
Coyote

What can we use phylogenies for?What can we use phylogenies for?• Character evolutionCharacter evolution
• Host-parasite evolution Host-parasite evolution
• Systematics and TaxonomySystematics and Taxonomy
• Evolutionary historyEvolutionary history
• Comparative biologyComparative biology

Character Evolution - AmniotaCharacter Evolution - Amniota
amnion
absentpresent
3 steps 1 step
Rayfi
nn
ed
fi
sh
lun
gfi
sh
frog
s
sala
mad
ers
mam
mals
turt
les
liza
rds
cro
cod
iles
bir
ds
sn
akes
Rayfi
nn
ed
fi
sh
lun
gfi
sh
frog
s
sala
mad
ers
mam
mals
turt
les
liza
rds
cro
cod
iles
bir
ds
sn
akes


Comparative AnalysesComparative Analyses
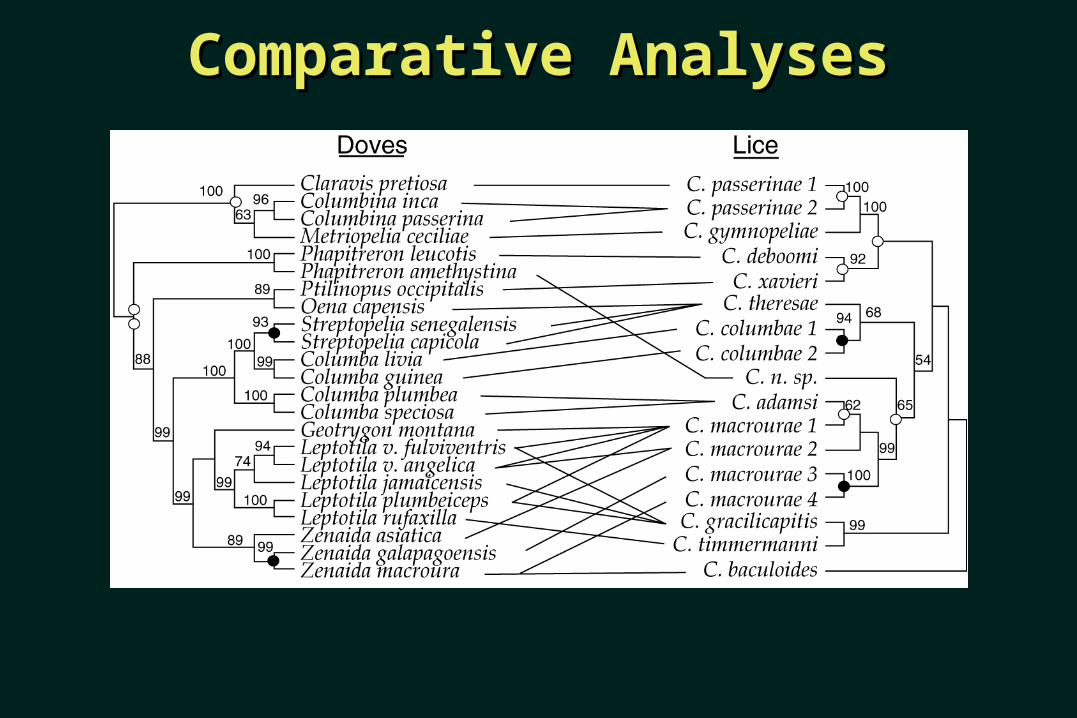
Comparative AnalysesComparative Analyses