t u c r o -s s - lup.lub.lu.selup.lub.lu.se/student-papers/record/8878303/file/8878922.pdf ·...
TRANSCRIPT

TOWARDS UNDERSTANDING CONSUMER
REACTIONS IN OUT-OF-STOCK SITUATIONS
A comparison of price promoted versus
regular-priced items in grocery retail
Christina Hajszan & Susan Timmerman
May 2016
Master’s Programme in Globalisation, Brands & Consumption
BUSN39: Degree Project in Global Marketing
Supervisor: Christian Koch
Examiner: Jon Bertilsson

ABSTRACT
Temporarily unavailable products in the grocery retail environment cause problems for
multiple parties, resulting in possible sales losses for retailers and high dissatisfaction
among consumers. With price promoted products being twice as often out-of-stock (OOS)
as regular-priced items, the need for a further understanding of reactions to price
promoted products is evident. The purpose of this thesis is therefore to examine the
differences between regular-priced and price promoted out-of-stock consumer responses
based on the specific product category coffee. The development of a response model
which tailored previously researched OOS responses towards price promoted products
served as a foundation to approach the problem. Using an experimental survey design,
the results of the experimental group (price promoted OOS) were compared against the
results of the control group (regular-priced OOS), finding that consumers react differently
in some instances. In both situations, consumers were most likely to switch to another
product of the same brand followed by postponing the purchase until the product is
available again. A great difference in behaviour was detected in relation to switching to
another store to buy the intended product, being far more popular in regular-priced
stock-out situations than in case of a price promoted OOS. The overall response patterns
indicate that consumers faced with a stock-out of a price promoted product only react
slightly different to stock-outs of regular-priced products, in both instances, however,
guided by a remarkably strong brand loyalty according to the studied responses.
Keywords: Out-of-Stock, Stock-out, Promotion, Price promotion, Consumer decision-
making, Consumer behaviour, Grocery retail

ACKNOWLEDGEMENTS
This thesis was written as a final degree project for the Master’s programme
‘Globalisation, Brands and Consumption’ in the Spring semester of 2016 at Lund
University, School of Economics and Management. Hereby, we would like to express our
gratitude to the two most important people during the writing process.
First and foremost, we would like to thank our supervisor Christian Koch for his
encouraging feedback, his availability throughout the process and his support regarding
our writings. We are very grateful for his supervision as he made us feel confident about
our thesis while still providing us with constructive criticism and specific needs for
change.
Furthermore, we are very grateful for Antonio Marañon’s advice regarding our data
collection process and analysis of the results. His expertise with IBM SPSS Statistics has
helped us to keep an overview of the necessary statistical tests and to understand the
possible interpretations of the results.

TABLE OF CONTENTS
1 Introduction .............................................................................................................................................. 1
2 Literature Review ................................................................................................................................... 5
2.1 Theoretical Background on OOS .............................................................................................. 5
2.2 Research Streams within OOS Literature ............................................................................. 6
2.2.1 OOS Research Focussing on the Demand Side ........................................................... 7
2.2.2 Antecedents Shaping OOS Consumer Reactions .................................................... 12
2.2.3 OOS Research Focussing on the Supply Side ........................................................... 16
2.3 OOS Research on Promotional Items .................................................................................. 18
2.4 Consumer Decision-Making Influenced by Price Promotions ................................... 19
2.4.1 Antecedents to Decisions on Price Promotions ...................................................... 20
2.4.2 Awareness of Sales Promotions .................................................................................... 24
2.5 Conceptual Research Model & Hypotheses....................................................................... 25
3 Methodology .......................................................................................................................................... 30
3.1 Methodological Approach ........................................................................................................ 30
3.1.1 Research Philosophy ......................................................................................................... 30
3.1.2 Research Approach ............................................................................................................ 31
3.1.3 Research Strategy ............................................................................................................... 31
3.1.4 Research Design .................................................................................................................. 32
3.2 Research Setting .......................................................................................................................... 33
3.2.1 Research Context ................................................................................................................ 33
3.2.2 Research Object .................................................................................................................. 35
3.3 Data Collection ............................................................................................................................. 36
3.3.1 Survey Design ...................................................................................................................... 36
3.3.2 Pilot Study ............................................................................................................................. 38
3.3.3 Sampling ................................................................................................................................ 39
3.3.4 Data Collection Process .................................................................................................... 40
3.4 Data Analysis ................................................................................................................................ 40
3.4.1 Data Preparation ................................................................................................................ 41
3.4.2 Respondents ......................................................................................................................... 42
3.5 Critical Methodological Evaluation ...................................................................................... 44

3.5.1 Reliability, Validity and Replicability ......................................................................... 44
3.5.2 Methodological Limitations ............................................................................................ 46
4 Results ...................................................................................................................................................... 49
4.1 Analysis of Variance (Anova) ................................................................................................. 49
4.2 Qualitative Comparison of the Results per Item ............................................................. 50
4.2.1 Substitution .......................................................................................................................... 51
4.2.2 Postponement ...................................................................................................................... 52
4.2.3 Change Location .................................................................................................................. 53
4.2.4 Intensity Differences ......................................................................................................... 54
4.2.5 Overview of Supported and Rejected Hypotheses ................................................ 56
4.3 Control Variables ......................................................................................................................... 56
5 Discussion of Results .......................................................................................................................... 58
5.1 Overall Responses ....................................................................................................................... 58
5.2 Substitution ................................................................................................................................... 59
5.3 Postponement .............................................................................................................................. 61
5.4 Location switch ............................................................................................................................ 62
6 Conclusion .............................................................................................................................................. 63
6.1 Theoretical Contribution.......................................................................................................... 64
6.2 Managerial Implications ........................................................................................................... 65
6.3 Limitations & Future Research .............................................................................................. 66
7 Bibliography .......................................................................................................................................... 68

LIST OF TABLES
Table 1. OOS responses and the antecedents shaping them ...................................................... 13
Table 2. Risks faced by retailers and manufacturers in OOS situations ................................ 18
Table 3. Operationalisation of concepts ............................................................................................. 37
Table 4. General questions....................................................................................................................... 38
Table 5. Index construction ..................................................................................................................... 42
Table 6. Composition of sample groups ............................................................................................. 43
Table 7. Cronbach's Alpha ....................................................................................................................... 45
Table 8. ANOVA results ............................................................................................................................. 50
Table 9. Mean scores per variable ........................................................................................................ 55
Table 10. Intensity of responses ........................................................................................................... 55
Table 11. Overview of hypotheses........................................................................................................ 56

LIST OF FIGURES
Figure 1. OOS responses .............................................................................................................................. 8
Figure 2. Conceptual research model .................................................................................................. 26
Figure 3. Promotional OOS responses................................................................................................. 29
Figure 4. Types of ICA retail stores ...................................................................................................... 34

1
1 INTRODUCTION
“In retailing, the biggest single customer-service complaint is not having the
item. […] it’s like inviting someone into your house and not offering him a seat.”
(Faircloth 1998, as cited in Taylor & Fawcett, 2001, p.74)
Stock-outs are considered an eminent problem of retailers in different industries.
According to ECR Europe’s (2003) survey on Europe’s shelf availability of products it was
found that retailers face an average out-of-stock (OOS) level of 8%. Several researchers
studying OOS situations furthermore found that price promoted products are about twice
as often out-of-stock as regular-priced products (e.g. Diels & Wiebach, 2011; ECR Europe,
2003; Ettouzani, Yates & Mena, 2012). The list below emphasizes the six most common
grocery customer complaints, with two out of them specifically considering OOS
situations (Sloot, 2006).
1. “Long waiting time at the check-out line
2. Items not available due to assortment reductions
3. Restocking shelves when the store is open
4. Out-of-stocks of regular items
5. No good opportunity to pack products when the check-out is passed
6. Out-of-stocks of promotional items (CBL, 2005, as cited in Sloot, 2006, p. 11)”
It can therefore be concluded that product unavailability possibly leads to high
dissatisfaction levels among grocery shoppers. Research into consumer reactions to
stock-outs is therefore of importance to limit the negative effects for both the retailers
and manufacturers.
Within literature, OOS situations have been studied frequently, mostly focussing on either
the logistical field of retail OOS situations, in order to prevent or limit stock-out situations
(e.g. Corsten & Gruen, 2003; Fernie & Grant, 2008; Gruen, Corsten & Bharadwaj, 2002;
McKinnon, Mendes & Nababteh, 2007), or on consumer behavioural responses and the
antecedents shaping them (e.g. Campo, Gijsbrechts & Nisol, 2000; Emmelhainz,
Emmelhainz & Stock, 1991b; Verhoef & Sloot, 2005). The most prevalent consumer
reactions to OOS situations were found to be substitution of the product in form of
switching to the same product of another brand or switching to another item within the
same brand, purchase postponement or switching to another store (Sloot, Verhoef &
Franses, 2005). These behaviours in their turn can affect both the retailer and

2
manufacturers negatively. Short-term damages include cannibalisation of product ranges
and a loss of sales due to consumers switching stores and buying other brands.
Furthermore, permanent damage to a customer’s brand or store loyalty could arise when
substitution the product or store and developing a relation with the new brand (Campo,
Gijsbrechts & Nisol, 2000; Diels & Wiebach, 2011). To prevent retailers from these
damages deeper insights were gained by numerous researchers identifying different
antecedents affecting the consumer’s decision, with brand and store loyalty being the
most studied influencers (Campo, Gijsbrechts & Nisol, 2000; Emmelhainz, Emmelhainz &
Stock, 1991b; Verhoef & Sloot, 2005).
However, the effects on consumer behaviour when confronted with a stock-out of a
promoted product have barely been studied. Studies on consumer decision-making
towards price promotions however, show significant influences of promotions on a
consumer’s choice (Alford & Biswas, 2000; De Oliveira Santini, Ladeira, Hoffman Sampaio
& Araújo Falcão, 2015; Gönül & Srinivasan, 1996; Majeed, 2007; Walters, 1991). This
implies that consumers can be expected to be highly discontented in the case of a
promoted item being unavailable. Nonetheless, only a few studies were dedicated to
consumer behaviour in OOS situations of promoted products. Diels and Wiebach (2011)
mostly focussed on the relation between phantom theory and promotional OOS
behaviour, where they examined the shift in preferences due to a reduced choice set. They
moreover introduced the response option branch switch which refers to consumers
switching to another outlet of the same retailer to purchase the promoted product.
Furthermore, Peinkofer, Esper, Smith and Williams (2015) measured the effect of price
promotions on consumer responses in online stock-out situations and particularly related
their study to consumer expectations during promotional periods. While differences in
consumer behaviour can be expected when comparing the two mentioned stock-out
situations, prior research lacks a distinct differentiation of responses to regular-priced
and price promoted OOS. By applying existing theories on stock-out behaviour to the
under researched phenomenon of price promoted OOS and comparing it to regular-priced
OOS responses, possible differences would lead to a deeper understanding of consumer
behaviour in OOS situations.
This research gap has therefore lead to the purpose of this study. Within this thesis the
consumer behavioural responses in case of an OOS situation of a price promoted product
will be examined and compared to the responses to OOS situations of regular-priced items
using an experimental survey design.

3
In order to fulfil this research purpose, the following question will serve as a guiding
principle throughout this study:
How do consumers respond differently when confronted with an OOS situation of a
regular-priced item compared to an OOS of a price promoted item in the retail grocery
sector?
The answers to this question will contribute to literature by providing a comparison
between two different stock-out situations and their respective consumer behavioural
traits. Both within the field of marketing as well as retailing literature this research has
the possibility to lead to new insights and starting points for further studies on consumer
behaviour. By building on the four most frequent behaviours as stated by Sloot, Verhoef
and Franses (2005) and implementing the recently developed behavioural trait branch
switch by Diels & Wiebach (2011), this thesis contributes to existing literature by
expanding possible reactions related to price promoted OOS situations. Within the
practical field, retailers as well as manufacturers operating in the grocery market are able
to benefit from the findings of this study by implementing the new insights in their
planning strategies by anticipating on possible consumer behavioural reactions in stock-
out situations of both regular-priced and price promoted items. The findings will lead to
practical recommendations for retailers and manufacturers considering these planning
strategies.
With the data being collected in a town in the South of Sweden and the relatively small
sample size, both due to time and budget limitations, the researchers are aware of the
limited generalisability of the study. However, it is believed that the findings provide a
foundation for future research and contribute in both theoretical and practical fields.
The thesis in hand starts with chapter one functioning as a rationale for the research
discussing the research gap, the purpose of the study and the potential theoretical and
practical contributions. Chapter two includes an extensive literature review divided into
different topics. First a short theoretical background on OOS studies is provided, followed
by a thorough overview of the different research streams within OOS literature mostly
focussing on the demand side and ending with a presentation of related studies.
Furthermore, the influences of price promotions on consumer decision-making are
presented considering the antecedents and the consumer’s awareness as biggest
influencers. The chapter closes with a conceptual research model showing and explaining
the hypotheses created based on the literature findings. The third chapter explains the
methodology of this study. The research philosophy and experimental survey design are
explained first and function as a foundation for all further methodological decisions. Then
the specific research setting, concerning the Swedish grocery market and the choice for

4
coffee as a research object are introduced and argued for. Additionally, the data collection
process considering the survey design, operationalisation, pre-test and sample selection
are discussed. The data analysis process including the statistical tests used is outlined and,
finally, a critical methodological evaluation is provided together with a reflection on the
credibility of the research findings. Chapter four presents the results found using
statistical tests as well as the testing of the developed hypotheses which results in a
rejection or support of each hypothesis. Chapter five focusses on the analysis and
discussion of the statistical findings related to researched literature and theory and
interprets the results. The final chapter, chapter six provides a conclusion of the thesis in
hand as well as an overview on the theoretical- and practical implications, the limitations
and future research opportunities.

5
2 LITERATURE REVIEW
The following chapter lays the theoretical foundation of this study by providing a discussion
and reflective evaluation of existing literature related to the studied topic. The first section
of the literature review discusses the development of OOS research with an emphasis on
literature related to consumer reactions to OOS situations as well as the antecedents shaping
these responses. The second section focuses on promotional decision-making from a
consumer perspective with special attention to price promotions in the retail environment.
The chapter concludes by developing a conceptual research model and hypotheses based on
the reviewed areas which provide a foundation for further analyses and discussion of the
researched topic.
2.1 THEORETICAL BACKGROUND ON OOS
Across literature the phenomenon of temporarily unavailable products is being referred
to as OOS (out-of-stock) or stock-out. To ensure a common understanding of the term out-
of-stock, a definition is provided. OOS refers to the temporary unavailability of an item
that is intended to be for sale in a retail store. An OOS situation occurs when the saleable
item is not physically present on the store shelf and ends with the replenishment of the
affected sales unit (Gruen & Corsten, 2008). ECR Europe (2003) takes the understanding
further by defining OOS as “a product not found in the desired form, flavour or size, not
found in saleable condition, or not shelved in the expected location – from the perspective
of the consumer (ECR, 2003, p. 8).” This definition implies that the desired item may be
physically available, but not in a condition or location that is expected by the customer.
Due to this definition taking up a more comprehensive perspective of OOS, the
researchers will use it as the common understanding of the studied phenomenon. Further,
OOS needs to be distinguished from the concepts de-listing and PAR (Permanent
Assortment Reduction) in which an item is completely removed from the shelves with no
intention to be available again. Consumer reactions are expected to differ in these two
categories as OOS situations are unexpected and the customer needs to react in this very
situation while PAR might already be expected by the consumer and lead to different
responses (Campo, Gijsbrechts & Nisol, 2004; Verhoef & Sloot, 2005) Another concept
related to the (un)availability of products is OSA which refers to on-shelf-availability and
describes the saleable item to be available on the shelf when the customer’s purchase
intention arises (Chopra & Meindl, 2007). Even though these two concepts are highly
correlated by definition, the study in hand emphasizes on OOS situations and OSA will
therefore not be elaborated on further.

6
OOS situations in the retail environment and their implications for the retailer and
consumer have received much attention in literature. While earlier research focussed on
the initial definition and measurement of consumer OOS reactions as well as potential
cost and revenue losses due to product stock-outs (Emmelhainz, Emmelhainz & Stock,
1991a; Peckham, 1963; Walter & Grabner, 1975), later studies determined their research
to the consumer and the behavioural patterns linked to this kind of phenomenon (Campo,
Gijsbrechts & Nisol, 2000; Emmelhainz, Emmelhainz & Stock, 1991b; Schary &
Christopher, 1979; Verbeke, Farris & Thurik, 1998).
A number of researchers argue that two studies marked the beginning of OOS research.
One of the first studies to be conducted in the field of OOS was published by Peckham
(1963) in cooperation with the A.C. Nielsen company on stock-outs in the grocery
environment and their potential to cause a loss of business to the retailer as well as the
manufacturer. His study focussed on providing first insights into the issue of retail stock-
outs and described consumer reactions in an explorative way. Conducting a quasi-
experiment in grocery stores Peckham found that consumers react to OOS of their
preferred brand by either purchasing another brand, another package size or colour of
the same brand or do not purchase the desired product at all.
The most influential study to further dictate OOS research was conducted in 1968 by
Progressive Grocer together with the National Association of Food Chains and The A.C.
Nielsen Company. As opposed to prior studies in which the cost of OOS was mainly
estimated by unsold inventory, this study aimed to understand consumer behaviour. Not
only did the paper distinguish between shelf and store unavailability, referring to the
product being available for purchase in the store backroom but not on the designated
shelf, it also considered factors such as different product categories, days of the week and
levels of brand loyalty to understand consumer behaviour (Zinn & Liu, 2011).
2.2 RESEARCH STREAMS WITHIN OOS LITERATURE
Aastrup and Kotzab (2010) argue that based on the Progressive Grocer study, two
research streams developed that shaped the understanding of OOS situations from a
consumer as well as supplier perspective, here referred to as OOS research focussing on
the demand and supply side. The thesis will follow Aastrup and Kotzab’s (2010)
organization of OOS literature and introduce relevant research of both research streams.

7
2.2.1 OOS RESEARCH FOCUSSING ON THE DEMAND SIDE
Within OOS research focussing on the demand side, Aastrup and Kotzab (2010) found that
OOS research can be divided into two different periods, with the earlier one focussing on
the classification of OOS responses and the latter one on understanding the factors
shaping OOS behaviour. Relevant literature will be presented in a chronological order,
referring to ‘Phase 1’ and ‘Phase 2’ of literature related to the demand side of OOS.
Phase 1: Classifying and quantifying consumer responses to OOS
Early studies within research on the demand side focussed on identifying and classifying
different consumer responses to gain an initial understanding of the phenomenon
(Emmelhainz, Emmelhainz & Stock, 1991a; Walter & Grabner, 1975). The researchers
primarily transformed their results on OOS reactions into consumer decision trees or
decision typologies, aiming to provide a comprehensive approach to understanding
consumer reactions to stock-outs (Aastrup & Kotzab, 2010). A review of the most relevant
researchers will be presented.
Walter and Grabner (1975) were the first researchers to introduce a comprehensive
model on specific consumer reactions by examining stock-outs in a liquor store. The
possible alternatives introduced include brand substitution for the same, a higher or
lower price, substitution of the product with an item of the same brand but another
package size, a delay of purchase or a switch of store. Even though the authors categorized
the responses with the aim to calculate potential losses and optimize planning rather than
understanding consumer behaviour, their detailed classification of possible consumer
reactions in OOS situations highly contributed to research and greatly influenced
subsequent studies within consumer response to OOS from a demand and behavioural
point of view.
Emmelhainz, Emmelhainz and Stock (1991a) analysed the impact of product and
situational characteristics influencing OOS behaviour, choosing a more authentic
approach. While researchers before tested stock-out situations through hypothetical
surveys or quasi-experiments, Emmelhainz, Emmelhainz and Stock (1991a) conducted a
field experiment by intentionally removing five different high frequency sales units from
shelves of a discount store for a limited period of time. Their results reflected similar
patterns as identified by previous research, however, the researchers were able to
categorize the responses into fifteen different decision typologies, presenting the most
detailed model until that point in time. In contrast to Emmelhainz, Emmelhainz and Stock
(1991a) and Zinn and Liu (2001) shortened their framework to provide a more
comprehensive model and introduced the acronym SDL, referring to Substitute, Delay or
Leave as possible OOS responses.

8
While a number of researchers developed different classifications of reactions to OOS
situations, related to different products and other factors, Sloot, Verhoef and Franses’
(2005) distinction summarizes the most frequent and important responses as shown in
Figure 1. To provide a more inclusive overview, the responses by Sloot, Verhoef and
Franses (2005) are further divided into the categories ‘substitution’ and ‘non-
substitution’ as it was found that consumers first make a decision between these two
options and then make a detailed choice within the chosen category (Emmelhainz,
Emmelhainz & Stock, 1991b; Verhoef & Sloot, 2005).
Figure 1. OOS responses
Adapted from Sloot, Verhoef and Franses (2005)
Substitution
1. Item switch: the consumer switches to another format or variety of the same brand
2. Brand switch: the consumer switches to another brand within the same product
category
3. Category switch: the consumer buys a substitute product from another product
category
Non-substitution
4. Store switch: the consumer switches store to purchase the item during the same
shopping trip
5. Postponement: the consumer postpones the intended purchase until the next
shopping trip
6. Cancellation: the consumer cancels the intended purchase completely
(Sloot, Verhoef and Franses, 2005)

9
Even though some researchers limited their study to only a few of the options mentioned
while others extended their use of options, it is believed that the summary by the
mentioned authors provides the most comprehensive framework of consumer OOS
responses. It should further be mentioned that due to researchers within OOS literature
taking different methodological approaches as well as examining different product
categories, a presentation of a general set of results attributed to each OOS reaction is
difficult to attain.
A global study conducted by Gruen, Corsten and Bharadwaj (2002) found that store
switch followed by brand substitution are the most popular options when confronted
with an OOS. Taking a closer look, the researchers found significant differences between
US and European consumers, with European consumers preferring brand switch before
store switch. ECR Europe (2003), examining European OOS situations, complements
these findings as the study found that brand switch is the most popular response followed
by store switch and purchase postponement. Item switch was only considered as a
possible OOS response in Gruen, Corsten and Bharadwaj’s (2002) research in which it was
ranked third. Category switch did not receive attention in any of the two presented
studies. Both studies however showed that purchase cancellation is the least preferred
option for consumers confronted with an OOS.
Due to prior studies showing that the frequency for category switch as well as cancellation
are rather low, these two options receive less attention within the OOS literature review
of this thesis while emphasis will be put on the most dominant choices store switch, brand
switch, item switch and postponement (Gruen, Corsten & Bharadwaj, 2002; ECR Europe,
2003; Sloot, Verhoef & Franses, 2005).
While different product categories were examined in prior research, the specific results
for each category were not always reported in a way that enables the authors to present
a comparative summary of OOS responses across categories. However, Gruen, Corsten
and Bharadwaj (2002) dedicated parts of their global study to comparing consumer
responses across categories and found significant differences between different groups of
products. The study looked at non-food products such as cosmetics, diapers, feminine
hygiene products, laundry detergent, toilet tissue, and paper towels as well as food-
products such as salted snacks and coffee. While laundry detergent, toilet tissue, paper
towels and salted snacks account for very high substitution patterns, cosmetics, feminine
hygiene and diapers showed a high willingness to switch to another store. Coffee,
however, did not show a clear pattern with substitution being only slightly more
favourable than switching stores. Furthermore, the product category of perishable
products, as studied by Van Woensel, Van Donselaar, Broekmeulen and Fransoo (2007)
faces increased substitution behaviour as compared to the non-perishable products
10
studied by Gruen, Corsten and Bharadwaj (2002). While a difference can be explained
between perishable and non-perishable products, no clear pattern can be attributed to
non-food or food products.
Phase 2: Understanding the antecedents shaping consumer responses to OOS
After intense classification and quantification of OOS reactions, early studies by Schary
and Christopher (1979) as well as Emmelhainz, Emmelhainz and Stock (1991b) marked
a shift in OOS consumer behaviour research as the conditions and antecedents that lead
to certain consumer reactions became more relevant than merely classifying and
quantifying stock-out responses (Aastrup & Kotzab, 2010).
Schary and Christopher’s (1979) study was the first one to attempt to explain consumer
behaviour patterns when confronted with an OOS using a more comprehensive approach
and relating it to external factors. The researchers took into account demographic
variables, the impact of the store and product related characteristics which resulted in
them finding a significant effect of brand and store loyalty on OOS reactions (Schary &
Christopher, 1979).
Complementing the examined antecedents of brand and store loyalty, Emmelhainz,
Emmelhainz and Stock (1991b) found additional situational as well as product-related
characteristics that have the possibility to influence a consumer’s decision whether to
substitute an OOS product or not. Urgency of need highly dictated whether consumers
would substitute the product or switch stores, resulting in a higher number of consumer
substituting a product. At the same time, a high perceived product risk when buying
another than the desired brand reduced the number of brand switches. Regarding
product usage, it was examined that regular items were more likely to be switched in an
OOS situation than items intended for special occasions.
Various research methods applied by previous authors, such as survey designs examining
hypothetical as opposed to true stock-outs, underwent some criticism as to whether they
truly represent consumer behaviour and possibly limit external validity. Verbeke, Farris
and Thurik (1998) therefore conducted a true OOS experiment in a Dutch grocery chain,
in which not only one SKU, such as previous researchers used (e.g. Emmelhainz,
Emmelhainz & Stock, 1991) but whole product lines of five leading brands were removed
from the shelves. Hence, the researchers eliminated the frequent reaction of switching
item within the same brand. The authors dedicated their study to examining the under
researched influencing factors such as the intensity of retail competition, the differences
in effects of a permanent change in assortment to an OOS experience, store loyalty, the
money spent and the amount of products bought during a shopping trip (Verbeke, Farris
& Thurik, 1998).

11
Researchers until 1998 considered different combinations of product-, store-, consumer-
or situation-related variables to affect OOS response, however, Campo, Gijsbrechts and
Nisol (2000) were the first ones to consider all four characteristics in their study as
relevant antecedents to shape consumer OOS response (Helm, Hegenbart & Endres,
2012). The researchers criticized existing literature to not be accurate enough as to how
the consumer response is shaped as only a limited set of explanatory variables had been
applied. Their findings, however, confirm prior research in some instances such as brand
and store loyalty decreasing the likelihood of item and store switching, respectively. In
accordance with Verbeke, Farris and Thurik (1998), the study found that shopping habits
such as the product quantity needed as well as the time available for the shopping trip
influence substitution decisions. Furthermore, the researchers added to Schary and
Christopher’s (1979) research by studying brand products in comparison with private
label products (Campo, Gijsbrecht & Nisol, 2000).
While researchers across OOS literature considered different characteristics in their
studies, it is apparent that brand loyalty, followed by store loyalty seem to be very
important antecedents to shape consumer OOS responses. Similar to the classification of
OOS reactions, the comparability of results is limited as researchers’ approaches to
research designs highly differ, primarily including method choice and studied product
categories. However, the factor loyalty in regard to brand and store type gained the most
attention in OOS literature.
To gain a better understanding of the antecedents shaping OOS consumer behaviour, the
researchers will provide a comprehensive overview of the four dominant variables
shaping consumer OOS responses as defined in prior literature (Sloot, Verhoef & Franses,
2005; Zinn & Liu, 2001).

12
2.2.2 ANTECEDENTS SHAPING OOS CONSUMER REACTIONS
To develop a better understanding of the antecedents shaping OOS consumer behaviour,
the four dominant variables that shape consumer OOS responses as applied and studied
across OOS literature will be presented (Campo, Gijsbrechts & Nisol, 2000; Schary &
Christopher, 1979; Sloot, Verhoef & Franses, 2005; Verbeke, Farris & Thurik, 1998; Zinn
& Liu, 2001). Verhoef and Sloot (2006) extended their model by adding the fifth
dimension ‘brand-related variables’, however, the researchers of this paper decided to
not further distinguish brand-related variables but to include them in the product-related
category.
Table 1 provides an overview of the four dominant antecedents that shape consumer OOS
responses and how they affect the four most common OOS responses (Campo, Gijsbrechts
& Nisol, 2000; Emmelhainz, Emmelhainz & Stock, 1991; Gruen, Corsten & Bharadwaj,
2002; Schary & Christopher, 1979; Sloot, Verhoef & Franses, 2005; Verbeke, Farris &
Thurik, 1998; Zinn & Liu, 2001).
As the aim of this study is to examine distinct differences and similarities of price
promoted and regular-priced products, the antecedents will not only serve as a means to
gain a deeper understanding of the researched topic but also as a guideline for the
interpretation of results.

13
Table 1. OOS responses and the antecedents shaping them
Adapted from Sloot, Verhoef and Franses (2005)
ANTECEDENTS
Product-related variables
Store-related variables
Situation-related variables
Consumer-related variables
OO
S R
ES
PO
NS
ES
Item switch
Availability of acceptable alternatives (+) Stockpiling (-) Utilitarian brand/product type (+) Perishable product (+)
Store loyalty (+) Low store prices (+)
Purchase quantity (+,-) Available shopping time (+,-) Time pressure (+) Time of the week (+,-) Product usage (+,-)
Positive shopping attitude (-) Higher age (-)
Brand switch
Availability of acceptable alternatives (+) Perceived risk of switching to alternatives (-) Brand loyalty (-) Stockpiling (-) Utilitarian brand/product type (+) Perishable product (+)
Store loyalty (+) Low store prices (+)
Purchase quantity (+,-) Available shopping time (+,-) Time pressure (+) Time of the week (+,-) Product usage (+,-)
Positive shopping attitude (-) Quality conscious (-) Higher age (-)
Postponement
Availability of acceptable alternatives (-) Stockpiling (+) Perishable product (-) Brand loyalty (+)
Store loyalty (+) Low store prices (+)
Large purchase quantity (-) Urgency of need (-) Available shopping time (+,-) Time pressure (+,-) Time of the week (+,-) Pre-visit agenda (-) Impulse buying (+)
Positive shopping attitude (+,-)
Store switch
Availability of acceptable alternatives (-) Perceived risk of switching to alternatives (-) Brand loyalty (+) Stockpiling (-) Hedonic brand/product type (+)
Store loyalty (-) Availability of alternative stores (+,-) Low store prices (-)
Purchase quantity (+,-) Available shopping time (+,-) Time pressure (+,-) Urgency of need (-) Time of the week (+,-) Pre-visit agenda (+) Impulse buying (-)
Positive shopping attitude (+) Price conscious (-) Higher age (+)
Negative effects are indicated by (-) and positive effects by (+).

14
Product-related variables
Product-related variables are characteristics related to the specific product or brand in
which the costumer experiences a stock-out (Sloot, Verhoef & Franses, 2005). One of the
most researched aspects within product-related characteristics is brand loyalty. A
number of studies show that brand loyalty negatively affects brand substitution, but
positively relates to store switch (Campo, Gijsbrechts & Nisol, 2000; Sloot, Verhoef &
Franses, 2005), indicating that loyal brand buyers are more likely to put additional effort
into the acquisition of the intended brand. Campo, Gijsbrechts and Nisol (2000) studied
that the availability of acceptable alternatives increases consumers’ willingness to
substitute the desired product and is therefore negatively related to store switching.
However, when Emmelhainz, Emmelhainz and Stock (1991b) studied the customer’s
perceived risk of switching to an alternative, they found that a significant number of people
perceived the risk to be rather high and therefore are less likely to substitute, indicating
that the availability of alternatives alone is not a sole indicator of increased substitution.
As outlined before, brand type can have an effect on the OOS reaction. Schary and
Christopher (1979) found that national brand buyers are more likely to switch stores to
purchase their preferred brand, while private label buyers were said to have a lower
tendency to do so. This can be attributed to the fact that national brands are better
distributed than private label brands, making it more inconvenient for private label brand
buyers to obtain the product (Sloot, Verhoef & Franses, 2005). Sloot, Verhoef and Franses
(2005) further examined hedonic and utilitarian brand types to have a different effect on
consumer OOS reactions. While products that provide the consumer with a hedonic
benefit such as fun, pleasure and excitement have a positive effect on store switching,
utilitarian products, which are primarily functional and instrumental, are more likely to
be substituted. Van Woensel et al. (2007) contributed to existing literature by being the
first to study OOS reactions to the product type of perishable products and found that
customers have a very high willingness to substitute due to the products’ short lead-times.
Sloot, Verhoef and Franses (2005) furthermore found that the possibility of product
stockpiling has a positive effect on purchase postponement while it has a negative effect
on product substitution.
Store-related variables
Store-related variables are characteristics related to the store or retail chain in which a
consumer experiences an OOS situation (Sloot, Verhoef & Franses, 2005). A number of
studies are concerned with the factor store loyalty and its effect on OOS responses. Most
studies report a positive effect on substitution of the missing product by item or brand
switch or postponement or cancellation of purchase while store switch is the least likely
OOS response of store loyal customers (Campo, Gijsbrechts & Nisol, 2000; Emmelhainz,

15
Emmelhainz & Stock, 1991b). Verbeke, Farris and Thurik (1998) studied the impact of
retail competition on OOS reactions and found that a competitive landscape with stores
carrying a similar assortment nearby did not positively affect store switch. Two years
later, Campo, Gijsbrechts and Nisol (2000) complemented previous researching by
finding no significant effect of store distance on OOS reactions. Sloot, Verhoef and Franses
(2005), however, studied that the number of alternative stores in the vicinity positively
affects store switch and negatively affects postponement, indicating the opposite of both
prior studies. Zinn and Liu (2001) found that lower store prices associated with higher
value compared to competition have a positive effect on substitution and purchase delay
and a negative effect on consumers leaving the store. This finding indicates that the
perception of low store prices is an important factor for the customer to decide whether
to switch stores or not.
Situation-related variables
Situational characteristics are concerned with the conditions that apply for the specific
shopping trip the consumer experiences an OOS situation in (Sloot, Verhoef & Franses,
2005). Multiple studies stated that urgency of need has a high impact on a consumer’s OOS
decision-making. Due to time constraints, a high urgency of need positively affects a
customer’s decision to substitute the product rather than to switch store (Campo,
Gijsbrechts & Nisol, 2000; Emmelhainz, Emmelhainz & Stock, 1991a; Zinn & Liu, 2001).
Campo, Gijsbrechts and Nisol (2000) further found that time pressure and the time
available for shopping influence OOS reactions. Little time available and strong pressure
are more likely to lead to the substitution of the item or brand as opposed to store switch
or cancellation and postponement. Helm, Hegenbart and Endres (2012) and Sloot,
Verhoef and Franses (2005) found that the time of the week in which the purchase is made,
has an effect on OOS reactions. While Helm, Hegenbart and Endres (2012) studied that
purchases towards the end of the week are more likely to be substituted, postponed or
even cancelled, Sloot, Verhoef and Franses (2005) found that consumers are more likely
to postpone the purchase during the first part of the week. Sloot, Verhoef and Franses
(2005) findings complement a global study conducted by the Grocery Manufacturers of
America, that examined that the chance of the occurrence of an OOS increases by the end
of the week with the highest stock-out percentages being detected on Sundays and
Mondays (Gruen, Corsten & Bharadwaj, 2002). Furthermore, the overall purchase
quantity of the shopping trip impacts OOS response by making it less favourable for the
consumer to postpone the purchase the larger the quantity gets (Campo, Gijsbrechts &
Nisol, 2000). Literature also considered a consumer’s pre-visit agenda, indicating that the
purchases were planned in detail in advance, as possible situational influencers of OOS
responses. Planned purchases are less likely to be postponed and more likely to result in
switching stores. The likelihood of substitution did not receive any attention (Helm,

16
Hegenbart & Endres, 2012; Zinn & Liu, 2001). When looking at the related phenomenon
of impulse buying, Sloot, Verhoef and Franses (2005) found similar indicators as their
results stated that unplanned purchases are more likely to be postponed or cancelled and
unlikely to lead to a store switch. However, purchase planning is likely to be related to the
intended product usage, which has proven to lead to different OOS responses.
Emmelhainz, Emmelhainz and Stock (1991b) differentiated between products intended
for regular use and products intended to be purchased for a special occasion. Their study
found that the majority of customers responded by substituting the product if it was for
regular use, while less than half of the respondents chose to substitute the product if it
was for a special occasion.
Consumer-related variables
This category refers to characteristics related to the consumer who experiences an OOS
situation (Sloot, Verhoef & Franses, 2005). Campo, Gijsbrechts and Nisol (2000) state that
consumers with a more positive overall shopping attitude have a higher tendency to
switch stores when confronted with an OOS as they value the shopping experience.
Considering demographics, Peckham (1963) states that age has a negative effect towards
substitute buying which can be attributed to the fact that older people have less time
constraints when visiting another store. Sloot, Verhoef and Franses (2005) later support
this view by finding the same results. However, other studies show that demographics
have no significant effect on consumer OOS reactions (Zinn & Liu, 2001). Researchers
further found that price consciousness is negatively related to store switching when faced
with an OOS, possibly indicating that the perceived cost of store switch is higher than of
substitution. On the other hand, being quality conscious has a negative relation towards
brand switching (Sloot, Verhoef & Franses, 2005).
2.2.3 OOS RESEARCH FOCUSSING ON THE SUPPLY SIDE
As argued by Aastrup and Kotzab (2010) the second stream of OOS research is focussed
on supply side issues that measure the risks, costs, as well as causes of OOS situations
from a logistical and supply chain point of view. Alike the demand side phase that focussed
on consumer reactions, this stream also emerged from the Progressive Grocer study from
1968 which showed that store-related issues such as space allocation, ordering routines
and lack of experienced personnel were the root causes of OOS situations (Aastrup and
Kotzab, 2010). Gruen, Corsten and Bharadwaj (2002) then further contributed to OOS
supply research by conducting a worldwide examination of OOS. This comprehensive
study was valuable to OOS research of the supply side by including indicators of root
causes as well as risks and possible losses of OOS to the retailer as well as manufacturer.

17
To provide an outline of findings within OOS research focussing on the supply side, root
causes of OOS as well risks related to OOS responses will be introduced in this chapter.
Root causes of OOS: In-store vs. upstream
A study done by Corsten and Gruen (2003) found that between 60-75% of OOS can be
attributed to in-store causes while 25-30% are due to upstream (distribution centre,
wholesale, retail HQ, supplier) causes. Aastrup and Kotzab (2009) take the percentage of
in-store causes even higher, accounting it for 98% of OOS origins. Corsten and Gruen
(2003) state that the most relevant in-store causes for OOS are inaccurate forecasting,
ordering and shelf-replenishment. Within forecasting and ordering, a number of
researchers (Corsten & Gruen, 2003; Fernie & Grant, 2008; Gruen, Corsten & Bharadwaj,
2002; McKinnon, Mendes & Nababteh, 2007) argue that promotions tend to be one of the
major origins of product unavailability. As stated before, promotional items are on
average twice as often OOS than regular-priced items (ECR Europe, 2003; Ettouzani, Yates
& Mena, 2012), which Gruen, Corsten and Bharadwaj (2002) primarily attribute to
inefficiencies within marketing departments of retailers. Poor planning of advertising
activities often restrict the supply chain to accurately match promotional demand and
potentially leads to OOS situations. Upstream causes, on the other hand, are usually
attributed to distribution centres or retail headquarters and manufacturers, however, as
mentioned before, only make up a small portion of OOS root causes (Gruen, Corsten &
Bharadwaj, 2002).
Risks related to OOS responses
Corsten and Gruen (2003) provide, based on the possible consumer OOS reactions, an
overview of possible risks related to a stock-out for the retailer as well as the
manufacturer. While most other studies primarily concentrate on the retailer’s sales loss
alone, these authors provide a more detailed framework. Gruen, Corsten and Bharadwaj
(2002) differentiate if the accumulated loss directly affects the retailer or the
manufacturer, which will be taken into consideration when providing the overview in
Table 2, based on the four most common consumer responses.

18
Table 2. Risks faced by retailers and manufacturers in OOS situations
OOS reaction Risk for retailer and manufacturer
Store switch
Store switch bears a direct loss to the retailer (Gruen, Corsten &
Bharadwaj, 2002). Consumers switching to stores with a perceived
lower level of OOS could possibly lead to a loss of shoppers for the
affected retailer (Corsten & Gruen, 2003).
Postponement
The postponement of a purchase neither directly affects the retailer
nor the manufacturer as the purchase is still intended to be made.
However, delay of purchase negatively affects cashflow for the
retailer as well as the manufacturer (Gruen, Corsten & Bharadwaj,
2002).
Item switch
The retailer as well as the manufacturer face a direct sales loss in case
the consumer chooses a lower priced item within the same brand
(Corsten & Gruen, 2003; Gruen, Corsten & Bharadwaj, 2002).
Brand switch
While brand switch entails possible negative effects for the retailer if
the chosen brand is of smaller size and/or cheaper, it bears the most
problematic impact for the manufacturer as it leads to a direct loss of
sale for the specific brand (Corsten & Gruen, 2003; Gruen, Corsten &
Bharadwaj, 2002).
While the review of prior literature of the demand side is more comprehensive and broad,
the theoretical background of the supply side is less extensive for a reason. As the aim of
this thesis is to contribute to OOS literature within the field of consumer behaviour and
study reactions directly from the consumer perspective, the supply side should merely
provide a full picture of OOS literature rather than providing insights to generate a
conceptual framework and hypotheses.
2.3 OOS RESEARCH ON PROMOTIONAL ITEMS
Even though the need for further research on consumer response particularly to
promotional OOS has been underlined by previous researchers (e.g. Sloot, Verhoef &
Franses, 2005), only a small number of publications can be found on this issue. Diels and
Wiebach (2011) aimed to fill this research gap and dedicated their discussion paper to
examine substitution behaviour in promotional OOS situations by applying context and
phantom theory. While their research primarily focussed on providing a theoretical
framework regarding the shift in preferences due to the reduced choice sets, their findings
greatly contributed to existing knowledge. Not only did they detect increased
postponement behaviour in promotional OOS situations, they also introduced the
consumer response option ‘branch switch’. Their assumptions lead them to test if

19
switching to another outlet of the same retail chain to make use of a promotional offer is
a valuable consumer response in an OOS, which will be of great interest within this
research as well.
The most recent study applied findings from OOS literature of physical stores to the online
environment. Peinkofer et al. (2015) measured the effect of price promotions on
consumer responses in online stock-out situations and particularly related their study to
consumer expectations in promotion situations. The assessment of OOS behaviour in the
online environment is of particular interest as the costs of switching are rather low
compared to the traditional offline retail setting. Interestingly, their findings suggest that
consumers in the online shopping environment develop lower expectations for promoted
products to be available, possibly due to negative prior experiences. Overall, their findings
point out that the dissatisfaction level when faced with an online OOS situation is rather
low linking it to a low expectation on product availability.
While a small number of researchers have already dedicated their work to examining
promotion effects on OOS situations, existing literature primarily focuses on providing a
theoretical framework related to various fields of consumer behaviour such as phantom
theory (Diels & Wiebach, 2011) and expectation-dissatisfaction-theory (Peinkofer et al.,
2015) within the context of promotional OOS. The researchers of the thesis in hand
however focus on providing insights to promotional OOS reactions by directly comparing
them to regular-priced stock-outs within the specific product category coffee, using an
experimental design on the yet under researched geographical market of Sweden.
2.4 CONSUMER DECISION-MAKING INFLUENCED BY PRICE PROMOTIONS
In order to understand customers’ responses to OOS situations of price promoted items
in grocery retail, a closer look will be taken upon the concepts of consumer decision-
making and price promotions. Consumers’ decisions are based upon multiple questions:”
what to buy, why to buy, when to buy, where to buy, how often to buy, how frequently to
use it, how it is evaluated after the purchase and the impact of such evaluations on future
purchases (Chaharsoughi & Yasory, 2012, p. 99).” Watson, Wood and Fernie (2015) state
that one of the key influencers on these consumer decisions is the price of a product.
Complementing to the important role of a product’s price for the consumers, Kucuk
(2014) points out that customers frequently consider a product’s price as an indication
for its quality, especially in situations when other sources of information and stimulus are
lacking e.g., similar packaging layout.

20
Walker and Knox (1997) refer to the famous model of Howard (1983, as cited in Walker
& Knox, 1997, p. 35) arguing that models of cognitive consumer behaviour are categorised
by causal sequences (“information -> attitude -> intention -> purchase”). They state the
importance of the information gathering stage via pre-purchase research,
advertisements, sales promotions, etc. shaping one’s attitude towards and desire for the
product before these mental processes are translated into an actual purchase (Walker &
Knox, 1997). The following sub-chapters will therefore focus on the antecedents to
consumer decision-making on price promoted purchases and the consumers’ awareness
of promotions as a situational influencer.
2.4.1 ANTECEDENTS TO DECISIONS ON PRICE PROMOTIONS
Apart from the customer’s weekly inventory check, the attractiveness of the promotion is
what leads to the customer’s decision to buy or not to buy the promoted product (De
Oliviera et al., 2015; Diamond & Sanyal, 1990; Gönül & Srinivasan, 1996; Grewal,
Krishnan, Baker & Borin, 1998; Majeed, 2007; Rothschild & Gaidis, 1981; Schindler,
1992). However, what exactly makes a promotion attractive to the consumer cannot
easily been said as different researchers found different factors of attractiveness.
Schindler (1992) nevertheless created three overall categories of attractive promotion
characteristics; monetary/non-monetary rewards, promotional price perception and the
promotional deal.
Monetary vs non-monetary reward
In the current grocery retail sector an important division in sales promotion techniques
was made between monetary and non-monetary rewards (De Oliviera Santini et al., 2015;
Schindler, 1992). In either way consumer demand is provoked, but with different sales
promotion techniques. Monetary sales promotions such as discounts, bonus packs and
coupons were found to be the best technique to increase short-term sales volumes.
According to De Oliviera Santini et al. (2015) these campaigns are successful due to the
immediate rewards received, in the form of money being saved, and the utilitarian
benefits gained. However, Pauwels, Silva-Risso, Srinivasan and Hanssens (2004) as well
as De Oliviera Santini et al. (2015), note that although the short-term sales of these
monetary rewards are most effective, they may also negatively influence the brand and
product image as it decreases the customer’s reference price on the long run. Non-
monetary promotions on the other hand, e.g. premiums and free samples, have mostly
been related to medium- to long-term effects considering raising and creating brand
loyalty (De Oliviera Santini et al., 2015). Diamond and Sanyal (1990, p. 488) found the
greatest distinction between the two types of rewards to be the customer’s feeling of
“losing less than usual” in the case of monetary rewards, contrasting to “gaining
something extra” with non-monetary promotions. Even though both types of rewards are

21
considered to be important to the attractiveness of a promotion, monetary promotions
have shown to be preferred by consumers and are therefore most frequently used by
retailers (De Oliviera Santini et al., 2015; Majeed, 2007). Therefore, this study’s focus will
be on monetary sales promotions, also referred to as price promotions.
Price promotions often affect consumer behaviour rather positively from a retailer’s
perspective. Walters (1991) and Kumar and Leone (1988) for example, consider the
advantage of promoted item purchases leading to a sales stimulation of non-promoted
complementary products. With, for example, a certain popular pasta sauce on sale, the
chances are rather high that the non-promoted pasta packages and parmesan cheese are
as well being bought more frequently during that period. Furthermore, the promotion of
relatively high priced products (e.g. cheese, coffee, alcoholic beverages, diapers) could
cause the consumer to intentionally switch stores and purchase those items at the
substitute retailer (Kumar & Leone, 1988). Next to store substitution promotions were
recognised to function as switching cues in the substitution of a product by several
researchers (Kucuk, 2004; Kumar & Leone, 1988; Walters, 1992). Depending on the
intensity of brand loyalty, customers may decide to purchase a different brand than their
regular one, once the competing brand is on sale. The intensity of this relation between
sales promotion and brand substitution however was found to be rather low (Walters,
1992).
Promotional price perception
In order for customers to be able to evaluate the discount given on a certain product, they
place this promotional price on their internal reference price range (Alford & Biswas,
2000; Grewal et al., 1998; Schindler, 1992). This internal reference price, also referred to
as expected-, fair-, or appropriate price, is often based on the consumer’s perception of
the regular market price or a range of prices the product is being sold for. According to
Schindler (1992) several researchers have proven that once a product is temporarily
priced below the internal reference price range the sales increase will be larger than when
a product is on sale but is still priced within the internal reference price range. This
statement was confirmed and complemented by Grewal et al. (1998) stating that it is all
about the consumer’s perception of the discount offer to be below the internal reference
price which could be reached by using semantic phrases and indications of sales which
will increase the effectiveness of the deal.
However, pricing a product below the internal reference price range cannot be done
without risks. First, it could lead to consumers lowering their internal reference price
which makes it more difficult to create successful price promotions next time as the
difference between the discount price and the reference price will be less (Grewal et al.,

22
1998). Furthermore, when products are frequently promoted in the form of trade-
incentives, in-store- or price promotions, consumers start taking these promotions for
granted and therefore become unwilling to pay the regular price for this certain product
(Kalwani & Yim, 1992). Moreover, with product prices often being seen as quality
indicators and price promotions below the internal reference price range, consumers may
assume there is something wrong with the product which may harm the product or brand
image (De Oliviera Santini et al., 2015; Grewal et al., 1998; Hardesty & Bearden, 2003;
Kalwani & Yim, 1992; Pauwels et al., 2004). Finally, Pride and Ferrell (2014) argue for
their concern of price promotions creating artificial needs and so manipulate consumers
into buying the product which is considered unethical.
It is therefore of high importance that managers are fully aware of the reference ranges
of their consumers in order to be able to create effective price promotions (Grewal et al.,
1998). An important finding of Grewal et al.’s (1998) study concludes that “carefully
managed price discounts will positively influence perceived value without any adverse
effect on brand’s perceived quality, thus enabling retailers and manufacturers to
successfully deliver high value (p. 348).”
Promotional deal
Next to the monetary versus non-monetary price promotions and the internal reference
price there are certain other factors related to a consumer’s decision-making on price
promotions. Firstly, Schindler (1992) mentions the moment of decision-making to affect
a consumer’s response to promotions. Customers who already made their decision before
entering the store, e.g. based on flyers or newspapers, are less likely to be seduced by the
availability of alternatives. It can therefore be assumed that when customers were
confronted with appealing price promotions before entering the store, they are more
likely to buy that advertised product than a competing product that was only promoted
through point-of-purchase displays (Schindler, 1992).
Another factor considered to be of great importance to a customer’s decision-making is
the way a promotion is presented to the consumer. Sayer and Dickson (1984, as cited in
Diamond & Sanyal, 1990) state that if consumers would purely evaluate sales promotion
deals by the factors of multi-attribute attitude models, they would solely focus on the
values instead of the presentation and details of the deal. However, Diamond and Sanyal
(1990) argue that in the case of promotional deals consumers make decisions on
presentational factors, formats and the information presented. Meaning that even if two
ads would offer the exact same deal but are presented in a different way, consumers will
find one deal more appealing than the other.

23
Furthermore, the consumer’s expectations on future discounts are taken into
consideration as Gönül and Srinivasan (1996) found this factor to be highly influential on
current consumer decision-making. Generally, consumers assume that once a product is
currently on sale it probably will not be any time again soon, creating an intrinsic urge to
make use of the deal and purchase the promoted item while the deal lasts. Krishna (1990,
as cited in Gönül & Srinivasan, 1996) states that even if these predictions on future
discount deals may be inaccurate, they lead to an increased purchase behaviour. Krishna,
Currim & Shoemaker (1991) on the other hand studied consumers’ perception on deal
frequency and deal price and found that people are often very knowledgeable about
promotion frequency as well as price discounts for different product categories. These
consumers are therefore often aware of the next occurrence of a deal and might be
affected differently by sales promotions.
Price promotions have shown to have a significant effect on consumers stockpiling the
promoted product (Diels & Wiebach, 2011; Sloot, Verhoef & Franses, 2005; van Heerde,
Gupta & Wittink, 2003). Consumers are likely to compare the inventory costs with the
product price and consequently decide on buying more and earlier than they would
necessarily need at that moment due to the promotion. However, Sloot, Verhoef and
Franses (2005) emphasize that this is naturally only applicable to non-perishable
products as perishable products such as milk or bread would go bad too soon and are
therefore unlikely to be stockpiled.
The extent to which a promotion creates involvement is considered to be another
influencing factor on a customer’s decision-making (Schindler, 1992). Two well-known,
evidential but extreme examples of these involvements consider the ‘coupon queens,’
who have mastered the competency of paying as little as necessary while buying as much
as possible, and the ‘mileage maniacs,’ frequent flyers who study and take extra flights
just to increase their mileage on frequent-flyer programmes. This involvement only
accounts for a certain type of promotions that require the consumer to do something in
order to profit from the deal (Schindler, 1992).
However, even though some customers must be triggered by these types of sales
promotions being convinced they can out-smart the retailer and other customers, most
clients prefer promotions that are delivered to them on a silver platter (De Oliviera Santini
et al., 2015; Majeed, 2007; Rothschild & Gaidis, 1981). Deals are preferred to be delivered
right upon purchase, may this be a direct monetary discount (Majeed, 2007) or a premium
that comes with the product (De Oliviera Santini et al., 2015). Rothschild and Gaidis
(1981) even extent to this preference of easy deals by stating that customers even prefer
to have a lower discount as long as the efforts are minimal.

24
2.4.2 AWARENESS OF SALES PROMOTIONS
Cobb and Hoyer (1986) distinguished three consumer groups in grocery retail; planners,
partial planners and impulse purchasers. Their study showed that planners mostly decide
on both the product category and specific brand before entering the store, while partial
planners often only considered the product category and impulse purchasers did not plan
anything at all before entering the store (Cobb & Hoyer, 1986). Additionally, the
researchers were able to examine the different in-store behavioural processes of the three
groups. Planners, the largest segment in their study, were mostly concerned with the
product image, brand image and product performance of the products they bought,
leaving little to no influence to the retailer on their decision. Partial planners on the other
hand were found to be most easily influenced due to their intensive searches in-store,
high price sensitivity and likeliness to respond to in-store promotions (Cobb & Hoyer,
1986). Finally, impulse purchasers were considered to be highly sensitive to in-store
stimuli concerning promotional deals as immediate triggers (Cobb & Hoyer, 1986; Xu &
Huang, 2014).
With these three groups of customers borne in mind, different situations of price
promoted purchases can be considered. Planners, the biggest group of grocery customers,
already knowing exactly what products of which brands they want to buy before entering
the store, could already be aware of the deal before entering the store due to their pre-
purchase research in for example television ads, supermarket flyers, newspaper ads,
direct marketing, etc. However, planners might not be aware of the promotion beforehand
and are only confronted in-store with these promotions. Nevertheless, Schindler (1992)
mentions, as stated before, that once consumers have already made up their decision at
home on the certain products they will buy, chances are much less they will be seduced
by other attractive alternatives.
Partial planners, being the most easily influenced consumer group, are assumed to be
highly responsive to promotions due to their high price sensitivity. No matter if the
consumers were already aware of the price promotion before their store visit or being
confronted in-store, this consumer group is assumed to be dragged along in the efforts of
the marketers.
Finally, impulsive purchasers, are considered to be a difficult group to count on due to
their unexpected behaviour and unpredicted purchases. Nevertheless, this group is highly
sensitive to stimuli and could be convinced as long as the promotions offer such a great
deal that they cannot be ignored or the consumers are unwittingly convinced of an
immediate strong intrinsic desire to purchase the product (Khorrami & Esfidani, 2015; Xu
& Huang, 2014).

25
2.5 CONCEPTUAL RESEARCH MODEL & HYPOTHESES
Based on the theoretical findings concerning OOS research and consumer behaviour
towards price promotions, a research model and hypotheses were developed. This model,
as presented in Figure 2, aims to serve as a basis for the empirical research in which the
hypotheses will be tested.
Price promotions are the most popular type of promotion among consumers (Majeed,
2007) and are therefore considered to be the origin of this research model. While there
are several antecedents influencing a consumer’s promotional decision-making,
antecedents regarding a consumer’s behavioural response to a promoted item being out-
of-stock were not established in previous studies. It was therefore chosen not to include
the potential antecedents, based on regular OOS situations and consumer decision-
making towards price promotions, in this study. These antecedents were however taken
into account when developing hypotheses for OOS reactions.
To be able to compare reactions on OOS situations of promotional versus regular-priced
items, Sloot, Verhoef and Franses’ (2005) classification of consumer reactions on regular-
priced stock-outs functioned as a basis. However, as category switch and cancellation are
very rare responses in prior research (Sloot, Verhoef & Franses, 2005) it was decided to
not include these two elements in the research model and focus on the most common OOS
responses. In addition to this, with this study introducing the concept of consumer
reactions on OOS situations of promoted items, two additional possible responses were
introduced. First, due to the high importance of price as a factor for consumers (e.g. De
Oliviera Santini et al., 2015; Diels & Wiebach, 2011; Walters, 1991), it was assumed that
customers are likely to switch to another store of the same retail chain in case of a stock-
out to still benefit from the price promotion, further referred to as branch switching. The
second response added concerns consumers postponing their purchase until the next
time the product is on sale again. This behavioural response was added due to this study’s
focus on price promoted OOS situations, opening up for two different postponement
possibilities.
Furthermore, it was chosen to focus on planned purchases where customers are aware of
the promotion before their shopping trip as it is assumed that the stock-out situation in
this case will have the highest effects. Moreover, this study will focus on the last day of
promotion of one specific product instead of a whole product category or brand line to
rule out additional influences on substitution behaviour.

26
Figure 2. Conceptual research model
Studies within consumer decision-making show that price promotions can have a
significant effect on a consumer’s choice, leading many consumers to adapt their shopping
behaviour accordingly (Alford & Biswas, 2000; de Oliveira Santini et al., 2015; Gönül &
Srinivasan, 1996; Majeed, 2007; Walters, 1991). It is due to price promotions being very
powerful in influencing a customer’s choice, that the researchers expect consumers to
also react differently in OOS situations of a price promoted item as compared to an OOS
of a regular-priced item. Furthermore, is it not only assumed that the reactions
themselves differ, but also the intensity of each reaction, resulting in a different rank
order of possible reactions. This indicates that the most and least preferred option may
be different for promotional and regular OOS.
H1: The intensity of promotional OOS reactions is different from regular-priced
OOS reactions.

27
Substitution
With regards to the literature on OOS behaviour, it can be concluded that the substitution
options brand- and item switching were always considered to be significant responses,
despite the purpose or research design of the study (e.g. Aastrup & Kotzab, 2010;
Emmelhainz, Emmelhainz & Stock, 1991; Sloot, Verhoef & Franses, 2005). Moreover, Diels
and Wiebach (2011) state that consumers experiencing a stock-out of a regular-priced
item are most likely to substitute their product in-store instead of switching stores due to
convenience. Considering promotional out-of-stock behaviour without any further
antecedents as e.g. brand loyalty, it is assumed that the two response types will be fairly
similar due to the absence of the promotional deal and therefore lower than in OOS
situations of regular-priced items.
H2a: The likelihood of consumers switching to another product of the same brand
is lower for promotional items than for regular-priced items in an OOS situation.
H2b: The likelihood of consumers switching to another brand is lower for
promotional items than for regular-priced items in an OOS situation.
Postponement
Postponing the purchase as a consumer behavioural option in an OOS situation, was
initially defined by Sloot, Verhoef and Franses (2005, p. 19) as “postponing the intended
buy until the next regular trip to the supermarket.” However, in a situation of price
promoted stock-outs the postponement could become more complex. It is assumed that
customers might postpone their purchase for two different reasons; their desire for the
specific product or their intention to buy that product for the promotional price.
In case of the latter, consumers often perceive promotions as an infrequent offer and feel
the urge to make use of this offer as long as it lasts (Gönül & Srinivasan, 1996). Krishna,
Currim and Shoemaker (1991), however, studied that some consumers are very
knowledgeable about the deal frequency of certain products, indicating that if a
promotional offer runs out, consumers are aware of and expect the promotion to be
offered again. This statement was complemented by Kalwani and Yim (1992) who found
that customers might start taking frequently promoted products for granted making them
unwilling to pay the regular price for this certain product. Furthermore, price promotions
have shown a significant link to consumers stockpiling the promoted product (Diels &
Wiebach, 2011; van Heerde, Gupta & Wittink, 2003). This relation can be explained by the
fact that stockpiling does not inevitably happen at the same time as the consumer’s

28
consumption, leading to consumers buying large quantities of the product at the most
beneficial moment. Based on these findings, it is considered to be very likely for customers
who experience an OOS of a promotional item to postpone the purchase until the same
product is promoted again.
H3a: The likelihood of consumers postponing their purchase is higher for
promotional items than for regular-priced items in an OOS situation where
consumers are mostly motivated by the promoted price.
However, concerning the other reason behind a consumer’s postponement regarding
their desire for the specific product, it is assumed that the behavioural responses will be
equal in both OOS situations. This, due to the promotional price being less of a
motivational factor than the product itself.
H3b: The likelihood of consumers postponing their purchase is equal for promotional
items than for regular-priced items in an OOS situation where consumers are mostly
motivated by the specific product.
Change location
As consumers see price as a key factor when making purchasing decisions and often
switch between different retail stores to make use of the best promotional deals (Walters,
1991), the option to go to another branch of the same retailer is considered to be of high
importance within the context of a promotional OOS. As promotions are usually not
limited to one specific retail outlet but are offered in the whole retail chain it is assumed
that consumers are very likely to leave the affected store and visit another store of the
same retail chain to benefit from the promotion.
H4a: The likelihood of consumers switching to another branch is higher for
promotional items than for regular-priced items in an OOS situation.
While store switch, in prior literature, is listed among the most common reactions to OOS
situations (Sloot, Verhoef & Franses, 2005) it is believed that the likelihood of consumers
going to another store to purchase the intended product is higher for regular-priced than
for promotional items. This is due to the fact that the promotional item is directly linked
to a specific retail chain, making it less attractive for consumers to switch to a different
store where the benefits of the promotion will not be present.
H4b: The likelihood of consumers switching to another store is lower for
promotional items than for regular-priced items in an OOS situation.

29
Based on the assumptions concerning OOS for price promoted products, the researchers
adapted the overview of responses and developed the three categories Substitution,
Postponement and Location switch. The structure of Figure 3 below will further on be used
throughout this thesis.
Figure 3. Promotional OOS responses

30
3 METHODOLOGY
The following chapter illustrates the methodological approach used for this research as well
as the motivation behind it. Research philosophy, approach, strategy and design as well as
data collection methods and sampling techniques are outlined in this chapter. Furthermore,
an argumentation for the research context and object are provided. A reflection on possible
limitations as well as a critical methodological evaluation of the research design are
presented at the end of this section.
3.1 METHODOLOGICAL APPROACH
This section elaborates on the chosen research philosophy, strategy, approach and design
of which the combination presents an argumentation for the choices made that ultimately
justify the selected research method. This method aims to fulfil the research purpose and
answer the research question in the best possible way.
3.1.1 RESEARCH PHILOSOPHY
According to Easterby-Smith, Thorpe and Jackson (2012) it is of high importance for the
researchers to be aware of the research philosophy as it rationalizes and justifies a
suitable research design. The research philosophy argues for the type of knowledge
needed, how these findings could answer the posed research question and prevents the
researcher from heading in the wrong direction when choosing an appropriate research
design. Being aware of one’s philosophical stand points does not only enhance the quality
of the conducted research but can remarkably contribute to the researchers’ creativity
and their consideration of different research methods (Easterby-Smith, Thorpe & Jackson,
2012).
From an ontological point of view, the study in hand is based on the grounds of
objectivism. The researchers believe that consumer reactions to promotional stock-out
situations are independent of external social actors and that an objective reality towards
this issue exists (Bryman & Bell, 2015). It is believed that consumers respond to the
temporary unavailability of a promoted product uninfluenced by external realities.
Within this research the main focus lays on one’s own behaviour and decisions in case of
a promotional stock-out instead of the societal pressure on one’s behaviour. Therefore,
the ontological orientation of this research is based on an external, objective reality
(Bryman and Bell, 2015). Research philosophy is further concerned with researchers
taking an epistemological stance. Epistemology concerns the issue of what should be
viewed as acceptable knowledge in a certain discipline and in which ways the nature of

31
the world can be inquired (Easterby-Smith, Thorpe & Jackson, 2012). As the intention of
this research is to test theoretical concepts that have previously been developed on a
more specific phenomenon, the researchers take a clear positivistic standpoint.
Positivism supports the view that the role of research is to use theory as a starting point
to generate and test hypotheses to explain and develop common laws (Bryman & Bell,
2015). The intention of the researchers to follow this positivistic philosophical stance
derives from its emphasis on quantifiable data and statistical analysis (Saunders, Lewis &
Thornhill, 2009).
3.1.2 RESEARCH APPROACH
The chosen approach for the studied matter follows a conclusive approach. While the
opposite, exploratory research designs, focus on providing new insights and are therefore
rather unstructured in nature, conclusive research tests more specific hypotheses based
on previous research (Malhotra, 2010). As the subject of consumer response towards
stock-outs in the grocery environment has already received much attention in previous
studies, the conclusive approach aims to generalise these findings for the specific
situation of promotional stock-outs. This approach is the result of following a deductive
process in which existing theory and research, such as consumer response models, are
used to test new hypotheses (Bryman & Bell, 2015). The developed hypotheses are based
on previous studies and theoretical frameworks within OOS literature as well as on
factors shaping promotional decision-making. An extensive literature study is needed in
order to create a conceptual framework leading to several hypotheses. The confirmation
or rejection of the hypothesis in the end of the research process will lead to the revision
or verification of previous findings (Bryman & Bell, 2015). The deductive approach, in
which hypotheses are created “[..] on the basis of what is known about a particular domain
and of theoretical considerations in relation to that domain [..]” (Bryman & Bell, 2011,
p.23), is therefore justifiable.
3.1.3 RESEARCH STRATEGY
In accordance with the objectivistic and positivistic research philosophy and the
deductive research approach, the chosen research strategy is of quantitative nature. The
coherence of these combinations is underlined by Bryman and Bell (2015, p. 37) stating
that quantitative research “[..] entails a deductive approach to the relationship between
theory and research, in which the accent is placed on the testing of theories [..].” As stated
above, the researchers aim to test existing OOS theories on a specific phenomenon within
this field, namely promotional stock-out situations in comparison to regular-priced OOS.
Furthermore, Easterby-Smith, Thorpe and Jackson (2012) argue that there are two types
of data sources that can be used within quantitative studies; primary and secondary data.

32
Keeping the research philosophy and approach as well as the aim of this study in mind,
primary data will serve as the source to test and revise theory on the basis of quantifiable,
highly relevant data. Additionally, the research purpose is of descripto-explanatory
nature. This indicates that the design entails elements of descriptive as well as
explanatory kind. While the classification of promotional OOS responses is rather
descriptive and seen as a means to an end rather than an end in itself and possibly as a
precursor to explanation, the comparison of promotional to regular-priced items aims to
provide further explanation and understanding of the phenomenon (Saunders, Lewis &
Thornhill, 2009).
3.1.4 RESEARCH DESIGN
While the decision to conduct quantitative research has been established, it is necessary
to be specific about the direction of one’s research design. A design gives structure to the
research and aims to provide a framework for further data collection methods and
analysis (Bryman & Bell, 2015). The design that complements the purpose of this research
the most is an experimental design. A classical experimental design involves two
randomly assigned groups that are equal in all aspects relevant to the research, of which
one group is exposed to a planned manipulation in order to assess its effect on a variable.
While one group, the experimental group receives a certain treatment, the other group,
the control group, does not, which enables the researchers to detect the effect of the
manipulated variable (Bryman & Bell, 2015; Easterby-Smith, Thorpe & Jackson, 2012;
Saunders, Lewis & Thornhill, 2009). Easterby-Smith, Thorpe and Jackson (2012) point
out, that the choice of an experimental design complements the applied positivist
research philosophy by developing hypotheses to confirm or disconfirm assumptions of
the world. As pointed out by Bryman and Bell (2015), comparison acts as a tool to examine
experiments, which leads to a better understanding of the studied issue as it is compared
with something similar. As the aim of this study is to detect and compare differences and
similarities between regular-priced and promotional OOS consumer reactions, an
experimental design therefore served as the most appropriate way to do so. The exposure
of the experimental group to a promotional stock-out while the control group is exposed
to a regular stock-out situation enabled the researchers to accurately test the developed
hypotheses and compare consumer reactions.
Moreover, a classical experimental approach often entails a pre- and post-test of the
experimental as well as the control group to compute the differences between each
groups’ scores and establish whether the manipulation had an impact (Bryman & Bell,
2015). However, for the study in hand a post-test only control group research design was
chosen. Following this approach, the experimental as well as the control group are only
tested after the treatment and not before. This does not only entail saving of valuable

33
resources such as time and money, but prevents a possible interaction effect that is likely
to occur when being exposed to a pre-test. A criticized disadvantage of experiment pre-
testing is the possibility for participants to get sensitized to the experiment if they have
been pre-tested, which may result in different outcomes (Bryman & Bell, 2015; Malhotra,
2010).
In accordance with the research design, a research method is chosen which highly
depends on, or even more, is a logical consequence of a researcher’s standpoints within
ontology and epistemology as well as the taken research approach, strategy and design
(Bryman & Bell, 2015; Saunders, Lewis & Thornhill, 2009). The method chosen to be most
applicable for the realization of the experimental research design are structured
interviews, also referred to as standardized interviews or social surveys. This type of data
collection method involves conducting interviews in which every respondent is provided
with the same stimulus and order of questions as other respondents. Usually, social
surveys are administered to a large number of respondents in order to quantify the data
and extract generalisable patterns (Bryman & Bell, 2015). A large benefit of this method
is the standardisation of both the questions asked and the recording of the answers. This
allows the researcher to assume that, when properly executed, the variation between the
respondents can be attributed to true variation and not due to interview errors, of which
the latter are a frequent threat when using semi- or unstructured interviews (Bryman &
Bell, 2015). Furthermore, the interviewer variability and bias within structured
interviews compared to any other type of data collection is fairly low. Due to the limited
choice of possible answers, the risk of the interviewers misinterpreting the answer or not
reporting the full answer of the respondent is limited (Bryman & Bell, 2015).
3.2 RESEARCH SETTING
In order to be able to compare the results of both surveys it was decided that a specific
research setting is needed. This decision is furthermore based on the aim of quantitative
research to get large quantities of data on a very specific subject (Bryman & Bell, 2015).
To provide a clear understanding of the chosen research context and the reasoning behind
the research object, further clarifications are given in this chapter.
3.2.1 RESEARCH CONTEXT
As the authors of the thesis in hand live in Sweden it was, due to means of accessibility,
decided to concentrate the research on the Swedish market. However, this decision is not
only based on reasons of convenience. While numerous researchers have already looked
at OOS reactions in different geographical locations, such as the Netherlands (Sloot,
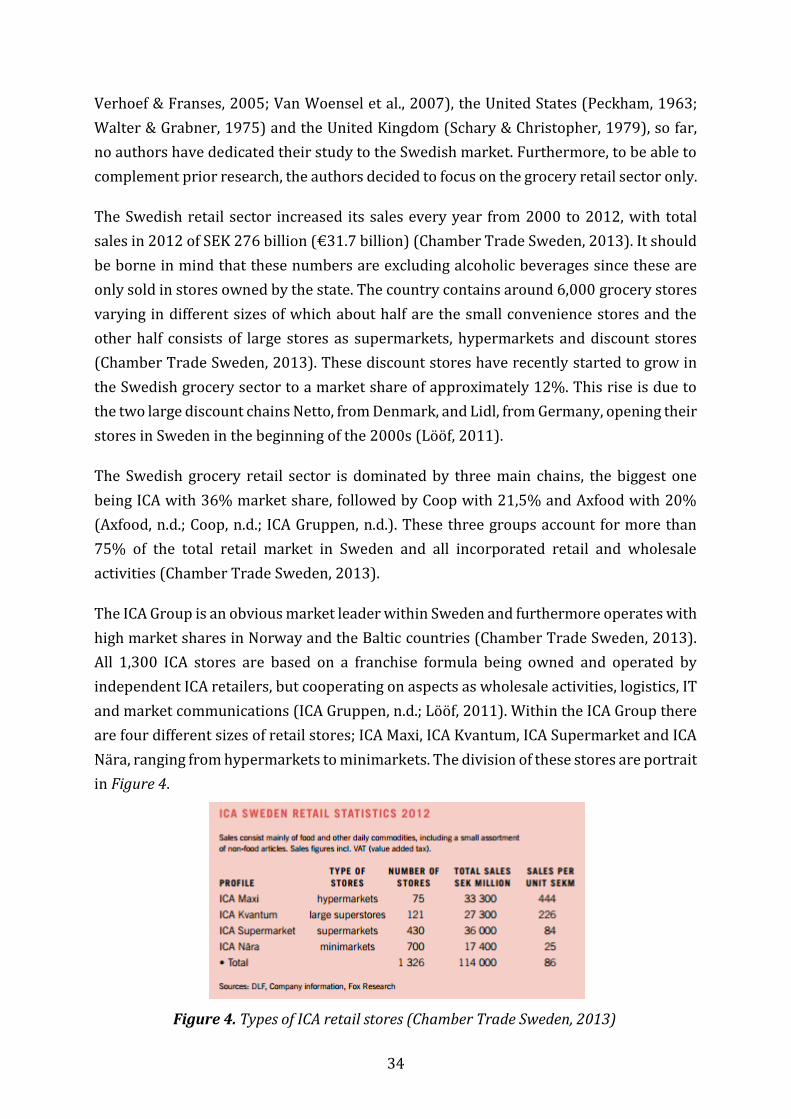
34
Verhoef & Franses, 2005; Van Woensel et al., 2007), the United States (Peckham, 1963;
Walter & Grabner, 1975) and the United Kingdom (Schary & Christopher, 1979), so far,
no authors have dedicated their study to the Swedish market. Furthermore, to be able to
complement prior research, the authors decided to focus on the grocery retail sector only.
The Swedish retail sector increased its sales every year from 2000 to 2012, with total
sales in 2012 of SEK 276 billion (€31.7 billion) (Chamber Trade Sweden, 2013). It should
be borne in mind that these numbers are excluding alcoholic beverages since these are
only sold in stores owned by the state. The country contains around 6,000 grocery stores
varying in different sizes of which about half are the small convenience stores and the
other half consists of large stores as supermarkets, hypermarkets and discount stores
(Chamber Trade Sweden, 2013). These discount stores have recently started to grow in
the Swedish grocery sector to a market share of approximately 12%. This rise is due to
the two large discount chains Netto, from Denmark, and Lidl, from Germany, opening their
stores in Sweden in the beginning of the 2000s (Lööf, 2011).
The Swedish grocery retail sector is dominated by three main chains, the biggest one
being ICA with 36% market share, followed by Coop with 21,5% and Axfood with 20%
(Axfood, n.d.; Coop, n.d.; ICA Gruppen, n.d.). These three groups account for more than
75% of the total retail market in Sweden and all incorporated retail and wholesale
activities (Chamber Trade Sweden, 2013).
The ICA Group is an obvious market leader within Sweden and furthermore operates with
high market shares in Norway and the Baltic countries (Chamber Trade Sweden, 2013).
All 1,300 ICA stores are based on a franchise formula being owned and operated by
independent ICA retailers, but cooperating on aspects as wholesale activities, logistics, IT
and market communications (ICA Gruppen, n.d.; Lööf, 2011). Within the ICA Group there
are four different sizes of retail stores; ICA Maxi, ICA Kvantum, ICA Supermarket and ICA
Nära, ranging from hypermarkets to minimarkets. The division of these stores are portrait
in Figure 4.
Figure 4. Types of ICA retail stores (Chamber Trade Sweden, 2013)

35
As shown in Figure 4 ICA’s minimarkets belong to the largest group of stores. However,
considering the purpose of this study, this type of grocery retail is not very relevant as it
often only offers a small assortment of each product category. Measuring consumer’s
behaviour considering item and brand substitution would therefore be biased. The
second largest group concerns the ICA supermarkets, which, considering the total sales,
also is the largest player of all ICA store types. Based on these numbers it is chosen to
execute the research in an ICA Supermarket in Lund, Sweden. This city is selected due to
accessibility reasons for the researchers and the large availability of both different types
of ICA stores and other retail chains as Coop and Axfood stores. The ICA store selected is
located in the Northern part of the city, closely located to family and student housing
areas. This choice is based on the store-related variables by Sloot, Verhoef and Franses
(2005), considering store loyalty and the availability of acceptable alternative stores in
the neighbourhood.
3.2.2 RESEARCH OBJECT
The studies discussed in the literature review researched a wide variety of product
categories. Based on these established criteria, several features are considered for this
study in order to choose a product category applicable to OOS situations of both regular-
priced and price promoted products. With this study being conducted in Sweden, coffee
was chosen as the research object. According to Kjelgaard and Ostberg (2007),
Scandinavian countries have the world’s highest annual coffee consumption per capita
which is about 2.5 times as much as the Italians, often considered the coffee nation of the
world. Statistics of 2014 even show that Sweden is the number two country in the world
with an average of 1,211 coffee cups consumed per day, coming right after Finland
(Statista, 2016). Next to its high consumption rate, coffee also has a high household
penetration rate and purchase frequency in Swedish supermarkets even though 25% of
the population visits a café at least once a week (Chamber Trade Sweden, 2010; European
Coffee Symposium, 2015).
Furthermore, the availability of different alternatives concerning brands and product
sizes in Swedish grocery retail is fairly high. These wide product ranges are considered to
be interesting concerning the high substitution possibilities in case of an OOS situation
(Campo & Nisol, 2004; Emmelhainz & Stock, 1991b; Sloot, Verhoef, Franses, 2005;
Verbeke, Farris, Thurik, 1998). However, coffee consumers appear to be very loyal to their
preferred brand and package size (Peckham, 1963; van Heerde, Gupta & Wittink, 2003).
Kumar and Leone (1988) argue for the relatively high effect of price promotions on coffee
considering it to be a fairly high priced product which is purchased frequently. This was
confirmed by Kalwani and Yim’s study (1992) proving a significant relationship between

36
the promotion, internal reference price and coffee. Even though Swedish consumers are
known to be consuming a high proportion of the relatively more expensive Arabica coffee,
the Swedish retail prices for coffee are around €5,71 per kilogram which is among the
lowest prices in Europe (Chamber Trade Sweden, 2010). This can be declared by the
fierce competition in the Swedish coffee market in grocery retail, which leads to frequent
price promotions on these products (Chamber Trade Sweden, 2010). Cohen, Leung,
Panchamgam, Perakis and Smith (2014) followed the promotional planning of coffee and
found that a particular coffee brand is on sale for 23% of the time, which basically means
once every four weeks.
With coffee being frequently researched in OOS studies (Cohen et al., 2014; Kalwani &
Yim, 1992; Kumar & Leone, 1988; Peckham, 1963; van Heerde, Gupta & Wittink, 2003;
van Woensel et al., 2007), it is assumed to be a relevant product category for the purpose
of this research as well. These frequent stock-outs will help the consumer in their ability
to imagine a stock-out situation at the moment of the experiment (Rani & Velayudhan,
2008).
A final important factor considers the stockpiling possibility of coffee. As found in
literature and incorporated in the hypotheses, a consumer’s stock is of influence on their
behaviour, especially in the case of price promotions as it may lead to larger quantities
purchased (Diels & Wiebach, 2011; Sloot, Verhoef & Franses, 2005).
3.3 DATA COLLECTION
This chapter explains the data collection process including specifics of the administered
survey, the method of operationalisation, the conduction of a pilot study as well as the
used sampling technique.
3.3.1 SURVEY DESIGN
In accordance with the choice of applying an experimental survey design, two different
surveys were created (Appendix 8.1.1 & 8.1.2). While the Experimental Group (EG)
received a certain treatment which the Control Group (CG) did not receive, the surveys
themselves followed a similar outline to ensure comparability. The EG was treated with
the factor price promotion, while the survey of the CG faced regular-priced items.
However, the questions themselves were created with the aim to examine the same kind
of behaviour which is why the question wording followed the same pattern with the only
difference being the impact of a price promotion in the EG. Both questionnaires contained
a short introduction that aimed to set the respondents in the right mind-set before

37
answering the questions. While the CG was asked to imagine their favourite coffee to not
be available in the store, the EG was asked to imagine their favourite, price promoted
coffee to not be available.
Within the context of survey design, the practice of operationalising studied concepts
needed to be considered. Operationalisation is the process of defining concepts into
measurable variables in order to test developed hypotheses quantitatively (Bryman &
Bell, 2015; Easterby-Smith, Thorpe & Jackson, 2012). Table 3 therefore aims to provide
an overview of the operationalised concepts by indicating the types and number of
questions used to observe the respective concept for each group.
Table 3. Operationalisation of concepts
CONCEPT HYPOTHESIS MEASURE CG EG
Item switch H2a 5 point Likert scale Q1 Q1
Rank order question
Q6 Q7
Brand switch H2b 5 point Likert Scale Q2 Q2
Rank order question
Q6 Q7
Promotion postponement*
H3a 5 point Likert Scale - Q3
Rank order question
- Q7
Product postponement
H3b 5 point Likert Scale Q3 Q4
Rank order question
Q6 Q7
Branch switch H4a
5 point Likert Scale Q4 Q5
Rank order question
Q6 Q7
Store switch H4b 5 point Likert Scale Q5 Q6
Rank order question
Q6 Q7
*While the respondents of both surveys faced the same kind of questions, the question
concerning H3a was only asked to the EG as the special influence of the factor ‘price’ was not
applicable to the CG. This is due to the concept of postponement being divided into two
questions for the EG (see chapter 2.5).
The surveys furthermore included four general questions, two control (C1, C2a/C2b) and
two demographic (D1, D2) questions as presented in Table 4. The control questions

38
functioned as a control factor to justify the chosen research object coffee in relation to
price promotions. The demographic questions D1 and D2 were developed to ensure and
regulate the exact same composition of the EG and CG which will further be explained in
subchapter 3.3.3..
Table 4. General questions
CONCEPT MEASURE CG EG
C1: Attraction to coffee promotion
5 point Likert scale Q7 Q8
C2a: Experience of coffee OOS
Closed question, single choice Q8 -
C2b: Experience of promoted coffee OOS
Closed question, single choice - Q9
D1: Age (Age group) Closed question, single choice Q9 Q10
D2: Gender Dichotomous question Q10 Q11
As indicated in Table 3 and Table 4, 5 point Likert scales were used as the main measure
to test the respondents’ likelihood of choosing the suggested reaction to an OOS situation.
A 5 point Likert scale enabled the respondent to indicate how strongly he or she agreed
with a statement or question asked, while agreeing reflects a positive attitude towards
the issue and disagreeing a negative tendency (Easterby-Smith, Thorpe & Jackson, 2012;
Saunders, Lewis & Thornhill, 2011). For the context of this thesis the scale was adapted
to a 5-point scale ranging from ‘highly unlikely’, ‘unlikely’, ‘neutral’ and ‘likely’ to ‘highly
likely’, including a neutral option for respondents that did not have an opinion about the
posed issue.
3.3.2 PILOT STUDY
According to Bryman and Bell (2015) it is suggested to conduct a pilot study or a pre-test
before conducting a survey to ensure that the research instruments and the questions are
suitable for the study. To prevent misinterpretations during the process of data collection,
a pilot study was conducted for both questionnaires. Each questionnaire was tested by
ten previously selected members of the population who were asked to communicate any
difficulties or unclarities they faced while answering the questions. The received feedback
was then taken into consideration and the questionnaires adjusted accordingly.
39
3.3.3 SAMPLING
In general, the objective of most research is to gain knowledge about a population.
However, as a population refers to a whole set of people, such as frequent coffee shoppers
within the Swedish grocery retail sector, defining a sample is of key importance to
facilitate research, especially when conducting a quantitative study (Easterby-Smith,
Thorpe & Jackson, 2012). A sample refers to a segment of the population selected for
participation (Malhotra, 2010) and aims to make a statement about the population as a
whole (Easterby-Smith, Thorpe & Jackson, 2012). The importance of reasoned sampling
is therefore apparent.
To ensure an accurate and justifiable sample, the researchers first defined the population
the study would be tested on. While it is decided to conduct the study on the Swedish
market due to reasons of accessibility, it is further noted that male and female inhabitants
of the Swedish municipality Lund in Southern Sweden, aged 20-69 years old and frequent
coffee buyers are taken into account for this study. As mentioned before, accessibility in
reference to time and financial constraints are a guiding principle when defining the
population.
As emphasized beforehand, a highly important factor within the classical experimental
design was the random assignment of groups and group members. Random, or
probability sampling uses chance in the selection process, referring to each unit in the
population to having the same chance of being selected. The random assignment within
experimental designs aims to reduce threats to the internal validity of the study by
assuring that changes to the dependent variable can only be attributed to the intended
manipulation by the researchers and not to the different composition of the two groups
(Bryman & Bell, 2015).
However, due to the non-availability of a sampling frame that would include the whole
population from which a random sample could be taken, it was decided to approach the
population in the best possible manner by conducting surveys directly at the point of sale,
just outside of the selected ICA store. While this type of sampling would usually indicate
non-probability sampling, more specifically convenience sampling in which respondents
are chosen based on the judgment of the interviewer, a clear system was implemented to
ensure an unbiased selection of interviewees. The interviewers implemented a counting
system in which every third person that left the store was approached to fill out the survey
and was asked if he or she was a frequent coffee buyer and willing to participate in the
study. This way, judgmental choice of respondents was ruled out as a possible interviewer
bias. Only in the very end of the sampling process some judgemental sampling occurred
where judgements were based on the estimated age of the potential respondent. Even

40
though this sampling technique can by definition not be attributed to being a complete
random sampling approach but rather a form of systematic probability sampling, it was
believed that this technique was executed to the best possible extent and provided the
researchers with a valuable sample.
To ensure an equal composition of the experimental and control group, two sample
groups were developed based on the following factors: age (further classified into four
age groups: 20-29 years, 30-39 years, 40-49 years, 50-59 years, 60-69 years) and gender
(male, female). With both groups consisting of a sample size of 50 each, a detailed
grouping was conducted based on population statistics of the municipality Lund that
would ensure the same composition of both groups (Appendix 8.2). Furthermore, it was
established that a minimum of 30 respondents in each group would be needed to
effectively test the developed hypotheses using an experimental survey design.
3.3.4 DATA COLLECTION PROCESS
The surveys were designed as self-completion questionnaires in paper-format to be filled
out in front of a chosen ICA supermarket. While the researchers were present and
approached the participants to take part in the survey, the questionnaires were filled out
by the respondents themselves. To ensure a valuable sample the respondents were first
asked if they were frequent coffee buyers and only in case of a positive response, were
therefore asked to fill out the survey. Although the research took place on the Swedish
market, the questionnaires were only provided in English. As, according to the EF English
Proficiency Index 2015 (EF, 2015), Sweden scored number one with a very high
proficiency level of the English language, this was not considered as a possible bias in the
sampling process. Aiming for the most truthful responses the surveys were filled out
anonymously, preventing any social desirability bias. After completion of the
questionnaire every respondent received a small incentive in the form of candy to thank
them for their participation. The data itself was collected over a period of four full days
with both of the researchers being involved.
3.4 DATA ANALYSIS
The following subchapter elaborates on the process of data preparation, the final
composition of the survey groups as well as the statistical tests that are required to test
the presented hypotheses and detect differences between regular-priced and price
promoted OOS responses.

41
3.4.1 DATA PREPARATION
After the data was collected using self-completion questionnaires in paper format, the
gathered information was computed into SPSS which served as the primary tool of
statistical analysis for this thesis. Overall, 107 respondents participated in the study of
which 53 completed the experimental survey and 54 the control survey. Invalid and
incomplete surveys were deleted from the dataset and in case of a surplus of respondents
within a group, randomized deletion ensured an equal composition of groups, resulting
in 50 valid respondents in each group. A detailed overview of the composition of the
sample groups is presented in Appendix 8.3.
Additional datasets
Throughout the process of data clearance, it was decided that different datasets were
needed to effectively test the developed hypotheses and discover differences between
groups. The initial, complete dataset, further referred to as Dataset O, included every
single variable presented in the questionnaires. However, as the survey of the EG
comprised one more question (Q3; H3a promotion postponement) the dataset was not
suitable to conduct certain statistical tests as missing values of the CG would have
distorted the results. Hypotheses H3a therefore required special attention as it compares
the postponement dimension price within the EG to the postponement dimension product
within the CG which lead to the setup of two additional datasets.
Dataset A was designed to only compare the factor tested in H3b product postponement by
deleting the variable promotion postponement within the EG. Dataset B, used to test H3a,
followed a reverse argumentation, deleting the variable product postponement within the
EG. This way, no missing values occurred and an unvarnished comparison of the two
groups was ensured. However, as the mere deletion of a variable would alter the ranking
concept (Q7) in the EG, both datasets underwent a ranking adjustment for the EG,
according to the deleted variable.
Index construction: Transforming variable scores
In unison with the creation of additional datasets, the variables underwent a
transformation. The surveys consisted of individual questions on a 5-point-Likert scale as
well as an additional ranking question encompassing the same items. It was assumed that,
due to the behavioural questions being asked on an individual level while the ranking
question confronted the respondent with a direct comparison and therefore a more
holistic view, respondents were likely to react differently for the two different type of
questions. However, as both types of questions were considered to be equally important

42
to provide insights to the studied matter, the merging of the variables was required to
effectively test the overall tendency of the concepts.
In a first step, the variables were recoded into new scale items whereas each variable that
was previously given a value ranging from 1-5, depending on the response of the Likert
scale and ranking, was then given a new index score that weighed the particular response,
as shown in Table 5. In the next step the individual and ranking variables were
transformed into a new variable by computing the sum of the scores of each item. The
scores then ranked from 0-100, which enabled the researchers to look at the concepts
from a more comprehensive perspective and facilitated further analyses.
Table 5. Index construction
Index construction
5-point-Likert scale Ranking question
Very unlikely = 0 Least preferred = 0
Unlikely = 12,5 4th choice = 12,5
Neutral = 25 3rd choice = 25
Likely = 37,5 2nd choice = 37,5
Very likely = 50 Most preferred = 50
Grouping variable
As the survey did not include a single variable that was treated as an independent variable
but rather included the treatment of price promotion within all questions of the EG, a
grouping variable was created in SPSS and assigned to the two different groups. The
grouping variable ensured that differences between the two groups could be observed
and was treated as an independent variable and factor throughout all tests.
3.4.2 RESPONDENTS
The importance of an equal composition of the control and experimental group based on
the Lund population was outlined in previous chapters and put great emphasis on
throughout the data collection process. After clearing the dataset, both sample groups
consisted of 50 respondents, equally distributed among the defined groups based on age
and gender as outlined in Table 6 below.

43
Table 6. Composition of sample groups
Control Group (N=50) Experimental Group (N=50)
Age groups Male Female Male Female
20-29 8 8 8 8
30-39 5 5 5 5
40-49 5 4 5 4
50-59 4 4 4 4
60-69 3 4 3 4
The composition of the two sample groups accurately followed the previously defined
grouping based on the population of Lund (Appendix 8.2) and therefore fulfilled the
criteria of an experiment in which the control as well as the experimental group need to
be equal.
Testing differences in behavioural responses between EG and CG
ANOVA
The One-Way ANOVA served as the primary statistical analysis to capture differences
among the survey groups. This type of test is used to identify differences in the mean
values of two groups possibly caused by an applied factor or treatment. The factor in the
context of this thesis was the experimental treatment of being exposed to a price
promoted product. The ANOVA tests if the null hypothesis, which refers to all means being
equal, is true and therefore detects if the experimental treatment had an effect (Malhotra,
2010). While typically, within statistical tests a significance level of p ≤ 0.05 explains a
difference between two groups, the tests used reported a significance level at p ≤ 0.1.
Furthermore, the ANOVA test requires the dependent variables to be of metric nature,
referring to interval or ratio scale variables (Malhotra, 2010). While the behavioural
questions were computed into ordinal variables in which case an ANOVA test would not
be an appropriate statistic, the process of index construction transformed the variables
into metric variables which ensured the ANOVA test to be of value.

44
Qualitative comparison of results per item While a One-Way ANOVA gave an initial understanding of significant differences between
the two groups, a further look into the mean values and statistical crosstabulations of each
variable was taken in order to effectively test the developed hypotheses. A direct
comparison of the means served as the primary statistic to reject or support a hypothesis
in which a mean difference of 5.0 points (on an indexed scale from 0-100) was considered
a considerable difference. Crosstabulations for each item served as an additional indicator
of response tendency.
3.5 CRITICAL METHODOLOGICAL EVALUATION
In the following subchapter the quality of the chosen research design is assessed. Firstly, the
study’s reliability, validity and replicability are critically evaluated and tested for, using the
statistical reliability scale of Cronbach’s Alpha. In the second half the critiques towards an
experimental survey design and the limitations of the data collection process are provided and
justified.
3.5.1 RELIABILITY, VALIDITY AND REPLICABILITY
According to Bryman & Bell (2011), the three most important evaluation criteria are
reliability, validity and replicability, of which the latter is not as common as the first two.
Reliability concerns the repeatability of the results, questioning if the measurements of a
concept produce consistent results even when executed another time or by another
researcher. With this research being conducted via self-completion questionnaires, it was
assumed that the inter-researcher reliability of the study was reached. However, there
might have been minor influences of the researchers in the sampling process and
therewith on the outcomes of the study (Chapter 3.5.2). The internal reliability,
concerning the coherency of the questions asked about a concept, was measured by the
calculation of Cronbach’s Alpha coefficient.
Cronbach’s Alpha measures the reliability of a number of item scales that are expected to
measure one concept (Field, 2013). This reliability test is especially important when
several Likert scales are used all related to one concept. Within this study each concept
was only measured by two questions, the specific behavioural response question and the
ranking question. The acceptable value for Cronbach’s Alpha is a never ending discussion
between several researchers. Field (2013) argues that all values above 0.7 clearly indicate
a reliable scale, even though sometimes values above 0.5 are already sufficient. According
to Malhotra (2010), acceptable values for Cronbach’s Alpha are 0.6 and higher. With the
latter being a common used indicator and Field’s (2013) values ranging from 0.5 to 0.7 it

45
was decided to take 0.6 as the acceptable value for this study. Table 7 below shows the
results of a reliability analysis that was executed for each concept individually using
Dataset O (Appendix 8.4).
Table 7. Cronbach's Alpha
Concept Number of Items Cronbach’s Alpha (α)
Item switch 2 0.566
Brand switch 2 0.689
Promotion postponement 2 0.744
Product postponement 2 0.706
Branch switch 2 0.744
Store switch 2 0.785
The table shows that brand switch, α = 0.689, promotion postponement, α = 0.744, product
postponement, α = 0.706, branch switch, α = 0.744 and store switch, α = 0.785 all have
acceptable internal reliability scores. Item switch only had a Cronbach’s Alpha score of α
= 0.566 which, according to the minimum set before, would not have accounted for a
reliable scale on the concept of item switching. However, the questions used to test item
switching were exactly the same as the ones for all other concepts, meaning that the
internal reliability of one scale cannot be that different from another one. Field (2013)
also argues that concepts only measured by two items often have lower internal reliability
values and that therefore sometimes the minimal scores should be stretched a little.
Concerning this latter statement, the Cronbach’s Alpha scores of this research can be
considered rather high as all of them are only measured by two items per concept.
The second evaluation criteria considered replicability. For various different reasons
researchers may decide to replicate the results of others instead of using one’s own. In
order for this to be possible the other study must be replicable by having described all
procedures of the study in great detail. This makes replicability closely related to
reliability, as in both cases a study must be able to be redone, may that be for real or in
case of replication. With this thesis’ method chapter describing every detail of the
research process and the SPSS outputs provided in the appendices, this study can be
considered very replicable. Ironically, even though a study must be replicable, findings
are almost never replicated by other authors as this is often seen as weak within business
research (Bryman & Bell, 2011).

46
Validity, the third evaluation concept, is focussed on the integrity of the conclusions
drawn from a study, defining if the study measured what it was supposed to measure
(Bryman & Bell, 2011; Field, 2013). Within quantitative experimental research there are
four main types of validity that are important to be assured; measurement validity,
internal validity, external validity and ecological validity (Bryman & Bell, 2011). The first,
measurement validity, concerns if the measurements used actually measure the concepts.
With the concepts of this study being fairly straightforward as they concern behavioural
responses instead of emotional responses, the establishment of appropriate
measurements was easily ensured. To establish internal validity when using an
experimental research design, the two most important aspects are the use of a control
group and an equal composition of these two groups. The need for a control group arises
from the threats of not being able to compare the results of and effects on the
experimental group which would then make it questionable if these results occurred
naturally or due to the experiment (Bryman & Bell, 2011). While internal validity was
ensured to the highest level by accurate and equal composition of the two groups, external
validity, testing a study’s generalisability, of the experimental design was flawed for
various reasons. First, a hypothetical as opposed to a true experiment beard the issue of
not establishing generalisability due to the research not being in a natural setting
(Saunders, Lewis & Thornhill, 2011). Furthermore, the study overtly surveying
respondents may have caused the respondents to answer differently than they would
when not being aware of their participation in the study. Other generalisability constrains
concern the research focus on Lund’s population, which made the results only applicable
for this population. However, it may be that the same results would appear in other parts
of Sweden or even other geographical locations when the study would be executed
somewhere else. Finally, ecological validity is a point of concern within experimental
survey designs. Ecological validity “is concerned with the question of whether or not
social scientific findings are applicable to people’s everyday, natural social settings
(Bryman & Bell, 2011, p.43).” While the study was conducted providing the respondents
with a hypothetical setting before answering the questions, the authors tried to ensure
ecological validity in the best possible way by sampling respondents in front of the
supermarket, assuring them to already be in a grocery shopping mind-set.
3.5.2 METHODOLOGICAL LIMITATIONS
Even though an experimental survey design was found to be the most appropriate method
to analyse the differences in consumer responses in the two stock-out situations, there
are several limitations coming with it that should be borne in mind. The most well-known
comment to experimental survey designs in which the experiment takes place in a
scientific setting concerns the poor ecological and external validity as described in chapter
3.5.1. Furthermore, the lacking attention to the respondents as individuals all having their

47
own reasoning for their behaviour is another critique towards the quantitative nature of
the study (Bryman & Bell, 2011).
The survey element of the research design also brought some limitations to the table. First
of all, with the researchers being present while the respondents filled out the interviews,
the potential for social desirability bias occurred. This bias refers to the respondents
answering the questions differently due to their image of the most socially desirable
answer (Bryman & Bell, 2011). Although this type of bias is always present in research, it
was believed that due to the low degree of sensitivity of the topic and the anonymity of
the respondents this did not significantly affect the results. A further cause of concern
regarding the presence of the researchers was their ability to probe and prompt during
the structured interview. In the case of respondents not fully understanding the question
due to language barriers or difficult wording they sometimes asked for further
clarifications. Even though this might have violated the rules of structured interviewing
where every respondent should be provided with the exact same interview stimulus as
any other, it was decided to respond to the asked questions as this prevented the data
from missing values or biased responses due to misunderstandings. The interviewer
variability was however kept to a minimum by having the same explanation for each
question. Furthermore, as the researchers chose a structured interview design with the
questions to be closed and pre-coded, the possibility arose that respondents were unable
to precisely express their thoughts. Closed questions make it difficult to be exhaustive and
include all possible answers, instead they suggest certain kinds of answers to the
interviewees, which may not be catered for every respondent. (Bryman & Bell, 2015)
However, by pre-testing the surveys and using mostly Likert scale response sets the
researchers aimed to reduce this problem to a minimum. Further, the hypothetical
situation provided to the respondents in the beginning of the EG survey mentioned it to
be the last day of the promotional deal, limiting the generalisability of the results. This
was however chosen to eliminate external factors as the time of re-stocking or the
consumer being able to re-visit the store another time during the same promotion period.
Finally, the concern of the research being conducted only in Lund in the South of Sweden
raised questions of generalisability. It could be argued that, in the North of Sweden,
consumers are affected differently by stock-outs of their preferred coffee brand as there
are for example less options to go to a different supermarket as compared to the South of
Sweden due to its lower population density (Nations Encyclopedia, 2016). However, with
the majority of Sweden’s population living in the South and the coastal areas according to
Nations Encyclopedia (2016), and the limited budget and timeframe not allowing the
researchers to travel throughout the country, it was chosen to only collect data in the
Southern region.

48
One final limitation regards the sampling procedure used in this study. Due to the non-
availability of a sampling frame a complete random sampling was not attainable. It was
therefore decided to use the next best option, a systematic probability sampling. By only
approaching every third person leaving the supermarket judgemental decisions were
tried to be avoided. It should however be mentioned that when some pre-defined age
groups were almost filled, some sort of judgemental sampling was used by approaching
potentially suitable respondents based on their estimated age. Even though this way of
sampling cannot be considered as a complete random sampling technique, it did provide
the researchers with a valuable sample. Moreover, the perfectly equal group divisions
based on the percentages of Lund’s population for both variables gender and age,
improved the representativeness of the selected sample. Nonetheless, the researchers are
aware of the consequences of the used procedure regarding the lost possibility of
generalising the results to the population.

49
4 RESULTS
This chapter presents the results of the statistical tests conducted in SPSS. While a One-Way
ANOVA gives an initial understanding of the differences between groups and acts as a starting
point for further interpretation, an individual comparison of the relevant variables aims to test
the developed hypotheses. Finally, the control variables of the survey are analysed in order to
justify the chosen research object.
4.1 ANALYSIS OF VARIANCE (ANOVA)
To gain an initial understanding of possible differences between the two groups, a One-
Way analysis of variance (ANOVA) was conducted. The ANOVA test identified whether the
mean values of each item of the two groups significantly differed from each other. The
primary test results used to interpret the analysis were significance level and effect size,
as presented in Table 8 below.
A significant difference between the means of the two groups was detected at a
significance level of p ≤ 0.1. When a significant difference between two groups can be
detected, the strength of the effect of the factor price promotion on the affected dependent
variable is of interest. The effect size was measured using the statistic eta squared (ƞ2)
where its value varies between 0 and 1, while 0.10 accounts for a small effect (explaining
10% of the total variance) while 0.50 accounts for a large effect size (explaining 50% of
the total variance) of the factor on the variable (Field, 2013; Malhotra, 2010).
The ANOVA test was conducted using dataset A (Appendix 8.5.1), while extended with the
respective values for price promotion, taken from dataset B (Appendix 8.5.2). The
dependent variables were analysed against the grouping variable Group that served as an
independent variable and factor throughout all conducted tests. Significance was
reported for promotion postponement (p = 0,051; ƞ2 = 3.8%) and store switch (p = 0.074;
ƞ2 = 3.2%) indicating that promotion postponement explained 3.8% and store switch
3.2% of the total variance between groups, both accounting for a rather small effect
(Appendix 8.5.3). As presented in the table, no significant effects (n.s.) were detected for
the remaining four variables item switch, brand switch, product postponement and branch
switch.

50
Table 8. ANOVA results
Scale items Mean
value CG Mean
value EG F-Ratio
Significance value (p)
Effect size (ƞ2)
Item switch 69.00 66.00 0.337 0.563 n.s.
Brand switch 39.50 38.00 0.066 0.798 n.s.
Promotion postponement*
54.75 42.75 3.907 0.051 0.038
Product postponement
54.75 47.25 1.688 0.197 n.s.
Branch switch 27.00 34.75 2.347 0.129 n.s.
Store switch 40.50 29.75 3.265 0.074 0.032
*The results for promotion postponement were taken from the ANOVA test conducted in dataset
B in which promotion postponement in the EG was directly compared to product postponement
in the CG.
While the ANOVA test indicated that the majority of variables did not explain a significant
difference between the two groups, the items were further looked at from an individual
perspective by directly comparing the mean values in order to test the hypotheses, as
presented in the following chapter.
4.2 QUALITATIVE COMPARISON OF THE RESULTS PER ITEM
The main purpose of this thesis was to compare the behavioural responses of consumers
in two different stock-out situations. As the One-Way ANOVA test, as described before,
did not deliver significant differences for all variables between the control- and
experimental group, it was decided to execute a qualitative comparison between the mean
scores of each variable separately. This analysis of the means was based on the dataset A
as this dataset includes the responses of both the ranking- and the variable specific
questions. With these variables being used, the possible mean scores lie between 0 and
100 of which the first indicates that absolutely no one considers this option and the latter
represents a full willingness of every respondent to behave that way.

51
Next to a comparison of mean scores per individual behavioural response, statistical
crosstabulations of each variable were created. These outcomes provided the researchers
with more in-depth insights into the range of responses given to each question, which
could have gone lost when only comparing averages. In order to get even more specific
data, the percentages of both the item specific questions and the ranking questions were
collected and compared.
In the subtopics below each variable is discussed separately, leading to the decision of the
hypothesis being supported or rejected. This decision was based on a minimal mean
difference of 5.0 between the control- and experimental group. It should however be
borne in mind that the One-Way ANOVA results were only significant for promotion
postponement and store switching on a level of p ≤ 0.1. This means that even if the mean
scores showed a difference of 5%, the standard deviations of these results were too high
to result in significant differences, making the supported hypothesis less strong. It is
however assumed that these standard deviations would be lower with a larger sample
size, resulting in significant results on the ANOVA test. Further interpretations on the
supported or rejected hypotheses are provided in chapter 5.
4.2.1 SUBSTITUTION
Item switch
The first behavioural response variable concerns item switching (Appendix 8.6.1 & 8.6.2).
When looking into the responses given to the item switch-related questions it was found
that 66% of the CG respondents considered themselves to be likely or highly likely to
switch items. Within the EG respondents were not as convinced of the option as 36% of
the respondents answered likely and 34% unlikely. However, when analysing the results
of the ranking question both groups picked item switch as their most preferred option
with a score of 50% in the CG and even 54% in the EG.
Only a slight difference in means was found by comparing the CG (�̅� =69.0, SD =27.34)
against the EG (�̅� =66.0, SD =24.23). Even though this difference of 3.0 in means indicates
the same direction as hypothesis 2a predicted, it cannot be supported as the difference is
considered to be too small.
HYPOTHESIS 2a (Rejected): The likelihood of consumers switching to another product of
the same brand is lower for promotional items than for regular-priced items in an OOS
situation.

52
Brand switch
Brand switching is the second behavioural response variable considered (Appendix 8.6.1
& 8.6.3). The answering percentages of the respondents concerning brand switching
within both groups show that the respondents were not very likely to switch to another
coffee brand in case of a stock-out situation. It is however considered to be quite
remarkable that brand switching had the highest percentages of ‘Neutral’ answered of all
variables with 22% in the CG and 16% in the EG. This is also reflected in the range of
answers in the ranking question as within the CG 34% chose brand switch as their least
preferred choice, while 36% chose it as their 2nd choice. Within the EG 32% of the
respondents had brand switching as their last choice while 40% had it as their 2nd choice.
Also in this variable there was only a minor difference found between both mean scores
of which the CG (�̅� =39.5, SD =31.07) is just 1.5 points higher than the EG (�̅� =38.0, SD
=27.19). These scores show that the likelihood of consumers switching to another brand
of the same product category was lower for promotional items than for regular-priced
items in an OOS situation. However, the difference in mean scores is too small to consider
the hypothesis to be supported.
HYPOTHESIS 2b (Rejected): The likelihood of consumers switching to another brand is
lower for promotional items than for regular-priced items in an OOS situation.
4.2.2 POSTPONEMENT
Promotion postponement
Promotion postponement, considering the consumers of the EG to wait with their
purchase until the next time it is on sale again, also revealed a different outcome than
what was anticipated (Appendix 8.6.1 & 8.6.4). Within promotion postponement the CG
showed that 30% of the respondents were likely to postpone, while 26% were unlikely to
wait. The EG within promotion postponement was a lot less likely to wait with 38% being
highly unlikely and 32% unlikely. Nevertheless, comparing the ranking question, only
20% of the EG had promotion postponement as their least preferred option, 30% as their
3rd option and even 28% as their most preferred choice, an almost equal division
compared to the CG.
Contrasting the hypothesis, the mean score of the EG (�̅� =42.75, SD =32.35) turned out
to be lower than in the CG (�̅� =54.75, SD =28.22), where regular-priced item
postponement was measured.

53
HYPOTHESIS 3a (Rejected): The likelihood of consumers postponing their purchase is
higher for promotional items than for regular-priced items in an OOS situation where
consumers are mostly motivated by the promoted price.
Product postponement
Within the variable of product postponement, in which it was measured how willing
consumers are to wait with their purchase until the product is available again, the division
within the answers of both groups were quite different (Appendix 8.6.1 & 8.6.5). Within
the CG 30% answered to be likely to postpone their purchase until the next time the
product is available again and 26% responded to be unlikely to wait. The EG only had 14%
of the respondents to be likely to postpone, while 42% answered to be unlikely to wait.
These clear differences were less visible in the ranking question, where 40% of the CG
respondents and 38% of the EG respondents chose product postponement as their 3rd
choice and even 26% in both groups as their first choice. However, 22% of the EG had
product postponement as their least preferred option while in the CG this was only 8%.
This clear division was also reflected when comparing the means. The respondents of the
CG (�̅� =54.75, SD =28.22) were evidently more likely to postpone their purchase than the
respondents of the EG (�̅� =47.25, SD =29.48). This difference was unexpected as the
researchers anticipated there to be no difference due to the lack of the influence of the
price promoted product, which leads to hypothesis 3b to be rejected.
HYPOTHESIS 3b (Rejected): The likelihood of consumers postponing their purchase is equal
for promotional items than for regular-priced items in an OOS situation where consumers
are mostly motivated by the specific product.
4.2.3 CHANGE LOCATION
Branch switch
Branch switching, a behavioural response that was especially added considering the
influence of price promoted OOS situations, appeared however, to be a very unpopular
choice within both groups (Appendix 8.6.1 & 8.6.6). 73% Of the CG and 74% of the EG
mentioned branch switch to be an unlikely or highly unlikely option. Within the ranking
question however, it appeared that the EG is more likely to consider branch switching
than the CG, even though both groups show the highest percentages for this option in the
4th choice (42% CG – 38% EG).
The mean scores of both groups show these clear differences as portrait in the ranking
question as well. As expected, the CG (�̅� =27.0, SD =22.64) had a significantly lower mean
score than the EG (�̅� =34.75, SD =27.70), indicating that consumers are more likely to

54
switch to another supermarket of the same branch in case of a price promoted OOS
situation than in the case of a stock-out of a regular-priced item.
HYPOTHESIS 4a (Supported): The likelihood of consumers switching to another branch is
higher for promotional items than for regular-priced items in an OOS situation.
Store switch
The final behavioural response tested, considered customers switching to any other store
in order to still purchase the desired product (Appendix 8.6.1 & 8.6.7). Respondents in
both groups were not very likely to switch stores in case of a stock-out situation. The EG
appeared to be even more negative towards this option with 68% of the respondents
choosing unlikely or highly unlikely, while only 54% of the CG chose these answers and
34% of this group claimed to be likely or highly likely to switch stores. This contrast is
also clearly visible in the answers of the ranking question with a quite equal division of
all positions within the CG and a large tendency to be the least preferred option in the EG
(4th choice 36% and last choice 32%).
This variable showed quite some differences in mean scores between the two groups in
which the CG (�̅� =40.5, SD =32.30) scored much higher than the EG (�̅� =29.75, SD
=26.95). These scores show that the consumers not influenced by the price promotion
were more likely to switch stores than the consumers that were considering the price
promoted product. This being found, together with the significant results of the One-Way
ANOVA test as described before, the hypothesis concerning store switching was found
supported.
HYPOTHESIS 4b (Supported): The likelihood of consumers switching to another store is
lower for promotional items than for regular-priced items in an OOS situation.
4.2.4 INTENSITY DIFFERENCES
Even though not all hypotheses were supported by the results of this study, the mean
scores between the groups have shown fairly interesting results (Table 9). The table
shows that only within item switch and brand switch, the two substitution variables, there
are hardly any differences in mean scores between the groups. Within the non-
substitution variables however, there are some clearly visible differences of at least 7.75
points on a scale of 1-100.

55
Table 9. Mean scores per variable
Scale items Mean value CG Mean value EG
Item switch 69.00 66.00
Brand switch 39.50 38.00
Promotion postponement*
54.75 42.75
Product postponement 54.75 47.25
Branch switch 27.00 34.75
Store switch 40.50 29.75
*The results for promotion postponement were taken from the ANOVA test conducted in dataset
B in which promotion postponement in the EG was directly compared to product postponement
in the CG.
Based on the mean scores, that combined both the outcomes of the specific behavioural
response questions and the ranking question, a ranking for both groups was created
where number 1 represents the most preferred option (Table 10). Both rankings are,
despite the differences in means, quite similar. However, it is remarkable that store switch
moved from the 3rd position in the CG, to the last position in the EG. Furthermore, it could
be stated to be interesting that promotion postponement has ended up quite high on the
ranking of the EG, but underneath product postponement. Interpretations and
elaborations on these results are provided in the next chapter.
Table 10. Intensity of responses
Control Group Experimental Group
1 = Item switch 1 = Item switch
2 = Product postponement 2 = Product postponement
3 = Store switch 3 = Promotion postponement
4 = Brand switch 4 = Brand switch
5 = Branch switch 5 = Branch switch
6 = Store switch

56
The main inspiration for this research concerned the expected difference in OOS reactions
in the different OOS situations. This hypothesis was overall, despite some of the rejected
hypotheses, supported by the results mentioned above.
HYPOTHESIS 1 (Supported): The intensity of promotional OOS reactions is different from
regular-priced OOS reactions.
4.2.5 OVERVIEW OF SUPPORTED AND REJECTED HYPOTHESES
Table 11 provides an overview of the tested hypotheses. Even though only three out of
seven hypotheses were supported by the collected data, the minor differences between
the mean scores for item- and brand switch showed a possible tendency in the direction
of the hypothesis. These differences were however not large enough to support the
related hypotheses.
Table 11. Overview of hypotheses
Hypothesis Concept Supported/Rejected
1 Intensity differences between groups
Supported
2a Item switch Rejected
2b Brand switch Rejected
3a Promotion postponement Rejected
3b Product postponement Rejected
4a Branch switch Supported
4b Store switch Supported
4.3 CONTROL VARIABLES
The questions Attraction to coffee promotions (C1), Experience of coffee OOS (C2a) and
Experience of promoted coffee OOS (C2b) functioned as control factors to justify the chosen
research object coffee in relation to price promotions.
Overall, 57% of the respondents were attracted or very attracted to coffee promotions,
while only 16% indicated that they are not attracted or not at all attracted to this type of
promotion. 27% of the respondents remained neutral in their response (Appendix 8.7.1).
Concerning question C2a regarding the consumer’s experience with their favourite coffee
being OOS, no clear tendency could be indicated for the CG. While 40% stated that they
had never experienced their favourite coffee to be OOS, 40% responded that they had

57
experienced this situation. 10% Indicated that they do not remember if they had ever
faced this situation (Appendix 8.7.2). The results for question C2b look slightly different.
24% Of the respondents of the EG state that they had experienced a promoted coffee to
be OOS, while 34% state that this situation had not occurred to them. However, 42% of
the respondents did not remember a situation like this (Appendix 8.7.3).
The overall tendency of the population to be attracted to price promotions signalizes that
the choice for coffee as a research object relation to price promotions was justifiable.

58
5 DISCUSSION OF RESULTS
Within this chapter the results of the primary research are compared to the findings of the
literature review. Possible reasons for the consumer responses in OOS situations are based
on the antecedents and findings of the literature review. First an overview of the differences
in responses between groups is provided and discussed, later on the sub-categories
substitution, postponement and location switch are individually analysed.
5.1 OVERALL RESPONSES
Comparing the results of both groups in customer responses it shows that there were no
major differences between the CG and the EG (Table 10). However, there are a few
interesting findings to both rankings. Most clearly visible is the change in position of the
response store switch from the 3rd position in the CG, being least preferred in the EG. This
could possibly be explained by the price promotion effect being present in the EG on the
responses regarding switching to another outlet of the same retailer to make use of the
promotional offer and postponing the purchase until the product is on sale again in the
future. When changing location in the CG, customers were not influenced by any price
promotions, leading to switching to another outlet of the same retailer often being less
popular than switching to any other store. This may have resulted from convenience
reasons, whereby other retailers may have been more practical to visit for the customer
(Campo, Gijsbrechts & Nisol, 2000; Sloot, Verhoef & Franses 2005), than especially going
to another ICA store (in this case). Promotion postponement on the other hand was only
introduced in the EG and appeared to be affected by the factor of price promotion.
Respondents showed to be more likely to postpone their purchase until the next time the
product is on sale again, instead of visiting a different store to buy the desired product.
Furthermore, it was found quite remarkable that even though several studies have
presented the large effects of price promotions on customer decision-making (e.g. De
Oliviera Santini et al., 2015; Majeed, 2007), in case of a stock-out customers preferred to
switch to a different item of the same brand instead of postponing their purchase or
changing location. This may imply that the price promotion factor is not as strong as was
expected by the researchers. Other antecedents, such as brand loyalty and urgency of need
may have a larger effect on consumer behavioural responses in an OOS situation.
Moreover, the postponement type of response was found to be more likely to occur than
customers changing location to buy the product elsewhere. This may have had to do with
the perceived costs of going to another store to buy the product being higher than the
‘costs’ of not having the product until the next shopping trip (Sloot, Verhoef & Franses,
2005). Furthermore, with coffee being a non-perishable product, customers may have

59
stockpiled the product before, lowering the urgency of need of an immediate purchase
(Diels & Wiebach, 2011; Sloot, Verhoef & Franses, 2005).
A final remark concerns the results of a global study on regular-priced products in OOS
situations by Gruen, Corsten and Bharadwaj (2002) that showed a different ranking than
the outcomes of the thesis in hand. Coffee was one of the numerous products their
research was based on, enabling a reasonable comparison with the study in hand.
However, their results showed that going to another store to buy the same product was
ranked the highest, followed by purchasing a different coffee brand. These two variables
ended respectively on the third and fourth place in the ranking of promotional OOS
responses of this study, preceded by choosing another item from the same brand and
postponing the purchase. The significant differences between the studies could possibly
be attributed to the geographical location of the studies, where this study focussed on a
city in southern Sweden while Gruen, Corsten and Bharadwaj (2002) examined the United
States and several countries in Europe without Sweden. As the Swedish coffee culture is
a heavily established phenomenon according to Kjelgaard and Ostberg (2007) and
indicates the highest coffee consumption per capita in the world (Statista, 2016) the
country can be considered a special case regarding the product category coffee. It should
also be borne in mind that when focussing on a different category the outcomes of this
study could have shown different results. This is assumed due to the high brand loyalty to
coffee in general and especially by Swedish consumers (Kjelgaard and Ostberg, 2007;
Peckham, 1963; van Heerde, Gupta & Wittink, 2003) making item switch and product
postponement the most popular consumer responses.
5.2 SUBSTITUTION
The consumer behavioural OOS responses item switch and brand switch both concern the
customer purchasing a substitute product instead of the intended product without
changing location. The results of the statistical tests for both responses showed no
significant differences between the CG and the EG. However, when comparing the
answers of both groups within each type of response, minor differences were found. Both
variables showed that the CG had a slightly higher tendency to substitute the product by
either switching to another item of the same brand, or by changing brands, than in the EG.
These differences were however not strong enough to be considered as significant
differences, resulting in both hypotheses being rejected.
As found in the literature study, according to Campo, Grijsbrechts and Nisol (2000), a high
availability of acceptable alternatives increases the likelihood of customers substituting
the unavailable product instead of buying the product elsewhere. With the studied object

60
of this study being coffee, the availability of different alternatives concerning brands and
product sizes in Swedish grocery retail was rather high, and therefore facilitated the easy
option of substitution. However, a significant number of consumers appeared to perceive
a high risk in switching to an alternative which may decrease their preference for
substituting their desired product with a different coffee brand (Emmelhainz,
Emmelhainz & Stock, 1991b). The same research however also found that the intention of
use influences the likelihood of substitution, whereby products intended for regular use
are more likely to be substituted (Emmelhainz, Emmelhainz & Stock, 1991b). With coffee
being used and bought on a high frequency basis in Sweden, this may have influenced the
higher tendencies for substitution in OOS situations than it would have with other types
of products.
Remarkable are the big differences between the two substitution possibilities, in which
switching to another item of the same brand was chosen to be most preferred in both
groups while switching to another brand ended up as a fourth choice in both groups.
These major differences are expected to have resulted from a high brand loyalty for the
product tested within this research. As found in the literature study, Sweden has a very
high household penetration rate of coffee, in which most people are very loyal to their
specific brand and flavour (Chamber Trade Sweden, 2010; Peckham, 1963; van Heerde,
Gupta & Wittink, 2003). This high brand loyalty may have had a negative effect on brand
switching. Furthermore, it may be assumed that brand loyal customers would perceive a
higher risk in switching to an alternative brand, than to an alternative product of the same
brand, confirming the findings of Emmelhainz, Emmelhainz and Stock (1991b). Therefore,
the high popularity of switching within the same brand can be explained by the high level
of convenience for the shopper by not having to leave the store or having to wait until the
next availability, while not having to switch to another brand.
Finally, the minor differences between the CG and the EG have led the researchers to
reject their hypotheses. The findings of this study showed that in case of an OOS situation,
customers were very willing to substitute the product, most likely by choosing a different
item of the same brand, despite the potential loss of the price promotion benefit. These
results could have been influenced by the consumer’s urgency of need for coffee
(Emmelhainz, Emmelhainz & Stock, 1991a; Zinn & Liu, 2001) or the available time for
shopping (Campo, Gijsbrechts & Nisol, 2000) the customer had in order to be able to wait
with the purchase or to leave and purchase the desired coffee elsewhere.

61
5.3 POSTPONEMENT
Looking at the overall rank order obtained from the statistical tests it is evident that
purchase postponement until the product is available again held a strong position for
regular-priced as well as price promoted OOS, being ranked number two in both groups.
As product postponement and switching to another product within the same brand lead
both rankings, it could be argued that consumers were highly affected by brand loyalty in
their choice of OOS response in both situations. As found by Campo, Gijsbrecht and Nisol
(2000) as well as Sloot, Verhoef and Franses (2005), brand loyalty is a strong influencer
of purchase postponement, which seems to also hold true for price promoted products.
Moreover, according to the overall rank order of responses, purchase postponement for
the promotional price was ranked below purchase postponement for the product within
the EG, indicating that consumers were more willing to wait for the specific product to be
available again for the regular price than postponing their purchase until a future
promotional offer occurs again. As found by Krishna, Currim and Shoemaker (1991),
consumers are often aware of the frequency of promotions which lead the researchers to
assume that this knowledge will most likely lead consumers to postpone their purchase
until the next promotional deal. While the statistical tests discovered a significant
difference of promotion postponement within the EG compared to product postponement
within the CG, the outcome was different than expected and the hypothesis had to be
rejected. While it was assumed that purchase postponement until the product is on sale
again for promotional products would be higher than purchase postponement for regular-
priced products, the results showed a reverse outcome. As opposed to Krishna, Currim
and Shoemaker’s research as mentioned above, it can be argued that the study by Gönül
and Srinivasan (1996) explains this effect. Customers seem to assume that once a product
is on promotion, it might not be offered for a cheaper price again any time soon, which may
have lead the respondents to consider the option of promotion postponement to a lesser
extent.
Moreover, the fact that purchase postponement in the EG was chosen over other
possibilities in which the price could have been considered a major influencer
(postponement until the next promotional offer, switching to another outlet of the same
retailer) indicates that consumers did not necessarily react to promotional OOS with only
the cost factor in mind. This counters Kalwani and Yim’s (1992) finding in which it is
assumed that promotions often lead consumers to become unwilling to pay the regular
price, which does not hold true in this case.

62
5.4 LOCATION SWITCH
Changing location for both types of OOS did not receive very much attraction. However,
the differences between the groups showed interesting data to be interpreted. The results
showed that consumers were significantly less likely to switch to another store in the case
of a price promoted OOS than for regular-priced items. Looking at the overall rank order
of choices for both groups, store switch was ranked third (out of five) within the CG and
sixth (out of six) in the EG, which indicates that store switch was the overall least
preferred option in case of a price promoted OOS. While for regular-priced items, store
switch still holds a fairly important position which supports prior literature (Sloot,
Verhoef & Franses, 2005), it can be argued that the absence of the price benefit in another
store seems to have been a strong influencer of this reaction in the EG as it did not
motivate the consumer to make any additional effort of switching stores. Switching to
another outlet of the same retailer, on the other hand, was a more attractive option in case
of a price promoted OOS than compared to a regular-priced item.
While Sloot, Verhoef and Franses (2005) found that price consciousness has a negative
effect on store switch as the perceived cost of store switching is possibly higher than the
cost of product substitution or postponement, it can be argued that in this case price
consciousness positively affected switching to another branch of the same retailer. While,
as argued before, store switch was the least preferred option in case of a price promoted
OOS because the benefit of the price promotion was lost, branch switch enabled the
consumer to still purchase the product for a cheaper price. It can therefore be indicated
that price conscious consumers are more likely to switch to another branch when faced
with a price promoted OOS. However, branch switch for regular-priced items is the least
preferred option and ranked below store switch, which can be argued by the availability
of alternative stores (Campo, Gijsbrechts & Nisol, 2000; Sloot, Verhoef & Franses 2005).
For regular-priced items consumers seem to be more willing to switch to any other store,
possibly due to shorter store distances, than switching to the same retail outlet that might
be further away. This option only seemed to be interesting in case of price promotion.
Another factor that could have influenced this decision is store loyalty. Store switch in
general is reported to be the least likely option for store loyal customers (Campo,
Gijsbrechts & Nisol, 2000; Emmelhainz, Emmelhainz & Stock, 1991b) which can be argued
to have a reverse effect on branch switch. Store or retailer loyal customers are likely to be
more willing to put additional effort in their purchases by switching to another branch of
the same retailer. The overall low attraction to changing location in both OOS situations
can be attributed to factors such as time pressure, available shopping time and urgency of
need, which results in an overall negative effect on location switching.

63
6 CONCLUSION
The final chapter provides a conclusion of the researched topic as well as an outline of the
theoretical- and managerial implications of this thesis, an elaboration on limitations of this
research and possibilities for future research.
While out-of-stock (OOS) reactions have been studied from different perspectives in
previous literature, the purpose of the thesis in hand was to examine the yet under-
researched differences and similarities of consumer reactions regarding price promoted
and regular-priced OOS situations. Guided by the research question: “How do consumers
respond differently when confronted with an OOS situation of a regular-priced item
compared to an OOS of a price promoted item in the retail grocery sector?” the researchers
based their study on existing OOS responses and extended them in regard to promotional
OOS. Whereas the main four OOS reactions deducted from prior research were product
substitution within the same brand, substitution within a different brand, purchase
postponement and switching to another store, this thesis extended the possible
responses. Considering the influence of price promotions three behavioural response
categories were created; substitution, including product substitution within the same or a
different brand, postponement, including postponement for the specific product or for the
promoted price, and location switch, referring to store and branch switch, of which the
latter indicates going to another outlet of the same retailer.
Using an experimental survey design that was based on the product category coffee and
conducted in a southern Swedish town, the comparison of the two OOS situations resulted
in only minor differences. However, the statistical tests as well as a more qualitative
comparison of each response showed that consumers react differently in some instances,
even though not to a significant extent. One of the most apparent findings was the small
likelihood of people to switch stores in case of a price promoted OOS situation as
compared to a relatively high likelihood to do so for regular-priced products. Switching
to another store of the same retailer, on the other hand, did not prove to be an interesting
option in case of regular-priced items and only slightly more relevant for price promoted
products. While the newly introduced option promotion postponement was expected to
show a significantly higher response for price promoted products, it did not seem to be a
very popular option when compared to the results of regular-priced items. Postponing
the purchase of the product once it is available again, however, seemed to be a popular
option for both OOS situations, while appreciated more for regular-priced items. Both
substitution options did not show a significant difference between the two situations. The
decision consumers were most likely to make in both groups however, was switching to
another item within the same brand. Switching to another brand, on the contrary, was
64
ranked relatively low in both groups. Overall, the responses for both groups seemed to be
guided by a strong brand loyalty to coffee, as the most preferred options for regular-
priced as well as price promoted products are related to the purchase of either the specific
product or a product of the same brand.
6.1 THEORETICAL CONTRIBUTION
This thesis contributes to OOS literature within marketing and retailing from a consumer
perspective. While OOS responses to different product and store types have already been
studied, researchers primarily focussed on regular-priced products of which the
responses were found to not be sufficient for promotional OOS. This study therefore
contributes to overall OOS literature through examining and introducing the concept of
price promoted OOS by applying existing OOS responses to the phenomenon of price
promoted stock-outs, which had only received minor attention until this point in time
(Diels & Wiebach, 2011; Peinkofer, 2015). With the further examination of the response
branch switch, this thesis confirms Diels and Wiebach’s (2011) introduction of this
reaction as a possible response for price promoted OOS situations. Furthermore, the
introduction of the concept promotion postponement proved to be a relevant response to
price promoted OOS and therefore adds a new dimension to possible OOS reactions. The
introduction of additional OOS responses lead the researchers to develop an OOS
response model (Figure 3) comprising the four dominant OOS responses based on prior
literature and the two additional responses tailored to price promoted OOS, put into
newly developed categories. The development of the model does not only provide more
structure to the interplay between regular-priced and price promoted OOS responses, it
furthermore offers a basis to close the mentioned research gap within OOS literature.
As the study found that substituting the missing product within the same brand and
postponing the purchase were the most prevalent responses for regular-priced as well as
for price promoted coffee OOS, it rejects Gruen, Corsten and Bharadwaj’s global study on
OOS (2002). Their specified findings for the product category coffee showed that
switching to another store is the most dominant option, followed by substitution for a
different brand and purchase postponement. The most popular response found in the
thesis in hand, switching to another item within the same brand, was presented only with
a small likelihood. It is assumed that the differences in responses can be attributed to the
cultural differences towards coffee consumption between the studied countries. Sweden,
which was not included in the global study by Gruen, Corsten and Bharadwaj (2002),
shows one of the highest coffee consumption patterns in the world (Statista, 2016) and
therefore deserves special attention in regard to the studied product category.

65
This study therefore further contributes to global OOS literature by researching a yet
under researched market with a strong consumer culture towards the studied product. In
relation to this, the thesis furthermore has potential to contribute to literature within
Swedish consumer culture by anticipating a strong brand loyalty towards coffee products
based on the preferred OOS responses found in this study.
The thesis further contributes to existing literature by directly comparing reactions of
promotional OOS to regular-priced OOS using an experimental survey design. While
experimental designs served as a frequent research method within OOS literature, a direct
comparison of two different OOS situations has not received much attention yet. While
prior studies aimed to compare existing results of different researchers (e.g. ECR Europe,
2003) to draw general conclusions on OOS, the ambiguous research objects and research
settings applied in literature restrict a valuable comparison. Even though the findings of
this thesis are, due to an intentionally small population and sample size, not generalizable
to a wide extent, they further contribute to OOS literature by providing a solid foundation
for further research.
6.2 MANAGERIAL IMPLICATIONS
Managerial implications are derived from the intensity of the individual consumer
responses. With switching to another item of the same brand being the most preferred
option in both cases, the consumer was generally more likely to continue their purchase
in the same store which does not cause a direct sales loss to neither the retailer nor the
manufacturer as the switch occurs within the same brand. Therefore, offering a wide
range of products within one brand provides the consumer with a bigger choice of
alternatives in case of a regular-priced as well as a price promoted OOS. Relating these
findings to promotional planning, it can therefore be advised to not only ensure the
promoted product to be available to the greatest possible extent, but also to re-stock
products of the same brand.
As product postponement was the second most preferred option in both OOS situations,
the retailer may not be directly faced with a sales loss if the customer is store loyal and
plans his or her next shopping trip at the same store. This therefore indicates that a quick
replenishment of the product is advised. With postponing the purchase until the next
promotional deal being the third most preferred option for price promoted products the
retailer regains the chance of selling the promoted product to the customer. However,
depending on a customer’s store loyalty, he or she might also be inclined to be attracted
to the next offer from a different retailer instead. While store switch did not seem to be
an attractive option for promoted products, it received more attraction for regular-priced

66
products. Store switch does not only indicate rather low store loyalty, it also poses the
risk of losing sales, and even more, losing a customer if another retailer proves to be more
efficient in terms of on-shelf-availability.
Overall it can therefore be stated that OOS should be avoided in the best possible manner.
However, with item switch and product postponement being the most preferred options
by consumers in regard to the product category coffee, retailers still face the possibility
of making profit on the intended purchase as customers are less likely to leave the store.
6.3 LIMITATIONS & FUTURE RESEARCH
Chapter 3.5. already touched upon the limitations of this study by critically evaluating the
choice for an experimental survey design and the data collection method. The most pivotal
methodological limitation concerns the low external validity implying there to be no basis
for generalising the results. This was caused by several factors: a hypothetical setting
instead of a natural environment, systematic non-probability sampling, a considerably
low sample size, the research setting only considering one retail store and one specific
product in one area of Sweden.
The object of the study deals with a specific situation that is likely to occur on the real
market, which would, in the researcher’s point of view, make an experimental design a
suitable choice. The general purpose of an experiment is to study connections between
variables, which would serve as an appropriate way to test consumer reactions to out-of-
stock situations in a laboratory or field environment (Saunders, Lewis & Thornhill, 2009).
However, even though it was preferred by the researchers to include a true experiment
as a data collection method to test one’s actual behaviour, it was chosen not to be
incorporated due to experiments being very complex in nature and the limited budget of
the study. Verbeke, Farris and Thurik (1998) explain that out-of-stock experiments have
been a relatively rare phenomenon considering the perceived risks of losing loyal
customers and the costs of the experiment itself for the retailers. This lead to the decision
of using an experimental survey design in which the respondents would be provided with
a hypothetical situation to assure the right mind-set for each group.
The study’s sample could also raise several questions. First of all, the sample size of each
group only considering 50 respondents might have affected the significant levels of the
One-Way ANOVA test in chapter 4.1. By using a larger sample size, it is believed that the
differences between the groups could lead to an increased significance in results, which
could therefore lead to different outcomes concerning the hypotheses. However, with an

67
advised minimum of 30 respondents per group in experimental research, this study
already provided additional insights by testing the outcomes of 50 respondents per group.
Furthermore, the sample being created by systematic probability sampling also limits the
generalisability of the study. Due to the non-availability of a sampling frame a complete
random sampling was not attainable. It was therefore decided to use the best possible
option, a systematic probability sampling.
Finally, the research setting being one store in one Swedish town focussing on one specific
product also contributes to the limited generalisability of this study. However, according
to Sloot (2006), most studies on OOS behaviour only considered one single retail chain as
this prevents the results from being biased by different store influences. Moreover, due
to time constraints it was chosen to only focus on coffee as a research object, which in this
research setting was very applicable (Chapter 3.2.2.).
Future studies could possibly take the above mentioned limitations into account while
further investigating the differences in consumer behaviour in the two stock-out
situations. By collecting data from a larger sample which was randomly selected, the
findings could be generalised to the complete sample population. Furthermore, it is of
interest to research additional product groups in relation to promotional OOS behaviour
as stock-outs in different product categories could lead to different consumer responses
(Gruen, Corsten and Bharadwaj, 2002; Van Woensel et al., 2007). Additionally, an
examination of other geographical markets is expected to provide different results due to
Sweden’s strong coffee culture. Finally, it is suggested to establish the antecedents for
price promotion OOS behaviour using a qualitative study. This could be beneficial for both
creating a better understanding of OOS consumer responses, as well as providing a basis
for further quantitative research on consumer behaviour when confronted with a stock-
out of a price promoted product.

68
7 BIBLIOGRAPHY
Aastrup, J. & Kotzab, H. (2010). Forty years of Out-of-Stock research – and shelves are still
empty, The International Review of Retail, Distribution and Consumer Research, vol. 20, no.
1, pp. 147-164, available through: LUSEM Library website
http://www.lusem.lu.se/library [Accessed 23 March 2016]
Aastrup, J. & Kotzab, H. (2009). Analyzing out-of-stock in independent grocery stores: an
empirical study, International Journal of Retail & Distribution Management, vol. 37, no. 9,
pp. 765-89, available through: LUSEM Library website http://www.lusem.lu.se/library
[Accessed 2 April 2016]
Alford, B. L. & Biswas, A. (2000). The effects of discount level, price consciousness and sale
proneness on consumer’s price perception and behavioral intention. Journal of Business
Research, vol. 55, no. 2002, pp.775-783, available through: LUSEM Library website
http://www.lusem.lu.se/library [Accessed 30 March 2016]
Axfood (n.d.) Market and competitors. Available online:
http://investor.axfood.se/index.php?p=market_and_competitors&lang=en [Accessed 11
December 2015]
Bauer, H., Sauer, N. & Becker, C. (2006). Investigating the relationship between product
involvement and consumer decision-making styles. Journal of Consumer Behaviour, vol. 5,
no. 4, pp.342-354, available through: LUSEM Library website
http://www.lusem.lu.se/library [Accessed 31 March 2016]
Bryman, A. & Bell, E. (2011). Business Research Methods. 3rd edn, New York: Oxford
University Press
Bryman, A. & Bell, E. (2015). Business Research Methods. 4th edn, New York: Oxford
University Press
Campo, K., Gijsbrechts, E. & Nisol, P. (2000). Towards Understanding Consumer Response
to Stock-Outs, Journal of Retailing, vol. 76, no. 2, pp. 219-242, available through: LUSEM
Library website http://www.lusem.lu.se/library [Accessed 29 March 2016]
Campo, K., Gijsbrechts, E. & Nisol, P. (2004). Dynamics in consumer response to product
unavailability: do stock-out reactions signal response to permanent assortment
reductions?, Journal of Business Research, vol. 57, pp.834-843, available through: LUSEM
Library website http://www.lusem.lu.se/library [Accessed 29 March 2016]

69
Chaharsoughi, S. A. & Yasory, T. H. (2012). Effect of sales promotion on consumer
behaviour based on culture. African Journal of Business Management, vol. 6, no. 1, pp.98-
102, available through: LUSEM Library website http://www.lusem.lu.se/library
[Accessed 31 March 2016]
Chamber Trade Sweden (2010). Coffee, Tea and Cacao, Focus on the Swedish Market,
Available Online: http://chambertradesweden.se/wp-
content/uploads/2012/12/Coffee_Tea_Cocoa_juni2010.pdf [Accessed 11 April 2016]
Chamber Trade Sweden (2013). Market Report Food, Available Online:
http://chambertradesweden.se/wp-content/uploads/2014/02/FOOD-Market-Report-
Sweden-2013.pdf [Accessed 11 April 2016]
Chopra, S. & Meindl, P. (2007). Supply Chain Management – Strategy, Planning and
Operation. 3rd ed. Upper Saddle River, NJ: Pearson Prentice Hall
Cobb, C. H. & Hoyer, W.D. (1986). Planned versus impulse purchase behavior. Journal of
Retailing, vol. 62, no. 4, pp.384-409, available through: LUSEM Library website
http://www.lusem.lu.se/library [Accessed 29 March 2016]
Cohen, M.C., Leung, N.H.Z., Panchamgam, K., Perakis, G. & Smith, A. (2014). The Impact of
Linear Optimization on Promotion Planning. SSRN Working Paper.
Coop (n.d.). About Coop. Available online: https://www.coop.se/Globala-
sidor/Inenglish/About-Coop/ [Accessed 10 December 2015]
Corsten, D.S. & Gruen, T.W. (2003). Desperately seeking shelf availability: An examination
of the extent, the causes and the efforts to address retail out-of-stocks, International
Journal of Retail & Distribution Management, vol. 31, no. 12, pp. 605-617, available
through: LUSEM Library website http://www.lusem.lu.se/library [Accessed 18 April
2016]
Diamond, W. D. & Sanyal, A. (1990). The effect of framing on the choice of supermarket
coupons. Advances in Consumer Research, vol. 17, pp.488-493, available through: LUSEM
Library website http://www.lusem.lu.se/library [Accessed 21 March 2016]
Diels, J.L. & Wiebach, N. (2011). Customer Reactions in Out-of-Stock Situations – Do
promotion-induced phantom positions alleviate the similarity substitution hypothesis?
Discussion Paper, Humboldt-Universität Berlin, Available Online: http://edoc.hu-
berlin.de/series/sfb-649-papers/2011-21/PDF/21.pdf [Accessed 21 March 2016]

70
Easterby-Smith, M., Thorpe, R. & Jackson, P. (2012). Management research. 4th edn,
London: SAGE Publications Ltd
ECR Europe (2003). ECR – Optimal Shelf Availability, increasing shopper satisfaction at
the moment of truth. ECR Europe, Brussels, available online: http://ecr-all.org/wp-
content/uploads/pub_2003_osa_blue_book.pdf [Accessed 23 March]
Emmelhainz, L.W., Emmelhainz, M.A. & Stock, J.R. (1991a). Logistics Implications of Retail
Stockouts, Journal of Business Logistics, vol. 12, no. 2, pp. 129-142, available through:
LUSEM Library website http://www.lusem.lu.se/library [Accessed 23 March 2016]
Emmelhainz, Emmelhainz & Stock (1991b). Consumer Responses to Retail Stock-outs,
Journal of Retailing, vol. 67, no. 2, pp. 138-147, available through: LUSEM Library website
http://www.lusem.lu.se/library [Accessed 26 March 2016]
Ettouzani, Y., Yates, N. & Mena, C. (2012). Examining retail on shelf availability:
promotional impact and a call for research. International Journal of Physical Distribution
& Logistics Management, vol. 42, no. 3, pp.213-243, available through: LUSEM Library
website http://www.lusem.lu.se/library [Accessed 25 March 2016]
EuropeanCoffeeSymposium (2015). Nordic Coffee Culture – Up and Up, Allegra, European
Coffee Symposium 2016, 14 September, Available Online:
http://www.europeancoffeesymposium.com/nordic-coffee-culture-up-and-up/
[Accessed 11 April 2016]
Fernie, J. & Grant, D.B. (2008) On-shelf availability: the case of a UK grocery retailer, The
International Journal of Logistics Management, vol. 19, no. 3, pp. 293-308, available
through: LUSEM Library website http://www.lusem.lu.se/library [Accessed 2 April
2016]
Field, A. (2013) Discovering Statistics Using IBM SPSS Statistics, London: Sage Publication
Limited
Gönül, F. & Srinivasan, K. (1996). Estimating the Impact of Consumer Expectations of
Coupons on Purchase Behavior: A Dynamic Structural Model. Marketing Science, vol. 15,
no. 3, pp.262-279, available through: LUSEM Library website
http://www.lusem.lu.se/library [Accessed 29 March 2016]
Goworek, H. & McGoldrick, P. (2015). Retail Marketing Management. Pearson Education
Limited.

71
Grewal, D., Krishnan, R., Baker, J. & Borin, N. (1998). The effect of store name, brand name
and price discounts on consumers' evaluations and purchase intentions. Journal of
Retailing, vol. 74, no. 3, pp.331-352, available through: LUSEM Library website
http://www.lusem.lu.se/library [Accessed 30 March 2016]
Gruen, T.W. & Corsten, D. (2008). A Comprehensive Guide to Retail Out-of-Stock
Reduction in the Fast-Moving Consumer Goods Industry, available online:
http://itsoutofstock.com/wp-content/uploads/2013/04/OOS-Guide-2008-Revision.pdf
[Accessed 23 March 2016]
Gruen, T.W., Corsten, D.S. & Bharadwaj, S. (2002). Retail Out-of-Stocks: A Worldwide
Examination of Extent, Causes and Consumer Responses. Grocery Manufacturers of
America, Washington, DC, available online:
http://www.uccs.edu/Documents/tgruen/GMA_2002_%20Worldwide_OOS_Study.pdf
[Accessed 18 April 2016]
Hardesty, D. & Bearden, W. (2003). Consumer evaluations of different promotion types
and price presentations: the moderating role of promotional benefit level. Journal of
Retailing, vol. 79, no. 1, pp.17-25, available through: LUSEM Library website
http://www.lusem.lu.se/library [Accessed 27 March 2016]
Helm, R. Hegenbart, T. & Endres, H. (2012). Explaining customer reactions to real
stockouts, Review of Managerial Science, vol. 7, no. 3, pp. 223-246, available online:
http://link.springer.com/article/10.1007%2Fs11846-012-0079-8 [Accessed 29 March
2016]
ICA Gruppen (n.d.). ICA Sweden - The leading grocery retailer in Sweden. Available online:
http://www.icagruppen.se/en/about-ica-gruppen/our-operations/ica-sweden/
[Accessed 5 April 2016]
Kalwani, M. & Yim, C. (1992). Consumer Price and Promotion Expectations: An
Experimental Study. Journal of Marketing Research, vol. 29, no. 1, p.90-100, available
through: LUSEM Library website http://www.lusem.lu.se/library [Accessed 1 April
2016]
Khorrami, M. S., & Esfidani, M. R. (2015). The Effect of Situational Factors
on Impulse Buying and Compulsive Buying: Clothing. International Journal of
Management, Accounting and Economics, vol. 2, no. 8, pp.823-837, available through:
LUSEM Library website http://www.lusem.lu.se/library [Accessed 21 March 2016]

72
Kjelgaard, D. & Ostberg, J. (2007). Coffee Grounds and the Global Cup: Glocal Consumer
Culture in Scandinavia, Consumption Markets & Culture, vol. 10, no. 2, pp.175-187,
available through: LUSEM Library website http://www.lusem.lu.se/library [Accessed 23
March 2016]
Kucuk, S. (2004). Reducing the Out-of-Stock Costs in a Developing Retailing Sector. WICM,
vol. 16, no. 3, pp.75-104, available through: LUSEM Library website
http://www.lusem.lu.se/library [Accessed 26 March 2016]
Kumar, V. & Leone, R. (1988). Measuring the Effect of Retail Store Promotions on Brand
and Store Substitution. Journal of Marketing Research, vol. 25, no. 2, p.178-185, available
through: LUSEM Library website http://www.lusem.lu.se/library [Accessed 28 March
2016]
Lööf, U. (2011). The Strength of Competition in the Swedish Grocery Retailing Market,
Bachelor Thesis, Deparment of Economics, Gothenburg School of Business, Economics and
Law, Available Online:
https://gupea.ub.gu.se/bitstream/2077/28686/1/gupea_2077_28686_1.pdf [Accessed
12 April 2016]
Majeed, A. C. (2007). A study of the effect of sales promotion on consumption of fast
moving consumer goods in Kerala. Thesis, Department of Commerce & Management
Studies, University of Calicut, available through: LUSEM Library website
http://www.lusem.lu.se/library [Accessed 20 March 2016]
Malhotra, N. K. (1981). A scale to measure self-concepts, person concepts, and product
concepts. Journal of Marketing Research, vol. 18, no. 4, pp.456-464, available through:
LUSEM Library website http://www.lusem.lu.se/library [Accessed 24 March 2016]
McKinnon, A.C., Mendes, D. & Nababteh, M. (2007). In-store logistics: an analysis of on-
shelf availability and stockout responses for three product groups, International Journal
of Logistics: Research and Applications, vol. 10, no. 3, pp. 251-68, available through: LUSEM
Library website http://www.lusem.lu.se/library [Accessed 2 April 2016]
Nunnally, J. C. and Bernstein I. H. (1994). Psychometric Theory, McGraw-Hill: New York,
USA
De Oliviera Santini, F., Ladeira, W., Hoffmann Sampaio, C. & Araújo Falcáo, C. (2015).
Perception of value, attractiveness and purchase intention: revisiting promotion
techniques sale. Review of Business Management, pp.1173-1192, available through:
LUSEM Library website http://www.lusem.lu.se/library [Accessed 1 April 2016]
73
Pauwels, K., Silva-Risso, J., Srinivasan, S. & Hanssens, D. (2004). New Products, Sales
Promotions, and Firm Value: The Case of the Automobile Industry. Journal of Marketing,
vol. 68, no. 4, pp.142-156, available through: LUSEM Library website
http://www.lusem.lu.se/library [Accessed 25 March 2016]
Peckham, J.O. (1963). The Consumer Speaks, Journal of Marketing, vol. 27, no. 4, pp. 21-
26, available through: LUSEM Library website http://www.lusem.lu.se/library [Accessed
15 March 2016]
Rani, L. & Velayudhan, S.K. (2008). Understanding consumer's attitude towards retail
store in stockout situations, Asia Pacific Journal of Marketing and Logistics, vol. 20, no. 3,
pp.259-275, available through: LUSEM Library website http://www.lusem.lu.se/library
[Accessed 25 March 2016]
Rothschild, M. & Gaidis, W. (1981). Behavioral Learning Theory: Its Relevance to
Marketing and Promotions. Journal of Marketing, vol. 45, no. 2, p.70, available through:
LUSEM Library website http://www.lusem.lu.se/library [Accessed 28 March 2016]
Saunders, M., Lewis, P. & Thornhill, A. (2009). Research methods for business students, 5th
edn, London: Pearson Education Limited
Schary, P.B. & Christopher, M. (1979). The Anatomy of a Stock-Out, Journal of Retailing,
vol. 55, no. 2, pp. 59-70, available through: LUSEM Library website
http://www.lusem.lu.se/library [Accessed 26 March 2016]
Schindler, R. (1992). A coupon is more than a low price: Evidence from a shopping-
simulation study. Psychology and Marketing, vol. 9, no. 6, pp.431-451, available through:
LUSEM Library website http://www.lusem.lu.se/library [Accessed 26 March 2016]
Sloot, L., Verhoef, P. & Franses, P. (2005). The impact of brand equity and the hedonic level
of products on consumer stock-out reactions. Journal of Retailing, vol. 81, no. 1, pp.15-34,
available through: LUSEM Library website http://www.lusem.lu.se/library [Accessed 18
March 2016]
Sprotles, G. & Kendall, E. (1986). A Methodology for Profiling Consumers' Decision-
Making Styles. Journal of Consumer Affairs, vol. 20, no. 2, pp.267-279, available through:
LUSEM Library website http://www.lusem.lu.se/library [Accessed 29 March 2016]
Statista (2016). Global leading coffee consuming countries in 2014 (average per capita
cups per year). Available Online: http://www.statista.com/statistics/277135/leading-
countries-by-coffee-consumption/ [Accessed 12 April 2016]

74
Taylor, J. & Fawcett, S. (2001). Retail on-shelf Performance of Advertised Items: an
Assesment of Supply Chain Effectiveness at the Point of Purchase. Journal of Business
Logistics, vol. 22, no. 1, pp.73-89, available through: LUSEM Library website
http://www.lusem.lu.se/library [Accessed 27 March 2016]
van Heerde, H.J., Gupta, S. & Wittink, D.R. (2003). Is 75% of the Sales Promotion Bump due
to Brand Switching? No it is 33%, Center Discussion Paper, 5, Tilburg: Marketing
Van Woensel, T., Van Donselaar, K. Broekmeulen, R. & Fransoo, J. (2007). Consumer
responses to shelf out-of-stocks of perishable products, International Journal of Physical
Distribution & Logistics Management, vol. 37, no. 9, pp. 704-718, available through: LUSEM
Library website http://www.lusem.lu.se/library [Accessed 2 April 2016]
Verbeke, W., Farris, P. & Thurik, R. (1998). Consumer response to the preferred brand out-
of-stock situation. European Journal of Marketing, vol. 32, no. 11-12, pp.1008-1028,
available through: LUSEM Library website http://www.lusem.lu.se/library [Accessed 27
March 2016]
Verhoef, P.C. & Sloot, L.M. (2006). Out-of-Stock: Reactions, Antecedents, Management
Solutions, and a Future Perspective, in: M. Krafft & M.K. Mantrala (eds), Retailing in the
21st Century, Heidelberg: Springer, pp. 239-253, available through: LUSEM Library
website http://www.lusem.lu.se/library [Accessed 24 March 2016]
Walker, D. & Knox, S. (1997). Understanding consumer decision making in grocery
markets: does attitude-behaviour consistency vary with involvement? Journal of
Marketing Communications, vol. 3, no. 1, pp.33-49, available through: LUSEM Library
website http://www.lusem.lu.se/library [Accessed 29 March 2016]
Walter, C.K. & Grabner, J.R. (1975). Stockout Cost Models: Empirical Test in a Retail
Situation, Journal of Marketing, vol. 39, pp. 56-68, available through: LUSEM Library
website http://www.lusem.lu.se/library [Accessed 23 March 2016]
Walters, R. (1991). Assessing the Impact of Retail Price Promotions on Product
Substitution, Complementary Purchase, and Interstore Sales Displacement. Journal of
Marketing, vol. 55, no. 2, p.17-28, available through: LUSEM Library website
http://www.lusem.lu.se/library [Accessed 23 March 2016]
Watson, I., Wood, S. & Fernie, J., (2015). “Passivity”: a model of grocery retail price
decision-making practice. European Journal of Marketing, vol. 49, no. 7-8, pp.1040-1066,
available through: LUSEM Library website http://www.lusem.lu.se/library [Accessed 25
March 2016]

75
Xu, Y. & Huang, J. (2014). Effects of Price Discounts and Bonus Packs on Online Impulse
Buying. Social Behavior and Personality: an international journal, vol. 42, no. 8, pp.1293-
1302, available through: LUSEM Library website http://www.lusem.lu.se/library
[Accessed 24 March 2016]
Zinn, W. & Liu, P.C. (2001). Consumer Response to Retail Stockouts, Journal of Business
Logistics, vol. 22, no. 1, pp. 49-71, available through: LUSEM Library website
http://www.lusem.lu.se/library [Accessed 26 March 2016]
Znidersic, R. K., Grubor, A. & Maric, D. (2014). Impulsive consumer behaviour.
International journal of multidisciplinarity in business and science, vol. 2, no. 2, pp.81-89,
available through: LUSEM Library website http://www.lusem.lu.se/library [Accessed 25
March 2016]

76
8 APPENDICES
8.1 SURVEY TEMPLATES
8.1.1 CONTROL GROUP

77
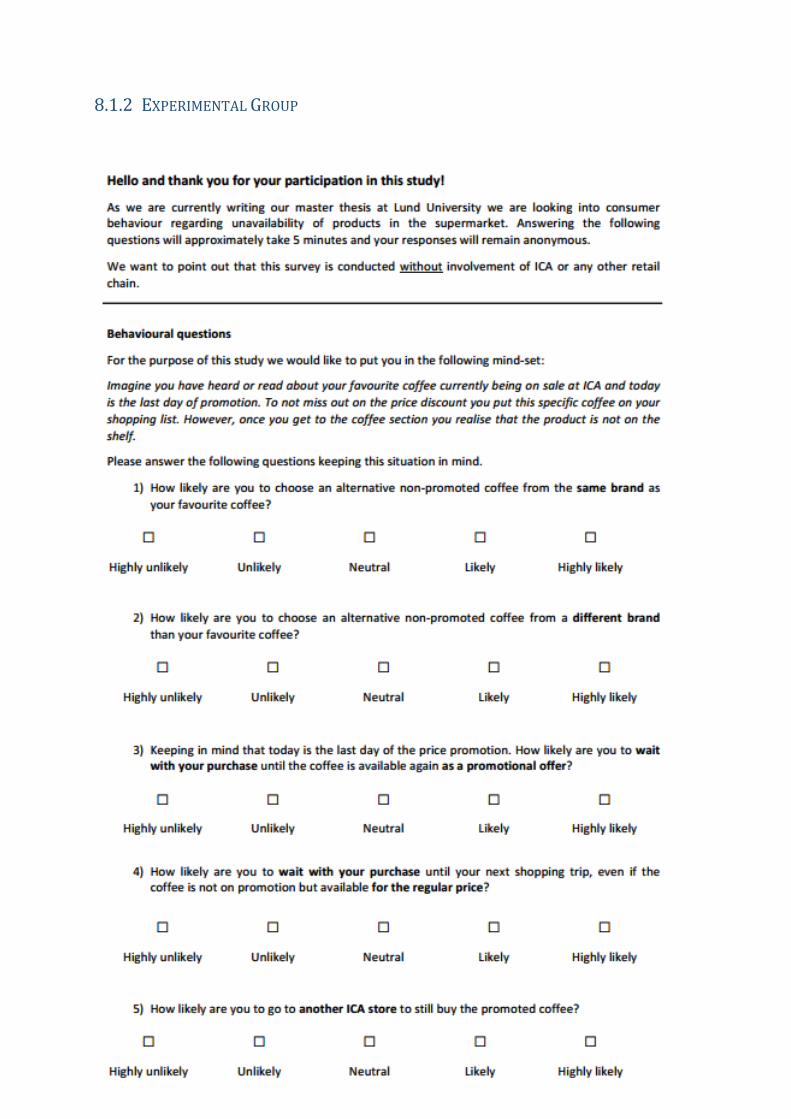
78
8.1.2 EXPERIMENTAL GROUP

79

80
8.2 SAMPLE DIVISION PER GROUP BASED ON LUND’S POPULATION
Population totals
Population distribution in %
Sample distribution per group based on
N=50
Group 1: 20-29
Total 24 809 30,6% 16
Men 12 722 51,3% 8
Women 12 087 48,7% 8
Group 2: 30-39
Total 15 185 18,7% 10
Men 7 806 51,4% 5
Women 7 379 48,6% 5
Group 3: 40-49
Total 14 151 17,5% 9
Men 7 123 50,3% 5
Women 7 028 49,7% 4
Group 4: 50-59
Total 12 446 15,4% 8
Men 6 042 48,5% 4
Women 6 404 51,5% 4
Group 5: 60-69
Total 11 826 14,6% 7
Men 5 632 47,6% 3
Women 6 194 52,4% 4

81
8.3 SAMPLE DIVISION OF RESPONDENTS PER GROUP
8.4 CRONBACH’S ALPHA SPSS OUTPUT
Item Switch
Brand Switch
Promotion postponement
Product Postponement

82
Branch Switch
Store Switch
8.5 ONE-WAY ANOVA
The OOS response promotion postponement is being referred to as price postponement
in all SPSS outputs.
8.5.1 ANOVA SPSS OUTPUT DATASET A

83
8.5.2 ANOVA SPSS OUTPUT DATASET B
8.5.3 EFFECT SIZE CALCULATIONS
Effect size Store Switch:
ƞ2= SS between groups (2889.063)/SS total (89592.188) = 0.0322 = 3.2%
Effect size Promotion postponement:
ƞ2= SS between groups (3600)/SS total (93906.25) = 0.03833 = 3.8%

84
8.6 QUALITATIVE COMPARISON OF RESULTS PER ITEM
The OOS response promotion postponement is being referred to as price postponement
in all SPSS outputs.
8.6.1 MEANS PER ITEM PER GROUP
8.6.2 CROSSTABULATIONS ITEM SWITCH

85

86
8.6.3 CROSSTABULATIONS BRAND SWITCH

87
8.6.4 CROSSTABULATIONS PROMOTION POSTPONEMENT

88
8.6.5 CROSSTABULATIONS PRODUCT POSTPONEMENT

89
8.6.6 CROSSTABULATIONS BRANCH SWITCH

90
8.6.7 CROSSTABULATIONS STORE SWITCH

91
8.7 CONTROL VARIABLES
8.7.1 ATTRACTION TO COFFEE
8.7.2 EXPERIENCE OOS CONTROL GROUP
8.7.3 EXPERIENCE OOS EXPERIMENTAL GROUP