t waves in western mediterranean sea after the may 21, 2003 … · 2017-04-04 · key words t waves...
TRANSCRIPT

591
ANNALS OF GEOPHYSICS, VOL. 50, N. 5, October 2007
Key words T waves – Ligurian Sea – SOFAR – fre-quency content
1. Introduction
On May 21, 2003 Algeria was shaken by astrong (mb=6.5) earthquake the consequences of
which were some 2266 people killed, more than10000 injured, 43500 buildings damaged or de-stroyed. The earthquake also caused a smalltsunami in the Northern Mediterranean Searecorded on tide gauges at Palma de Mallorca(Spain, 1.2 m), Nice (France, 10 cm), Genoa(Italy, 8 cm). The earthquake was clearly feltalong the coast of Liguria (north-western Italy),located some 800-900 km apart from thesource, with an intensity of III-IV MSK scale,and it was recorded by the seismic stations op-erating in the Liguria Region (table I; figs. 1and 2). The source of this shock was locatedclose to the Algerian coast, with the followingcoordinates (from EMSC: http://www.emsc-csem.org/): date – 21/05/03; origin time –
T waves in Western Mediterranean Seaafter the May 21, 2003 Algerian earthquake
Stefano Solarino (1) and Claudio Eva (2)(1) Istituto Nazionale di Geofisica e Vulcanologia, Sezione CNT, Roma, Italy(2) Dipartimento per lo Studio del Territorio e delle sue Risorse (DipTeRis),
Università degli Studi di Genova, Italy
Abstract Aim of this paper is to discuss on the T phases generated after the mb 6.5 earthquake that shook Algeria on May 21,2003. The seismograms, recorded by a cluster of seismic stations located on the coast facing the Ligurian Sea, North-ern Italy, some 800 km N-NE from the source, represent a good database able to shed some light on the recognition,propagation and characteristics of these quite uncommon phases. The occurrence and the recording of T phases arein fact due to particular conditions, and require both particular characteristics of the bathymetric slope and the exis-tence of a clear path between the instruments and the earthquake’s source: these constraints are exactly realized inthe north-western part of the Mediterranean Sea, whose coasts have been affected several times in the past by simi-lar events. The preliminary investigations on the complex recorded seismogram show two different behaviours forstations close the coast and inland. In both cases, two distinct T phases (namely T1 and T2) are observed. In one casethey have apparent velocities close to an average SOFAR channel, and are thus the recording of direct T phases. Inparticular, T1 is probably a precursor due to some scattering, while T2 is the direct T wave. Conversely, the record-ings of the stations inland show apparent velocities that suggest back conversion of the original T to P and S wavesand a crustal path. The frequency content of the T phases, as derived from the spectral analysis, reveals marked am-plitude peaks also in the range 1-3 Hz, conversely to what was proposed by other authors for similar occurrences inother parts of the world. Since the geometry and shape of the SOFAR channel vary, it is highly likely that the spec-trum is biased by the water conditions and the frequency content might change in different seas. Finally, the attenu-ation of the T phase does not depend on the actual distance of the receiver from the source but rather from the back-conversion point: the amplitude varies thus with the in-land path and decreases proportionally to x−1.
Mailing address: Dr. Stefano Solarino, Istituto Nazionaledi Geofisica e Vulcanologia, Sezione CNT, c/o Dipartimentoper lo Studio del Territorio e delle sue Risorse (DipTeRis),Università degli Studi di Genova, V.le Benedetto XV 5, Geno-va, Italy; e-mail: [email protected]

592
Stefano Solarino and Claudio Eva
Table I. Location (distance and azimuth) and instrumentation of the seismic stations used in this work. Thedistance from the coast computed on the incoming path is also reported.
Station code Distance from Azimuth (°) Distance from Instrument make and typeepicenter (km) the coast (km)
0FIN 887 25 45 Geotech S13 (1c)NEGI 833 24 7 Guralp CMG 40 (3c)0IMI 846 25 11 Geotech S13 (1c)
MONE 858 24 35 Guralp CMG 40 (3c)0PCP 932 26 80 Geotech S13 (1c)GENL 935 28 1 Guralp CMG 40 (3c)ROTM 956 24 132 Lennartz 3D 5s (3c)0ROB 884 24 60 Geotech S13 (1c)RONM 834 23 12 Lennartz 3D 5s (3c)
Fig. 1. Path connecting the epicenter (star) of the Algerian earthquake to RSNI recording stations in theMediterranean Sea. Circles indicate the three-component stations and triangles the mono-component ones. Thepanel on the right hand-side shows a zoom on the stations used in this work.

593
T waves in Western Mediterranean Sea after the May 21, 2003 Algerian earthquake
18:44:20; lat – 36.96N; long – 3.634E; depth –12 km; mb – 6.5.
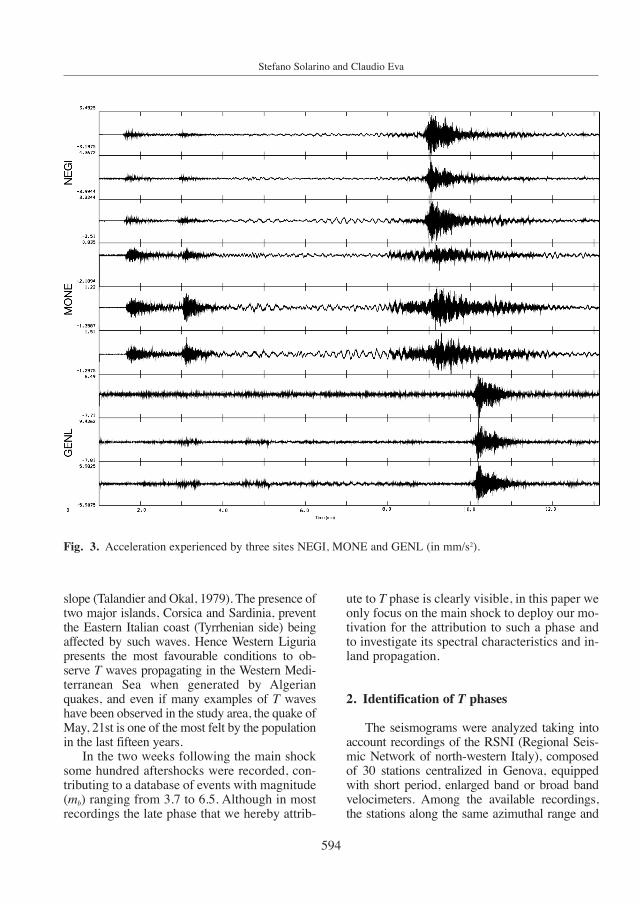
Although no macroseismic survey has beencarried out, the available reports on human per-ception of the event indicate that while theearthquake was clearly felt along the coastalline in Genova and Imperia (GENL and 0IMI infig. 1), where it created a certain alarm, theshaking was very weak or completely absent inland. Figure 3 shows the deconvolved estimateof the acceleration level (in mm/s2) for stationsNEGI, MONE and GENL. It is evident thatMONE, that is 35 km away from the coast (fig.1), experienced a significantly smaller acceler-ation, almost 6 times less, than GENL.
The recordings of the Algerian earthquake asdetected by the velocity seismometers installed in
north-western Italy show, approximately 8 to 10min after the P wave arrival, a strong and longperturbation which we attribute to T phase (fig. 2).The amplitude of such a phase, at least two ordershigher than the P and S waves in some recordings,and its frequency content were the reasons forconfusing its occurrence with a local seaquake.However, the oceanic structure and the propertiesof water in the Western Mediterranean Sea, alongwith a rather developed SOFAR channel, favourthe generation and propagation of T waves (Jen-sen et al., 1994). In fact the geometry and shapeof both Algerian and Western Ligurian coasts areable to convert a fraction of energy of seismicwaves into acoustic energy when they hit theocean boundary and to convert back this energy toseismic when the T waves impact again on the
Fig. 2. Sample of the recordings of the Algerian earthquake as detected by some instruments of the RSNI net-work. NEGI and MONE are equipped with broadband instruments.
594
Stefano Solarino and Claudio Eva
slope (Talandier and Okal, 1979). The presence oftwo major islands, Corsica and Sardinia, preventthe Eastern Italian coast (Tyrrhenian side) beingaffected by such waves. Hence Western Liguriapresents the most favourable conditions to ob-serve T waves propagating in the Western Medi-terranean Sea when generated by Algerianquakes, and even if many examples of T waveshave been observed in the study area, the quake ofMay, 21st is one of the most felt by the populationin the last fifteen years.
In the two weeks following the main shocksome hundred aftershocks were recorded, con-tributing to a database of events with magnitude(mb) ranging from 3.7 to 6.5. Although in mostrecordings the late phase that we hereby attrib-
ute to T phase is clearly visible, in this paper weonly focus on the main shock to deploy our mo-tivation for the attribution to such a phase andto investigate its spectral characteristics and in-land propagation.
2. Identification of T phases
The seismograms were analyzed taking intoaccount recordings of the RSNI (Regional Seis-mic Network of north-western Italy), composedof 30 stations centralized in Genova, equippedwith short period, enlarged band or broad bandvelocimeters. Among the available recordings,the stations along the same azimuthal range and
Fig. 3. Acceleration experienced by three sites NEGI, MONE and GENL (in mm/s2).

595
T waves in Western Mediterranean Sea after the May 21, 2003 Algerian earthquake
closer to the coast were selected (table I). Besidesthe instrumental characteristics, table I indicatesdistance and azimuth from the source for eachstation. The distance of each station from thecoast, as computed on the incoming wavefront, isalso reported; this measure is fundamental to dis-tinguish and explain different seismic behaviours.
The available recordings of the Algerianearthquake are very different, being detected byvarious instruments (table I). Nevertheless, ahigh amplitude phase is clearly visible in thesecond part of each seismogram (figs. 2, 3, 4and 6a,b), some 8 min after the P and S arrivals.Short period and semi-broad band instruments(ROTM and RONM in fig. 2) appear as themost sensitive, whereas this phase is partlymasked by surface waves in broadband record-ings (NEGI and MONE in fig. 2). It is evidentthat, before any further analysis is done, the
Fig. 4. Seismograms of the vertical components of ROB (upper) and GENL (lower) before and after applyingthe bandpass filter 0.5-20 Hz.
Fig. 5. Velocity of the SOFAR channel in May forthe Mediterranean Sea. The SOFAR for the Pacific isreported for comparison.

596
Stefano Solarino and Claudio Eva
lower frequencies must be removed. Accordingto the spectral analysis conducted on severalseismograms, a 0.5-20 Hz band pass filter wasapplied to all records. More details on the spec-tral content of the wavelets will be given anddiscussed in the next paragraph. As an example,the appearance of the vertical component afterfiltering for GENL and ROB stations (whichare broad band and short period respectively) isshown in fig. 4; no significant differences arefound for the horizontal components.
Since the shape and characteristics of a Tphase strongly depend on the position of therecording station with respect to the coast, seis-mograms were separated into two groups, onerelative to instruments operating close to thecoast (fig. 6a), the other relative to stations locat-ed inland (fig. 6b). The first group is made of
recording instruments located within a distanceof 35 km from the coast computed on the incom-ing wavefront (see fig. 1); the second comprisesthe stations located at 35 km and more from thecoast. The threshold to distinguish betweengroups was chosen by both a visual inspection ofthe waveforms and by checking match and ho-mogeneity of several seismogram juxtapositions.
In all plots, two late phases, recorded 500 s af-ter the P onset, are visible. We call them T1 andT2 respectively. The absolute path time, the shapeand the amplitude of these phases are consistentwith a T wave or a back-converted T wave. In fact,only by travelling with a velocity close to 1.5 km/scan a wave reach a station located some 800 to1000 km away from the source 8 min after the ori-gin time. Moreover, the sonograms computed forthe whole seismograms (some are shown in fig. 8)
Fig. 6a,b. Seismograms of two groups (divided according to their location) of vertical components for stationsordered with respect to the epicentral distance: a) stations on the coast; b) stations in land. The recognized phas-es and their apparent velocities are also shown (km/s).
a b

597
T waves in Western Mediterranean Sea after the May 21, 2003 Algerian earthquake
do not reveal any dispersive behaviour of the seis-mic waves, confirming that only body waves arecontained within. All these are very sound ele-ments to label the later arrival as T phases.
The plots in fig. 6a,b allow us to compute theapparent velocities of the two groups of record-ings. It is very clear that all stations close to thecoast (fig. 6a) have recorded phases with an ap-parent velocity ranging from 1.5 to 1.65 km/s, an-other element that favours the recognition of Tphases.
A very different situation is observed for therecordings inland (fig. 6b). The apparent veloc-ities are coherent with those of P and S wavestravelling in the upper crust. These recordingsare then relative to converted T phases.
To summarize, the T phase travelled in theSOFAR and reached the coastal station right afterthe conversion, conserving the velocity and ener-gy of the T wave. The conversion back to P and Smust have happened very close to the coast. Infact, unlike what happens in other seas, the SO-FAR low velocity waveguide in the Mediter-ranean is very shallow and narrow (fig. 5). Theimpact of the wave train with the slope musttherefore have occurred at a distance from the
coast where the bathymetry is compatible withthe depth of the SOFAR waveguide, that is about200 m. By looking at the bathymetry, the conver-sion point should be at less than 6-8 km in aver-age from the coast.
3. Spectral characteristics and attenuationof the T waves
The results of the analysis in the frequencydomain for the T phase (namely for the part of thesignal ranging from 7 to 10 min) has been com-pacted in the plot shown in fig. 7. It reports thespectra of the non filtered vertical component of5 recording stations (GENL, NEGI, RONM,MONE and ROTM) and reveals the existence oftwo frequency bands: the first in the range 0.01-0.5 Hz (which is not taken into account as exclud-ed by the filtering applied in all analyses in thetime domain) and the second in the range 0.5-20Hz. Moreover the spectra exhibit peaks withmaximum of amplitude in the range 1 to 3 Hz, inagreement with the results obtained by other au-thors studying similar waves for the Pacific oceanpaths (Koyonagi et al., 1995; Okal and Talandier,
Fig. 7. Spectra of the presumed T phase for stations GENL (red line), NEGI (green line), RONM (blue line),MONE (black line) and ROTM (grey line).

598
Stefano Solarino and Claudio Eva
1997; Okal, 2001). However some of these au-thors state that the spectrum of T waves, as guid-ed waves through the narrow SOFAR channel, isrestricted to high frequencies, f >2 Hz while inthis case even lower frequencies are present. This
difference can be related to the different proper-ties of the SOFAR channel in the different seas,as we will point out in more detail later on. Spec-tra show a small shift of maximum amplitude to-wards higher frequencies with increasing coastal
Fig. 8. Sonograms for GENL, NEGI and ROTM.

599
T waves in Western Mediterranean Sea after the May 21, 2003 Algerian earthquake
distance (from red to grey lines), but substantial-ly the higher values are mainly centred in theband 1-2 Hz. Finally, as previously stated for thewhole spectrum, longitudinal and vertical com-ponents show a similar trend.
Coming to a more quantitative aspect, a pre-liminary approach to the attenuation of T waveshas been performed. For this purpose, the Tphase energy flux, that is the integral of the Tphase spectrum in the frequency range 2-10 Hz,was evaluated. Following Newman and Okal(1998) and Okal et al. (2003)
where U is the complex spectral amplitude ofthe ground motion and ρ and α are the densityand the P wave velocity of the receiver structurerespectively.
The results, as a function of distance from thecoast on the travel path, are presented in fig. 9,showing how the energy of converted T wavesattenuates with the inland path.
( )( ) dE U
min
max
2 2
παρ
ω ω ω=ω
ω
#
Comparing the actual attenuation of Twaves with geometrical spreading (proportion-al to x−1) it is possible to appreciate the goodagreement between the two curves. Again, nosignificant differences have been inferred forhorizontal components.
A visible anomaly can be observed for sta-tion ROTM: indeed this station shows a very dif-ferent spectrum (fig. 7, grey line) and an anom-alous increase in amplitude (fig. 9, right hand-side). This station is located on the very thicksedimentary deposits of the Po Plain domain: itis plausible to ascribe this anomalous behaviourto a local site effect. Finally it is interesting tonotice that the energy decreases with distance onthe incoming path from the coastal line ratherthan the source distance (table I). For example,MONE is one of the closest stations (858 kmfrom the source), but it is at 35 km from thecoast, that is about 41-43 km from the likely con-version point. On the other hand, GENL is one ofthe more distant stations (935 km from the pro-posed source) but it is only a few km away fromthe conversion point. The perception of the
Fig. 9. Energy attenuation for each component with increasing distance computed in the frequency window 2-10 Hz. Each symbol represents the energy computed at the relevant station. To fit all curves in one plot, the twotransversal components (red and green line) are multiplied by 1e-6; no exaggeration has been applied to the ver-tical component (dotted line). The shape of the curve attenuating with R−1 is reported for comparison (blue line).

600
Stefano Solarino and Claudio Eva
earthquake, which was reported to be so differentfor towns that are very close, is certainly relatedto the distance from the conversion point. In fact,as already pointed out, most of the reports werecollected in Genova and Imperia, located at 1and 11 km respectively from the coast. Finally, itmust be remarked that an energy loss of about80% is already reached when the path exceeds10 km.
4. Discussion and conclusions
This paper analyzed the characteristics oflate seismic phases associated with the mb=6.5earthquake that shook Algeria on May 21, 2003as recorded by seismic stations installed on thecoast facing the Ligurian Sea.
These stations, located along the northnorth-east path at a distance ranging from 800
Fig. 10. Comparison of T wave spectrum (red line) and PS spectrum (green line) for GENL station.

601
T waves in Western Mediterranean Sea after the May 21, 2003 Algerian earthquake
to 1000 km, provided seismograms in which, atabout 7-8 min after the P phase, a complex Twave is clearly visible. The identification of thislater phase as T has been proposed on the basisof several pieces of evidence. The shape, ampli-tude and path time are consistent with those metin other studies and with a wave travelling witha velocity of 1.5 km/s. The apparent velocitycomputed for the recordings on stations close tothe coast is of the same order. Sonograms makethe exclusion of surface waves within the seis-mogram very reasonable.
On all recordings, the T train is split intotwo parts. In particular, the stations that areapart from the coast show apparent velocitiescompatible with P and S waves that travelledwithin the crust. They are therefore the record-ing of back-converted T waves. Instead, therecordings of the stations closer to the coast,and therefore to the conversion point, exhibitoriginal T waves.
The preliminary study on the spectral char-acteristics and attenuation of the recorded Twaves provided interesting insights on the prop-agation of such a wave in the MediterraneanSea. They are:
– The frequency content extends down to 1Hz, conversely to what was proposed by otherstudies (Okal and Talandier, 1997; Talandierand Okal, 1998). Moreover, sonograms andspectra show that the maximum amplitude isconfined in the range 1-3 Hz, while in otherstudies values around 5 Hz have been suggest-ed. We propose that the shape and depth of theSOFAR waveguide channel may influence thespectra, since in fact the characteristics of theSOFAR in the Mediterranean Sea are very dif-ferent from other seas.
– The likely position of the back-conver-sion point is very close to the coast, where thebathymetry is of the same order of the depth ofthe waveguide (around 200 m). Because of theshape of the slope under the Ligurian Sea, thatis incised by several steep canyons, it is highlylikely that the conversion point is at less than 10km from the coast.
– T waves attenuate very fast in the vicinityof the conversion point. We estimate that 80%of the energy is dumped at a distance greaterthan 10 to 15 km beyond the conversion point.
– Compared to P and S waves, T phases con-tain more high frequency and generally speaking,of higher amplitude (fig. 10).
Acknowledgements
The paper profitted from the comments andsuggestions of two anonymous reviewers.
The experience of Giacomo Carenzo, whoshared the thrill of one night spent doing phasepicking, was of great help for the accomplish-ment of this work.
REFERENCES
JENSEN, F.B., W.A. KUPERMAN, M.B. PORTER and H. SCHMIDT
(1994): Computational Ocean Acoustics (Am. Inst. Phys.Press, New York), pp. 612.
KOYANAGI, S., K. AKI, N. BISWAS and K. MAYEDA (1995):Inferred attenuation from site effect-corrected T phasesrecorded on the Island of Hawaii, Pure Appl. Geophys.,144, 1-17.
NEWMAN, A.V. and E.A. OKAL (1998): Teleseismic esti-mates of radiated seismic energy: the E/M0 discrimi-nant for tsunami earthquakes, J. Geophys. Res., 103,26885-26898.
OKAL, E. (2001): Converted T phases recorded on Hawaiifrom Polynesian nuclear tests: a preliminary report,Pure Appl. Geophys., 158 (3), 457-474.
OKAL, E. and J. TALANDIER (1997): T waves from the greatBolivian deep earthquake in relation to channeling of S-wave energy up to the slab, J. Geophys. Res., 102 (B12),27412-27437.
OKAL, E., P.J. ALASSET, O. HYVERNAUD and F. SCHINDELE
(2003): The deficient T waves of tsunami earthquakes,Geophys. J. Int., 152, 416-432.
TALANDIER, J. and E. OKAL (1979): Human perception of Twaves: the June 22, 1977 Tonga earthquake felt onTahiti, Bull. Seismol. Soc. Am., 69 (5), 1475-1486.
TALANDIER, J. and E. OKAL (1998): On the mechanism ofconversion of seismic waves to and from T waves in thevicinity of island shores, Bull. Seismol. Soc. Am., 88(2), 621-632.
(received January 20, 2006;accepted November 7, 2007)