tabla strokes recognition - welcome to...
TRANSCRIPT

1
Tabla Strokes Recognition
Mihir Sarkar
2
Tabla?
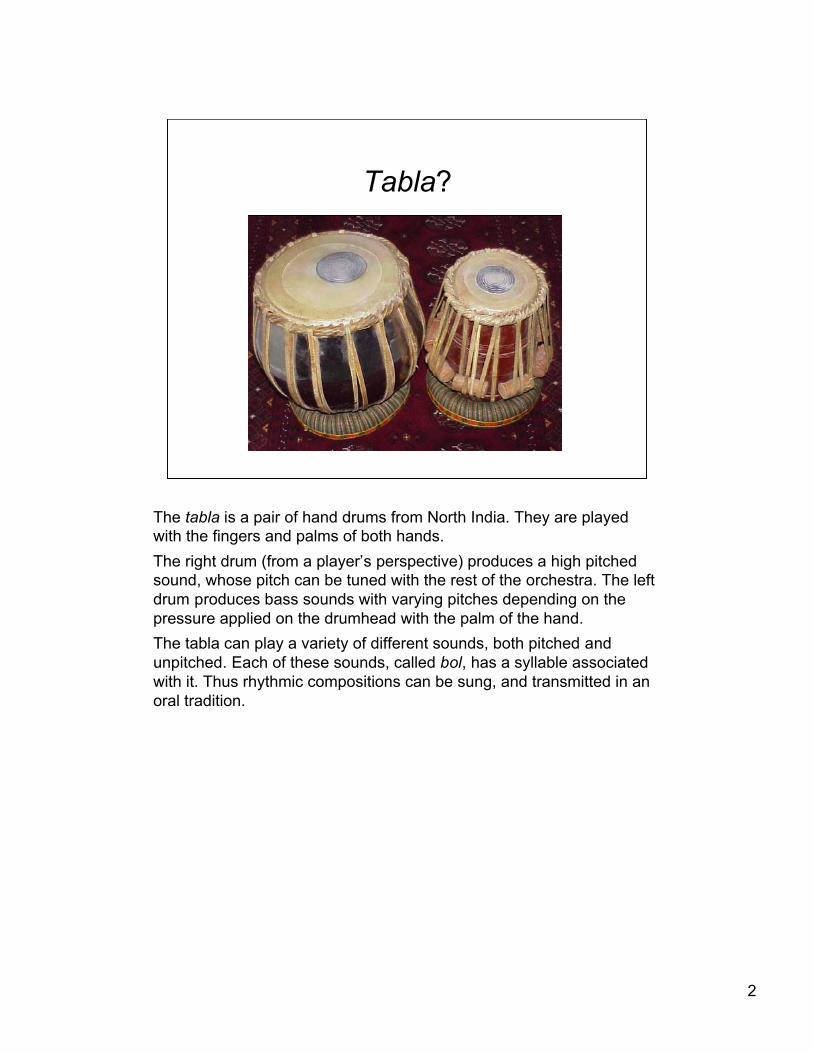
The tabla is a pair of hand drums from North India. They are playedwith the fingers and palms of both hands.The right drum (from a player’s perspective) produces a high pitchedsound, whose pitch can be tuned with the rest of the orchestra. The leftdrum produces bass sounds with varying pitches depending on thepressure applied on the drumhead with the palm of the hand.The tabla can play a variety of different sounds, both pitched andunpitched. Each of these sounds, called bol, has a syllable associatedwith it. Thus rhythmic compositions can be sung, and transmitted in anoral tradition.
3
Context
• Can you distinguish different bols?
• Can a machine automatically classify tablastrokes?
• Is there a systematic way to identify thebest method to recognize tabla strokes?
Humans can distinguish different bols after some minimal training.How can a machine classify tabla strokes, and how would it comparewith a human?In this work, I study a systematic way to recognize tabla strokes bytrying out various parameters to select the optimum features forclassification.Tabla strokes recognition can be interesting both for music informationretrieval in large multimedia databases, or for automatic transcription oftabla performances.
4
Vision
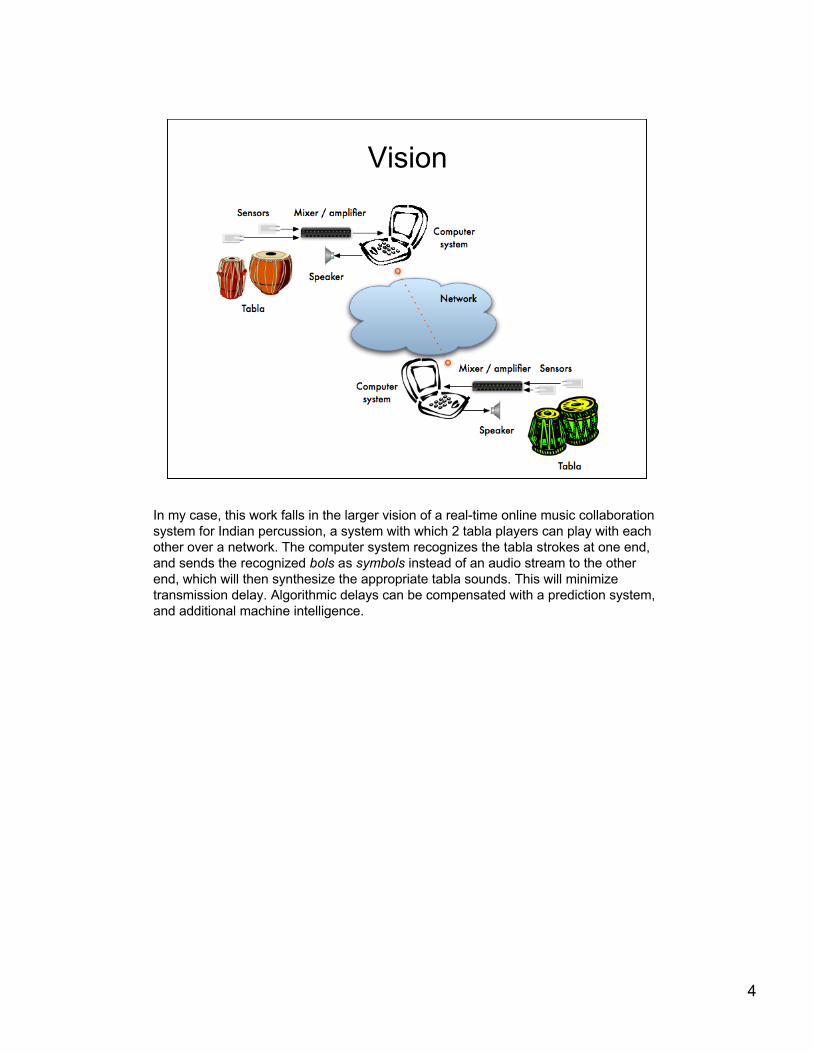
In my case, this work falls in the larger vision of a real-time online music collaborationsystem for Indian percussion, a system with which 2 tabla players can play with eachother over a network. The computer system recognizes the tabla strokes at one end,and sends the recognized bols as symbols instead of an audio stream to the otherend, which will then synthesize the appropriate tabla sounds. This will minimizetransmission delay. Algorithmic delays can be compensated with a prediction system,and additional machine intelligence.
5
Experimental Setup
• 1 tabla set• 3 tabla players• 10 bols• 413 recordings (kept 300)• Microphone input (studio recording)• Discrete strokes
I used one tabla set for recordings. 3 players (Manu Gupta, GrahamGrindlay, and myself) played 10 of the most common bols on the tabla,10 times each. I actually got more recordings, but kept 300 so as tohave equal priors for each class (i.e. each type of stroke). Therecordings were done in a studio environment with low noise. Discretestrokes were played, as opposed to elaborate rhythmic patterns.
6
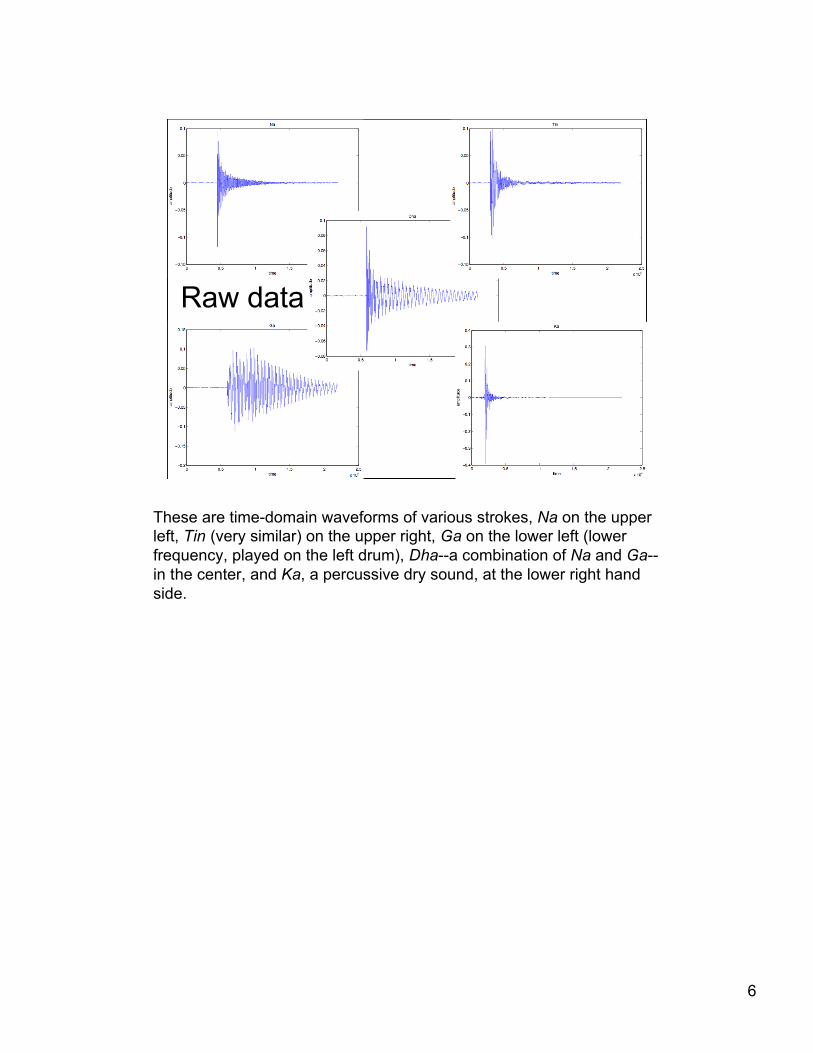
Raw data
These are time-domain waveforms of various strokes, Na on the upperleft, Tin (very similar) on the upper right, Ga on the lower left (lowerfrequency, played on the left drum), Dha--a combination of Na and Ga--in the center, and Ka, a percussive dry sound, at the lower right handside.
7
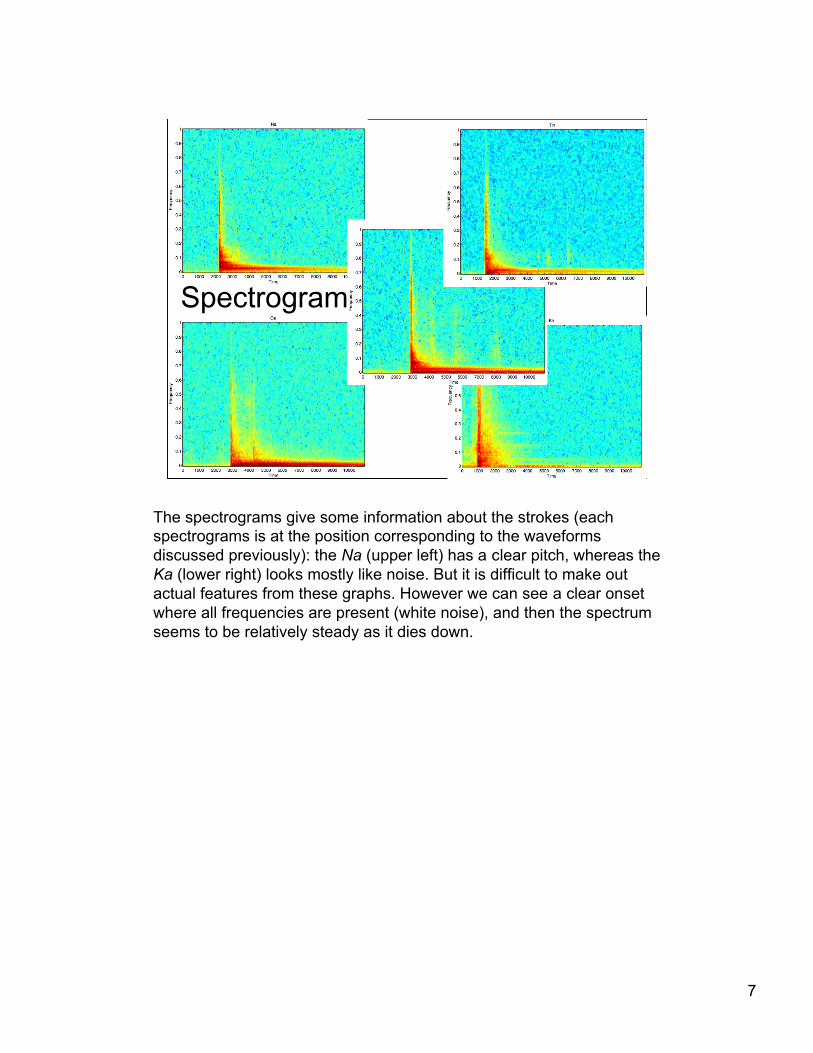
Spectrogram
The spectrograms give some information about the strokes (eachspectrograms is at the position corresponding to the waveformsdiscussed previously): the Na (upper left) has a clear pitch, whereas theKa (lower right) looks mostly like noise. But it is difficult to make outactual features from these graphs. However we can see a clear onsetwhere all frequencies are present (white noise), and then the spectrumseems to be relatively steady as it dies down.
8
Feature Extraction
• Time domain: ZCR• Frequency domain: PSD• Cepstral domain: MFCC
Some of the possible features include zero-crossings (based on theliterature), but I quickly dropped it because of the noise level on therecordings, which, although low, created zero crossings throughouteach frame. In the frequency domain, I considered the Power SpectralDensity (Welch’s method--other algorithms, such as the Periodogrammethod, performed similarly--with a 3% variance at most). I alsoconsidered Mel Frequency Cepstrum Coefficients, widely used formusic information retrieval and speech recognition.
9
Dataset Selection
• Orthogonal dimensions:– Instances– Bols– Players
• Training / leave-one-out validation• Testing
The recordings provided me with 3 orthogonal dimensions in mydataset: each instance of a stroke played by each player, the strokesthemselves, and the players.I considered an 80/20% break-up of my dataset for training and testing.
10
Baseline
• Random: 10%• Human: 87%• Initial k-NN: 18%
(Welch’s PSD, NFFT = 16, k = 1)
For comparison purpose, the random baseline (with equal priors) givesa recognition rate of 10%. I was also curious as to how a human wouldactually perform. I performed the test and came out with a score of 87%on the testbed of my dataset.My first run of an automatic classifier gave me 18%, definitelysomething to work on.
11
k-NN
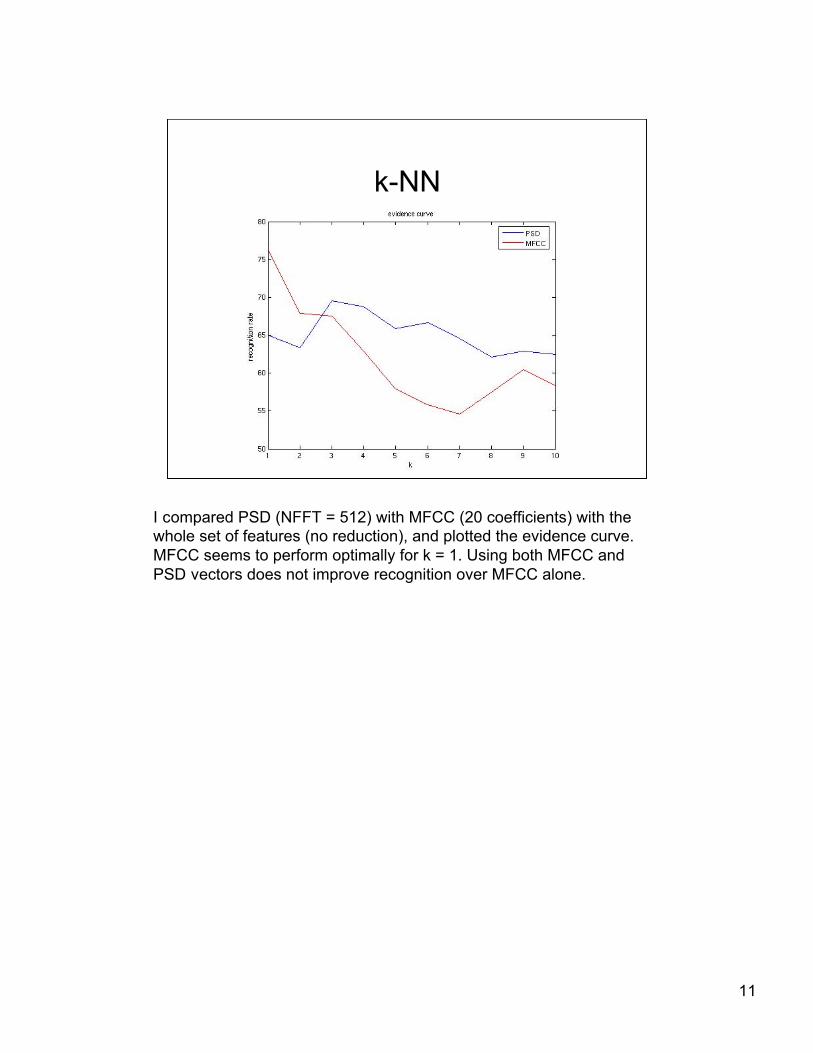
I compared PSD (NFFT = 512) with MFCC (20 coefficients) with thewhole set of features (no reduction), and plotted the evidence curve.MFCC seems to perform optimally for k = 1. Using both MFCC andPSD vectors does not improve recognition over MFCC alone.
12
k-NN
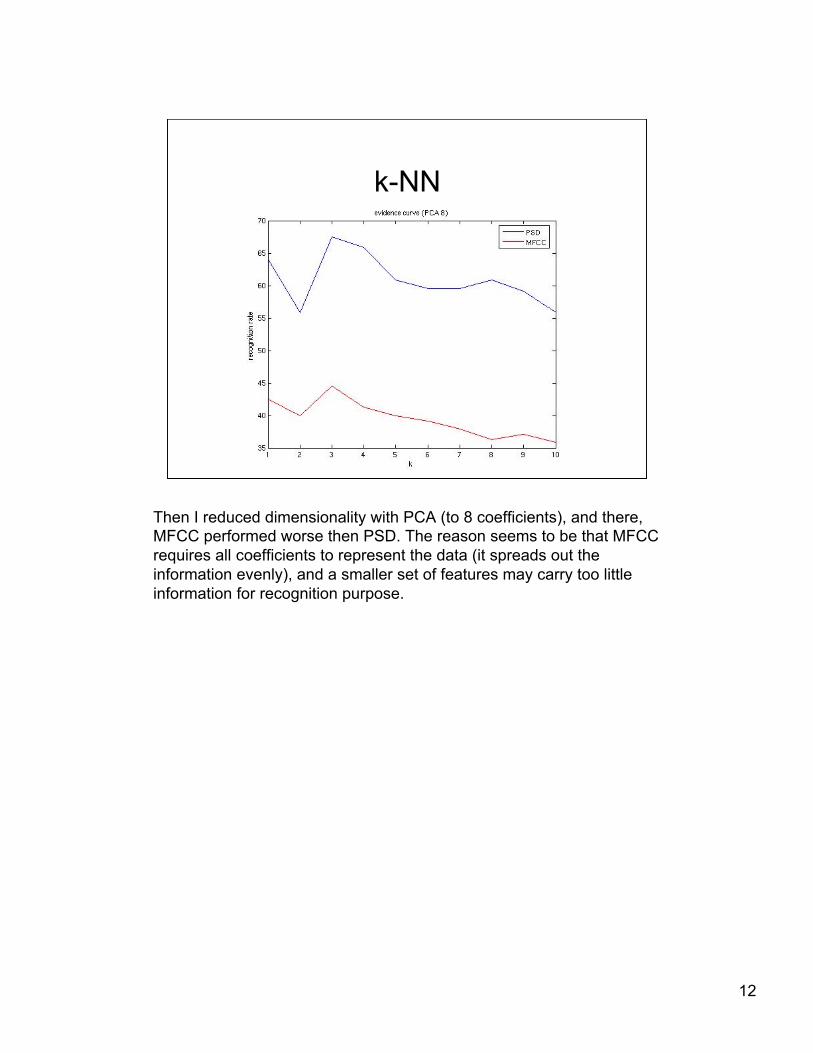
Then I reduced dimensionality with PCA (to 8 coefficients), and there,MFCC performed worse then PSD. The reason seems to be that MFCCrequires all coefficients to represent the data (it spreads out theinformation evenly), and a smaller set of features may carry too littleinformation for recognition purpose.
13
k-NN
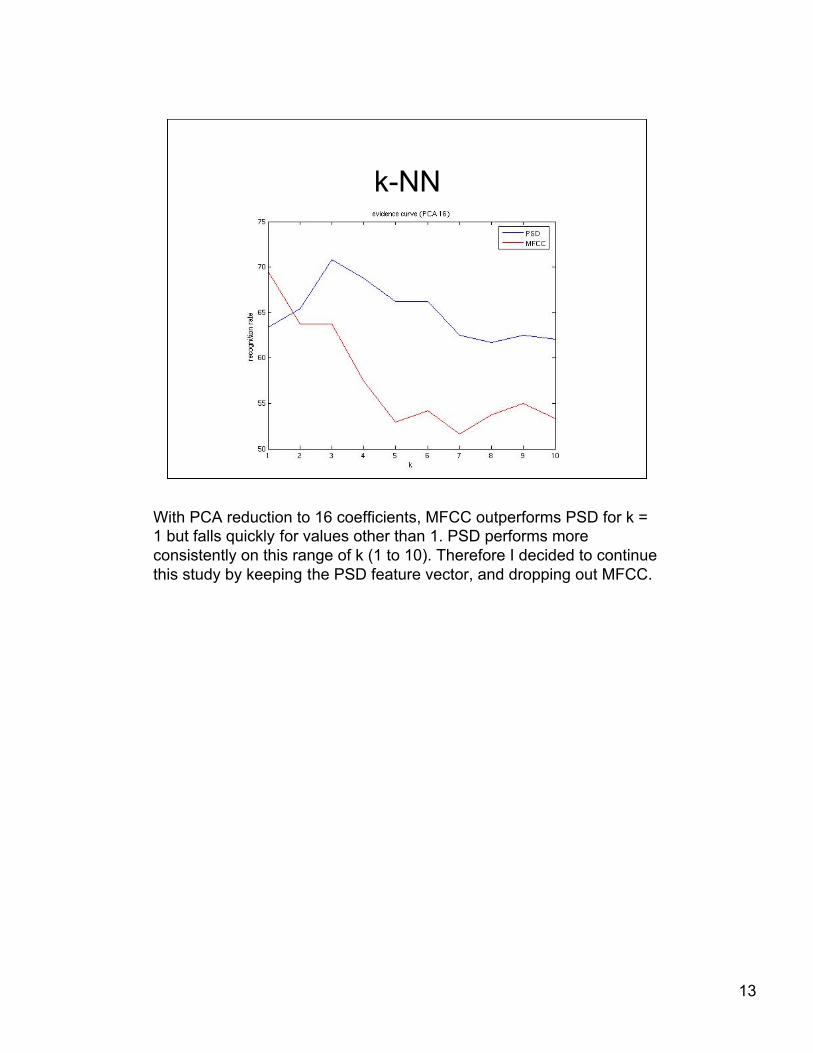
With PCA reduction to 16 coefficients, MFCC outperforms PSD for k =1 but falls quickly for values other than 1. PSD performs moreconsistently on this range of k (1 to 10). Therefore I decided to continuethis study by keeping the PSD feature vector, and dropping out MFCC.
14
k-NN
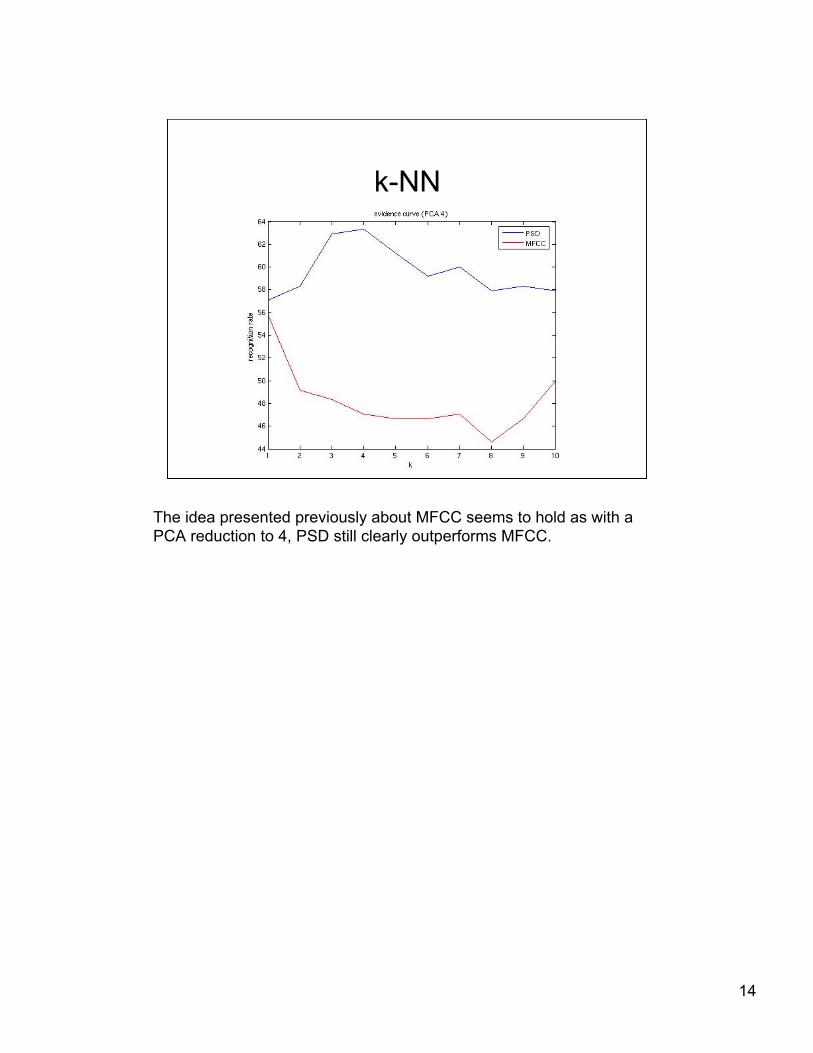
The idea presented previously about MFCC seems to hold as with aPCA reduction to 4, PSD still clearly outperforms MFCC.
15
k-NN
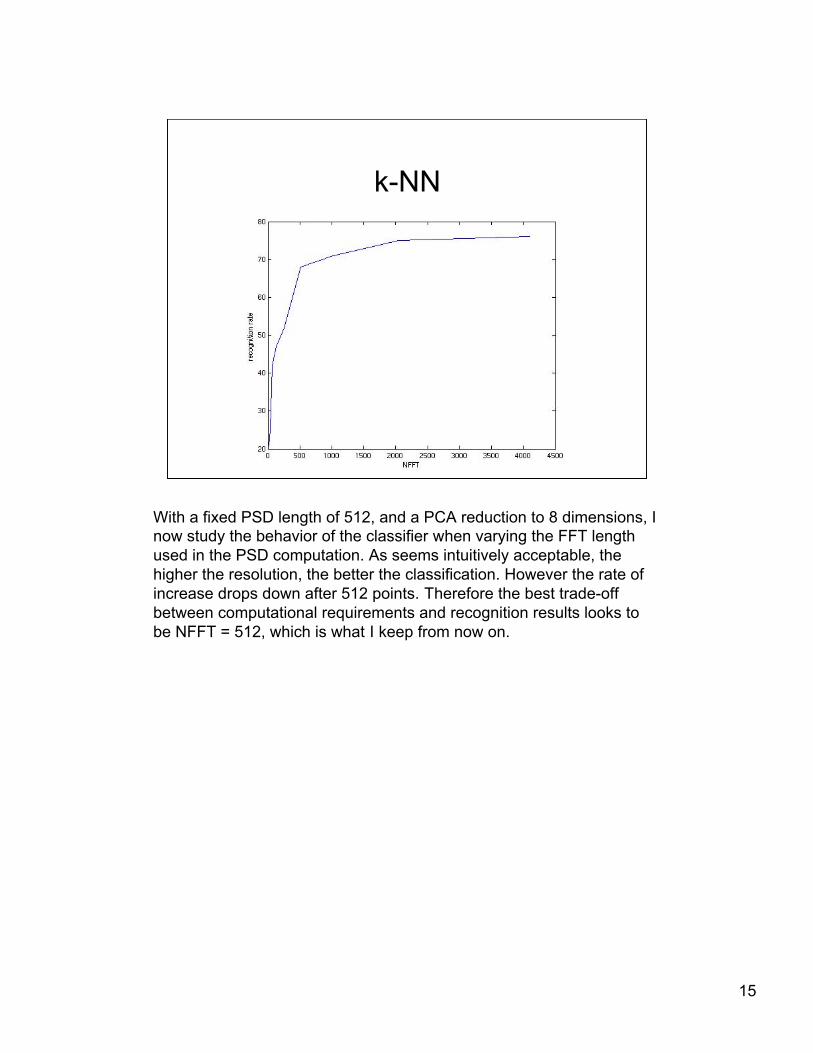
With a fixed PSD length of 512, and a PCA reduction to 8 dimensions, Inow study the behavior of the classifier when varying the FFT lengthused in the PSD computation. As seems intuitively acceptable, thehigher the resolution, the better the classification. However the rate ofincrease drops down after 512 points. Therefore the best trade-offbetween computational requirements and recognition results looks tobe NFFT = 512, which is what I keep from now on.
16
k-NN
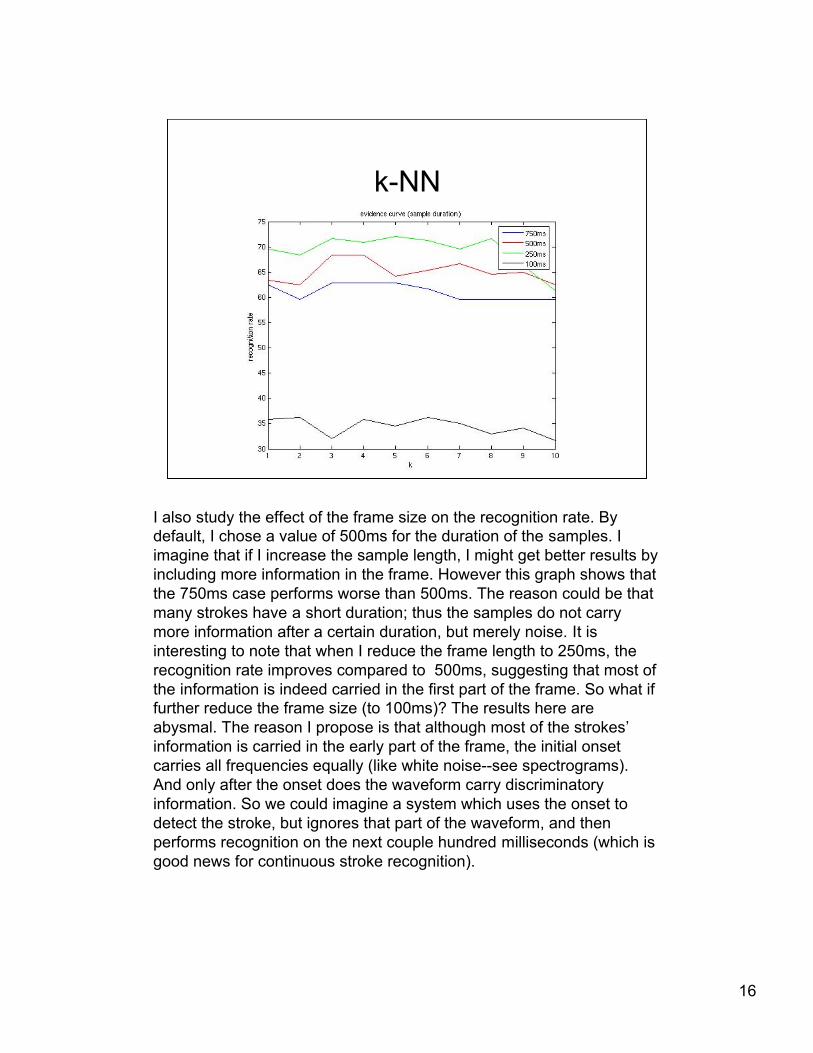
I also study the effect of the frame size on the recognition rate. Bydefault, I chose a value of 500ms for the duration of the samples. Iimagine that if I increase the sample length, I might get better results byincluding more information in the frame. However this graph shows thatthe 750ms case performs worse than 500ms. The reason could be thatmany strokes have a short duration; thus the samples do not carrymore information after a certain duration, but merely noise. It isinteresting to note that when I reduce the frame length to 250ms, therecognition rate improves compared to 500ms, suggesting that most ofthe information is indeed carried in the first part of the frame. So what iffurther reduce the frame size (to 100ms)? The results here areabysmal. The reason I propose is that although most of the strokes’information is carried in the early part of the frame, the initial onsetcarries all frequencies equally (like white noise--see spectrograms).And only after the onset does the waveform carry discriminatoryinformation. So we could imagine a system which uses the onset todetect the stroke, but ignores that part of the waveform, and thenperforms recognition on the next couple hundred milliseconds (which isgood news for continuous stroke recognition).
17
Confusion Matrix
5000000010Thun0312000000Tat1041000000Re0401000010Te0000410100Dhin0001120200Dha0010103010Ka0000200400Ga2000010030Tin1000000005Na
ThunTatReTeDhinDhaKaGaTinNa
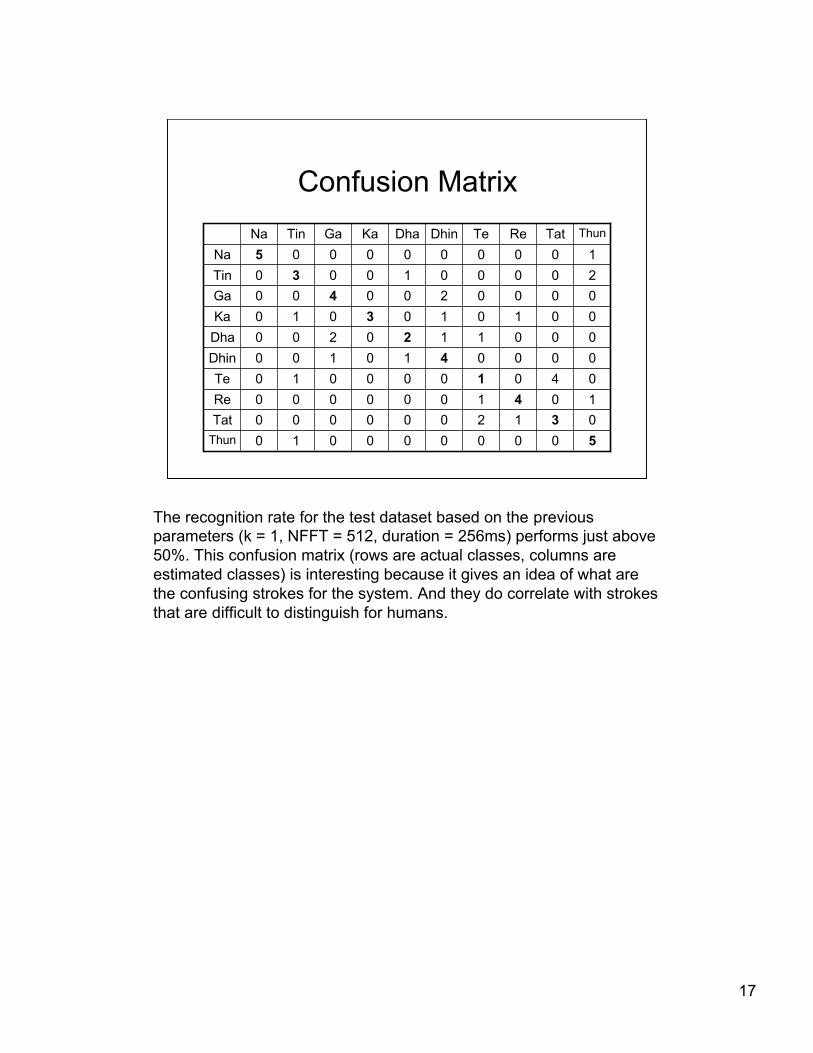
The recognition rate for the test dataset based on the previousparameters (k = 1, NFFT = 512, duration = 256ms) performs just above50%. This confusion matrix (rows are actual classes, columns areestimated classes) is interesting because it gives an idea of what arethe confusing strokes for the system. And they do correlate with strokesthat are difficult to distinguish for humans.
18
Neural Networks
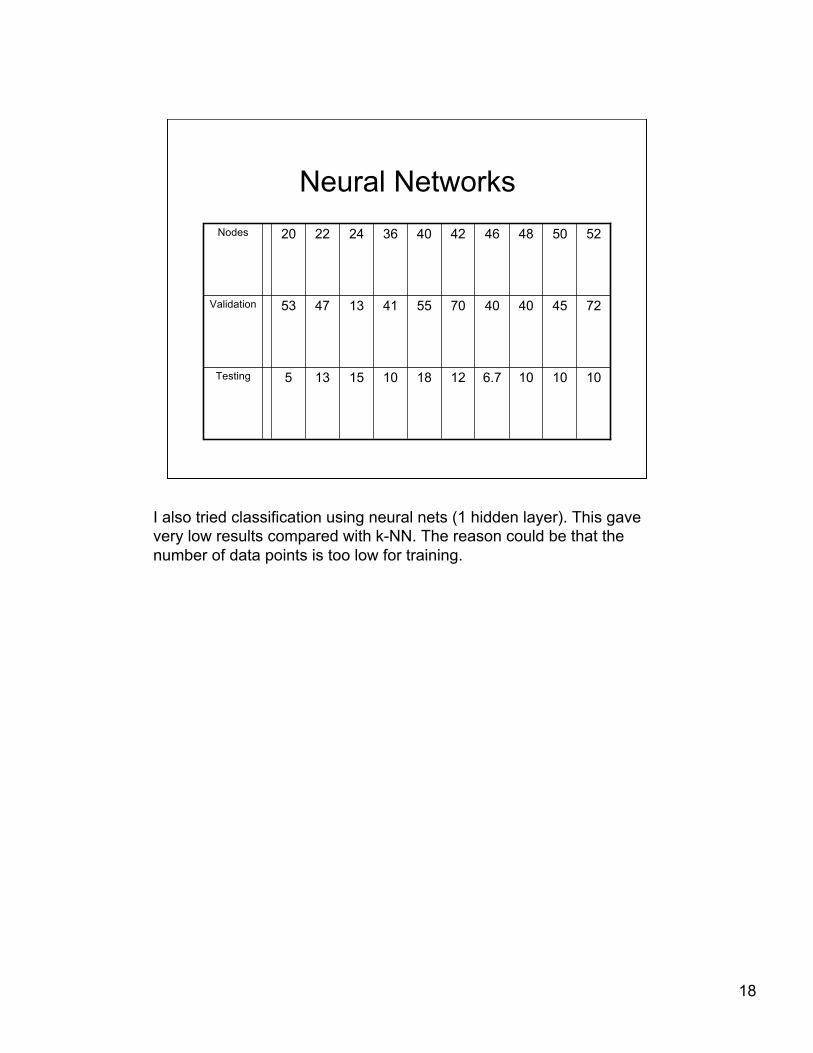
1010106.712181015135Testing
72454040705541134753Validation
52504846424036242220Nodes
I also tried classification using neural nets (1 hidden layer). This gavevery low results compared with k-NN. The reason could be that thenumber of data points is too low for training.
19
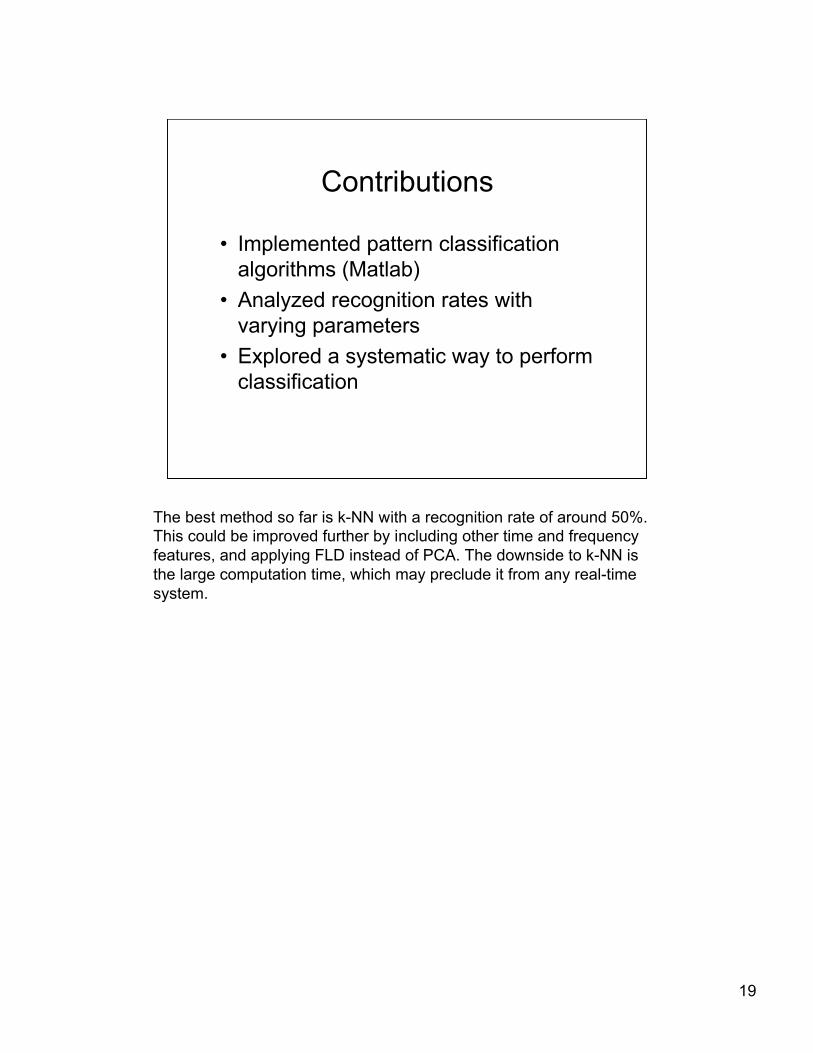
Contributions
• Implemented pattern classificationalgorithms (Matlab)
• Analyzed recognition rates withvarying parameters
• Explored a systematic way to performclassification
The best method so far is k-NN with a recognition rate of around 50%.This could be improved further by including other time and frequencyfeatures, and applying FLD instead of PCA. The downside to k-NN isthe large computation time, which may preclude it from any real-timesystem.
20
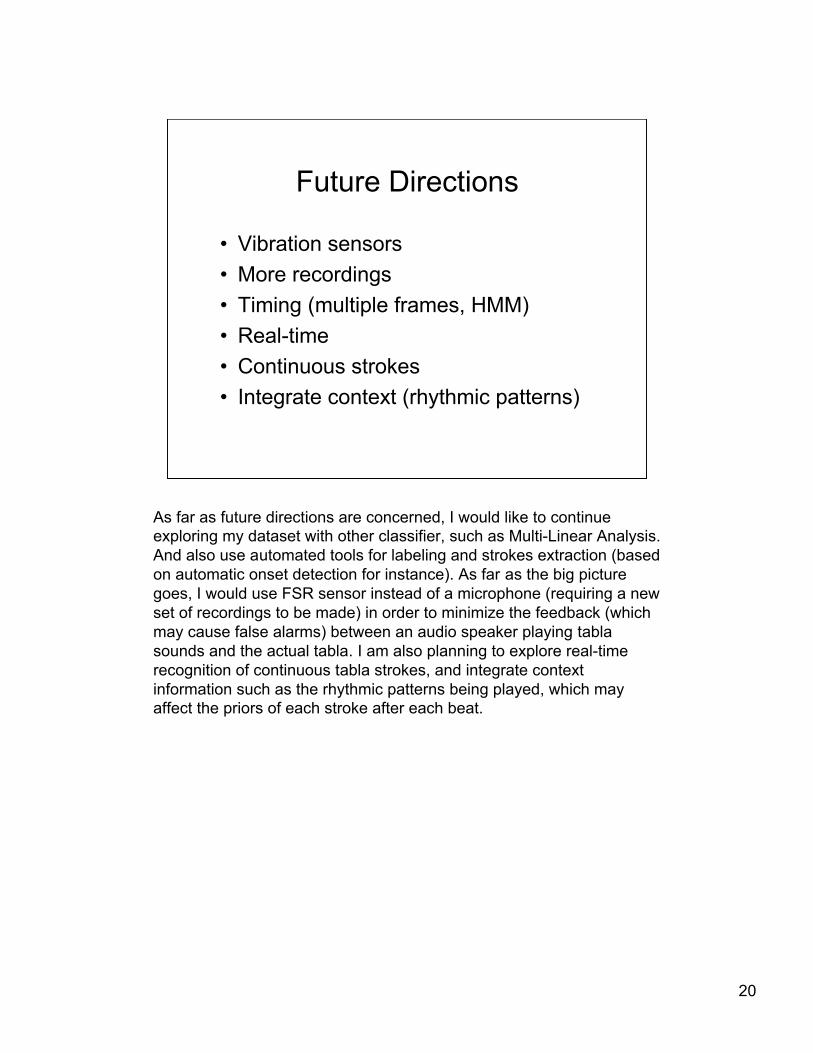
Future Directions
• Vibration sensors• More recordings• Timing (multiple frames, HMM)• Real-time• Continuous strokes• Integrate context (rhythmic patterns)
As far as future directions are concerned, I would like to continueexploring my dataset with other classifier, such as Multi-Linear Analysis.And also use automated tools for labeling and strokes extraction (basedon automatic onset detection for instance). As far as the big picturegoes, I would use FSR sensor instead of a microphone (requiring a newset of recordings to be made) in order to minimize the feedback (whichmay cause false alarms) between an audio speaker playing tablasounds and the actual tabla. I am also planning to explore real-timerecognition of continuous tabla strokes, and integrate contextinformation such as the rhythmic patterns being played, which mayaffect the priors of each stroke after each beat.