table 1. number of nonfatal occupational injuries and...
TRANSCRIPT
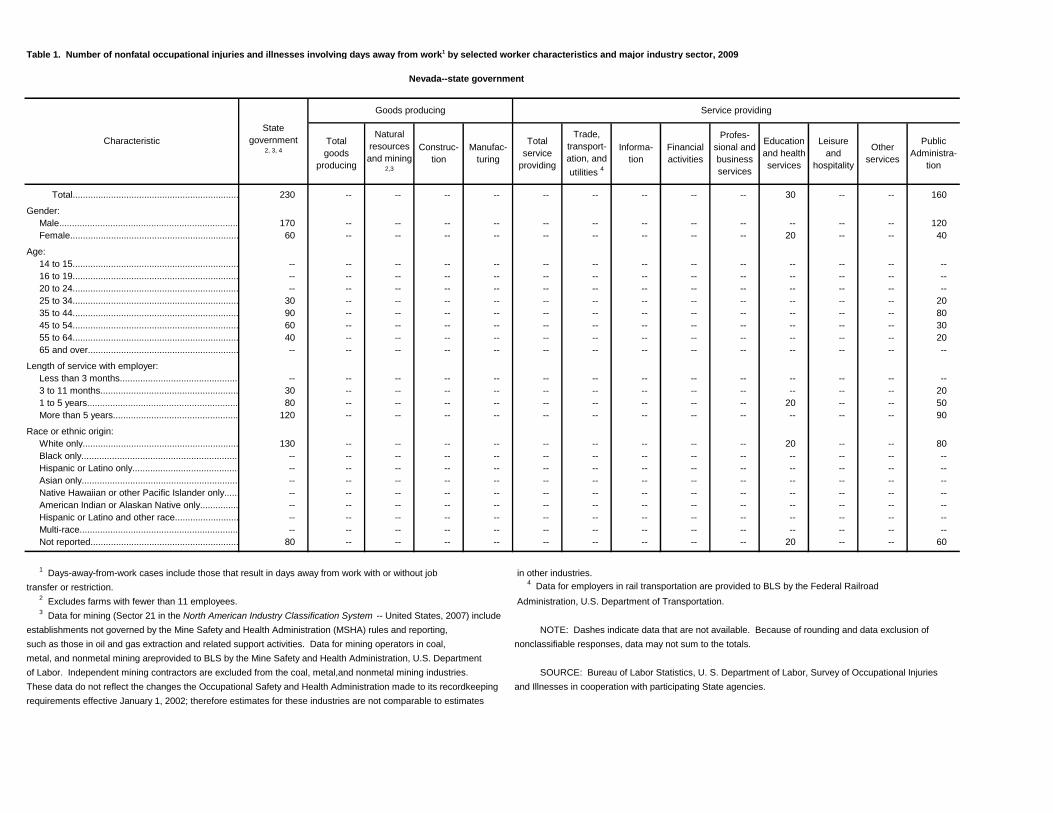
Table 1. Number of nonfatal occupational injuries and illnesses involving days away from work1 by selected worker characteristics and major industry sector, 2009
Total................................................................................................................230 -- -- -- -- -- -- -- -- -- 30 -- -- 160
Gender:
Male................................................................................................................170 -- -- -- -- -- -- -- -- -- -- -- -- 120
Female................................................................................................................60 -- -- -- -- -- -- -- -- -- 20 -- -- 40
Age:
14 to 15................................................................................................................-- -- -- -- -- -- -- -- -- -- -- -- -- --
16 to 19................................................................................................................-- -- -- -- -- -- -- -- -- -- -- -- -- --
20 to 24................................................................................................................-- -- -- -- -- -- -- -- -- -- -- -- -- --
25 to 34................................................................................................................30 -- -- -- -- -- -- -- -- -- -- -- -- 20
35 to 44................................................................................................................90 -- -- -- -- -- -- -- -- -- -- -- -- 80
45 to 54................................................................................................................60 -- -- -- -- -- -- -- -- -- -- -- -- 30
55 to 64................................................................................................................40 -- -- -- -- -- -- -- -- -- -- -- -- 20
65 and over................................................................................................................-- -- -- -- -- -- -- -- -- -- -- -- -- --
Length of service with employer:
Less than 3 months................................................................................................................-- -- -- -- -- -- -- -- -- -- -- -- -- --
3 to 11 months................................................................................................................30 -- -- -- -- -- -- -- -- -- -- -- -- 20
1 to 5 years................................................................................................................80 -- -- -- -- -- -- -- -- -- 20 -- -- 50
More than 5 years................................................................................................................120 -- -- -- -- -- -- -- -- -- -- -- -- 90
Race or ethnic origin:
White only................................................................................................................130 -- -- -- -- -- -- -- -- -- 20 -- -- 80
Black only................................................................................................................-- -- -- -- -- -- -- -- -- -- -- -- -- --
Hispanic or Latino only................................................................................................................-- -- -- -- -- -- -- -- -- -- -- -- -- --
Asian only................................................................................................................-- -- -- -- -- -- -- -- -- -- -- -- -- --
Native Hawaiian or other Pacific Islander only................................................................................................................-- -- -- -- -- -- -- -- -- -- -- -- -- --
American Indian or Alaskan Native only................................................................................................................-- -- -- -- -- -- -- -- -- -- -- -- -- --
Hispanic or Latino and other race................................................................................................................-- -- -- -- -- -- -- -- -- -- -- -- -- --
Multi-race................................................................................................................-- -- -- -- -- -- -- -- -- -- -- -- -- --
Not reported................................................................................................................80 -- -- -- -- -- -- -- -- -- 20 -- -- 60
in other industries.
4 Data for employers in rail transportation are provided to BLS by the Federal Railroad
Administration, U.S. Department of Transportation.
NOTE: Dashes indicate data that are not available. Because of rounding and data exclusion of
nonclassifiable responses, data may not sum to the totals.
SOURCE: Bureau of Labor Statistics, U. S. Department of Labor, Survey of Occupational Injuries
and Illnesses in cooperation with participating State agencies.
establishments not governed by the Mine Safety and Health Administration (MSHA) rules and reporting,
such as those in oil and gas extraction and related support activities. Data for mining operators in coal,
metal, and nonmetal mining areprovided to BLS by the Mine Safety and Health Administration, U.S. Department
of Labor. Independent mining contractors are excluded from the coal, metal,and nonmetal mining industries.
These data do not reflect the changes the Occupational Safety and Health Administration made to its recordkeeping
requirements effective January 1, 2002; therefore estimates for these industries are not comparable to estimates
2 Excludes farms with fewer than 11 employees.
3 Data for mining (Sector 21 in the North American Industry Classification System -- United States, 2007) include
Trade,
transport-
ation, and
utilities 4
Informa-
tion
Financial
activities
Profes-
sional and
business
services
Natural
resources
and mining 2,3
Construc-
tion
Other
services
Public
Administra-
tion
1 Days-away-from-work cases include those that result in days away from work with or without job
transfer or restriction.
Manufac-
turing
Total
service
providing
Education
and health
services
Leisure
and
hospitality
Nevada--state government
Characteristic
State
government2, 3, 4
Goods producing Service providing
Total
goods
producing

Table 2. Percent distribution of nonfatal occupational injuries and illnesses involving days away from work1 by selected worker characteristics and major industry sector, 2009
Total [230 cases]................................................................................................................100.0 -- -- -- -- -- -- -- -- -- 100.0 -- -- 100.0
Gender:
Male................................................................................................................73.9 -- -- -- -- -- -- -- -- -- -- -- -- 75.0
Female................................................................................................................26.1 -- -- -- -- -- -- -- -- -- 66.7 -- -- 25.0
Age:
14 to 15................................................................................................................-- -- -- -- -- -- -- -- -- -- -- -- -- --
16 to 19................................................................................................................-- -- -- -- -- -- -- -- -- -- -- -- -- --
20 to 24................................................................................................................-- -- -- -- -- -- -- -- -- -- -- -- -- --
25 to 34................................................................................................................13.0 -- -- -- -- -- -- -- -- -- -- -- -- 12.5
35 to 44................................................................................................................39.1 -- -- -- -- -- -- -- -- -- -- -- -- 50.0
45 to 54................................................................................................................26.1 -- -- -- -- -- -- -- -- -- -- -- -- 18.8
55 to 64................................................................................................................17.4 -- -- -- -- -- -- -- -- -- -- -- -- 12.5
65 and over................................................................................................................-- -- -- -- -- -- -- -- -- -- -- -- -- --
Length of service with employer:
Less than 3 months................................................................................................................-- -- -- -- -- -- -- -- -- -- -- -- -- --
3 to 11 months................................................................................................................13.0 -- -- -- -- -- -- -- -- -- -- -- -- 12.5
1 to 5 years................................................................................................................34.8 -- -- -- -- -- -- -- -- -- 66.7 -- -- 31.3
More than 5 years................................................................................................................52.2 -- -- -- -- -- -- -- -- -- -- -- -- 56.3
Race or ethnic origin:
White only................................................................................................................56.5 -- -- -- -- -- -- -- -- -- 66.7 -- -- 50.0
Black only................................................................................................................-- -- -- -- -- -- -- -- -- -- -- -- -- --
Hispanic or Latino only................................................................................................................-- -- -- -- -- -- -- -- -- -- -- -- -- --
Asian only................................................................................................................-- -- -- -- -- -- -- -- -- -- -- -- -- --
Native Hawaiian or other Pacific Islander only................................................................................................................-- -- -- -- -- -- -- -- -- -- -- -- -- --
American Indian or Alaskan Native only................................................................................................................-- -- -- -- -- -- -- -- -- -- -- -- -- --
Hispanic or Latino and other race................................................................................................................-- -- -- -- -- -- -- -- -- -- -- -- -- --
Multi-race................................................................................................................-- -- -- -- -- -- -- -- -- -- -- -- -- --
Not reported................................................................................................................34.8 -- -- -- -- -- -- -- -- -- 66.7 -- -- 37.5
in other industries.
4 Data for employers in rail transportation are provided to BLS by the Federal Railroad
Administration, U.S. Department of Transportation.
NOTE: Dashes indicate data that are not available. Because of rounding and data exclusion of
nonclassifiable responses, data may not sum to the totals.
SOURCE: Bureau of Labor Statistics, U. S. Department of Labor, Survey of Occupational Injuries
and Illnesses in cooperation with participating State agencies.
establishments not governed by the Mine Safety and Health Administration (MSHA) rules and reporting,
such as those in oil and gas extraction and related support activities. Data for mining operators in coal,
metal, and nonmetal mining areprovided to BLS by the Mine Safety and Health Administration, U.S. Department
of Labor. Independent mining contractors are excluded from the coal, metal,and nonmetal mining industries.
These data do not reflect the changes the Occupational Safety and Health Administration made to its recordkeeping
requirements effective January 1, 2002; therefore estimates for these industries are not comparable to estimates
2 Excludes farms with fewer than 11 employees.
3 Data for mining (Sector 21 in the North American Industry Classification System -- United States, 2007) include
Trade,
transport-
ation, and
utilities 4
Informa-
tion
Financial
activities
Profes-
sional and
business
services
Natural
resources
and mining 2,3
Construc-
tion
Other
services
Public
Administra-
tion
1 Days-away-from-work cases include those that result in days away from work with or without job
transfer or restriction.
Manufac-
turing
Total
service
providing
Education
and health
services
Leisure
and
hospitality
Nevada--state government
Characteristic
State
government2, 3, 4
Goods producing Service providing
Total
goods
producing

Table 3. Number of nonfatal occupational injuries and illnesses involving days away from work1 by major occupational group and major industry sector, 2009
Total…………………………………………………………………………………..230 -- -- -- -- -- -- -- -- -- 30 -- -- 160
Management occupations................................................................................................................-- -- -- -- -- -- -- -- -- -- -- -- -- --
Business and financial operations occupations................................................................................................................20 -- -- -- -- -- -- -- -- -- -- -- -- 20
Computer and mathematical occupations................................................................................................................-- -- -- -- -- -- -- -- -- -- -- -- -- --
Architecture and engineering occupations................................................................................................................-- -- -- -- -- -- -- -- -- -- -- -- -- --
Life, physical, and social science occupations................................................................................................................-- -- -- -- -- -- -- -- -- -- -- -- -- --
Community and social services occupations................................................................................................................30 -- -- -- -- -- -- -- -- -- -- -- -- 30
Legal occupations................................................................................................................-- -- -- -- -- -- -- -- -- -- -- -- -- --
Education, training, and library occupations................................................................................................................-- -- -- -- -- -- -- -- -- -- -- -- -- --
Healthcare practitioners and technical occupations................................................................................................................-- -- -- -- -- -- -- -- -- -- -- -- -- --
Protective service occupations................................................................................................................90 -- -- -- -- -- -- -- -- -- -- -- -- 80
Building and grounds cleaning
and maintenance occupations................................................................................................................-- -- -- -- -- -- -- -- -- -- -- -- -- --
Personal care and service occupations................................................................................................................-- -- -- -- -- -- -- -- -- -- -- -- -- --
Office and administrative support occupations................................................................................................................-- -- -- -- -- -- -- -- -- -- -- -- -- --
Farming, fishing, and forestry occupations................................................................................................................-- -- -- -- -- -- -- -- -- -- -- -- -- --
Construction and extraction occupations................................................................................................................20 -- -- -- -- -- -- -- -- -- -- -- -- --
Installation, maintenance, and repair occupations................................................................................................................-- -- -- -- -- -- -- -- -- -- -- -- -- --
Transportation and material moving occupations................................................................................................................20 -- -- -- -- -- -- -- -- -- -- -- -- --
in other industries.
4 Data for employers in rail transportation are provided to BLS by the Federal Railroad
Administration, U.S. Department of Transportation.
NOTE: Dashes indicate data that are not available. Because of rounding and data exclusion of
nonclassifiable responses, data may not sum to the totals.
SOURCE: Bureau of Labor Statistics, U. S. Department of Labor, Survey of Occupational Injuries
and Illnesses in cooperation with participating State agencies.
establishments not governed by the Mine Safety and Health Administration (MSHA) rules and reporting,
such as those in oil and gas extraction and related support activities. Data for mining operators in coal,
metal, and nonmetal mining areprovided to BLS by the Mine Safety and Health Administration, U.S. Department
of Labor. Independent mining contractors are excluded from the coal, metal,and nonmetal mining industries.
These data do not reflect the changes the Occupational Safety and Health Administration made to its recordkeeping
requirements effective January 1, 2002; therefore estimates for these industries are not comparable to estimates
2 Excludes farms with fewer than 11 employees.
3 Data for mining (Sector 21 in the North American Industry Classification System -- United States, 2007) include
Trade,
transport-
ation, and
utilities 4
Informa-
tion
Financial
activities
Profes-
sional and
business
services
Natural
resources
and mining 2,3
Construc-
tion
Other
services
Public
Administra-
tion
1 Days-away-from-work cases include those that result in days away from work with or without job
transfer or restriction.
Manufac-
turing
Total
service
providing
Education
and health
services
Leisure
and
hospitality
Nevada--state government
Occupation
State
government2, 3, 4
Goods producing Service providing
Total
goods
producing

Table 4. Number of nonfatal occupational injuries and illnesses involving days away from work1 by selected worker occupations and major industry sector, 2009
Total…………………………………………………………………………………..230 -- -- -- -- -- -- -- -- -- 30 -- -- 160
Correctional officers and jailers................................................................................................................50 -- -- -- -- -- -- -- -- -- -- -- -- 50
Police and sheriff's patrol officers................................................................................................................20 -- -- -- -- -- -- -- -- -- -- -- -- --
Highway maintenance workers................................................................................................................20 -- -- -- -- -- -- -- -- -- -- -- -- --
in other industries.
4 Data for employers in rail transportation are provided to BLS by the Federal Railroad
Administration, U.S. Department of Transportation.
NOTE: Dashes indicate data that are not available. Because of rounding and data exclusion of
nonclassifiable responses, data may not sum to the totals.
SOURCE: Bureau of Labor Statistics, U. S. Department of Labor, Survey of Occupational Injuries
and Illnesses in cooperation with participating State agencies.
establishments not governed by the Mine Safety and Health Administration (MSHA) rules and reporting,
such as those in oil and gas extraction and related support activities. Data for mining operators in coal,
metal, and nonmetal mining areprovided to BLS by the Mine Safety and Health Administration, U.S. Department
of Labor. Independent mining contractors are excluded from the coal, metal,and nonmetal mining industries.
These data do not reflect the changes the Occupational Safety and Health Administration made to its recordkeeping
requirements effective January 1, 2002; therefore estimates for these industries are not comparable to estimates
2 Excludes farms with fewer than 11 employees.
3 Data for mining (Sector 21 in the North American Industry Classification System -- United States, 2007) include
Trade,
transport-
ation, and
utilities 4
Informa-
tion
Financial
activities
Profes-
sional and
business
services
Natural
resources
and mining 2,3
Construc-
tion
Other
services
Public
Administra-
tion
1 Days-away-from-work cases include those that result in days away from work with or without job
transfer or restriction.
Manufac-
turing
Total
service
providing
Education
and health
services
Leisure
and
hospitality
Nevada--state government
Occupation
State
government2, 3, 4
Goods producing Service providing
Total
goods
producing

Table 5. Number of nonfatal occupational injuries and illnesses involving days away from work1 by selected injury or illness characteristics and major industry sector, 2009
Total...............................................................................................................230 -- -- -- -- -- -- -- -- -- 30 -- -- 160
Nature of injury, illness:
Sprains, strains...............................................................................................................110 -- -- -- -- -- -- -- -- -- -- -- -- 90
Bruises, contusions...............................................................................................................-- -- -- -- -- -- -- -- -- -- -- -- -- --
Cuts, lacerations...............................................................................................................-- -- -- -- -- -- -- -- -- -- -- -- -- --
Punctures...............................................................................................................-- -- -- -- -- -- -- -- -- -- -- -- -- --
Fractures...............................................................................................................-- -- -- -- -- -- -- -- -- -- -- -- -- --
Heat burns...............................................................................................................-- -- -- -- -- -- -- -- -- -- -- -- -- --
Carpal tunnel syndrome...............................................................................................................-- -- -- -- -- -- -- -- -- -- -- -- -- --
Tendonitis...............................................................................................................-- -- -- -- -- -- -- -- -- -- -- -- -- --
Chemical burns...............................................................................................................-- -- -- -- -- -- -- -- -- -- -- -- -- --
Amputations...............................................................................................................-- -- -- -- -- -- -- -- -- -- -- -- -- --
Multiple traumatic injuries...............................................................................................................30 -- -- -- -- -- -- -- -- -- -- -- -- --
Part of body affected:
Head...............................................................................................................20 -- -- -- -- -- -- -- -- -- -- -- -- --
Eye...............................................................................................................-- -- -- -- -- -- -- -- -- -- -- -- -- --
Neck...............................................................................................................-- -- -- -- -- -- -- -- -- -- -- -- -- --
Trunk...............................................................................................................90 -- -- -- -- -- -- -- -- -- -- -- -- 90
Shoulder...............................................................................................................-- -- -- -- -- -- -- -- -- -- -- -- -- --
Back...............................................................................................................50 -- -- -- -- -- -- -- -- -- -- -- -- 50
Upper extremities...............................................................................................................20 -- -- -- -- -- -- -- -- -- -- -- -- --
Arm...............................................................................................................-- -- -- -- -- -- -- -- -- -- -- -- -- --
Wrist...............................................................................................................-- -- -- -- -- -- -- -- -- -- -- -- -- --
Hand, except finger...............................................................................................................-- -- -- -- -- -- -- -- -- -- -- -- -- --
Finger...............................................................................................................-- -- -- -- -- -- -- -- -- -- -- -- -- --
Lower extremities...............................................................................................................50 -- -- -- -- -- -- -- -- -- 20 -- -- 30
Knee...............................................................................................................30 -- -- -- -- -- -- -- -- -- 20 -- -- --
Ankle...............................................................................................................-- -- -- -- -- -- -- -- -- -- -- -- -- --
Foot, except toe...............................................................................................................-- -- -- -- -- -- -- -- -- -- -- -- -- --
Toe...............................................................................................................-- -- -- -- -- -- -- -- -- -- -- -- -- --
Body systems...............................................................................................................-- -- -- -- -- -- -- -- -- -- -- -- -- --
Multiple parts...............................................................................................................40 -- -- -- -- -- -- -- -- -- -- -- -- 30
See footnotes at end of table.
Leisure
and
hospitality
Other
services
Public
Administra-
tion
Total
service
providing
Trade,
transport-
ation, and
utilities 4
Informa-
tion
Financial
activities
Profes-
sional and
business
services
Education
and health
services
Nevada--state government
Characteristic
State
government2, 3, 4
Goods producing Service providing
Total
goods
producing
Natural
resources
and mining 2,3
Construc-
tion
Manufac-
turing

Source of injury, illness:
Chemicals, chemical products...............................................................................................................-- -- -- -- -- -- -- -- -- -- -- -- -- --
Containers...............................................................................................................-- -- -- -- -- -- -- -- -- -- -- -- -- --
Furniture, fixtures...............................................................................................................-- -- -- -- -- -- -- -- -- -- -- -- -- --
Machinery...............................................................................................................-- -- -- -- -- -- -- -- -- -- -- -- -- --
Parts and materials...............................................................................................................-- -- -- -- -- -- -- -- -- -- -- -- -- --
Person, injured or ill worker...............................................................................................................40 -- -- -- -- -- -- -- -- -- -- -- -- 30
Worker motion or position...............................................................................................................40 -- -- -- -- -- -- -- -- -- -- -- -- 30
Floor, ground surfaces...............................................................................................................30 -- -- -- -- -- -- -- -- -- -- -- -- 20
Tools, instruments, and equipment...............................................................................................................40 -- -- -- -- -- -- -- -- -- -- -- -- 30
Vehicles...............................................................................................................30 -- -- -- -- -- -- -- -- -- -- -- -- --
Person, other than worker...............................................................................................................20 -- -- -- -- -- -- -- -- -- -- -- -- 20
Health care patient...............................................................................................................-- -- -- -- -- -- -- -- -- -- -- -- -- --
Event or exposure:
Contact with object, equipment...............................................................................................................30 -- -- -- -- -- -- -- -- -- -- -- -- --
Struck by object...............................................................................................................-- -- -- -- -- -- -- -- -- -- -- -- -- --
Struck against object...............................................................................................................20 -- -- -- -- -- -- -- -- -- -- -- -- --
Caught in object, equipment, material...............................................................................................................-- -- -- -- -- -- -- -- -- -- -- -- -- --
Fall to lower level...............................................................................................................-- -- -- -- -- -- -- -- -- -- -- -- -- --
Fall on same level...............................................................................................................30 -- -- -- -- -- -- -- -- -- -- -- -- 20
Slips, trips...............................................................................................................-- -- -- -- -- -- -- -- -- -- -- -- -- --
Overexertion...............................................................................................................70 -- -- -- -- -- -- -- -- -- -- -- -- 60
Overexertion in lifting...............................................................................................................30 -- -- -- -- -- -- -- -- -- -- -- -- 30
Repetitive motion...............................................................................................................-- -- -- -- -- -- -- -- -- -- -- -- -- --
Exposed to harmful substance...............................................................................................................-- -- -- -- -- -- -- -- -- -- -- -- -- --
Transportation accidents...............................................................................................................30 -- -- -- -- -- -- -- -- -- -- -- -- --
Highway accident...............................................................................................................-- -- -- -- -- -- -- -- -- -- -- -- -- --
Fires, explosions...............................................................................................................-- -- -- -- -- -- -- -- -- -- -- -- -- --
Assault, violent act...............................................................................................................20 -- -- -- -- -- -- -- -- -- -- -- -- 20
by person...............................................................................................................20 -- -- -- -- -- -- -- -- -- -- -- -- 20
by animal...............................................................................................................-- -- -- -- -- -- -- -- -- -- -- -- -- --
1 Days-away-from-work cases include those that result in days away from work with or without job transfer effective January 1, 2002: therefore estimates for these industries are not comparable to
or restriction. estimates in other industries.
2 Excludes farms with fewer than 11 employees.
4 Data for employers in rail transportation are provided to BLS by the Federal Railroad
3 Data for mining (Sector 21 in the North American Industry Classification System -- United States, 2007) include Administration, U.S. Department of Transportation.
establishments not governed by the Mine Safety and Health Administration (MSHA) rules and reporting, such NOTE: Dashes indicate data that are not available. Because of rounding and data
as those in oil and gas extraction and related support activities. Data for mining operators in coal, metal, and exclusion of nonclassifiable responses, data may not sum to the totals.
nonmetal mining are provided to BLS by the Mine Safety and Health Administration, U.S. Department of Labor.
Independent mining contractors are excluded from the coal, metal, and nonmetal mining industries. These data SOURCE: Bureau of Labor Statistics, U. S. Department of Labor, Survey of
do not reflect the changes the Occupational Safety and Health Administration made to its recordkeeping requirements Occupational Injuries and Illnesses in cooperation with participating State agencies.
Profes-
sional and
business
services
Construc-
tion
Education
and health
services
Leisure
and
hospitality
Other
services
Public
Administra-
tion
Manufac-
turing
Total
service
providing
Trade,
transport-
ation, and
utilities 4
Informa-
tion
Financial
activities
Nevada--state government
Characteristic
State
government2, 3, 4
Goods producing Service providing
Total
goods
producing
Natural
resources
and mining 2,3
Table 5. Number of nonfatal occupational injuries and illnesses involving days away from work1 by selected injury or illness characteristics and major industry sector, 2009 -- Continued
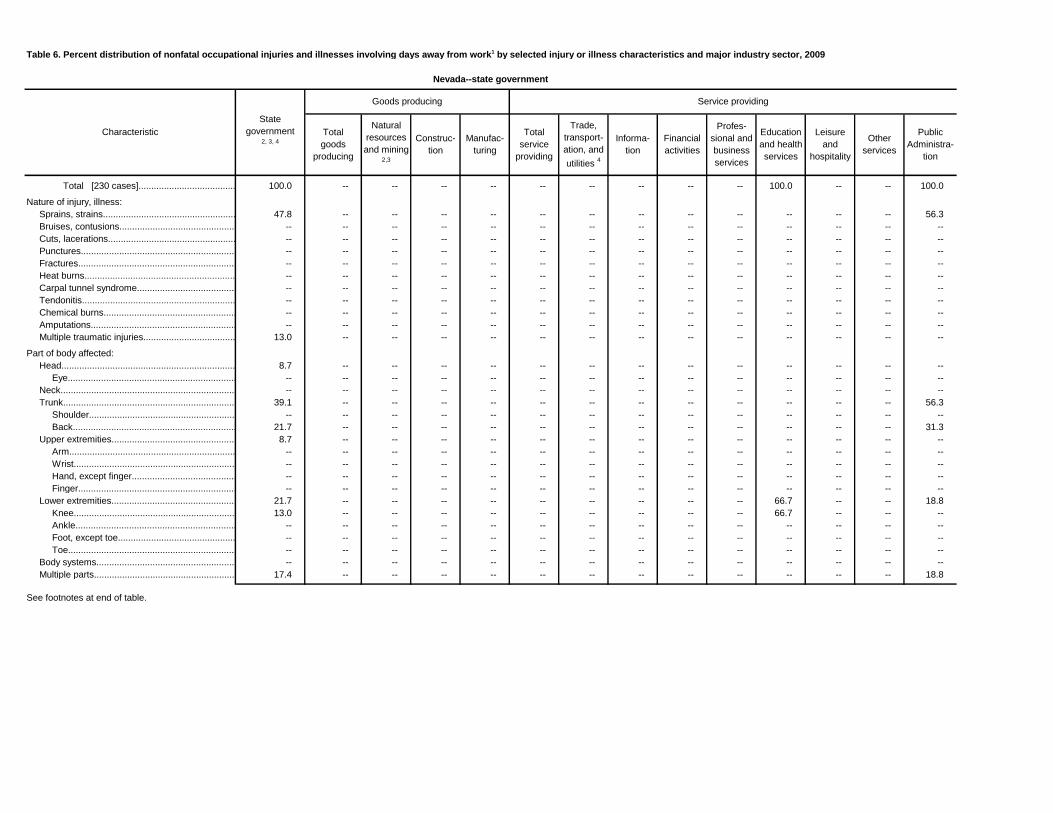
Table 6. Percent distribution of nonfatal occupational injuries and illnesses involving days away from work1 by selected injury or illness characteristics and major industry sector, 2009
Total [230 cases]...............................................................................................................100.0 -- -- -- -- -- -- -- -- -- 100.0 -- -- 100.0
Nature of injury, illness:
Sprains, strains...............................................................................................................47.8 -- -- -- -- -- -- -- -- -- -- -- -- 56.3
Bruises, contusions...............................................................................................................-- -- -- -- -- -- -- -- -- -- -- -- -- --
Cuts, lacerations...............................................................................................................-- -- -- -- -- -- -- -- -- -- -- -- -- --
Punctures...............................................................................................................-- -- -- -- -- -- -- -- -- -- -- -- -- --
Fractures...............................................................................................................-- -- -- -- -- -- -- -- -- -- -- -- -- --
Heat burns...............................................................................................................-- -- -- -- -- -- -- -- -- -- -- -- -- --
Carpal tunnel syndrome...............................................................................................................-- -- -- -- -- -- -- -- -- -- -- -- -- --
Tendonitis...............................................................................................................-- -- -- -- -- -- -- -- -- -- -- -- -- --
Chemical burns...............................................................................................................-- -- -- -- -- -- -- -- -- -- -- -- -- --
Amputations...............................................................................................................-- -- -- -- -- -- -- -- -- -- -- -- -- --
Multiple traumatic injuries...............................................................................................................13.0 -- -- -- -- -- -- -- -- -- -- -- -- --
Part of body affected:
Head...............................................................................................................8.7 -- -- -- -- -- -- -- -- -- -- -- -- --
Eye...............................................................................................................-- -- -- -- -- -- -- -- -- -- -- -- -- --
Neck...............................................................................................................-- -- -- -- -- -- -- -- -- -- -- -- -- --
Trunk...............................................................................................................39.1 -- -- -- -- -- -- -- -- -- -- -- -- 56.3
Shoulder...............................................................................................................-- -- -- -- -- -- -- -- -- -- -- -- -- --
Back...............................................................................................................21.7 -- -- -- -- -- -- -- -- -- -- -- -- 31.3
Upper extremities...............................................................................................................8.7 -- -- -- -- -- -- -- -- -- -- -- -- --
Arm...............................................................................................................-- -- -- -- -- -- -- -- -- -- -- -- -- --
Wrist...............................................................................................................-- -- -- -- -- -- -- -- -- -- -- -- -- --
Hand, except finger...............................................................................................................-- -- -- -- -- -- -- -- -- -- -- -- -- --
Finger...............................................................................................................-- -- -- -- -- -- -- -- -- -- -- -- -- --
Lower extremities...............................................................................................................21.7 -- -- -- -- -- -- -- -- -- 66.7 -- -- 18.8
Knee...............................................................................................................13.0 -- -- -- -- -- -- -- -- -- 66.7 -- -- --
Ankle...............................................................................................................-- -- -- -- -- -- -- -- -- -- -- -- -- --
Foot, except toe...............................................................................................................-- -- -- -- -- -- -- -- -- -- -- -- -- --
Toe...............................................................................................................-- -- -- -- -- -- -- -- -- -- -- -- -- --
Body systems...............................................................................................................-- -- -- -- -- -- -- -- -- -- -- -- -- --
Multiple parts...............................................................................................................17.4 -- -- -- -- -- -- -- -- -- -- -- -- 18.8
See footnotes at end of table.
Other
services
Public
Administra-
tion
Trade,
transport-
ation, and
utilities 4
Informa-
tion
Financial
activities
Profes-
sional and
business
services
Education
and health
services
Leisure
and
hospitality
Nevada--state government
Characteristic
State
government2, 3, 4
Goods producing Service providing
Total
goods
producing
Natural
resources
and mining 2,3
Construc-
tion
Manufac-
turing
Total
service
providing
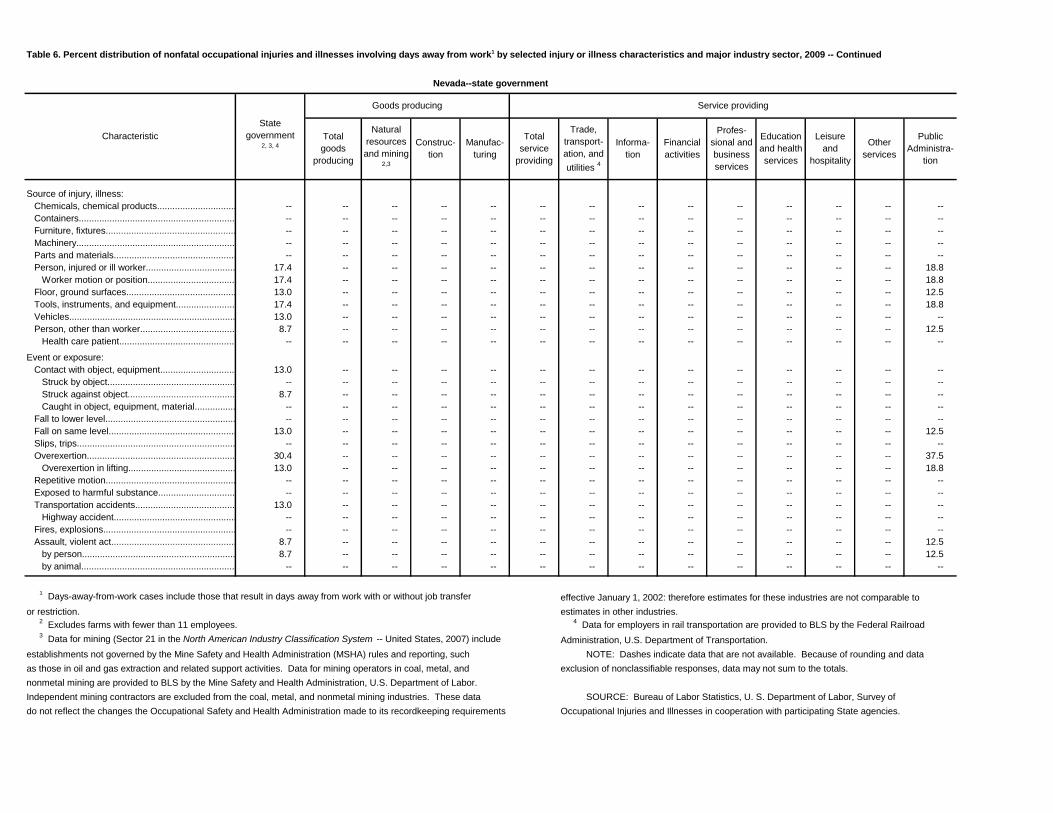
Table 6. Percent distribution of nonfatal occupational injuries and illnesses involving days away from work1 by selected injury or illness characteristics and major industry sector, 2009 -- Continued
Source of injury, illness:
Chemicals, chemical products...............................................................................................................-- -- -- -- -- -- -- -- -- -- -- -- -- --
Containers...............................................................................................................-- -- -- -- -- -- -- -- -- -- -- -- -- --
Furniture, fixtures...............................................................................................................-- -- -- -- -- -- -- -- -- -- -- -- -- --
Machinery...............................................................................................................-- -- -- -- -- -- -- -- -- -- -- -- -- --
Parts and materials...............................................................................................................-- -- -- -- -- -- -- -- -- -- -- -- -- --
Person, injured or ill worker...............................................................................................................17.4 -- -- -- -- -- -- -- -- -- -- -- -- 18.8
Worker motion or position...............................................................................................................17.4 -- -- -- -- -- -- -- -- -- -- -- -- 18.8
Floor, ground surfaces...............................................................................................................13.0 -- -- -- -- -- -- -- -- -- -- -- -- 12.5
Tools, instruments, and equipment...............................................................................................................17.4 -- -- -- -- -- -- -- -- -- -- -- -- 18.8
Vehicles...............................................................................................................13.0 -- -- -- -- -- -- -- -- -- -- -- -- --
Person, other than worker...............................................................................................................8.7 -- -- -- -- -- -- -- -- -- -- -- -- 12.5
Health care patient...............................................................................................................-- -- -- -- -- -- -- -- -- -- -- -- -- --
Event or exposure:
Contact with object, equipment...............................................................................................................13.0 -- -- -- -- -- -- -- -- -- -- -- -- --
Struck by object...............................................................................................................-- -- -- -- -- -- -- -- -- -- -- -- -- --
Struck against object...............................................................................................................8.7 -- -- -- -- -- -- -- -- -- -- -- -- --
Caught in object, equipment, material...............................................................................................................-- -- -- -- -- -- -- -- -- -- -- -- -- --
Fall to lower level...............................................................................................................-- -- -- -- -- -- -- -- -- -- -- -- -- --
Fall on same level...............................................................................................................13.0 -- -- -- -- -- -- -- -- -- -- -- -- 12.5
Slips, trips...............................................................................................................-- -- -- -- -- -- -- -- -- -- -- -- -- --
Overexertion...............................................................................................................30.4 -- -- -- -- -- -- -- -- -- -- -- -- 37.5
Overexertion in lifting...............................................................................................................13.0 -- -- -- -- -- -- -- -- -- -- -- -- 18.8
Repetitive motion...............................................................................................................-- -- -- -- -- -- -- -- -- -- -- -- -- --
Exposed to harmful substance...............................................................................................................-- -- -- -- -- -- -- -- -- -- -- -- -- --
Transportation accidents...............................................................................................................13.0 -- -- -- -- -- -- -- -- -- -- -- -- --
Highway accident...............................................................................................................-- -- -- -- -- -- -- -- -- -- -- -- -- --
Fires, explosions...............................................................................................................-- -- -- -- -- -- -- -- -- -- -- -- -- --
Assault, violent act...............................................................................................................8.7 -- -- -- -- -- -- -- -- -- -- -- -- 12.5
by person...............................................................................................................8.7 -- -- -- -- -- -- -- -- -- -- -- -- 12.5
by animal...............................................................................................................-- -- -- -- -- -- -- -- -- -- -- -- -- --
1 Days-away-from-work cases include those that result in days away from work with or without job transfer effective January 1, 2002: therefore estimates for these industries are not comparable to
or restriction. estimates in other industries.
2 Excludes farms with fewer than 11 employees.
4 Data for employers in rail transportation are provided to BLS by the Federal Railroad
3 Data for mining (Sector 21 in the North American Industry Classification System -- United States, 2007) include Administration, U.S. Department of Transportation.
establishments not governed by the Mine Safety and Health Administration (MSHA) rules and reporting, such NOTE: Dashes indicate data that are not available. Because of rounding and data
as those in oil and gas extraction and related support activities. Data for mining operators in coal, metal, and exclusion of nonclassifiable responses, data may not sum to the totals.
nonmetal mining are provided to BLS by the Mine Safety and Health Administration, U.S. Department of Labor.
Independent mining contractors are excluded from the coal, metal, and nonmetal mining industries. These data SOURCE: Bureau of Labor Statistics, U. S. Department of Labor, Survey of
do not reflect the changes the Occupational Safety and Health Administration made to its recordkeeping requirements Occupational Injuries and Illnesses in cooperation with participating State agencies.
Education
and health
services
Leisure
and
hospitality
Other
services
Public
Administra-
tion
Manufac-
turing
Total
service
providing
Trade,
transport-
ation, and
utilities 4
Informa-
tion
Financial
activities
Profes-
sional and
business
services
Nevada--state government
Characteristic
State
government2, 3, 4
Goods producing Service providing
Total
goods
producing
Natural
resources
and mining 2,3
Construc-
tion

Table 7. Incidence rates1 for nonfatal occupational injuries and illnesses involving days away from work2 per 10,000 full-time workers for selected characteristics and major
industry sector, 2009
Total [230 cases]...............................................................................................................84.3 -- -- -- -- -- -- -- -- -- 26.1 -- -- 116.2
Nature of injury, illness:
Sprains, strains...............................................................................................................40.1 -- -- -- -- -- -- -- -- -- -- -- -- 67.5
Bruises, contusions...............................................................................................................-- -- -- -- -- -- -- -- -- -- -- -- -- --
Cuts, lacerations...............................................................................................................-- -- -- -- -- -- -- -- -- -- -- -- -- --
Punctures...............................................................................................................-- -- -- -- -- -- -- -- -- -- -- -- -- --
Fractures...............................................................................................................-- -- -- -- -- -- -- -- -- -- -- -- -- --
Heat burns...............................................................................................................-- -- -- -- -- -- -- -- -- -- -- -- -- --
Carpal tunnel syndrome...............................................................................................................-- -- -- -- -- -- -- -- -- -- -- -- -- --
Tendonitis...............................................................................................................-- -- -- -- -- -- -- -- -- -- -- -- -- --
Chemical burns...............................................................................................................-- -- -- -- -- -- -- -- -- -- -- -- -- --
Amputations...............................................................................................................-- -- -- -- -- -- -- -- -- -- -- -- -- --
Multiple traumatic injuries...............................................................................................................12.6 -- -- -- -- -- -- -- -- -- -- -- -- --
Part of body affected:
Head...............................................................................................................8.0 -- -- -- -- -- -- -- -- -- -- -- -- --
Eye...............................................................................................................-- -- -- -- -- -- -- -- -- -- -- -- -- --
Neck...............................................................................................................-- -- -- -- -- -- -- -- -- -- -- -- -- --
Trunk...............................................................................................................34.1 -- -- -- -- -- -- -- -- -- -- -- -- 62.0
Shoulder...............................................................................................................-- -- -- -- -- -- -- -- -- -- -- -- -- --
Back...............................................................................................................19.5 -- -- -- -- -- -- -- -- -- -- -- -- 36.0
Upper extremities...............................................................................................................6.9 -- -- -- -- -- -- -- -- -- -- -- -- --
Arm...............................................................................................................-- -- -- -- -- -- -- -- -- -- -- -- -- --
Wrist...............................................................................................................-- -- -- -- -- -- -- -- -- -- -- -- -- --
Hand, except finger...............................................................................................................-- -- -- -- -- -- -- -- -- -- -- -- -- --
Finger...............................................................................................................-- -- -- -- -- -- -- -- -- -- -- -- -- --
Lower extremities...............................................................................................................19.6 -- -- -- -- -- -- -- -- -- 16.0 -- -- 20.9
Knee...............................................................................................................11.6 -- -- -- -- -- -- -- -- -- 16.0 -- -- --
Ankle...............................................................................................................-- -- -- -- -- -- -- -- -- -- -- -- -- --
Foot, except toe...............................................................................................................-- -- -- -- -- -- -- -- -- -- -- -- -- --
Toe...............................................................................................................-- -- -- -- -- -- -- -- -- -- -- -- -- --
Body systems...............................................................................................................-- -- -- -- -- -- -- -- -- -- -- -- -- --
Multiple parts...............................................................................................................13.9 -- -- -- -- -- -- -- -- -- -- -- -- 18.2
See footnotes at end of table.
Other
services
Public
Administra-
tion
Trade,
transport-
ation, and
utilities 5
Informa-
tion
Financial
activities
Profes-
sional and
business
services
Manufac-
turing
Total
service
providing
Education
and health
services
Leisure
and
hospitality
Nevada--state government
Characteristic
State
government2, 3, 4
Goods producing Service providing
Total
goods
producing
Natural
resources
and mining 3,4
Construc-
tion

Table 7. Incidence rates1 for nonfatal occupational injuries and illnesses involving days away from work2 per 10,000 full-time workers for selected characteristics and major
industry sector, 2009 --- Continued
Source of injury, illness:
Chemicals, chemical products...............................................................................................................-- -- -- -- -- -- -- -- -- -- -- -- -- --
Containers...............................................................................................................-- -- -- -- -- -- -- -- -- -- -- -- -- --
Furniture, fixtures...............................................................................................................-- -- -- -- -- -- -- -- -- -- -- -- -- --
Machinery...............................................................................................................-- -- -- -- -- -- -- -- -- -- -- -- -- --
Parts and materials...............................................................................................................-- -- -- -- -- -- -- -- -- -- -- -- -- --
Person, injured or ill worker...............................................................................................................13.8 -- -- -- -- -- -- -- -- -- -- -- -- 19.5
Worker motion or position...............................................................................................................13.2 -- -- -- -- -- -- -- -- -- -- -- -- 18.4
Floor, ground surfaces...............................................................................................................12.5 -- -- -- -- -- -- -- -- -- -- -- -- 17.6
Tools, instruments, and equipment...............................................................................................................15.2 -- -- -- -- -- -- -- -- -- -- -- -- 23.1
Vehicles...............................................................................................................12.3 -- -- -- -- -- -- -- -- -- -- -- -- --
Person, other than worker...............................................................................................................7.0 -- -- -- -- -- -- -- -- -- -- -- -- 13.3
Health care patient...............................................................................................................-- -- -- -- -- -- -- -- -- -- -- -- -- --
Event or exposure:
Contact with object, equipment...............................................................................................................10.2 -- -- -- -- -- -- -- -- -- -- -- -- --
Struck by object...............................................................................................................-- -- -- -- -- -- -- -- -- -- -- -- -- --
Struck against object...............................................................................................................5.8 -- -- -- -- -- -- -- -- -- -- -- -- --
Caught in object, equipment, material...............................................................................................................-- -- -- -- -- -- -- -- -- -- -- -- -- --
Fall to lower level...............................................................................................................-- -- -- -- -- -- -- -- -- -- -- -- -- --
Fall on same level...............................................................................................................10.1 -- -- -- -- -- -- -- -- -- -- -- -- 16.4
Slips, trips...............................................................................................................-- -- -- -- -- -- -- -- -- -- -- -- -- --
Overexertion...............................................................................................................23.9 -- -- -- -- -- -- -- -- -- -- -- -- 43.9
Overexertion in lifting...............................................................................................................10.4 -- -- -- -- -- -- -- -- -- -- -- -- 20.8
Repetitive motion...............................................................................................................-- -- -- -- -- -- -- -- -- -- -- -- -- --
Exposed to harmful substance...............................................................................................................-- -- -- -- -- -- -- -- -- -- -- -- -- --
Transportation accidents...............................................................................................................10.1 -- -- -- -- -- -- -- -- -- -- -- -- --
Highway accident...............................................................................................................-- -- -- -- -- -- -- -- -- -- -- -- -- --
Fires, explosions...............................................................................................................-- -- -- -- -- -- -- -- -- -- -- -- -- --
Assault, violent act...............................................................................................................8.3 -- -- -- -- -- -- -- -- -- -- -- -- 15.0
by person...............................................................................................................6.7 -- -- -- -- -- -- -- -- -- -- -- -- 13.3
by animal...............................................................................................................-- -- -- -- -- -- -- -- -- -- -- -- -- --
reporting, such as those in oil and gas extraction and related support activities. Data for mining operators
in coal, metal, and nonmetal mining are provided to BLS by the Mine Safety and Health Administration,
U.S. Department of Labor. Independent mining contractors are excluded from the coal, metal, and
nonmetal mining industries. These data do not reflect the changes the Occupational Safety and
Health Administration made to its recordkeeping requirements effective January 1, 2002; therefore
estimates for these industries are not comparable to estimates in other industries.
5 Data for employers in rail transportation are provided to BLS by the Federal Railroad
Administration, U.S. Department of Transportation.
NOTE: Dashes indicate data that are not available. Because of rounding and data exclusion of
nonclassifiable responses, data may not sum to the totals.
SOURCE: Bureau of Labor Statistics, U. S. Department of Labor, Survey of Occupational Injuries
and Illnesses in cooperation with participating State agencies.
transfer or restriction.
3 Excludes farms with fewer than 11 employees.
4 Data for mining (Sector 21 in the North American Industry Classification System -- United States, 2007)
include establishments not governed by the Mine Safety and Health Administration (MSHA) rules and
N = number of injuries and illnesses
EH = total hours worked by all employees during calendar year
20,000,000 = base for 10,000 equivalent full-time workers (working 40 hours per week,
50 weeks per year).
2 Days-away-from-work cases include those that result in days away from work with or without job
Other
services
Public
Administra-
tion
1 Incidence rates represent the number of injuries and illnesses per 10,000 full-time workers and were
calculated as: (N/EH) x 20,000,000 where
Manufac-
turing
Total
service
providing
Trade,
transport-
ation, and
utilities 5
Informa-
tion
Nevada--state government
Characteristic
State
government2, 3, 4
Goods producing Service providing
Total
goods
producing
Education
and health
services
Leisure
and
hospitality
Natural
resources
and mining 3,4
Construc-
tion
Financial
activities
Profes-
sional and
business
services

Table 8. Percent distribution of nonfatal occupational injuries and illnesses involving days away from work1 by selected worker characteristics and number of days away
from work, 2009
Total [230 cases]...............................................................................................................100.0 26.1 17.4 17.4 8.7 8.7 -- 21.7 4
Gender:
Male...............................................................................................................100.0 23.5 23.5 17.6 11.8 -- -- 23.5 4
Female...............................................................................................................100.0 33.3 -- -- -- -- -- -- 5
Age:
14 to 15...............................................................................................................-- -- -- -- -- -- -- -- --
16 to 19...............................................................................................................-- -- -- -- -- -- -- -- --
20 to 24...............................................................................................................-- -- -- -- -- -- -- -- --
25 to 34...............................................................................................................100.0 -- -- -- -- -- -- -- 2
35 to 44...............................................................................................................100.0 -- -- -- -- -- -- 33.3 4
45 to 54...............................................................................................................100.0 33.3 -- -- -- -- -- 33.3 4
55 to 64...............................................................................................................100.0 -- -- -- -- -- -- -- 5
65 and over...............................................................................................................-- -- -- -- -- -- -- -- --
Length of service with employer:
Less than 3 months...............................................................................................................-- -- -- -- -- -- -- -- --
3 to 11 months...............................................................................................................100.0 -- -- -- -- -- -- -- 4
1 to 5 years...............................................................................................................100.0 25.0 -- -- -- -- -- -- 5
More than 5 years...............................................................................................................100.0 16.7 33.3 16.7 -- -- -- 25.0 4
Race or ethnic origin:
White only...............................................................................................................100.0 23.1 23.1 -- -- -- -- 30.8 5
Black only...............................................................................................................-- -- -- -- -- -- -- -- --
Hispanic or Latino only...............................................................................................................-- -- -- -- -- -- -- -- --
Asian only...............................................................................................................-- -- -- -- -- -- -- -- --
Native Hawaiian or other Pacific Islander only...............................................................................................................-- -- -- -- -- -- -- -- --
American Indian or Alaskan Native only...............................................................................................................-- -- -- -- -- -- -- -- --
Hispanic or Latino and other race...............................................................................................................-- -- -- -- -- -- -- -- --
Multi-race...............................................................................................................-- -- -- -- -- -- -- -- --
NOTE: Dashes indicate data that are not available. Because of rounding and data exclusion of
nonclassifiable responses, data may not sum to the totals.
21 to 30
days
31 days
or more
1 Days-away-from-work cases include those that result in days away from work with or without job SOURCE: Bureau of Labor Statistics, U. S. Department of Labor, Survey of Occupational
transfer or restriction. Injuries and Illnesses in cooperation with participating State agencies.
Nevada--state government
Characteristic
Percent of cases involving
Median
days away
from workTotal
cases1 day 2 days
3 to 5
days
6 to 10
days
11 to 20
days
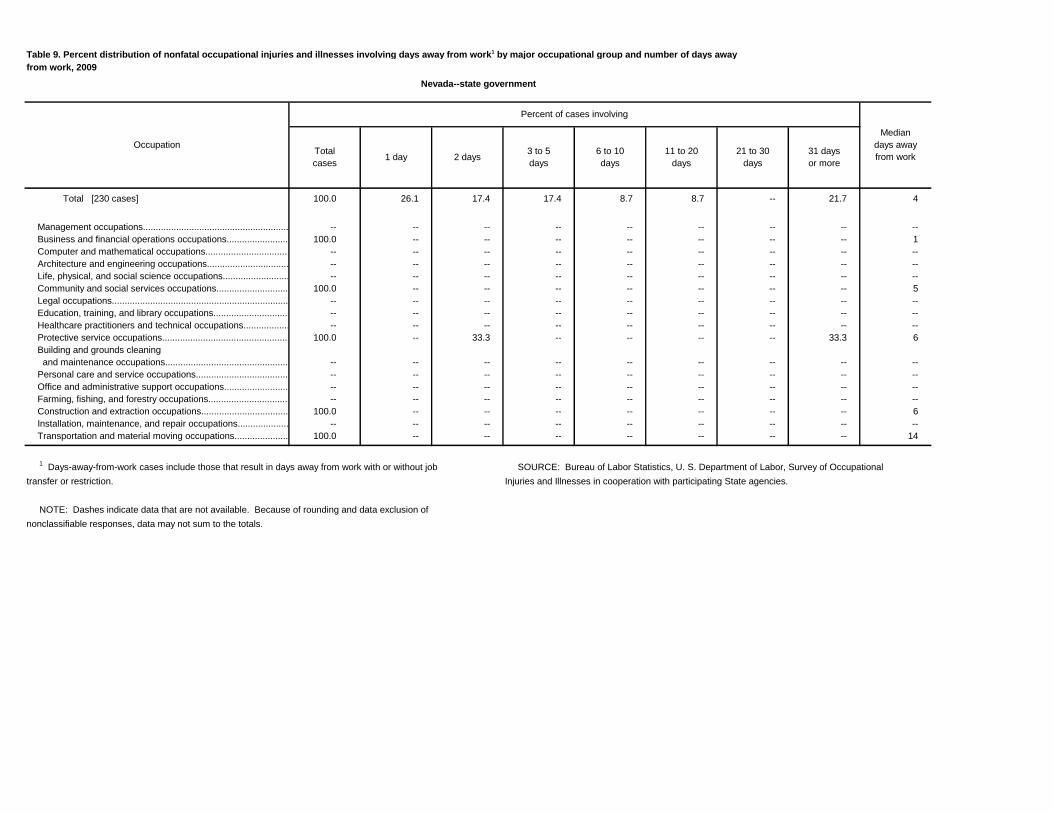
Table 9. Percent distribution of nonfatal occupational injuries and illnesses involving days away from work1 by major occupational group and number of days away
from work, 2009
Total [230 cases] 100.0 26.1 17.4 17.4 8.7 8.7 -- 21.7 4
Management occupations................................................................................................................-- -- -- -- -- -- -- -- --
Business and financial operations occupations................................................................................................................100.0 -- -- -- -- -- -- -- 1
Computer and mathematical occupations................................................................................................................-- -- -- -- -- -- -- -- --
Architecture and engineering occupations................................................................................................................-- -- -- -- -- -- -- -- --
Life, physical, and social science occupations................................................................................................................-- -- -- -- -- -- -- -- --
Community and social services occupations................................................................................................................100.0 -- -- -- -- -- -- -- 5
Legal occupations................................................................................................................-- -- -- -- -- -- -- -- --
Education, training, and library occupations................................................................................................................-- -- -- -- -- -- -- -- --
Healthcare practitioners and technical occupations................................................................................................................-- -- -- -- -- -- -- -- --
Protective service occupations................................................................................................................100.0 -- 33.3 -- -- -- -- 33.3 6
Building and grounds cleaning
and maintenance occupations................................................................................................................-- -- -- -- -- -- -- -- --
Personal care and service occupations................................................................................................................-- -- -- -- -- -- -- -- --
Office and administrative support occupations................................................................................................................-- -- -- -- -- -- -- -- --
Farming, fishing, and forestry occupations................................................................................................................-- -- -- -- -- -- -- -- --
Construction and extraction occupations................................................................................................................100.0 -- -- -- -- -- -- -- 6
Installation, maintenance, and repair occupations................................................................................................................-- -- -- -- -- -- -- -- --
Transportation and material moving occupations................................................................................................................100.0 -- -- -- -- -- -- -- 14
NOTE: Dashes indicate data that are not available. Because of rounding and data exclusion of
nonclassifiable responses, data may not sum to the totals.
21 to 30
days
31 days
or more
1 Days-away-from-work cases include those that result in days away from work with or without job SOURCE: Bureau of Labor Statistics, U. S. Department of Labor, Survey of Occupational
transfer or restriction. Injuries and Illnesses in cooperation with participating State agencies.
Nevada--state government
Occupation
Percent of cases involving
Median
days away
from workTotal
cases1 day 2 days
3 to 5
days
6 to 10
days
11 to 20
days

Table 10. Percent distribution of nonfatal occupational injuries and illnesses involving days away from work1 by selected occupations and number of days away
from work, 2009
Total [230 cases] 100.0 26.1 17.4 17.4 8.7 8.7 -- 21.7 4
Correctional officers and jailers................................................................................................................100.0 -- -- -- -- -- -- -- 23
Police and sheriff's patrol officers................................................................................................................100.0 -- -- -- -- -- -- -- 5
Highway maintenance workers................................................................................................................100.0 -- -- -- -- -- -- -- 6
NOTE: Dashes indicate data that are not available. Because of rounding and data exclusion of
nonclassifiable responses, data may not sum to the totals.
21 to 30
days
31 days
or more
1 Days-away-from-work cases include those that result in days away from work with or without job SOURCE: Bureau of Labor Statistics, U. S. Department of Labor, Survey of Occupational
transfer or restriction. Injuries and Illnesses in cooperation with participating State agencies.
Nevada--state government
Occupation
Percent of cases involving
Median
days away
from workTotal
cases1 day 2 days
3 to 5
days
6 to 10
days
11 to 20
days

Table 11. Percent distribution of nonfatal occupational injuries and illnesses involving days away from work1 by selected injury or illness characteristics and number of days
away from work, 2009
Total [230 cases]...............................................................................................................100.0 26.1 17.4 17.4 8.7 8.7 -- 21.7 4
Nature of injury, illness:
Sprains, strains...............................................................................................................100.0 -- 36.4 -- -- -- -- 36.4 4
Bruises, contusions...............................................................................................................-- -- -- -- -- -- -- -- --
Cuts, lacerations...............................................................................................................-- -- -- -- -- -- -- -- --
Punctures...............................................................................................................-- -- -- -- -- -- -- -- --
Fractures...............................................................................................................-- -- -- -- -- -- -- -- --
Heat burns...............................................................................................................-- -- -- -- -- -- -- -- --
Carpal tunnel syndrome...............................................................................................................-- -- -- -- -- -- -- -- --
Tendonitis...............................................................................................................-- -- -- -- -- -- -- -- --
Chemical burns...............................................................................................................-- -- -- -- -- -- -- -- --
Amputations...............................................................................................................-- -- -- -- -- -- -- -- --
Multiple traumatic injuries...............................................................................................................100.0 -- -- -- -- -- -- -- 6
Part of body affected:
Head...............................................................................................................100.0 -- -- -- -- -- -- -- 2
Eye...............................................................................................................-- -- -- -- -- -- -- -- --
Neck...............................................................................................................-- -- -- -- -- -- -- -- --
Trunk...............................................................................................................100.0 22.2 33.3 -- -- -- -- 33.3 2
Shoulder...............................................................................................................-- -- -- -- -- -- -- -- --
Back...............................................................................................................100.0 40.0 -- -- -- -- -- 60.0 44
Upper extremities...............................................................................................................100.0 -- -- -- -- -- -- -- 3
Arm...............................................................................................................-- -- -- -- -- -- -- -- --
Wrist...............................................................................................................-- -- -- -- -- -- -- -- --
Hand, except finger...............................................................................................................-- -- -- -- -- -- -- -- --
Finger...............................................................................................................-- -- -- -- -- -- -- -- --
Lower extremities...............................................................................................................100.0 -- -- -- -- -- -- -- 11
Knee...............................................................................................................100.0 -- -- -- -- -- -- -- 14
Ankle...............................................................................................................-- -- -- -- -- -- -- -- --
Foot, except toe...............................................................................................................-- -- -- -- -- -- -- -- --
Toe...............................................................................................................-- -- -- -- -- -- -- -- --
Body systems...............................................................................................................-- -- -- -- -- -- -- -- --
Multiple parts...............................................................................................................100.0 -- -- -- -- -- -- -- 5
See footnotes at end of table.
6 to 10
days
21 to 30
days
31 days
or more
11 to 20
days
Nevada--state government
Characteristic
Percent of cases involving
Median
days away
from workTotal
cases1 day 2 days
3 to 5
days

Table 11. Percent distribution of nonfatal occupational injuries and illnesses involving days away from work1 by selected injury or illness characteristics and number of days
away from work, 2009 -- Continued
Source of injury, illness:
Chemicals, chemical products...............................................................................................................-- -- -- -- -- -- -- -- --
Containers...............................................................................................................-- -- -- -- -- -- -- -- --
Furniture, fixtures...............................................................................................................-- -- -- -- -- -- -- -- --
Machinery...............................................................................................................-- -- -- -- -- -- -- -- --
Parts and materials...............................................................................................................-- -- -- -- -- -- -- -- --
Person, injured or ill worker...............................................................................................................100.0 -- -- -- -- -- -- -- 4
Worker motion or position...............................................................................................................100.0 -- -- -- -- -- -- -- 4
Floor, ground surfaces...............................................................................................................100.0 -- -- -- -- -- -- -- 6
Tools, instruments, and equipment...............................................................................................................100.0 -- -- -- -- -- -- 75.0 44
Vehicles...............................................................................................................100.0 -- -- -- -- -- -- -- 5
Person, other than worker...............................................................................................................100.0 -- -- -- -- -- -- -- 6
Health care patient...............................................................................................................-- -- -- -- -- -- -- -- --
Event or exposure:
Contact with object, equipment...............................................................................................................100.0 66.7 -- -- -- -- -- -- 1
Struck by object...............................................................................................................-- -- -- -- -- -- -- -- --
Struck against object...............................................................................................................100.0 -- -- -- -- -- -- -- 1
Caught in object, equipment, material...............................................................................................................-- -- -- -- -- -- -- -- --
Fall to lower level...............................................................................................................-- -- -- -- -- -- -- -- --
Fall on same level...............................................................................................................100.0 -- -- -- -- -- -- -- 6
Slips, trips...............................................................................................................-- -- -- -- -- -- -- -- --
Overexertion...............................................................................................................100.0 -- -- -- -- -- -- 42.9 4
Overexertion in lifting...............................................................................................................100.0 -- -- -- -- -- -- -- 44
Repetitive motion...............................................................................................................-- -- -- -- -- -- -- -- --
Exposed to harmful substance...............................................................................................................-- -- -- -- -- -- -- -- --
Transportation accidents...............................................................................................................100.0 -- -- -- -- -- -- -- 14
Highway accident...............................................................................................................-- -- -- -- -- -- -- -- --
Fires, explosions...............................................................................................................-- -- -- -- -- -- -- -- --
Assault, violent act...............................................................................................................100.0 -- -- -- -- -- -- -- 6
by person...............................................................................................................100.0 -- -- -- -- -- -- -- 6
by animal...............................................................................................................-- -- -- -- -- -- -- -- --
1 Days-away-from-work cases include those that result in days away from work with or without job
2 days
transfer or restriction. Injuries and Illnesses in cooperation with participating State agencies.
NOTE: Dashes indicate data that are not available. Because of rounding and data exclusion of
nonclassifiable responses, data may not sum to the totals.
6 to 10
days
11 to 20
days
21 to 30
days
31 days
or more
SOURCE: Bureau of Labor Statistics, U. S. Department of Labor, Survey of Occupational
Nevada--state government
Characteristic
Percent of cases involving
Median
days away
from workTotal
cases1 day
3 to 5
days
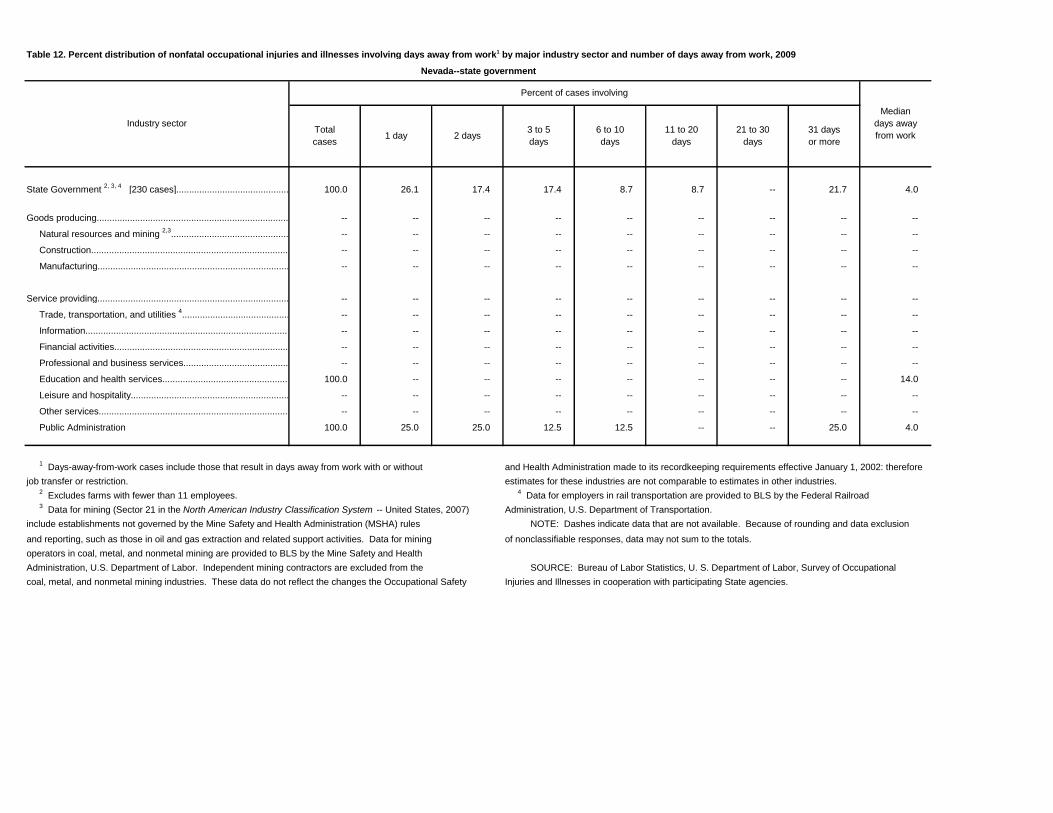
Table 12. Percent distribution of nonfatal occupational injuries and illnesses involving days away from work1 by major industry sector and number of days away from work, 2009
State Government 2, 3, 4
[230 cases]................................................................................................................100.0 26.1 17.4 17.4 8.7 8.7 -- 21.7 4.0
Goods producing................................................................................................................-- -- -- -- -- -- -- -- --
Natural resources and mining 2,3
................................................................................................................-- -- -- -- -- -- -- -- --
Construction................................................................................................................-- -- -- -- -- -- -- -- --
Manufacturing................................................................................................................-- -- -- -- -- -- -- -- --
Service providing................................................................................................................-- -- -- -- -- -- -- -- --
Trade, transportation, and utilities 4................................................................................................................-- -- -- -- -- -- -- -- --
Information................................................................................................................-- -- -- -- -- -- -- -- --
Financial activities................................................................................................................-- -- -- -- -- -- -- -- --
Professional and business services................................................................................................................-- -- -- -- -- -- -- -- --
Education and health services................................................................................................................100.0 -- -- -- -- -- -- -- 14.0
Leisure and hospitality................................................................................................................-- -- -- -- -- -- -- -- --
Other services................................................................................................................-- -- -- -- -- -- -- -- --
Public Administration 100.0 25.0 25.0 12.5 12.5 -- -- 25.0 4.0
and Health Administration made to its recordkeeping requirements effective January 1, 2002: therefore
estimates for these industries are not comparable to estimates in other industries.
operators in coal, metal, and nonmetal mining are provided to BLS by the Mine Safety and Health
Administration, U.S. Department of Labor. Independent mining contractors are excluded from the SOURCE: Bureau of Labor Statistics, U. S. Department of Labor, Survey of Occupational
coal, metal, and nonmetal mining industries. These data do not reflect the changes the Occupational Safety Injuries and Illnesses in cooperation with participating State agencies.
3 Data for mining (Sector 21 in the North American Industry Classification System -- United States, 2007) Administration, U.S. Department of Transportation.
include establishments not governed by the Mine Safety and Health Administration (MSHA) rules NOTE: Dashes indicate data that are not available. Because of rounding and data exclusion
and reporting, such as those in oil and gas extraction and related support activities. Data for mining of nonclassifiable responses, data may not sum to the totals.
21 to 30
days
31 days
or more
1 Days-away-from-work cases include those that result in days away from work with or without
job transfer or restriction.
2 Excludes farms with fewer than 11 employees.
4 Data for employers in rail transportation are provided to BLS by the Federal Railroad
Nevada--state government
Industry sector
Percent of cases involving
Median
days away
from workTotal
cases1 day 2 days
3 to 5
days
6 to 10
days
11 to 20
days
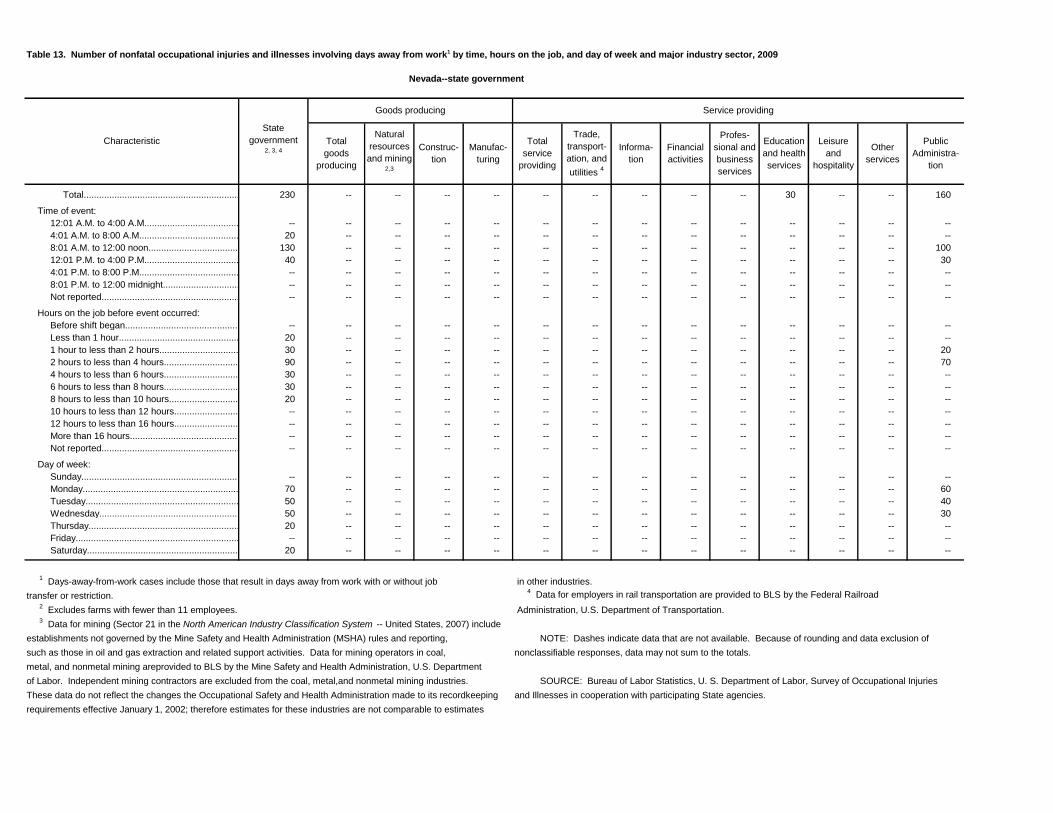
Table 13. Number of nonfatal occupational injuries and illnesses involving days away from work1 by time, hours on the job, and day of week and major industry sector, 2009
Total...............................................................................................................230 -- -- -- -- -- -- -- -- -- 30 -- -- 160
Time of event:
12:01 A.M. to 4:00 A.M................................................................................................................-- -- -- -- -- -- -- -- -- -- -- -- -- --
4:01 A.M. to 8:00 A.M................................................................................................................20 -- -- -- -- -- -- -- -- -- -- -- -- --
8:01 A.M. to 12:00 noon...............................................................................................................130 -- -- -- -- -- -- -- -- -- -- -- -- 100
12:01 P.M. to 4:00 P.M................................................................................................................40 -- -- -- -- -- -- -- -- -- -- -- -- 30
4:01 P.M. to 8:00 P.M................................................................................................................-- -- -- -- -- -- -- -- -- -- -- -- -- --
8:01 P.M. to 12:00 midnight...............................................................................................................-- -- -- -- -- -- -- -- -- -- -- -- -- --
Not reported...............................................................................................................-- -- -- -- -- -- -- -- -- -- -- -- -- --
Hours on the job before event occurred:
Before shift began...............................................................................................................-- -- -- -- -- -- -- -- -- -- -- -- -- --
Less than 1 hour...............................................................................................................20 -- -- -- -- -- -- -- -- -- -- -- -- --
1 hour to less than 2 hours...............................................................................................................30 -- -- -- -- -- -- -- -- -- -- -- -- 20
2 hours to less than 4 hours...............................................................................................................90 -- -- -- -- -- -- -- -- -- -- -- -- 70
4 hours to less than 6 hours...............................................................................................................30 -- -- -- -- -- -- -- -- -- -- -- -- --
6 hours to less than 8 hours...............................................................................................................30 -- -- -- -- -- -- -- -- -- -- -- -- --
8 hours to less than 10 hours...............................................................................................................20 -- -- -- -- -- -- -- -- -- -- -- -- --
10 hours to less than 12 hours...............................................................................................................-- -- -- -- -- -- -- -- -- -- -- -- -- --
12 hours to less than 16 hours...............................................................................................................-- -- -- -- -- -- -- -- -- -- -- -- -- --
More than 16 hours...............................................................................................................-- -- -- -- -- -- -- -- -- -- -- -- -- --
Not reported...............................................................................................................-- -- -- -- -- -- -- -- -- -- -- -- -- --
Day of week:
Sunday...............................................................................................................-- -- -- -- -- -- -- -- -- -- -- -- -- --
Monday...............................................................................................................70 -- -- -- -- -- -- -- -- -- -- -- -- 60
Tuesday...............................................................................................................50 -- -- -- -- -- -- -- -- -- -- -- -- 40
Wednesday...............................................................................................................50 -- -- -- -- -- -- -- -- -- -- -- -- 30
Thursday...............................................................................................................20 -- -- -- -- -- -- -- -- -- -- -- -- --
Friday...............................................................................................................-- -- -- -- -- -- -- -- -- -- -- -- -- --
Saturday...............................................................................................................20 -- -- -- -- -- -- -- -- -- -- -- -- --
in other industries.
4 Data for employers in rail transportation are provided to BLS by the Federal Railroad
Administration, U.S. Department of Transportation.
NOTE: Dashes indicate data that are not available. Because of rounding and data exclusion of
nonclassifiable responses, data may not sum to the totals.
SOURCE: Bureau of Labor Statistics, U. S. Department of Labor, Survey of Occupational Injuries
and Illnesses in cooperation with participating State agencies.
establishments not governed by the Mine Safety and Health Administration (MSHA) rules and reporting,
such as those in oil and gas extraction and related support activities. Data for mining operators in coal,
metal, and nonmetal mining areprovided to BLS by the Mine Safety and Health Administration, U.S. Department
of Labor. Independent mining contractors are excluded from the coal, metal,and nonmetal mining industries.
These data do not reflect the changes the Occupational Safety and Health Administration made to its recordkeeping
requirements effective January 1, 2002; therefore estimates for these industries are not comparable to estimates
2 Excludes farms with fewer than 11 employees.
3 Data for mining (Sector 21 in the North American Industry Classification System -- United States, 2007) include
Trade,
transport-
ation, and
utilities 4
Informa-
tion
Financial
activities
Profes-
sional and
business
services
Natural
resources
and mining 2,3
Construc-
tion
Other
services
Public
Administra-
tion
1 Days-away-from-work cases include those that result in days away from work with or without job
transfer or restriction.
Manufac-
turing
Total
service
providing
Education
and health
services
Leisure
and
hospitality
Nevada--state government
Characteristic
State
government2, 3, 4
Goods producing Service providing
Total
goods
producing

Table 14. Percent distribution of nonfatal occupational injuries and illnesses involving days away from work1 by time, hours on the job, and day of week and major industry sector, 2009
Total [230 cases]................................................................................................................100.0 -- -- -- -- -- -- -- -- -- 100.0 -- -- 100.0
Time of event:
12:01 A.M. to 4:00 A.M.................................................................................................................-- -- -- -- -- -- -- -- -- -- -- -- -- --
4:01 A.M. to 8:00 A.M.................................................................................................................8.7 -- -- -- -- -- -- -- -- -- -- -- -- --
8:01 A.M. to 12:00 noon................................................................................................................56.5 -- -- -- -- -- -- -- -- -- -- -- -- 62.5
12:01 P.M. to 4:00 P.M.................................................................................................................17.4 -- -- -- -- -- -- -- -- -- -- -- -- 18.8
4:01 P.M. to 8:00 P.M.................................................................................................................-- -- -- -- -- -- -- -- -- -- -- -- -- --
8:01 P.M. to 12:00 midnight................................................................................................................-- -- -- -- -- -- -- -- -- -- -- -- -- --
Not reported................................................................................................................-- -- -- -- -- -- -- -- -- -- -- -- -- --
Hours on the job before event occurred:
Before shift began................................................................................................................-- -- -- -- -- -- -- -- -- -- -- -- -- --
Less than 1 hour................................................................................................................8.7 -- -- -- -- -- -- -- -- -- -- -- -- --
1 hour to less than 2 hours................................................................................................................13.0 -- -- -- -- -- -- -- -- -- -- -- -- 12.5
2 hours to less than 4 hours................................................................................................................39.1 -- -- -- -- -- -- -- -- -- -- -- -- 43.8
4 hours to less than 6 hours................................................................................................................13.0 -- -- -- -- -- -- -- -- -- -- -- -- --
6 hours to less than 8 hours................................................................................................................13.0 -- -- -- -- -- -- -- -- -- -- -- -- --
8 hours to less than 10 hours................................................................................................................8.7 -- -- -- -- -- -- -- -- -- -- -- -- --
10 hours to less than 12 hours................................................................................................................-- -- -- -- -- -- -- -- -- -- -- -- -- --
12 hours to less than 16 hours................................................................................................................-- -- -- -- -- -- -- -- -- -- -- -- -- --
More than 16 hours................................................................................................................-- -- -- -- -- -- -- -- -- -- -- -- -- --
Not reported................................................................................................................-- -- -- -- -- -- -- -- -- -- -- -- -- --
Day of week:
Sunday................................................................................................................-- -- -- -- -- -- -- -- -- -- -- -- -- --
Monday................................................................................................................30.4 -- -- -- -- -- -- -- -- -- -- -- -- 37.5
Tuesday................................................................................................................21.7 -- -- -- -- -- -- -- -- -- -- -- -- 25.0
Wednesday................................................................................................................21.7 -- -- -- -- -- -- -- -- -- -- -- -- 18.8
Thursday................................................................................................................8.7 -- -- -- -- -- -- -- -- -- -- -- -- --
Friday................................................................................................................-- -- -- -- -- -- -- -- -- -- -- -- -- --
Saturday................................................................................................................8.7 -- -- -- -- -- -- -- -- -- -- -- -- --
in other industries.
4 Data for employers in rail transportation are provided to BLS by the Federal Railroad
Administration, U.S. Department of Transportation.
NOTE: Dashes indicate data that are not available. Because of rounding and data exclusion of
nonclassifiable responses, data may not sum to the totals.
SOURCE: Bureau of Labor Statistics, U. S. Department of Labor, Survey of Occupational Injuries
and Illnesses in cooperation with participating State agencies.
establishments not governed by the Mine Safety and Health Administration (MSHA) rules and reporting,
such as those in oil and gas extraction and related support activities. Data for mining operators in coal,
metal, and nonmetal mining areprovided to BLS by the Mine Safety and Health Administration, U.S. Department
of Labor. Independent mining contractors are excluded from the coal, metal,and nonmetal mining industries.
These data do not reflect the changes the Occupational Safety and Health Administration made to its recordkeeping
requirements effective January 1, 2002; therefore estimates for these industries are not comparable to estimates
2 Excludes farms with fewer than 11 employees.
3 Data for mining (Sector 21 in the North American Industry Classification System -- United States, 2007) include
Trade,
transport-
ation, and
utilities 4
Informa-
tion
Financial
activities
Profes-
sional and
business
services
Natural
resources
and mining 2,3
Construc-
tion
Other
services
Public
Administra-
tion
1 Days-away-from-work cases include those that result in days away from work with or without job
transfer or restriction.
Manufac-
turing
Total
service
providing
Education
and health
services
Leisure
and
hospitality
Nevada--state government
Characteristic
State
government2, 3, 4
Goods producing Service providing
Total
goods
producing

Table 15. Percent distribution of nonfatal occupational injuries and illnesses involving days away from work1 by time, hours on the job, and day of week and number of days away from work, 2009
Total [230 cases]...............................................................................................................100.0 26.1 17.4 17.4 8.7 8.7 -- 21.7 4
Time of event:
12:01 A.M. to 4:00 A.M................................................................................................................-- -- -- -- -- -- -- -- --
4:01 A.M. to 8:00 A.M................................................................................................................100.0 -- -- -- -- -- -- -- 2
8:01 A.M. to 12:00 noon...............................................................................................................100.0 15.4 30.8 -- -- -- -- 30.8 4
12:01 P.M. to 4:00 P.M................................................................................................................100.0 -- -- -- -- -- -- -- 6
4:01 P.M. to 8:00 P.M................................................................................................................-- -- -- -- -- -- -- -- --
8:01 P.M. to 12:00 midnight...............................................................................................................-- -- -- -- -- -- -- -- --
Not reported...............................................................................................................-- -- -- -- -- -- -- -- --
Hours on the job before event occurred:
Before shift began...............................................................................................................-- -- -- -- -- -- -- -- --
Less than 1 hour...............................................................................................................100.0 -- -- -- -- -- -- -- 2
1 hour to less than 2 hours...............................................................................................................100.0 -- -- -- -- -- -- -- 5
2 hours to less than 4 hours...............................................................................................................100.0 -- 33.3 -- -- -- -- 33.3 4
4 hours to less than 6 hours...............................................................................................................100.0 -- -- -- -- -- -- -- 14
6 hours to less than 8 hours...............................................................................................................100.0 -- -- -- -- -- -- -- 5
8 hours to less than 10 hours...............................................................................................................100.0 -- -- -- -- -- -- -- 4
10 hours to less than 12 hours...............................................................................................................-- -- -- -- -- -- -- -- --
12 hours to less than 16 hours...............................................................................................................-- -- -- -- -- -- -- -- --
More than 16 hours...............................................................................................................
Not reported...............................................................................................................-- -- -- -- -- -- -- -- --
Day of week:
Sunday...............................................................................................................-- -- -- -- -- -- -- -- --
Monday...............................................................................................................100.0 -- -- -- 28.6 -- -- 42.9 8
Tuesday...............................................................................................................100.0 -- -- -- -- -- -- -- 2
Wednesday...............................................................................................................100.0 -- -- -- -- -- -- -- 4
Thursday...............................................................................................................100.0 -- -- -- -- -- -- -- 14
Friday...............................................................................................................-- -- -- -- -- -- -- -- --
Saturday...............................................................................................................100.0 -- -- -- -- -- -- -- 5
SOURCE: Bureau of Labor Statistics, U. S. Department of Labor, Survey of Occupational
Injuries and Illnesses in cooperation with participating State agencies.
nonclassifiable responses, data may not sum to the totals.
21 to 30
days
31 days
or more
1 Days-away-from-work cases include those which result in days away from work with or without job
transfer or restriction.
NOTE: Dashes indicate data that are not available. Because of rounding and data exclusion of
Nevada--state government
Characteristic
Percent of cases involving
Median
days away
from workTotal
cases1 day 2 days
3 to 5
days
6 to 10
days
11 to 20
days

Table 16. Incidence rates1 for nonfatal occupational injuries and illnesses involving days away from work
2 per 10,000 full-time workers by selected worker
occupation and selected parts of body, Nevada government, Nevada, 2009
Total………………………………………………………………………..………….84.3 8.0 -- -- 34.1 19.5 -- 6.9 -- -- -- --
Business and financial operations occupations
(13-0000) . . . . . . . . . . . . . . . . . . . . . . . . . . . . . . . . . . . . . . . . . . . . . . . . . . . . .-- -- -- -- -- -- -- -- -- -- -- --
Community and social services occupations (21-0000) . . . . . . . . . . . . . . . . . . . . . . . . . . . . . . . . . . . . . . . . . . . . . . . . . . . . .-- -- -- -- -- -- -- -- -- -- -- --
Protective service occupations (33-0000) . . . . . . . . . . . . . . . . . . . . . . . . . . . . . . . . . . . . . . . . . . . . . . . . . . . . .-- -- -- -- -- -- -- -- -- -- -- --
Construction and extraction occupations (47-0000) . . . . . . . . . . . . . . . . . . . . . . . . . . . . . . . . . . . . . . . . . . . . . . . . . . . . .-- -- -- -- -- -- -- -- -- -- -- --
Transportation and material moving occupations
(53-0000) . . . . . . . . . . . . . . . . . . . . . . . . . . . . . . . . . . . . . . . . . . . . . . . . . . . . .-- -- -- -- -- -- -- -- -- -- -- --
Upper extremities
Total Finger
Hand,
except
fingers
Occupation State Government
Part of body affected by the injury or illness
Head
Neck
Trunk
Back Shoulder Total ArmEyes Total Wrist

Table 16. Incidence rates1 for nonfatal occupational injuries and illnesses involving days away from work
2 per 10,000 full-time workers by selected worker
occupation and selected parts of body, Nevada government, Nevada, 2009
Total………………………………………………………………………..………….84.3 19.6 11.6 -- -- -- 13.9 --
Business and financial operations occupations
(13-0000) . . . . . . . . . . . . . . . . . . . . . . . . . . . . . . . . . . . . . . . . . . . . . . . . . . . . .-- -- -- -- -- -- -- --
Community and social services occupations (21-0000) . . . . . . . . . . . . . . . . . . . . . . . . . . . . . . . . . . . . . . . . . . . . . . . . . . . . .-- -- -- -- -- -- -- --
Protective service occupations (33-0000) . . . . . . . . . . . . . . . . . . . . . . . . . . . . . . . . . . . . . . . . . . . . . . . . . . . . .-- -- -- -- -- -- -- --
Construction and extraction occupations (47-0000) . . . . . . . . . . . . . . . . . . . . . . . . . . . . . . . . . . . . . . . . . . . . . . . . . . . . .-- -- -- -- -- -- -- --
Transportation and material moving occupations
(53-0000) . . . . . . . . . . . . . . . . . . . . . . . . . . . . . . . . . . . . . . . . . . . . . . . . . . . . .-- -- -- -- -- -- -- --
1 Incidence rates represent the number of injuries and illnesses per 10,000
2 Days-away-from-work cases include those that result in days away from work with or
full-time workers and were calculated as: (N/EH) x 20,000,000 where without job transfer or restriction.
N = number of injuries and illnesses NOTE: Dashes indicate data that are not available. Because of rounding and data
EH = total hours worked by all employees during calendar year exclusion of nonclassifiable responses, data may not sum to the totals.
20,000,000 = base for 10,000 equivalent full-time workers SOURCE: Bureau of Labor Statistics, U. S. Department of Labor, Survey of
(working 40 hours per week, 50 weeks per year). Occupational Injuries and Illnesses in cooperation with participating State agencies.
Ankle Foot, Toe
Occupation State Government
Part of body affected by the injury or illness
Lower extremities
Body
systems
Multiple
parts
All other
body partsTotal Knee
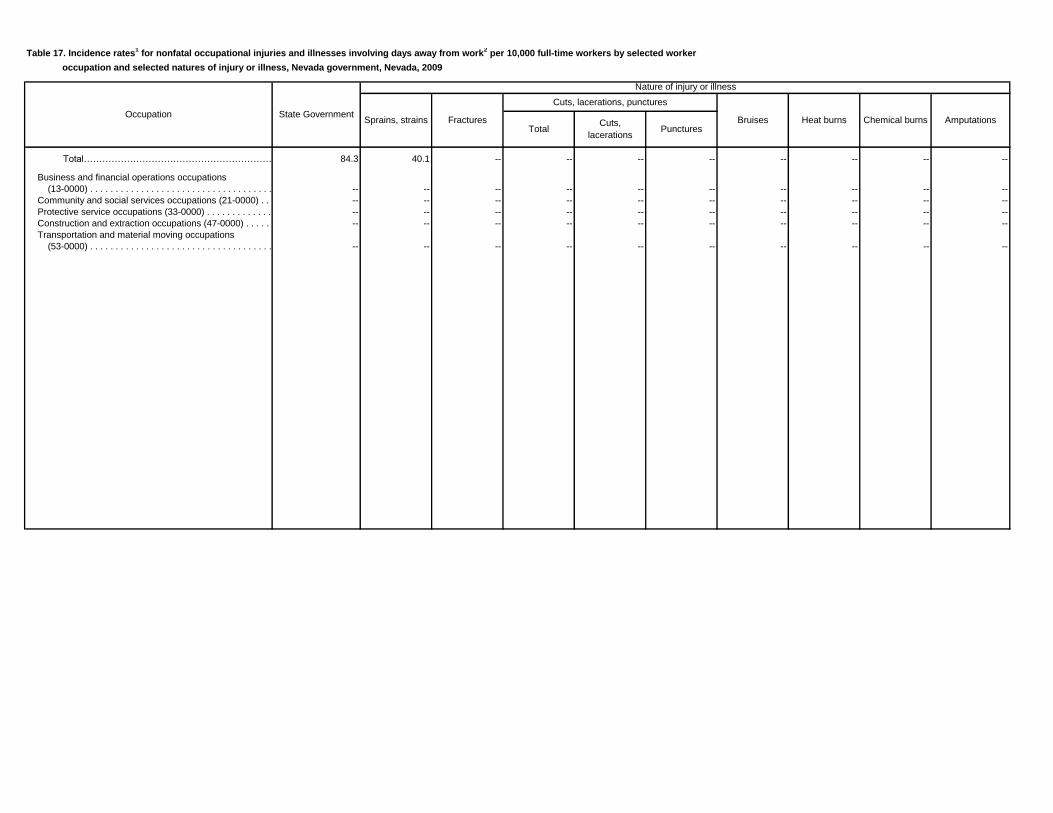
Table 17. Incidence rates1 for nonfatal occupational injuries and illnesses involving days away from work
2 per 10,000 full-time workers by selected worker
occupation and selected natures of injury or illness, Nevada government, Nevada, 2009
Total………………………………………………………………………..………….84.3 40.1 -- -- -- -- -- -- -- --
Business and financial operations occupations
(13-0000) . . . . . . . . . . . . . . . . . . . . . . . . . . . . . . . . . . . . . . . . . . . . . . . . . . . . .-- -- -- -- -- -- -- -- -- --
Community and social services occupations (21-0000) . . . . . . . . . . . . . . . . . . . . . . . . . . . . . . . . . . . . . . . . . . . . . . . . . . . . .-- -- -- -- -- -- -- -- -- --
Protective service occupations (33-0000) . . . . . . . . . . . . . . . . . . . . . . . . . . . . . . . . . . . . . . . . . . . . . . . . . . . . .-- -- -- -- -- -- -- -- -- --
Construction and extraction occupations (47-0000) . . . . . . . . . . . . . . . . . . . . . . . . . . . . . . . . . . . . . . . . . . . . . . . . . . . . .-- -- -- -- -- -- -- -- -- --
Transportation and material moving occupations
(53-0000) . . . . . . . . . . . . . . . . . . . . . . . . . . . . . . . . . . . . . . . . . . . . . . . . . . . . .-- -- -- -- -- -- -- -- -- --
Occupation State Government
Nature of injury or illness
Sprains, strains Fractures
Cuts, lacerations, punctures
Bruises Heat burns Chemical burns AmputationsTotal
Cuts,
lacerationsPunctures

Table 17. Incidence rates1 for nonfatal occupational injuries and illnesses involving days away from work
2 per 10,000 full-time workers by selected worker
occupation and selected natures of injury or illness, Nevada government, Nevada, 2009
Total………………………………………………………………………..………….84.3 -- -- 12.6 -- -- -- -- 16.4
Business and financial operations occupations
(13-0000) . . . . . . . . . . . . . . . . . . . . . . . . . . . . . . . . . . . . . . . . . . . . . . . . . . . . .-- -- -- -- -- -- -- -- --
Community and social services occupations (21-0000) . . . . . . . . . . . . . . . . . . . . . . . . . . . . . . . . . . . . . . . . . . . . . . . . . . . . .-- -- -- -- -- -- -- -- --
Protective service occupations (33-0000) . . . . . . . . . . . . . . . . . . . . . . . . . . . . . . . . . . . . . . . . . . . . . . . . . . . . .-- -- -- -- -- -- -- -- --
Construction and extraction occupations (47-0000) . . . . . . . . . . . . . . . . . . . . . . . . . . . . . . . . . . . . . . . . . . . . . . . . . . . . .-- -- -- -- -- -- -- -- --
Transportation and material moving occupations
(53-0000) . . . . . . . . . . . . . . . . . . . . . . . . . . . . . . . . . . . . . . . . . . . . . . . . . . . . .-- -- -- -- -- -- -- -- --
1 Incidence rates represent the number of injuries and illnesses per 10,000 full-time workers and
2 Days-away-from-work cases include those that result in days away from work with or
were calculated as: (N/EH) x 20,000,000 where without job transfer or restriction.
N = number of injuries and illnesses NOTE: Dashes indicate data that are not available. Because of rounding and data
EH = total hours worked by all employees during calendar year exclusion of nonclassifiable responses, data may not sum to the totals.
20,000,000 = base for 10,000 equivalent full-time workers SOURCE: Bureau of Labor Statistics, U. S. Department of Labor, Survey of
(working 40 hours per week, 50 weeks per year). Occupational Injuries and Illnesses in cooperation with participating State agencies.
Occupation State Government
Nature of injury or illness
Carpal tunnel
syndromeTendonitis
Multiple injuries Soreness Pain
All other naturesTotal
With fractures,
burns, and other
injuries
With sprains
and bruisesTotal
Back pain, hurt
back only

Table 18. Incidence rates1 for nonfatal occupational injuries and illnesses involving days away from work
2 per 10,000 full-time workers by selected worker
occupation and selected sources of injury or illness, Nevada government, Nevada, 2009
Total………………………………………………………………………..………….84.3 -- -- -- -- -- 7.0 -- 13.8 13.2 12.5 -- 12.3 22.1
Business and financial operations occupations
(13-0000) . . . . . . . . . . . . . . . . . . . . . . . . . . . . . . . . . . . . . . . . . . . . . . . . . . . . .-- -- -- -- -- -- -- -- -- -- -- -- -- --
Community and social services occupations (21-0000) . . . . . . . . . . . . . . . . . . . . . . . . . . . . . . . . . . . . . . . . . . . . . . . . . . . . .-- -- -- -- -- -- -- -- -- -- -- -- -- --
Protective service occupations (33-0000) . . . . . . . . . . . . . . . . . . . . . . . . . . . . . . . . . . . . . . . . . . . . . . . . . . . . .-- -- -- -- -- -- -- -- -- -- -- -- -- --
Construction and extraction occupations (47-0000) . . . . . . . . . . . . . . . . . . . . . . . . . . . . . . . . . . . . . . . . . . . . . . . . . . . . .-- -- -- -- -- -- -- -- -- -- -- -- -- --
Transportation and material moving occupations
(53-0000) . . . . . . . . . . . . . . . . . . . . . . . . . . . . . . . . . . . . . . . . . . . . . . . . . . . . .-- -- -- -- -- -- -- -- -- -- -- -- -- --
1 Incidence rates represent the number of injuries and illnesses per 10,000 full-time workers and
2 Days-away-from-work cases include those that result in days away from work with or
were calculated as: (N/EH) x 20,000,000 where without job transfer or restriction.
N = number of injuries and illnesses NOTE: Dashes indicate data that are not available. Because of rounding and data
EH = total hours worked by all employees during calendar year exclusion of nonclassifiable responses, data may not sum to the totals.
20,000,000 = base for 10,000 equivalent full-time workers SOURCE: Bureau of Labor Statistics, U. S. Department of Labor, Survey of
(working 40 hours per week, 50 weeks per year). Occupational Injuries and Illnesses in cooperation with participating State agencies.
OccupationState
Government
Source of injury or illness
Chemicals
and
chemical
products
Containers
Furniture
and
fixtures
MachineryParts and
materials
Person,
other than
worker
Health care
patient
Person,
injured or ill
worker
Worker
motion or
position
Floors,
walkways,
or ground
surfaces
Handtools VehiclesAll other
sources

Table 19. Incidence rates1 for nonfatal occupational injuries and illnesses involving days away from work
2 per 10,000 full-time workers by selected worker
occupation and selected events or exposures leading to injury or illness, Nevada government, Nevada, 2009
Total………………………………………………………………………..………….84.3 10.2 -- 5.8 -- -- 10.1 -- 23.9 10.4
Business and financial operations occupations
(13-0000) . . . . . . . . . . . . . . . . . . . . . . . . . . . . . . . . . . . . . . . . . . . . . . . . . . . . .-- -- -- -- -- -- -- -- -- --
Community and social services occupations (21-0000) . . . . . . . . . . . . . . . . . . . . . . . . . . . . . . . . . . . . . . . . . . . . . . . . . . . . .-- -- -- -- -- -- -- -- -- --
Protective service occupations (33-0000) . . . . . . . . . . . . . . . . . . . . . . . . . . . . . . . . . . . . . . . . . . . . . . . . . . . . .-- -- -- -- -- -- -- -- -- --
Construction and extraction occupations (47-0000) . . . . . . . . . . . . . . . . . . . . . . . . . . . . . . . . . . . . . . . . . . . . . . . . . . . . .-- -- -- -- -- -- -- -- -- --
Transportation and material moving occupations
(53-0000) . . . . . . . . . . . . . . . . . . . . . . . . . . . . . . . . . . . . . . . . . . . . . . . . . . . . .-- -- -- -- -- -- -- -- -- --
Occupation State Government
Event or exposure leading to injury or illness
Contact with objects
Fall to lower
level
Fall on same
level
Slips or trips
without fall
Overexertion
TotalStruck by
object
Struck against
object
Caught in or
compressed
or crushed
Total In lifting

Table 19. Incidence rates1 for nonfatal occupational injuries and illnesses involving days away from work
2 per 10,000 full-time workers by selected worker
occupation and selected events or exposures leading to injury or illness, Nevada government, Nevada, 2009
Total………………………………………………………………………..………….84.3 -- -- 10.1 -- -- 8.3 6.7 -- -- 9.9
Business and financial operations occupations
(13-0000) . . . . . . . . . . . . . . . . . . . . . . . . . . . . . . . . . . . . . . . . . . . . . . . . . . . . .-- -- -- -- -- -- -- -- -- -- --
Community and social services occupations (21-0000) . . . . . . . . . . . . . . . . . . . . . . . . . . . . . . . . . . . . . . . . . . . . . . . . . . . . .-- -- -- -- -- -- -- -- -- -- --
Protective service occupations (33-0000) . . . . . . . . . . . . . . . . . . . . . . . . . . . . . . . . . . . . . . . . . . . . . . . . . . . . .-- -- -- -- -- -- -- -- -- -- --
Construction and extraction occupations (47-0000) . . . . . . . . . . . . . . . . . . . . . . . . . . . . . . . . . . . . . . . . . . . . . . . . . . . . .-- -- -- -- -- -- -- -- -- -- --
Transportation and material moving occupations
(53-0000) . . . . . . . . . . . . . . . . . . . . . . . . . . . . . . . . . . . . . . . . . . . . . . . . . . . . .-- -- -- -- -- -- -- -- -- -- --
1 Incidence rates represent the number of injuries and illnesses per 10,000 full-time workers and
2 Days-away-from-work cases include those that result in days away from work with or
were calculated as: (N/EH) x 20,000,000 where without job transfer or restriction.
N = number of injuries and illnesses NOTE: Dashes indicate data that are not available. Because of rounding and data
EH = total hours worked by all employees during calendar year exclusion of nonclassifiable responses, data may not sum to the totals.
20,000,000 = base for 10,000 equivalent full-time workers SOURCE: Bureau of Labor Statistics, U. S. Department of Labor, Survey of
(working 40 hours per week, 50 weeks per year). Occupational Injuries and Illnesses in cooperation with participating State agencies.
Occupation State Government
Event or exposure leading to injury or illness
Repetitive
motion
Exposure to
harmful
substance or
environment
Transportation accidents
TotalHighway
accidents
Fires and
explosions
Assaults and violent acts
All other
eventsTotalAssaults, by
person
Assaults, by
other
Assault, by
animal

Table 20. Incidence rates1 for nonfatal occupational injuries and illnesses involving days away from work
2 per 10,000 full-time workers by selected worker
characteristic, major occupational group, and selected parts of body, Nevada government, Nevada, 2009
Total………………………………………………………………………..………….84.3 8.0 -- -- 34.1 19.5 -- 6.9 -- -- -- --
Gender:
Male................................................................................................................132.6 -- -- -- 65.0 35.9 -- -- -- -- -- --
Female................................................................................................................43.1 -- -- -- -- -- -- -- -- -- -- --
Age:
14 to 15................................................................................................................-- -- -- -- -- -- -- -- -- -- -- --
16 to 19................................................................................................................-- -- -- -- -- -- -- -- -- -- -- --
20 to 24................................................................................................................-- -- -- -- -- -- -- -- -- -- -- --
25 to 34................................................................................................................48.1 -- -- -- -- -- -- -- -- -- -- --
35 to 44................................................................................................................185.5 -- -- -- 131.0 76.7 -- -- -- -- -- --
45 to 54................................................................................................................70.8 -- -- -- 23.8 -- -- -- -- -- -- --
55 to 64................................................................................................................80.2 -- -- -- -- -- -- -- -- -- -- --
65 and over................................................................................................................-- -- -- -- -- -- -- -- -- -- -- --
Major occupational group:
Management occupations................................................................................................................-- -- -- -- -- -- -- -- -- -- -- --
Business and financial operations occupations................................................................................................................-- -- -- -- -- -- -- -- -- -- -- --
Computer and mathematical occupations................................................................................................................-- -- -- -- -- -- -- -- -- -- -- --
Architecture and engineering occupations................................................................................................................-- -- -- -- -- -- -- -- -- -- -- --
Life, physical, and social science occupations................................................................................................................-- -- -- -- -- -- -- -- -- -- -- --
Community and social services occupations................................................................................................................-- -- -- -- -- -- -- -- -- -- -- --
Legal occupations................................................................................................................-- -- -- -- -- -- -- -- -- -- -- --
Education, training, and library occupations................................................................................................................-- -- -- -- -- -- -- -- -- -- -- --
Arts, design, entertainment, sports,
and media occupations................................................................................................................-- -- -- -- -- -- -- -- -- -- -- --
Healthcare practitioners and technical occupations................................................................................................................-- -- -- -- -- -- -- -- -- -- -- --
Healthcare support occupations................................................................................................................-- -- -- -- -- -- -- -- -- -- -- --
Protective service occupations................................................................................................................-- -- -- -- -- -- -- -- -- -- -- --
Food preparation and serving related occupations................................................................................................................-- -- -- -- -- -- -- -- -- -- -- --
Building and grounds cleaning
and maintenance occupations................................................................................................................-- -- -- -- -- -- -- -- -- -- -- --
Personal care and service occupations................................................................................................................-- -- -- -- -- -- -- -- -- -- -- --
Sales and related occupations................................................................................................................-- -- -- -- -- -- -- -- -- -- -- --
Office and administrative support occupations................................................................................................................-- -- -- -- -- -- -- -- -- -- -- --
Farming, fishing, and forestry occupations................................................................................................................-- -- -- -- -- -- -- -- -- -- -- --
Construction and extraction occupations................................................................................................................-- -- -- -- -- -- -- -- -- -- -- --
Installation, maintenance, and repair occupations................................................................................................................-- -- -- -- -- -- -- -- -- -- -- --
Production occupations................................................................................................................-- -- -- -- -- -- -- -- -- -- -- --
Transportation and material moving occupations................................................................................................................-- -- -- -- -- -- -- -- -- -- -- --
Upper extremities
Total Finger
Hand,
except
fingers
Characteristic State Government
Part of body affected by the injury or illness
Head
Neck
Trunk
Back Shoulder Total ArmEyes Total Wrist

Table 20. Incidence rates1 for nonfatal occupational injuries and illnesses involving days away from work
2 per 10,000 full-time workers by selected worker
characteristic, major occupational group, and selected parts of body, Nevada government, Nevada, 2009
Total………………………………………………………………………..………….84.3 19.6 11.6 -- -- -- 13.9 --
Gender:
Male................................................................................................................132.6 29.6 13.8 -- -- -- 17.5 --
Female................................................................................................................43.1 11.1 -- -- -- -- 10.8 --
Age:
14 to 15................................................................................................................-- -- -- -- -- -- -- --
16 to 19................................................................................................................-- -- -- -- -- -- -- --
20 to 24................................................................................................................-- -- -- -- -- -- -- --
25 to 34................................................................................................................48.1 22.3 -- -- -- -- -- --
35 to 44................................................................................................................185.5 -- -- -- -- -- -- --
45 to 54................................................................................................................70.8 -- -- -- -- -- 18.5 --
55 to 64................................................................................................................80.2 -- -- -- -- -- -- --
65 and over................................................................................................................-- -- -- -- -- -- -- --
Major occupational group:
Management occupations................................................................................................................-- -- -- -- -- -- -- --
Business and financial operations occupations................................................................................................................-- -- -- -- -- -- -- --
Computer and mathematical occupations................................................................................................................-- -- -- -- -- -- -- --
Architecture and engineering occupations................................................................................................................-- -- -- -- -- -- -- --
Life, physical, and social science occupations................................................................................................................-- -- -- -- -- -- -- --
Community and social services occupations................................................................................................................-- -- -- -- -- -- -- --
Legal occupations................................................................................................................-- -- -- -- -- -- -- --
Education, training, and library occupations................................................................................................................-- -- -- -- -- -- -- --
Arts, design, entertainment, sports,
and media occupations................................................................................................................-- -- -- -- -- -- -- --
Healthcare practitioners and technical occupations................................................................................................................-- -- -- -- -- -- -- --
Healthcare support occupations................................................................................................................-- -- -- -- -- -- -- --
Protective service occupations................................................................................................................-- -- -- -- -- -- -- --
Food preparation and serving related occupations................................................................................................................-- -- -- -- -- -- -- --
Building and grounds cleaning
and maintenance occupations................................................................................................................-- -- -- -- -- -- -- --
Personal care and service occupations................................................................................................................-- -- -- -- -- -- -- --
Sales and related occupations................................................................................................................-- -- -- -- -- -- -- --
Office and administrative support occupations................................................................................................................-- -- -- -- -- -- -- --
Farming, fishing, and forestry occupations................................................................................................................-- -- -- -- -- -- -- --
Construction and extraction occupations................................................................................................................-- -- -- -- -- -- -- --
Installation, maintenance, and repair occupations................................................................................................................-- -- -- -- -- -- -- --
Production occupations................................................................................................................-- -- -- -- -- -- -- --
Transportation and material moving occupations................................................................................................................-- -- -- -- -- -- -- --
1 Incidence rates represent the number of injuries and illnesses per 10,000
2 Days away from work cases include those that result in days away from work with or
full-time workers and were calculated as: (N/EH) x 20,000,000 where without job transfer or restriction.
N = number of injuries and illnesses NOTE: Dashes indicate data that are not available. Because of rounding and data
EH = total hours worked by all employees during calendar year exclusion of nonclassifiable responses, data may not sum to the totals.
20,000,000 = base for 10,000 equivalent full-time workers SOURCE: Bureau of Labor Statistics, U. S. Department of Labor, Survey of
(working 40 hours per week, 50 weeks per year). Occupational Injuries and Illnesses in cooperation with participating State agencies.
Ankle Foot, Toe
Characteristic State Government
Part of body affected by the injury or illness
Lower extremities Body
systems
Multiple
parts
All other
body partsTotal Knee
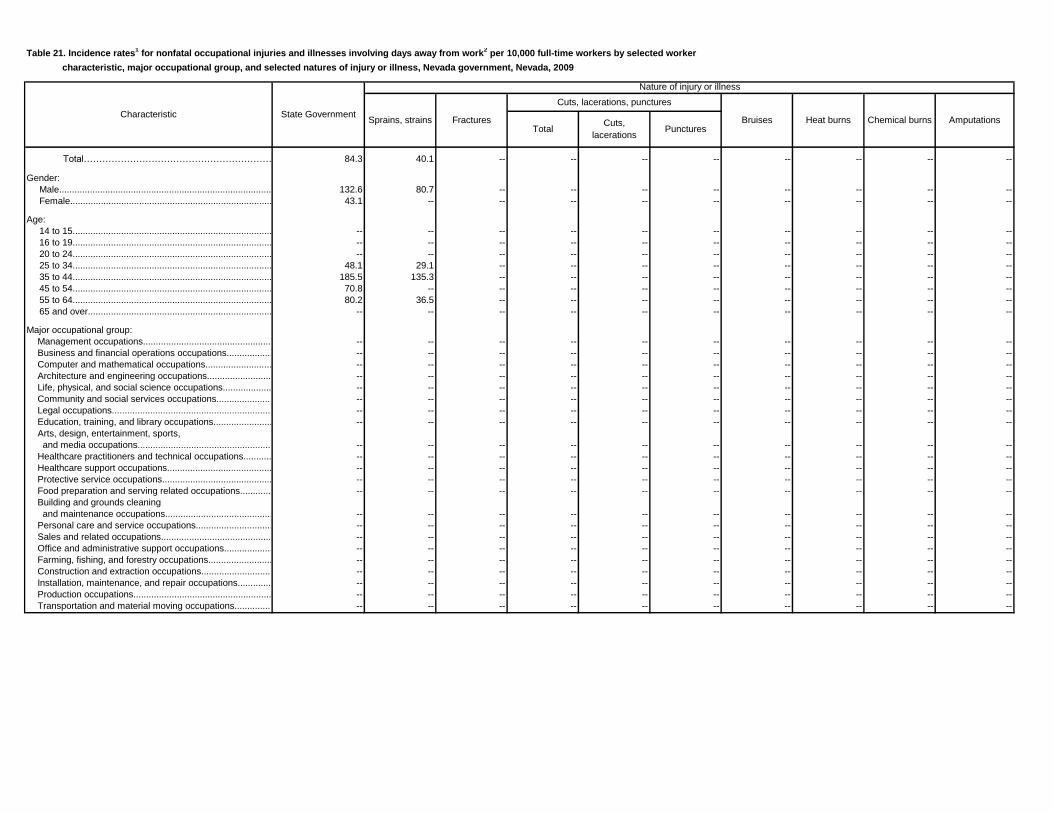
Table 21. Incidence rates1 for nonfatal occupational injuries and illnesses involving days away from work
2 per 10,000 full-time workers by selected worker
characteristic, major occupational group, and selected natures of injury or illness, Nevada government, Nevada, 2009
Total………………………………………………………………………..………….84.3 40.1 -- -- -- -- -- -- -- --
Gender:
Male................................................................................................................132.6 80.7 -- -- -- -- -- -- -- --
Female................................................................................................................43.1 -- -- -- -- -- -- -- -- --
Age:
14 to 15................................................................................................................-- -- -- -- -- -- -- -- -- --
16 to 19................................................................................................................-- -- -- -- -- -- -- -- -- --
20 to 24................................................................................................................-- -- -- -- -- -- -- -- -- --
25 to 34................................................................................................................48.1 29.1 -- -- -- -- -- -- -- --
35 to 44................................................................................................................185.5 135.3 -- -- -- -- -- -- -- --
45 to 54................................................................................................................70.8 -- -- -- -- -- -- -- -- --
55 to 64................................................................................................................80.2 36.5 -- -- -- -- -- -- -- --
65 and over................................................................................................................-- -- -- -- -- -- -- -- -- --
Major occupational group:
Management occupations................................................................................................................-- -- -- -- -- -- -- -- -- --
Business and financial operations occupations................................................................................................................-- -- -- -- -- -- -- -- -- --
Computer and mathematical occupations................................................................................................................-- -- -- -- -- -- -- -- -- --
Architecture and engineering occupations................................................................................................................-- -- -- -- -- -- -- -- -- --
Life, physical, and social science occupations................................................................................................................-- -- -- -- -- -- -- -- -- --
Community and social services occupations................................................................................................................-- -- -- -- -- -- -- -- -- --
Legal occupations................................................................................................................-- -- -- -- -- -- -- -- -- --
Education, training, and library occupations................................................................................................................-- -- -- -- -- -- -- -- -- --
Arts, design, entertainment, sports,
and media occupations................................................................................................................-- -- -- -- -- -- -- -- -- --
Healthcare practitioners and technical occupations................................................................................................................-- -- -- -- -- -- -- -- -- --
Healthcare support occupations................................................................................................................-- -- -- -- -- -- -- -- -- --
Protective service occupations................................................................................................................-- -- -- -- -- -- -- -- -- --
Food preparation and serving related occupations................................................................................................................-- -- -- -- -- -- -- -- -- --
Building and grounds cleaning
and maintenance occupations................................................................................................................-- -- -- -- -- -- -- -- -- --
Personal care and service occupations................................................................................................................-- -- -- -- -- -- -- -- -- --
Sales and related occupations................................................................................................................-- -- -- -- -- -- -- -- -- --
Office and administrative support occupations................................................................................................................-- -- -- -- -- -- -- -- -- --
Farming, fishing, and forestry occupations................................................................................................................-- -- -- -- -- -- -- -- -- --
Construction and extraction occupations................................................................................................................-- -- -- -- -- -- -- -- -- --
Installation, maintenance, and repair occupations................................................................................................................-- -- -- -- -- -- -- -- -- --
Production occupations................................................................................................................-- -- -- -- -- -- -- -- -- --
Transportation and material moving occupations................................................................................................................-- -- -- -- -- -- -- -- -- --
Characteristic State Government
Nature of injury or illness
Sprains, strains Fractures
Cuts, lacerations, punctures
Bruises Heat burns Chemical burns AmputationsTotal
Cuts,
lacerationsPunctures

Table 21. Incidence rates1 for nonfatal occupational injuries and illnesses involving days away from work
2 per 10,000 full-time workers by selected worker
characteristic, major occupational group, and selected natures of injury or illness, Nevada government, Nevada, 2009
Total………………………………………………………………………..………….84.3 -- -- 12.6 -- -- -- -- 16.4
Gender:
Male................................................................................................................132.6 -- -- -- -- -- -- -- 16.6
Female................................................................................................................43.1 -- -- 14.2 -- -- -- -- 16.2
Age:
14 to 15................................................................................................................-- -- -- -- -- -- -- -- --
16 to 19................................................................................................................-- -- -- -- -- -- -- -- --
20 to 24................................................................................................................-- -- -- -- -- -- -- -- --
25 to 34................................................................................................................48.1 -- -- -- -- -- -- -- --
35 to 44................................................................................................................185.5 -- -- -- -- -- -- -- --
45 to 54................................................................................................................70.8 -- -- -- -- -- -- -- --
55 to 64................................................................................................................80.2 -- -- -- -- -- -- -- --
65 and over................................................................................................................-- -- -- -- -- -- -- -- --
Major occupational group:
Management occupations................................................................................................................-- -- -- -- -- -- -- -- --
Business and financial operations occupations................................................................................................................-- -- -- -- -- -- -- -- --
Computer and mathematical occupations................................................................................................................-- -- -- -- -- -- -- -- --
Architecture and engineering occupations................................................................................................................-- -- -- -- -- -- -- -- --
Life, physical, and social science occupations................................................................................................................-- -- -- -- -- -- -- -- --
Community and social services occupations................................................................................................................-- -- -- -- -- -- -- -- --
Legal occupations................................................................................................................-- -- -- -- -- -- -- -- --
Education, training, and library occupations................................................................................................................-- -- -- -- -- -- -- -- --
Arts, design, entertainment, sports,
and media occupations................................................................................................................-- -- -- -- -- -- -- -- --
Healthcare practitioners and technical occupations................................................................................................................-- -- -- -- -- -- -- -- --
Healthcare support occupations................................................................................................................-- -- -- -- -- -- -- -- --
Protective service occupations................................................................................................................-- -- -- -- -- -- -- -- --
Food preparation and serving related occupations................................................................................................................-- -- -- -- -- -- -- -- --
Building and grounds cleaning
and maintenance occupations................................................................................................................-- -- -- -- -- -- -- -- --
Personal care and service occupations................................................................................................................-- -- -- -- -- -- -- -- --
Sales and related occupations................................................................................................................-- -- -- -- -- -- -- -- --
Office and administrative support occupations................................................................................................................-- -- -- -- -- -- -- -- --
Farming, fishing, and forestry occupations................................................................................................................-- -- -- -- -- -- -- -- --
Construction and extraction occupations................................................................................................................-- -- -- -- -- -- -- -- --
Installation, maintenance, and repair occupations................................................................................................................-- -- -- -- -- -- -- -- --
Production occupations................................................................................................................-- -- -- -- -- -- -- -- --
Transportation and material moving occupations................................................................................................................-- -- -- -- -- -- -- -- --
1 Incidence rates represent the number of injuries and illnesses per 10,000 full-time workers and
2 Days away from work cases include those that result in days away from work with or
were calculated as: (N/EH) x 20,000,000 where without job transfer or restriction.
N = number of injuries and illnesses NOTE: Dashes indicate data that are not available. Because of rounding and data
EH = total hours worked by all employees during calendar year exclusion of nonclassifiable responses, data may not sum to the totals.
20,000,000 = base for 10,000 equivalent full-time workers SOURCE: Bureau of Labor Statistics, U. S. Department of Labor, Survey of
(working 40 hours per week, 50 weeks per year). Occupational Injuries and Illnesses in cooperation with participating State agencies.
Characteristic State Government
Nature of injury or illness
Carpal tunnel
syndromeTendonitis
Multiple injuries Soreness Pain
All other naturesTotal
With fractures,
burns, and other
injuries
With sprains
and bruisesTotal
Back pain, hurt
back only

Table 22. Incidence rates1 for nonfatal occupational injuries and illnesses involving days away from work
2 per 10,000 full-time workers by selected worker
characteristic, major occupational group, and selected sources of injury or illness, Nevada government, Nevada, 2009
Total………………………………………………………………………..………….84.3 -- -- -- -- -- 7.0 -- 13.8 13.2 12.5 -- 12.3 22.1
Gender:
Male................................................................................................................132.6 -- -- -- -- -- 14.2 -- 22.2 22.2 12.4 -- 14.6 37.4
Female................................................................................................................43.1 -- -- -- -- -- -- -- -- -- 12.6 -- 10.4 --
Age:
14 to 15................................................................................................................-- -- -- -- -- -- -- -- -- -- -- -- -- --
16 to 19................................................................................................................-- -- -- -- -- -- -- -- -- -- -- -- -- --
20 to 24................................................................................................................-- -- -- -- -- -- -- -- -- -- -- -- -- --
25 to 34................................................................................................................48.1 -- -- -- -- -- -- -- -- -- -- -- -- --
35 to 44................................................................................................................185.5 -- -- -- -- -- -- -- -- -- -- -- -- 87.4
45 to 54................................................................................................................70.8 -- -- -- -- -- -- -- -- -- 26.4 -- -- --
55 to 64................................................................................................................80.2 -- -- -- -- -- -- -- 35.5 -- -- -- -- --
65 and over................................................................................................................-- -- -- -- -- -- -- -- -- -- -- -- -- --
Major occupational group:
Management occupations................................................................................................................-- -- -- -- -- -- -- -- -- -- -- -- -- --
Business and financial operations occupations................................................................................................................-- -- -- -- -- -- -- -- -- -- -- -- -- --
Computer and mathematical occupations................................................................................................................-- -- -- -- -- -- -- -- -- -- -- -- -- --
Architecture and engineering occupations................................................................................................................-- -- -- -- -- -- -- -- -- -- -- -- -- --
Life, physical, and social science occupations................................................................................................................-- -- -- -- -- -- -- -- -- -- -- -- -- --
Community and social services occupations................................................................................................................-- -- -- -- -- -- -- -- -- -- -- -- -- --
Legal occupations................................................................................................................-- -- -- -- -- -- -- -- -- -- -- -- -- --
Education, training, and library occupations................................................................................................................-- -- -- -- -- -- -- -- -- -- -- -- -- --
Arts, design, entertainment, sports,
and media occupations................................................................................................................-- -- -- -- -- -- -- -- -- -- -- -- -- --
Healthcare practitioners and technical occupations................................................................................................................-- -- -- -- -- -- -- -- -- -- -- -- -- --
Healthcare support occupations................................................................................................................-- -- -- -- -- -- -- -- -- -- -- -- -- --
Protective service occupations................................................................................................................-- -- -- -- -- -- -- -- -- -- -- -- -- --
Food preparation and serving related occupations................................................................................................................-- -- -- -- -- -- -- -- -- -- -- -- -- --
Building and grounds cleaning
and maintenance occupations................................................................................................................-- -- -- -- -- -- -- -- -- -- -- -- -- --
Personal care and service occupations................................................................................................................-- -- -- -- -- -- -- -- -- -- -- -- -- --
Sales and related occupations................................................................................................................-- -- -- -- -- -- -- -- -- -- -- -- -- --
Office and administrative support occupations................................................................................................................-- -- -- -- -- -- -- -- -- -- -- -- -- --
Farming, fishing, and forestry occupations................................................................................................................-- -- -- -- -- -- -- -- -- -- -- -- -- --
Construction and extraction occupations................................................................................................................-- -- -- -- -- -- -- -- -- -- -- -- -- --
Installation, maintenance, and repair occupations................................................................................................................-- -- -- -- -- -- -- -- -- -- -- -- -- --
Production occupations................................................................................................................-- -- -- -- -- -- -- -- -- -- -- -- -- --
Transportation and material moving occupations................................................................................................................-- -- -- -- -- -- -- -- -- -- -- -- -- --
1 Incidence rates represent the number of injuries and illnesses per 10,000 full-time workers and
2 Days away from work cases include those that result in days away from work with or
were calculated as: (N/EH) x 20,000,000 where without job transfer or restriction.
N = number of injuries and illnesses NOTE: Dashes indicate data that are not available. Because of rounding and data
EH = total hours worked by all employees during calendar year exclusion of nonclassifiable responses, data may not sum to the totals.
20,000,000 = base for 10,000 equivalent full-time workers SOURCE: Bureau of Labor Statistics, U. S. Department of Labor, Survey of
(working 40 hours per week, 50 weeks per year). Occupational Injuries and Illnesses in cooperation with participating State agencies.
CharacteristicState
Government
Source of injury or illness
Chemicals
and
chemical
products
ContainersFurniture
and fixturesMachinery
Parts and
materials
Person,
other than
worker
Health care
patient
Person,
injured or ill
worker
Worker
motion or
position
Floors,
walkways,
or ground
surfaces
Handtools VehiclesAll other
sources

Table 23. Incidence rates1 for nonfatal occupational injuries and illnesses involving days away from work
2 per 10,000 full-time workers by selected worker
characteristic, major occupational group, and selected events or exposures leading to injury or illness, Nevada government, Nevada, 2009
Total………………………………………………………………………..………….84.3 10.2 -- 5.8 -- -- 10.1 -- 23.9 10.4
Gender:
Male................................................................................................................132.6 16.3 -- -- -- -- -- -- 51.9 22.7
Female................................................................................................................43.1 -- -- -- -- -- -- -- -- --
Age:
14 to 15................................................................................................................-- -- -- -- -- -- -- -- -- --
16 to 19................................................................................................................-- -- -- -- -- -- -- -- -- --
20 to 24................................................................................................................-- -- -- -- -- -- -- -- -- --
25 to 34................................................................................................................48.1 -- -- -- -- -- -- -- -- --
35 to 44................................................................................................................185.5 -- -- -- -- -- -- -- 135.3 61.1
45 to 54................................................................................................................70.8 -- -- -- -- -- 24.5 -- -- --
55 to 64................................................................................................................80.2 -- -- -- -- -- -- -- -- --
65 and over................................................................................................................-- -- -- -- -- -- -- -- -- --
Major occupational group:
Management occupations................................................................................................................-- -- -- -- -- -- -- -- -- --
Business and financial operations occupations................................................................................................................-- -- -- -- -- -- -- -- -- --
Computer and mathematical occupations................................................................................................................-- -- -- -- -- -- -- -- -- --
Architecture and engineering occupations................................................................................................................-- -- -- -- -- -- -- -- -- --
Life, physical, and social science occupations................................................................................................................-- -- -- -- -- -- -- -- -- --
Community and social services occupations................................................................................................................-- -- -- -- -- -- -- -- -- --
Legal occupations................................................................................................................-- -- -- -- -- -- -- -- -- --
Education, training, and library occupations................................................................................................................-- -- -- -- -- -- -- -- -- --
Arts, design, entertainment, sports,
and media occupations................................................................................................................-- -- -- -- -- -- -- -- -- --
Healthcare practitioners and technical occupations................................................................................................................-- -- -- -- -- -- -- -- -- --
Healthcare support occupations................................................................................................................-- -- -- -- -- -- -- -- -- --
Protective service occupations................................................................................................................-- -- -- -- -- -- -- -- -- --
Food preparation and serving related occupations................................................................................................................-- -- -- -- -- -- -- -- -- --
Building and grounds cleaning
and maintenance occupations................................................................................................................-- -- -- -- -- -- -- -- -- --
Personal care and service occupations................................................................................................................-- -- -- -- -- -- -- -- -- --
Sales and related occupations................................................................................................................-- -- -- -- -- -- -- -- -- --
Office and administrative support occupations................................................................................................................-- -- -- -- -- -- -- -- -- --
Farming, fishing, and forestry occupations................................................................................................................-- -- -- -- -- -- -- -- -- --
Construction and extraction occupations................................................................................................................-- -- -- -- -- -- -- -- -- --
Installation, maintenance, and repair occupations................................................................................................................-- -- -- -- -- -- -- -- -- --
Production occupations................................................................................................................-- -- -- -- -- -- -- -- -- --
Transportation and material moving occupations................................................................................................................-- -- -- -- -- -- -- -- -- --
Characteristic State Government
Event or exposure leading to injury or illness
Contact with objects
Fall to lower
level
Fall on same
level
Slips or trips
without fall
Overexertion
TotalStruck by
object
Struck against
object
Caught in or
compressed
or crushed
Total In lifting

Table 23. Incidence rates1 for nonfatal occupational injuries and illnesses involving days away from work
2 per 10,000 full-time workers by selected worker
characteristic, major occupational group, and selected events or exposures leading to injury or illness, Nevada government, Nevada, 2009
Total………………………………………………………………………..………….84.3 -- -- 10.1 -- -- 8.3 6.7 -- -- 9.9
Gender:
Male................................................................................................................132.6 -- -- -- -- -- 13.4 13.4 -- -- 13.7
Female................................................................................................................43.1 -- -- 10.4 -- -- -- -- -- -- --
Age:
14 to 15................................................................................................................-- -- -- -- -- -- -- -- -- -- --
16 to 19................................................................................................................-- -- -- -- -- -- -- -- -- -- --
20 to 24................................................................................................................-- -- -- -- -- -- -- -- -- -- --
25 to 34................................................................................................................48.1 -- -- -- -- -- -- -- -- -- --
35 to 44................................................................................................................185.5 -- -- -- -- -- -- -- -- -- --
45 to 54................................................................................................................70.8 -- -- -- -- -- -- -- -- -- --
55 to 64................................................................................................................80.2 -- -- -- -- -- -- -- -- -- --
65 and over................................................................................................................-- -- -- -- -- -- -- -- -- -- --
Major occupational group:
Management occupations................................................................................................................-- -- -- -- -- -- -- -- -- -- --
Business and financial operations occupations................................................................................................................-- -- -- -- -- -- -- -- -- -- --
Computer and mathematical occupations................................................................................................................-- -- -- -- -- -- -- -- -- -- --
Architecture and engineering occupations................................................................................................................-- -- -- -- -- -- -- -- -- -- --
Life, physical, and social science occupations................................................................................................................-- -- -- -- -- -- -- -- -- -- --
Community and social services occupations................................................................................................................-- -- -- -- -- -- -- -- -- -- --
Legal occupations................................................................................................................-- -- -- -- -- -- -- -- -- -- --
Education, training, and library occupations................................................................................................................-- -- -- -- -- -- -- -- -- -- --
Arts, design, entertainment, sports,
and media occupations................................................................................................................-- -- -- -- -- -- -- -- -- -- --
Healthcare practitioners and technical occupations................................................................................................................-- -- -- -- -- -- -- -- -- -- --
Healthcare support occupations................................................................................................................-- -- -- -- -- -- -- -- -- -- --
Protective service occupations................................................................................................................-- -- -- -- -- -- -- -- -- -- --
Food preparation and serving related occupations................................................................................................................-- -- -- -- -- -- -- -- -- -- --
Building and grounds cleaning
and maintenance occupations................................................................................................................-- -- -- -- -- -- -- -- -- -- --
Personal care and service occupations................................................................................................................-- -- -- -- -- -- -- -- -- -- --
Sales and related occupations................................................................................................................-- -- -- -- -- -- -- -- -- -- --
Office and administrative support occupations................................................................................................................-- -- -- -- -- -- -- -- -- -- --
Farming, fishing, and forestry occupations................................................................................................................-- -- -- -- -- -- -- -- -- -- --
Construction and extraction occupations................................................................................................................-- -- -- -- -- -- -- -- -- -- --
Installation, maintenance, and repair occupations................................................................................................................-- -- -- -- -- -- -- -- -- -- --
Production occupations................................................................................................................-- -- -- -- -- -- -- -- -- -- --
Transportation and material moving occupations................................................................................................................-- -- -- -- -- -- -- -- -- -- --
1 Incidence rates represent the number of injuries and illnesses per 10,000 full-time workers and
2 Days away from work cases include those that result in days away from work with or
were calculated as: (N/EH) x 20,000,000 where without job transfer or restriction.
N = number of injuries and illnesses NOTE: Dashes indicate data that are not available. Because of rounding and data
EH = total hours worked by all employees during calendar year exclusion of nonclassifiable responses, data may not sum to the totals.
20,000,000 = base for 10,000 equivalent full-time workers SOURCE: Bureau of Labor Statistics, U. S. Department of Labor, Survey of
(working 40 hours per week, 50 weeks per year). Occupational Injuries and Illnesses in cooperation with participating State agencies.
Occupation State Government
Event or exposure leading to injury or illness
Repetitive
motion
Exposure to
harmful
substance or
environment
Transportation accidents
TotalHighway
accidents
Fires and
explosions
Assaults and violent acts
All other
eventsTotalAssaults, by
person
Assaults, by
other
Assault, by
animal