table 1.1. among women aged 15–19, rates abortion … abortion abortion total estimated population...
TRANSCRIPT

Pregnancy ratePregnancy among sexually Abortion Abortion Total Estimated Population
Year rate experienced* Birthrate rate ratio† pregnancies Births Abortions fetal losses§ (in 000s)
1973 96.5 u 59.3 23.0 27.9 982,420 604,096 234,100 144,230 10,1831974 99.1 u 57.6 27.3 32.2 1,025,130 595,449 282,350 147,320 10,3401975 101.4 u 55.6 31.5 36.2 1,061,500 582,238 329,830 149,430 10,465
1976 101.4 u 52.8 34.6 39.6 1,073,270 558,744 366,160 148,360 10,5861977 105.0 u 52.8 37.8 41.7 1,111,550 559,154 400,520 151,880 10,5881978 105.8 u 51.5 40.0 43.8 1,117,330 543,407 422,950 150,980 10,5611979 109.8 u 52.3 42.8 45.0 1,153,290 549,472 449,020 154,800 10,5021980 111.4 u 53.2 43.3 44.9 1,156,900 552,161 449,370 155,370 10,381
1981 110.4 u 52.2 43.4 45.4 1,114,650 527,392 437,990 149,280 10,0961982 110.3 235.3 52.4 43.2 45.2 1,082,230 513,758 423,380 145,090 9,8091983 109.8 229.2 51.4 43.7 46.0 1,044,720 489,286 415,980 139,460 9,5151984 108.5 221.9 50.6 43.4 46.2 1,007,500 469,682 403,520 134,290 9,2871985 109.6 219.6 51.0 44.0 46.4 1,005,260 467,485 403,890 133,890 9,174
1986 107.3 210.8 50.2 42.8 46.0 987,560 461,905 393,890 131,770 9,2061987 107.2 206.6 50.6 42.3 45.5 979,640 462,312 386,240 131,090 9,1391988 112.0 211.7 53.0 44.0 45.4 1,011,180 478,353 397,410 135,410 9,0291989 115.5 219.6 57.3 42.5 42.6 1,020,870 506,503 375,510 138,850 8,8411990 117.6 224.9 60.3 41.1 40.5 1,017,470 521,826 355,710 139,940 8,656
1991 115.9 223.1 61.8 37.9 38.0 974,330 519,577 318,940 135,810 8,4071992 111.6 216.2 60.3 35.7 37.2 936,350 505,415 299,870 131,070 8,3891993 108.6 211.6 59.0 34.4 36.8 922,640 501,093 292,120 129,430 8,4961994 105.1 206.1 58.2 32.1 35.6 913,520 505,488 279,030 129,000 8,6891995 100.1 197.4 56.0 29.9 34.8 893,480 499,873 266,940 126,670 8,929
TABLE 1.1. Among women aged 15–19, rates of pregnancy, birth and abortion; abortion ratios; numbers of pregnancies, births, abortions and fetal losses; and population, 1973–2013
20

Pregnancy ratePregnancy among sexually Abortion Abortion Total Estimated Population
Year rate experienced* Birthrate rate ratio† pregnancies Births Abortions fetal losses§ (in 000s)
TABLE 1.1. Among women aged 15–19, rates of pregnancy, birth and abortion; abortion ratios; numbers of pregnancies, births, abortions and fetal losses; and population, 1973–2013
1996 96.1 191.6 53.5 29.0 35.2 883,390 491,577 266,820 125,000 9,1931997 91.8 185.2 51.3 27.5 34.9 865,400 483,220 259,580 122,600 9,4251998 89.2 181.9 50.3 26.2 34.2 859,700 484,895 252,570 122,240 9,6411999 86.1 177.6 48.8 25.1 34.0 840,550 476,050 244,810 119,690 9,7622000 83.8 174.9 47.6 24.3 33.8 826,070 468,990 239,340 117,730 9,855
2001 79.2 167.2 45.0 22.9 33.7 784,390 445,944 226,590 111,850 9,9092002 74.8 159.8 42.6 21.5 33.5 746,550 425,493 214,510 106,550 9,9822003 72.2 156.9 41.1 20.8 33.6 728,040 414,580 209,590 103,870 10,0872004 70.5 155.9 40.5 19.9 32.9 722,010 415,262 203,360 103,390 10,2432005 68.7 154.6 39.7 19.1 32.4 716,530 414,593 199,110 102,830 10,435
2006 70.5 161.6 41.1 19.3 31.9 747,020 435,436 204,080 107,500 10,5972007 70.2 163.9 41.5 18.6 30.9 753,110 444,899 199,300 108,910 10,7312008 68.2 154.7 40.2 18.1 31.0 736,930 434,758 195,660 106,520 10,8052009 63.7 140.5 37.9 16.6 30.4 688,640 409,802 178,980 99,860 10,8052010 57.7 127.9 34.3 15.0 30.4 617,990 367,678 160,700 89,610 10,704
2011 52.4 116.6 31.3 13.5 30.2 552,640 329,772 142,650 80,220 10,5412012 48.3 107.8 29.3 11.9 28.8 502,460 305,388 123,630 73,440 10,4122013 43.4 101.2 26.4 10.6 28.7 448,440 273,105 109,740 65,590 10,337
*The pregnancy rate among all 15–19‐year‐olds who have ever had sex (see text). †Number of abortions divided by the sum of births and abortions and multiplied by 100. §Includes miscarriages and stillbirths. Notes: All rates are the number of events per 1,000 women aged 15–19; pregnancy rate includes estimated number of pregnancies ending in miscarriage or stillbirth. u=unavailable.
21(continued)

Pregnancy Abortion Abortion Total Estimated PopulationYear rate Birthrate rate ratio* pregnancies Births Abortions fetal losses† (in 000s)
1973 65.1 38.6 17.1 30.7 402,220 238,403 105,580 58,240 6,1831974 66.6 37.3 19.8 34.7 417,980 234,177 124,520 59,290 6,2761975 68.1 36.1 22.5 38.4 428,740 227,270 141,830 59,640 6,295
1976 67.7 34.1 24.4 41.7 428,170 215,493 154,170 58,520 6,3281977 69.7 33.8 26.5 43.9 440,500 213,788 167,230 59,480 6,3191978 68.6 32.2 27.2 45.8 431,240 202,661 170,950 57,630 6,2911979 70.7 32.3 29.1 47.4 438,540 200,137 180,350 58,060 6,2041980 72.8 32.7 30.5 48.3 441,630 198,222 185,240 58,170 6,064
1981 71.9 32.0 30.4 48.7 420,480 187,397 177,820 55,260 5,8501982 72.0 32.2 30.3 48.5 404,700 181,162 170,280 53,260 5,6221983 72.3 31.8 31.0 49.4 392,360 172,673 168,320 51,370 5,4281984 70.5 31.0 30.3 49.4 379,150 166,744 162,780 49,630 5,3751985 71.3 31.0 31.0 50.0 385,680 167,789 167,580 50,320 5,408
1986 70.0 30.6 30.3 49.8 386,220 168,572 167,210 50,440 5,5151987 71.0 31.7 30.0 48.6 386,480 172,591 163,060 50,820 5,4441988 74.0 33.7 30.5 47.6 388,200 176,624 160,230 51,350 5,2471989 74.8 36.4 28.3 43.8 372,200 181,044 140,860 50,300 4,9741990 74.6 37.5 26.9 41.8 364,730 183,327 131,580 49,820 4,889
1991 73.2 38.5 24.5 38.9 357,630 188,226 119,780 49,620 4,8831992 70.6 37.5 23.3 38.2 352,820 187,549 116,150 49,120 4,9951993 69.7 37.4 22.5 37.6 354,800 190,535 114,690 49,580 5,0881994 68.1 37.2 21.3 36.5 357,360 195,169 111,960 50,230 5,2511995 64.4 35.5 19.8 35.9 349,360 192,508 107,590 49,260 5,426
TABLE 1.2. Among women aged 15–17, rates of pregnancy, birth and abortion; abortion ratios; numbers of pregnancies, births, abortions and fetal losses; and population, 1973–2013
22

Pregnancy Abortion Abortion Total Estimated PopulationYear rate Birthrate rate ratio* pregnancies Births Abortions fetal losses† (in 000s)
TABLE 1.2. Among women aged 15–17, rates of pregnancy, birth and abortion; abortion ratios; numbers of pregnancies, births, abortions and fetal losses; and population, 1973–2013
1996 60.7 33.3 18.9 36.2 338,800 185,721 105,400 47,680 5,5831997 56.9 31.4 17.4 35.7 326,160 180,154 99,980 46,030 5,7321998 54.2 29.9 16.6 35.7 313,800 173,231 96,290 44,280 5,7891999 50.8 28.2 15.5 35.5 295,130 163,588 89,840 41,700 5,8092000 48.4 26.8 14.7 35.4 283,430 157,209 86,170 40,060 5,862
2001 44.4 24.5 13.6 35.8 263,380 145,324 80,900 37,150 5,9282002 42.0 23.1 13.0 35.9 252,070 138,731 77,810 35,530 6,0082003 40.5 22.2 12.6 36.2 245,290 134,384 76,390 34,520 6,0602004 39.2 21.8 11.8 35.2 240,740 133,980 72,690 34,070 6,1462005 37.8 21.1 11.4 35.1 239,050 133,191 72,020 33,840 6,319
2006 38.5 21.6 11.4 34.6 247,700 138,943 73,610 35,150 6,4342007 38.1 21.7 11.0 33.6 247,000 140,566 71,200 35,230 6,4842008 37.0 21.1 10.6 33.4 237,590 135,664 67,990 33,930 6,4172009 34.1 19.6 9.6 33.0 216,350 124,247 61,140 30,960 6,3442010 30.3 17.4 8.6 33.0 190,200 109,173 53,810 27,220 6,282
2011 26.7 15.4 7.5 32.7 165,810 95,538 46,510 23,760 6,2062012 24.0 14.1 6.4 31.4 147,130 86,423 39,470 21,230 6,1422013 20.8 12.2 5.5 31.1 126,880 74,820 33,730 18,340 6,111
*Number of abortions divided by the sum of births and abortions and multiplied by 100. †Includes miscarriages and stillbirths. Note: All rates are the number of events per 1,000 women aged 15–17; pregnancy rate includes estimated number of pregnancies ending in miscarriage or stillbirth.
23(continued)

Pregnancy Abortion Abortion Total Estimated PopulationYear rate Birthrate rate ratio* pregnancies Births Abortions fetal losses† (in 000s)
1973 145.1 91.4 32.1 26.0 580,200 365,693 128,520 85,990 4,0001974 149.4 88.9 38.8 30.4 607,140 361,272 157,830 88,040 4,0651975 151.7 85.1 45.1 34.6 632,760 354,968 188,000 89,790 4,170
1976 151.5 80.6 49.8 38.2 645,100 343,251 211,990 89,850 4,2581977 157.2 80.9 54.6 40.3 671,050 345,366 233,280 92,400 4,2691978 160.7 79.8 59.0 42.5 686,090 340,746 252,000 93,350 4,2701979 166.3 81.3 62.5 43.5 714,740 349,335 268,670 96,730 4,2981980 165.6 82.0 61.2 42.7 715,260 353,939 264,130 97,200 4,318
1981 163.5 80.1 61.3 43.3 694,180 339,995 260,170 94,020 4,2451982 161.8 79.4 60.4 43.2 677,530 332,596 253,110 91,830 4,1871983 159.6 77.5 60.6 43.9 652,360 316,613 247,660 88,090 4,0871984 160.6 77.4 61.5 44.3 628,350 302,938 240,750 84,660 3,9131985 164.5 79.6 62.7 44.1 619,580 299,696 236,310 83,570 3,767
1986 162.9 79.5 61.4 43.6 601,340 293,333 226,670 81,330 3,6911987 160.5 78.4 60.4 43.5 593,160 289,721 223,180 80,260 3,6951988 164.7 79.8 62.7 44.0 622,980 301,729 237,190 84,060 3,7821989 167.8 84.2 60.7 41.9 648,660 325,459 234,650 88,560 3,8671990 173.3 89.9 59.5 39.8 652,750 338,499 224,130 90,110 3,766
1991 175.0 94.0 56.5 37.5 616,700 331,351 199,170 86,190 3,5241992 172.0 93.7 54.1 36.6 583,530 317,866 183,720 81,950 3,3931993 166.6 91.1 52.1 36.4 567,840 310,558 177,430 79,850 3,4081994 161.8 90.3 48.6 35.0 556,170 310,319 167,080 78,770 3,4381995 155.3 87.7 45.5 34.1 544,120 307,365 159,350 77,410 3,503
TABLE 1.3. Among women aged 18–19, rates of pregnancy, birth and abortion; abortion ratios; numbers of pregnancies, births, abortions and fetal losses; and population, 1973–2013
24

Pregnancy Abortion Abortion Total Estimated PopulationYear rate Birthrate rate ratio* pregnancies Births Abortions fetal losses† (in 000s)
TABLE 1.3. Among women aged 18–19, rates of pregnancy, birth and abortion; abortion ratios; numbers of pregnancies, births, abortions and fetal losses; and population, 1973–2013
1996 150.9 84.7 44.7 34.5 544,590 305,856 161,420 77,310 3,6101997 146.0 82.1 43.2 34.5 539,240 303,066 159,600 76,570 3,6931998 141.7 80.9 40.6 33.4 545,900 311,664 156,280 77,960 3,8521999 138.0 79.0 39.2 33.2 545,420 312,462 154,970 77,990 3,9532000 135.9 78.1 38.4 32.9 542,630 311,781 153,180 77,670 3,993
2001 130.9 75.5 36.6 32.6 521,010 300,620 145,690 74,690 3,9812002 124.4 72.2 34.4 32.3 494,480 286,762 136,700 71,020 3,9742003 119.9 69.6 33.1 32.2 482,750 280,196 133,190 69,360 4,0262004 117.5 68.7 31.9 31.7 481,270 281,282 130,660 69,320 4,0962005 116.0 68.4 30.9 31.1 477,480 281,402 127,080 68,990 4,116
2006 119.9 71.2 31.3 30.6 499,310 296,493 130,470 72,350 4,1632007 119.2 71.7 30.2 29.6 506,100 304,333 128,090 73,680 4,2472008 113.8 68.2 29.1 29.9 499,350 299,094 127,670 72,590 4,3892009 105.9 64.0 26.4 29.2 472,290 285,555 117,840 68,890 4,4612010 96.7 58.5 24.2 29.3 427,790 258,505 106,890 62,390 4,422
2011 89.2 54.0 22.2 29.1 386,830 234,234 96,140 56,460 4,3352012 83.2 51.3 19.7 27.8 355,330 218,965 84,160 52,210 4,2702013 76.1 46.9 18.0 27.7 321,550 198,285 76,010 47,260 4,226
*Number of abortions divided by the sum of births and abortions and multiplied by 100. †Includes miscarriages and stillbirths. Note: All rates are the number of events per 1,000 women aged 18–19; pregnancy rate includes estimated number of pregnancies ending in miscarriage or stillbirth.
25(continued)

Pregnancy Abortion Abortion Total Estimated PopulationYear rate Birthrate rate ratio* pregnancies Births Abortions fetal losses† (in 000s)‡
1973 13.5 6.1 5.6 47.7 28,330 12,861 11,730 3,740 2,0921974 14.4 6.0 6.5 51.9 29,920 12,529 13,530 3,860 2,0841975 15.2 6.0 7.3 54.9 32,100 12,642 15,390 4,070 2,118
1976 15.3 5.7 7.7 57.2 31,880 11,928 15,970 3,980 2,0811977 15.2 5.6 7.7 58.0 31,150 11,455 15,820 3,870 2,0491978 14.7 5.3 7.6 58.7 29,750 10,772 15,290 3,680 2,0201979 15.9 5.5 8.4 60.5 30,890 10,699 16,410 3,780 1,9451980 16.0 5.5 8.5 60.4 29,300 10,169 15,540 3,590 1,834
1981 16.0 5.4 8.6 61.6 28,540 9,632 15,440 3,470 1,7871982 16.0 5.6 8.5 60.2 28,000 9,773 14,790 3,430 1,7481983 16.8 5.5 9.3 62.9 29,910 9,752 16,550 3,610 1,7811984 16.9 5.5 9.4 63.2 30,790 9,965 17,120 3,710 1,8191985 16.8 5.5 9.3 62.7 31,150 10,220 17,170 3,760 1,853
1986 17.4 6.0 9.3 61.0 29,690 10,176 15,890 3,620 1,7061987 17.5 6.4 9.0 58.4 28,290 10,311 14,470 3,510 1,6141988 17.8 6.7 8.8 56.7 27,940 10,588 13,850 3,500 1,5731989 17.4 7.1 8.1 53.0 28,030 11,486 12,960 3,590 1,6081990 17.7 7.3 8.1 52.3 28,050 11,657 12,790 3,610 1,588
1991 16.8 7.2 7.5 50.9 28,130 12,014 12,470 3,650 1,6701992 17.1 7.2 7.7 51.6 28,990 12,220 13,020 3,750 1,6941993 16.5 7.1 7.2 50.1 28,930 12,554 12,600 3,770 1,7561994 15.6 7.0 6.6 48.7 28,970 12,901 12,260 3,810 1,8551995 14.4 6.6 5.9 47.4 26,800 12,242 11,010 3,550 1,861
TABLE 1.4. Among women aged 14 or younger, rates of pregnancy, birth and abortion; abortion ratios; numbers of pregnancies, births, abortions and fetal losses; and population, 1973–2013
26

Pregnancy Abortion Abortion Total Estimated PopulationYear rate Birthrate rate ratio* pregnancies Births Abortions fetal losses† (in 000s)‡
TABLE 1.4. Among women aged 14 or younger, rates of pregnancy, birth and abortion; abortion ratios; numbers of pregnancies, births, abortions and fetal losses; and population, 1973–2013
1996 13.1 5.8 5.5 48.6 24,970 11,148 10,540 3,280 1,9111997 11.9 5.3 5.1 49.2 22,940 10,121 9,810 3,010 1,9201998 11.6 5.0 5.0 50.2 21,840 9,462 9,530 2,850 1,8901999 10.6 4.6 4.5 49.5 20,640 9,054 8,890 2,700 1,9562000 10.1 4.3 4.4 50.6 19,830 8,519 8,730 2,580 1,972
2001 9.3 3.9 4.2 51.4 18,380 7,781 8,220 2,380 1,9802002 8.6 3.6 3.9 51.6 17,360 7,315 7,800 2,240 2,0152003 8.0 3.2 3.7 53.7 16,480 6,661 7,710 2,100 2,0582004 7.5 3.2 3.4 51.5 16,070 6,781 7,210 2,080 2,1472005 7.4 3.2 3.3 50.9 15,720 6,722 6,960 2,040 2,123
2006 7.1 3.0 3.1 50.9 14,960 6,396 6,620 1,940 2,1032007 7.0 3.0 3.1 51.0 14,520 6,195 6,450 1,880 2,0742008 6.7 2.8 3.0 51.7 13,700 5,764 6,170 1,770 2,0462009 6.0 2.5 2.8 52.8 12,230 5,029 5,630 1,570 2,0402010 5.5 2.2 2.5 53.3 11,050 4,497 5,140 1,410 2,023
2011 4.8 2.0 2.2 52.9 9,680 3,974 4,460 1,240 2,0212012 4.4 1.8 2.0 52.2 8,820 3,672 4,010 1,140 2,0212013 3.6 1.5 1.6 51.6 7,350 3,098 3,300 950 2,028
*Number of abortions divided by the sum of births and abortions and multiplied by 100.†Includes miscarriages and stillbirths. ‡Women aged 14. Notes: All rates are calculated as the number of events experienced by women aged 14 and younger divided by the female population aged 14. The denominator is limited to 14‐year‐olds because the majority of all pregnancies among women aged 14 and younger occur among 14‐year‐olds (see Methodology). The pregnancy rate includes the estimated number of pregnancies ending in miscarriage or stillbirth.
27(continued)

Pregnancy Abortion Abortion Total Estimated PopulationYear rate Birthrate rate ratio* pregnancies Births Abortions fetal losses† (in 000s)‡
1973 82.3 50.3 20.0 28.5 1,010,750 616,957 245,820 147,970 12,2751974 84.9 48.9 23.8 32.7 1,055,050 607,978 295,890 151,180 12,4241975 86.9 47.3 27.4 36.7 1,093,600 594,880 345,220 153,500 12,583
1976 87.2 45.1 30.2 40.1 1,105,150 570,672 382,130 152,350 12,6671977 90.4 45.2 32.9 42.2 1,142,700 570,609 416,330 155,760 12,6371978 91.2 44.0 34.8 44.2 1,147,080 554,179 438,240 154,660 12,5811979 95.1 45.0 37.4 45.4 1,184,180 560,171 465,430 158,580 12,4471980 97.1 46.0 38.1 45.3 1,186,190 562,330 464,900 158,960 12,216
1981 96.2 45.2 38.2 45.8 1,143,200 537,024 453,430 152,750 11,8831982 96.1 45.3 37.9 45.6 1,110,230 523,531 438,180 148,520 11,5561983 95.1 44.2 38.3 46.4 1,074,630 499,038 432,530 143,060 11,2961984 93.5 43.2 37.9 46.7 1,038,290 479,647 420,650 137,990 11,1071985 94.0 43.3 38.2 46.8 1,036,410 477,705 421,060 137,650 11,027
1986 93.2 43.3 37.6 46.5 1,017,250 472,081 409,780 135,390 10,9121987 93.7 44.0 37.3 45.9 1,007,930 472,623 400,710 134,600 10,7531988 98.0 46.1 38.8 45.7 1,039,120 488,941 411,270 138,920 10,6021989 100.4 49.6 37.2 42.9 1,048,900 517,989 388,470 142,440 10,4481990 102.1 52.1 36.0 40.9 1,045,530 533,483 368,500 143,550 10,244
1991 99.5 52.8 32.9 38.4 1,002,460 531,591 331,410 139,460 10,0771992 95.7 51.3 31.0 37.7 965,340 517,635 312,890 134,820 10,0831993 92.8 50.1 29.7 37.2 951,570 513,647 304,720 133,200 10,2521994 89.4 49.2 27.6 36.0 942,490 518,389 291,300 132,810 10,5441995 85.3 47.5 25.8 35.2 920,280 512,115 277,950 130,220 10,790
TABLE 1.5. Among women younger than 20, rates of pregnancy, birth and abortion; abortion ratios; numbers of pregnancies, births, abortions and fetal losses; and population, 1973–2013
28

Pregnancy Abortion Abortion Total Estimated PopulationYear rate Birthrate rate ratio* pregnancies Births Abortions fetal losses† (in 000s)‡
TABLE 1.5. Among women younger than 20, rates of pregnancy, birth and abortion; abortion ratios; numbers of pregnancies, births, abortions and fetal losses; and population, 1973–2013
1996 81.8 45.3 25.0 35.6 908,370 502,725 277,360 128,280 11,1041997 78.3 43.5 23.7 35.3 888,330 493,341 269,390 125,610 11,3451998 76.4 42.9 22.7 34.6 881,550 494,357 262,110 125,080 11,5311999 73.5 41.4 21.7 34.3 861,190 485,104 253,700 122,390 11,7172000 71.5 40.4 21.0 34.2 845,890 477,509 248,070 120,310 11,827
2001 67.5 38.2 19.8 34.1 802,770 453,725 234,820 114,230 11,8892002 63.7 36.1 18.5 33.9 763,910 432,808 222,310 108,790 11,9972003 61.3 34.7 17.9 34.0 744,520 421,241 217,300 105,980 12,1452004 59.6 34.1 17.0 33.3 738,070 422,043 210,560 105,470 12,3902005 58.3 33.6 16.4 32.8 732,250 421,315 206,060 104,870 12,557
2006 60.0 34.8 16.6 32.3 761,970 441,832 210,700 109,440 12,7002007 59.9 35.2 16.1 31.3 767,630 451,094 205,740 110,790 12,8062008 58.4 34.3 15.7 31.4 750,640 440,522 201,830 108,290 12,8522009 54.6 32.3 14.4 30.8 700,870 414,831 184,610 101,430 12,8442010 49.4 29.2 13.0 30.8 629,030 372,175 165,840 91,020 12,727
2011 53.3 31.7 14.0 30.6 562,320 333,746 147,110 81,460 10,5412012 49.1 29.7 12.3 29.2 511,280 309,060 127,640 74,580 10,4122013 44.1 26.7 10.9 29.0 455,780 276,203 113,040 66,540 10,337
*Number of abortions divided by the sum of births and abortions and multiplied by 100. †Includes miscarriages and stillbirths. ‡Women aged 15–19. Notes: All rates are calculated as the number of events experienced by women younger than 20, divided by the female population aged 15–19. The denominator is limited to 15–19‐year‐olds because 97–98% of all pregnancies among women younger than 20 occurred among 15–19‐year‐olds. The pregnancy rate includes estimated number of pregnancies ending in miscarriage or stillbirth.
29(continued)

Pregnancy Abortion Abortion Total Estimated PopulationYear rate Birthrate rate ratio* pregnancies Births Abortions fetal losses† (in 000s)
1973 172.6 119.8 26.2 17.9 1,586,180 1,101,113 240,760 244,300 9,1901974 174.9 117.8 30.5 20.6 1,645,130 1,108,051 286,790 250,290 9,4081975 173.3 113.0 34.3 23.3 1,677,450 1,093,676 331,850 251,920 9,677
1976 175.8 110.2 39.6 26.4 1,741,700 1,091,602 392,520 257,570 9,9051977 184.1 112.9 44.3 28.2 1,870,720 1,146,491 449,930 274,290 10,1591978 183.6 109.8 47.2 30.1 1,906,100 1,139,524 489,700 276,880 10,3801979 190.1 112.7 49.9 30.7 2,005,020 1,188,663 526,020 290,330 10,5461980 194.3 114.8 51.5 31.0 2,076,150 1,226,200 549,730 300,210 10,683
1981 191.1 112.2 51.4 31.4 2,065,190 1,212,000 555,270 297,930 10,8051982 190.1 111.6 51.1 31.4 2,054,380 1,205,979 552,010 296,400 10,8041983 185.4 107.8 51.0 32.1 1,995,630 1,160,274 548,460 286,900 10,7621984 185.0 106.8 51.6 32.6 1,976,470 1,141,578 551,440 283,460 10,6861985 187.1 108.3 52.0 32.5 1,972,770 1,141,320 548,350 283,100 10,541
1986 185.9 107.4 51.8 32.5 1,907,420 1,102,119 531,710 273,590 10,2581987 186.7 107.9 52.0 32.5 1,861,500 1,075,856 518,610 267,030 9,9711988 191.2 110.2 53.7 32.8 1,852,890 1,067,472 519,930 265,490 9,6891989 195.7 113.7 53.8 32.1 1,853,840 1,077,598 509,740 266,490 9,4731990 202.1 116.4 56.7 32.8 1,898,570 1,093,730 532,820 272,030 9,396
1991 200.5 115.3 56.5 32.9 1,894,590 1,089,692 533,600 271,300 9,4511992 198.0 113.7 55.9 33.0 1,864,070 1,070,490 526,800 266,780 9,4171993 194.0 111.3 55.0 33.1 1,809,660 1,038,127 512,640 258,890 9,3281994 188.2 109.2 51.9 32.2 1,725,020 1,001,418 475,750 247,860 9,1681995 182.9 107.5 49.1 31.4 1,643,830 965,547 441,060 237,220 8,986
TABLE 1.6. Among women aged 20–24, rates of pregnancy, birth and abortion; abortion ratios; numbers of pregnancies, births, abortions and fetal losses; and population, 1973–2013
30

Pregnancy Abortion Abortion Total Estimated PopulationYear rate Birthrate rate ratio* pregnancies Births Abortions fetal losses† (in 000s)
TABLE 1.6. Among women aged 20–24, rates of pregnancy, birth and abortion; abortion ratios; numbers of pregnancies, births, abortions and fetal losses; and population, 1973–2013
1996 183.6 107.8 49.3 31.4 1,609,910 945,210 432,420 232,280 8,7701997 181.7 107.3 48.1 31.0 1,595,140 942,048 422,440 230,650 8,7811998 181.8 108.4 47.0 30.2 1,618,280 965,122 418,300 234,850 8,9011999 180.6 107.9 46.5 30.1 1,643,410 981,929 422,820 238,670 9,0992000 181.2 108.9 46.0 29.7 1,694,240 1,017,806 429,880 246,550 9,350
2001 175.6 105.6 44.5 29.6 1,699,170 1,021,627 430,190 247,340 9,6772002 170.6 103.1 42.7 29.3 1,692,180 1,022,106 423,320 246,750 9,9162003 168.3 102.3 41.4 28.8 1,698,750 1,032,305 418,170 248,280 10,0942004 165.6 101.5 39.8 28.2 1,687,680 1,034,454 405,760 247,470 10,1912005 164.7 101.8 38.7 27.6 1,684,190 1,040,388 396,110 247,690 10,223
2006 170.4 105.5 39.8 27.4 1,744,710 1,080,437 407,450 256,830 10,2392007 168.8 105.4 38.5 26.7 1,733,340 1,082,354 395,020 255,970 10,2702008 164.3 101.8 38.4 27.4 1,699,260 1,052,184 396,940 250,130 10,3402009 155.0 96.2 36.0 27.2 1,621,160 1,005,982 376,350 238,830 10,4592010 144.9 89.5 34.1 27.6 1,540,810 951,688 362,530 226,590 10,631
2011 137.5 85.2 32.1 27.4 1,493,480 925,200 348,400 219,880 10,8602012 132.5 82.9 30.0 26.6 1,464,720 916,811 331,410 216,500 11,0542013 127.4 80.4 28.1 25.9 1,420,930 896,745 313,480 210,700 11,152
*Number of abortions divided by the sum of births and abortions and multiplied by 100. †Includes miscarriages and stillbirths. Note: All rates are the number of events per 1,000 women aged 20–24; pregnancy rate includes estimated number of pregnancies ending in miscarriage or stillbirth.
31(continued)

Race/ethnicity and measure 1990 1991 1992 1993 1994 1995 1996 1997 1998 1999TOTALPregnancy rate 117.6 115.9 111.6 108.6 105.1 100.1 96.1 91.8 89.2 86.1Birthrate 60.3 61.8 60.3 59.0 58.2 56.0 53.5 51.3 50.3 48.8Abortion rate 41.1 37.9 35.7 34.4 32.1 29.9 29.0 27.5 26.2 25.1Abortion ratio 40.5 38.0 37.2 36.8 35.6 34.8 35.2 34.9 34.2 34.0
RACEWhitePregnancy rate 98.2 96.1 91.9 89.5 87.3 84.5 81.0 77.5 75.5 73.0Birthrate 51.2 52.6 51.4 50.6 50.5 49.5 47.5 45.5 44.9 44.0Abortion rate 33.4 29.9 27.4 26.1 24.3 22.8 21.8 20.8 19.6 18.3Abortion ratio 39.4 36.3 34.8 34.0 32.4 31.5 31.5 31.3 30.4 29.4
BlackPregnancy rate 226.7 225.6 220.2 213.4 201.9 184.1 178.3 170.7 164.7 158.7Birthrate 112.9 114.8 111.3 107.3 102.9 94.4 89.6 86.3 83.5 79.1Abortion rate 82.9 79.9 78.7 76.9 71.3 64.3 64.3 61.1 58.6 58.0Abortion ratio 42.3 41.0 41.4 41.7 40.9 40.5 41.8 41.5 41.2 42.3
All nonwhitePregnancy rate 194.7 193.5 188.3 182.3 173.4 159.0 152.8 145.2 139.7 134.2Birthrate 96.3 97.8 94.6 91.2 87.5 80.5 75.9 72.6 70.2 66.1Abortion rate 71.9 69.2 68.0 66.3 62.2 56.8 56.1 52.8 50.4 49.9Abortion ratio 42.7 41.5 41.8 42.1 41.5 41.4 42.5 42.1 41.8 43.0
RACE/ETHNICITY
Non‐Hispanic white*Pregnancy rate u 83.2 77.4 75.0 72.5 69.6 66.1 63.5 60.9 57.9Birthrate 42.6 43.1 41.5 40.7 40.4 39.3 37.6 36.0 35.3 34.1Abortion rate u 28.6 25.1 23.8 21.8 20.4 19.1 18.4 16.8 15.4Abortion ratio u 39.8 37.7 36.9 35.0 34.2 33.7 33.9 32.3 31.1
Non‐Hispanic blackPregnancy rate u u u u u u u u u uBirthrate u u u u u u u u u uAbortion rate u u u u u u u u u uAbortion ratio u u u u u u u u u u
Non‐Hispanic other Pregnancy rate u u u u u u u u u uBirthrate u u u u u u u u u uAbortion rate u u u u u u u u u uAbortion ratio u u u u u u u u u u
HispanicPregnancy rate u 165.6 166.8 163.1 161.2 156.3 151.1 141.6 140.4 137.8Birthrate 99.5 104.6 103.3 101.8 101.3 99.3 94.6 89.6 87.9 86.8Abortion rate u 36.4 39.0 37.2 36.0 33.7 34.1 31.0 31.8 30.7Abortion ratio u 25.8 27.4 26.8 26.2 25.3 26.5 25.7 26.5 26.1*Pregnancy rates, birthrates and abortion ratios of non‐Hispanic whites follow the NCHS methodology of including all births to white women of unknown Hispanic ethnicity with non‐Hispanic births (<1% of all birth certificates). Notes: All rates are the number of events per 1,000 women aged 15–19; pregnancy rate includes the estimated number of pregnancies ending in miscarriage or stillbirth. The abortion ratio is the number of abortions divided by the sum of births and abortions and multiplied by 100. In this and subsequent tables, data are tabulated according to the womanʹs age at the pregnancy outcome and, for births, according to the mother´s race (not the child´s). Numbers and rates may differ slightly from those published previously (see text). u=unavailable.
TABLE 1.7. Among women aged 15–19, rates of pregnancy, birth and abortion; and abortion ratios, by race, and by race and ethnicity, according to year, 1990–2013
32

Race/ethnicity and measure 2000 2001 2002 2003 2004 2005 2006 2007 2008 2009TOTALPregnancy rate 83.8 79.2 74.8 72.2 70.5 68.7 70.5 70.2 68.2 63.7Birthrate 47.6 45.0 42.6 41.1 40.5 39.7 41.1 41.5 40.2 37.9Abortion rate 24.3 22.9 21.5 20.8 19.9 19.1 19.3 18.6 18.1 16.6Abortion ratio 33.8 33.7 33.5 33.6 32.9 32.4 31.9 30.9 31.0 30.4
RACEWhitePregnancy rate 70.9 67.4 64.1 62.0 60.5 58.8 60.3 60.6 58.6 54.9Birthrate 43.1 41.0 39.2 38.0 37.4 36.7 37.9 38.4 37.3 35.3Abortion rate 17.5 16.5 15.5 14.9 14.1 13.4 13.5 13.2 12.5 11.4Abortion ratio 28.9 28.7 28.3 28.2 27.4 26.7 26.2 25.6 25.1 24.5
BlackPregnancy rate 155.5 145.2 135.5 129.0 126.1 122.2 125.0 122.3 120.2 112.1Birthrate 77.2 71.3 65.8 62.5 61.7 60.1 62.2 62.1 60.1 56.5Abortion rate 57.2 54.3 51.4 49.1 47.3 45.6 45.7 43.5 43.7 40.3Abortion ratio 42.6 43.2 43.9 44.0 43.4 43.1 42.4 41.2 42.1 41.6
All nonwhitePregnancy rate 131.0 121.8 113.0 107.9 105.0 101.8 103.9 101.0 98.7 91.2Birthrate 64.2 59.3 54.7 52.0 51.2 49.9 51.4 51.3 49.5 46.2Abortion rate 49.1 46.0 43.0 41.4 39.6 38.1 38.3 35.9 35.8 32.6Abortion ratio 43.3 43.6 44.0 44.3 43.6 43.3 42.7 41.2 42.0 41.4
RACE/ETHNICITY
Non‐Hispanic white*Pregnancy rate 55.3 51.5 48.2 46.4 44.5 43.3 44.0 44.4 43.4 41.3Birthrate 32.6 30.3 28.6 27.4 26.7 26.0 26.7 27.2 26.7 25.7Abortion rate 14.7 13.8 12.7 12.3 11.3 11.0 10.9 10.7 10.3 9.5Abortion ratio 31.1 31.4 30.7 30.9 29.7 29.8 29.1 28.2 27.7 27.0
Non‐Hispanic blackPregnancy rate u u u u u u u u u uBirthrate u u u u u u u u u uAbortion rate u u u u u u u u u uAbortion ratio u u u u u u u u u u
Non‐Hispanic other Pregnancy rate u u u u u u u u u uBirthrate u u u u u u u u u uAbortion rate u u u u u u u u u uAbortion ratio u u u u u u u u u u
HispanicPregnancy rate 135.6 130.8 125.4 121.2 120.9 116.0 117.2 113.8 105.8 95.0Birthrate 86.6 84.4 80.6 78.4 78.1 76.5 77.4 75.3 70.3 63.6Abortion rate 28.8 26.8 26.0 24.7 24.7 22.1 22.1 21.3 19.4 16.9Abortion ratio 25.0 24.1 24.4 24.0 24.1 22.4 22.2 22.1 21.6 21.0*Pregnancy rates, birthrates and abortion ratios of non‐Hispanic whites follow the NCHS methodology of including all births to white women of unknown Hispanic ethnicity with non‐Hispanic births (<1% of all birth certificates). Notes: All rates are the number of events per 1,000 women aged 15–19; pregnancy rate includes the estimated number of pregnancies ending in miscarriage or stillbirth. The abortion ratio is the number of abortions divided by the sum of births and abortions and multiplied by 100. In this and subsequent tables, data are tabulated according to the womanʹs age at the pregnancy outcome and, for births, according to the mother´s race (not the child´s). Numbers and rates may differ slightly from those published previously (see text). u=unavailable.
TABLE 1.7. Among women aged 15–19, rates of pregnancy, birth and abortion; and abortion ratios, by race, and by race and ethnicity, according to year, 1990–2013
(continued) 33

Race/ethnicity and measure 2010 2011 2012 2013TOTALPregnancy rate 57.7 52.4 48.3 43.4Birthrate 34.3 31.3 29.3 26.4Abortion rate 15.0 13.5 11.9 10.6Abortion ratio 30.4 30.2 28.8 28.7
RACEWhitePregnancy rate 49.6 44.9 41.8 37.6Birthrate 32.0 29.1 27.4 24.9Abortion rate 10.2 9.1 8.1 7.0Abortion ratio 24.1 23.8 22.9 22.0
BlackPregnancy rate 102.2 93.8 84.6 76.1Birthrate 51.4 47.2 43.9 39.0Abortion rate 36.9 33.8 28.9 26.7Abortion ratio 41.8 41.7 39.7 40.6
All nonwhitePregnancy rate 82.8 75.8 68.4 61.6Birthrate 41.6 38.1 35.4 31.2Abortion rate 29.9 27.4 23.6 21.9Abortion ratio 41.9 41.8 40.0 41.2
RACE/ETHNICITY
Non‐Hispanic white*Pregnancy rate 37.7 35.3 33.0 29.6Birthrate 23.6 21.7 20.5 18.6Abortion rate 8.5 8.5 7.7 6.6Abortion ratio 26.4 28.0 27.4 26.1
Non‐Hispanic blackPregnancy rate u 92.6 83.7 75.1Birthrate u 47.2 43.8 38.9Abortion rate u 32.6 28.3 25.8Abortion ratio u 40.9 39.2 39.9
Non‐Hispanic other Pregnancy rate u 33.4 30.1 28.1Birthrate u 16.3 15.5 13.6Abortion rate u 12.6 10.5 10.7Abortion ratio u 43.7 40.4 44.1
HispanicPregnancy rate 83.0 73.5 67.4 60.8Birthrate 55.6 49.6 46.3 41.5Abortion rate 14.8 12.7 10.8 10.0Abortion ratio 21.0 20.3 19.0 19.3*Pregnancy rates, birthrates and abortion ratios of non‐Hispanic whites follow the NCHS methodology of including all births to white women of unknown Hispanic ethnicity with non‐Hispanic births (<1% of all birth certificates). Notes: All rates are the number of events per 1,000 women aged 15–19; pregnancy rate includes the estimated number of pregnancies ending in miscarriage or stillbirth. The abortion ratio is the number of abortions divided by the sum of births and abortions and multiplied by 100. In this and subsequent tables, data are tabulated according to the womanʹs age at the pregnancy outcome and, for births, according to the mother´s race (not the child´s). Numbers and rates may differ slightly from those published previously (see text). u=unavailable.
TABLE 1.7. Among women aged 15–19, rates of pregnancy, birth and abortion; and abortion ratios, by race, and by race and ethnicity, according to year, 1990–2013
(continued) 34

State1988 1992 1996 2000 2005 2008 2010 2011 2013
Total 112 112 96 84 69 68 58 52 43Alabama 111 † 117 103 90 71 73 63 59 48Alaska 111 † 112 † 83 75 ‡ 65 69 64 59 47Arizona 127 132 115 105 90 82 60 56 47Arkansas 114 116 106 93 80 82 73 69 59California 155 † 158 † 123 † 96 ‡ 75 ‡ 73 ‡ 60 ‡ 54 ‡ 44 ‡
Colorado 102 112 93 82 69 66 54 47 37Connecticut 108 96 85 71 58 56 45 38 29Delaware 119 † 119 90 92 76 82 68 60 46District of Columbia 211 256 150 123 111 113 90 79 67Florida 134 † 125 † 113 † 98 † 78 ‡ 73 ‡ 60 ‡ 56 ‡ 46 ‡
Georgia 123 127 107 95 79 78 65 59 47Hawaii 134 141 103 93 72 77 65 61 44Idaho 73 78 70 62 53 57 47 41 36Illinois 113 † 112 104 87 67 69 57 51 43Indiana 90 95 87 73 61 59 53 49 42
Iowa 69 † 67 † 58 † 54 49 51 44 39 32Kansas 88 91 79 69 59 63 53 48 40Kentucky 97 99 89 75 65 71 62 59 52Louisiana 107 108 97 87 67 † 80 † 69 66 54Maine 82 71 58 52 43 43 37 34 29
Maryland 129 119 103 92 66 † 64 † 58 † 55 † 42 †Massachusetts 97 87 77 60 46 43 37 33 24Michigan 111 109 88 75 60 58 52 47 39Minnesota 69 64 56 50 42 42 36 31 26Mississippi 106 122 106 102 83 90 77 70 58
Missouri 99 100 85 74 62 65 54 51 43Montana 73 81 66 60 56 59 53 47 41Nebraska 75 71 62 59 48 51 43 39 35Nevada 143 144 141 116 94 85 69 62 49New Hampshire 88 † 62 † 57 † 47 † 33 † 33 † 28 † 26 † 22 †
Pregnancy rate*TABLE 2.1. Pregnancy rates among women aged 15–19, by year, according to state, selected years 1988–2013
35

State1988 1992 1996 2000 2005 2008 2010 2011 2013
Pregnancy rate*TABLE 2.1. Pregnancy rates among women aged 15–19, by year, according to state, selected years 1988–2013
New Jersey 113 97 97 92 71 62 51 47 36New Mexico 125 129 110 103 93 93 80 72 62New York 116 119 104 91 76 72 63 58 45North Carolina 123 121 103 95 73 73 60 53 44North Dakota 58 59 49 41 41 43 42 40 34
Ohio 97 93 81 74 61 63 54 49 41Oklahoma 105 † 100 † 90 † 85 74 80 69 65 58Oregon 106 99 90 79 57 61 47 44 36Pennsylvania 87 84 68 60 51 56 49 44 35Rhode Island 86 94 80 66 56 54 44 41 32
South Carolina 115 109 94 88 76 77 66 59 48South Dakota 69 74 60 54 50 53 47 46 38Tennessee 111 112 97 89 77 76 62 58 49Texas 117 122 113 101 87 86 73 65 58Utah 69 65 58 52 43 48 38 33 28
Vermont 81 71 60 44 38 39 32 32 28Virginia 107 101 87 72 60 56 48 43 36Washington 109 108 87 75 59 61 50 47 37West Virginia 79 † 86 74 67 60 65 64 63 54Wisconsin 75 73 61 55 46 45 39 34 28Wyoming 83 81 76 77 § 64 † 68 † 56 † 52 † 41 †
*Pregnancy rate is the number of events per 1,000 women aged 15–19; includes estimated number of pregnancies ending in fetal loss. †Estimate based on the number of abortions among all women in the state and the proportion of abortions obtained by women of the same age in neighboring or similar states. ‡Estimate based on the number of abortions among all women in the state and the proportion of abortions obtained by women of the same age nationally. §Estimate obtained by applying the average of the proportions of abortions obtained by 15–19‐year‐old women in Wyoming in 1992, 1996 and 1999 to the number of abortions among all women in the state in 2000.
36(continued)
State1988 1992 1996 2000 2005 2008 2010 2011 2013
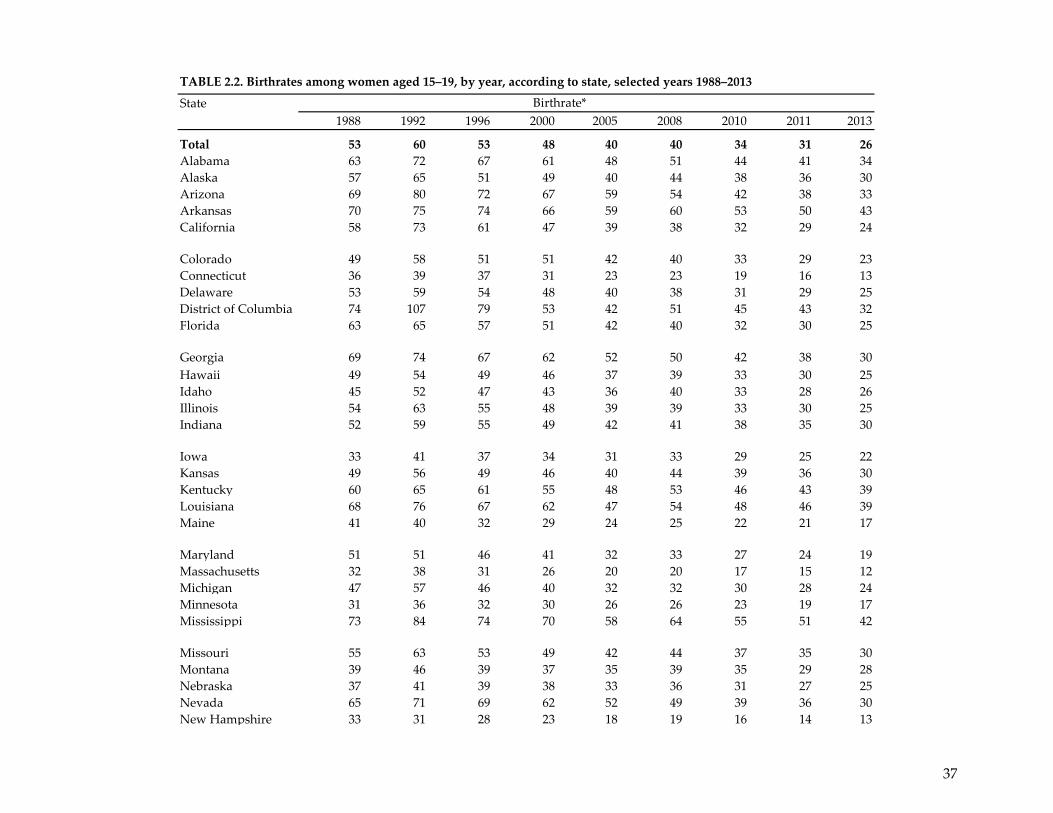
Total 53 60 53 48 40 40 34 31 26Alabama 63 72 67 61 48 51 44 41 34Alaska 57 65 51 49 40 44 38 36 30Arizona 69 80 72 67 59 54 42 38 33Arkansas 70 75 74 66 59 60 53 50 43California 58 73 61 47 39 38 32 29 24
Colorado 49 58 51 51 42 40 33 29 23Connecticut 36 39 37 31 23 23 19 16 13Delaware 53 59 54 48 40 38 31 29 25District of Columbia 74 107 79 53 42 51 45 43 32Florida 63 65 57 51 42 40 32 30 25
Georgia 69 74 67 62 52 50 42 38 30Hawaii 49 54 49 46 37 39 33 30 25Idaho 45 52 47 43 36 40 33 28 26Illinois 54 63 55 48 39 39 33 30 25Indiana 52 59 55 49 42 41 38 35 30
Iowa 33 41 37 34 31 33 29 25 22Kansas 49 56 49 46 40 44 39 36 30Kentucky 60 65 61 55 48 53 46 43 39Louisiana 68 76 67 62 47 54 48 46 39Maine 41 40 32 29 24 25 22 21 17
Maryland 51 51 46 41 32 33 27 24 19Massachusetts 32 38 31 26 20 20 17 15 12Michigan 47 57 46 40 32 32 30 28 24Minnesota 31 36 32 30 26 26 23 19 17Mississippi 73 84 74 70 58 64 55 51 42
Missouri 55 63 53 49 42 44 37 35 30Montana 39 46 39 37 35 39 35 29 28Nebraska 37 41 39 38 33 36 31 27 25Nevada 65 71 69 62 52 49 39 36 30New Hampshire 33 31 28 23 18 19 16 14 13
Birthrate*
TABLE 2.2. Birthrates among women aged 15–19, by year, according to state, selected years 1988–2013
37

State1988 1992 1996 2000 2005 2008 2010 2011 2013
Birthrate*
TABLE 2.2. Birthrates among women aged 15–19, by year, according to state, selected years 1988–2013
New Jersey 39 39 35 32 24 24 20 19 15New Mexico 72 80 70 66 61 61 53 48 43New York 40 45 40 33 26 26 23 21 18North Carolina 61 69 62 59 47 47 38 35 28North Dakota 31 37 32 27 27 28 29 28 24
Ohio 52 58 50 46 38 39 34 31 27Oklahoma 62 70 63 60 53 58 50 48 43Oregon 48 53 50 43 33 36 28 26 22Pennsylvania 41 45 38 34 29 30 27 25 21Rhode Island 38 46 39 34 28 28 22 21 18
South Carolina 65 70 60 58 49 51 43 39 32South Dakota 44 48 40 38 37 39 35 34 29Tennessee 64 71 64 59 53 52 43 41 35Texas 69 78 73 69 61 61 52 47 41Utah 44 46 41 38 31 35 28 24 21
Vermont 33 36 30 23 17 20 18 17 14Virginia 46 52 45 41 33 33 27 24 20Washington 47 51 46 39 31 33 27 25 20West Virginia 50 56 51 46 42 47 45 44 40Wisconsin 38 42 37 35 30 30 26 23 20Wyoming 48 50 45 42 43 47 39 35 30
*Number of births per 1,000 women aged 15–19.
38(continued)

State1988 1992 1996 2000 2005 2008 2010 2011 2013
Total 44 36 29 24 19 18 15 14 11Alabama 32 † 28 20 16 12 11 9 9 7Alaska 39 † 31 † 20 15 ‡ 16 15 17 14 10Arizona 41 32 27 22 18 15 9 9 7Arkansas 28 24 16 12 9 10 9 8 6California 77 † 64 † 45 † 36 ‡ 26 ‡ 25 ‡ 20 ‡ 18 ‡ 14 ‡
Colorado 40 38 29 19 17 16 13 11 8Connecticut 59 45 37 31 27 26 20 17 13Delaware 50 † 44 23 31 25 33 28 23 15District of Columbia 111 117 50 53 55 47 33 25 26Florida 53 † 43 † 40 † 34 † 24 ‡ 23 ‡ 20 ‡ 19 ‡ 15 ‡
Georgia 37 34 25 19 15 17 13 13 10Hawaii 68 69 41 35 26 27 24 23 13Idaho 18 14 12 10 9 8 7 6 4Illinois 43 † 33 34 27 19 20 16 14 12Indiana 25 22 19 13 10 8 7 6 5
Iowa 27 † 16 † 12 † 12 10 10 9 8 5Kansas 27 22 18 12 10 9 6 5 4Kentucky 22 20 14 8 6 7 6 6 5Louisiana 23 15 16 11 10 † 14 † 11 10 7Maine 30 21 18 15 12 12 10 8 8
Maryland 62 53 44 38 25 † 22 † 23 † 23 † 17 †Massachusetts 54 38 36 26 20 17 15 13 9Michigan 50 37 29 24 20 18 14 13 10Minnesota 29 19 16 13 11 10 8 7 6Mississippi 16 20 16 16 11 12 9 8 7
Missouri 30 22 20 14 11 11 9 8 7Montana 24 24 17 15 13 11 10 10 7Nebraska 28 20 14 12 8 7 5 6 5Nevada 59 54 52 37 29 24 20 17 11New Hampshire 44 † 22 † 21 † 17 † 11 † 10 † 9 † 9 † 7 †
TABLE 2.3. Abortion rates among women aged 15–19, by year, according to state, selected years 1988–2013 Abortion rate*
39

State1988 1992 1996 2000 2005 2008 2010 2011 2013
TABLE 2.3. Abortion rates among women aged 15–19, by year, according to state, selected years 1988–2013 Abortion rate*
New Jersey 60 45 50 49 38 30 25 22 17New Mexico 35 30 23 22 18 18 15 12 9New York 62 60 51 47 41 38 33 30 22North Carolina 45 34 26 22 16 14 12 10 9North Dakota 19 14 10 8 8 8 7 6 4
Ohio 31 22 19 17 14 14 12 10 8Oklahoma 28 † 15 † 13 † 13 10 9 8 7 6Oregon 44 32 27 25 16 16 12 11 9Pennsylvania 34 28 20 18 14 18 15 13 9Rhode Island 37 35 30 23 20 19 16 14 10
South Carolina 33 23 20 17 16 14 13 11 9South Dakota 15 15 10 7 6 6 4 5 3Tennessee 31 24 18 16 12 12 9 8 7Texas 31 26 23 17 13 12 10 8 8Utah 15 9 8 6 6 6 4 4 3
Vermont 38 26 22 14 16 13 9 11 9Virginia 47 36 30 21 18 15 14 12 11Washington 48 43 29 26 20 20 16 15 11West Virginia 17 † 16 12 10 8 8 9 10 5Wisconsin 27 21 16 12 10 8 7 6 5Wyoming 23 20 20 25 § 12 † 10 † 8 † 9 † 5 †
*Number of abortions per 1,000 women aged 15–19. †Estimate based on the number of abortions among all women in the state and the proportion of abortions obtained by women of the same age in neighboring or similar states. ‡Estimate based on the number of abortions among all women in the state and the proportion of abortions obtained by women of the same age nationally. §Estimate obtained by applying the average of the proportions of abortions obtained by 15–19‐year‐old women in Wyoming in 1992, 1996 and 1999 to the number of abortions among all women in the state in 2000.
40(continued)

State1988 1992 1996 2000 2005 2008 2010 2011 2013
Total 45 37 35 34 32 31 30 30 29Alabama 34 † 28 23 21 20 18 17 18 16Alaska 40 † 32 † 28 23 ‡ 28 25 31 28 25Arizona 37 29 27 24 23 22 18 20 17Arkansas 28 24 18 16 13 14 14 13 12California 57 † 47 † 43 † 44 ‡ 40 ‡ 39 ‡ 39 ‡ 38 ‡ 38 ‡
Colorado 45 39 37 27 29 28 27 28 26Connecticut 62 53 50 50 54 54 52 51 50Delaware 49 † 43 30 40 38 46 48 44 39District of Columbia 60 52 38 50 57 48 42 37 45Florida 46 † 40 † 41 † 40 † 37 ‡ 36 ‡ 38 ‡ 39 ‡ 38 ‡
Georgia 35 32 27 23 22 25 24 25 25Hawaii 58 56 45 43 41 41 42 44 35Idaho 28 22 21 19 19 17 17 18 14Illinois 45 † 34 38 36 33 34 32 33 33Indiana 32 28 26 20 19 17 17 15 15
Iowa 45 † 29 † 24 † 26 25 23 24 23 18Kansas 35 28 26 21 19 17 12 12 13Kentucky 27 23 18 13 12 12 12 12 11Louisiana 25 17 19 16 17 † 21 † 18 18 15Maine 42 34 36 34 34 32 32 29 31
Maryland 55 51 49 48 44 † 41 † 45 † 49 † 47 †Massachusetts 63 50 54 50 50 47 46 47 44Michigan 51 40 38 38 38 36 32 32 30Minnesota 49 34 33 30 29 27 26 28 25Mississippi 18 19 18 19 16 16 14 14 14
Missouri 36 26 27 23 21 21 19 19 18Montana 38 34 31 29 27 23 22 26 20Nebraska 43 33 27 25 19 16 15 18 16Nevada 48 43 43 37 36 32 34 32 27New Hampshire 57 † 42 † 42 † 43 † 38 † 33 † 35 † 39 † 34 †
TABLE 2.4. Abortion ratios among women aged 15–19, by year, according to state, selected years 1988–2013 Abortion ratio*
41

State1988 1992 1996 2000 2005 2008 2010 2011 2013
TABLE 2.4. Abortion ratios among women aged 15–19, by year, according to state, selected years 1988–2013 Abortion ratio*
New Jersey 61 54 59 60 61 56 55 54 53New Mexico 33 27 24 25 22 22 22 20 17New York 61 57 56 58 61 60 59 59 56North Carolina 43 33 29 28 25 23 24 22 25North Dakota 37 27 24 23 22 22 19 17 15
Ohio 38 27 27 27 27 26 26 24 22Oklahoma 31 † 17 † 17 † 17 16 14 13 12 12Oregon 48 38 34 37 33 31 30 30 28Pennsylvania 45 38 34 34 33 37 36 33 31Rhode Island 49 43 44 41 42 40 42 40 36
South Carolina 34 25 25 23 25 21 24 22 22South Dakota 25 23 21 16 13 12 11 12 10Tennessee 33 25 22 21 18 19 18 17 16Texas 31 25 24 20 18 16 16 15 16Utah 26 17 15 13 16 14 13 15 14
Vermont 53 42 43 38 47 39 34 39 40Virginia 50 41 40 34 35 32 34 34 35Washington 50 45 39 40 39 37 37 37 35West Virginia 26 † 23 19 17 17 14 17 18 11Wisconsin 41 33 30 26 24 21 21 20 19Wyoming 33 28 31 37 § 22 † 17 † 17 † 20 † 15 †
*Number of abortions divided by the sum of births and abortions, multiplied by 100. †Estimate based on the number of abortions among all women in the state and the proportion of abortions obtained by women of the same age in neighboring or similar states. ‡Estimate based on the number of abortions among all women in the state and the proportion of abortions obtained by women of the same age nationally. §Estimate obtained by applying the average of the proportions of abortions obtained by 15–19‐year‐old women in Wyoming in 1992, 1996 and 1999 to the number of abortions among all women in the state in 2000.
42(continued)

15–19 15–17 18–19 15–19 15–17 18–19 15–19 15–17 18–19Total 43 21 76 26 12 47 11 6 18 29Alabama 48 22 86 34 16 61 7 3 12 16Alaska 47 19 95 30 11 63 10 6 18 25Arizona 47 22 85 33 15 60 7 3 12 17Arkansas 59 26 110 43 18 83 6 3 10 12California‡ 44 21 77 24 11 42 14 7 25 38
Colorado 37 18 64 23 12 40 8 4 14 26Connecticut 29 16 48 13 6 22 13 7 20 50Delaware 46 25 74 25 12 40 15 9 23 39District of Columbia 67 62 70 32 24 37 26 31 23 45Florida‡ 46 21 83 25 11 45 15 7 26 38
Georgia 47 22 85 30 14 55 10 5 17 25Hawaii 44 19 83 25 10 47 13 6 24 35Idaho 36 13 71 26 9 52 4 2 8 14Illinois 43 22 75 25 12 44 12 7 20 33Indiana 42 19 75 30 14 55 5 3 9 15
Iowa 32 15 54 22 10 38 5 3 8 18Kansas 40 17 74 30 13 54 4 2 8 13Kentucky 52 23 97 39 17 73 5 2 8 11Louisiana 54 25 99 39 17 72 7 4 11 15Maine 29 14 52 17 7 32 8 5 12 31
Maryland§ 42 22 71 19 9 34 17 10 28 47Massachusetts 24 12 39 12 6 19 9 4 15 44Michigan 39 18 71 24 11 43 10 5 18 30Minnesota 26 11 48 17 7 31 6 2 10 25Mississippi 58 28 101 42 19 74 7 4 11 14
Missouri 43 18 80 30 13 56 7 3 12 18Montana 41 19 73 28 13 50 7 4 12 20Nebraska 35 16 61 25 11 43 5 2 8 16Nevada 49 21 97 30 12 62 11 6 21 27New Hampshire§ 22 10 39 13 5 23 7 4 10 34
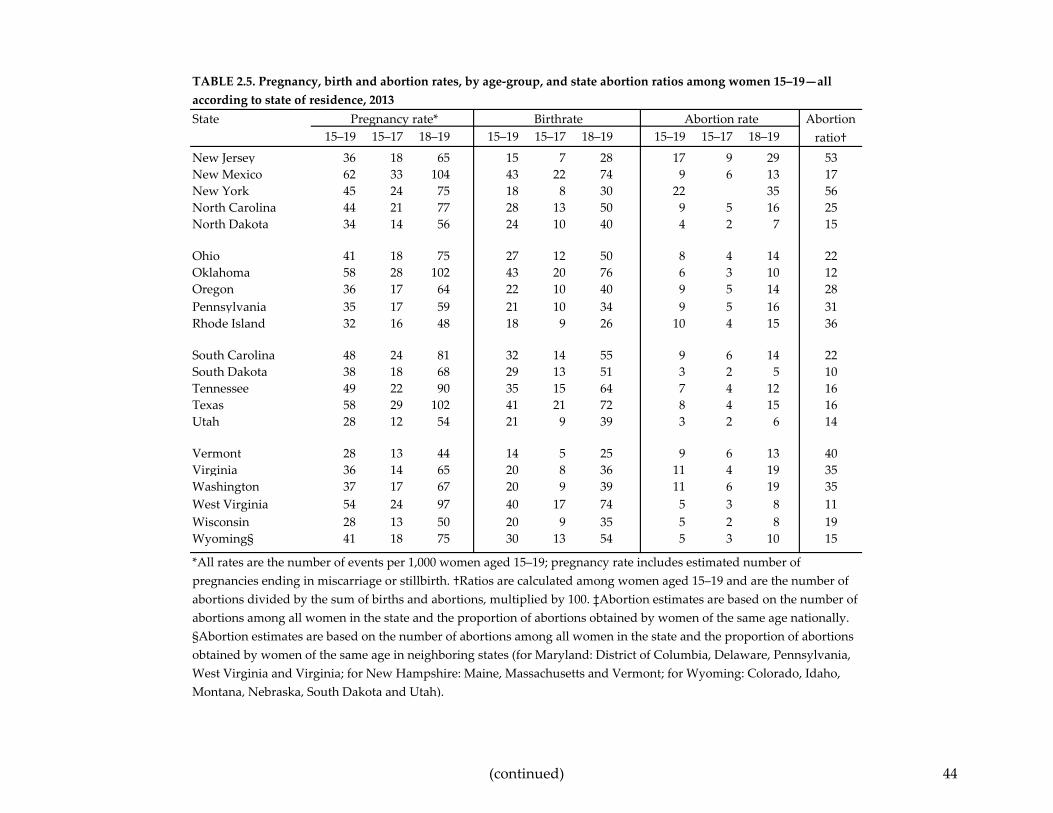
TABLE 2.5. Pregnancy, birth and abortion rates, by age‐group, and state abortion ratios among women 15–19—all according to state of residence, 2013State Abortion
ratio†Pregnancy rate* Birthrate Abortion rate
43
15–19 15–17 18–19 15–19 15–17 18–19 15–19 15–17 18–19
TABLE 2.5. Pregnancy, birth and abortion rates, by age‐group, and state abortion ratios among women 15–19—all according to state of residence, 2013State Abortion
ratio†Pregnancy rate* Birthrate Abortion rate
New Jersey 36 18 65 15 7 28 17 9 29 53New Mexico 62 33 104 43 22 74 9 6 13 17New York 45 24 75 18 8 30 22 35 56North Carolina 44 21 77 28 13 50 9 5 16 25North Dakota 34 14 56 24 10 40 4 2 7 15
Ohio 41 18 75 27 12 50 8 4 14 22Oklahoma 58 28 102 43 20 76 6 3 10 12Oregon 36 17 64 22 10 40 9 5 14 28Pennsylvania 35 17 59 21 10 34 9 5 16 31Rhode Island 32 16 48 18 9 26 10 4 15 36
South Carolina 48 24 81 32 14 55 9 6 14 22South Dakota 38 18 68 29 13 51 3 2 5 10Tennessee 49 22 90 35 15 64 7 4 12 16Texas 58 29 102 41 21 72 8 4 15 16Utah 28 12 54 21 9 39 3 2 6 14
Vermont 28 13 44 14 5 25 9 6 13 40Virginia 36 14 65 20 8 36 11 4 19 35Washington 37 17 67 20 9 39 11 6 19 35West Virginia 54 24 97 40 17 74 5 3 8 11Wisconsin 28 13 50 20 9 35 5 2 8 19Wyoming§ 41 18 75 30 13 54 5 3 10 15
*All rates are the number of events per 1,000 women aged 15–19; pregnancy rate includes estimated number of pregnancies ending in miscarriage or stillbirth. †Ratios are calculated among women aged 15–19 and are the number of abortions divided by the sum of births and abortions, multiplied by 100. ‡Abortion estimates are based on the number of abortions among all women in the state and the proportion of abortions obtained by women of the same age nationally. §Abortion estimates are based on the number of abortions among all women in the state and the proportion of abortions obtained by women of the same age in neighboring states (for Maryland: District of Columbia, Delaware, Pennsylvania, West Virginia and Virginia; for New Hampshire: Maine, Massachusetts and Vermont; for Wyoming: Colorado, Idaho, Montana, Nebraska, South Dakota and Utah).
(continued) 44

State<15 15–19 15–17 18–19 <15 15–19 15–17 18–19 <15 15–19 15–17 18–19 <15 15–19 15–17 18–19
Total 7,350 448,440 126,880 321,550 3,098 273,105 74,820 198,285 3,300 109,740 33,730 76,010 950 65,590 18,340 47,260Alabama 140 7,610 2,070 5,530 64 5,392 1,471 3,921 50 1,030 280 750 20 1,180 320 860Alaska 20 1,110 290 820 8 708 162 546 10 230 80 150 § 170 40 120Arizona 110 10,300 2,840 7,460 71 7,232 2,011 5,221 20 1,480 390 1,090 20 1,590 440 1,150Arkansas 60 5,610 1,490 4,120 37 4,155 1,059 3,096 20 560 200 370 10 890 230 660California** 990 56,990 16,420 40,570 314 30,505 8,525 21,980 560 18,530 5,630 12,910 120 7,950 2,270 5,690
Colorado 70 6,100 1,800 4,300 30 3,834 1,129 2,705 30 1,360 400 960 10 900 270 640Connecticut 50 3,670 1,110 2,560 19 1,606 445 1,161 30 1,580 530 1,060 10 480 140 340Delaware 20 1,380 400 970 6 728 201 527 10 460 150 310 § 190 50 140District of Columbia 40 1,340 480 860 20 637 185 452 20 530 240 290 10 180 60 120Florida** 480 26,050 7,260 18,790 165 13,962 3,699 10,263 260 8,450 2,560 5,880 60 3,640 1,000 2,640
Georgia 360 16,120 4,450 11,670 143 10,322 2,799 7,523 170 3,400 990 2,400 50 2,400 660 1,740Hawaii 20 1,740 450 1,280 12 976 247 729 10 520 140 370 § 250 60 180Idaho 20 1,970 440 1,530 11 1,425 312 1,113 § 230 60 170 § 310 70 240Illinois 330 18,420 5,550 12,870 124 10,525 2,990 7,535 170 5,260 1,790 3,480 40 2,630 780 1,850Indiana 110 9,360 2,570 6,790 72 6,742 1,799 4,943 20 1,150 370 780 20 1,460 400 1,070
Iowa 30 3,290 870 2,420 12 2,289 580 1,709 20 500 160 340 § 510 130 380Kansas 50 3,910 1,010 2,910 30 2,869 722 2,147 10 430 130 300 10 620 160 460Kentucky 80 7,220 1,870 5,360 46 5,410 1,374 4,036 20 670 200 470 10 1,150 290 850Louisiana 160 8,070 2,240 5,830 90 5,811 1,550 4,261 50 1,000 340 660 20 1,260 340 920Maine 10 1,180 320 860 6 697 166 531 10 310 110 200 § 170 40 130
Maryland†† 180 8,030 2,430 5,600 51 3,690 1,027 2,663 110 3,270 1,090 2,180 20 1,070 310 750Massachusetts 80 5,610 1,480 4,130 33 2,734 734 2,000 40 2,120 550 1,570 10 760 200 560Michigan 190 13,170 3,570 9,600 77 7,872 2,098 5,774 90 3,390 960 2,430 20 1,910 520 1,400Minnesota 70 4,630 1,190 3,440 31 2,950 758 2,192 30 990 260 730 10 690 180 510Mississippi 120 5,990 1,660 4,330 74 4,347 1,162 3,185 30 700 240 460 20 940 260 680
Missouri 90 8,370 2,120 6,250 43 5,814 1,459 4,355 40 1,270 330 930 10 1,290 330 960Montana 20 1,270 350 920 6 855 229 626 10 220 70 150 § 190 50 140Nebraska 30 2,180 580 1,600 13 1,552 412 1,140 10 290 80 210 § 340 90 250Nevada 60 4,190 1,140 3,050 26 2,604 673 1,931 20 970 300 670 10 620 160 450New Hampshire†† 10 990 240 750 3 560 118 442 10 290 90 200 § 140 30 110
TABLE 2.6. Numbers of pregnancies, births, abortions and fetal losses among women younger than 20, by age‐group, according to state, 2013
Pregnancies*,† Births Abortions* Fetal losses*,‡
45

State<15 15–19 15–17 18–19 <15 15–19 15–17 18–19 <15 15–19 15–17 18–19 <15 15–19 15–17 18–19
TABLE 2.6. Numbers of pregnancies, births, abortions and fetal losses among women younger than 20, by age‐group, according to state, 2013
Pregnancies*,† Births Abortions* Fetal losses*,‡
New Jersey 230 10,160 3,140 7,030 43 4,188 1,183 3,005 170 4,670 1,560 3,110 30 1,300 390 910New Mexico 70 4,230 1,360 2,870 33 2,959 909 2,050 30 620 250 370 10 650 210 450New York 580 28,700 8,660 20,040 125 11,128 2,980 8,148 390 13,950 4,620 9,330 60 3,620 1,060 2,560North Carolina 240 14,070 3,850 10,220 128 9,020 2,422 6,598 80 2,950 860 2,090 30 2,100 570 1,530North Dakota 10 790 180 600 7 563 125 438 § 100 30 70 § 120 30 90
Ohio 270 15,700 4,170 11,530 112 10,352 2,641 7,711 120 2,980 910 2,070 30 2,370 620 1,750Oklahoma 120 7,150 2,060 5,090 69 5,310 1,518 3,792 30 710 220 490 20 1,130 330 810Oregon 40 4,240 1,210 3,040 15 2,594 694 1,900 20 1,030 340 690 § 620 170 450Pennsylvania 270 14,680 4,050 10,630 98 8,657 2,407 6,250 140 3,900 1,060 2,840 30 2,120 590 1,530Rhode Island 20 1,190 300 890 5 659 176 483 10 370 80 290 § 170 40 130
South Carolina 90 7,230 2,070 5,160 52 4,763 1,261 3,502 30 1,380 510 870 10 1,090 300 790South Dakota 20 1,070 290 790 10 812 214 598 § 90 30 60 § 170 50 130Tennessee 170 10,060 2,700 7,370 88 7,105 1,855 5,250 60 1,400 430 970 20 1,560 410 1,150Texas 860 53,150 16,410 36,740 526 37,525 11,730 25,795 210 7,380 2,120 5,260 130 8,240 2,560 5,680Utah 30 3,120 800 2,320 15 2,254 572 1,682 10 380 100 280 § 490 120 360
Vermont 10 610 140 470 3 317 55 262 10 210 70 140 § 80 20 70Virginia 120 9,460 2,190 7,270 35 5,300 1,210 4,090 70 2,820 670 2,150 10 1,340 310 1,030Washington 100 7,910 2,260 5,650 35 4,386 1,145 3,241 50 2,400 800 1,600 10 1,120 310 810West Virginia 40 2,920 760 2,160 21 2,178 548 1,630 10 280 90 180 10 460 120 340Wisconsin 70 5,370 1,390 3,980 39 3,692 938 2,754 20 850 240 610 10 820 210 610Wyoming†† 10 760 200 560 2 540 141 399 § 100 30 70 § 120 30 90
*Rounded to the nearest 10. †Includes estimated number of pregnancies ending in miscarriage or stillbirth. ‡Estimated as 20% of births plus 10% of abortions; includes stillbirths. §Fewer than 5 abortions or fetal losses. **Abortion estimates are based on the number of abortions among all women in the state and the proportion of abortions obtained by women of the same age nationally. ††Abortion estimates are based on the number of abortions among all women in the state and the proportion of abortions obtained by women of the same age in neighboring states (for Maryland: District of Columbia, Delaware, Pennsylvania, West Virginia and Virginia; for New Hampshire: Maine, Massachusetts and Vermont; for Wyoming: Colorado, Idaho, Montana, Nebraska, South Dakota and Utah).
(continued) 46

State Non‐
Hispanic white
Non‐Hispanic
black
Non‐Hispanic
other† Hispanic
Non‐Hispanic white‡
Non‐Hispanic
black‡
Non‐Hispanic other†,‡ Hispanic
Non‐Hispanic
white
Non‐Hispanic
black
Non‐Hispanic
other† HispanicTotal 30 75 28 61 19 39 14 42 7 26 11 10Alabama u u u u 30 41 12 47 u u u uAlaska 35 47 70 51 20 30 49 35 10 9 11 9Arizona u u u u 19 38 45 45 u u u uArkansas 51 85 31 64 39 59 23 49 4 13 3 4California u u u u 10 30 7 35 u u u u
Colorado 25 43 28 64 14 25 13 44 7 12 12 10Connecticut u u u u 5 21 3 37 u u u uDelaware 25 76 25 95 16 37 6 44 5 28 16 39District of Columbia 8 101 20 72 2 47 1 51 5 40 17 10Florida u u u u 19 38 6 25 u u u u
Georgia 29 65 18 83 24 38 7 45 1 18 9 26Hawaii 32 38 45 61 19 21 23 42 8 12 15 10Idaho 30 32 48 60 21 22 31 47 4 5 10 4Illinois u u u u 14 48 4 37 u u u uIndiana 37 67 27 57 27 47 12 43 4 10 11 5
Iowa§ 29 74 40 u 18 52 17 47 4 10 16 uKansas 32 62 29 72 23 45 14 57 4 7 10 4Kentucky 51 65 21 65 39 44 11 49 4 11 7 6Louisiana§ 42 73 43 u 31 50 19 48 3 11 16 uMaine 29 43 33 22 17 24 19 16 8 13 9 4
Maryland u u u u 11 29 4 39 u u u uMassachusetts u u u u 6 18 5 41 u u u uMichigan 27 89 21 46 17 48 11 33 6 29 7 6Minnesota 18 64 49 57 11 37 31 41 4 18 11 7Mississippi u u u u 35 52 30 41 u u u u
Missouri 37 72 32 61 26 47 15 43 4 15 13 8Montana 35 u u 47 23 ** 67 33 7 u u 7Nebraska u u u u 17 45 31 57 u u u uNevada u u u 56 20 42 14 42 u u u 5New Hampshire u u u u 12 18 4 24 u u u u
TABLE 2.7. Pregnancy, birth and abortion rates among women aged 15–19, by race and ethnicity, according to state, 2013Abortion ratePregnancy rate* Birthrate
47

State Non‐
Hispanic white
Non‐Hispanic
black
Non‐Hispanic
other† Hispanic
Non‐Hispanic white‡
Non‐Hispanic
black‡
Non‐Hispanic other†,‡ Hispanic
Non‐Hispanic
white
Non‐Hispanic
black
Non‐Hispanic
other† Hispanic
TABLE 2.7. Pregnancy, birth and abortion rates among women aged 15–19, by race and ethnicity, according to state, 2013Abortion ratePregnancy rate* Birthrate
New Jersey 14 89 41 48 5 29 2 33 7 50 35 8New Mexico 38 47 70 72 24 28 50 51 8 12 9 9New York 22 90 23 77 11 26 6 33 8 54 15 34North Carolina 31 63 41 71 20 37 23 51 6 16 12 9North Dakota u u u u 18 32 67 60 u u u u
Ohio u u u u 22 49 9 43 u u u uOklahoma§ 56 67 58 u 38 48 42 61 5 8 7 uOregon 30 52 25 57 17 29 13 42 9 15 9 6Pennsylvania u u u u 14 41 7 50 u u u uRhode Island u u u u 10 28 13 41 u u u u
South Carolina 40 61 31 64 26 39 14 47 8 12 13 6South Dakota 25 34 103 67 18 21 83 52 3 8 3 4Tennessee 41 72 17 70 30 47 9 55 5 14 5 4Texas 36 65 21 76 24 41 8 57 6 15 10 7Utah 21 34 28 63 15 24 20 49 3 4 4 4
Vermont 29 26 13 23 15 20 4 10 10 2 7 11Virginia 26 60 19 49 15 31 5 32 7 21 11 9Washington u u u 62 15 22 15 43 u u u 9West Virginia 55 55 17 30 41 33 12 25 5 14 2 uWisconsin§ 22 78 43 59 12 55 29 44 4 11 9 5Wyoming u u u u 27 13 53 40 u u u u
*All rates are the number of events per 1,000 women aged 15–19; pregnancy rate includes estimated number of pregnancies ending in miscarriage or stillbirth. †Refers to those identifying as races other than black or white, and not identifying as Hispanic. ‡Includes births to women with ethnicity unknown. §Pregnancy and abortion rates are for white, black and other, irrespective of Hispanic ethnicity (births used for calculation of pregnancy rate are for comparable race groups without ethnicity). **Rate not calculated because population of women aged 15–19 was less than 500. Note : u=unavailable, or data did not pass quality threshold (data on race or ethnicity missing for >20% of abortions, see Methodology); exceptions were made for Nevada and Washington, which had rates calculated for Hispanic teens despite 21% and 22% of abortions missing data on ethnicity, respectively.
48(continued)

State
Pregnancies*,† Births*,‡ Abortions* Fetal
Losses*,§ Pregnancies*,† Births*,‡ Abortions* Fetal
Losses*,§Total 172,710 108,720 38,400 25,580 120,630 62,493 41,490 16,650Alabama u 2,909 u u u 2,126 u uAlaska 460 262 130 70 60 39 10 10Arizona u 1,807 u u u 456 u uArkansas 3,350 2,542 270 540 1,630 1,132 240 250California u 4,084 u u u 2,685 u u
Colorado 2,540 1,476 700 360 380 219 110 50Connecticut u 428 u u u 325 u uDelaware 430 278 80 60 610 298 230 80District of Columbia 40 9 30 ** 1,140 532 460 150Florida u 5,237 u u u 4,621 u u
Georgia 4,820 3,941 90 800 8,180 4,729 2,270 1,170Hawaii 250 148 60 40 40 24 10 10Idaho 1,310 929 170 200 30 20 ** **Illinois u 3,343 u u u 3,731 u uIndiana 6,350 4,635 720 1,000 1,820 1,263 280 280
Iowa†† 2,720 1,579 380 420 420 279 60 70Kansas 2,270 1,642 270 360 480 354 50 80Kentucky 5,850 4,460 450 940 990 669 170 150Louisiana†† 3,570 2,451 290 570 4,330 2,962 640 670Maine 1,070 631 280 150 50 27 10 10
Maryland u 1,025 u u u 1,887 u uMassachusetts u 1,014 u u u 363 u uMichigan 6,570 4,133 1,460 970 5,310 2,869 1,700 740Minnesota 2,400 1,537 510 360 920 530 260 130Mississippi u 1,782 u u u 2,393 u u
Missouri 5,460 3,935 670 850 2,140 1,379 440 320Montana 910 589 180 140 u 3 u uNebraska u 820 u u u 184 u uNevada u 699 u u u 394 u uNew Hampshire u 488 u u u 18 u u
TABLE 2.8. Numbers of pregnancies, births, abortions and fetal losses among women aged 15–19, by race and ethnicity, according to state, 2013
Non‐Hispanic white Non‐Hispanic black
49

State
Pregnancies*,† Births*,‡ Abortions* Fetal
Losses*,§ Pregnancies*,† Births*,‡ Abortions* Fetal
Losses*,§
TABLE 2.8. Numbers of pregnancies, births, abortions and fetal losses among women aged 15–19, by race and ethnicity, according to state, 2013
Non‐Hispanic white Non‐Hispanic black
New Jersey 2,160 779 1,110 270 4,030 1,308 2,230 480New Mexico 720 461 150 110 80 46 20 10New York 7,240 3,593 2,660 980 9,800 2,795 5,860 1,150North Carolina 5,730 3,762 1,110 860 5,320 3,172 1,380 770North Dakota u 354 u u u 20 u u
Ohio u 6,574 u u u 2,968 u uOklahoma†† 5,000 2,908 460 800 950 653 110 150Oregon 2,560 1,440 760 360 190 106 60 30Pennsylvania u 4,342 u u u 2,423 u uRhode Island u 271 u u u 83 u u
South Carolina 3,480 2,297 660 530 3,070 1,993 620 460South Dakota 550 397 70 90 30 17 10 **Tennessee 5,880 4,270 690 920 3,290 2,148 650 490Texas 11,920 8,081 2,020 1,820 7,950 4,963 1,810 1,170Utah 1,810 1,244 290 280 60 45 10 10
Vermont 570 297 190 80 10 11 ** **Virginia 4,120 2,429 1,090 600 3,710 1,913 1,280 510Washington u 2,166 u u u 272 u uWest Virginia 2,710 2,048 230 430 160 96 40 20Wisconsin†† 3,560 1,797 570 550 1,400 943 200 220Wyoming u 397 u u u 7 u u
*Rounded to the nearest 10. †Includes estimated number of pregnancies ending in miscarriage or stillbirth. ‡Includes births towomen with ethnicity unknown. §Estimated as 20% of births plus 10% of abortions; includes stillbirths. **Fewer than five abortions or fetal losses. ††Numbers of pregnancies, abortions and fetal losses are for white, black and other, irrespective of Hispanic ethnicity (births used for calculation of numbers of pregnancies are for comparable race groups without ethnicity). ‡‡Refers to those identifying as races other than black or white, and not identifying as Hispanic. Note: u=unavailable, or data did not pass quality threshold (data on race or ethnicity missing for >20% of abortions, see Methodology); exceptions were made for Nevada and Washington, which had measures calculated for Hispanic teens despite 21% and 22% of abortions missing data on ethnicity, respectively.
50(continued)

State
Pregnancies*,† Births*,‡ Abortions* Fetal
Losses*,§ Pregnancies*,† Births*,‡ Abortions* Fetal
Losses*,§Total 18,460 8,932 7,040 2,490 136,080 92,960 22,300 20,820Alabama u 37 u u u 320 u uAlaska 490 338 70 80 100 69 20 20Arizona u 837 u u u 4,132 u uArkansas 80 59 10 10 550 422 40 90California u 1,139 u u u 22,597 u u
Colorado 220 98 90 30 2,960 2,041 470 450Connecticut u 17 u u u 836 u uDelaware 30 7 20 ** 320 145 130 40District of Columbia 20 1 20 ** 130 95 20 20Florida u 110 u u u 3,994 u u
Georgia 250 95 120 30 2,870 1,557 910 400Hawaii 1,120 583 380 150 320 221 50 50Idaho 90 55 20 10 540 421 40 90Illinois u 87 u u u 3,364 u uIndiana 150 69 70 20 1,030 775 90 160
Iowa†† 150 56 60 20 u 375 u uKansas 120 60 40 20 1,040 813 60 170Kentucky 50 27 20 10 340 254 30 50Louisiana†† 180 72 60 20 u 326 u uMaine 40 25 10 10 20 14 ** **
Maryland u 45 u u u 733 u uMassachusetts u 76 u u u 1,281 u uMichigan 290 155 90 40 1,000 715 130 160Minnesota 640 410 140 100 660 473 80 100Mississippi u 52 u u u 120 u u
Missouri 190 86 80 20 580 414 80 90Montana u 211 u u 80 52 10 10Nebraska u 75 u u u 473 u uNevada u 109 u u 1,860 1,402 160 300New Hampshire u 6 u u u 48 u u
TABLE 2.8. Numbers of pregnancies, births, abortions and fetal losses among women aged 15–19, by race and ethnicity, according to state, 2013
Non‐Hispanic other‡‡ Hispanic
51

State
Pregnancies*,† Births*,‡ Abortions* Fetal
Losses*,§ Pregnancies*,† Births*,‡ Abortions* Fetal
Losses*,§
TABLE 2.8. Numbers of pregnancies, births, abortions and fetal losses among women aged 15–19, by race and ethnicity, according to state, 2013
Non‐Hispanic other‡‡ Hispanic
New Jersey 1,000 46 860 90 2,980 2,055 470 460New Mexico 590 420 70 90 2,850 2,032 370 440New York 1,200 308 760 140 10,460 4,432 4,670 1,350North Carolina 550 313 160 80 2,460 1,773 310 390North Dakota u 136 u u u 53 u u
Ohio u 87 u u u 723 u uOklahoma 1,200 800 140 190 u 949 u uOregon 220 114 70 30 1,270 934 140 200Pennsylvania u 110 u u u 1,782 u uRhode Island u 26 u u u 279 u u
South Carolina 90 43 40 10 580 430 60 90South Dakota 410 332 10 70 80 66 ** 10Tennessee 70 41 20 10 830 646 50 130Texas 820 315 400 100 32,460 24,166 3,150 5,150Utah 150 105 20 20 1,100 860 60 180
Vermont 10 3 10 ** 10 6 10 **Virginia 320 88 190 40 1,310 870 250 200Washington u 356 u u 2,290 1,592 340 350West Virginia 10 7 ** ** 30 27 ** 10Wisconsin†† 410 244 80 60 940 708 90 150Wyoming u 41 u u u 95 u u
*Rounded to the nearest 10. †Includes estimated number of pregnancies ending in miscarriage or stillbirth. ‡Includes births towomen with ethnicity unknown. §Estimated as 20% of births plus 10% of abortions; includes stillbirths. **Fewer than five abortions or fetal losses. ††Numbers of pregnancies, abortions and fetal losses are for white, black and other, irrespective of Hispanic ethnicity (births used for calculation of numbers of pregnancies are for comparable race groups without ethnicity). ‡‡Refers to those identifying as races other than black or white, and not identifying as Hispanic. Note: u=unavailable, or data did not pass quality threshold (data on race or ethnicity missing for >20% of abortions, see Methodology); exceptions were made for Nevada and Washington, which had measures calculated for Hispanic teens despite 21% and 22% of abortions missing data on ethnicity, respectively.
52(continued)

State
15–19 15–17 18–19Non‐Hispanic
white Non‐Hispanic
blackNon‐Hispanic
other* HispanicTotal 10,336,667 6,110,950 4,225,717 5,833,339 1,607,258 656,496 2,239,574Alabama 157,706 93,316 64,390 95,860 51,887 3,111 6,848Alaska 23,422 14,794 8,628 13,228 1,284 6,934 1,976Arizona 218,918 131,325 87,593 96,744 11,896 18,718 91,560Arkansas 95,547 58,034 37,513 65,222 19,154 2,572 8,599California 1,296,621 770,744 525,877 393,229 89,778 168,630 644,984
Colorado 164,540 97,259 67,281 101,952 8,909 7,726 45,953Connecticut 124,605 71,510 53,095 81,066 15,193 5,862 22,484Delaware 29,638 16,421 13,217 17,164 8,017 1,129 3,328District of Columbia 20,046 7,787 12,259 5,881 11,379 912 1,874Florida 569,816 342,946 226,870 270,677 122,553 18,620 157,966
Georgia 339,507 202,224 137,283 166,101 125,036 13,576 34,794Hawaii 39,064 23,657 15,407 7,666 1,162 24,924 5,312Idaho 55,419 33,892 21,527 43,703 896 1,798 9,022Illinois 427,554 256,165 171,389 237,555 78,019 20,827 91,153Indiana 222,832 132,684 90,148 171,770 27,059 5,798 18,205
Iowa 103,708 59,180 44,528 87,138 5,402 3,230 7,938Kansas 97,144 57,710 39,434 70,701 7,878 4,196 14,369Kentucky 137,854 82,492 55,362 115,029 15,209 2,380 5,236Louisiana 148,280 89,308 58,972 78,750 58,919 3,817 6,794Maine 40,139 23,478 16,661 36,823 1,124 1,289 903
Maryland 191,036 112,479 78,557 94,818 65,014 12,473 18,731Massachusetts 229,214 122,978 106,236 161,237 20,050 16,352 31,575Michigan 334,335 198,556 135,779 239,411 59,406 13,700 21,818Minnesota 175,524 104,005 71,519 136,445 14,310 13,106 11,663Mississippi 102,527 59,742 42,785 51,604 46,270 1,719 2,934
Missouri 193,777 115,536 78,241 148,896 29,605 5,738 9,538Montana 30,776 18,183 12,593 25,716 337 3,128 1,595Nebraska 62,575 36,247 26,328 47,728 4,120 2,397 8,330Nevada 85,708 54,388 31,320 35,136 9,359 7,837 33,376New Hampshire 44,584 25,205 19,379 40,265 973 1,361 1,985
TABLE 2.9. Population estimates for women 15–19, by age‐group and by race and ethnicity, according to state, 2013Population Population by race/ethnicity
53

State
15–19 15–17 18–19Non‐Hispanic
white Non‐Hispanic
blackNon‐Hispanic
other* Hispanic
TABLE 2.9. Population estimates for women 15–19, by age‐group and by race and ethnicity, according to state, 2013Population Population by race/ethnicity
New Jersey 282,952 174,068 108,884 151,771 45,055 24,254 61,872New Mexico 68,456 40,801 27,655 18,856 1,644 8,365 39,591New York 631,456 362,504 268,952 335,197 108,961 51,699 135,599North Carolina 317,683 185,053 132,630 184,661 84,930 13,500 34,592North Dakota 23,475 12,657 10,818 19,936 633 2,025 881
Ohio 380,348 227,108 153,240 293,635 60,687 9,264 16,762Oklahoma 124,048 74,137 49,911 76,162 13,504 18,885 15,497Oregon 119,021 71,609 47,412 84,317 3,672 8,732 22,300Pennsylvania 415,992 234,773 181,219 305,696 58,466 16,167 35,663Rhode Island 37,603 19,100 18,503 25,953 2,966 1,947 6,737
South Carolina 150,472 87,131 63,341 87,780 50,561 3,053 9,078South Dakota 28,021 16,347 11,674 21,933 803 4,020 1,265Tennessee 204,534 122,531 82,003 142,850 45,529 4,379 11,776Texas 918,744 558,001 360,743 331,306 122,392 39,267 425,779Utah 109,575 66,529 43,046 85,027 1,855 5,306 17,387
Vermont 21,912 11,257 10,655 19,996 563 735 618Virginia 264,618 152,218 112,400 158,682 61,828 17,010 27,098Washington 214,074 130,066 84,008 140,736 12,461 24,109 36,768West Virginia 54,209 32,067 22,142 49,634 2,897 597 1,081Wisconsin 188,801 109,879 78,922 147,099 17,124 8,549 16,029Wyoming 18,257 10,869 7,388 14,597 529 773 2,358
*Refers to those identifying as races other than black or white, and not identifying as Hispanic.
54(continued)

StatePercent of pregnancies that are
unintended Pregnancy rate*Unintended pregnancy rate
(95% CI)Total T u 44 uAlabama A u 49 uAlaska A 62% 48 30 (26‐33)Arizona A u 48 uArkansas A 69% 59 41 (35‐47)California† C u 45 u
Colorado C 75% 37 28 (25‐31)Connecticut C u 30 uDelaware D 74% 47 35 (32‐38)District of Columbia D u 69 uFlorida† F u 47 u
Georgia G 66% 49 32 (29‐35)Hawaii H 76% 45 34 (31‐37)Idaho I u 36 uIllinois I 74% 44 33 (30‐35)Indiana I u 42 u
Iowa I 67% 32 21 (17‐26)Kansas K u 41 uKentucky K u 53 uLouisiana L u 56 uMaine M 72% 30 21 (19‐24)
Maryland‡ M 79% 43 34 (31‐37)Massachusetts M 75% 25 19 (17‐20)Michigan M 72% 40 29 (26‐31)Minnesota M 69% 27 18 (16‐21)Mississippi M u 60 u
Missouri M 69% 44 30 (27‐33)Montana M u 42 uNebraska N 64% 35 23 (20‐25)Nevada N u 50 uNew Hampshire‡ N 71% 22 16 (13‐19)
TABLE 2.10. Among women younger than 20, percent of pregnancies that are unintended, pregnancy rate and unintended pregnancy rate, according to state, 2013
55

StatePercent of pregnancies that are
unintended Pregnancy rate*Unintended pregnancy rate
(95% CI)
TABLE 2.10. Among women younger than 20, percent of pregnancies that are unintended, pregnancy rate and unintended pregnancy rate, according to state, 2013
New Jersey N 79% 37 29 (27‐31)New Mexico N 56% 63 35 (32‐38)New York N 78% 46 36 (34‐38)North Carolina N u 45 uNorth Dakota N u 34 u
Ohio O 66% 42 28 (24‐32)Oklahoma O 67% 59 39 (34‐45)Oregon O 70% 36 25 (22‐28)Pennsylvania P 64% 36 23 (20‐26)Rhode Island R 73% 32 23 (22‐25)
South Carolina S u 49 uSouth Dakota S u 39 uTennessee T 73% 50 37 (33‐41)Texas T u 59 uUtah U 67% 29 19 (17‐21)
Vermont V 66% 28 19 (17‐20)Virginia V u 36 uWashington W 75% 37 28 (25‐31)West Virginia W 59% 54 32 (27‐37)Wisconsin W 76% 29 22 (20‐24)Wyoming‡ W 61% 42 26 (21‐30)
*All rates are calculated as the number of events experienced by women younger than 20, divided by the female population aged 15–19. The denominator is limited to 15–19‐year‐olds because 97–98% of all pregnancies among women younger than 20 occurred among 15–19‐year‐olds. The pregnancy rate includes estimated number of pregnancies ending in miscarriage or stillbirth. †Abortion estimates are based on the number of abortions among all women in the state and the proportion of abortions obtained by women of the same age nationally. ‡Abortion estimates are based on the number of abortions among all women in the state and the proportion of abortions obtained by women of the same age in neighboring states (for Maryland: District of Columbia, Delaware, Pennsylvania, West Virginia and Virginia; for New Hampshire: Maine, Massachusetts and Vermont; for Wyoming: Colorado, Idaho, Montana, Nebraska, South Dakota and Utah). Note: u=data on the pregnancy intention status of births was not available (see text).
56(continued)