table of contents - akpce.comakpce.com/page4/files/fsc manual.pdf · table of contents begin...
TRANSCRIPT

Table of Contents
Begin
Introduction 5
Installation 9
Quick Start 11
Organization and Structure 15
Preference File 20
General Functions and Menu Descriptions 21
Starting FSC 26
Operating FSC
Operations Common To All Categories 27
Continuous Category Jobs 30
Continuous Category Site 32
Contour Category Job 34
Contour Category Site 35
Great Circle (point-to-Point) 37
Controls - Function and Purpose
Continuous Category Job Controls 38
Continuous Category Site Controls 46
Contour Category Job Controls 53
Contour Category Site Controls 59
Great Circle (Point-to-Point) Job Controls 66
Great Circle (Point-to-Point) Site Controls 69
Boundaries/Roads 75
Calibration Aid 77
Labels 80
Map Projection 84
Page Size 86
FSC Instruction Manual

How To - Actions
Isotropic/Dipole Considerations 88
dBu Calculations 90
Antenna Input Power 91
Attach Universal Site to a Job 92
Copy Job 93
Copy Site 94
Create a New Job 95
Create a New Site For a Job 96
Create a New Universal Site 97
Create Roads/Boundaries 98
Create Terrain 100
Defaults - Setting 101
Delete a Site from a Job 102
Delete a Universal Site 103
Detach a Site From a Job 104
Display Results On Screen 105
Fixed Gains and Losses 107
Import Antenna 109
Modify a Universal Site 110
Printing 111
Save Coverage To Files 113
Scale of km/miles 115
Select An Existing Job 116
Discussions, Considerations and Background
Contour Methods Background 117
Contour Types 119
Graphics Output 123
Map Considerations 124
Map Scanning Issues 126
FSC Instruction Manual

Preference File 127
Terrain
Expanding FSC Terrain Coverage 128
SRTM Data 129
SRTM Errors 131
Terrain For Jobs and Sites 132
Terrain Usage in FSC - WARNING 133
DeLorme XMap
Using XMap 134
Getting Started 135
Sizing A Map 136
Positioning A Map 139
Photoshop (Elements)
Using Photoshop 141
Working With A Defined Map 142
Working With An Undefined Map 144
References 145
Contact 147
FSC Instruction Manual
Introduction
Do not be alarmed at the size of this manual. The length arisesnot from program complexity but from a rich feature set andmany notes describing technical practices, hints and historicalanecdotes. Actual operations of this program may beaccomplished by persons with limited knowledge or experience inthe field of radio-frequency propagation. Collecting various field strength program elements used regularlyfor many years by the radio frequency consulting engineeringfirm of Arthur K. Peters, Consulting Engineers, Inc. has led to thecreation of this software tool. By combining a variety ofsophisticated programs, tables and data into one tool, a simplifiedprogram using two screens has been created to solve manycoverage issues in a unified manner. The program has been giventhe copyrighted name FieldStrengthCalc, also referred to as FSC. Current FSC calculation functions include:
! FM and TV Contour calculations as used in the USA. ! A variation of the preceding FM/TV calculations thatpermits usage for mobile calculations by adjusting formobile antenna height. ! COST contour method for modern cellular and 2–waysystems. ! Carey contour methods for paging & mobile systems. ! Point-to-point great circle calculations with reliabilitystatistics for communications links.
FSC Instruction Manual 5

statistics for communications links. ! Detailed continuous area coverage analyses usingLongley-Rice (NBS, Technical Note 101) calculations forboth power (dBm, dBW, dBk) and voltage (dBu)problems.
Each calculation method produces some form of output report orfile. Each method produces a screen calculation, a print and oneor more graphics files. The point-to-point method produces agraphical report showing a great circle terrain profile with Fresneland earth radius data and path reliability information. Valid frequency ranges exist for each of the calculations. Forexample, the COST calculations have a valid frequency rangefrom 150 MHz to 2 GHz. Longley-Rice continuous analyses andpoint-to-point calculations are valid from 30 MHz to 20 GHz.Mobile, FM and TV calculations are valid in the range 50 MHzto approximately 1 GHz. Other parameters such as distance andantenna heights also may depend upon a specific calculationmethod. FSC is fully capable of using directional antenna patterns for allcalculations. Presently, FSC employs antenna patterns using theObspat internal antenna format. FSC has no antenna datamanagement or manipulation capabilities. However, FSCprovides for importing antenna pattern files using CelPlan, Planetand TIA-804-B formats. Moreover, FSC is supplied with anantenna database of some 10,000 common directional antennapatterns. The FSC database was created several years ago anddoes not include newer antennas, the patterns of which mayeasily be downloaded from manufacturers.
FSC Instruction Manual 6
(Obspat is a tool that computes antenna pattern distortions due tonearby metallic objects such as when using side-mountedantennas. It also enables custom pattern creation and synthesisusing combinations of stock antennas.) FSC is supported with a 3 arc-second terrain database that isavailable for a substantial portion of the earth. Because of itsenormous size and the shear logistics of copying the terraindatabase, FSC is supplied with one regional coverage areaspecified by the purchaser. Other regions are available for anominal fee. Typical regions are North America, South America,Europe, Africa, Northern Asia and Southern Asia includingAustralia and New Zealand. At the outset of the FSC development process it was decided tokeep costs low and features high. Since we are experts in radiofrequency engineering and not as expert in mapping and graphics,the decision was made to leave mapping and graphics operationsto those experts, eliminating the requirement for us to incorporateand maintain that software. FSC was designed to provide overlaygraphics files that could be imported into software such asPhotoshop, Photoshop Elements and similar graphics programs. Itwas also decided that it is much more efficient and cost effectiveto use commercial mapping software to produce high qualitymaps when and where they are required. Both of these decisions are proving to be correct. The workproduct or output from FSC can be quickly imported into aninexpensive graphics program such as Photoshop Elements(under $100 USD). Base maps can be created using, for example,Delorme’s X-Map (under $200 USD) that may also be importedinto a graphics program. Adjusting the transparency of an FSCoverlay yields high quality, professional maps for much lowercosts. Note that the use of three programs (FSC, mapping and
FSC Instruction Manual 7

costs. Note that the use of three programs (FSC, mapping andgraphics) is not onerous. Consider that once a base map is createdfor an area, it may be a long time before another map isnecessary. The graphics processing is as simple as creating theFSC overlay file and then importing a base map and the FSCoverlay into a graphics program and printing or saving the result.
FSC Instruction Manual 8

Installation
This process depends upon how the user desires to utilize FSC.
Single Computer
The simplest configuration is operation on a single computer. Toinstall, drag the installer from the CD or DVD to your desktop.Double click and follow instructions. If this is not a newinstallation, before installing, please search for and delete all filesnamed FieldStrengthPreferences. Once the application is installed, double-click the FSC icon. ForWindows, this is located in Start>Programs>FieldStrengthCalc. The user will then be requested, via four dialogs, to identify 1) aJobs folder, 2) a Sites folder, 3) a folder containing antenna filesand 4) a folder containing digital terrain data. After the userperforms a validation process FSC will display its main screen.
Network
For network operations all folders may be located on a server oranother computer to which read and write access is permitted.However, it is required that an FSC application be placed on eachclient computer. On each licensed computer, multiple users mayuse FSC and will be provided with separate preferences.
Once the application is installed, double-click the FSC icon. ForWindows, this is located in Start>Programs>FieldStrengthCalc. The user, for each computer to be licensed for Obspat, will thenbe requested, via four dialogs, to identify 1) a Jobs folder, 2) aSites folder, 3) a folder containing antenna files and 4) a foldercontaining digital terrain data. After the user performs a
FSC Instruction Manual 9

containing digital terrain data. After the user performs avalidation process FSC will display its main screen.
File And Folder Locations
Data folders and files may be located anywhere. Networked usersmay access them anywhere on the network and use them as theirown. Single computer users may have folders located anywhereon their computers. This permits subsets of Sites, antennas andJobs to be stored or grouped as desired. Be certain that all FSCfiles and folders permit read and write access.
FSC Instruction Manual 10

Quick Start FSC
Many of the field entries presented here are normally set asdefault values that do not need to be entered each and every time.But for this exercise the process includes entry of all necessaryvariables.
For each calculation type in this program there are certain data thatmust be entered. It is assumed that FSC has been installed and theoperating folders have been selected. To get started you will needthe following information. For the first coverage calculation we choose to perform a"Continuous" coverage calculation.Also we want to use metric units. Setting up a job:Start FSCIn the upper right corner:Select Continuous.Enter a Job name in the field below the Job pull-down menu(Select Job).Enter 250000 in the Scale fieldEnter 150 in the Resolution fieldEnter 800 in the Frequency fieldClick on the Save button at bottom of screen In the Job pull-down menu, select the job with the name you justentered. All FSC operations require certain SITE data. Switch to the Sitescreen (click on Site button)
FSC Instruction Manual 11

Enter a Site name in the Site Name fieldClick the Save Site buttonFrom the Current Site pull down menu, select the site with thename you just entered Enter 800 in the Frequency fieldEnter v in the Polarization fieldIn the Latitude field enter 37 43 39In the Longitude field enter -83 56 41Leave the Ground elev field blank - FSC will fill it inEnter 100 in the Antenna Height agl fieldEnter 1.5 in the Mobile Antenna Height agl fieldEnter 0, 359,1 in the Start, Stop, Increment Azimuth fields,respectivelyEnter 0.8, 32, 0.32 in the Start, Stop, Increment Distance fields,respectivelyFrom the Climate Type pull down menu select ContinentalTemperateFrom the Soil Type pull down menu select Poor GroundEnter 301 in the Average Surface Refractivity fieldEnter 90, 90, 90 in the Locations, Time and Confidence fieldsClick the Save Terrain With Site checkboxClick the Save Site button Click the Make Terrain button. A value should appear in theGround Elev fieldWhen the Have Terrain words appear, Click the Calculate button.When the Have Calcs words appear click the Cancel button On the Main screen the Site name should appear in the Sites table(upper left)Click the site name you entered
FSC Instruction Manual 12

Click the checkbox beside the site name you entered.If any other sites are checked, click to uncheck themClick the Save button The only data entry that remains is the selection of the systempower and selection of signal level values and colors you want toobserve. System power is determined by adding the transmitter outputpower to the sum of all system gains and all system losses.Assume a transmitter has an output power of 30 Watts (which is 10LOG (30) = 14.8 dBW) . Assume:10 dB = base station antenna gain-3 dB = base station transmission line loss3 dB = mobile receiver antenna gain-1 dB = mobile transmission line loss14.8 dBW = transmitter power output____________________________________23.8 dBW = Fixed Gains and Losses Enter 23.8 into the Fixed Gains and Losses fieldFrom the pull down menu next to the fixed gains/losses field, selectdBW The Level Table is located to the right of the Projection typeindicator and the +Row buttonFrom the Level pull down menu select dBmIn the first column of the first row enter -110Click the +Row button and enter -95 below the -110Click the +Row button and enter -75 below the -95Click In the right column of each row and select a color.Click the Save button at the bottom of the screen
FSC Instruction Manual 13
Click the Display button for a screen display On the main screen:In the Sites table click (Highlight) the Site nameAbove the Display button click the Print Scale checkboxOn the left of the screen, check the Site Center CrossEnter some words in the Site Label fieldCheck the Print checkboxClick the Save buttonClick the Display button again To Print the Coverage to PrinterIn the File Menu Select Page Setup and choose a printerIn the File Menu Select Print (to printer) To Print Coverage to a picture file for use as an image overlayIn the File Menu select "Save Coverage to File"Open the images (coverage and scale) in an image editor foroverlaying on a base map To make a LabelIn the Tools menu select Create LabelClick the Init button.Type words into the various fields. Make them different sizes,colors, fonts, etc.When finished click OK.Go Back to the label and adjust spacings. Add Returns+Spaces forempty lines to space vertically.The label should show on the main screen. Set the print checkboxand position drop down menu.Click the Display button
FSC Instruction Manual 14

Program Organization and Structure
Conceptually, the program is comprised of Jobs, each of whichcontains a collection of one or more Sites. A Job employs asingle calculation category. There are three general calculationcategories:
! Area coverage (labeled ‘Continuous’) using power and
voltage parameters (dBm, dBW, dBk, dBu) ! Contour calculations (labeled ‘Contour’) (Currently 10
types of contour calculations may be selected andintermixed.) See the discussion under Contour Typesin the Discussions, Considerations and Backgroundchapter.
! Great circle point-to-point calculations (labeled ‘Great
Circle’)
A Job may contain any number of Sites. (Point-to-point has onlyone Site file that holds data for two locations.) When printing orcreating a graphics file all Sites connected with a Job may beselectively included in the output. A Site is a collection of specific data, usually associated with aphysical location. Depending on the calculation category, this cancomprise geographical coordinates and details and selections ofvarious parameters used in coverage calculations including terraindetails, antenna heights, etc. Antennas are individual files (with .opa extensions) of oneantenna or antenna configuration. Antenna files are listed in andmay be selected from a contextual (pull-down or drop-down)
FSC Instruction Manual 15
may be selected from a contextual (pull-down or drop-down)menu. FSC has two important screens and several less frequently usedsupporting screens. The Job screen is where jobs are establishedand selected. Print and file details are set on this screen and someSite details can be reviewed. The second primary screen is the Site screen that provides for Siteestablishment and holds data for one site. Its controls selectvarious parameters for a site and initiate terrain and field strengthcalculations.
The terms folder and directory have the same meaning.
Program Components
The executable application may be installed at any convenientlocation on the computer. Application aliases or shortcuts mayalso be placed anywhere, such as the desktop, etc. However,Windows versions are installed in specific locations automaticallyby the installer. There are four types of operational folders that may have anydesired names, are selected by the user, and their identities andlocations are retained in FSC until the user selects others. Thesefolders store functionally different data.
Jobs – A user selected folder where FSC stores new jobsand reads existing jobs. FSC will read and write job andother job support files to this folder. Since this folder isselectable, any number of Jobs folders may exist. Thisfolder will contain individual job folders.
FSC Instruction Manual 16

Sites – A folder that contains site files. This folder may bevisualized as a pool folder containing sites that may beattached to any compatible job. Because sites in thisfolder may be selected for any job, we have termed themuniversal sites. Ant – A folder that contains antenna files formatted forFSC. Properly formatted files have an .opa file extension.Each antenna file includes a horizontal, and optionally avertical, plane radiation pattern with gain valuesreferenced to a dipole (dBd). Ter – A folder containing digital elevation data files. Allfiles contain a 1-degree x 1-degree matrix of terrainelevations at 3 arc-second intervals. These files areformatted in the SRTM format. There are two databases that are in an FSC Databasesfolder that may be placed anywhere that contain boundaryand road data. The databases have extensions of .rsd andare entitled COUNTRYdb and usCOUNTYdb.
Job
Each job in FSC is a folder with a job name preceded by “fsj_”.For example, a job named “Savannah” would be a folder named(by FSC) “fsj_Savannah”. A job contains several components.Foremost is a job file with the name of the job and a fileextension of “.fsj”. The job name is taken as the job file name,for example, “Savannah.fsj”. The job folder will contain site filesand may contain terrain files, a boundary file and graphics filesconsisting of results of coverage calculations, a scale of distanceand/or a label to be placed on a map.
FSC Instruction Manual 17

A job file contains data common to all sites attached to it and theoverall job, including for example, site names of attached sites,printing and resolution values and, in the case of Continuous andContour categories, signal levels and colors. Each job folder contains one or more attached site folders. For anactive job, the names of all sites contained in the job folder areshown in a table on the Job screen. To attach a site to a jobsimply click the checkbox to the left of its name. Click again todetach a site from a job.
Site
A site file has as its name the site name with an “.fss” extension.Sites created when there is no active job are created in the Sitespool folder. Sites created while a job is active are written directlyinto the active job folder, as illustrated in the next section.
Site In a Job
An active job is one that has been selected on the Job screen fromthe Job popup menu. Actions described refer to the active job. When a job is selected all of the sites contained in that job folderare listed in the Sites table on the Job screen. Also listed in thetable are all the sites contained in the Sites pool folder. When a site from the Sites folder is attached to a job that has notpreviously been attached to the job (by clicking the checkbox tothe left of the site name on the Job screen) a copy of the site filefrom the site pool is placed into the job folder. The site name ofthe pool site is retained when placed in the job folder. Once a site is attached to a job, whenever that job is selected,functions and modifications are performed on the attached site.That is, the original pool site file remains unchanged; all changes
FSC Instruction Manual 18
That is, the original pool site file remains unchanged; all changesare performed on the copy placed in the selected job folder. This architecture permits reuse of a site file from a pool to beused in many jobs with each job able to customize the site asdesired. For example, changing antennas, heights and/or powers.
FSC Instruction Manual 19

Preference File FSC maintains on each computer, for each user, a file namedFieldStrengthPreferences. In that file are all of the user selectableoptions including data units and user entered titles to be printedon data sheets and coverage plots. Preferences are automaticallysaved when FSC quits. All information is saved in thepreferences file and will not be requested again unless thepreferences file has been replaced or corrupted. Because the possible names and locations of FSC data files arelimitless, there may be occasions when the user or applicationbecomes confused. If this occurs, locate theFieldStrengthPreferences file and move it to the recycle bin/trash.This will force FSC to start from scratch including re-enteringtitle information and identifying the various data folders.
FSC Instruction Manual 20

General Functions and Menu Descriptions In the FSC menu bar are standard functional and operationalselections such as Edit and Help. Other functions specific to FSCare found in the File and Tools menus.
Rename Functions
Job Screen –Select the job to be renamed in the Job pull down menu.Type the new job name in the field beneath the Job pulldown menu.Click the Save button.
Site Screen –Select a site to be renamed from the Current Site pull downmenu.Type the new site name in the Site Name field.Click the “Save Site” button.
Save, Save As and Change Name Functions
Save functions take different meanings depending on the state ofFSC. FSC is designed to guide the user when extra information isrequired to perform a function. The following pseudo code is included for informationalpurposes. There will normally be no reason to study it.Job Screen – Save button clicked.
If a job is currently selected –If changes have been made to a site, the site is saved.
If the field beneath the Job pull down menu is empty, theJob is saved. If the field is not empty, user will getprompted for a name change or for a Save Asoperation.
FSC Instruction Manual 21

operation. If a job is not currently selected –
If the field under Job pull down menu is not empty anew job is created if there is no existing job with thesame name.
Site Screen – Save Site button has been clicked.If a job is currently selected the following takes place in
the site’s job folder. Otherwise, the following takesplace in the Sites folder.
If a Site is selected -
If the Site Name field is empty the site is saved.If the field is not empty, the user is prompted for aname change or for a Save As operation.If a name change was selected the user is given the
option to change names of all occurrences of siteswith the old name.
If a Site is not selected -If the Site Name field is not empty a new site iscreated if there is no existing site with the same name.
File Menu
Save Job or Site – This is a smart save that saves either or bothjob and site. It may be invoked using the Ctrl-S (Cmd-S) keys. Itis also the equivalent of clicking the Save buttons on both Joband Site screens. Save Coverage To File – Saves the calculated coverage of theselected job to an image (.bmp or .pict-Mac) file. Also saves asimages a scale of km/miles based on the map scale, and any labelcreated in FSC. This function may also be invoked using Ctrl-F(Cmd-F) keys.
FSC Instruction Manual 22

Print Coverage – Prints the computed coverage image to a printerusing the user specified dot resolution and map scale. May beinvoked using Ctrl-P (Cmd-P) keys. Print Job Data – Prints a text page to the printer containing userspecified job and site data for all sites. May be invoked usingCtrl-D (Cmd-D) keys.
Tools Menu
Create Label – Displays the Label dialog of FSC. May also beinvoked using the Ctrl-L (Cmd-L) keys. The label is saved ondialog exit. Boundaries/Roads – Opens a dialog with which boundaries androads may be selected for U.S. counties and roads and the samefor most countries of the world. Feature colors and linethicknesses are also set here. Copy Job – A job that has been selected in FSC, and its contents,is copied to another user specified folder. If copied to the samefolder as the selected job, FSC prompts for a different job name. Copy Site – Duplicates a site file and its attendant files. If copiedto the same job folder FSC prompts for a different site name. Set Site Preferences – Saves as default any data present in theSite screen. Once preferences have been set, clearing the Sitescreen will load the saved values. Set Job Preferences – Saves as default any data present in the Jobscreen. Once set, clearing the Job screen will load the savedvalues.
FSC Instruction Manual 23

Calibrate – Invokes the Calibrate dialog that enables somestatistical analysis of signal levels or path losses in user specifiedareas. Used only with the Continuous category. Import Antenna – Performs a sequence of steps to import anantenna file. A pull down menu selector lists the permittedformats. When obtaining antenna patterns specify one of theseformats. Imported formats are converted to the Obspat format andstored in the “Ant” folder. Set Map Parameters – Invokes the dialog that selects the mapprojection used for output files and displays. These includeGeometric, Lambert Conformal Conic, Albers Equal Area andTransverse Mercator projections. Geographic coordinates may beentered that define the map reference from which Sites anddirections are computed for the selected projection. Earth shapeconstants may be entered or selected from a list of referencevalues. This data is stored with a job and may differ betweenjobs, if desired. Most of these parameters are filled-inautomatically by FSC. Select Jobs Folder – Selects the default folder within which FSCwill search for jobs. Select Sites Folder – Selects the default folder within which FSCwill search for sites if not found in the current Job folder. Select Antenna Folder – Selects the default folder within whichFSC will search for antennas. Select Terrain Folder – Selects the default folder within whichFSC will search for SRTM terrain data.
FSC Instruction Manual 24

Select Database folder – Selects the default folder containing theCounty and Country boundary/roads databases.
FSC Instruction Manual 25

Starting FSC Once installed, FSC may be started in all of the usual waysaccording to each particular platform.
Normal
Windows users may use the Start>Program menu or click ashortcut. Mac users have similar availability.
Emergency
FSC normally starts by using the user preference file that containspaths to the previously selected working directories. FSC can be made to start when one or more of these folderlocations are missing from the user preference file. Start FSCprogram in the usual manner. As each folder location is requestedin a dialog, click cancel. Several warning messages may beissued. Dismiss them. Eventually, the main screen will appear.Then, from the Tools menu, select the locations of the desiredoperational folders.
FSC Instruction Manual 26

Operations Issues Common to all Categories
A typical session for any category, except point-to-point, beginswith an assessment of the desired project’s goals, usually startingwith obtaining or creating a base map of a known scale. If themap is digital, the resolution (dot density - dpi) should be known.Scale and resolution factors are entered in each Job. The base map creation process includes determining the overallkm or mile extent of the map. For example, determine therequired length and width of the map in km or miles consideringthe positions of the Sites to be plotted, including theirapproximate coverage radii. Other times a map might be requiredto include a specific geographic area. Next consider the featuresto be included on the map such as roads, political boundaries,cities, etc. (It is very useful – and impressive - to use topographicmaps with included contour lines because coverage data hasbreaks in coverage that match terrain undulations.) FSC can be run at any map scale. Therefore, one could pick anyrandom scale, create a map, the signal coverage, a label and atitle block and have accurate results – if one can create a map atthe selected scale. Without a mapping program this may bedifficult to accomplish. Usually it is necessary that scale alsoconsider the size of the desired output plot to match the desiredmap size to paper size. While it is true that any size is possible,simple reductions of oversize maps usually lead to losses ofresolution and poorer quality. The same is true for expandingundersized maps. So, get in the habit of sizing a project to bothmap scale and paper size. This is a simple process. To determine scale considering paper size, scales must becomputed for both the length and width of the paper and selectthe larger of the two values. Include a margin on each edge as
FSC Instruction Manual 27

the larger of the two values. Include a margin on each edge asdesired. For metric sizes, divide the required map width in km(converted to cm) by the width of the paper (in cm), less the leftand right margins in cm.
Likewise, divide the required map height in km (converted to cm)by the height of the paper less the top and bottom margins in cm.For English units use miles and inches. The required map scale isthe larger of the two calculations and is spoken as a “scale of oneto ‘scale’ ” and written as 1:‘scale’. For example, assume a paper width = 20 cm and height = 30 cm.Assume margins of 1 cm on all sides. Assume the required mapwidth to be 50 km and the height to be 25 km. It is clear that thepaper first needs to be rotated to the landscape position for bestfit. To convert km to cm, multiply by 100’000. This obtains awidth = 5’000’000 cm and a height = 2’500’000 cm. Thencompute two scales as 5’000’000/(30 – 2) = 178’571 = width and2’500’000/(20 – 2) = 138’889 = height. The map scale that willfit inside the paper margins is 178’571, which can be rounded upto a scale of 1:180’000. For English units, use miles and inchesand a conversion multiplier = 63,360. To keep file sizes reasonable, a resolution of 150 dpi for mapsand all FSC images has yielded good quality maps. For organizational efficiency a Project folder is usually firstcreated to hold all project jobs, sites and terrain. With multi-siteprojects there are frequently several jobs, perhaps holdingdifferent combinations of sites or sites that have differentcharacteristics such as different antenna heights. If not alreadyselected, select the new project folder in the Tools/Select JobsFolder menu.
FSC Instruction Manual 28

If sites are to be used repeatedly for a project and are not in theuser designated Sites folder, you may want to enter these sitesinto the Sites folder at this time or copy (and edit) a site to theSites folder. Recall also, that new sites may also be independentlyplaced in any Job folder at any time.
FSC Instruction Manual 29
Continuous Category Job Operations
Either select an existing job in the Job menu, or, start a new Jobby entering a job name in the field below the Job menu. If severalconfigurations are to be computed, it is usual to place eachconfiguration in a separate Job in the project folder. Each jobname should also reflect the configuration to avoid laterconfusion. For new jobs, select the Job Type. Then enter print scale,resolution and frequency. Next, click on the Save button. Thenselect the new Job in the Job menu. Create new or select Sites to be used from the Site list box. ASave is recommended at this point. Highlight each selected Site by clicking on its name. On the Jobscreen enter Site Label information, Site Center Cross, Print andlabel location with respect to the Site center. Select an antenna if the desired pattern is in the Antenna Patternlist and enter the antenna orientation azimuth. Omni antenna gainis included in the Fixed Gains and Losses field. Enter Fixed Gains and Losses and select the power units for theJob. If a job label is to be used, it may be created at any time. Notethe label will not appear in any output unless the Print (label) isselected. Select the position of the label. This category plots coverage continuously over a desired area.The size of the area depends on the desired signal level to beobserved, lower levels producing larger areas. In the Level
FSC Instruction Manual 30

observed, lower levels producing larger areas. In the Levelsection select Level Units, fill in the table showing (signal) Level,Level Label and color. FSC first plots the top row of the Leveltable for each site and repeats for each subsequent row. Thisstrategy enables coherent plotting of multiple sites. It is importantthat the table use ascending signal levels. Recall that Sites for the Power and dBu categories compute pathlosses for a given polarization, transmitting antenna location andheight. Thus, any changes may be made, for any Site, to theSite’s transmitter antenna and Fixed Gains and Losses fieldwithout need to re-compute path losses. Any change of Sitelocation requires re-computing terrain and path loss. Antennaheight and polarization changes also require that path losses bere-computed.
FSC Instruction Manual 31
Continuous Category Site Operations
If a site is to be added to a job, select the job. Transfer to the Sitescreen. If a site is to be installed in the general Sites folder, verify thatthe Sites folder path is correct. On the Job screen verify that nojob is selected, then select a Job Type. Transfer to the Site screen. Enter the site’s name in the Site Name field. If using Englishunits, click the English Units control on the lower right of theSite screen. Click the Save Site button at the bottom of the screen.Select the Site from the Current Site drop down menu. Enter the remaining data for the Site. Click the Save Site button. Click the Make Terrain button. Click the Calculate Button. Clickthe Save Site button. If everything is functional, the Have Terrain and Have Calcsindicators will be visible. Additional Site information, such as a site label that appearsadjacent to the site center mark, may be added on the Job screenafter a site has been selected for an existing job. The Job screenSite Center Cross, Print and Site Label controls are Site controlsthat appear in the Job screen. To add, change or delete the Sitelabel information, select a Job and click on the site name. On theJob screen, make desired changes or delete the label text. Clickthe Save button. Establishment of map markings may proceed as desired.Provisions are included to easily link map markings to one of thesites in a job. Select either Cmd-B/Ctrl-B or the Tools >
FSC Instruction Manual 32

sites in a job. Select either Cmd-B/Ctrl-B or the Tools >Boundaries/Roads menu. Select one of the sites from the drop-down menu in the Boundaries window. Then fill in the rest of theinformation and exit the window. Selecting one of the job’s sitesis not mandatory. Any area center latitude/longitude pair anddistance may be used.
FSC Instruction Manual 33

Contour Category Job Operations
Either select an existing job in the Job menu, or, start a new Jobby entering a job name in the field below the Job menu. If severalconfigurations of sites are to be computed, it is usual to placeeach configuration in a separate Job in the project folder. Eachjob name should also indicate the configuration to avoid laterconfusion. For new jobs, select the Job Type. Then enter print scale,resolution and frequency. Next, click on the Save button. Thenselect the new Job in the Job menu. Select Sites to be used from the Sites list. Save is recommendedat this point. Highlight each selected Site by clicking on its name. Enter SiteLabel information, Site Center Cross, Print and label locationwith respect to the Site center. Establishment of map markings may proceed as desired.Provisions are included to easily link map markings to one of thesites in a job. Select either Cmd-B/Ctrl-B or the Tools >Boundaries/Roads menu. Select one of the sites from the drop-down menu in the Boundaries window. Then fill in the rest of theinformation and exit the window. Selecting one of the job’s sitesis not mandatory. Any area center latitude/longitude pair anddistance may be used. If a job label is to be used it may be created at any time. Note thelabel will not appear in any output unless the Print (label) isselected. Select the position of the label.
FSC Instruction Manual 34

Contour Category Site Operations
If a site is to be added to a job, select the job. Transfer to the Sitescreen. If a site is to be installed in the Sites folder, verify that the Sitesfolder path is correct. On the Job screen verify that no job isselected, then select a Job Type. Transfer to the Site screen. Enter the site’s name in the Site Name field. If using Englishunits, click the English Units control on the lower right of theSite screen. Click the Save Site button at the bottom of the screen.Select the Site from the Current Site list. Enter the remaining values for the Site. Begin by entering foreach contour a Contour Value and selecting a Data Source (rightclick), Line Color and Fill Color, if any. Then enter Label, LineType and Line thickness (mm) and other data. Click the Save Site button. When finished entering data and saving, click the Calculatebutton. The Have Calcs control will turn on if all is well. Note that all contour methods except manual entry and Cost-Hatarequire terrain calculations. However, since the required terraindistances are fixed, FSC automatically computes all requiredterrain without the need for user attention. Additional Site information may be added on the Job screen aftera site has been selected for an existing job. The Job screen SiteCenter Cross, Print and Site Label controls are stored in the Sitefile. To add, change or delete the Site label information, on theJob screen select a Job and click on the site name. Make desired
FSC Instruction Manual 35

Job screen select a Job and click on the site name. Make desiredchanges or delete the label text. Click the Save button.
FSC Instruction Manual 36

Great Circle (Pt to Pt) Category Operations
Either select an existing job in the Job menu, or, start a new Jobby entering a job name in the field below the Job menu. For new jobs, select Great Circle in the Job Type. Click the Savebutton. Then select the new Job in the Job menu. Transfer to the Site screen by clicking on the Site button. Enter ormake changes for data on that page. If the Have Calcs control isnot activated click on the Calculate button. Click the Save Site button at the bottom of the screen. Return tothe Job screen. Enter any remaining data and click on the Savebutton.
FSC Instruction Manual 37

Continuous Category Job Controls There are a number of options, checkboxes and other controls onthe FSC Job screen. This Section deals with their functions. Notethat some controls from this category also appear in othercategories, their functions remaining identical. This category employs a detailed terrain database and a set ofsophisticated calculations to produce (isotropic) path loss over auser defined area. It can account for and employ atmosphericconditions, soil conditions, frequency and other physicalcharacteristics known to affect radio frequency propagation.Based on a series of worldwide, long-term measurements thismethod can also account for statistical variations to obtainestimates of reliability over time, location and situation. Because this category produces path losses it is independent of allradio system characteristics except transmitting antenna location,frequency, polarization and the heights above ground of thetransmitting and receiving antennas. Thus, once path losses for anarea have been computed, any system parameter may be changedwithout the need to recalculate. For example, antenna patterns,transmitter powers, receiver sensitivities and transmission linecomponents may be changed, provided that transmitter location,polarization, antenna heights and frequency remain unchanged.
FSC Instruction Manual 38
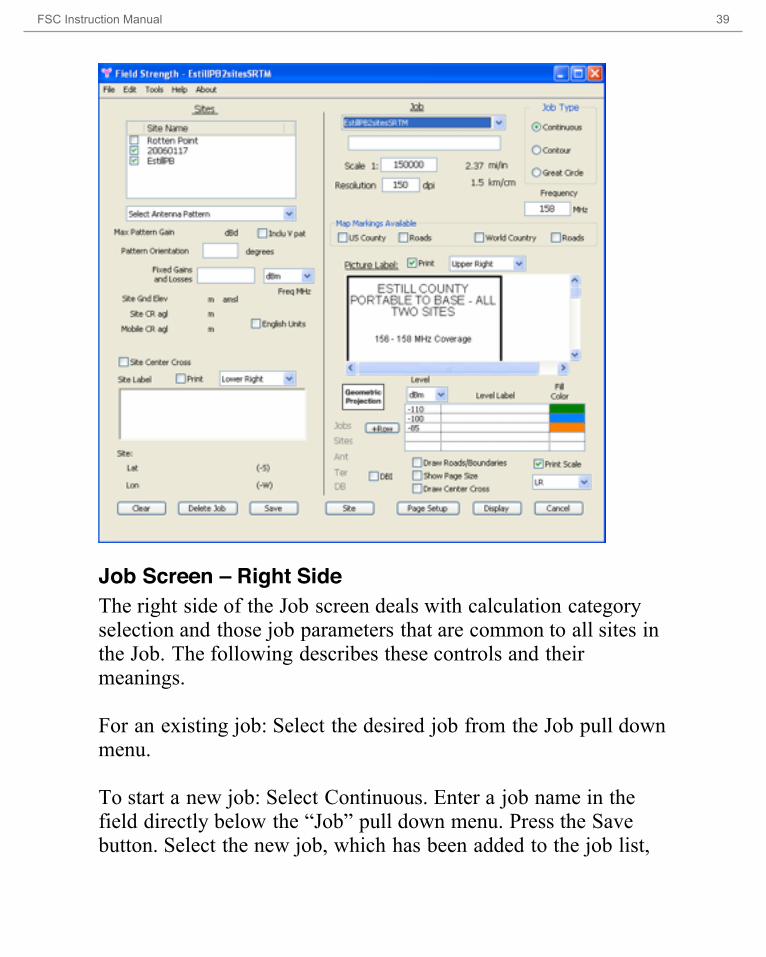
Job Screen – Right Side
The right side of the Job screen deals with calculation categoryselection and those job parameters that are common to all sites inthe Job. The following describes these controls and theirmeanings. For an existing job: Select the desired job from the Job pull downmenu. To start a new job: Select Continuous. Enter a job name in thefield directly below the “Job” pull down menu. Press the Savebutton. Select the new job, which has been added to the job list,from the pull-down menu.
FSC Instruction Manual 39

from the pull-down menu.
Print Scale – This is a ratio of cm to cm. Usually this isset to match your map scale. For example, a Print or Mapscale of 1:100000 would represent 1 cm (on map) =100000 cm (on Earth) (= 1000 m = 1 km).
Resolution – is in dots per inch (dpi) for historicalreasons. This value directly impacts the size of an outputfile. This number should also match your base mapresolution, a reasonable value being 150 dpi. Frequency – This is the “official” job frequency value andis stored with the job. There is also a frequency valueassociated with each site, which is the frequency used fordetermining the site’s path loss. These two frequencies areused as verification to help prevent a site computed at onefrequency from being used in a job having a differentfrequency. A warning is issued when the site and jobfrequencies differ by more than 15 percent. Map Markings Available – Four checkboxes indicatewhich features are included in the boundary (.bdr) file ofthis job. This file is created by selecting Tools >Boundaries/Roads or using Ctrl-B (Cmd-B). US Countydisplays Unites States county boundaries. Roads currentlydisplays US Interstate Highways and some other limitedaccess roadways. World Country displays countryboundaries for most of the Earth. Roads displays manymajor roads in most countries. Note that World Countryalso displays ocean boundaries and may be used with USCounty boundaries for states bordering water.
FSC Instruction Manual 40

Picture Label Print – Select if a label is to be printed onthe graphic. FSC has label generating capability. The labelroutine is invoked with Ctrl-L (Cmd-L) or in the Toolsmenu. Labels may be included separately as a file orprinted on screen and printer presentations. Position Label – This pull down menu positions the labelin one of the corners of the graphic. Open Area – A label generated with FSC and appearingin a job folder is displayed in this area. Level Units – A pull down menu that identifies the unitsof the Levels entered in the first column of the Leveltable. Choices are dBm, dBW and dBu (dB above onemicrovolt per meter). Levels and Colors – This is the input table controllingdisplay of computed field strength data. Power levels areentered at which the display of signals will change color.Each level and its associated color will be applied to allsites appearing in an output graphic. Words typed in theLevel Label column may be used in an FSC created Labelalong with the level entered in the first column. See thelabel in the example file. Clicking the mouse button in thethird column of the table invokes the system’s color pallet. (It is recommended that values producing the greatestdistance be entered first, followed in order by levelsproducing lesser distances. This sequence is recommendedbecause the coverage from the first row of the table isdrawn first, on top of which is drawn each of the others inrow sequence. FSC has some provisions for sorting, butwill automatically sort only in situations where it is clear
FSC Instruction Manual 41

will automatically sort only in situations where it is clearwhat the user desires. For other situations the user isresponsible for ordering the data. For example, if levelsare entered in dBm, the sequence entered might be -110, -100, -85 dBm.) Projection Indicator – Shows the currently selected mapprojection. A mouse click on this indicator opens the mapprojection window. DBI Indicator – FSC antenna gain reference. Eitherisotropic (dBi) or dipole (dBd) reference. Draw Roads/Boundaries – Select to have FSC includeroads and boundaries in output graphics and prints. Show Page Size – When selected, prior to printing, amessage is issued that gives the page size required tocompletely contain the output graphic at the given scale. Draw Center Cross – Select to have FSC place a cross atthe center of the output graphic. Print Scale – Select if a distance scale is desired on thegraphic. Position pull down menu – If a distance scale is requestedthis control selects the corner of the graphic at which thescale is placed. Choices are upper right, upper left, lowerright and lower left. Jobs, Sites, Ant, Ter – These grayed words reveal thepaths to their respective folders when the mouse cursor ispoised above them. The paths are displayed beneath the
FSC Instruction Manual 42

poised above them. The paths are displayed beneath therow of buttons at the bottom of the Job screen.
Job Screen – Left Side
On the left side some parameters may be entered orselected that will not require recalculation of a site’s pathlosses. These are specific to and are a part of a Site file. Sites in the Sites list are attached to an active Job byclicking the checkbox to the left of the site’s name. (A Jobis active once it has been selected in the Jobs pull downmenu.) Sites are deselected from a job by unchecking thecheckbox. To view limited Site data, whether or not the site has beenselected, click the desired Site’s name outside of thecheckbox.
Select Antenna Pattern – Pull down menu displaysantenna files in the current Ant folder from which anantenna may be selected. If no antenna is selected adefault gain of zero dBd (unity gain) is assumed. Inclu V Pat – If the selected antenna has a verticalradiation pattern, selecting this function causes FSC toalso utilize that data. Pattern Orientation – Antenna directional radiationpatterns are stored with their main lobes pointed to North(N 0° E). Azimuths increase from 0 to 360 degrees in aclockwise direction through East, South and West. Fixed Gains and Losses – This field should include allsystem gains and losses except path losses (calculated by
FSC Instruction Manual 43
system gains and losses except path losses (calculated byFSC). Include the transmitting antenna gain unless anantenna has been selected in the pull down menu.Calibration and other adjustments may also be included.But, minimally, this number should include transmitterpower, filter and line losses at both ends, preamplifiergain and antenna gains (exclude the transmitter antennagain when employing an antenna pattern from the SelectAntenna Pattern drop down menu). FSC then computesthe received power including path losses. English Units – This indicator displays which unitsversion is in effect for the displayed site. Sites may useeither English or metric systems. Sites using either systemmay be freely intermixed in a given job. Site Center Cross – When selected a cross will be placedon graphics at the location of the site. Site Label Print – When selected this will include thesite’s text label. Site Label Position – Pull down menu selects the offsetdirection, from the site’s center, where the label is placed. Site Label – Text that will be placed on the graphicsoutput at the position selected above. Carriage returns andempty lines are honored, thus providing for limited layoutcapability. Clear Button – Clears, resets the screen and deselects thejob.
FSC Instruction Manual 44
Delete Job Button – Deletes the selected Job Save Button – Smartly saves Job and Site changes asnecessary. Site Button – Switches to the Site screen. Page Setup Button – The standard printer setup. Display – Prints on the screen a scaled picture of theoutput. Cancel – Quits the program.
FSC Instruction Manual 45

Continuous Category Site Controls There are a number of options, checkboxes and other controls onthe FSC Job screen. This Section deals with their functions. Notethat some controls from this category also appear in othercategories, their functions remaining identical. This category employs a detailed terrain database and a set ofsophisticated calculations to produce (isotropic) path loss over auser defined area. It can account for and employ atmosphericconditions, soil conditions, frequency and other physicalcharacteristics known to affect radio frequency propagation.Based on a series of worldwide, long-term measurements thismethod can also account for statistical variations to obtainestimates of reliability over time, location and situation. Because this category produces path losses it is independent of allradio system characteristics except transmitting antenna location,frequency, polarization and the heights above ground of thetransmitting and receiving antennas. Thus, once path losses for anarea have been computed, any system parameter may be changedwithout the need to recalculate. For example, antenna patterns,transmitter powers, receiver sensitivities and transmission linecomponents may be changed, provided that transmitter location,polarization, antenna heights and frequency remain unchanged.
Site Screen
Sites created with no job selected are placed in the user specifiedSites folder. Sites created while a job is selected are placed in theselected job’s folder. A Site is a file containing information about a site. A site filename is comprised of the site name with an “.fss” file extension.
FSC Instruction Manual 46

name is comprised of the site name with an “.fss” file extension.Sites are individually calculated, by site, and may, if attached to ajob, spawn additional files such as a terrain file and path loss file.
Site Name – If no site is selected, entering a name in thisfield and clicking the Save Site button will create a newsite file in the current Sites folder. If a job has beenselected it will be placed in the current job’s folder. Comments – This field is for any notes or privatecomments associated with a site. None of these commentsare printed or otherwise exposed outside of the site file. Frequency (MHz) – The frequency that will be used withall calculations associated with this site.
FSC Instruction Manual 47
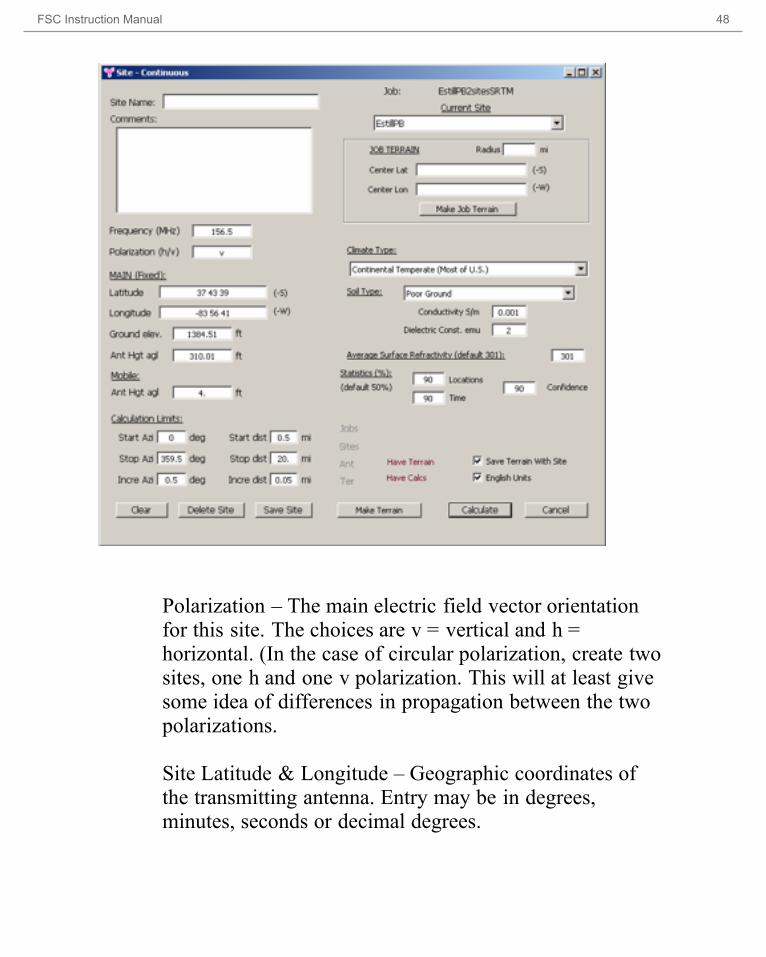
Polarization – The main electric field vector orientationfor this site. The choices are v = vertical and h =horizontal. (In the case of circular polarization, create twosites, one h and one v polarization. This will at least givesome idea of differences in propagation between the twopolarizations. Site Latitude & Longitude – Geographic coordinates ofthe transmitting antenna. Entry may be in degrees,minutes, seconds or decimal degrees.
FSC Instruction Manual 48

Ground Elev. – Elevation above mean sea level of theground at the transmitting antenna location using theprevailing units. If left blank, when terrain is computedfor the site, this field will be filled-in automatically. If amore accurate elevation is known, it should be utilized. Ant Hgt agl – Antenna radiation center height aboveground level. Mobile Ant Hgt agl – This is the height above ground ofthe test receive antenna radiation center. This antenna ismoved over the user specified area of interest. Calculation Limits Azimuth – The beginning, ending andincremental azimuths (degrees) of radials to be calculated.Frequently these values are [0, 360, 1]. However, if thedesired radial distance is great, the increment may bedecreased to provide less space between radials at greaterdistances. Incremental distances could be 0.5 or 0.25degrees, or less. Calculation Limits Distance – The beginning, ending andincremental distances in current units at which FSCshould compute the path loss. Incremental distances lessthan the distance between terrain elevation pointsproduces no accuracy improvements. A typical value forincrement is about 0.3 km. Hint: the start distance is usually made greater than zeroto provide an empty circle for a short distance around thesite location. This permits greater accuracy in aligning thesite on a map, particularly when a cross is also plotted atthe site’s center. The stop and incremental distances arealso used by terrain routines.
FSC Instruction Manual 49

also used by terrain routines. Current Site – Pull down menu to select a site from thelist of Sites on the Job screen. The following three controls are to be used only if a JobTerrain file is to be created. (Terrain for individual sitesuse the site coordinates and end distance and MakeTerrain button for terrain creation.)
Terrain Radius, Center Lat, Center Lon – Enterdesired values and click Make Job Terrain. Thiscan be used to produce a common terrain file forall sites within the specified Radius. Be careful toensure the radius includes the full extent of thedesired areas of the enclosed sites.
Climate Type Selection – This pull down menu selects forthe general type of climate in which the system willoperate. Select the one that applies. Soil type – The pull down menu selects for soilconductivity and dielectric constant with types rangingfrom poor to seawater. If in doubt select Average Ground.Conductivity and Dielectric values for the selected soiltype are automatically entered. Conductivity and Dielectric constant – These two fieldspermit direct entry if the values are known. Averages overradial distances or over the entire area should be used. Average Surface Refractivity – Tables and graphsshowing average values worldwide are available. Ifunknown, use the default value.
FSC Instruction Manual 50
unknown, use the default value. Statistics: Locations, Time and Confidence – These fieldspermit modification of path loss values based onpercentage of time and locations. Median (50%) valuesmay be used, although many problems require 90% timeand locations reliability data. For interference calculationsvalues of 10% time/locations are typically assigned topotential interferors. Confidence is a statistic that biasesthe calculations; for example, one area may be more likelyto provide lower path losses than another area. This mightoccur when one system has significantly fewer trees thananother. Confidence is an estimate of how the currentsystem relates to all possible systems from the poorest tothe best. If a pessimistic outlook (higher path loss values)is desired, confidence should be given a higher percentageand vice-versa. Have Terrain – An indicator that illuminates when theselected site has appropriate terrain data. FSC operatesthis control. Have Calcs – An indicator that illuminates when theselected site has appropriate path loss data. FSC operatesthis control. Save Terrain With Site – If unchecked, terrain will berecalculated each time path loss is calculated. The size ofa 32 x 32 km terrain file is about 1 Mb. English Units – A user control that selects English units.This applies only to the current site. The default is metricunits.
FSC Instruction Manual 51

Jobs, Sites, Ant, Ter – These grayed words reveal thepaths to their respective folders when the mouse cursor ispoised above them. The paths are displayed beneath therow of buttons at the bottom of the screen. Paths to thevarious folders are selected from the Tools menu bar. Clear Button – Clears and resets the Site screen. Delete Site Button – Deletes a selected site from a currentJob or from the Site folder if no Job has been selected. Save Site Button – Saves the selected site to a Job folderor to the Sites folder if no job has been selected. Make Terrain Button – Creates a terrain file for theselected site. Calculate Button – Computes the path loss after firstdeveloping any necessary terrain data. Cancel – Quits the Site screen.
FSC Instruction Manual 52

Contour Category Job Controls
Job Screen
Most technical data for this category is entered on the Site screenwhere each site may have different antennas, powers, types ofcontour lines and different fill and line colors for each contour.The Job screen has fewer controls than the Continuous categories,but each control has the same functionality as described in detailfor the Continuous category.
Job Screen – Right Side
FSC Instruction Manual 53

The right side of the Job screen deals with calculation categoryselection and those job parameters that are common to all sites inthe Job. The following describes these controls and theirmeanings. Note that a label would show on this screen if this jobhad one. See Job screen of the Continuous Category. For an existing job: Select the desired job from the Job pull downmenu. To start a new job: Select Continuous. Enter a job name in thefield directly below the “Job” pull down menu. Press the Savebutton. Select the new job, which has been added to the job list,from the pull-down menu.
Print Scale – This is a ratio of cm to cm. Usually this isset to match your map scale. For example, a Print or Mapscale of 1:100000 would represent 1 cm (on map) =100000 cm (on Earth) (= 1000 m = 1 km).
Resolution – is in dots per inch (dpi) for historicalreasons. This value directly impacts the size of an outputfile. This number should also match your base mapresolution, a reasonable value being 150 dpi. Frequency – This is the “official” job frequency value andis stored with the job. There is also a frequency valueassociated with each site, which is the frequency used fordetermining the site’s path loss. These two frequencies areused as verification to help prevent a site computed at onefrequency from being used in a job having a differentfrequency. A warning is issued when the site and jobfrequencies differ by more than 15 percent.
FSC Instruction Manual 54

Map Markings Available – Four checkboxes indicatewhich features are included in the boundary (.bdr) file ofthis job. This file is created by selecting Tools >Boundaries/Roads or using Ctrl-B (Cmd-B). US Countydisplays Unites States county boundaries. Roads currentlydisplays US Interstate Highways and some other limitedaccess roadways. World Country displays countryboundaries for most of the Earth. Roads displays manymajor roads in most countries. Note that World Countryalso displays ocean boundaries and may be used with USCounty boundaries for states bordering water. Picture Label Print – Select if a label is to be printed onthe graphic. FSC has label generating capability. The labelroutine is invoked with Ctrl-L (Cmd-L) or in the Toolsmenu. Labels may be included separately as a file orprinted on screen and printer presentations. Position Label – This pull down menu positions the labelin one of the corners of the graphic. Open Area – A label generated with FSC and appearingin a job folder is displayed in this area. Level Units – A pull down menu that identifies the unitsof the Levels entered in the first column of the Leveltable. Choices are dBm, dBW and dBu (dB above onemicrovolt per meter). Levels and Colors – This is the input table controllingdisplay of computed field strength data. Power levels areentered at which the display of signals will change color.Each level and its associated color will be applied to allsites appearing in an output graphic. Words typed in the
FSC Instruction Manual 55
sites appearing in an output graphic. Words typed in theLevel Label column may be used in an FSC created Labelalong with the level entered in the first column. See thelabel in the example file. Clicking the mouse button in thethird column of the table invokes the system’s color pallet. (It is recommended that values producing the greatestdistance be entered first, followed in order by levelsproducing lesser distances. This sequence is recommendedbecause the coverage from the first row of the table isdrawn first, on top of which is drawn each of the others inrow sequence. FSC has some provisions for sorting, butwill automatically sort only in situations where it is clearwhat the user desires. For other situations the user isresponsible for ordering the data. For example, if levelsare entered in dBm, the sequence entered might be -110, -100, -85 dBm.) Projection Indicator – Shows the currently selected mapprojection. A mouse click on this indicator opens the mapprojection window. Draw Roads/Boundaries – Select to have FSC includeroads and boundaries in output graphics and prints. Show Page Size – When selected, prior to printing, amessage is issued that gives the page size required tocompletely contain the output graphic at the given scale. Draw Center Cross – Select to have FSC place a cross atthe center of the output graphic. Print Scale – Select if a distance scale is desired on thegraphic.
FSC Instruction Manual 56
graphic. Position pull down menu – If a distance scale is requestedthis control selects the corner of the graphic at which thescale is placed. Choices are upper right, upper left, lowerright and lower left. Jobs, Sites, Ant, Ter, DB – These grayed words reveal thepaths to their respective folders when the mouse cursor ispoised above them. The paths are displayed beneath therow of buttons at the bottom of the Job screen.
Job Screen – Left Side
On the left side some parameters may be entered orselected that will not require recalculation of a site’s pathlosses. These are specific to and are a part of a Site file. Sites in the Sites list are attached to an active Job byclicking the checkbox to the left of the site’s name. (A Jobis active once it has been selected in the Jobs pull downmenu.) Sites are deselected from a job by unchecking thecheckbox. To view limited Site data, whether or not the site has beenselected, click the desired Site’s name outside of thecheckbox. English Units – This indicator displays which unitsversion is in effect for the displayed site. Sites may useeither English or metric systems. Sites using either systemmay be freely intermixed in a given job. Site Center Cross – When selected a cross will be placedon graphics at the location of the site.
FSC Instruction Manual 57

on graphics at the location of the site. Site Label Print – When selected this will include thesite’s text label. Site Label Position – Pull down menu selects the offsetdirection, from the site’s center, where the label is placed. Site Label – Text that will be placed on the graphicsoutput at the position selected above. Carriage returns andempty lines are honored, thus providing for limited layoutcapability. Clear Button – Clears, resets the screen and deselects thejob. Delete Job Button – Deletes the selected Job Save Button – Smartly saves Job and Site changes asnecessary. Site Button – Switches to the Site screen. Page Setup Button – The standard printer setup. Display – Prints on the screen a scaled picture of theoutput. Cancel – Quits the program.
FSC Instruction Manual 58
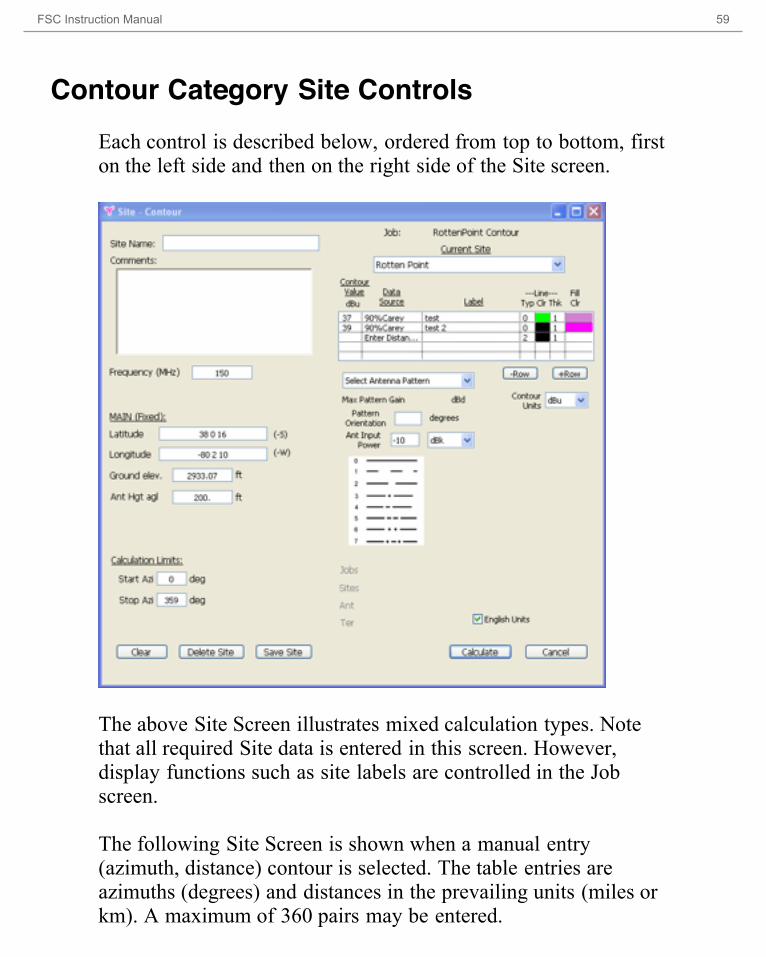
Contour Category Site Controls Each control is described below, ordered from top to bottom, firston the left side and then on the right side of the Site screen.
The above Site Screen illustrates mixed calculation types. Notethat all required Site data is entered in this screen. However,display functions such as site labels are controlled in the Jobscreen. The following Site Screen is shown when a manual entry(azimuth, distance) contour is selected. The table entries areazimuths (degrees) and distances in the prevailing units (miles orkm). A maximum of 360 pairs may be entered.
FSC Instruction Manual 59

Entry of a single pair is interpreted as a circle with a radius equalto the tabular distance value. All entered points are linearlyinterpolated to fill in the distances every degree.
Control descriptions and functions are detailed below for bothSite screen variations.
Site Name – If no site is selected, entering a name in thisfield and clicking the Save Site button will create a newsite file. This file will be placed in the current Sites folderif no job is selected, otherwise it will be placed in thecurrent job’s folder. If a site is currently selected, entering a name in this fieldand clicking the Save Site button invokes a dialogallowing selection of a Change Name or Save As
FSC Instruction Manual 60

allowing selection of a Change Name or Save Asfunction. Comments – This field is for any notes or privatecomments associated with a selected site. None of thesecomments are printed or otherwise exposed outside of thesite file. Frequency (MHz) – The frequency that will be used in allcalculations associated with this site.
Site Latitude & Longitude – Geographic coordinates ofthe transmitting antenna. Entry may be in degrees,minutes, seconds or decimal degrees. Ground Elev. – Elevation above mean sea level of theground at the transmitting antenna using the chosen units.If left blank, when terrain is obtained for the site, thisfield will be filled-in automatically. If a more accurateelevation is known, it should be utilized. Ant Hgt agl – Antenna radiation center height aboveground level. Mobile Ant Hgt agl –This is the height above ground ofthe test receive antenna radiation center that is movedover the user specified area of interest. This field isrequired only for those calculations that permit the mobileantenna height to be changed such as the Cost-Hata andMobile(TV) contour methods. The remaining methodshave mobile antenna heights implicit in their definitionswith no provisions for changing heights. However, byadjusting the contour value and/or power input values, anyfactor may be compensated for.
Calculation Limits – Start and Stop Azimuth fieldsprovide for display of partial contours. If left blank a full
FSC Instruction Manual 61

provide for display of partial contours. If left blank a full360° contour is assumed. Current Site – This pull down menu selects the current sitefrom its list of sites, if any. Contour Setup – The following items occur in the table.Many of the tabular values may be defaulted.
Contour Value – All contour types except “EnterDistance” require a value in this column. Thevalue units are dBm, dBW or dBu. To enter avalue, click on the desired cell. Data Source – This column is activated by right-clicking (Ctl-click) when the mouse cursor issimultaneously poised over the desired row and theData Source column. A list is presented afterwhich scrolling the mouse and releasing selects thedesired calculation. Label – This column accepts a text label that isused by the job Label creation process. The labeltext and contour value are colored with either thecontour fill color or, if no fill is selected, thecontour line color. This cell may be displayed in alarger format by shift-clicking on a Label cell. Typ (Line Type) – This column selects one of theline types shown in the box of lines. Click on theTyp cell and enter the type number, 0 to 7. Noentry defaults to Line Type 0, a solid line. Clr (Line Color) – Clicking in these cells invokesthe system color picker. The contour line will bedrawn in the selected color. Colors may bedefaulted, typically using black. Recall that white
FSC Instruction Manual 62

defaulted, typically using black. Recall that whitewill not print. Thk (Line Thickness) – The contour line thicknessin millimeters. A value of zero causes the line tobe not drawn. Fill Clr (Fill Color) – Clicking in these cellsinvokes the system color picker. The entire contourwill be filled in the selected color. Colors may bedefaulted.
+ Row – This button adds a row to the table. Clickingmultiple times adds multiple rows. However, when a Siteis “calculated”, rows missing a Contour value are culledfrom the table. - Row – This button deletes a row from the table. Click arow and then click this button.
Contour Units – This pull down menu sets the units forthe Contour Values. Choices are dBm, dBW or dBu. Allcontours must use the selected unit. (If mixed units aredesired, create an additional site and select a differentunit.) Select Antenna – Selects the antenna pattern from the listof antenna files in the user designated Antenna folder. Theantenna name is displayed and its maximum gain isdisplayed. If no antenna is selected the default gain is 0dBd. Pattern Orientation – Antenna directional radiationpatterns are stored with their main lobes pointed north (N0° E). Azimuths increase from 0 to 360 degrees in aclockwise direction through East, South and West.
FSC Instruction Manual 63

Antenna Input Power – The value entered in this fieldshould include system losses and gains and include apower source. See an expanded discussion in the ‘FixedGains and Losses – Continuous, dBu and Great Circle’section. Antenna Power Units – The units of the power source canbe dBm, dBW or dBk. These units are referenced to onemilliWatt, one Watt and one kiloWatt, respectively. Enter Distance – When the Data Source is “EnterDistance”, an Azimuth/Distance table and two buttonsappear.
Azimuth – Holds azimuth values in degrees. Distance – Holds distance values in metric orEnglish units according to the selected system. Clear List Button – Clears the entire entry table. Save List Button – Saves only the manual entrytable.
Have Calcs – An indicator that illuminates when theselected site has had the contours calculated. FSCoperates this control. English Units – A user control that selects English units.This applies only to the currently selected site. The defaultis metric units.
Jobs, Sites, Ant, Ter – These grayed words reveal thepaths to their respective folders when the mouse cursor ispoised above them. The paths are displayed beneath therow of buttons at the bottom of the screen.
FSC Instruction Manual 64

row of buttons at the bottom of the screen. Clear button – Clears and loads default values into the Sitescreen. Delete Site button – Deletes a selected site from a currentJob or from the Sites folder if no Job has been selected. Save Site button – Saves the selected site to a Job folderor to the Site folder if no job has been selected. Calculate button – Computes the results after firstdeveloping any required terrain data. Cancel button – Quits the Site screen.
FSC Instruction Manual 65
Great Circle (Point-to-Point) Job ControlsThis category provides a point-to-point or link method thatusually is associated with dedicated communications between twofixed locations using fixed antennas. This category is namedGreat Circle because the terrain between two sites is generated byFSC on a true great circle path. (Frequently point-to-point terrain in other software uses a linearinterpolation of geographic coordinates, which is only accurateover relatively short distances. FSC enjoys no such distancelimitations.) The path loss calculator is the same as used for the Continuouscategory. Frequency limitations are 20 MHz to 20 GHz. Thus,this method is very versatile. It is also simple to use and achievesgood, practical accuracy for most calculations. This category features a single output form. A rectangular graphshows the terrain profile between the two selected sites. Includedon the graph are up to three user selected earth curvature linesand one FSC supplied earth curvature derived from the pathcalculations. Additionally, Fresnel zone terrain heights are shownbased on the first Fresnel zone multiplied by a user suppliedfactor (frequently 0.6). In this graph the terrain profile andFresnel zone are plotted minus the earth’s curvature. All otherdata and lines are drawn as curves that include the earth’scurvature. This form of display amplifies the effects of terrainblockages.
Great Circle Job Screen
Most of the functions for the Job screen have been relocated tothe Site page for convenience.
FSC Instruction Manual 66

On the left side of this screen are the usual site data shown inother categories. The right side consists of Job selection andcreation.
Select Antenna Pattern – Pull down menu selects anantenna from the antenna files in the current antennafolder. If no antenna is selected the default gain is 0 dBd.
Pattern Orientation – Antenna directional radiationpatterns are stored with their main lobes pointed north (N0° E). Azimuths increase from 0 to 360 degrees in a
FSC Instruction Manual 67

0° E). Azimuths increase from 0 to 360 degrees in aclockwise direction through East, South and West. Fixed Gains and Losses – This field should include allsystem gains and losses except path losses (calculated byFSC). Include the transmitting antenna gain unless anantenna has been selected in the pull down menu.Calibration and other adjustments may also be included.But, minimally, this number should include transmitterpower, filter and line losses at both ends, preamplifiergain and antenna gains (exclude the transmitter antennagain when employing an antenna pattern from the SelectAntenna Pattern drop down menu). FSC then computesthe received power including path losses.
The right side consists of Job selection, creation and name changefunctions.
Terrain Min Plot Elev – FSC normally plots all terrainvariations at the largest scale that fits in the graph. It alsoautomatically suppresses elevations below the lowestvalue of terrain along the path. This field permits the userto override FSC’s selection.
FSC Instruction Manual 68

Great Circle (Point-to-Point) Site ControlsThis category provides a point-to-point or link method thatusually is associated with dedicated communications between twofixed locations using fixed antennas. This category is namedGreat Circle because the terrain between two sites is generated byFSC on a true great circle path. (Frequently point-to-point terrain in other software uses a linearinterpolation of geographic coordinates, which is only accurateover relatively short distances. FSC enjoys no such distancelimitations.)The path loss calculator is the same as used for the Continuouscategory. Frequency limitations are 20 MHz to 20 GHz. Thus,this method is very versatile. It is also simple to use and achievesgood, practical accuracy for most calculations. This category features a single output form. A rectangular graphshows the terrain profile between the two selected sites. Includedon the graph are up to three user selected earth curvature linesand one FSC supplied earth curvature derived from the pathcalculations. Additionally, Fresnel zone terrain heights are shownbased on the first Fresnel zone multiplied by a user suppliedfactor (frequently 0.6). In this graph the terrain profile andFresnel zone are plotted minus the earth’s curvature. All otherdata and lines are drawn as curves that include the earth’scurvature. This form of display amplifies the effects of terrainblockages.
Great Circle Site Screen
Most of the controls are the same as on the Site screens of theother categories. However, this screen includes data for two sites– a FROM site and a TO site. Geographic coordinate, groundelevation and antenna height data are required for both sites. (If
FSC Instruction Manual 69

elevation and antenna height data are required for both sites. (Ifleft blank, the ground elevations for both sites will be filled-in byFSC. Data of greatest accuracy should be utilized.)
Site Name – If no site is selected, entering a name in thisfield and clicking the Save Site button will create a newsite file. This file will be placed in the current Sites folderif no job is selected, otherwise it will be placed in thecurrent job’s folder. If a site is currently selected, entering a name in this fieldand clicking the Save Site button will invoke a dialogallowing selection of a Change Name or Save Asfunction.
Comments – This field is for any notes or privatecomments associated with a selected site. None of thesecomments are printed or otherwise exposed outside of thesite file. Frequency (MHz) – The frequency that will be used in allcalculations associated with this site. Polarization – The main electric field vector orientationfor this site. The choices are v = vertical and h =horizontal. (In the case of circular polarization, create twojobs, one using h and one v polarization. This will at leastgive some idea of differences in propagation between thetwo polarizations.)
FSC Instruction Manual 70

The following are the data for the station at the beginning of thepath, the FROM site.
Site Latitude & Longitude – Geographic coordinates ofthe transmitting antenna. Entry may be in degrees,minutes, seconds or decimal degrees. Ground Elev. – Elevation above mean sea level of theground at the transmitting antenna using the chosen units.If left blank, when terrain is obtained for the site, thisfield will be filled-in automatically. If a more accurate
FSC Instruction Manual 71
field will be filled-in automatically. If a more accurateelevation is known, it should be used. Ant Hgt agl – Antenna radiation center height aboveground level. k1, k2 and k3 – Relative values of the Earth’s radius.When a value is entered, a line representing that (relative)radius is plotted on the graph. Weather and atmosphericconditions play a role in the diffraction of signals causingthem to more or less follow the earth’s curvature.Sometimes signals follow a sharp curvature andsometimes a broad curvature that may be represented as asphere. The ratios of these radii to the actual earth’s radiusare called k factors. Frequently, k values ranging between0.5 and 1.5 are used, depending on the nature of the pathand character of the region containing the path. FSCcomputes and displays an internal k value based on theClimate type and refractivity. The user can add threeadditional k-factors that will be plotted on the outputgraph. First Fresnel – A Fresnel zone is a locus of points aboutthe direct line between two site antennas where, if a signalreflection occurs, the reflected signal could causecancellation of the direct signal. The full set of pointslooks like a watermelon (ellipsoid of revolution) centeredon the direct line between antennas. There are manyFresnel zones, where the reflected signal is out of phaseby 0.5, 1.5, 2.5,… wavelengths, the most important beingthe first. For the waves to totally cancel they must beexactly out-of-phase and their amplitudes must be equal.As a result, many engineers accept path clearances that arewithin 0.6 of the first Fresnel zone. This relaxes somewhat
FSC Instruction Manual 72

within 0.6 of the first Fresnel zone. This relaxes somewhatthe amount of ground, water and vegetation clearancenecessary for a given path.
Entering a value in First Fresnel causes a light line to be drawnabove the terrain line on the output graph. The distance betweenthis line and the terrain line is the Fresnel distance. If the k-factorline computed by FSC crosses (intersects) the Fresnel line, thenthe path does not have “Fresnel clearance”. The following are the data for the station at the end of the path,the TO site.
Site Name Site Latitude & Longitude – Geographic coordinates ofthe receiving antenna. Entry may be in degrees, minutes,seconds or decimal degrees. Ground Elev. – Elevation above mean sea level of theground at the receiving antenna using the chosen units. Ifleft blank, when terrain is obtained for the site, this fieldwill be filled-in automatically. If a more accurateelevation is known, it should be utilized. Ant Hgt agl – Antenna radiation center height aboveground level.
Climate Type Selection – This pull down menu selects for thegeneral type of climate of the path. Select the one that applies. Soil type – The pull down menu selects for soil conductivity anddielectric constant with types ranging from poor to seawater. If indoubt select Average Ground. Conductivity and Dielectric values
FSC Instruction Manual 73

doubt select Average Ground. Conductivity and Dielectric valuesfor the selected soil type are automatically entered. Conductivity and Dielectric constant – These two fields permitdirect entry if the values are known. Averages over an entire pathshould be used. Average Surface Refractivity – Tables and graphs showingworldwide average values are available. If unknown, use thedefault value. Statistics are automatically included on the output graph as areliability factor ranging from 1 per cent to 99.9999 percent.Output values are given at the various reliability levels for bothpath loss and power including Gains, Losses and transmit antennagain, if any.
FSC Instruction Manual 74
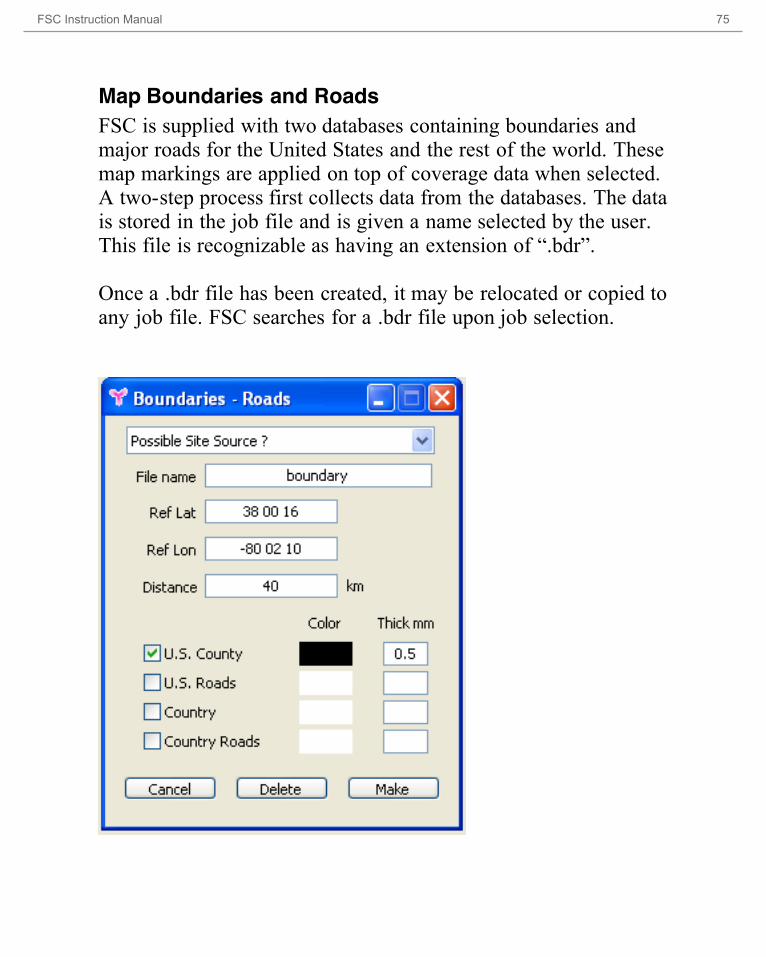
Map Boundaries and Roads
FSC is supplied with two databases containing boundaries andmajor roads for the United States and the rest of the world. Thesemap markings are applied on top of coverage data when selected.A two-step process first collects data from the databases. The datais stored in the job file and is given a name selected by the user.This file is recognizable as having an extension of “.bdr”. Once a .bdr file has been created, it may be relocated or copied toany job file. FSC searches for a .bdr file upon job selection.
FSC Instruction Manual 75

Opening the Boundary dialog from Tools>Boundary or Ctrl-B(Cmd-B) displays data from an existing .bdr file. If one does notexist, the top pull-down menu lists the sites attached to the job.The user may reference the boundary file to one of the listedsites, or, enter any Lat/Lon desired. To change any data, type new data and click Make. To delete afile simply click the Delete button.
FSC Instruction Manual 76

Calibration Aid
The Continuous category calculations can produce a very largenumber of data points. Consider a calculation that is computed atdistances of say, 1 to 20 km every 0.2 km for 360 radials. FSC’spath loss files would contain more than 32000 data points andwould have computed more than 32000 individual terrain profilesin the process. Sometimes users have some actual measurementsfrom a cell or station at known locations. FSC, like otherprediction tools, does a good job of obtaining field strength (pathloss) on a relative basis. For example, when FSC predicts the pathloss at two locations, the values obtained are typically accuraterelative to each other but, for environmental reasons, the absolutepath loss may be somewhat inaccurate and need adjustment. Aroutine is provided in FSC that helps the user select and viewstatistics of a series of path loss values for a selected radial anddistance span. From that information an adjustment factor may befound that can be added to Fixed Gains and Losses. In general,this works fairly well.
FSC Instruction Manual 77

The various controls have the following meanings andrequirements.
Include Antenna Gain – Check if the antenna gain is to beincluded in the statistical results. Include Fixed Gain and Losses – Check if this value is to beincluded in the statistical results. Azimuth – The radial azimuth of the desired path for thiscalculation.
FSC Instruction Manual 78

Start/Stop Distance – Include points between the start andstop distances.
For the selected points the mean, median, standard deviation andrms signal statistics are presented. If either of the upper twocheck boxes is selected, the statistics values will appropriatelyreflect those changes. Another less sophisticated, but equally valid technique foradjusting FSC’s calculated results, in areas where signal receptionexperience can be obtained, is to simply ask some users wherereception is inadequate. Then adjust the contour values or thelevels at which colors change or ‘Fixed Gains and Losses’, singlyor in combination, until coverage plots show losses of coverage atthose locations. This is a very successful technique even if not scientificallyrigorous. The results are very often quite accurate because FSC’srelative path loss calculations are accurate. Furthermore, userinterviews have the effect of including system equipment, actualarea clutter factors and usage patterns. This type of informationmay be of value, even if it pertains to different frequencies,because most gross coverage deficiencies are caused by grossfactors, such as terrain shielding, that affect signals over relativelywide frequency ranges. Note: This technique should never beapplied using just one or two locations. Employ a sufficientnumber of locations to be confident that adjustments arewarranted.
FSC Instruction Manual 79

Labels
There is capability in FSC to produce labels. It is relatively easyand fast. However, a graphics program, such as Adobe PhotoshopElements, will provide greater flexibility. Labels created in FSCare saved as internal FSC files in the Job folder with a filenameconsisting of the Job name with an “.lbl” extension. Job labelscreated in FSC are also displayed in the Job screens of theContinuous and Contour jobs. Great Circle jobs use their ownspecial output presentations. Label making and modifications are invoked from the Toolsmenu (Tools>Create Label) or using Ctrl-L (Cmd-L). A label isturned on/off from the Job screens by selecting Print in thecheckbox above the Print Label field. The location of the Label isdetermined by selecting the printout target corner from the dropdown menu under the Print Scale checkbox. To create a Label, open the Label dialog. Fill-in the desiredinformation and close the dialog. If a job has been selected thelabel will be placed in the job folder. If no job has been selectedthe label will be placed in the Jobs folder as a default label withthe filename “fs.lbl”. Default labels may be assigned to jobs byselecting a job and then opening the Label dialog, then clickingthe Get Default button. Make changes, if any, and when finishedclose the dialog. Default labels are typically created to holdinformation that does not frequently change. When creating image files, by selecting Make File from the menubar or using Ctrl-F (Cmd-F), the user will be asked if a label fileis desired. If so, FSC will request a filename. This separate Labelfile is an image file that may be used in a graphics program toplace a label anywhere.
FSC Instruction Manual 80

The above label is produced in the following label screen.
Each section (field) of the Label screen is independent. Blanksections add nothing to the label. Each section uses rich textformatting in which the text font may be colored and havedifferent font types and sizes. The individual sections arepositioned on the label in about the same order as appears on theLabel screen. Spacing within a section may be adjusted byinserting line feeds and spaces. Label controls and functions are: Font – Selected from the drop-down font menu. Size – Sets size of the highlighted text. Color – Sets color of the highlighted text.
B, I, U – Changes the state of highlighted text. B is bold, Iis italicize and U is underscore.
FSC Instruction Manual 81

Max Label Width – Sets the maximum width limit of thelabel. The label may be narrower, but never wider thanthis size. Text that is longer than this width is wrapped tothe next line. Titles/Notes – Contents of this section appear centered atthe top of the label.
FSC Instruction Manual 82
Init Button – Clicking places, in the Signal Descriptionssection, the values and colors from the table of contourlevels on the Continuous category Job screen. This buttonis disabled for the other categories, requiring that data behand entered. Signal Descriptions – This section is the label body thatcan have the above Init Button values and/or any othermanually entered text. Text in this section is centered onthe label below the Titles/Notes section. Company Name – This section is centered below theSignal Descriptions field. Date – Appears at the bottom left of the label, beneath theCompany Name section. Page – Appears at the bottom right of the label, beneaththe Company Name section. Get Default Button – If one exists, a default label is readinto this screen. OK Button – Saves the current label and exits the screen. Cancel Button – Closes screen without saving.
FSC Instruction Manual 83

Map Projection Control
There are four map projections available in FSC.
GeometricAlbers Equal Area ConicLambert Conformal ConicTransverse Mercator
These may be selected using the Tools>Set Map Parameters or bypressing Ctrl-M (Cmd-M) or by clicking the projection graphicon the Job screen. The screen has pull-down menus to select theprojection type, select a reference earth and set the hemisphere inwhich the map center is located. There are also data fields wherethe user may insert data instead of using the default data enteredby the pull-down menu selections.
Many common maps exist worldwide using the availableprojections. There should be local paper maps or electronic mapsavailable in one or more of these projections.
FSC Instruction Manual 84

available in one or more of these projections. The Reference Earth pull-down menu presents a choice of seven
reference earths used widely from the 19th century to the present.These include the latest satellite generated earth. This great rangeis necessary because there are many older maps still in circulationand, in some cases, still being published. Values are automatically loaded for the selected earth. Other earthmodels may be represented by manually entering their values. Most FSC operations require no values to be entered. OnlyReference Earth and Projection Type selections are required. FSCwill insert other values if none are provided. However, if specificmaps are to be used, the values from the maps may be entered.
FSC Instruction Manual 85

Page Size (and Map Center)
When Show Page Size is selected on a Job screen this dialogappears just before a print occurs. The user may cancel or acceptthe printing process. The scale, specified on the Main page, and the paper size,specified in the Page Setup dialog, and the project size to beprinted are used to determine if the project will fit on the page atthe given scale. If Show Page Size is checked and the project willnot fit on the page the warning message is presented. If the user selects Print, the project image will be reduced andprinted at a scale that will fit on the paper. When this occurs, thescale designation (eg Scale 1:250000) will not appear on the scaleof miles/kilometers. Only when the image fits on the paper at thecorrect scale will the scale designation appear. This feature may be used to determine the scale at which theproject can be printed on the specified paper size by specifyingdifferent scales and submitting the project for printing, repeatinguntil a scale that fits is found. None of this is necessary when creating files as they are alwaysmade as large as required. The page size required to contain the entire full-sized print at thespecified scale is presented using appropriate units. Many printerdrivers permit image reductions to fit a selected paper size.However, if it is important that the image scale be true on theprinted page, then the scale (or paper size) must be adjusted untilthe image fits on the page.
FSC Instruction Manual 86

FSC also computes the approximate geographic coordinates of themap center that includes coverage areas associated with all sitesto be printed. Once sites have been selected and calculated andprior to creating the base map, the map center may be found byPrinting from the menu or Ctrl-P (Cmd-P), receiving the Sheetsize and center data and then canceling the Print.
FSC Instruction Manual 87

Isotropic/Dipole Considerations
FSC may use either an Isotropic or Dipole reference system.There is a checkbox on the main screen that shows the currentreference being used. This reference should be set for each newjob and may be changed at any time by clicking the checkbox. A dipole antenna has a gain of 1.64 ( 2.15 dB) with respect to anisotropic radiator’s gain of 1 (0 dB). All antenna patterns imported into FSC, with file extensions of“.opa”, have gains that are referenced to a dipole (dBd). However, it is important to understand that when using FSC inthe isotropic mode (DBI checked), antennas with gains expressedas referenced to a dipole require that a factor of 2.15 dB be addedfor each (dBd) antenna. For example, with dBd gain antennas atboth the transmitter and receiver, a 4.3 dB factor is added to theFixed Gains and Losses* field. Antennas with gains expressed indBi require no changes. In the dipole mode (DBI unchecked), using antennas with gainsexpressed in dBi, the Fixed Gains and Losses* field must bereduced by 2.15 dB for each (dBi) antenna. This includes antennapatterns selected from FSC antennas folder. Thus, when bothantennas are isotropic referenced, a factor of 4.3 must besubtracted from the Fixed Gain and Losses* field. If the DBI checkbox is changed in an existing Job, FSC issues areminder to adjust the Fixed Gains and Losses* field.
FSC Instruction Manual 88

* Adjust the Ant Input Power field (Site screen) for the Contour Job category.
FSC Instruction Manual 89

dBu Calculations
dBu calculations require some special mention. Continuous andContour categories permit (or require) specifying signal levels asfield voltages. The usual form is dBu, which is defined as thenumber of dB above one microvolt per meter. FSC utilizes thesame calculations for dBu as for the Power category. The relation between power received and the inducing electricfield is
Pr = (|E|2/Z0) Ae (Watts)
Where Pr = received power, W, |E| = electric field intensity
magnitude, V/m, and Z0 = 377 Ohms, the intrinsic impedance of
free space. The effective antenna aperture, Ae, is
Ae = G!2 / 4" (m2)
where G = receiving antenna gain and ! = wavelength. FSCassumes for this conversion an isotropic radiator with G = 1. Coverage areas are frequently defined using electric fieldintensity as, for example, the area within the 74 dBu contour.With FSC it is only necessary to enter 74 dBu and the coverage isautomatically computed.
FSC Instruction Manual 90
Antenna Input Power – Contour
This parameter appears in the Contour category on the Sitescreen. It is similar to the Fixed Gains and Losses factor in theContinuous and Great Circle categories. All of the Contour category methods (except manual distanceentry) in FSC employ the concept of antenna input power as areference. This power value should also include all gains andlosses at the receiver and transmitter as well as any other desiredadjustments such as clutter and dBd/dBi conversions. (SeeIsotropic/Dipole Considerations.) If an FSC directional transmitting antenna is to be used do notinclude a gain for that antenna. Omnidirectional transmitting antenna gain may be included whenusing omni antennas rather than selecting an omni antenna fromthe Ant folder.
FSC Instruction Manual 91

Attach an Existing Universal Site To a Job
With a Job selected, click in the check box to the left of thedesired Site’s name. This will copy the site file from the Sitesfolder into the current Job file. Any number of sites may beselected. Site may be reviewed by clicking the Site’s name outside of thecheckbox. This displays some site information on the left side ofthe Job screen. For more site information, click the Site button atthe bottom of the screen. Once a site is attached to a job, all further site actions areassociated with the job’s copy of the site file from the Sitesfolder.
FSC Instruction Manual 92
Copy Job
Select a Job.
From the Tools menu select Copy Job
When the Select dialog appears, select the destination folder andenter a new name for the copied job if the destination location isthe same as the source location.
FSC Instruction Manual 93
Copy Site
Select a Site.
From the Tools menu select Copy Site
When the Select dialog appears, select the destination folder andenter a new name for the copied site if the destination location isthe same as the source location.
FSC Instruction Manual 94

Create a New Job
Clear the Job screen by clicking the Clear button at the bottomleft of the screen. This will clear all fields and load into fields allpreviously defined default values, if any. Select the Job category by clicking the desired radio button in theupper right corner of the Job screen. Enter a name and frequency.Click the Save button at bottom of screen. In the Select Job dropdown menu, select the new Job by name. This prepares a job forall subsequent operations.
FSC Instruction Manual 95

Create a New Site For a Job
To create a site, select a Job by name from the Job drop downmenu. Click the Site button. Enter a name in the ‘Site Name:’field, fill in desired information and click the ‘Save Site’ button. New sites created using the Site screen while a Job is selectedwill be placed only in that Job’s folder, the folder that begins withthe prefix ‘fsj_’ followed by the job name. They will not beaccessible to other jobs unless manually copied and pasted intoanother job or by using the Site Copy function in the Tools menu.
FSC Instruction Manual 96
Create a New Universal Site
This is a site that is placed in the user selected Sites folder and isavailable to all jobs. The location of the Sites folder may befound by placing the mouse cursor over the dimmed word ‘Sites’just above the Site button. Sites in this folder maintain most ofthe information about a site. However, they may not have anyassociated terrain or path loss data as those items are specific toeach Job. The purpose of a universal site is to reduce the need toenter site data over and over again. Site files have two configurations, one for Great Circle and onefor the remaining categories. Deselect any current job byselecting ‘Select Job’ in the Job drop down menu. If the universalsite is to be used for Great Circle calculations click the GreatCircle button in the Job screen. Go to the Site screen by clickingthe Site button. Click the Clear button to clear fields and load Sitedefault values. Fill in as many fields as desired. Enter the Sitename and click the ‘Save Site’ button. This site will be placed in the Sites folder. All sites in that folderappear in the Sites list on the Job screen.
FSC Instruction Manual 97

Create Boundaries and Roads
Applies to Continuous and Contour Category jobs. Select a Job. Select Tools > Boundaries/Roads from the menu orpress Ctrl-B (Cmd-B) on the keyboard. On the dialog enter a file name and. in the checkboxes, select thedesired county and road data categories. Set the color and line thickness for each desired road andboundary category. (Color is selected by clicking on the colorspace adjacent to a category.) The data for Ref Lat, Ref Lon and Distance should be referencedto some known location because, when creating files for overlay,the Boundary file is separate from the coverage, scale and labelfiles. Using a known reference makes it easier to aligncomponents. To aid in the alignment process, there is a drop-down menulisting all sites attached to the job. This will provide aroad/boundary mark at one of the sites, which makes it obviouswhen aligning coverage and boundary files. Jobs with numerous sites often are built using a central referencepoint at a known latitude/longitude. This location may be used forthe Ref Lat/Ref Lon values. Click the Make button when ready. This creates a database file(with a .bdr extension) in the Job folder that has all the rawboundary/road data for the Job. When a display, print or filecreation is called for, FSC uses the raw data file to produce the
FSC Instruction Manual 98

creation is called for, FSC uses the raw data file to produce thefinal boundary/road picture. The .bdr file may be deleted from a selected job by selectingBoundary/Roads and clicking the Delete button.
FSC Instruction Manual 99

Create Terrain for Jobs and Sites
Applies only to Continuous Category jobs. Other job categoriesproduce their own terrain automatically. Create Terrain For a Site – Select a Job. Go to the site screen andselect a Site. Be certain the Site’s geographic coordinates andcalculation limits are specified. Click the ‘Make Terrain’ button atthe bottom of the screen. Create Terrain For a Job – Select a job by name from the Jobdrop down menu. Go to the Site screen by clicking the Sitebutton. Fill in the fields in the JOB TERRAIN area of the screen.Click the ‘Make Job Terrain’ button.
FSC Instruction Manual 100

Defaults Setup Users may set, or not, default values for most parameters andcontrols. Once set, the default values are loaded into theirrespective controls automatically on opening the program or onclearing a screen. This applies to both Jobs and Sites. It alsoapplies to most calculations, contour, environmental, printing andstatistical values. To set Job defaults:
Start FSC in the usual manner. A splash screen will appearfollowed by the Job screen. Without selecting a Job, fill in all desired values on theJob screen including colors. A calculation category mayalso be selected. When finished, select the menu Tools>Set JobPreferences.
To set Site defaults:
Start FSC. Without selecting a Job, click the Site button. Fill in all desired values on the Site screen includingcolors. By selecting the various calculation categories (onthe Job screen) and filling in the Site parameters, virtuallyall Site controls may be given default values. When finished, select the menu Tools>Set SitePreferences.
FSC Instruction Manual 101

Delete a Site From a Job
Select a job and transfer to the Site screen by clicking the Sitebutton. Select the site in the Current Site drop down menu. Clickthe Delete Site button.
FSC Instruction Manual 102

Delete a Universal Site
Deselect any active job by selecting ‘Select Job’ on the Job dropdown menu on the Job screen. Transfer to the Site screen byclicking the Site button. Select the universal site in the CurrentSite drop down menu. Click the Delete Site button.
FSC Instruction Manual 103

Detach an Attached Site From a Job
A site that has been attached to a job has a folder in that job. Todetach the site simply uncheck its checkbox. The site folderremains in the job folder and may be reattached by checking thecheckbox. The site may be reattached by selecting its checkbox.
FSC Instruction Manual 104
Display Results On Screen Users may visualize calculation results on the screen. All jobcategories can provide a display on the Job screen of userselected components such as coverage, label, etc. The Great Circle category provides a rectangular graph showinga terrain profile with the various Fresnel and k-factor linesdrawn. Contour and Continuous jobs will display all site coverage and ifselected, label, scale and boundary/road data. Select a Job. Click the Display button on the bottom-right of theJob screen. NOTES:
The display accounts for map offsets and scale. FSC will attemptto place the largest version of the results as will fit on the displayscreen, meaning it will automatically scale the picture. If the user does not enter reference coordinates in the MapProjection Control (Ctrl-M, Cmd-M), FSC automatically createsa reference Latitude & Longitude for every Job. FSC normallysupplies most data it needs that is not entered by the user. Occasionally, during the process of selecting or changing sites orthe job reference coordinates, the reference Lat/Lon in the MapProjection Dialog remains as it was initially entered or created byFSC. When a display is requested and conditions have changed,
FSC Instruction Manual 105

FSC. When a display is requested and conditions have changed,the picture may be incorrect. If things do look incorrect, it issuggested that the Map Reference Lat/Lon fields of the MapProjection dialog be cleared. FSC will then reset the referencevalues based on the existing job data and the display will becorrect.
FSC Instruction Manual 106
Fixed Gains and Losses
The Continuous and Great Circle categories require that thisparameter be given a value. It is the place where system power,gains and losses are accounted for. FSC calculates path loss forthese two categories. Path loss is dependent on climate, soils,signal refractivity, frequency, antenna heights, terrain and a factorgenerally known as clutter. The behavior of signals versus thesefactors has been extensively measured and studied and forms thebasis of path loss. From an examination of path loss, amplifierand antenna gains, transmitter output power, filter and line lossesand receiver sensitivities, one determines the median expectedpower available at a receiver. With that median and with FSC’sknowledge of the statistics of signal variations, estimates ofpower at the receiver are determined. The general technique is toadd to the transmitter power all gains (G) and subtract all losses(L). FSC then subtracts path loss to yield power available at thereceiver terminals. Over an extended time interval, the difference between the FSCcalculated and actual received power can be lumped into a clutterfactor. Clutter arises from local disturbances due to such factorsas shrubs, trees, buildings, and from inaccuracies in the path lossmodel. Clutter may change with location and season. Fortunately,clutter is easily accounted for because values tend to be relativelyconstant for a given system environment.
FSC Instruction Manual 107
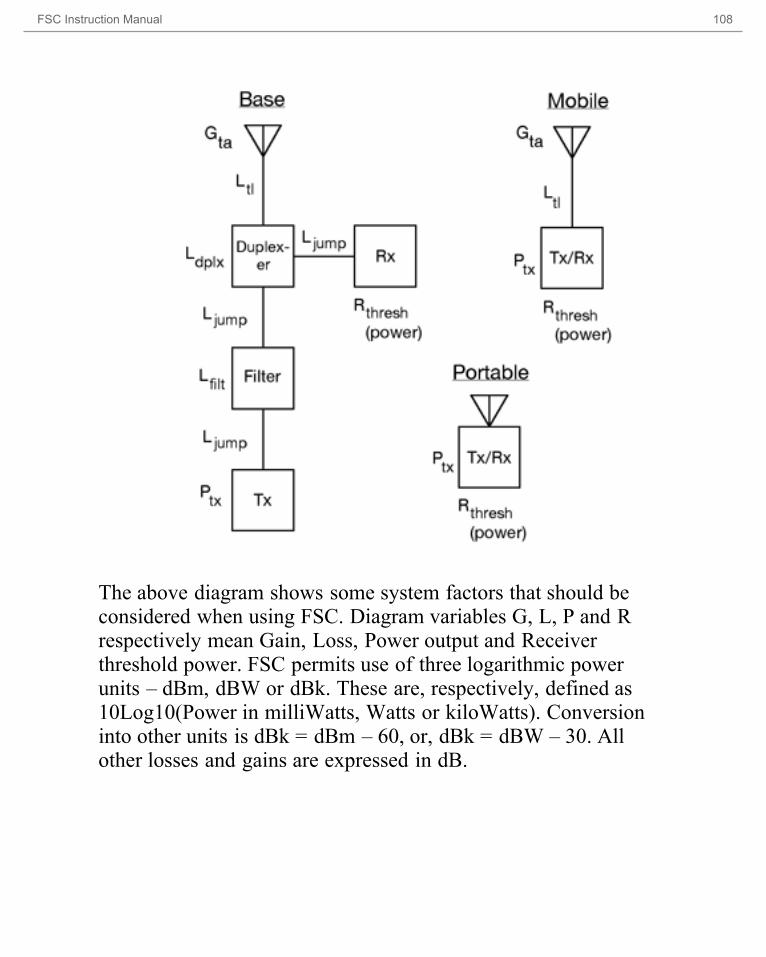
The above diagram shows some system factors that should beconsidered when using FSC. Diagram variables G, L, P and Rrespectively mean Gain, Loss, Power output and Receiverthreshold power. FSC permits use of three logarithmic powerunits – dBm, dBW or dBk. These are, respectively, defined as10Log10(Power in milliWatts, Watts or kiloWatts). Conversioninto other units is dBk = dBm – 60, or, dBk = dBW – 30. Allother losses and gains are expressed in dB.
FSC Instruction Manual 108
Import Antennas
A number of different antenna file formats may be imported into FSC.Importing is the process of reading an antenna pattern file in some formatand converting as much information and data as possible from that file.The information is then stored as an FSC antenna. Currently, FSC willimport files formatted as CelPlan, Planet and TIA-804-B. Imported filesare stored using the Obspat format with file extensions of “.opa”. Obspatfiles store pattern gain data referenced to a dipole. The Antenna Folder location must be defined before proceeding. (Tools> Select Antenna Folder.) Select from the menu: Tools> Import Antenna. A dialog will appearrequesting, via a drop down menu, the specific format and a name for theantenna. A dialog will appear requesting identification of the file to beimported. Once identified, the process occurs automatically with theantenna appearing alphabetically in Antenna drop down menus.
FSC Instruction Manual 109
Modify a Universal Site
Deselect any existing job by selecting ‘Select Job’ from the dropdown Job menu. If the site is to be used for Great Circle calculations, first selectthe category button for Great Circle on the Job screen. Click the Site button to go to the Site screen. Select the desiredSite by name from the ‘Current Site’ drop down menu. Makechanges and click the Save Site button.
FSC Instruction Manual 110

Printing
All Categories have a printable product accessible from File >Print Coverage or Ctrl-P/Cmd-P. All categories also have a limited usefulness worksheet Jobprintout accessible from File > Print Job Data or Ctrl-D/Cmd-D. Printer Setup data is stored by FSC and does not requirereinitializing unless the default printer is changed. Use the menuFile > Print Setup to set and store this information. Great Circle printing: There are no content options. The Print Coverage menu optionprints a fixed format terrain and data graph that includes user-entered data and FSC calculated data. These functions provide allthe information necessary to describe and evaluate a point-to-point radio path. Continuous and Contour Categories: Print Coverage for theses categories is influenced by thefollowing user selections:
Four map projections, Geometric, Lambert, Albers,Transverse MercatorCoverage size, scale and resolutionCoverage information colorsContour dash patternsContour color fillsBoundaries
FSC Instruction Manual 111

RoadsLabel composed in FSCCross centered in output imageCrosses at each site locationLabels at each site locationA scale of km and mi
FSC Instruction Manual 112

Save Coverage To Files
All Categories have a file product accessible from menu File >Save Coverage to File (Ctrl-F/Cmd-F). The file format is .bmp inWindows and .pict in Macintosh. Great Circle Category: There are no content options. The Save Coverage to File menuoption creates an image file of a fixed format terrain and datagraph that includes user-entered data and FSC calculated data.These functions provide all the information necessary to describeand evaluate a point-to-point radio path. Continuous and Contour Categories: Files for theses categories are influenced by the following userselections:
Four map projections, Geometric, Lambert, Albers,Transverse MercatorCoverage size, scale and resolutionCoverage information colorsContour dash patternsContour color fillsBoundariesRoadsLabel composed in FSCCross centered in output imageCrosses at each site locationLabels at each site locationA scale of km and mi
FSC Instruction Manual 113

It is assumed that those desiring files for these categories will usethem in a graphics program. Therefore, FSC makes individualfiles for each layer. Based on the options set in the Job screen, thefiles created are: Coverage, Scale, Label and Boundary. When this menu option is invoked, the user is given the option toaccept each file prior to its creation.
FSC Instruction Manual 114

Scale of km/miles
FSC includes a Scale of km/miles that is automatically includedon printouts, if requested. Its size is based on the Print Scale valuein the Job screen.
This process is turned on/off from a Job screen by checking PrintScale. The location of the Scale on printouts is determined byselecting the target corner of the printout with the pull downmenu beneath the Print Scale checkbox. When the Make File option is selected the user will be asked if aScale is desired. If so, a filename must be given. The scale iscreated as a separate file and stored as an image file in the Jobfolder.
FSC Instruction Manual 115

Select an Existing Job
From the drop down Job menu select the desired Job by name.
FSC Instruction Manual 116
FSC Contour Methods – Background
FSC presently includes a collection of ten methods and data setsfor computing and representing signal levels with contours. Hereis some general information about them. FSC can be extended toprovide additional methods should demand warrant. Contour category calculations are traditionally based on curves,initially constructed from measured data that were normalizedinto a family of specific values. For example, they are frequentlybased on internationally accepted sets of curves that describe fieldstrength values versus distance for a given transmitting antennaradiating a reference power. The measured data was analyzed toproduce the family of curves for several different transmittingantenna heights. A receive antenna height is usually fixed becausethe field measurements were made using a consistent receiverantenna height. Contour methods may be found in CCIR documents as well as innational standards of a number of countries, such as the U.S. FCCRules and Regulations. A number of international standardscurrently utilize similar curves, such as Recommendation ITU-RP.1546-3. Curves of this nature allow for easy and rapiddeterminations of field intensity at a specified distance andtransmitting antenna height. They typically may be adjusted for arange of transmitting powers. Since the 1980’s interest in “computerizing” these curves andextending frequency ranges have driven the process to alsoexpand the number of propagation factors considered. The Cost-Hata method is an example derived from a relatively complexmobile analysis by Okumura and subsequently modified bynumerous workers using additional measurements. Okumura’s
FSC Instruction Manual 117

numerous workers using additional measurements. Okumura’sresults were depicted in a set of a dozen or so families of curves.The European Cost 231 project reduced the complex andsometimes ambiguous Okumura processes to a few unambiguousequations readily solved by computer. The results are reasonablyaccurate when applied within specified limitations. Carey and TV/FM methods utilize fixed receiver heights assumedin their results. The Carey method was created from CCIR dataand adjusted to describe conditions for mobile radio systems. TheTV/FM data, gathered in the 1950’s, uses receiver antennaheights of 30 feet (9.1 m). The Carey curves were created for amobile antenna height of 6 feet (1.8 m). FSC uses these data asthey have been historically applied without modification. The Mobile(TV) method uses a replica of the TV/FM data excepta logarithmic factor derived by the FCC is included to adjust thedata for variable receive antenna heights. Because of a long history and actual field experience using thesemethods, they are still in wide use as allocation tools and are fastand easy to apply in FSC. The Cost-Hata method computes path loss based on frequencyand antenna heights above ground. In this respect it is similar tothe Power and dBu methods in that the system power may bevaried at will.
FSC Instruction Manual 118

Contour Category Types
Contours are widely used to express coverage and interferenceconditions. A contour is usually a representation of where thesignals from one or more sites diminish to certain values. Thesevalues are field intensities or power flux densities, dBu or dBm,dBW, dBk, respectively. Often they are generated frommeasurement-based tables, sets of curves or empirical formulaefitted to data. FSC has several different options available that will be discussedin this section. Additionally, a manual contour option is availableto draw circles or contours from tabular data by typing azimuthand distance number pairs. FSC calculates and stores contourdata each degree. Start and Stop azimuths simply specify howmuch of a contour is plotted. In the present implementation are calculations based on severalcommonly used methods. A few rely on the terrain database. Forconvenience where data permits, the base data are separated into90%, 50% and 10% calculations. These subdivisions may beused in several ways. Most frequently they are specified bygovernment allocation requirements. For example, servicecoverage may be defined as a certain signal level with 90%reliability, or, for interference as a specific signal level with 10%reliability. In this example the percentage value may beinterpreted as “90 (or 10) percent of the time the signal will equalthe specified level”. Characteristics of contour methods available in FSC are listedhere.
FSC Instruction Manual 119

Manual Entry –User enters one or more azimuth/distance pairs. Asingle azimuth/distance pair produces a circularcontour.
Carey –
From FCC Report R-6406 by Roger B. Carey, threesets of curve data are based on CCIR VHF and UHFland mobile curves adjusted for 90% reliability. Thesecurves assume a terrain roughness factor of 50 m andtime availabilities of 10%, 50% and 90%. The FCCused CCIR curves adjusted downward by 9 dB toaccount for a receiving antenna height of 1.8 m insteadof the original measurements height of 10 m. This method requires antenna power input and basestation antenna height. The default antenna gain is 0dBd if a directional antenna is not specified. Averageterrain between 3 and 16 km is automaticallyemployed by FSC in computing distances to anycontour. Frequency range is approximately 35-1000MHz.
TV/FM –
From FCC Report R-6602 and later Reports, thismethod using derived curves is the basis for broadcastservices in the U.S. (FCC Rules 73.699), includingFM and Television, both analog and digital. Curvesare used by FSC over a frequency range from 50 to1000 MHz in three 50% location, 90% reliability setsof time availabilities of 10%, 50% and 90%. Receiveantenna height is assumed to be 10 m.
FSC Instruction Manual 120

This method requires antenna power input andtransmitting station antenna height. The defaultantenna gain is 0 dBd if a directional antenna is notspecified. Average terrain between 3 and 16 km foreach radial is automatically employed by FSC incomputing distances to any contour.
Mobile(TV/FM) –This data set uses the same curves as describe abovefor TV/FM. In this method terrain is based on 3-16 kmaverages for each radial. A height-gain factor isemployed to adjust for a receiving antenna heighthigher or lower than 10 m. Frequency range is 50 to1000 MHz. This method requires base station antenna height andantenna power input and mobile antenna height.. Thedefault transmitting and receiving antenna gains are 0dBd. If a directional transmitting antenna is used, donot include its gain in Fixed Gains and Losses.
COST-Hata –
This method is based on the European COST 231project for macro cells. FSC implements the Cost-Hata prediction model, which utilizes frequency, baseand mobile antenna heights and distance. This method requires base station antenna height andantenna power input. The default antenna gain is 0dBd if a directional antenna is not specified.
Frequency is restricted to 100 to 2000 MHz. Basestation antenna heights must range between 30 and200 m. Mobile antenna heights are restricted to range
FSC Instruction Manual 121

200 m. Mobile antenna heights are restricted to rangebetween 1 and 10 m. Distances are valid between 1and 20 km.
Other –Other contour methods can be incorporated uponrequest.
FSC Instruction Manual 122
Graphics Output
There are two varieties of FSC graphical output, a printed graphwith data for Great Circle point-to-point problems and, for theremaining categories, a series of images consisting of coverageplots, scales and labels. The point-to-point results are presentedon a graph that has a fixed format and is only variable withrespect to data and user options. The images produced in FSC can vary because the user composesmuch of the data to be displayed, the exception being scales thatare generated by FSC using the Print Scale and Resolution (dotdensity-dpi) variables. Images are stored as individual fileshaving ‘.bmp or .png’ extensions, with names specified by theuser. The sizes of image files depend on area and dot density. FSC displays its data results using a one of four user selectablemap projections. The Geometric projection is simply a linear(Cartesian) plot. The other three provide transformations found ina great variety of common maps, Transverse Mercator, LambertConformal Conic and Albers Equal Area Conic. The projectionsare applied to printed, screen and filed images. FSC providesprojections using true elliptical earth mathematics.
FSC Instruction Manual 123

Map Considerations
In most cases FSC coverage results are utilized with some formof map. Aside from an obvious technique of scanning a papermap, there are a variety of methods for obtaining digital mapdata, one of which will be described in detail in a later Section.Any common map images, of any size, may be used with FSCwithin the caveats described below. It is assumed that maps usedwith FSC are accurately scaled and have known latitude andlongitude references and projection details. FSC uses Print Scaleand Resolution (dot density-dpi) to size its graphical imageoutput. Site locations rely on geographic coordinates forpositioning. If there is no digital map available for your desired area, papermaps may be scanned to provide a digital format. Large mapsmay be scanned in sections and reassembled in graphicssoftware. This may sometimes require a determination of the mapscale if not given with the map. Read the discussion in the‘Operations Issues Common to all Categories’ section concerningmap scale. (Measure the map distance (cm) between two pointsfor which the actual distance in km is known. Convert the actualdistance in km to cm. The map scale is 1:’actual distance in cm’.) Maps are produced in a large variety of sizes, scales andprojections. A projection is a process of transforming featuresfrom the 3-dimensional Earth to a 2-dimensional sheet of paperor computer image. It is not possible in the transformationprocess to simultaneously attain accurate 2-dimensional physicalcharacteristics of area, distance, direction and shape. Variouscartographers and mathematicians have created differentprojections that optimize some of these characteristics whilepermitting others to become distorted. For example, some mapprojections maintain accurate shape, which implies accurate
FSC Instruction Manual 124

projections maintain accurate shape, which implies accuratedistances. Others provide accurate directions but have inaccurateshape or area.
FSC Instruction Manual 125
Map Scanning Issues
Suppose a map must be scanned from a paper source that has aknown scale. Suppose also that only a portion of the map will beused. If the map’s projection data is available, that data may beentered in the Set Map Projection screen, particularly with respectto the Standard Parallel(s), reference latitude and centrallongitude (central meridian). Depending primarily on distancefrom the central latitude and longitude and specific projection towhich the map was drawn, the position, shape and rotation offigures will differ with position. Because the FSC output must be fitted to an existing map, a mapsection to be used with FSC should be scanned using the mapborder as a reference direction for North. Do not rotate the mapsection to produce a “local” north reference and simultaneouslyspecify the original map’s central latitude and longitude as theFSC reference. For example, the central meridian of a Lambertprojection map is usually vertical. With this projection, all otherlines of longitude are displaced horizontally, converging at apole. Thus, the “tilt” of a north line increases (or decreases) withlongitude from the central meridian (longitude). FSC will producecorrectly “distorted” (projected) images that will fit a correctlyscanned map. With the Lambert case it actually is acceptable to establish a localNorth by rotation. But, this is not generally true. In any case, FSCprovides projections using true elliptical earth mathematics.
FSC Instruction Manual 126

Preference File FSC maintains on each computer, for each user, a file namedFieldStrengthPreferences. In that file are all of the user selectableoptions including data units and user entered titles to be printedon data sheets and coverage plots. Preferences are automaticallysaved when FSC quits. All information is saved in thepreferences file and will not be requested again unless thepreferences file has been replaced or corrupted. Because the possible names and locations of FSC data files arelimitless, there may be occasions when the user or applicationbecomes confused. If this occurs, locate theFieldStrengthPreferences file and move it to the recycle bin/trash.This will force FSC to start from scratch including re-enteringtitle information and identifying the various data folders.
FSC Instruction Manual 127

Expanding FSC Terrain Coverage
Any files that meet the specifications in the following sectionswill function in FSC simply by adding the files to the (userselected) Terrain Folder. Terrain data employing other formatsmay be used directly with FSC after being reformatted and giventhe proper filenames. The only formatting restrictions are the file structure consisting of1201 rows each with 1201 points (columns) and the two-bytesigned integer and use of the proper byte order (Endian).
FSC Instruction Manual 128

SRTM Data
Using radar techniques aboard a spacecraft, the data was collectedover most of the populated area of the Earth. The coverage is notcomplete, however, being available only between latitudes from50 South to 60 North. A number of individuals andadministrations are working to enhance the coverage. FSC alsoincludes some terrain enhancements in Alaska and areas inNorway and Sweden. Canada above latitude 60 degrees has beencompleted using 3-second government data. SRTM data as used in FSC are sampled at three arc-secondintervals in latitude and longitude. Data are divided into onesquare degree latitude and longitude tiles arranged in a rasterpresentation with equal intervals of latitude and longitude. This"geographic" projection data is devoid of any map projection andeach tile edge matches adjacent tile edges.Each tile is a file having names that refer to the latitude andlongitude of the lower left corner of the tile - e.g. N37W105 hasits lower left corner at 37 degrees north latitude and 105 degreeswest longitude. To be more precise, these coordinates refer to thegeometric center of the lower left pixel, which is about 90 metersin extent. SRTM data are placed into “height” files that have the extension.HGT and are signed, two byte integers. The bytes are inMotorola "big-endian" order with the most significant byte first,directly readable by systems such as Sun SPARC, SiliconGraphics and Macintosh. DEC Alpha and most PCs use Intel("little-endian") order. FSC performs any necessary byteswapping. Terrain heights are in meters referenced to the WGS84/EGM96geoid. Data voids are assigned the value -32768. SRTM files
FSC Instruction Manual 129

geoid. Data voids are assigned the value -32768. SRTM filescontain 1201 rows of 1201 columns. The rows at the north andsouth edges as well as the columns at the east and west edges ofeach cell overlap and are identical to the edge rows and columnsin the adjacent cell. Data are arranged in row major order in each 1 x 1 degree file.The first data point in a file is the northwest corner. Data thenproceeds eastward across the northern row, which is 1201 pointsin length. The next point (1202) is the westernmost point of thenext southern row (2), and so on, for 1201 rows.
FSC Instruction Manual 130

SRTM Errors
The SRTM data has missing data in some of the 1 x 1 degreefiles. These are artifacts of the radar technique employed, such asnot having correct scanning angles to see into deep canyons, etc.There are also some errors due to reflections that cause bumps tooccur at random locations. Limited usage of the data indicates these errors do not appear togreatly affect the results of FSC calculations, although exceptionsmay exist. To minimize problems FSC fills voids with the nearestnon-void elevations. It performs filling during terrain runs anddoes not require that an .hgt file be modified. Therefore, filesadded in the future will also be similarly filled.
FSC Instruction Manual 131

Terrain for Jobs and Sites
Continuous category jobs provide user access to terrain functionsprimarily because of the potential for large terrain file sizes.(Depending on the number of sites, there may be some saving ofdisk space and operator effort by using an all encompassing JobTerrain file instead of individual site terrain files.) It is recommended that the option ‘Save Terrain With Site’ beselected by clicking that check box. If this option is not checked,each time the program performs a calculation the terrain will needto be recreated, a process that can take some time depending onthe size of the area and how frequently calculations are requested. Contour and Great Circle category jobs do not have large terrainstorage requirements. Therefore, these categories do not requireuser access to terrain processes because FSC automaticallycomputes terrain each time calculations are commanded. Terrain may be associated either with a Job or Site. Only one JobTerrain file may be present in a Job folder, which always has thename ‘JobTerrain.fst’. There may be many site terrain files, eachin a site folder having a site name and an .fst extension. FSC willtry first to find Site terrain and then Job terrain. So, both files mayexist in a Job. This is handy, for example, if a site is to be addedafter a Job Terrain file has been established.
FSC Instruction Manual 132
Terrain Usage In FSC
Each SRTM terrain tile is stored as a single FSC file. All terrain data is taken from the user specified Terrain Folder.Thus, terrain may be stored in many folders, perhaps segregatedby region. The currently selected terrain folder path may bedetermined by placing the mouse cursor over the dimmed word‘Ter’ on either Job or Site screen. Note that any missing terrain files are treated as if the entire 1 x 1degree files are at sea level. Because FSC does not know whichfiles should contain land, this substitution will occur withoutwarning. Usually when this occurs the effects are evident on theoutput graphics.
FSC Instruction Manual 133

Using DeLorme’s XMap
This section describes the operations of using a map creation program incommon use in the United States. Similar processes would be utilizedwith other map generation software. XMap 4.5 by DeLorme is a mapping program that provides many morecapabilities than are required for creating base maps for FSC. However, itis easy to use and relatively inexpensive. XMap is written for a Windowssystem and does not function on a Mac operating system. However, itworks well using Windows on Mac hardware. XMap uses CD’s and DVD’s for its map data. If there is no DeLormemap coverage for the desired area, any digital map source may be used.Paper maps may be scanned to provide a digital format. Large maps maybe scanned in sections and reassembled in the graphics software. See thesection entitled ‘Map Considerations’. XMap produces an image file with a ‘.bmp’ extension that can be usedwith a graphics program to compose finished maps. XMap has anoverlay feature that might be exploited to overlay FSC coverage, scaleand label images. However, this latter feature was not investigatedbecause of previous familiarity with an inexpensive, excellent graphicsprogram, Adobe Photoshop Elements. The following is a relatively detailed example of one way that XMapmay be used to produce a base map, including some explanations of thereasons behind certain selections and actions. Decide on the point density. A value of 150 dpi (dots per inch) isrecommended because it gives a good balance of image quality and filesize.
FSC Instruction Manual 134

Getting Started
Assuming the program has been installed and a data disccontaining the desired area is in an optical drive, start theprogram from the Start menu. If there are two windows on the screen, click the split screenbutton, a button that looks like a monitor icon, located just abovethe scale near the lower right of the screen. This yields the largestamount of map viewing space. Select the Map Data tab. Check all of the map features andattributes desired for the map. Select the Print tab. On the left side of the Print tab is a columnof buttons. Select the Map button. Select the ‘Map Display’ tab. Select the ‘Units’ button on the left.Then select the Coordinates and Measures appropriate to yoursystem. It is recommended that a crosshair be placed at the screen centerby selecting the ‘Map Display’ tab, selecting the ‘Features’ buttonon the left and clicking the ‘Map Center Crosshair’ option. Thiscrosshair is not included in any print or file output. The map display should now show some portion of the disc map.
FSC Instruction Manual 135

Sizing A Map
This process takes some back and forth motions and depends onwhether a specific area is required or if a general area issatisfactory. Also, since often a map will be designed for paperprinting, the paper size must be reckoned with. The process iseasy, but sometimes can be confusing. If there is a specific area to be shown, start by zooming andmoving the map until it is centered and the entire area fits withinthe visible screen area. If the East – West dimension is larger thanthe North – South dimension a landscape orientation is called for,otherwise use a portrait orientation. Note the ‘Data Zoom’ value.Now zoom in until the map covers a small area. Place the cursorin the center of the crosshairs and note the geographiccoordinates, indicated just beneath the rotation text field. Thisrepresents the center of the selected area. Zoom back out to theoriginal Data Zoom level. By notating the map center coordinatesand the data zoom value, the map can be quickly rebuilt in thefuture. If there is no special or specific area designated, the user needs todefine one. As indicated earlier, some idea can be deduced bysimply knowing the extent of the project including the radii of thecoverage areas of each facility to be included. This may beaccomplished in XMap by simply guessing at a center positionand clicking on that point. This moves the map to the screencenter. Then, perform selective changes of scale and re-centeringuntil the map displays the area and correct position. To simultaneously consider the paper size, the paper size must beselected. Select the Print tab. Select the ‘Map’ button on the left.On the bottom right click on the button that has a hand holding a
FSC Instruction Manual 136

On the bottom right click on the button that has a hand holding awrench, the Page Setup button. Select the printer, sheet size andpaper orientation from the resulting dialog. It is recommended that the page center now be locked. Select the‘Print’ tab followed by ‘Lock Print Center’. Then select ‘PrintPreview’. A magenta square or rectangular box will appear on thescreen. The map section enclosed by the magenta box is the areathat will be printed (or sent to a file) and is based on the printer’sselected paper size. This view takes into account the paper sizeand map scale shown in the Photo Zoom menu. The map scalemay be changed manually by simply entering a value, or byselecting a value from the Photo Zoom drop down menu. TheData Zoom buttons on the upper right may also be changed,providing a gross scale adjustment. A slightly more refinedadjustment is obtained by clicking the up-down buttons to theright of the Data Zoom field. A helper method that reduces the number of steps is to Print theproject in FSC with the ‘Show Page Size’ option selected. FSCwill determine how large a sheet is required and give the centercoordinates of the project area. One or two scale changes willprovide a rapid convergence of the paper/project sizes. Once thecentral coordinates and scale are known, they may be entereddirectly in XMap to produce the map. Note that for any map position movements, the ‘Lock PrintCenter’ must be unlocked. To write a map to a disc file, the above process for printing mustbe followed. When properly sized and centered and using thePrint tab mode, click on the right side button with the blue floppydisc icon. The area inside the magenta box will be written to animage file after being given a filename/location and desired bit
FSC Instruction Manual 137

image file after being given a filename/location and desired bitdensity in dpi, dots per inch. Finally, record and keep for the map the final scale from thePhoto Zoom, the map center coordinates, the Data Zoom number,the CD/DVD name and the pixel density (dpi). These data are allthat are required to rapidly reproduce the map in its final form.
FSC Instruction Manual 138
Positioning A Map
Select the Print tab. On the left side of the Print tab is a columnof buttons. Select the Map button. If you have a reference set of coordinates (latitude/longitude) ofsome point in your desired map area you can go directly to thatpoint by selecting the ‘Find’ tab, selecting the ‘Quick Search’button on the left and entering the coordinates in the ‘Search For’field and clicking on the ‘Search’ button. This places the point’scoordinates at the exact center of the visible screen. (Referencecenter coordinates for a Job may be obtained from FSC’s PageSize dialog. Refer to that section for details.) The map may also be repositioned by clicking on the map whilethe cursor is poised over a desired point. This causes the clickedpoint to be moved to the screen center, directly under thecrosshair. Another means to reposition the map is to move the cursor nearone edge of the map area until the cursor changes to a hand.Depress and hold the left mouse button and drag the map asrequired. Along the right side of the screen is the control panel. At the topof this area is the Data Zoom indicator. Below are three buttonsthat control the zoom level, to zoom in and out. These functionswill be used frequently. Less frequently used are the next nine buttons that also repositionthe map. The center button restores the previous map position.The eight others reposition the map in the directions shown oneach button.
FSC Instruction Manual 139

each button. Beneath the nine buttons are an indicator and text field to rotatethe map. These are normally unnecessary for an FSC mapbecause XMap and FSC both reference north to the top of thepage.
FSC Instruction Manual 140

Using Adobe Photoshop Elements
Adobe Photoshop Elements (APE) is a powerful and easy to use graphicsprogram that is a subset of Adobe Photoshop or CS3. Most of the filters,manipulations and operations are directly from Photoshop and operateidentically. APE is typically employed to combine a base map with images producedby FSC. For example, a base map is opened followed by the FSCcoverage image. The FSC image is copied and pasted into the base map,which is automatically pasted into a separate layer. The coverage layertransparency is then adjusted to show more or less transparency therebyadjusting the amount the base map shows through. The FSC scale andlabel are then opened and placed on the base map. A final export of thecomposed graphic completes the process. The APE file holding thecomponents is saved as a Photoshop file with each component on adifferent layer, making future changes easy.
FSC Instruction Manual 141

Working With A Defined Map
This assumes a base map has been created or obtained using an imageformat. And with that base map is knowledge of the scale and dot density(dpi).If the scale and dot density is unknown it is still possible to use the mapwith a penalty of a little more effort. See the next section. Open the base map image file in APE. Before doing anything else, selectfrom the menu: Image>Image Size. Verify that the Resolution is 150 dpi(~60 dpcm) or whatever dot density was specified for the base map. Ifnot, change it to the map value. Save and enter a name for the new fileusing the native Photoshop format. That file is the base map for thecurrent and all future projects. Now, with the base map still open, do aFile>Save As, giving a name befitting of the current project. The remainder of the process is similar. Assuming the FSC coverageimage used the same dot density, open the FSC coverage file, verify ormake the Resolution the same as the map. Copy the coverage image (Ctrl-C or Cmd-C) and paste it into the basemap image (Ctrl-V or Cmd-V). This action places the coverage image ina layer above the base map image. The coverage image may completely mask the base map. However, sincethe base map needs to be seen, the coverage must be made transparent.Select the coverage layer by clicking the coverage image in the Layerpane of the auxiliary window. This should be the second layer, the oneabove the map layer. From the top drop-down menu, select Multiply.Adjust the Opacity slider to about 50% for a first try. Final adjustment ofopacity will depend on the map and overlay colors and the amount ofdetail. Usually a value of 60% is satisfactory for many jobs.
FSC Instruction Manual 142

Assuming the label and scale are to be opaque, they may be opened,copied and pasted into the base map file in a similar manner. Toreposition them, select their layer, select the move tool and use the mouseor direction arrows for repositioning. Save the base map file as a Photoshop (.psd) document. The page maybe printed directly from APE, or, other formats may be saved such as a.bmp file or a .pdf file. APE automatically takes care of all the layeroperations and gives the proper output.
FSC Instruction Manual 143

Working With An Undefined Map
If items such map scale are unknown, the information may bemeasured. One way is to print a paper copy of the map. Thenusing the distance between two points on the map (in cm) and theknown distances of these points on the earth (in cm), the mapscale may be determined. This is explained in the MapConsiderations section. The distance between the points may bedetermined using a map with known scale and accuracy or evendriving the distance. By using a paper copy of the map, factors such as unintentionalprinter size reductions are accounted for automatically. It shouldthen be possible to produce in FSC coverage, label and scaleimages of the correct size by adjusting the Print Scale value onthe Job screen. From this point, the procedures described inpreceding section may be used.
FSC Instruction Manual 144

References
For Power and dBu Categories:P. L. Rice, A. G. Longley, K. A. Norton and A. P. Barsis,National Bureau of Standards Technical Note 101, last revisionJanuary 1, 1967. Volumes 1 & 2. For sale by NTIS. Containsworldwide Surface Refractivity chart, Vol 1, Figure 4.1. G. A. Hufford, A. G. Longley and W. A. Kissick, NTIA Report82-100, A guide to the Use of the ITS Irregular Terrain Model inthe Area Prediction Mode. For sale by NTIS. Defines some of themore obscure elements of Tech Note 101. US 47 CFR FCC Part 73.190, Figure R3 is a map showingground conductivity values for the United States. Otherjurisdictions have similar data. For sale by NTIS. For FM and TV:Jack Damlein, William A. Daniel, Harry Fine and George V.Waldo, FCC Report R-6602, Development of VHF and UHFPropagation Curves for TV and FM Broadcasting. Describes thecreation of the current allocation propagation curves used by theU.S. FCC. Note that Mobile(TV/FM) is a derivative of this category.US 47 CFR FCC Part 73 gives the current contour definitionsused to allocate and authorize the various classes of transmittingfacilities in U.S. In the U.S. these are typically defined usingvalues of contours in dBu. For Carey:Roger B. Carey, FCC Report R-6406, Technical FactorsAffecting The Assignment Of Facilities the Domestic Public LandMobile Radio Service. Details the factors that guided allocation
FSC Instruction Manual 145

Mobile Radio Service. Details the factors that guided allocationof Paging and Mobile services in the US. Tables of distanceshave replaced many of the original DPLMRS allocationprocesses. However, services such as Public Safety still use theseprocesses as allocation tools because they provide more efficientfrequency utilization. For Great Circle (Point-to-Point):This category incorporates a single radial of the Power and dBucategory. Data is presented differently but the calculationprocesses are identical. For COST-Hata:See the final COST 231 project report, Chapter 4. For Maps and other considerations:John P. Snyder, U.S. Geological Survey, Professional Paper 1395,Map Projections – A Working Manual
FSC Instruction Manual 146

Contact
Trouble Reports And Program Feedback
Please direct your feedback comments and trouble reports via e-mail to [email protected]. Responses will be returned as promptlyas possible.
Feature Requests
Please forward all feature requests to [email protected]. Unlessfurther understanding is required, there typically will be noresponses. The next program update cycle will contain all feasiblefeatures as requested. Direct inquiries to: Arthur K. Peters Web Site: www.akpce.comConsulting Engineers Phone: 1-352-331-0149
5422 NW 91st Boulevard Fax: 1-352-331-8026Gainesville, FL 32653 USA E-mail: [email protected]
FSC Instruction Manual 147