table of contents - mass.gov · web viewexecutive summary pg. 3 introduction pg. 5 tura progress...
TRANSCRIPT

2008 Toxics Use ReductionInformation Release
Commonwealth of MassachusettsExecutive Office of Energy and Environmental Affairs
Department of Environmental Protection
Developed in collaboration with:Office of Technical Assistance and Technology
Toxics Use Reduction Institute
June 2010

Table of Contents
Executive Summary Pg. 3
I. Introduction Pg. 5
II. TURA Progress 2000-2008 Pg. 6
III. 2008 TURA Chemical Data Pg. 11
IV. 2008 Significant Industrial Sectors Pg. 20
V. 2008 Major TURA Facilities Pg. 22
VI. Key TURA Terms Pg. 25

Page 3
Executive Summary
Massachusetts manufacturers and other businesses subject to the Toxics Use Reduction Act (TURA) have dramatically reduced their reliance on toxic chemicals, making Massachusetts a national leader in toxics use reduction. Through toxics use reduction, Massachusetts businesses have reduced chemical transportation risks, workplace hazards, toxics in products and waste, and have saved money.
In 2008, 530 facilities reported the use of 147 listed toxic substances to the Massachusetts Department of Environmental Protection (MassDEP). These facilities fell within certain industry sectors, had ten or more full-time employee equivalents, and used listed toxic substances at or above reporting thresholds. In total (including trade secret data), these facilities reported: 956 million pounds of toxic substances used (down from 1,020 million pounds in 2007), 78 million pounds of toxic byproduct (or waste) generated (down from 81 million pounds in 2007), 322 million pounds of toxics shipped in or as products (down from 334 million pounds in 2007), 5 million pounds of toxics released to the environment (down from 6 million pounds in 2007), and 30 million pounds of toxics transferred off-site for further waste management (the same as 30 mil-
lion pounds in 2007).
Year to year comparisons of raw TURA data do not always show actual progress in toxics use reduction since production levels and reporting requirements change over time. To account for these changes, the TURA program measures progress by using reported data (excluding trade secret data1) normalized for changes in production and using a consistent set of chemicals and industries subject to reporting over a given period of time (referred to as a “Core Group”). This report highlights progress of a 2000 Core Group from 2000 to 2008.
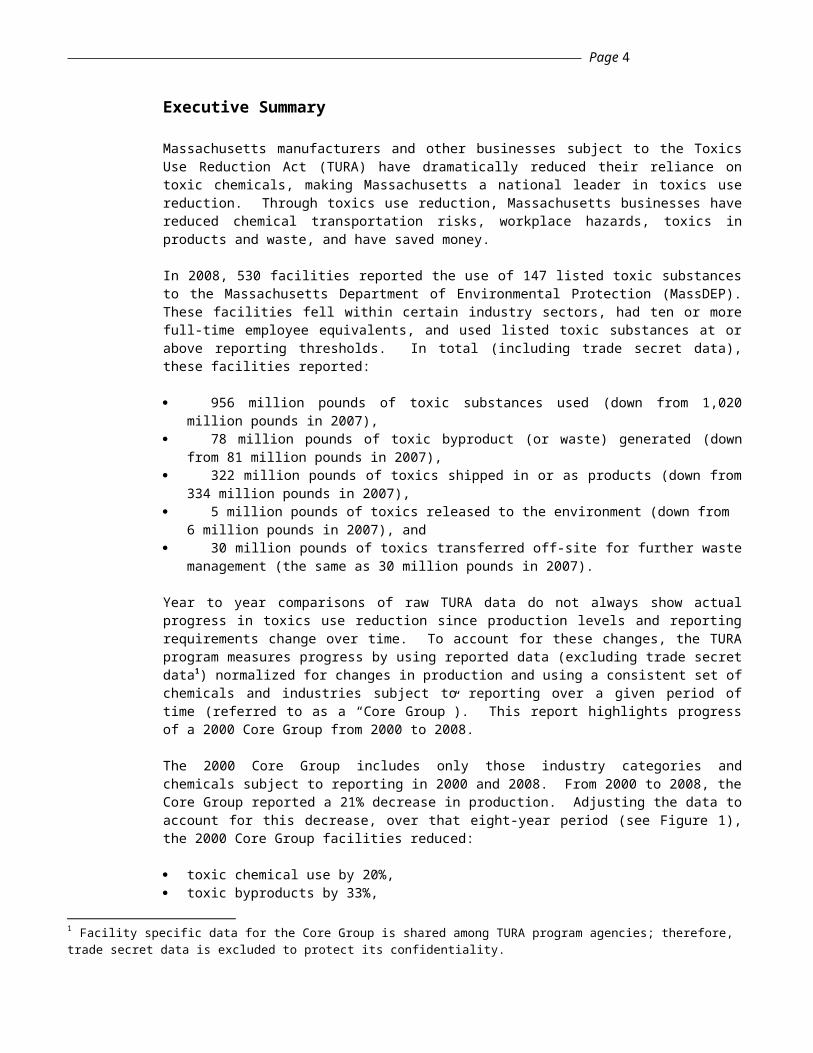
The 2000 Core Group includes only those industry categories and chemicals subject to reporting in 2000 and 2008. From 2000 to 2008, the Core Group reported a 21% decrease in production. Adjusting the data to account for this decrease, over that eight-year period (see Figure 1), the 2000 Core Group facilities reduced:
toxic chemical use by 20%, toxic byproducts by 33%, toxics shipped in product by 19%, on-site releases of toxics to the environment by 52%, and transfers of toxics off-site for further waste management by 39%.
The TURA program has achieved its sustained success through the efforts of Massachusetts industry working with state government to implement the goals of the TURA program. Massachusetts facilities have reduced significant amounts of waste by implementing toxics use reduction techniques, including input substitution, production unit modernization, production unit redesign, improved operation and maintenance, and recycling and reuse of chemicals in their production processes. They have demonstrated that toxics use reduction not only reduces toxic chemical use and waste, but also saves businesses money over the long-term.
1 Facility specific data for the Core Group is shared among TURA program agencies; therefore, trade secret data is excluded to protect its confidentiality.
Page 4
Figure 3 – 2000 Core Group Toxics Use Reduction Progress From 2000 to 2008 (Production Adjusted)
52%
20%
19%
33%
39%
Page 5
I. IntroductionThe Toxics Use Reduction Act (TURA) requires Massachusetts companies that fall within certain industry sectors, have ten or more full-time employee equivalents, and use listed toxic substances at or above reporting thresholds to report their chemical use annually to the Massachusetts Department of Environmental Protection (MassDEP) and pay an annual toxics use fee. TURA requires reporting facilities to develop toxics use reduction plans that identify and evaluate opportunities to reduce the use of toxics and the generation of toxic byproducts. These plans must be updated every two years and approved by a MassDEP-certified toxics use reduction planner. After several toxics use reduction planning efforts, companies have the option of developing resource conservation plans (addressing energy, water, or materials use) or implementing an environmental management system that integrates toxics use reduction planning. In planning year 2008, 26 facilities developed a total of 32 resource conservation plans and 13 facilities implemented environmental management systems under TURA.
In addition to MassDEP’s administration of reporting and planning requirements, the TURA program is supported by the Office of Technical Assistance and Technology (OTA) and the Toxics Use Reduction Institute (TURI) at the University of Massachusetts, Lowell. OTA provides non-regulatory technical assistance to facilities seeking to reduce the use of toxics, develops fact sheets and other technical guidance documents, supports the development of technology solutions by leveraging state and federal funding, and creates market-based incentives to reduce toxics use for qualifying TURA filers. TURI provides toxics use reduction education, training, and library services; supports research on cleaner materials and processes; and operates a laboratory for testing non-toxic or less-toxic cleaning alternatives. TURI also makes TURA data available on its website in a user-friendly way that is searchable by community, chemical or company. See www.turi.org/turadata.
This 2008 Toxics Use Reduction Information Release contains important chemical information that is useful to the public, government, and industry. However, it is important to note that because the data in this report are collected only from facilities within certain industrial sectors that have ten or more full-time employees and that use certain chemicals above established reporting thresholds, this report does not provide a complete picture of the use and release of all chemicals. In addition, this report does not contain information about exposures of the public to reported chemicals.
For more information about the TURA program, please visit the following web sites:
Massachusetts Department of Environmental Protection,Toxics Use Reduction Program: www.mass.gov/dep/toxics/toxicsus.htm
Office of Technical Assistance and Technology: www.mass.gov/envir/ota
Toxics Use Reduction Institute: www.turi.org

Page 6
II. TURA Progress 2000-2008 Figure 2 illustrates TURA filing trends since 2000. Out of 1,422 chemicals listed under TURA, 147 were reported in 2008, down from 194 in 2000. From 2000 to 2001, the number of facilities reporting under TURA rose to 716 due to new requirements to report lead and lead compounds at lower thresholds applicable to persistent bio-accumulative and toxic (PBT) chemicals. However, the number has declined to 530 in 2008, due to a combination of reduced chemical use, facilities closing, reduced production due to economic conditions, and 2006 statutory changes to TURA reporting requirements. The number of individual Form Ss2 filed followed a similar trend, decreasing from a high of 2,594 in 2001 to 1,677 in 2008, consistent with the decline in the number of TURA filers.
Figure 2 - TURA Filer Trends 2000 - 2008
2 A separate Form S is required for each chemical reported by a facility; the Form S is the form used to report chemical use information.
Page 7
2000 Core Group Progress – Production Adjusted Data
Since TURA reporting requirements have changed over time, TURA progress is best measured by using a consistent set of chemicals and industries subject to reporting over a given period of time (referred to as a “Core Group”). In order to more accurately measure progress, the TURA data are adjusted or normalized to eliminate the effects of changes in production using production ratios reported by the Core Group facilities.
The following example illustrates how data are adjusted to reflect changes in production:
In year 1, a facility produces 1,000 machine parts, and generates 100 lbs. of byproduct.
In year 2, the facility produces 10% less machine parts (900). Therefore, the production ratio is .90. However, the facility only generates 80 lbs. of byproduct.
The production adjusted byproduct for year 2 is 80 lbs./.90 = 89 lbs. The production adjusted percent change from year 1 to year 2 is [100-89]/100
= .11, or an 11% reduction, while its actual byproduct reduction is 20%.
The 2000 Core Group includes facility categories and chemicals that were subject to reporting in 2000 and that remained subject to reporting in 20083. In 2008, the 2000 Core Group used 632 million pounds, or 81% of the toxic chemicals reported (which is 778 million pounds excluding trade secret data).
From 2000 to 2008, 2000 Core Group filers reported a 21 percent decrease in production. From 2000 to 2008 (see Figure 3), when adjusted for production, the 2000 Core Group facilities reduced:
toxic chemical use by 20%, toxic byproducts by 33%, toxics shipped in product by 19%, on-site releases of toxics to the environment by 52%, and transfers of toxics off-site for further waste management by 39%.
2000 Core Group Progress – Without Adjusting for Production
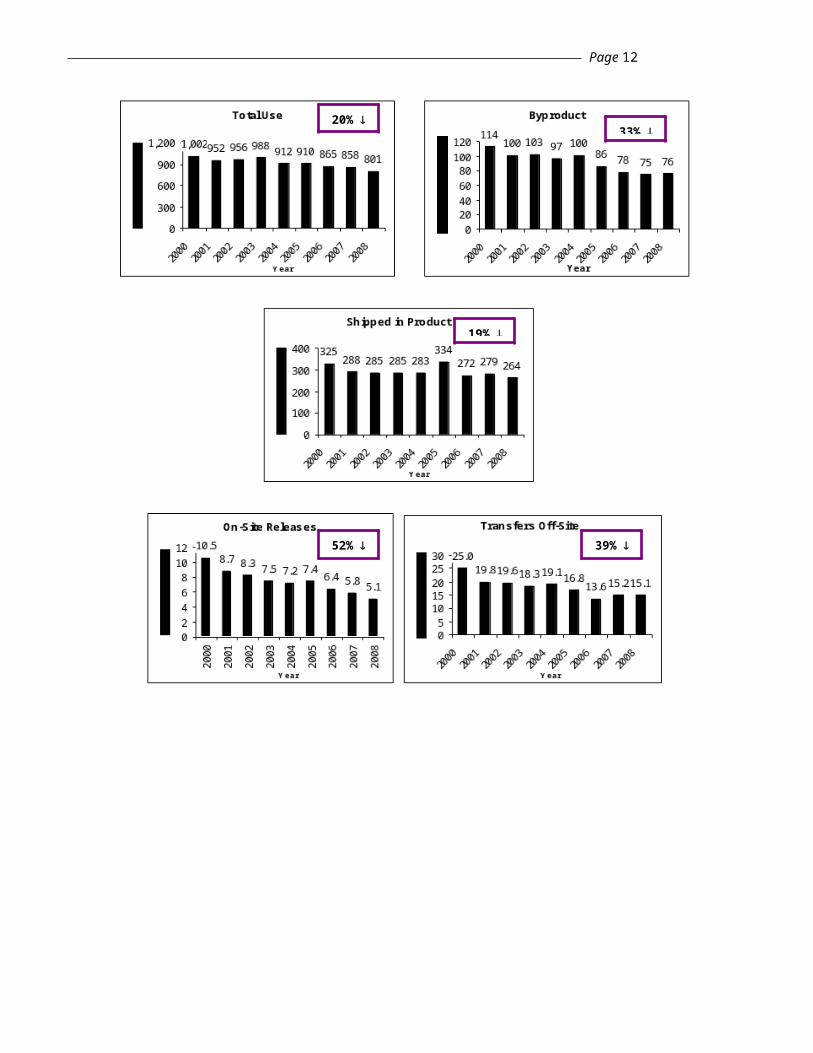
The actual quantities reported by the 2000 Core Group over the period 2000 to 2008 are shown in Figure 4. These quantities have not been adjusted for changes in production. From 2000 to 2008, Core Group facilities reduced:
toxic chemical use by 37% (from 1,002 million pounds in 2000 to 632 million pounds in 2008), toxic byproducts by 47% (from 114 million pounds in 2000 to 60 million pounds in 2008), toxics shipped in product by 36% (from 325 million pounds in 2000 to 209 million pounds in 2008), on-site releases of toxics to the environment by 62% (from 10 million pounds in 2000 to 4 million
pounds in 2008), and transfers of toxics off-site for further waste management by 52% (from 25 million pounds in 2000 to 12
million pounds in 2008). Figure 3 – 2000 Core Group Toxics Use Reduction Progress From 2000 to 2008
(Production Adjusted)
3 The 2000 Core Group includes all industry sectors and all chemical use except for the following: use of respirable crystalline silica (which was first reportable in 2001), use of lead and lead compounds due only to the lower 100-pound thresholds for lead and lead compounds that took effect in 2001, municipal waste combustor combustion-related emis -sions first reportable in 2003, and use of any chemical covered by a trade secret claim.
Page 8
Figure 4 – 2000 Core Group Toxics Use Reduction Progress From 2000 to 2008 (Not Production Adjusted)
52%
20%
19%
33%
39%

Page 9
37% 47%
36%
62% 52%
Page 10
Table 1 summarizes TURA data from 2000 to 2008, showing both reported and production adjusted quantities. For each category, each year’s production adjusted quantity is normalized to the base year production level, thus providing a comparison of production-adjusted quantities to base year quantities. Quantities in shaded boxes are adjusted for changes in manufacturing activity (level of production) using the facility-reported Production Ratio/Activity Index. For the 2000 Core Group, the activity index shows a decrease in production of 21 percent from 2000 to 2008.
Table 12000 CORE GROUP DATA: 2000 - 2008 TREND SUMMARY(Quantities are in millions of pounds and do not include trade secret quantities.
Shaded columns show production-adjusted quantities.)
TOTAL USE BYPRODUCT SHIPPED IN PRODUCT
ON-SITERELEASES
TRANSFERSOFF-SITE
ACTIVITY INDEX4
2000 1001.99 1001.99 113.69 113.69 325.20 325.20 10.49 10.49 24.96 24.962001 923.10 951.65 97.24 100.25 279.15 287.78 8.48 8.74 19.17 19.76 0.972002 853.16 956.03 91.78 102.85 254.56 285.25 7.41 8.30 17.45 19.55 0.922003 890.50 987.99 87.70 97.30 257.17 285.32 6.78 7.52 16.45 18.25 1.012004 813.45 911.62 89.46 100.26 252.53 283.01 6.42 7.19 17.04 19.10 0.992005 771.34 909.93 73.11 86.25 282.76 333.56 6.30 7.43 14.25 16.81 0.952006 732.86 864.53 66.23 78.13 230.79 272.26 5.45 6.43 11.51 13.58 1.002007 690.75 857.74 60.55 75.19 225.00 279.40 4.70 5.84 12.20 15.15 0.95 2008 632.49 801.43 60.28 76.38 208.50 264.19 4.01 5.08 11.92 15.10 0.98
Percent Change 37% 20% 47% 33% 36% 19% 62% 52% 52% 39% 21%
2000-2008 Reduction Reduction Reduction Reduction Reduction Reduction Reduction Reduction Reduction Reduction Decrease
43 The Production Ratio/Activity Index reported by each facility measures the change in production from the previous reporting year to the current reporting year.

Page 11
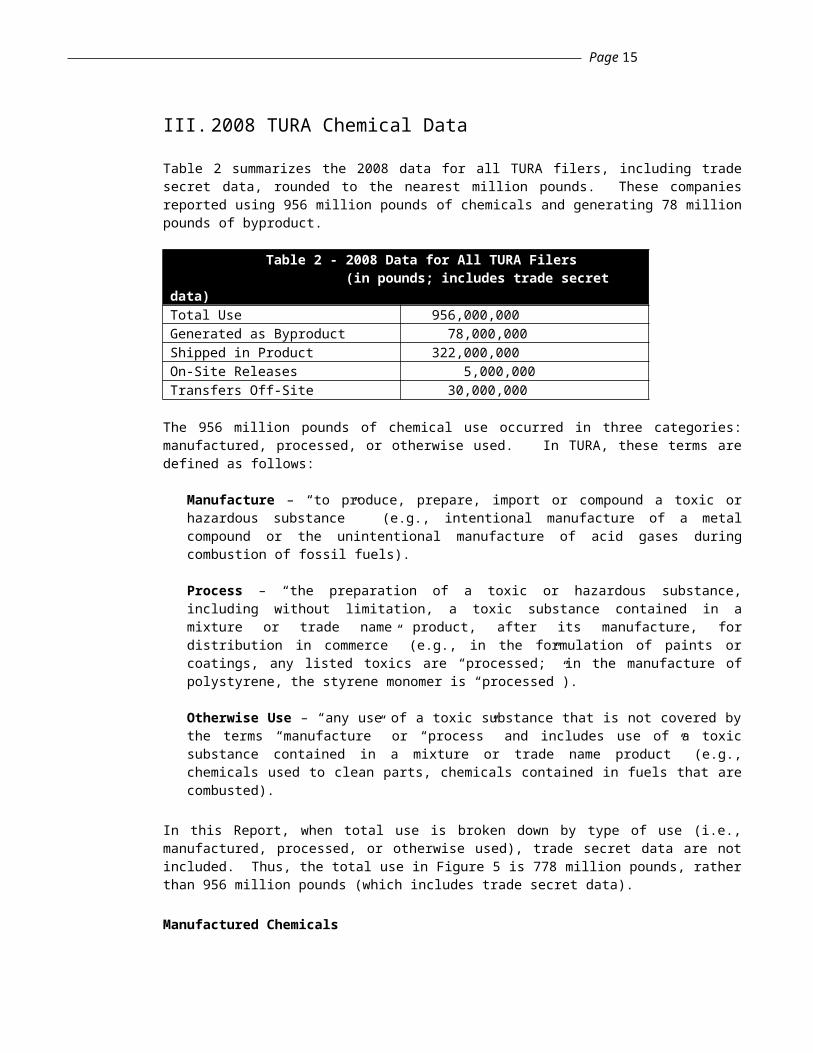
III. 2008 TURA Chemical DataTable 2 summarizes the 2008 data for all TURA filers, including trade secret data, rounded to the nearest million pounds. These companies reported using 956 million pounds of chemicals and generating 78 million pounds of byproduct.
Table 2 - 2008 Data for All TURA Filers (in pounds; includes trade secret data)
Total Use 956,000,000Generated as Byproduct 78,000,000Shipped in Product 322,000,000On-Site Releases 5,000,000Transfers Off-Site 30,000,000
The 956 million pounds of chemical use occurred in three categories: manufactured, processed, or otherwise used. In TURA, these terms are defined as follows:
Manufacture – “to produce, prepare, import or compound a toxic or hazardous substance” (e.g., intentional manufacture of a metal compound or the unintentional manufacture of acid gases during combustion of fossil fuels).
Process – “the preparation of a toxic or hazardous substance, including without limitation, a toxic substance contained in a mixture or trade name product, after its manufacture, for distribution in commerce” (e.g., in the formulation of paints or coatings, any listed toxics are “processed;” in the manufacture of polystyrene, the styrene monomer is “processed”).
Otherwise Use – “any use of a toxic substance that is not covered by the terms “manufacture” or “process” and includes use of a toxic substance contained in a mixture or trade name product” (e.g., chemicals used to clean parts, chemicals contained in fuels that are combusted).
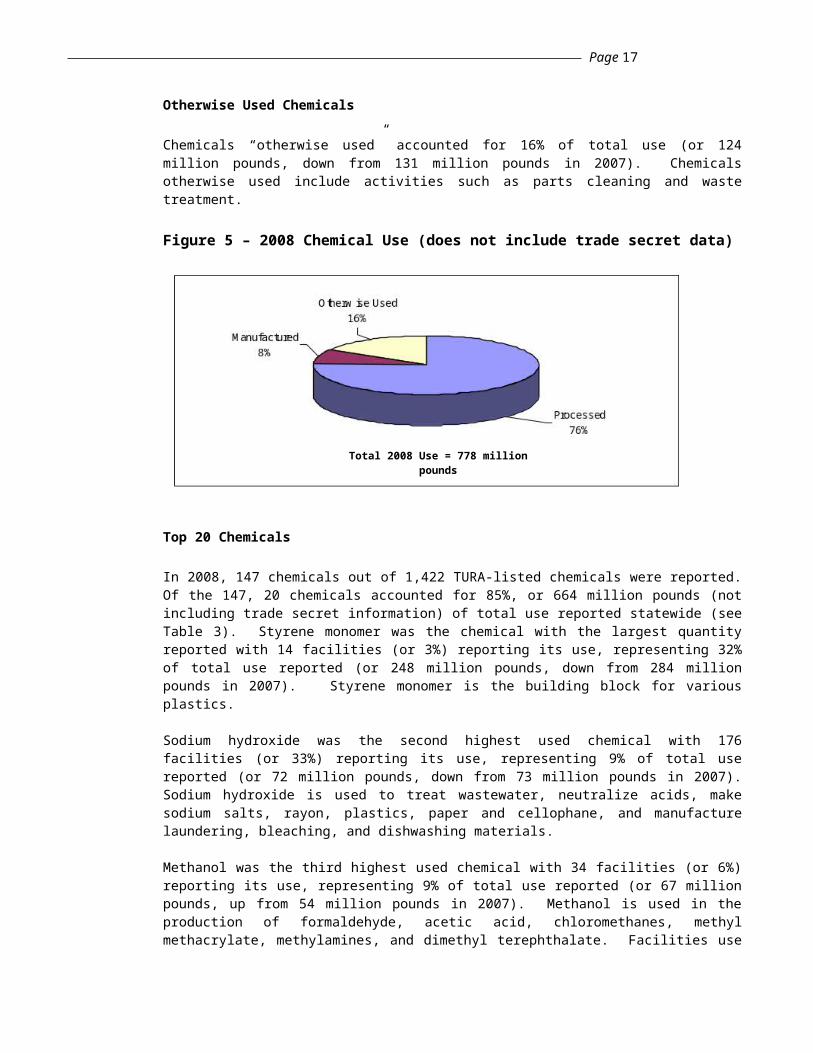
In this Report, when total use is broken down by type of use (i.e., manufactured, processed, or otherwise used), trade secret data are not included. Thus, the total use in Figure 5 is 778 million pounds, rather than 956 million pounds (which includes trade secret data).
Manufactured Chemicals
Figure 5 shows that relatively little manufacturing of TURA chemicals occurs in Massachusetts. Chemicals reported as “manufactured” accounted for 8% of the total use statewide (or 65 million pounds, up from 61 million pounds in 2007). A significant amount of the chemicals reported as manufactured are not manufactured intentionally, but are coincidentally manufactured as a result of some other activity. Examples include the creation of acid gases from fuel combustion for power generation and the production of nitrate compounds as a result of wastewater treatment.
Processed Chemicals
In Massachusetts, the predominant category of chemical use is “processing,” which includes incorporating a listed chemical into a product. Processing of chemicals accounted for 76% of total use (or 588 million pounds, down from 610 million pounds in 2007). Styrene, which is used in the production of plastics, accounted for 42% (or 248 million pounds) of total chemicals processed.
Page 12
Otherwise Used Chemicals Chemicals “otherwise used” accounted for 16% of total use (or 124 million pounds, down from 131 million pounds in 2007). Chemicals otherwise used include activities such as parts cleaning and waste treatment.
Figure 5 – 2008 Chemical Use (does not include trade secret data)
Top 20 Chemicals
In 2008, 147 chemicals out of 1,422 TURA-listed chemicals were reported. Of the 147, 20 chemicals accounted for 85%, or 664 million pounds (not including trade secret information) of total use reported statewide (see Table 3). Styrene monomer was the chemical with the largest quantity reported with 14 facilities (or 3%) reporting its use, representing 32% of total use reported (or 248 million pounds, down from 284 million pounds in 2007). Styrene monomer is the building block for various plastics.
Sodium hydroxide was the second highest used chemical with 176 facilities (or 33%) reporting its use, representing 9% of total use reported (or 72 million pounds, down from 73 million pounds in 2007). Sodium hydroxide is used to treat wastewater, neutralize acids, make sodium salts, rayon, plastics, paper and cellophane, and manufacture laundering, bleaching, and dishwashing materials.
Methanol was the third highest used chemical with 34 facilities (or 6%) reporting its use, representing 9% of total use reported (or 67 million pounds, up from 54 million pounds in 2007). Methanol is used in the production of formaldehyde, acetic acid, chloromethanes, methyl methacrylate, methylamines, and dimethyl terephthalate. Facilities use methanol as a solvent or antifreeze in the manufacturing of paint stripper, aerosol spray paints, wall paints, carburetor cleaners, and car windshield washer compounds.
Total 2008 Use = 778 million pounds(excluding trade secret data)

Page 13
Table 3 - 2008 Top 20 Chemicals: Total Use
Total UseThese quantities do not include
Trade Secret
Chemical Name(CAS #)
Total Use(Lbs.)
Styrene Monomer (100425) 248,489,268
Sodium Hydroxide (1310732) 71,892,770
Methanol (67561) 66,596,784
Hydrochloric Acid (7647010) 59,169,267
Sulfuric Acid (7664939) 22,891,570
Sodium Hypochlorite (7681529) 22,753,119
Formaldehyde (50000) 22,536,216
Toluene (108883) 21,632,679
Potassium Hydroxide (1310583) 17,003,241
Ammonia (7664417) 14,861,002
Zinc Compounds (1039) 13,155,278
Methyl Methacrylate (80626) 12,010,531
Nitrate Compounds (1090) 11,705,643
Chlorine (7782505) 11,391,221
Ethyl Acetate (141786) 9,645,742
Methyl Ethyl Ketone (78933) 9,218,848
Acetone (67641) 8,672,540
Diisocyanates (1050) 7,117,653
Toluene Diisocyanate (26471625) 6,865,641
Adipic Acid (124049) 6,578,028The following chemicals would appear in the Top 20 Chemicals Total Use list if trade secret quantities were included: Butyraldehyde, Sodium Bisulfite, Vinyl Acetate.

Page 14
Table 4 shows the Top 20 chemicals generated as byproduct in 2008, which accounted for 87% (or 68 million pounds) of total byproduct generated statewide. Table 4 also shows the Top 20 chemicals shipped in product in 2008, which accounted for 85% (or 216 million pounds) of total shipped in product (excluding trade secret data).
Table 4 - 2008 Top 20 Chemicals: Byproduct Generationand Shipped in Product
Byproduct Generation
These quantities includeTrade Secret
Shipped in Product
These quantities do not include Trade Secret
Chemical Name(CAS #)
Byproduct Generation
(Lbs.)
Chemical Name(CAS #)
Shipped in Product(Lbs.)
Sodium Hydroxide (1310732) 9,193,462 Methanol (67561) 47,875,812
Nitrate Compounds (1090) 9,140,571 Sodium Hydroxide (1310732) 45,311,461
Ethyl Acetate (141786) 8,564,975 Sodium Hypochlorite (7681529) 18,190,802
Toluene (108883) 6,714,291 Potassium Hydroxide (1310583) 13,991,710
Sulfuric Acid (7664939) 5,355,349 Toluene (108883) 11,864,456
Methanol (67561) 4,161,793 Chlorine (7782505) 11,357,221
Methyl Ethyl Ketone (78933) 3,661,924 Ammonia (7664417) 10,505,946
Hydrochloric Acid (7647010) 3,565,947 Zinc Compounds (1039) 8,220,826
Formaldehyde (50000) 2,686,832 Acetone (67641) 6,305,758
Lead (7439921) 2,527,787 Methyl Ethyl Ketone (78933) 5,555,234
Acetone (67641) 2,222,279 Copper Compounds (1015) 5,269,811
Ethylene Glycol (107211) 1,753,509 Sulfuric Acid (7664939) 4,880,432
N-Methyl-2-Pyrrolidone (872504) 1,459,706 Glycol Ethers (1022) 4,143,262
Nitric Acid (7697372) 1,358,481 N-Methyl-2-Pyrrolidone (872504) 3,724,136
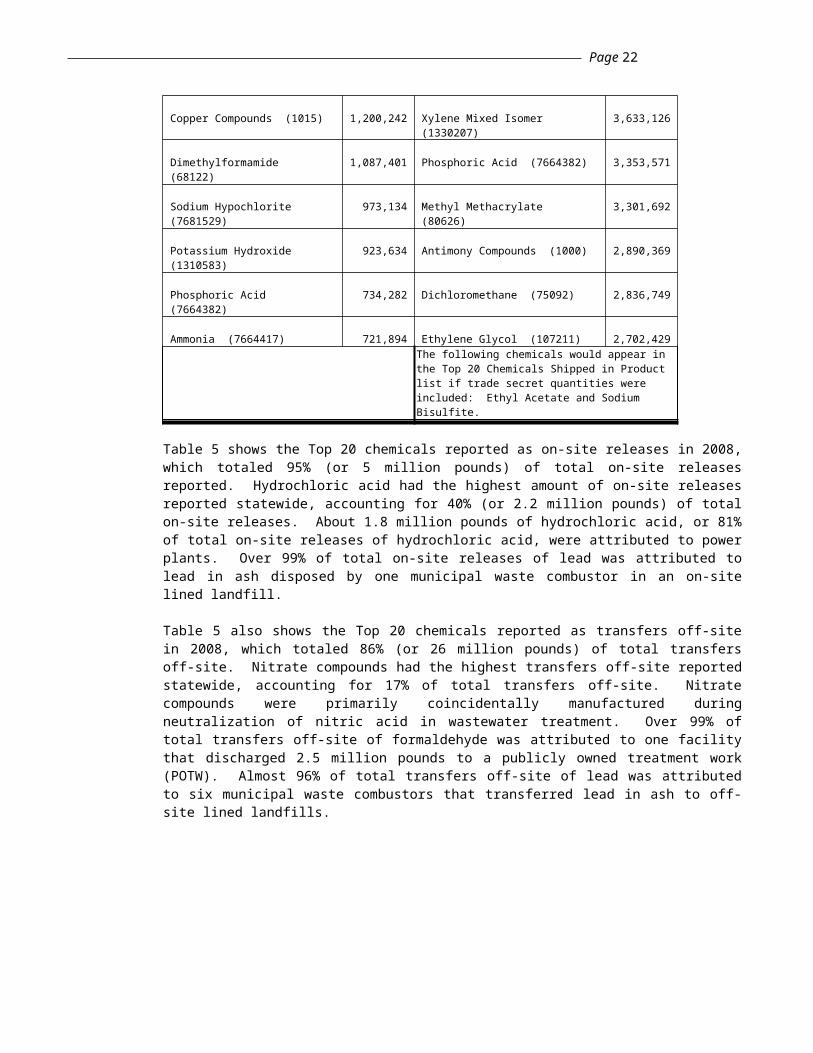
Copper Compounds (1015) 1,200,242 Xylene Mixed Isomer (1330207) 3,633,126
Dimethylformamide (68122) 1,087,401 Phosphoric Acid (7664382) 3,353,571
Sodium Hypochlorite (7681529) 973,134 Methyl Methacrylate (80626) 3,301,692
Potassium Hydroxide (1310583) 923,634 Antimony Compounds (1000) 2,890,369
Phosphoric Acid (7664382) 734,282 Dichloromethane (75092) 2,836,749
Ammonia (7664417) 721,894 Ethylene Glycol (107211) 2,702,429The following chemicals would appear in the Top 20 Chemicals Shipped in Product list if trade secret quantities were included: Ethyl Acetate and Sodium Bisulfite.
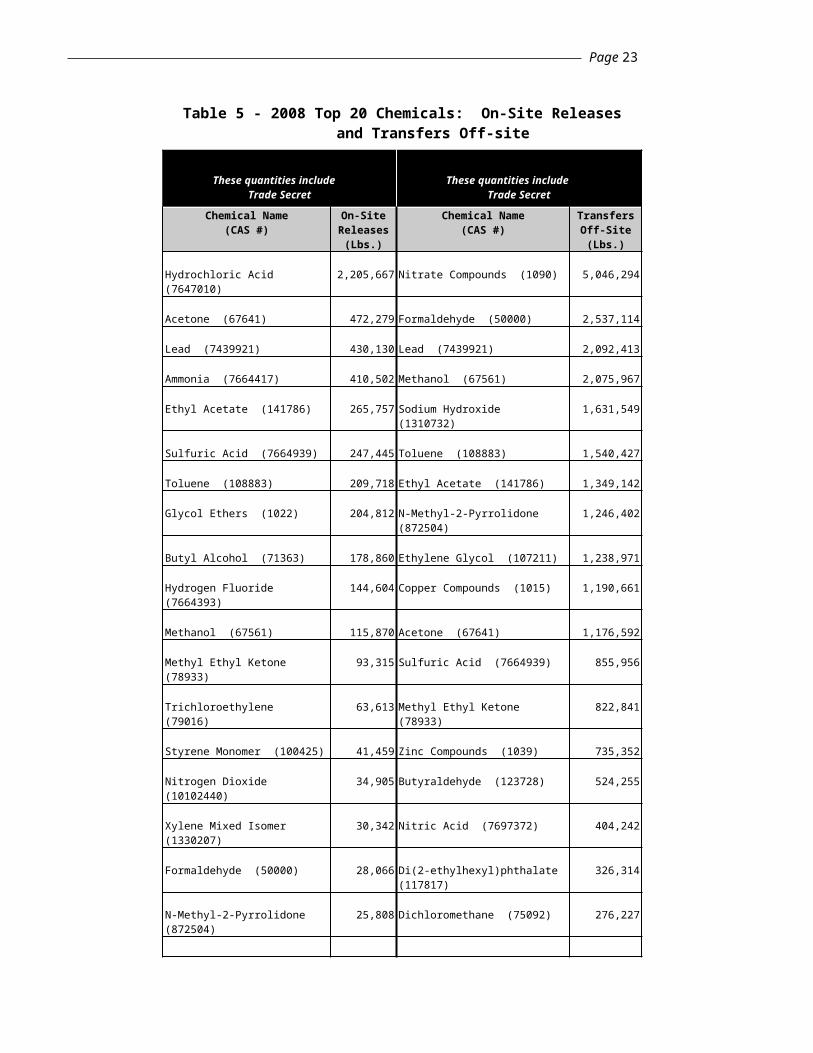
Table 5 shows the Top 20 chemicals reported as on-site releases in 2008, which totaled 95% (or 5 million pounds) of total on-site releases reported. Hydrochloric acid had the highest amount of on-site releases reported statewide, accounting for 40% (or 2.2 million pounds) of total on-site releases. About 1.8 million pounds of hydrochloric acid, or 81% of total on-site releases of hydrochloric acid, were attributed to power
Page 15
plants. Over 99% of total on-site releases of lead was attributed to lead in ash disposed by one municipal waste combustor in an on-site lined landfill.
Table 5 also shows the Top 20 chemicals reported as transfers off-site in 2008, which totaled 86% (or 26 million pounds) of total transfers off-site. Nitrate compounds had the highest transfers off-site reported statewide, accounting for 17% of total transfers off-site. Nitrate compounds were primarily coincidentally manufactured during neutralization of nitric acid in wastewater treatment. Over 99% of total transfers off-site of formaldehyde was attributed to one facility that discharged 2.5 million pounds to a publicly owned treatment work (POTW). Almost 96% of total transfers off-site of lead was attributed to six municipal waste combustors that transferred lead in ash to off-site lined landfills.
Table 5 - 2008 Top 20 Chemicals: On-Site Releases and Transfers Off-site
On-Site Releases These quantities include
Trade Secret
Transfers Off-SiteThese quantities include
Trade Secret
Chemical Name(CAS #)
On-Site Releases
(Lbs.)
Chemical Name(CAS #)
Transfers Off-Site(Lbs.)
Hydrochloric Acid (7647010) 2,205,667 Nitrate Compounds (1090) 5,046,294
Acetone (67641) 472,279 Formaldehyde (50000) 2,537,114
Lead (7439921) 430,130 Lead (7439921) 2,092,413
Ammonia (7664417) 410,502 Methanol (67561) 2,075,967
Ethyl Acetate (141786) 265,757 Sodium Hydroxide (1310732) 1,631,549
Sulfuric Acid (7664939) 247,445 Toluene (108883) 1,540,427
Toluene (108883) 209,718 Ethyl Acetate (141786) 1,349,142
Glycol Ethers (1022) 204,812 N-Methyl-2-Pyrrolidone (872504) 1,246,402
Butyl Alcohol (71363) 178,860 Ethylene Glycol (107211) 1,238,971
Hydrogen Fluoride (7664393) 144,604 Copper Compounds (1015) 1,190,661
Methanol (67561) 115,870 Acetone (67641) 1,176,592
Methyl Ethyl Ketone (78933) 93,315 Sulfuric Acid (7664939) 855,956
Trichloroethylene (79016) 63,613 Methyl Ethyl Ketone (78933) 822,841
Styrene Monomer (100425) 41,459 Zinc Compounds (1039) 735,352
Nitrogen Dioxide (10102440) 34,905 Butyraldehyde (123728) 524,255
Xylene Mixed Isomer (1330207) 30,342 Nitric Acid (7697372) 404,242
Formaldehyde (50000) 28,066 Di(2-ethylhexyl)phthalate (117817) 326,314
N-Methyl-2-Pyrrolidone (872504) 25,808 Dichloromethane (75092) 276,227
Butyraldehyde (123728) 23,000 Tetrahydrofuran (109999) 269,399
Dimethylformamide (68122) 22,621 Lead Compounds (1026) 264,123
Page 16
Persistent Bioaccumulative Toxic (PBT) Chemicals
Chemicals classified as persistent bio-accumulative toxic (PBT) chemicals by the U.S. Environmental Protection Agency (EPA) under the Toxics Release Inventory (TRI) Program are of particular concern because they are highly toxic, remain in the environment for long periods of time, are not readily destroyed, and build up or accumulate in body tissue. Relatively small releases of PBT chemicals can pose human and environmental health threats and, therefore, the use and release of these chemicals, even in relatively small amounts, warrant public reporting as well as efforts to reduce their use and release. For 2008, Massachusetts facilities reported the use of eight PBT chemicals/chemical categories (see Table 6). It should be noted that TURA data are collected only from facilities within certain industrial sectors that have 10 or more full-time employees, and therefore it does not provide a complete picture of the use and emissions of chemicals, whether PBT or non-PBT chemicals. For instance, TURA data do not include emissions from cars and trucks, or emissions from the majority of releases of pesticides, volatile organic compounds, fertilizers, and many other non-industrial sources. They also do not capture the use of toxic chemicals in consumer products that are not manufactured in Massachusetts.
Table 62008 PBT Summary
(in pounds unless otherwise noted)PBT
Chemical/Chemical Category
Reporting Threshold
Number of
Facilities Total Use Generated
as Byproduct
Shipped in
Product
On-Site Releases
Transfers Off-Site
PolycyclicAromaticCompounds(PACs)
100 lbs. 31 3,280,618 9,574 51,756 1,246 2,831
Benzo(g,h,i)perylene 10 lbs. 26 33,393 33 869 0 29
Mercury 10 lbs. 19 11,769 9,177 3,077 777 8,396
Mercury Compounds 10 lbs. 5 983 171 417 100 271Poly-chlorinated biphenyls (PCBs)
10 lbs. 3 156,170 156,165 5 0 150,835
Dioxin and Dioxin-like Compounds
0.1 Grams
13 1,522.770Grams
1,526.320Grams
0.000Grams
147.384Grams
1,303.714Grams
Lead 100 lbs. 85 3,743,254 2,527,787 1,226,419 430,130 2,092,413 Lead Compounds 100 lbs. 92 1,137,504 258,980 824,172 3,039 260,077
Page 17
Higher Hazard Substances
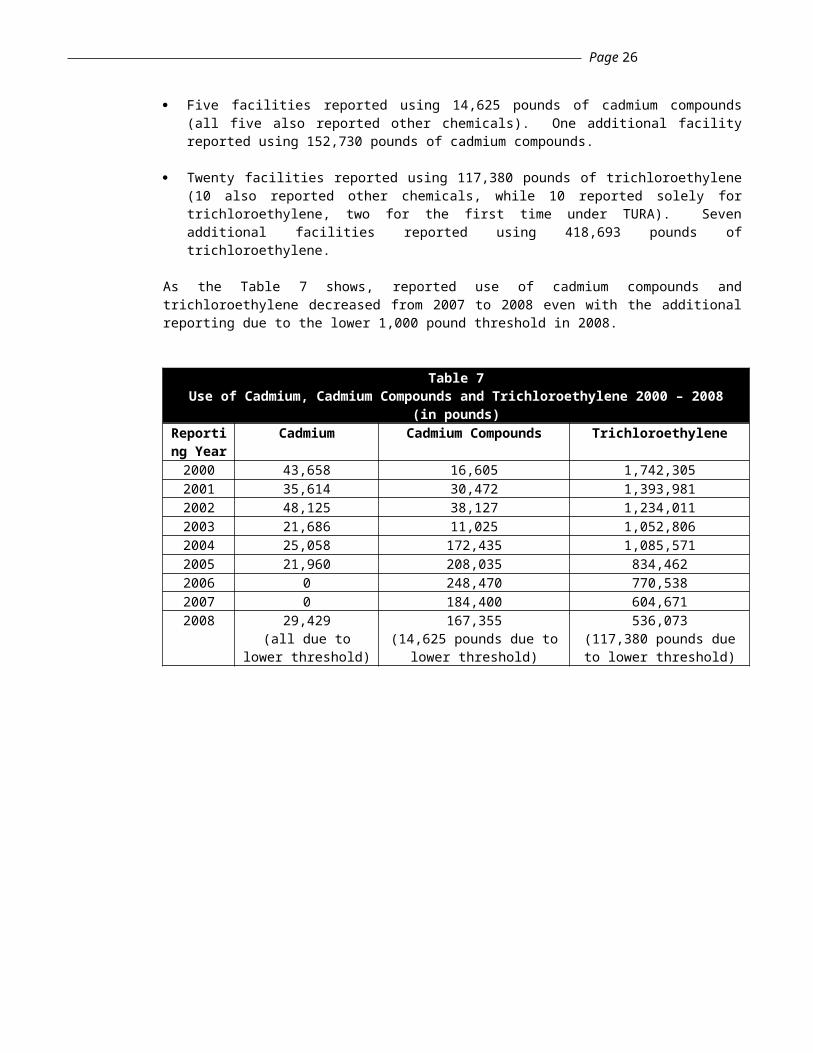
In 2008 cadmium, cadmium compounds, and trichloroethylene were designated as higher hazard substances with a lower 1,000 pound reporting threshold. As a result, 28 facilities reported these substances due to the lower reporting thresholds:
Five facilities reported using 29,429 pounds of cadmium (all five also reported other chemicals);
Five facilities reported using 14,625 pounds of cadmium compounds (all five also reported other chemicals). One additional facility reported using 152,730 pounds of cadmium compounds.
Twenty facilities reported using 117,380 pounds of trichloroethylene (10 also reported other chemicals, while 10 reported solely for trichloroethylene, two for the first time under TURA). Seven additional facilities reported using 418,693 pounds of trichloroethylene.
As the Table 7 shows, reported use of cadmium compounds and trichloroethylene decreased from 2007 to 2008 even with the additional reporting due to the lower 1,000 pound threshold in 2008.
Table 7Use of Cadmium, Cadmium Compounds and Trichloroethylene 2000 – 2008
(in pounds)Reporting
YearCadmium Cadmium Compounds Trichloroethylene
2000 43,658 16,605 1,742,3052001 35,614 30,472 1,393,9812002 48,125 38,127 1,234,0112003 21,686 11,025 1,052,8062004 25,058 172,435 1,085,5712005 21,960 208,035 834,4622006 0 248,470 770,5382007 0 184,400 604,6712008 29,429
(all due to lower threshold)
167,355(14,625 pounds due to lower
threshold)
536,073(117,380 pounds due to lower
threshold)

Page 18
Asthmagens
In 2009 the Lowell Center for Sustainable Production (LCSP) published Asthma-Related Chemicals in Massachusetts: an Analysis of Toxics Use Reduction Data (available on TURI’s website www.turi.org). The purpose of this project was to understand the extent to which chemicals that can cause the initial onset of asthma or trigger subsequent asthma attacks are being used by Massachusetts industries who report under the Toxics Use Reduction Act (TURA) program (using 1990 to 2005 data). The report identified 335 chemicals that can cause or exacerbate asthma, of which 68 are reportable under TURA and of which 41 have been reported at some point during the program’s history.
The TURA Program has begun working to better understand the uses of these chemicals in relation to potential exposures and toxics use reduction opportunities. Table 8 summarizes 2008 data on some of the chemicals identified in the LCSP report that were reported under TURA. In 2008, 20 chemicals identified as asthmagens by the Association of Occupational and Environmental Clinics (AOEC) were reported under TURA. Styrene monomer, sulfuric acid, and formaldehyde had the largest amount of uses and releases.
Styrene monomer was used by 14 facilities, although the bulk of its use was by one facility. All reported releases of styrene were air releases. Sulfuric acid was used by 108 facilities. Power plants had the largest amount of releases, which were all to air. Formaldehyde was used by nine facilities, with one facility responsible for the bulk of the total use. Formaldehyde releases were primarily to air, with a small amount discharged to water.
Table 8Asthma-Related Toxics
(in pounds)Chemical Name (Number of facilities) Use On-Site Releases
Acetic Acid (17) 1,857,265 5,574Aluminum (2) 127,545 20Chlorine (3) 11,391,221 0.4Chromium (2) 56,093 4Chromium Compounds (8)* 497,366 568Diethanolamine (1) 11,839 0Ethylenediamine (2) 25,572 16Ethylene Oxide (1) 310,400 303Formaldehyde (9) 22,536,216 28,066Hydrazine (1) 160,931 11Maleic Anhydride (1) 525,080 386Methylenebisphenyl (2) 170,913 0Methylmethacrylate (6) 12,010,531 2,378Nickel (4) 827,155 104Nickel Compounds (9) 758,767 7,250Phthalic Anhydride (1) 326,113 256Polymeric Diphenylmethane Diisocyanate (1) 41,250 0Styrene Monomer (14) 248,489,260 41,459Sulfuric Acid (108) 22,882,404 246,980Toluene Diisocyanate (1) 362,180 0
* Chromium is considered an asthmagen by AOEC but chromium compounds are not.

Page 19
Carcinogens
Several TURA chemicals are identified as Group 1 carcinogens (i.e., carcinogenic to humans) by the International Agency for Research on Cancer (IARC). In 2008, seven IARC Group 1 carcinogens were reported under TURA (see Table 9). Formaldehyde, nickel compounds and chromium compounds had the largest amounts of reported uses and releases. Of these chemicals, dioxin was reported by the most facilities. Releases were primarily air releases; however, there also were releases to water and land.
Table 9IARC Group 1 Carcinogens
(in pounds unless otherwise noted)Chemical Name (Number of Facilities) Use On-Site Releases
Cadmium (5) 39,522 35Chromium Compounds (8)* 497,366 568Crystalline Silica (2) 218,561 10Dioxin (13)* 1522.77 grams 147.38 gramsEthylene Oxide (1) 310,400 303Formaldehyde (9) 22,536,216 28,066Nickel Compounds (9) 758,767 7,250
* Hexavalent Chromium and 2,3,7,8-Tetrachlorodibenzo-para-dioxin are the agents specifically listed as Group 1 by IARC.

Page 20
IV. 2008 Significant Industrial SectorsUnder TURA, facilities in the Manufacturing Standard Industrial Classification (SIC) codes (20-39 inclusive) and those in SIC codes 10-14, 40, 44-51, 72, 73, 75 and 76, or the corresponding NAICS code must report their chemical use if they meet or exceed certain thresholds.
Figure 6 shows the number of TURA reporting facilities in each industry sector. The Chemical Manufacturing sector represents approximately 19% (96 facilities) of the number of TURA reporting facilities, and uses 75% of the reportable TURA chemicals (see Figure 7). This sector is a diverse group of industries, and includes companies that manufacture or formulate adhesives, paints, pharmaceuticals, and plastic materials and resins. Approximately 35% of the total chemical use for this sector was attributable to the use of styrene monomer, which is used in the manufacture of polystyrene and other plastics.
Figure 6 - 2008 Number of Facilities By Industrial Sector Total Number of Facilities = 530
Figure 7 - 2008 Chemical Use By Industrial SectorTotal Use = 956,000,000 Pounds

Page 21
The second largest sector, Primary Metal Manufacturing, accounted for 6% of total statewide use. The two third largest sectors, Utilities and Merchant Wholesalers, Nondurable Goods, each accounted for 3% of chemical use. Waste Management and Remediation Services and Paper Manufacturing each accounted for 2% of total statewide use, leaving the balance of statewide use (9%) to a variety of sectors.
Figure 8 shows byproduct generation by industrial sector. While the Chemical Manufacturing sector accounted for 75% of total statewide use, this sector produced 34% of the total byproduct generated in 2008. In contrast, the Paper Manufacturing sector, which accounted for 2% of total statewide chemical use, accounted for 18% of the byproduct generated. The Utilities sector accounted for 8%, and the Computer & Electronic Product Manufacturing and Textile Mills sectors each accounted for 7% of total byproduct generated. The Plastics & Rubber Products Manufacturing and Fabricated Metal Product Manufacturing sectors each accounted for 6% of the total byproduct generated. The remaining 14% of byproduct generated was attributed to a variety of sectors.
Figure 8 - 2008 Byproduct Generation By Industrial SectorTotal Byproduct = 81,000,000 Pounds
Figure 9 shows on-site releases to the environment by industrial sector. The Utilities sector, which represented 3% of total statewide use, was the largest source of on-site releases, accounting for 45% of all on-site releases. This sector provides power for Massachusetts businesses and citizens. Seventy-one percent of on-site releases in this sector were attributed to the coincidental manufacture of hydrochloric acid during combustion. The Chemical Manufacturing sector, which accounted for 75% of total chemical use, accounted for 11% of total on-site releases to the environment. The Waste Management and Remediation Services sector accounted for 12% of total on-site releases; the Fabricated Metal Product Manufacturing sector accounted for 10% of total on-site releases; and the Paper Manufacturing sector accounted for 9% of total on-site releases. The remaining 13% of total on-site releases was attributed to a variety of sectors.
Figure 9 - 2008 On-Site Releases By Industrial SectorTotal On-Site Releases = 6,000,000 Pounds
Page 22
V. 2008 Major TURA FacilitiesTop 20 Facility Lists
Table 10 lists the 20 facilities that used the largest quantity of TURA chemicals. These 20 facilities used 724 million pounds, or 76% of total statewide use.
Table 10 – 2008 Top 20 Facilities(Largest Quantity of Total Use)
Total UseThese quantities include
Trade Secret
Facility Name Town Total Use (Lbs.)
Ineos Nova LLC Springfield 244,752,514
Solutia Inc.Indian Orchard Plant Springfield
109,477,946
Borden & Remington Fall River 93,385,336
Holland Company Inc. Adams 44,452,012
Ineos Melamines LLC Springfield 41,236,360
Eastman Gelatine Corp. Peabody 30,071,560
Southwin Ltd. Leominster 17,803,437
Semass Partnership Rochester 16,636,498
Camco Manufacturing Inc. Leominster 15,506,188
James Austin Co. Ludlow 15,022,295
Omnova Solutions Inc. Fitchburg 14,209,791
Cytec Surface Specialties Inc. Springfield 13,829,820
Ashland Distribution Co. Tewksbury 11,297,214
ITW TACC Rockland 10,792,923
Houghton Chemical Corp. Boston 9,830,532
Ashland Hercules Water Technologies Chicopee 9,239,967
Astro Chemicals Inc. Springfield 6,912,357
Advanced Urethane Technologies Inc. Newburyport 6,793,527
Bostik Inc. Middleton 6,597,695
Nyacol Nano Technologies, Inc. Ashland 6,011,800
Page 23
Table 11 lists the 20 facilities that generated the largest quantity of byproduct. These facilities generated 44 million pounds of byproduct, or 56% of total statewide byproduct. Table 16 also lists the 20 facilities with the largest quantity shipped in product. These facilities shipped 267 million pounds in product, or 83% of total shipped in product statewide.
Table 11 - 2008 Top 20 Facilities(Largest Quantity of Byproduct Generation and Shipped in Product)
Byproduct GenerationThese quantities include
Trade Secret
Shipped in ProductThese quantities include
Trade Secret
Facility Name Town ByproductGeneration
(Lbs.)
Facility Name Town Shipped inProduct (Lbs.)
Eastman Gelatine Corp. Peabody 6,876,800 Borden & Remington Fall River 93,372,599
Venture Tape Corp. Rockland 5,606,317Solutia Inc.Indian Orchard Plant Springfield 33,332,301
Solutia Inc.Indian Orchard Plant Springfield 4,284,954 Southwin Ltd. Leominster 17,798,712
Ineos Melamines LLC Springfield 3,951,000Camco Manufacturing Inc. Leominster 15,508,458
Flexcon Co. Inc. Plant 2 Spencer 3,833,165 James Austin Co. Ludlow 15,051,429
Madico Inc. Woburn 2,503,863 Holland Company Inc. Adams 14,690,012
Crane & Co. Inc. Pioneer Mill Dalton 2,107,989Ashland Distribution Co. Tewksbury 10,888,457
Intel Massachusetts Inc. Hudson 1,865,079 ITW TACC Rockland 10,639,853
Lewcott Corp. Millbury 1,538,086Houghton Chemical Corp. Boston 9,810,210
Dominion Energy Brayton Point LLC Somerset 1,377,243
Cytec Surface Specialties Inc. Springfield 7,443,210
ITW Foilmark Inc. Newburyport 1,259,200 Astro Chemicals Inc. Springfield 6,641,731
Bostik Inc. Middleton 1,256,711 Webco Chemical Corp. Dudley 5,853,500Brittany Dyeing & Printing Corp. New Bedford 1,242,625 Callahan Co. Walpole 4,315,688
Barnhardt Manufacturing Co. Colrain 1,193,676
Rohm & Haas Electronics Materials LLC Marlborough 4,196,030
Intelicoat Technologies Inc. South Hadley 932,232 ITW Devcon Plexus Danvers 3,609,323
Waters Corp. Taunton 926,727 Bostik Inc. Middleton 2,897,454
Semass Partnership Rochester 890,954 Advance Coatings Co. Westminster 2,849,674
Majilite Manufacturing Inc. Dracut 864,215Callaway Golf Ball Operations Inc. Chicopee 2,778,791
Evergreen Solar Inc. Devens 839,816
Belden CDT Networking Inc. DBA Mohawk CDT Leominster 2,583,056
Belden CDT Networking Inc. DBA Mohawk CDT Leominster 827,399 Alphagary Corp. Leominster 2,347,864
Table 12 lists the 20 facilities that had the largest quantity of on-site releases and the 20 facilities that had the largest quantity of transfers off-site. The 20 facilities with the largest quantity of on-site releases released 4 million pounds, or 76% of total releases statewide. Six of these facilities were power plants, accounting for 2.1 million pounds, or 38% of total on-site releases. Over 1.5 million pounds, or 72% of these power plants’ on-site releases, were due to the coincidental manufacture of hydrochloric acid during combustion. The remainder of the power plants’ on-site releases was due to the coincidental manufacture of the following chemicals during combustion: ammonia (11%),

Page 24
sulfuric acid (9%), hydrogen fluoride (7%), and metal compounds (2%). Four of the Top 20 facilities were municipal waste combustors (MWCs) that reported combustion-related emissions. Of the .9 million pounds of on-site releases reported by these MWCs, 51% of the releases was due to the coincidental manufacture of hydrochloric acid during combustion and 49% was due to lead in ash disposed in an on-site lined landfill at one facility.
The 20 facilities with the largest quantity of transfers off-site transferred almost 18 million pounds, or 61% of the total transfers off-site statewide.
Table 12 – 2008 Top 20 Facilities(Largest Quantity of On-Site Releases and Transfers Off-Site) On-Site ReleasesThese quantities include
Trade Secret
Transfers Off-SiteThese quantities include
Trade SecretFacility Name Town On-Site
Releases (Lbs.)
Facility Name Town Transfers Off-Site(Lbs.)
Dominion Energy Brayton Point LLC Somerset 1,290,470 Ineos Melamines LLC Springfield 3,543,625
Covanta Haverhill Inc. Haverhill 482,845Solutia Inc. Indian Orchard Plant Springfield 3,232,112
Mt. Tom Generating Company LLC Holyoke 345,242
Brittany Dyeing & Printing Corp. New Bedford 1,242,625
Solutia Inc.Indian Orchard Plant Springfield 317,391 Waters Corp. Taunton 914,049
Crown Beverage Packaging USA Lawrence 300,460
Belden CDT Networking Inc. DBA Mohawk CDT Leominster 827,356
Semass Partnership Rochester 162,225Intel Massachusetts Inc. Hudson 801,594
Dominion Energy Salem Harbor LLC Salem 159,528 Semass Partnership Rochester 728,733
Mirant Canal LLC Sandwich 140,458Metalor Technologies USA Attleboro 722,311
Wheelabrator Millbury Inc. Millbury 123,147 Evergreen Solar Inc. Devens 672,288
Ideal Tape Co. Lowell 115,490 Genzyme Corp. Boston 668,032
Wheelabrator Saugus Inc. Saugus 103,165Koch Membrane Systems Inc. Wilmington 587,484
Somerset Power LLC Somerset 100,707Cytec Surface Specialties Inc. Springfield 557,819
Vacumet Corp. Franklin 93,466Applied Biosystems LLC Bedford 555,460
Hollingsworth & Vose Co. West Groton 83,650Johnson Matthey Pharma Services Devens 547,469
Jen Mfg. Inc. Millbury 78,396 Ideal Tape Co. Lowell 477,058
Alliance Leather Inc. Peabody 65,767 Millipore Corp. Bedford 469,253Boston Generating Mystic LLC Everett 59,124
Wheelabrator Millbury Inc. Millbury 439,280
Metalor Technologies USA Attleboro 56,970 Wheelabrator Saugus Inc. Saugus 427,696
Tyco Electronics Corp. Worcester 47,854Flexcon Co. Inc. Plant 2 Spencer 419,966
Venture Tape Corp. Rockland 44,410 PCI Synthesis Inc. Newburyport 396,923

PRODUCT – a product, a family of products, an intermediate product, family of intermediate products, or a desired result or a family of results. “Product” also means a byproduct that is used as a raw material without treatment.
SHIPPED IN PRODUCT – the quantity in pounds of the chemical that leaves the facility as product.
BYPRODUCT – all non-product outputs of reportable substances generated by a production unit prior to handling, treatment, and release.
This section contains definitions of key TURA terms.
TURA – Massachusetts Toxics Use Reduction Act of 1989 (MGL 21I)TRI – federal EPA Toxics Release InventoryTRADE SECRET – the information identified as confidential by TURA filers. To protect confidentiality claims by Trade Secret filers, all trade secret data in this information release are presented in aggregated form. Aggregated data do not include the names and amounts of chemicals subject to claims of confidentiality.2000 CORE GROUP – includes all industry categories and chemicals that were subject to TURA reporting in 2000 and remained subject to reporting in 2008. The 2000 Core Group is used to measure progress from 2000 to 2008.
The terms and definitions below have been arranged in order of inputs and outputs. Chemicals that are used by companies are brought into the facility and are manufactured, processed or otherwise used. As a result of using these chemicals, a company has outputs that can include a product that is created for sale, or a byproduct or waste. The calculation of use and waste of chemicals is known as ‘mass balance.’ Generally the inputs equal the outputs, but there are circumstances where a chemical is used in ways that result in an imbalance between inputs and outputs. These circumstances are most often the result of: 1) chemicals are recycled on-site, 2) the product was held in inventory, 3) chemical is consumed or transformed, or 4) the chemical is a compound.
Page 25
VI. Key TURA Terms
PROCESS – the preparation of a toxic or hazardous substance, including without limitation, a toxic substance contained in a mixture or trade name product, after its manufacture, for distribution in commerce: a) in the same form or physical state, or in a different form or physical state, from that in which it was received by the toxics user so preparing such substance; or b) as part of an article containing the toxic or hazardous substance.
ON-SITE RELEASES– all byproducts that are released to the air, discharged to surface waters, released to land and underground injection wells.
TRANSFERS OFF-SITE – byproducts that are transferred off-site for energy recovery, recycling, treatment and disposal.
TOTAL USE – the total quantity in pounds of TURA chemicals reported as manufactured, processed and otherwise used.
MANUFACTURE – to produce, prepare, import or compound a toxic or hazardous substance.
OTHERWISE USE – any use of a toxic substance that is not covered by the terms “manufacture” or “process” and includes use of a toxic substance contained in a mixture or trade name product.
Mass Balance
Massachusetts Department ofEnvironmental ProtectionOne Winter StreetBoston, MA 02108-4746
Commonwealth of MassachusettsDeval L. Patrick, Governor
Executive Office of Energy and Environmental AffairsIan A. Bowles, Secretary
Department of Environmental ProtectionLaurie Burt, Commissioner