table of contents - of contents 1. investing in marketing in times of ... marketing and promotional...
TRANSCRIPT

TABLE OF CONTENTS
1. Investing in Marketing in Times of Recession 9 CARMENBĂLAN 2. BuildingQualitythroughRecessionintheEMBAProgramBasedonAssessmentofLearning 25 DALINADUMITRESCU,OANAFIRICĂ
3. LeanandJITOperationsforEffectiveFlexiblePackagingIndustry 49 CARMENMINCU,RADUCOMĂNESCU
4. SurvivorsoftheCrisis 63 OVIDIUDÎMBEAN-CREȚA,THOMASDEVANEY 5. MacroprudentialToolsandTheirInterferencewithFiscalPolicy 99 PETREBREZEANU,CRISTINAVLAD
6. CorporateSocial(CS)andCorporateFinancialPerformance(CFP): anEmpiricalEvidencefromListedCompaniesinRomania 115 LILIANASIMIONESCU 7. AnAnalysisoftheGreekSovereignDebtCrisisandofthePossibleImpactofaGrexit 127 IONMICU 8. RomanianPolicyofHealthCareDuringCrisis 143 PAULTĂNĂSESCU

International Conference of the Institute for Business Administration in Bucharest, 2015 9
INVESTING IN MARKETING IN TIMES OF RECESSION
Ph. D. Carmen BălanThe Bucharest University of Economic Studies
The Institute for Business Administration in Bucharest
Abstract: The decision to invest in marketing when the economy is booming is easily substantiated by companies on the basis of the numerous and attractive market opportunities. Should companies facing the challenges of recession invest in marketing? Are the marketing expenditures legitimate when cost-cutting becomes a priority? This paper aims to identify the right answers to these questions. The main objectives consist in exploring the following aspects: existence of conspicuous consumption in recession; strategic choices in marketing in a downturn; influence of company size, sector of activity and entrepreneurial orientation upon the marketing options of companies; impact of marketing investment on business performance; the marketing drivers of the success stories of companies that confronted recession. In essence, marketing investments are necessary even when companies focus on cost-cutting and improving operational excellence. Decision-makers must keep balance between short-term and long-term objectives.
Keywords: marketing strategies, marketing practice, recession
JEL Codes: M30, M31
INTRODUCTIONThe business community and researchers have not reached yet a final agreement on how to define
recession. The term describes a downturn, a decline in economic activity, but is not equivalent to crisis. The majority of experts and business people consider that gross domestic product (GDP) is the
fundamental indicator of recession. Duration of the decline is also taken into account. Thus, most often, recession is defined as two consecutive quarters of decline in the GDP adjusted for inflation. This is a narrow perspective of recession.
Other institutions and experts support a broader perspective. For instance, the private research organization National Bureau of Economic Research in the U.S.A. defines recession as “[…] a significant decline in economic activity spread across the economy, lasting more than a few months, normally visible in production, employment, real income, and other indicators. A recession begins when the economy reaches a peak of activity and ends when the economy reaches its trough.” (Claessens and Kose, 2009).
Marketers focused their attention on recession trying to clarify the role of marketing during economic downturns. Four decades ago, Cundiff (1975) asked the business and academic communities the following question: “What is the role of marketing in a recession?”. He underlined that few studies addressed the impact of the business cycles on the role of marketers.
In late 1990s, research evidence underlined that marketing helps firms to “pull the firm through a macroeconomic downturn” (Pearce and Michael, 1997). Since then, an increasing number of practitioners and researchers approached this topic. Nevertheless, there is no unique clear-cut and error-free marketing strategy that may be applied successfully by all companies in recessionary times.
1. CONSPICUOUS CONSUMPTION DURING RECESSIONIn principle, one could expect that conspicuous consumption diminishes in recessionary times.
Preference for taste instead of status could be the foundation of such a behavior.However, market realities contradict this “rational” perspective. Research findings relative to the marketing
strategies applied by Louis Vuitton and Gucci during recession showed that conspicuous consumption did not diminish (Nunes, Drèze and Han, 2011). The research showed that faced with recession between January 2008 and May 2009, the two manufacturers of luxury handbags made three major decisions:

10 Building Growth through Recesison
a) to reduce the product assortment. Louis Vuitton eliminated 60% of its product lines, while Gucci cut 93%. The number of products added to the portfolio during recession was very low. Consequently, the number of product lines registered a net decline.
b) to make the brand more conspicuous. In the case of the new product lines added during recession, both Louis Vuitton and Gucci made the brand logo more prominent.
c) to increase prices. During recession, customers were charged higher prices. For example, Louis Vuitton increased on average by 12% the prices of the product lines remaining in the portfolio. The price of the new products was higher than that of the products removed by 47%. The company replaced existing products with higher-priced items. In the case of Gucci, the same price increases reached 0.5% and respectively and 16.8%.
The result of these adjustment decisions was a favorable one. The leather good divisions of both companies registered increased sales during the recession interval (Nunes, Drèze and Han, 2011). The ascending trend of sales may be explained by the behavior of two market segments: the Patricians and the Parvenus. The former segment does not have a need for status-items, but members want to associate with other Patricians. The latter segment will invest in more prominent brands in order to differentiate from those who cannot afford to invest heavily in “loud” luxury brands.
In conclusion, even if most consumer segments reconsider the allocation of their financial resources and become more interested in simplicity and thriftiness, there are segments that remain connected to conspicuous consumption both before and during crisis.
2. STRATEGIC CHOICES IN MARKETING IN A DOWNTURNWhen the economy witnesses a positive trend, companies are eager to experiment new marketing
ideas, in order to exploit market opportunities and sustain an ever increasing growth rate. Faced with recession, companies must become more creative and innovative, to find ways to deal with economic decline and financial constraints. In consumer markets, marketing strategies must be reviewed in order o identify the best options to maintain the company place in the market. Hereinafter, the strategies applied by two distinct sectors are presented. The former refers to the wine production and retailing and the latter to the luxury hotel business. The examples have been chosen to illustrate the marketing strategic choices not only of suppliers of goods, but also of suppliers of services.
A survey on a sample of 129 managers of small and medium-size enterprises specialized in wine production and retailing from major wine producing countries (such as France, Italy, Spain, Germany, Portugal as well as from USA, Chile, Argentine) revealed three perspectives relative to the adaptation of marketing strategies during times of recession (Barbat and Mora, 2010). The three perspectives rely on the following major marketing areas.
a) distribution channels. The access to the final consumer is critical for achieving success in recession. The efficient management of distribution requires the consideration of both offline and online channels, of specialized outlets and large retail chains. The wine tourism also increases in importance.
b) product features. The wine producers and retailers responded to recession in the following ways: redesigning the labels to increase readability, developing the concept of wine brand, increasing the marketing and promotional efforts, underlining the type of wine (e.g. Merlot, Sauvignon, Chardonnay etc.). All these actions aim to increase differentiation in a market marked by a diversified supply.
c) higher integration in the supply chain. The conclusion of trade partnerships among producers, distributors, retailers is an approach that develops in recession. In addition, decisions are made to better finance inventory, the credit for customers and the treasury. The practice of integration is more developed in the “New World” of wine products (U.S.A., Latin American countries etc.).
In the luxury hotel business, the most important players faced with recession do not think firstly to price discounts to maintain their revenue and profits. A survey of 211 luxury hotels in 95 countries revealed that managers would enhance added-value provided to customers rather than price incentives (Barsky, 2009). The research findings revealed the strategies considered by the luxury hotels in times of recession

International Conference of the Institute for Business Administration in Bucharest, 2015 11
and crisis:a) superior value for customers. A share of 20% of the sample would increase added-value offerings
for customers. A share of 9% would invest in renovating the properties, while 8% would cut expenditures for renovations.
b) focus on sales promotions. To stimulate demand on short-term, hotels would use sales promotion tools targeting travelers and respectively travel agents. About 19% of the sample of luxury hotels would use creative promotions and 13% would give incentives to travel agents.
c) reduced rates. Only 9% of the interviewees would decrease prices. The fact that most luxury hotels do not rely on price reductions is facilitated by the significant demand that developed lately for the luxury hotel services on global scale.
d) changes in the advertising budget. Only 4% of the respondents would increase advertising spending. However, far more managers would make the opposite decision, respectively 19% would cut advertising expenditures and 5% would cut online advertising.
The two sectorial examples show that price reductions/discounts are not the first option of marketers when companies face recession. Besides prices, all the other components of the marketing mix are reconfigured, from product portfolio to distribution system and communication tools.
3. INFLUENCE OF COMPANY SIZE, SECTOR OF ACTIVITY AND ENTREPRENEURIAL ORIENTATIONRelevant findings were generated by a study on a sample of 180 companies from the U.S.A., out of
which 1/3 of the sample consisted in industrial companies from the Fortune 500 ranking, 1/3 in service companies from the Fortune 500 and 1/3 in small business companies from the Inc. 500 ranking (Sharma, 1993). According to the survey, the adjustments vary significantly by company size and sector of activity:
a) promotional appeal. Service companies tend to respond to recession by means of changes in the promotional appeal to a larger extent than industrial companies.
b) investment in promotional tools. Investment in radio and print ads is mostly the response of service companies and to a lower extent of small enterprises.
c) distribution channels. Faced with recession, small companies are those that respond by increasing the number of distribution channels, while service companies are the least active relative to this option.
d) market segmentation. Small companies spend more efforts to segment the market than all the other companies. Compared to them, industrial companies disregard this topic.
e) diversification. To balance the effects of recession, the diversification into other products and markets is more applied by small enterprises and less by industrial companies.
In the case of entrepreneurial firms (with market shares below 0.5%), the type of marketing strategies applied before recession impact significantly the capability of those firms to recover from recession (Pearce and Michael, 1997). A survey on a sample of 118 publicly traded U.S. manufacturing firms from sectors characterized by high levels of technology and innovation (Industrial and Computer Equipment; Electrical Equipment and Components; Measuring, Analysis, and Control Instruments) led to the identification of two categories of marketing strategies that must be applied during the peak and the decline periods of the business cycle. Firstly, during both periods, entrepreneurial firms must increase their investments in sales and advertising, breadth of the assortment and geographic coverage. Secondly, strategies able to ensure business expansion and marketing efficiency are recommended.
4. IMPACT OF MARKETING INVESTMENT ON BUSINESS PERFORMANCE DURING RECESSIONThe reduction in the overall company budget seems to be the right solution to the challenges raised
by economic recession.A meta-analysis of the research relative to the investment in marketing activities during recession
revealed the need for more in-depth studies in this domain. According to O’Malley, Story and O’Sullivan (2011), “The long-term impact of marketing investment has not been sufficiently studied, nor has marketing’s pro-cyclical role.”. Nevertheless, the analysis of the extant research literature revealed the following aspects

12 Building Growth through Recesison
relative to marketing budgets during recession:a) undermining company performance. The decision to maintain profits by reducing costs may not
be the best choice in all cases. Cutting-back on marketing expenditures may undermine the position of the firm on the market. Regaining the lost position could be more costly on long run.
b) pro-cyclical vs. counter-cyclical investment in advertising. Research revealed that investing in advertising in times of recession (counter-cyclically) generates more positive results than in times of economic development (pro-cyclically). By encouraging consumer confidence and stimulating the demand, the counter-cyclical investment in advertising may diminish the duration and negative effects of a recession period.
c) investment in innovation. During recession, investment in research and development may lead to positive results. The creation of new products may stimulate demand and create competitive advantage. In addition, companies must adapt to the changes in the specific needs, preferences and behaviors of the customers.
d) investment in customer service. In order to maintain revenues and profits during recession, companies may invest in customer service. The impact of this decision consists in developing the relationships with the actual customers and preserving their loyalty. In addition, customers whose purchasing power is not affected by recession will expect excellent service, while the other customer segments will also expect an appropriate level of service.
Before cutting marketing budgets, decision-makers should carefully evaluate the short-term and long-term consequences. Six major questions require a properly-substantiated answer (Kotler and Caslione, 2009). These questions refer to the extent to which the company has made:
m detailed inventory of the growth investments of the company, to identify the sources of losses and of profits;
m assessment of the impact of the investments on the customer behavioral patterns, in order to stimulate the growth-driving behaviors;
m evaluation of the effect of own investments in overcoming the barriers to buying the company’s brands;
m right mix of levers to stimulate customer purchases, by changing customer perceptions, by creating monetary incentives and by increasing brand availability;
m most appropriate investment decisions based on their short-term and long-term effects;m searches for new profitable investment opportunities.Research shows that some companies have higher chances than others to become post-recession
winners depending on their cost strategy. Such companies are those that underline operational efficiency and cut costs while still investing in marketing and R&D (Galuti, Nohria and Wohlgezogen, 2010). The companies that cut all costs, including marketing expenditures will most probably register lower performance levels. The investments in marketing and R&D made by the segment of “progressive companies’ have positive effects on sales and profits especially in the post-recession period.
The strategic approach consisting in increasing marketing budgets when the total budget of the company is reduced is called aggressive marketing. Experts draw the attention of decision-makers over the “quality” of the marketing investment. Thus, how the budget is spent is 3-4 times more important than the total value of the investment (Aaker, 2009). The aggressive marketing may be effective and may have a favorable impact if investments are made in high potential markets that are able to generate significant return on investments.
5. MARKETING SUCCESS STORIES IN RECESSIONAn example of successful marketing strategy in downturn was provided by BMW in UK in 2010 (Tylee,
2010). The car market was extremely competitive and the BMW brand had to maintain its competitive position in front of Audi, Mercedes-Benz and Jaguar. The cause of market success was multifold:
a) less focus on price in the advertising campaigns. Success was generated by the decision of the

International Conference of the Institute for Business Administration in Bucharest, 2015 13
marketing director of BMW UK to switch from a price-driven approach at dealers’ level to strategies driven by the technical performance of the cars. BMW as well as competing brands provided customers attractive deals. However, top marketing management realized that showcasing price deals in the advertising campaigns of the dealers was counterproductive since the message of BMW focused on a premium positioning under the “Efficient Dynamics” mantra.
b) review of the advertising supplier. In times of recession, the company questioned the three-decade relationships with WCRS, its provider of advertising services. The performance of every supplier including WCRS had to be reviewed periodically.
c) transparent strategy towards stakeholders. BMW UK conveyed a clear message to the most important categories of stakeholders: consumers, dealers and employees. The orientation towards ensuring a high level of customer satisfaction was reiterated. Car dealers were reassured of the solid support provided by BMW UK. Employees were also informed about the priority direction of the company.
d) differentiated targeting approach. Being aware of the emergence of different segments in the automotive market and of their specific needs, BMW started to provide different solutions for specific segments. Thus, instead of selling more of one successful product, respectively the original 3 series model, the company diversified its offering with coupé and convertible models. On the 4x4 market, BMW expanded its market share with “XL”, a crossover SUV”.
e) integrated marketing communication. The company started to consider blending several new marketing communication tools with the traditional communication mix. Within the context of the Olympic games organized by UK in 2012, BMW developed its Facebook presence and interactions with customers.
Another company that successfully dealt with recession is the German-origin discounter Lidl on the Scottish market. The marketing strategy consisted in the efficient management of distribution and logistic costs (Gibb, 2013). This strategy referred to the following marketing areas:
a) one distribution center. All the Scottish operations of Lidl are centralized in the distribution center of Livingston that has 229,000 sq.ft.
b) one delivery per day. Each of the 88 Lidl store in Scotland receives one delivery per day only. c) economies of scale in transportation. Every lorry leaves the warehouse only if loaded with
merchandise at full capacity. If a store does not order merchandise at the full capacity of the lorry, the centers adds several products that are expected to sell well that day. On their way back to the center, lorries take the waste from stores and bring it to the recycling center of Lidl.
d) narrower product assortment. In order to decrease costs, Lidl sells only 1,800 lines, a far less diversified range of products compared to the assortment of supermarkets, which consists in 25,000-50,000 lines.
e) multi-task personnel. Each Lidl store may have 3-10 people dealing with everything.f) close suppliers. The logistics costs are carefully managed by selecting suppliers from UK and in
close proximity to the stores. In addition, compared to other retailers such as Marks & Spencer, Lidl does not use expensive means of transportation such as airplanes to supply fresh fruit from far-away suppliers.
Another success story in recession is related not only to the marketing strategies but also to the marketing industry, respectively to the branding service sector. The company is Kinesis that was founded in the year 2000, in Portland (U.S.A.). The success consists in making a profitable transition from a red ocean to a blue ocean market space (Chan Kim and Mauborgne, 2015). Before recession, the company provided branding services to every type of potential customer, being focused on winning projects rather than on differentiation and sustainable cash flow and business. The recession forced the company to find solutions for two problems. The former was the overcrowded market, the competition being extremely intense. The latter was the change in the behavior of customers who started to consider that investing in branding services was unnecessary in times of recession. The main shifts accomplished by the company in its business were the following:
a) creating a new demand and identifying former noncustomers. Kinesis found a blue ocean in connecting marketing not to marketing managers, but to company executives. Previously, the customers

14 Building Growth through Recesison
of Kinesis and of other similar providers of branding services were the marketing managers. Previously, the head of the company was nor a target customer, but became the target noncustomer on which the blue ocean opportunity relied. Thus, the company created an offering that did not exist before and targeted noncustomers without applying to marketing managers as “intermediaries” of the relationships with the CEOs.
b) new offering. Kinesis provided branding services like an in-house employee without being on the company’s payroll. The marketing processes were transferable to the client organization.
c) focus on smaller customers. The company started targeting the segment of customers that was not addressed by the large providers of branding services. Small and mid-size companies were formerly non-customers for the leaders in this marketing industry.
d) productizing services. In the red ocean that characterized the traditional market of branding services, companies had cash flow problems because customers paid one or two months after receiving the service. According to its new business model, Kinesis turned from a “service philosophy” to a “product philosophy”. The aim was to ensure financial sustainability based on the payment of “products” in advance by customers.
The major achievement of Kinesis consists in a radical change in its business model. Success is proven by the significant growth the company has achieved since 2011. The revenue evolution was reversed from a revenue decline of 14% in 2010 to an increase of 32% in 2014.
6. CONCLUSIONS Several conclusions may be drawn relative to the role and specific features of marketing in recession.a) Investments in marketing are necessary. Both marketing managers and chief executive officers
must be aware that investments in marketing during recession are a must not just an option. The role of marketing focuses mainly on accomplishing objectives such as: protection of the position acquired in the market; maintenance of the existing customers; discovery and exploitation of new market opportunities; identification of blue oceans to ensure the sustainable development of the company.
b) Investments in marketing may be associated with cost-cutting initiatives at company level. Research shows that marketing expenditures are still legitimate when cost-cutting becomes a priority. Thus, aggressive marketing makes sense on condition that both the value and quality of the investment are considered.
c) Consumer behavior patterns change due to recession, but there are also signs that indicate continuity in behavior. In principle,due to fewer financial resources, most consumers tend to modify their consumption. Nevertheless, there are also segments of customers that are still “engines” of conspicuous consumption. To meet such demand, companies have to take into account that those buyers are status seekers. Thus, assortment reduction, more prominent brands and price increases will very likely increase the sales and profit potential for these companies.
d) Marketing decisions in recession must be creative and innovative. To maintain or increase competitiveness in a market marked by recession, companies must design and implement new strategies. The array of options go further than price discounts. All the marketing mix components are potential sources of value for both the company and its customers.
e) Investments in marketing impact the capability to recover from recession. The results of the investments in marketing are sometimes less obvious during recession. However, the efforts deployed for recovery are more successful if marketing investments are cleverly made. At the same time, counter-cyclical investment in advertising may stimulate demand, increase consumer confidence and diminish the negative effects of recession.
f) The investments in marketing during recession should not be limited to advertising. Investments in innovation, customer service and marketing communication may generate superior value for customers. Targeting new customer segments, reviewing positioning and reconfiguring the marketing mix components are all possible options to adjust the marketing strategies in recession with positive outcomes for the company and for its customers.

International Conference of the Institute for Business Administration in Bucharest, 2015 15
During recessionary times, marketing should be an integral part of the strategic and operational decisions of each company. Cutting all the marketing expenditures will only “liberate” some resources, but with negative consequences on short and medium term. Becoming a winner in the post-recession period requires careful marketing choices based on a thorough understanding of the consumer behavior patterns. Smarter choices relative to the marketing tools to be used during recession will support companies’ efforts to increase overall business effectiveness and efficiency while keeping control over the available budget.
REFERENCESAacker, D., 2009. Aggressive recession marketing: When does it make sense? Marketing News, p.11.Barbat, V. and Mora, P., 2010. Marketing et récession, une exploration de la perception et des réponses des
PME de la filière viticole. Revue Française du Marketing, 228, pp. 17-34.Barsky, J., 2009. Luxury Hotels and Recession: A View From Around the World, [online] Available at: <http://
repository.usfca.edu/ml/>2 Accessed [12 July 2015].Chan Kim W. and Mauborgne, R., 2015. How one company turned recession into an opportunity – and
thrived. [online] Available at: < http://knowledge.insead.edu/strategy/how-one-company-turned-the-recession-into-an-opportunity-and-thrived-3946> Accessed [12 July 2015].
Claessens, S. and Kose, M.A., 2009. What is a recession? Finance and Development, 46(1). [online] Available at: <http://www.imf.org/external/pubs/ft/fandd/2009/03/basics.htm #author> Accessed [12 July 2015].
Cundiff, E.W., 1975. What is the role of marketing in a recession.Journal of Marketing, 39, p.1. Galuti, R., Nohria, N. and Wohlgezogen, F. (2010).Roaring Out of Recession.Harvard Business Review. Gibb, B, 2013. German Food Giant Lidl is one of the success stories of the recession. Available at: < http://
www.sundaypost.com/news-views/scotland/german-food-giant-lidl-is-one-of-the-success-stories-of-the-recession-1.119423> Accessed [12 July 2015].
Kotler, P. and Caslione, J.A., 2009. How marketers can respond to recession and turbulence. Journal of Customer Behavior, 8(2), pp. 187-191.
Nunes, J.C., Drèze, X. and Han, Y.J., 2011. Conspicuous consumption in a recession: Toning it down or turning it up? Journal of Consumer Psychology, 21, pp. 199-205.
O’Malley, L., Story, V. and O’Sullivan, V., 2011. Marketing in a recession: retrench or invest? Journal of Strategic Marketing, (19)3, pp. 285-310.
Pearce, J.A. and Michael, S.C., 1997.Marketing strategies that make entrepreneurial firms recession-resistant.Journal of Business Venturing, 12, pp. 301-314.
Sharma, A., 1993. Marketing strategies during recession: A comparison of small and large firms. Journal of Small Business Management, 31(3), pp. 62-72.
Tylee, J., 2010. Why the recession has been so good to BMW? [online] Available at: <http://www.campaignlive.co.uk/news/1032076/> Accessed [12 July 2015].

International Conference of the Institute for Business Administration in Bucharest, 2015 25
BUILDING QUALITY THROUGH RECESSION IN THE EMBA PROGRAM BASED ON ASSESSMENT OF LEARNING
Ph. D. Dalina DumitrescuThe Institute for Business Administration in Bucharest
The Bucharest University of Economic Studies
Ph. D. Oana FiricăThe Institute for Business Administration in Bucharest
Abstract: The financial crisis and the recession period put a huge pressure equally on the business schools to survive in the context of drop in enrolment and on the enrolled students – managers in the Executive MBA programs fighting for the profit and performance in their companies. The basic research question of the paper refers to the assessment of learning (AOL) results as an illustration of the efforts of the business school to maintain the quality of knowledge transfer and students’ learning during crisis and recession. The paper presents how The Institute for Business Administration in Bucharest (IBAB) used the results of learning assessment and the steps taken to maintain the level of the learning quality during tough times.
Keywords: managerial education, assessment of learning, program learning goals, curriculum continuous improvement, crisis and the quality of business education
INTRODUCTIONOutcome based measurements of learning are particularly important for business schools because they
can provide external constituents (current and potential executive students, trustees, public officials, accreditation agencies, employers, sponsoring companies) the evidence that the organization is achieving its education mission (Dumitrescu & Duhaneanu, 2010).
In order to identify if the learning goals have been achieved or not a selection of program-level assessment techniques are used. The purpose of this paper is to illustrate how The Institute of Business Administration in Bucharest (IBAB) maintained the quality of learning, by means of AOL techniques implemented at the Dissertation exam, sustained at the end of the Executive Master of Business Administration program.
For business education, one of the most important effects of the financial crisis and the recession period is the huge pressure equally on the business schools to survive in the context of drop in enrolment and on the enrolled students – managers in the Executive MBA programs fighting for profit and performance in their companies. The basic research question of the paper refers to the assessment of learning (AOL) results as an illustration of the efforts of the business school to maintain the quality of knowledge transfer and students’ learning during crisis and recession. The paper presents how IBAB used the results of learning assessment and the steps taken to maintain the level of the learning quality during tough times.
THE CONCEPTUAL BASE OF THE APPROACHContinuous improvement is processes used to measure at what extent the students attain the learning goals
assumed by the school and based on those results plan the future improvement efforts (Handy & S.Polimeni, 2012).
Two basic approaches can be used in measuring learning: direct assessment and indirect assessment (Martell & Calderon, 2005). In the indirect approach, evidences about the learning results, learning experience and learning environment are collected from students, alumni and employers using specific instruments such as: surveys, questionnaires, interviews, and focus groups. In the direct approach, assessment is based on the demonstration of student knowledge or skills. Existing assignments such as oral presentations, exams, projects, portfolios can provide the basis for data collection. There is a preference for the direct approach in outcomes
26 Building Growth through Recesison
assessment. In the present paper it is illustrated the use of direct assessment model.AOL realizes multiple objectives (Moskal, Ellis & Keon, 2008):m Increasing stakeholders’ confidence making transparent what skills, abilities, information and attitudes the
graduates are expected to get, by specifying the learning goals at program level (“the promises”);m Applying systematically AOL to provide various interested third parties the empirical evidence of student
knowledge and skills, and consequently feedback about the quality the program has achieved (“the achievements vs. promises”);
m Providing evidence-based information about the quality of learning process to sponsoring companies interested to expose its high potential employees to a targeted managerial education and/or to employers who seek a certain type of qualified graduates. The evidence of certain competencies typically consists of assessments of students’ performance.
The specific tools used in the AOL are structured in such a way that educational standards are established and maintained. Very often, the disseminated information regarding the results of the AOL, seen as “hard evidences” about the quality achieved in the transfer of knowledge foster employee and student pride in their institutions. The results are a strong base for continuous improvement of curriculum, pedagogy and program as a whole for permanent maintenance of what is learned and done in the program with the ever changing demand in the market in terms of qualifications.
All these objectives and consequences were considered when the instrument of measurement used in our research was developed and applied.
The time frame for collecting data was a period of time of seven years, 2008-2014 considered of interest in order to see if the assessed quality of education results changed during the crisis and recession.
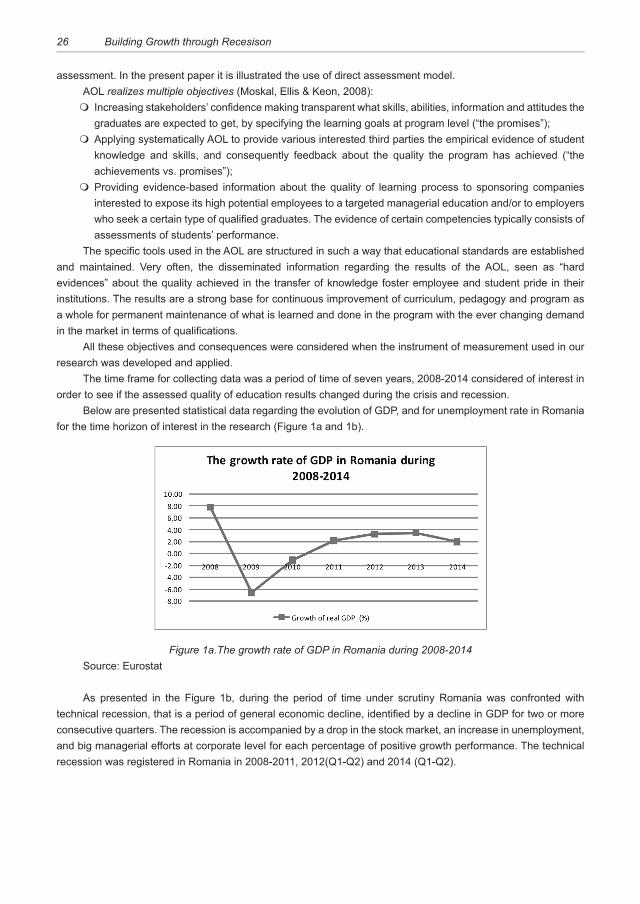
Below are presented statistical data regarding the evolution of GDP, and for unemployment rate in Romania for the time horizon of interest in the research (Figure 1a and 1b).
Figure 1a.The growth rate of GDP in Romania during 2008-2014Source: Eurostat
As presented in the Figure 1b, during the period of time under scrutiny Romania was confronted with technical recession, that is a period of general economic decline, identified by a decline in GDP for two or more consecutive quarters. The recession is accompanied by a drop in the stock market, an increase in unemployment, and big managerial efforts at corporate level for each percentage of positive growth performance. The technical recession was registered in Romania in 2008-2011, 2012(Q1-Q2) and 2014 (Q1-Q2).

International Conference of the Institute for Business Administration in Bucharest, 2015 27
Figure 1b. The quarterly evolution of GDP growth rate in Romania during technical recession (2009 Q1 to 2014 Q2)
Source: Eurostat
The evolution of selected indicators gives, from a macroeconomic perspective, the image of the tensions in the economic environment and the effects of adjustments. It is noticeable that Romania after an abrupt decrease in the economic growth entered technically in a recession and posted a very slow growth considered from year to year perspective. All type of businesses were confronted with the restrictions and challenges of an economic environment in constriction and adopted severe operational measures. The business schools were exposed to a double pressure- from outside and from inside: the outside main pressure was represented by the fact that during crisis and recession fewer companies in Romania allocated budgets for training, the enrollment dropped and consequently their revenues with cascading internal effects. IBAB suffered the same constraint (Figure 2).
Figure 2. The IBAB enrollment during 2008-2014Source: IBAB internal data
The inside pressure was mainly determined by the specific double position of the students: the enrolled participants in the EMBA Program are in the same time managers exposed to the pressure to give performance to the company where they were involved in the operations and decision process, therefore a potential effect could have been less personal time allocated to learning process. Not rarely the adaptive restructuring activities to the business environment supposed measures affecting the human resources capabilities of the companies. During the same period of time, the unemployment rate was above 7%, indicating that coping with the slow growth of economy the number of unemployed persons increased (Figure 3).

28 Building Growth through Recesison
Figure 3. The unemployment rate in Romania during 2008-2014Source: Eurostat
Our research questions is related to the findings that concludes that “learning is essentially situated in and is thus a function of the physical and social context implying that the best way to learn would be within the ‘context’ of everyday practice” (Singh, 2013). The same approach is developed by Lemke (Lemke, 1994), who stated that learning is an activity that happens in eco-social context; that is the learning context in all its systemic dimensions, ranging from the personal to the social, and is aimed at processes of meaning-making.
It is a difference between the assessing process for student work in a course and assessing students work for program learning goals achievement. For class or course, each individual student is assessed based on criteria and standards established by the professor teaching the course.
For program assessment, the group of faculty determines explicit criteria for evaluation, which is done by a commission of professors or by an outsider and the feedback goes to program faculty and managers. If the number of students is high sampling is used at the program level. In our research given the relatively reduced number of students we used the results of the entire population.
The general approach for program learning assessment supposes multiple steps as follows (Alsup, Dumitrescu & Firica, 2011):
Step 1. Identification of program learning goals and objectives started from the mission of the school and from the corresponding competencies IBAB expected students to achieve at graduation.
Step 2. Alignment of curricula with learning goals was done by mapping the courses in the program to the learning objectives seen as measurable indicators of the learning goals. Learning goals reflect the outcomes expected from the program, such as the knowledge, skills, and attitudes faculty want students to gain from the program; learning objectives present what students must do to demonstrate proficiency in a given area.
Step 3. Identification of assessment instruments and measures. Using the recommendations of AACSB International1, IBAB applied direct methods of assessment. In the present research the instrument is Dissertation Assessment Matrix and Rubric applied to the Dissertation exam.
Step 4. Collection, analysis and dissemination of assessment information Based on the results collected through a process with the above presented steps, the research question
addressed in the paper is if the quality of student learning in the program changed during the crisis and recession period of time as measured by AOL methods applied at the end of the program and measured during the Dissertation exam.
DATA AND METHODOLOGYThe data regarding the AOL results have been collected for the horizon of time 2008-2014 based on the
instrument named Dissertation Assessment Matrix and Rubric applied to the final exam in the program, the Dissertation exam.
1 Association to Advance Collegiate Schools of Business

International Conference of the Institute for Business Administration in Bucharest, 2015 29
The Dissertation exam is formed of two parts: a complex written, investigative report, the Dissertation paper, with all relevant information structured like a case study, submitted in advance, and an oral presentation to defend the report and highlight the main findings and personal contribution regarding the business decisions to solve the dilemma captured in the case. The Dissertation paper is coordinated by a professor and the exam is public.
The Dissertation Assessment Matrix and Rubric is:m Formal assessment and grading instrument for the final, summative, end of the Program exam. It contains
ten questions;m Ensuring consistency in assessment and grading disregard the field the reports addressed in the
Dissertation; ensuring consistency in assessment and grading among the faculty members in the Dissertation commission;
m Ensuring consistency in assessment and grading in time whichever would have been the members in the Dissertation commission.
According to the best practices, data collection at regular intervals - yearly in the case of our research - enables trends to be identified and examined, which provides important information for program improvement. An advantage of this type of assessment is that faculty can assess multiple learning objectives.
Three learning goals are under scrutiny and evaluation: Business acumen, Written communication and Verbal communication. The Business acumen is assessed by questions Q7-Q10 of the matrix. The learning outcomes related with each question are presented in the table below:
Question The objective on focus- Business acumen Learning outcomes-logic and details for assessment
Q7 Case study content The understanding of different business practices, principles and the ability to
identify, select and present as evidence quality information
Q8 Case study analysis The understanding and demonstrated mastery and use of different business
models studied in the EMBA Program to solve the identified dilemma
Q9 Proposed decision and course
of actions
The appropriateness, the quality, complexity and argumentation of the
solutions, conclusions, recommendations and implications
Q10 Coping with the challenges The ability to answer to different questions challenging the data, solutions
and their grounds and the course of actions
The learning goal Communication- Written communication is assessed by the use of the question Q6:
Question The objective on focus – Written communication Learning outcomes-logic and details for assessment
Q6 The Dissertation paper –
Final project – format
The proper format of the Dissertation in line with the requirements stated in
advance
For the oral presentation each student has an interval of 25 minutes to present the business context, the dilemma and the proposed decisions and course of actions. The oral presentation was used for the assessment of the learning goal Communication- Verbal communication, by the use of the questions Q1-Q5.
Question The objective on focus- Verbal communication Learning outcomes-logic and details for assessment
Q1The oral presentation- the quality of introduction and
organization
Oral presentation skills – motivating the audience to listen and the logical structure of the presentation
Q2 The oral presentation- the quality of content
Oral presentation skills – including significant facts, appropriate data and information
Q3 The oral presentation- quality of slides/ visuals aids Oral presentation skills – following guidelines for professional visual aids
Q4
The oral presentation- the quality of presentation’s
conclusions and recommendations
Oral presentation skills – synthesis of the decision making process of the business case
Q5 The oral presentation- quality of the delivery
Oral presentation skills – the professional way of delivering the presentation and compliance with the time limit

30 Building Growth through Recesison
Dissertation Assessment Matrix and Rubric has been used for all the interval of time 2008-2014 with minor changes due to the continuous improvement process. The modification in the Matrix were done to better capture in the assessment the elements of quality or the requirements presented to the students before starting the preparation of the Dissertation paper or to make them clearer the expected requirements for some assessment criteria. For example in 2013 the Q10 was changed because in time the students were very concerned to present the content of the Dissertation paper, but paid less attention to the quality of the answers to the questions addressed by the commission in order to challenge the approach in the proposed solution:
Before change: After change:
Q10 How well did the presentation capture the quality of the Final Project?
How well did the student perform during the questions and answers session?
In the same approach, in 2013, for Q6 the requirements regarding the proper structure of the Dissertation were enlarged with clearer specification related to citation and referencing rules.
The assessment criteria were explained and included on the project instructions handed to students and faculty advisors in advance.
The method involves the conversion of elements of assessment technique, as recommended by AACSB International, in letter grades. In the AOL process of high importance is to establish a rubric scale that communicates students exactly what is expected of them on assessment criteria. A rubric is a scoring guide: a list or chart that describes the criteria and the expectations used to score an assignment. It includes what faculty is looking for when they evaluate an assignment. In addition to serving as a grading guide, rubrics serve to communicate the faculty’s expectations for an assignment. Therefore, rubrics not only serve as a “template” allowing to grade assignments more efficiently, they create consistency in grading as the scoring criteria are clearly established. The existence of rubrics is extremely important for ensuring consistency in assessment both in time and between the members of Dissertation commission.
For example, to assess the learning objective Communication – Verbal communication, the learning outcome “ability to capture in the oral presentation the content of Dissertation paper” (objective changed in 2013) the corresponding rubrics were:
Excellent (5) The whole Dissertation paper is clearly understood by the audience in terms of dilemma, methodology, basic assumptions, relevant data, main conclusions, recommendations and implications.
Above Average (4) The presentation captures the case, the dilemma with conclusions but with not quantitative or
qualitative arguments.
Average (3) The presentation captures only the general story from the case with brief conclusions.
Below Average (2) The presentation is a general presentation of the Dissertation paper, with no relevant elements.
Poor (1) There is no connection between the presentation and the Dissertation paper in term of topic or
development.
Each year the Dissertation commission was formed of 4 faculty nominated by the rector except the years 2010, 2011, 2012 when in line with the Romanian accreditation rules the commission was formed by 9 members: 6 faculty form IBAB and 3 professors from other reputed universities, specialized in business administration, nominated by the Romanian accreditation agency.
During the Dissertation exam the assessment is performed in real time by each individual member of the faculty commission, using the Dissertation Assessment Matrix as instrument and Rubrics as guide for rating the assessed elements on a 5-point Likert scale. For the consistency in the interpretation of results, the meaning of the marks on the Likert scale is presented below:
1 2 3 4 5
Poor Below
average
Average Above
average
Excellent

International Conference of the Institute for Business Administration in Bucharest, 2015 31
No consultation or adjustments take place between commission members. At the end of the exam the filled in document for each student are collected and the final grade calculated based on these documents.
RESULTS AND FINDINGSThe analysis in this paper focuses on the judgments based on the results and findings at the Learning Goal
(program) level. Thus three values were identified for each Learning Goal and year: m the average grade, by calculating the mean of all the items corresponding to a Learning Goal (LG) per
student, and then taking the average per year;m the maximum grade, by calculating the mean of all the items corresponding to a LG per student, and then
taking the maximum per year; m the minimum grade, by calculating the mean of all the items corresponding to a LG per student, and then
taking the minimum per year.
a) Results regarding the LG Business AcumenAs previously mentioned in the Assessment Matrix the LG Business Acumen was assessed through
questions 7 to 10 .The measurements and the judgments are done at program level: here not the individual result is important but the results of the whole group of assessed students and this for the aggregated results at each subsequent questions used in the assessment of the LG).
The graph in the Figure 4 shows the evolution in time for the minimum, average and maximum values.
Figure 4. Assessment at program level for LG Business Acumen
The averages show that Business Acumen was assessed between “above average” and “excellent” on the Likert scale in all 7 years. The range of averages was 4.12 in 2011 to 4.65 points in 2014. It is to be mentioned that in 2011 Romania registered the highest level of unemployment rate (Figure 3) and that it has been the first year with positive GDP growth after the crisis (Figure 2). It is possible that the increased number of Commission members during 2010-2012 influenced the assessment, but in the same period of time the economy was confronted with technical recession and the individual effect each factor can not be insulated. The trend of averages shows a continuous improvement process.
In the years when the number of Commission members was 9 the average maximum number of points for Business Acumen was rated “above average”. In all the other years there were students assessed at “excellent” level.
Interesting results are related to the average minimum number of points: in 3 out of 7 years there were assessments at “poor” and “below average” level, in the rest of 4 years there were assessments at average level. In all the three years where the Commission was formed of 9 members there were no assessments “below average”. Here was the starting point for improvement measures mentioned before.

32 Building Growth through Recesison
b) Results regarding the Learning Goal Written communicationThe trends for annual average, maximum, and minimum points are shown in the Figure 5.
Figure 5. Assessment at program level for LG Written communication
The average number of points at the program level for the LG Written communication shows “above average” and “excellent” level in all 7 years. The range of averages was 4.06 in 2008 to 4.65 points in 2014. The identified trend shows a continuous improvement process.
In 2008 and two years (2011 and 2012) when the Commission was formed by of members the maximum number of points was situated in the “above average” lane, while in the rest of the four years at “excellent” level. The identified trend is increasing.
The average minimum number of points: in 4 out of 7 years there were grades at “poor” and “below average” level; in the rest of 4 years there were students ”below average” level. In the third year when the Commission was formed of 9 members, 2012, we can notice the first jump of minimum, showing that all students were at least at “average” level. The efforts to improve the content of Q6 resulted in a better understanding of requirements of Written Communication, therefore better results.
c) Results regarding the Learning Goal Verbal communicationIn The Assessment Matrix the LG Verbal communication was assessed through questions 1 to question 5.
The trends for annual average, maximum, and minimum points are shown in the Figure 6.
Figure 6. Assessment at program level for LG Verbal communication
The average number of points for the LG Verbal communication shows that the achievement of this objective was assessed between “above average” to “excellent” in all 7 years. The range of averages was 4.06 in 2011 and 4.54 points in 2014. The identified trend shows a continuous improvement process.

International Conference of the Institute for Business Administration in Bucharest, 2015 33
The average maximum number of points was situated in the “above average lane”, except two years: 2009 and 2014. In the rest of the years, there were students assessed at “excellent” level.
The average minimum number of points shows that in 3 out of 7 years there were students rated at” below average” level; in the rest of 4 years the students were assessed at “average” level as minimum quality in the cohort. When the Commission was formed of 9 members we can notice that there were students assessed at “average“ level, with the exception of the year 2011. The efforts to improve the weak aspects of learning are evident by the upward trend of the minimum values in time.
d) Results regarding the assessments of the three LGs on selected horizon of timeThe analysis of the assessment of the three LGs in time is, in our perception, a good opportunity to identify
the contribution of the corresponding assessment to the final grade based on the total points obtained by assessment and identification on the learning objectives where faculty made efforts for improvement. Below are the three graphs showing the three Learning Goals analyzed (Figure 7, 8, and 9).
Figure 7. Assessment at program level for the three LGs based on average assessment points
The average number of points per LG at program level in each year is very closed showing the fact that the performance of the students in the program for the three LGs is much closed, increased in time and positioned in the quality segment “above average” to “excellent”.
Figure 8. Assessment at program level for the three LGs based on maximum average
Starting with 2010 no student was assessed by all the commission members as “excellent” in Business Acumen until 2013; only in 2009 and 2014 at least one student was assessed in unanimity by the Commission as complying with the quality requirements at “excellent” level.

34 Building Growth through Recesison
Starting with 2009 until 2012 for the LG Verbal communication the average maximum number of points granted by the commission was continuously declining and after that it has continuously improved until 2014 when at least one student got from all the members of the Commission the “excellent” appraisal. The same trend is evident for the LG Written communication but the efforts for improvement took place sooner and in line with the ranking specified by the rubric matrix the assessment was positioned by some of the Commission’s members at a superior level.
The efforts for improvement must be continued on LG Verbal communication – here no student has been assessed by all the commission members at “excellent” level. The analysis at the question level could identify the gaps for future improvement actions.
Figure 9. Assessment at program level for the three LGs based on minimum average points
The minimum assessment points represent the average number of assessment points received by the students that in each corresponding year were measured by the members of the Commission as complying with the quality requirements defined by the grading rubrics at the lowest level. It is to be noticed that starting with 2011 the minimum average assessment points at the program level for the three LGs are closer and closer to one another and increased in value on the quality scale. Those trends show efforts of continuous improvement in the tutorial activity given by the Dissertation advisors oriented toward the requirements in the rubrics captured by the consistency in assessment phase.
CONCLUSIONSThe paper analyzes the evolution in time of three essential Learning Goals assessments (Business Acumen,
Written and Verbal communication) at IBAB and found that the actions taken to maintain and improve quality proved fruitful. The horizon of time on focus for the analysis captures a very complex and dynamic business environment confronted with crisis and recession. During the learning process, the faculty in IBAB followed consistently the quality requirements and was implicated in continuous improvement plans. Even if students were put under big pressure in recession time, in their work place, they were able to prove that they acquired in the school knowledge, skills, and attitudes that help them cope with difficult business situations.
The AOL procedures are extremely important as base for grading but also for continuous improvement of educational activity. They overcome the topic and student level and refer to the achievements at the program level, targeting the mission of the business school –to prepare well equipped managers for the business environment at any stage.
The comparability and consistency in time of the results are due to the use of the same proper instrument: Dissertation Assessment Matrix and Rubric that insures quality of the assessment process.
As long as the assessment instruments are consistently used the number of members in the Dissertation Commission does not influence the results of AOL. However, the assessment results are sensitive to the number of assessed candidates.

International Conference of the Institute for Business Administration in Bucharest, 2015 35
At Program level, the average number of assessment points are very closed for the three LGs, they are indicating that, in general, the graduates possessed the skills, information and abilities required by the description in the rubrics, at a level “above the average“ to “excellent” and the trend shows continuous improvement efforts. The quality is maintained even in recession time.
The maximum number of assessment points is situated constantly in the “above average” and “excellent” area, the range being 4.72 to 5. This proves that in each year there are extremely performing, mature students, able to make informed decisions and to communicate those decisions in a convincing manner, verbally or in writing.
For all the three Learning Goals the average number of points is closer to the maximum, than to the minimum level. This shows that the improvement actions were consistent in time and had the chance to improve performance.
At Program level the assessments related to the three LGs on a horizon of 7 years shows a continuous effort for improvement.
REFERENCESAlsup, R., Dumitrescu, D., Firica, O. (2011). Managing Change with Assurance and Assessment of Learning: IBAB
an Executive MBA Case Study. Proceedings of Conference The 7th International Conference Management of Technological Changes – MTC 2011.
Dumitrescu, D. & Duhaneanu, M. (2010). Building mission driven curricula through International Partnerships – Case Study: IBAB (ASEBUSS) & KSU. Proceedings of The 2nd International Conference: Institutional Strategic Quality Management - ISQM2010, vol I, 203-2011.
Handy, S. A. & S.Polimeni, R. (2012). Direct Assessment Techniques for Course-Level Learning Goals and Objectives as Applied to Accounting Programs. Journal of the Academy of Business Education.
Handy, S., Katz, R., Polimeni, R. (2008). Guide for Accounting/Taxation Programs Assessment Using Learning Goals and Objectives. Journal of the Academy of Business Education, 89-105.
Lemke, J. (1994). Semiotics and the deconstruction of conceptual learning-J Accel Learn Teach.Martell, K. & Calderon, T. (2005). Assessment of Student Learning in Business Schools: Best Practices Each Step
of the Way (Vol. I). AACSB International, ISBN 882393.Moskal, P., Ellis, T. & Keon, T. (2008). Summary of Assessment in Higher Education and the Management of
Student-Learning Data. Academy of Management Learning & Education, Vol. 7, No. 2, 269–278.Singh, P. (2013). Environmental Education: Enhancing Learning. 26, 299–314.Suskie, L. (2004). Assessing student learning: A common sense guide. Bolton:Anker.

International Conference of the Institute for Business Administration in Bucharest, 2015 49
LEAN AND JIT OPERATIONS FOR EFFECTIVE FLEXIBLE PACKAGING INDUSTRY
Ph. D. Carmen MincuThe Institute for Business Administration in Bucharest
Radu Comănescu, EMBAArtema Plast, Gerosa Group
Abstract: The paper attempts to make an instrumental case in the area of lean and Just-In-Time operations in the flexible packaging industry. Lean operations, process mapping and streamlining, competing with time in delivering customer service, are discussed in the paper in order to highlight alternatives to manage costs in producing flexible packaging to deliver upon customer value.
Keywords: Operations Management; Lean and Just-In-Time Operations; Process Mapping
JEL Codes: D23, D24, M1, L2
Motto: “The most dangerous kind of waste is the waste we do not recognize.” Shigeo Shingo
MEAN, LEAN, GREEN OPERATIONSA long-established approach to planning and scheduling is based upon convening demand into appropriate
batches or orders, and then assigning the work to available capacity in sequence, starting with the first stage of production process. The problems that arise are traditionally solved by using stock - either raw material stock, finished goods stock, or inter-stage buffer stocks. The practice of block scheduling, so that each process stage takes a specific time unit, generates large work-in-progress stocks in order to fulfill the desire to maintain high equipment utilization and thus low unit costs, paradoxically with driving up the costs associated with stockholding, to the point where unit costs are even higher. Additionally, the lack of responsiveness brought on by the inertia of the system can adversely affect competitive advantage. There is a minor advantage in utilizing machinery and labor fully if the result is merely large quantities of work-in-progress stock because of bottlenecks further down the process, or large quantities of finished goods with no immediate prospect of sale. (Galloway; 1993) The Japanese development of Just-In-Time (JIT) has addressed these shortcomings, by directing attention to throughput rather than utilization. The key element of a JIT system is quality that is ingrained in both the product and the process. Zero waste may well be unattainable, but the underlying philosophy is one of continuous development of lean operations. Inventories must be seen as a bad excuse for poor planning, inflexibility, wrong machinery, quality flaws etc. The aim of JIT is to speed up customer response, while minimizing any waste in inventories, machine and operator idle time and set-up time, scrap and rework. Lean operations would hence, maximize the value added by each of a company’s activities by removing waste and delays (Figure 1).
Implementation of ‘zero waste’ operations draws close attention to several areas: inventory reduction, smaller batch sizes, quality control, complexity reduction and transparency, flattering organization structure and delegation, waste minimization. (Mincu; 2006) Outstanding techniques are at the disposal of management to mitigate the avatars of these areas: analysis of logistical parameters, simulation, workflow analyses, material flow analyses, information flow analyses, production flexibility analyses e.g. SMED3, task analysis, pull control systems at production level e.g. Kanban4.
3 Single Minute Exchange of Dye. Originating in Japan, SMED is a method of reducing change over time, whereby activities needed to produce new products are either eliminated (where possible), or carried out parallel to the production process
4 A Japanese planning technique based on the principle that components should not be manufactured until they are needed, the ultimate goal being tighter control of inventories. Kanban is the Japanese for the cards associated with containers with parts across a production process to clear a specific production step; only when in possession of such a card is the store authorized to replace the container. The assembly schedule ‘pulls’ production through the system

50 Building Growth through Recesison
Figure 1. Core elements of lean and JIT operations
In the following sections, the authors will highlight promptly the considerations previously made on JIT and lean operations on the example of flexible packaging operations.
FLEXIBLE PACKAGINGThe flexible packaging industry has always represented a battlefield for niche specialists that dare to venture
since numerous variables and factors influence and determine the product coordinates. (Comӑnescu; 2015) The flexible packaging production lines typically process pre-produced (extruded) films of polypropylene, polyethylene, polyester, aluminum etc., print, laminate and cut them, and eventually – if required by customer, make bags and pouches customized to the customer’s order. Manufactured from hydrocarbon, plastic represents the raw material for flexible packaging industry and continues to stay connected to the price of oil and gas. The oil price has declined since mid-2014 as a major shock to the global chemical industry. Many producers were underprepared for both the magnitude and speed of the impact on their businesses, on the background of wild volatility in the oil market. These so-called return-to-normal oil prices were expected to prevail in the market in the medium term being driven by fundamental changes in the supply and demand dynamics of the oil industry (Figure 2).
Figure 2. Impact of oil-related evolutions in the chemical industries5
5 http://www.mckinsey.com/insights/energy_resources_materials/oil-price_shocks_and_the_chemical_industry_preparing_for_a_volatile_environment

International Conference of the Institute for Business Administration in Bucharest, 2015 51
As seen in McKinsey research in Figure 2, while the oil price went down, the raw material for the flexible packaging sector price should have recorded a drop in prices of 15 to 30 percent within a period of up to four months. Yet, a shortage in supply along to a sudden increase in demand have surged on the background of three main drivers: the Euro devaluation exceeding 25 percent against the US Dollar (as the reference currency for all oil transactions from the Middle East), the seasonal factors, and stock building at several European players in the industry in anticipation of further price increase and supply shortages. These have generated not a decrease but an increase of raw material prices of 33 percent in e.g. only three months (between March and June 2015). (McKinsey; 2014)
Due to lack of consumption and a constantly decreasing population, the Romanian packaging market was not tempting enough the international companies. It was only in the last ten years the multinationals decided to enter the market – although in a very cautious manner - by purchasing well-established companies. Their main goal was to displace orders from the more costly production site in Western Europe to a better cost-effectiveness. This has given local producers an opportunity to grow and develop.
As time passed by, the Romanian population slowly got educated into the western consumerism and large food multinationals entered the market. Nevertheless, due to the lack of experience and know-how for special films and packaging solutions, those food companies have chosen to maintain their suppliers outside of Romania, leaving only the low quality, simple packaging for the Romanian producers. This has led to a big discrepancy between the quantities actually needed for the products produced in Romania and the quantity of packaging actually produced by Romanian producers. The local production covered around 60 percent of the actual need of packaging in Romania as compared to as much as 160 percent in countries such as Italy that are exporting all over Europe, even in Romania. This situation could not hold on the long run. The possibility of combining western know-how with Romanian low labor costs, lower investment costs and even lower taxes while being nearer to their customers and their ever increasing needs, have lured international players to invest in Romania6. With an expected 5 percent growth rate of the Romanian packaging market in the next years, investing in the flexible packaging operations in Romania appears as great partnership opportunities for both international and local players.
Nowadays, Romanian producers of flexible packaging must be prepared to cope with the increase of the raw material price. They must decide whether this increase would fully transfer over the customer to still securing profit margins. As the lead times for the flexible packaging films for instance are usually between four and six weeks, the company may possess stocks on most of the jobs for two or even three months in advance. This means that the company has a temporal cushion to adopt the new prices and necessarily to implement secondary measures in order to prepare the company for the case the customers will reject the price increase. A good option for the producer would be to plan for considering three waves of price increase and announce customers that the first will happen e.g. within 30 days, the second at 45 days and eventually, a last one encompassing the remaining increase from raw material price.
Parallel to price increases, the producer has to come up with a backup solution in case the price increases backfire. A reevaluation of the entire business, production processes, supply chain, customer orientation etc must be initiated to attempt absorbing the 33 percent increase of the raw material price, with the raw material accounting for roughly 15 percent of the final product price. The company is hence compelled to consider with much responsibility the full-fledge process of servicing a customer that would need the flexible packaging product.
PROCESS MAPPING TO GET AWARENESS OF STATUS-QUOThe authors have applied the service mapping technique (Anthony; 1992) in order to identify the potential
failure points (Figure 3). According to Anthony, these failure points could be steps of service process that do not add value to the customer’s experience of the service, or where customer involvement in the service system does not support the service concept or is inadequately integrate with the service system, or are back-boned over poorly designed operations infrastructure.
6 One of the biggest packaging producers in Europe is Gerosa Group, www.gerosagroup.com, with factories in Spain, France and Italy. Gerosa acquired in 2003 the majority of shares of Artema Plast, the leading Romanian company in the flexible packaging industry, leaving the Romanian management with a minority interest. The authors have researched the current operations of Artema Plast in the paper.

52 Building Growth through Recesison
Figure 3 – Process map to serve the customer in a flexible packaging company

International Conference of the Institute for Business Administration in Bucharest, 2015 53
As highlighted by the service map for flexible packaging, key to ensure effective operations in flexible packaging is to keep all customer representatives aware of the status of the project at all time, by overseeing the service map and carefully timing for all steps, diminishing waste and working under a just-in-time philosophy.
PRODUCTION ANALYSES TO GAIN CLARITY ON PRODUCTION CAPACITIESThe production analyses target the main coordinates of the current production capacities, to highlight
performance and efficiency at any moment. Identification of écarts between local flexible packaging operations and similar operations in other countries allows the understanding for where the operations stand and how to improve. The benchmarking could suggest ways to improve set-up time, working speed - for various machinery and people, at different manufacturing stages (printing, laminating, cutting, producing pouches), preventing the need for investing in new equipment, or increasing number of personnel.
Achieving the performance parameters in operations following production analyses may secure the offset of abovementioned price increase of 30 percent if not beyond this threshold, especially via reducing set-up costs and adopting employee objectives that encompass a successful operational process.
QUEUING SYSTEM SIMULATIONS TO DELIVER THE PROMISED LEAD TIMEThe queuing system simulation helps analyze the performance of the current operations from the point
of view of waiting/idle times, hence bottlenecks, offering a clear picture of the resources needed to fulfill the estimated production needs. Consequently, it can give the awareness and understanding of the level of service delivered to the customer, along to the costs necessary to intensify it.
Based on accurate waiting line statistics – average time and number in the system, average waiting time, the number of people or machines necessary to fulfill order in the promised time interval, probability that the system is empty -, the management could enhance the control over the desired process outcomes. (Comӑnescu; 2015)
5S OPERATIONS PRACTICES TO ENABLE WASTE-FREE ENVIRONMENTStrong enablers for a waste-free environment are the Five S (5S) operations practices. (Krajewski, Ritzman,
Malhotra; 2010) As a methodology for organizing, cleaning, developing, and sustaining a productive work environment, it highlights five work practices – sorting, straightening, shining, standardizing, and sustaining – that are conducive to visual controls and lean production.
The first 5S practice is ‘Sort’ that instructs to separate needed items from unneeded items (including materials, parts, paperwork, tools etc), and discard the unneeded. ‘Straighten’ requires to neatly arranging and placing items in the specific place designated for everyone, hence organize the area so that it is easy to identify proceedings. The ‘Shine’ 5S term expresses the obligation to clean and wash the work area to make it ‘shine’. ‘Standardize’ as the fourth 5S practice suggests establishing schedules and methods of performing the cleaning and sorting so that the continuous cleanliness and state of readiness are maintained. Lastly, ‘Sustain’ implies creating discipline to perform the first four S practices, whereby everyone understands, obeys and practices the rules when in the flexible packaging plant. (Mincu; 2014)
JIT SUPPLY MANAGEMENT TO REDUCE INVENTORIESAn inventory management that is JIT-oriented offers the opportunity to decrease the costs and cash tied up
in stocks by receiving raw materials and the other goods only when they are needed in the production process. Nevertheless, the producers form flexible packaging industry have adopted for long time now the strategy of
keeping stocks for selected raw materials to cover the price volatility and the material availability. It is the strategic decision of these companies and the industry has assumed these costs, yet maintaining a close attention to minimizing inventories for other items and materials. (Comӑnescu; 2015)
The JIT-oriented inventory management contributes directly to optimizing the financial resources utilization and the warehouse resources, while better controlling the production process. This has the power to free up very significant cash flow and resolve an increasing storage space problem.

54 Building Growth through Recesison
FULLY-FLEDGED KPI DASHBOARD TO ENSURE STRATEGIC MANAGEMENT CONTROLAs researched, the flexible packaging producers’ clients need three things: on-time deliveries, quality
and competitive prices. While the price coordinates could be determined through market studies and customer feedback, the performance through on-time deliveries and quality could be evaluated by comparing the actual delivery dates to the promised delivery dates and through quality refusals against actual quantity delivered.
Monitoring a Key Performance Indicators dashboard leverage the company endeavors on the long run to better adapt to the customers’ needs, while keeping the company leadership, management and employee base informed and alert of market demand, customer feedback, financial coordinates and costs required to increase service level and customer satisfaction etc.
CONCLUSIONSIn a business where product innovation is not the prime factor of success and in which most of the companies
are able to access the same production technology and raw material price coordinates, the focus must fall on lean and just-in-time operations management. Never pass a burden or higher costs over the customer - one must collaborate with the customer and deal with the burden together instead!
REFERENCESAnthony R., (1992). Note on Service Mapping, Harvard Business School, BostonComӑnescu R., (2015). Developing Lean Operations in ARTEMA Plast, Dissertation Paper, Institute for Business
Administration (ASEBUSS), BucharestEvans J.R., (2013). Statistics, Data Analysis and Decision Modeling, Pearson Education Limited, Essex, EnglandGalloway R.L., (1993). Principles of Operations Management, Routledge, London, New YorkHeizer J., Render B., (2011). Operations Management, Pearson Prentice Hall, New Jersey Hill C.W.L., (2014). International Business: Competing in the Global Marketplace, McGraw-Hill/Irwin, New York McKinsey & Company, (2014). Price Shocks and the Chemical Industry Preparing for a Volatile Environment,
http://www.mckinsey.com/insights/energy_resources_materials/oil-price_shocks_and_the_chemical_industry_preparing_for_a_volatile_environment
Mincu C., (2014). Digital Operational Strategies for Municipal Solid Waste Treatment, Proceedings of the International Conference “Digital Economy: Challenge or Growth Driver for SMEs and Corporations”, Supplement of the “Quality-Access to Success” Journal, Year 15, S4
Mincu C., (2010). Flexibility and Harmony: Organizational Culture in a Lean Six Sigma Business Environment, Proceedings of the International Conference “Leading and Dealing with Risk and Uncertainty from Economic Downturn to Recovery”, Supplement of the “Quality-Access to Success” Journal, Year 11, No.117
Mincu C., (2006). Just-In-Time Operations, Technical Notes, Institute for Business Administration (ASEBUSS), Bucharest
Mincu C., (2006). Managing Quality, Technical Notes, Institute for Business Administration (ASEBUSS), BucharestPeng M.W., (2014). Global Strategic Management, South-Western Cengage Learning, United Kingdom www.gerosagroup.com

International Conference of the Institute for Business Administration in Bucharest, 2015 63
SURVIVORS OF THE CRISIS
Ph. D. Dean. Ovidiu Dîmbean-CrețaThe Institute for Business Administration in Bucharest
Thomas Devaney, MBAKennesaw State University
INTRODUCTIONThe purpose of this paper is to identify commonalities from the point of view of successfully maintaining
during times of economic crisis in two very different markets, those of the US and Romania, based on a simple and clear set of common financial indicators.
The latest US business cycle contraction (recession)11 began at the peak December 2007 and ended at the trough in June 2009 resulting in an 18 month peak to trough contraction (the National Bureau of Economic Research, 2015). During this time the S&P 500 retreated from an adjusted high of 1515.96 on December 10, 2007 to a low of 676.53 on March 9, 2009.
This resulted in a loss in equity value of approximately 55%. During this market decline there was no place to hide within the US equity markets, as all sectors within the S&P 500 posted declines ranging from 31% to 83%. Intriguingly, however, the three best performers during this most recent bear market were the traditional defensive sectors: consumer staples, health care, and utilities. Additionally intriguing is that history shows these three defensive sectors recorded identical ranking placements during average bear markets from 1946-2002.
In other words, whenever the S&P 500 suffered through a bear market all sectors posted declines.However, the defensive sectors of consumer staples, health care, utilities and to a lesser extent, energy were the best relative performers, ranking 1, 2, 3 and 4 respectively (Stovall, March 2010).
In Romania the shock wave did not come until the fourth quarter of 2008, thus influencing the Romania economy severely in 2009 and 2010. This is confirmed by the dramatic contraction of 7.1% (National Institute for Statistics) of the Romanian GDP in 2009 versus 2008, and .8% in 2010 versus 2009. A slow recovery followed in the range of 1% per year for the next two years, 2011 and 2012 with alternative quarters’ results.
Much has been written about the premises, causes, and permissive environment that led to the referenced financial crisis not only in the US and Romania, but that spread worldwide. But that will not be the focus of this paper. Rather, we intend to identify those companies and industries that performed well, or at least better than the overall economy during this time and identifywho are they and how did they did it.
APPROACH OF ANALYSISIn order to analyze those companies and industries that did exceptionally well during the recessionary
period, we chose a set of relevant financial indicators, starting from the central axiom of maximizing shareholder value.
From the US perspective we started by identifying the highest (1515.96 on December 10, 2007) and lowest (676.53 on March 9, 2009)closing value of the S&P 500 index.The S&P 500 index is widely regarded as the best single gauge of large-cap US equities comprised of the 500 leading US companies representing approximately 80% coverage of the available market capitalization (S&P Dow Jones Indices LLC.). Using these two dates and the overall index decline in value of approximately 55% as our benchmark,we thenobtained the adjusted closing price of each of the 50212 currently included securities that comprise the S&P 500 index on these dates.
We used the adjusted closing price to more accurately reflect the total gains/losses, taking into account any dividends that may have been paid during the time of our analysis.Since companies are regularly added and
11 The NBER does not define a recession in terms of two consecutive quarters of decline in real GDP. Rather, a recession is a significant decline in economic activity spread across the economy, lasting more than a few months, normally visible in real GDP, real income, employment, industrial production, and wholesale-retail sales. For more information, see the latest announcement from the NBER’s Business Cycle Dating Committee, dated 9/20/10.
12 Although the index includes only 500 companies, two classes of common stock of Discovery Communications and Google are included in the index.

64 Building Growth through Recesison
deleted from the S&P 500 and we began with the current constituents, we had to eliminate 30 securities from the current 502 securities as historical stock prices were not available for either one or both of the dates used in our analysis.
For the remaining 472 securities we obtained the historical stock prices from Yahoo.com and calculated the gain or loss for each of the securities.We then expressed each of the gains/losses as a percentage of the December 10, 2007 adjusted closing price to determine the percent gain/loss. We recognize our analysis will contain survivor biases since we began with the current constituents, as of June 30, 2015, of the S&P 500 rather than constituents at the start date of our analysis.
We grouped each of the securities according to the underlying company’s Global Industry Classification Standard (GICS)13 and determined the simple average gain/loss by Sector.
Our results are slightly different than those presented by Stovall (Stovall, March 2010). We contribute the difference to several factors, including the use of a simple average of the securities. Whereas the S&P 500 index uses a float adjusted market cap weighting, we used the adjusted close price to include dividends whereas Stovall excluded dividends.
And finally, our constituent companies would be different as we started with the constituent companies at June 30, 2015.
Nonetheless, the differences, especially in regards to the sector rankings, appear insignificant with consumer staples, health care,and utilities being in the top four performing sectors and financials, industrials, and materials being the three worst performing sectors.In the middle where the losses are within a few percentages points of each other, by sector we have a slightly different ranking.
Based on our analysis, sector returns are as follows:
Sector 12/10/2007 – 03/09/2009 % Change
Consumer Staples -35%
Health Care -38%
Telecommunication Services -43%
Utilities -46%
Information Technology -50%
Consumer Discretionary -51%
Energy -52%
Materials -53%
Industrials -55%
Financials -68%
When looking at the data presented in aggregate it is reasonable to conclude that the performance of an individual company in times of economic turmoil is more dependent upon the sector in which the company operates than any financial matrix or management competencies. However, when we look at several of the best performing companies we must consider a different conclusion. Of the 472 securities examined, only ten had positive returns over the approximately 15 month timeframe examined while the total population had an average loss of52% and individual sector losses ranged from 35% for consumer staples to 68% for financials. Of the ten securities that provided a positive total return, five are classified as consumer discretionary, two as health care, and oneeach as consumer staples,energy, and financials.
Clearly at the individual security level, factors other than sector are playing a role in the performance of certain companies. For example, one would not expect to see Peoples United Financial, a savings and loans, in the top ten performing companies when it is a member of the worst performing sector, financials, with average equity declines of 68% in our population. Nor would one expect to see five companies in the consumer discretionary sector included in the list of top performing companies.
13 “GICS is a registered trademark of McGraw-Hill and MSCI Inc.

International Conference of the Institute for Business Administration in Bucharest, 2015 65
CONSUMER DISCRETIONARYWhen looking at the five companies in the consumer discretionary sector more closely we see that four of
the five most likely performed well due to their product offering and/or pricing strategy. Ross Stores is a women’s apparel store and, although classified as a consumer discretionary clothing is still a necessity, at least in the United States, and Ross tag line is “Dress for Less”. Family Dollar Stores offers everyday items for the entire family at value prices. Family Dollar claims to offer the lowest possible price, the name brand and quality private-brand merchandise customers need and use every day. Family Dollar’s vision is to “be the best small format value and convenience retailer serving the needs of customer in the neighborhoods we serve”. (Family DollarStores, Inc.).Its concept is to be a self-serve, cash and carry neighborhood discount store in low to middle income neighborhoods.Dollar Tree is another discount variety store offering a mix of merchandise that includes items such as housewares, glassware, dinnerware, cleaning supplies, candy, snacks, food, health and beauty, toys, gifts, party supplies, stationery, craft supplies, teaching supplies, books, seasonal décor, and more. Everything costs only $1 or less (Dollar Tree, Inc.). AutoZone started in 1979 to fill the need for retail automotive parts store to help people with the upkeep of their vehicles. Today AutoZone is a Fortune 500 company with more than $8.1 billion in annual sales.Part of the AutoZone pledge states “We got the best merchandise at the right price.” (AutoZone, Inc.). During an economic downturn people change some of their spending habits. For example, during a recession people buy fewer new cars. This means they keep their existing cars longer, which means they are going to need more repairs on these existing cars.Generally, suppliers of lower-cost products will find their sales improve as buyers try to cut costs by going to lower-cost items (Walden) so it is not surprising to see these consumer discretionary companies performed well during the downturn. The final consumer discretionary company and the best performing company in our list of top performers is Netflix with approximate total shareholder return from December 10, 2007 through March 9, 2015 of an amazing 64%. Netflix is a subscription based movie rental business that delivers DVD’s directly to the customer by US mail and internet streaming content to patrons’ televisions and other electronic devices. Netflix ended 2008 with 9.4 million subscribers, up 25% from a year earlier, and fully diluted earnings per share of $1.32, up 36% from the previous year.In the annual letter to the shareholders included in the 2008 Annual Report, the Chief Executive Officer and President, Reed Hastings, stated two factors contributed to the strong results in 2008 and will play a major role in the future: “Thecontinuing strength of our core DVD-by-mail offering, which enables us to deliver strong subscriber and earnings growth while investing in the future of our business and the growing traction of internet streaming, which we believe contributed to faster subscriber growth, lower subscriber acquisition costs, and higher profit in the fourth quarter of 2008” (Netflix, Inc).
Symbol Name Sector Description Price1 12/10/2007
Price1 3/9/2009
Change $
Change %
GMCR Keurig Green Mountain Consumer Staples
Processed & Packaged goods 8.03 8.16 0.13 2%
PBCT People’s United Financial Financials Savings and Loans 12.56 12.95 0.39 3%SWN Southwestern Energy Energy Independent oil and gas 26.83 28.27 1.44 5%VRTX Vertex Pharmaceuticals Health Care Biotechnology 25.47 26.96 1.49 6%
ROST Ross Stores Consumer Discretionary Apparel Stores 6.34 6.86 0.52 8%
EW Edwards Lifesciences Health Care Medical appliances and equipment 24.61 27.28 2.67 11%
AZO AutoZone Consumer Discretionary Auto parts stores 132.17 150.00 17.83 13%
DLTR Dollar Tree Consumer Discretionary Discount variety stores 9.79 13.33 3.54 36%
FDO Family Dollar Stores Consumer Discretionary Discount variety stores 17.76 28.00 10.24 58%
NFLX NetFlix Consumer Discretionary CATV Systems 23.49 38.50 15.01 64%
1 Ajusted dose from Yahoo finance

66 Building Growth through Recesison
Key performance indicators obtained from Morningstar.com show impressive results for Netflix throughout the entire three years affected by the recession of 2007, 2008 and 2009.Among some of the notable ratios:
Netflix, Inc. 2007 2008 2009
Revenue Growth YOY (%) 20.94 13.22 22.39
Net margin % 5.55 6.08 6.94
Asset Turnover (x) 1.92 2.16 2.57
ROA % 10.66 13.13 17.86
ROE (%) 15.85 21.35 42.42
Financial Leverage (x) 1.5 1.78 3.41
Debt/Equity (x) - .11 1.19
As indicated, Netflix produced impressive revenue growth even during difficult economic times. Netflix improved net margins, asset turnover, ROA and ROE in each of the three years during the recession. Although financial leverage did increase slightly, Netflix still maintained a lower than average debt/equity ratio. Although it may be argued that the success of Netflix was a result of its providing a low cost entertainment substitute product which made it attractive to more customers during difficult times, it is unlikely that these types of results were fueled solely on this fact.We would argue it was more likely the result of Netflix’s innovative platform to deliver movies and television shows into subscriber homesquickly and without hassle.In fact, Netflix released its streaming product in 2007, the year the US recession started. Netflix has continued to provide exceptional shareholder returns after the recession with its current 52 week stock price change up 50.38% and a closing stock price of $707.61 on July 13, 2015 up from the $38.50 on March 9, 2009used in our analysis.
CONSUMER STAPLESKeurig Green Mountain is the only company in the best performing sector, consumer staples, which made
our list of the top ten performing companies. Green Mountain Coffee Roasters is a leader in the specialty coffee industry selling gourmet branded coffees and teas. As noted in Keurig Green Mountain FYE September 27, 2008 annual report, “A significant driver of the Company’s growth has been the sale of K-Cups® and the Keurig® brewing systems. Keurig is a pioneer and leading manufacturer of gourmet single cup brewing systems and markets its premium patented single-cup brewing systems for consumers at home or away from home. Keurig earns royalty income from the sale of K-Cups form all vendors licensed to sell K-cups. ”The cost of K-Cups is significantly higher compared to regular premium coffee and it therefore seems counterintuitive that Keurig Green Mountain would perform so well in an economic downturn. One would expect a shift away from specialty coffee and teas to lower cost substitutes in difficult economic times. However, as with Netflix, it appears that Green Mountain Coffee Roasters’ success is related to introducing an innovative product to the market.Although the K-Cup was invented in 1990, the first Keurig home brewer was not introduced until 2004 and Green Mountain Coffee Roasters acquired Keurig in 2006. Since the acquisition Keurig, Green Mountain has provided extraordinary shareholder returns as illustrated in the graph:
Source: Green Mountain Coffee Roasters, Inc. Form 10-K FYE September 27, 2008

International Conference of the Institute for Business Administration in Bucharest, 2015 67
FINANCIALSAs a sector, the financials performed the worst, declining in equity value on average 68% over the time
period examined. Yet one company within this sector, People’s United Financial, was one of only ten companies of the 472 examined to produce positive returns for its shareholders during the crisis period examined.People’s United Financial is a savings & loan holding company. The principal business of People’s United Financial is to provide a full range of financial services to individual, corporate, and municipal customers. People’s United Bank’s operations are divided into two primary business segments that represent its core businesses, Commercial Banking and Consumer Financial Services (People’s United Financial ). The Financial sector losses was primarily a result of the fallout associated with the subprime mortgage market that led to a credit and liquidity crisis and a significant deterioration in activity within the secondary mortgage market, exacerbated by an accelerated softening of the real estate market. People’s United Financial was able to avoid the adverse effects of the 2007-2008 credit crises which affected most other banks because it never pursued the sub-prime mortgage market and has avoided exposure to similar, high risk Alt-A loans and structured investment vehicles (People’s United Financial ). Effective January 2008, People’s United Financial acquired Chittenden Corporation which nearly doubled PBCT’s assets.Key performance ratios for PBCT for the years 2007-2009 obtained from Morningstar.com are presented below:
People’s United Financial 2007 2008 2009
Revenue Growth YOY (%) 26.84 39.88 -5.76
Net margin % 22.2 14.84 11.42
Asset Turnover (x) .06 .06 .04
ROA % 1.23 .83 .49
ROE (%) 5.16 2.90 1.97
Financial Leverage (x) 3.05 3.90 4.17
Debt/Equity (x) .01 .07 .07
We can see that PBCT performed very well during the first two years of the US recession with healthy growth in revenue.Although margins, asset turnover, ROA and ROE did deteriorate and leverage increased, it still maintained positive returns which many of the financials were unable to do.However, as the housing and real estate markets continued to decline since 2008 it seems FBCT was unable to continue to outperform the financial sector or the S&P 500 as illustrated in the following graph:
Source:People’s United Financial, Inc. 2014 Annual Report page 20
68 Building Growth through Recesison
It appears that the extended period of ultra-low interest rates combined with increased regulatory expectations and tightening credit spreads, the result of heightened industry competition has ultimately taken its toll on People’s United Financial, Inc. along with the financial sector in general. People’s United Financial, Inc. may have initially outperformed the S&P 500 and the financial sector as a result of the quality of its assets and quality underwriting practices. However, it ultimately succumbed to sector pressures and its financial performance as measured by total return actually fell below comparable benchmarks such as the SNL Mid Cap U.S. Bank and Thrift Index.
ENERGYOnly one company in the energy sector from our data set produced positive shareholder returns.
Southwestern Energy Company is an independent oil and gas company which explores, develops, and produces natural gas and oil in the United States. When one looks at Southwestern Energy Company’s annual reports they will quickly notice what looks like a hand scribbled formula on the cover page with a tag line:
In the 2007 letter to the shareholders, Harold M. Korell, CEO& Chairman of the Board explains the company’s’ concept of value added per dollar invested (PVI for short). The equation is
(Present value of future revenues minus cost discounted at 10%) PVI =Investment
Mr. Korell goes on tostate Southwestern Energy has a threshold target to invest in projects that generate a PVI of at least 1.3 (Southwestern Energy Company, 2008). Of course we recognize this formula that Mr. Korell refers to as “Our Way” as being very similar to the profitability index expressed as,
(Present of Future Cash Flows) PVI = Initial Investment
a cost benefit ratio used in capital budget and often used to rank competing projects. A profitability index of 1.0 or greater would be an acceptable project and the financial attractiveness of the project increases as the profitability index increases. Assuming Southwestern Energy Company cost of capital is somehow related to the 10% discount factor used in their PVI equation, this suggests that Southwestern Energy expects to generate at least $1.30 PV for every $1.00 invested. One must examine whether performance is a result of a financially disciplined management team which develops and trademarks formulas explaining value creation or are the results driven by other factors? In the 2009 letter to shareholders, Steven L Mueller, the new President & Chief Executive Officer replacing Harold M. Korell who recently retired from day to day operations states the Company’s

International Conference of the Institute for Business Administration in Bucharest, 2015 69
shares grew 5,776% over the past decade and was named the top performing stock in the S&P 500 over that time frame (Southwestern Energy Company, 2009), pretty impressive.However, without discrediting these exceptional results, other factors within the energy sector were also playing a role in the success of Southwestern Energy. Starting around 2000, shale gas in the United States has become a rapidly increasing source of natural gas as a result of improvements in hydraulic fracturing technology.One of the earliest plays was the Fayetteville (AR) shale that was discovered by Southwestern Energy Company who began drillingin June 2004 (Southwestern Energy Company, 2004).
Somewhat like Netflix and Keurig Green Mountain, Southwestern Energy Company most likely also benefited from being an innovator applying new technology to gain a competitive edge. Key financial ratios for Southwestern Energy Company from Morningstar.com are presented below:
Southwestern Energy 2007 2008 2009
Revenue Growth YOY (%) 64.48 84.17 -7.17
Net margin % 17.62 24.57 -1.66
Asset Turnover (x) .42 .55 .45
ROA % 7.37 13.55 -.75
ROE (%) 14.36 27.34 -1.47
Financial Leverage (x) 2.20 1.90 2.05
Debt/Equity (x) .59 .27 .43
HEALTH CAREIn the health care sector two companies have provided positive shareholder returns during the period
examined, Vertex Pharmaceuticals a biotechnology company, and Edwards Lifesciences, a medical appliances and equipment company.
Looking at the financial performance of Vertex Pharmaceuticals one would be surprised that it produced positive returns for its shareholders.Key financial ratios from Morningstar.com (Morningstar)for the years 2007-2009 are presented below:
Vertex Pharmaceuticals 2007 2008 2009
Revenue Growth YOY (%) -8.02 -11.81 -41.94
Net margin % -196.61 -262.02 -630.27
Asset Turnover (x) .26 .22 .07
ROA % -51.38 -58.14 -43.75
ROE (%) -100.69 -180.27 -96.19
Financial Leverage (x) 2.22 4.10 1.78
Debt/Equity (x) - 1.20 .11
So how does a company that is losing revenue, producing negative net margins, ROA, and ROE stock price increase? Obviously investors must have great expectation for the future.In the case of Vertex Pharmaceuticals it appears much of that expectation was riding on a new drug, Telaprevir. Telaprevir was Vertex Pharmaceuticals’ lead investigational drug at the time and was a treatment of Hepatitis C virus (HCV) infection. In the Annual Report, Joshua Boger, Ph. D. President and Chief executive Officer stated, “We expect to build on momentum generated in 2006 as we move forward to build Vertex on Telaprevir” (Vertex Pharmaceuticals Incorporated, 2006). Indeed, as illustrated in the following graph the expectations for Telaprevir were very positive.
As illustrated, Vertex Pharmaceuticals Incorporated total return took off early in 2007 through 2009 while the NASDAQ composite was in a freefall through 2008.Vertex Pharmaceuticals Incorporated did not gain FDA until May 23, 2011 (FDA.Gov).Unfortunately, after racking up $1 billion in sales in August, 2014, Vertex Pharmaceuticals announced it would discontinueTelapreviramongst increased competition from newer drugs.

70 Building Growth through Recesison
In the first six months of 2014 Telaprevir sales were down 96% from the same period a year earlier(Silverman, 2014).Nonetheless, Vertex Pharmaceuticals continued to invest in its pipeline, introducing new drugs for the treatment of serious life threatening diseases.As noted in on Vertex Pharmaceuticals web page a quote from Jeffrey Leiden, M.D. Ph.D. Chairman, President and Chief Executive Officer of Vertex, “With the recent progress across our research and development programs in cystic fibrosis, we have established a clear path for the future of our company.”Interestingly, Vertex has continued to lose money every year with the exception of 2011, when it still only made $30 million USD in net income.Yet its stock price has continued to skyrocket, currently trading in the $130 USD price range.
Source:Vertex Pharmaceuticals Incorporated 2011 Form 10-K
The second health care sector company to produce positive shareholder returns during the examination period was Edwards Lifesciences. Edwards Lifesciences roots date back to 1958 when Miles “Lowell” Edwards set out to build the first artificial heart. Today Edwards Lifesciences is a global leader in the science of heart valves and hemodynamic monitoring.(Edwards Lifesciences).Unlike Vertex Pharmaceuticals Incorporated, Edwards’ financial ratios look quite healthy with solid revenue growth in all three years, along with increasing net margins, assets turnovers, ROA and ROE.
Edwards Lifesciences 2007 2008 2009
Revenue Growth YOY (%) 5.22 13.44 6.76
Net margin % 10.36 10.41 17.34
Asset Turnover (x) .84 .90 .88
ROA % 8.72 9.39 15.19
ROE (%) 14.26 15.04 22.50
Financial Leverage (x) 1.61 1.59 1.40
Debt/Equity (x) .07 .20 .08
A review of many years of Edwards Lifesciences annual reports and 10-K’s reveals a common theme: Edwards is a leader in innovation and the development of new products in the treatment of advanced cardiovascular disease, the world’s leading cause of death and disability. During each year reviewed, management continued discussing the launching of new heart valve products, therapies and/or clinical care monitoring systems while producing better than average financial results as illustrated with the Performance Graph below:
International Conference of the Institute for Business Administration in Bucharest, 2015 71
Source: Edwards Lifesciences 2014 Form 10-K
CONCLUSIONSThe financial crises that began in the United States in 2007 and spread throughout most key economies
resulted in a global risk that not many companies were able to mitigate. Looking at 472 securities included in the S&P 500, only ten were able to product a positive return to their shareholders during the time period from December 10, 2007 through March 9, 2009. The limited scope of this paper attempts to identify similar characteristics to help explain how some companies were able to beat the odds. The study supports the fact that from a macroeconomic perspective, the particular industry sector in which a company operates plays a large role in how well the company will perform in an economic downturn (at least from an industry ranking perspective) as reported by Stovall (Stovall, March 2010). The three defensive sectors, consumer staples, health care and utilities, recorded identical ranking placements during average bear markets from 1946-2002. However, from an individual company level, our list of “Survivors”, the only ten companies to produce positive shareholder returns sector makeup was actually quite different with only one consumer staples, two health care and no utilities making our list.In fact, the consumer discretionarysector, which historically ranks near the bottom during bear markets was the most heavily represented in the Survivors with five of the ten companies in this sector. Upon further investigation of these companies’ actual business, the results were not that surprising. Three of the five are discount, low cost providers of household items or clothing with another being a retail auto parts store. It makes sense that suppliers of lower-costs products will find their sales improve as buyers try to cut costs by going to lower-cost items (Walden).Additionally, consumers will be more reluctant to purchase new cars during a recession when fears of being laid off are high and will therefore drive their current cars longer, investing in maintenance and repairs. The last consumer discretionary, Netflix, was surprising as a Survivor, even more so as a top performing stock, providing total shareholder return of approximately 64% compared to the average return of -52%. It appears more than coincidental that Netflix’s growth during this time coincides with the release of its streaming video content in 2007. This provided a low cost, convenient entertainment solution delivering videos directly into consumers’ homes without having to go out to rent a DVD or worry about returning it on time. Likewise, it appears that the success of the only consumer staples company, Green Mountain Roasters, was a result of its acquisition of Keurig in 2006, along with the introduction of the single K-Cup home coffee brewers. Both of these companies were first to market with a newer, more convenient product that garnered huge consumer acceptance.
Peoples United Financial was the only financial sector company to make the list of Survivors and is a member of the worst performing sector during the crisis. The results must be attributable to superior management or some other external factors at the time. Based on management’s discussion in its annual reports during the time, management claims their success was a result of sound underwriting practices and the avoidance of the sub-

72 Building Growth through Recesison
prime mortgage market and other alt A loans and structured investment vehicles. From the authors’ perspective it seems some of the success was a result of the acquisition of the Chittenden Corporation in 2007,which resulted in almost doublingthe size of its assets. Although People’s United Financial performed excellently during the worst part of the downturn, it has underperformed in comparison to the S&P 500 and the SNL Mid Cap index since 2009.In reviewing Southwestern Energy Company’s annual reports, it immediately became clear that Southwestern is a financially disciplined and focused company. In almost every report looked at the company discusses what it calls “Our Way”, which consists of two core beliefs: That the Right People doing the Right Things, wisely investing the cash flow from the underlying Assets will create Value+.And that its use of what it refers to as PVI - Present Value Index which is a slight variation of what is commonly known in finance as the Profitability Index in all their investment decisions. Southwestern Energy has produced superior shareholder returns for many years and was named the top performing stock in the S&P 500. Southwestern Energy stock grew 5,776% while under the leadership of Harold M. Korell and was named the top performing stock in the S&P 500 over that time frame.
Lastly, we looked at two very different health care companies. It is difficult (at best) to understand the performance of Vertex Pharmaceuticals. From a financial perspective one would expect to see its stock plummeting with declining revenues and triple digit negative ROE each of the years examined. It seems that the investing public was betting heavily on the promise of a key new drug which only helped produce profitable results for one year. Years later in 2011, before being discontinued in 2014 due to declining sales as a result of competitor’s newer drugs.In fact, the stock continues to grow since 2009 from the closing price of $26.96 on March 9, 2009 to $134.17 on July 17, 2015 despite the fact it only had one profitable year in the past ten.In comparison, Edwards Lifesciences, a medical device and equipment company, consistently produces innovative products and therapies while producing consistent above average financial results.
For the Romanian case we can begin our analysis with the evolution of the companies’ market values within the relevant period. This is useful until 2008, the Romanian economy and its companies grew in a very booming way.This was due to the undervaluing assets in Eastern Europe before, beginning during the period of 2001-2004. The announcement of Romania getting into the European Union at the beginning of 2007 quickly inflated prices of most of the assets, starting with real estate and land, and going to companies and businesses years prior to 2007, then in 2007 and 2008 prices were already sky high.
That’s why the landing of the Romanian economy and most of the economic factors were impacted sharply in 2009. Then let’s see in the continuing market what’s happened with the most valuable companies and industries in 2008 and 2009 compared with previous years, using excellent information from the yearly top 100 of the most valuable companies in Romania, published annually since 2006 by the group of companies led by the daily newspaper, “Ziarul Financiar – Financial Newspaper”.**
The most valuable Romanian company by far, during the period before the crisis as well as after, was Petrom (oil and gas producer), owned in proportion of 51% by OMV Group from Austria. Petrom was evaluated in 2006 at almost 9 billion Euro. But its value dropped a little lower in 2007 before the crisis hit Europe and in Romania, at 8.4 billion Euro and then it followed the decline down to less than 5 billion in 2008 and just 3.6 billion in 2009. But in 2010, Petrom regained some value to 4.5 billion Euro showing that the energy sector can probably recuperate faster than other industries from the loss taken during the crisis.
* Data from the National Institute for Statistics
** 100 most valuable companies in Romania in 2009 and 2010
ENERGYBesides Petrom, there were other energy companies in Romania that actually did better than or similar to
Petrom.Some were Nuclearelectrica, Hidroelectrica, CEZ Distributie, GDF Suez Energy, and other smaller at market value which were mainly affected in 2009, but they could already show signs of recovery in 2010. Some of these companies are still state owned,but others are private, generally becoming part of bigger Western Europe operators. The question of why and how the energy sector could recover so fast in just 1-2 years is answered by either they were manufacturers or merely distributors of energy.We can see in more details further on, when

International Conference of the Institute for Business Administration in Bucharest, 2015 73
looking at their financial results, thus observing also the poor performers of the industry, who didn’t show a quick recovery like those already mentioned above.
Financials/ Company
Net Margin (%)
Assets Turnover (x) ROA (%) ROE (%) Financial
Leverage (x)Debt/Equity
(x)
Years 2008 2009/2010 2008 2009/
2010 2008 2009/2010 2008 2009/
2010 2008 2009/2010 2008 2009/
2010
Petrom 6 9.5/11.6 0.67 0.53/
0.48 4 5/5.5
7.3 9.7/11.1 1.8 1.9/
1.97 0.83 0.45/0.52
Nuclearelectrica 2.9/0.9
0.16/0.17
0.5/0.1
0.7/0.2
1.4/1.36
0.37/0.36
CEZ Distributie 1.6 1.6 3.4 1.97 5.5 3.2 6.7 6.2 1.2 1.93 0.11 0.82
GDF Suez Energy 3.4 10.5/5 1.05 0.99/
0.95 3.6 10.4/4.75 5.7 15/
7.4 1.5 1.5/1.55 0.56 0.46/
0.49
Petrom’s turnover decreased in 2009 versus 2008 by 23% in lei (domestic currency) and even more in Euro or dollar terms due to depreciation of local currency as well. This decrease is mainly due to lower price levels and volumes. However, profit margin improved significantly in 2009 compared with 2008 and on continuation in 2010, due to restructuring operations. These improvement helped ROA and ROE going up, even though assets turnover went down. Therefore, margin offset slowing down assets turnover, and ROE also grew by higher leverage.
In 2010 sales recovered by 15% versus 2009, accompanied by further growth in ROE, in total Balance Sheet and Equity financing, and in operating profit after tax, thus showing a fast change of direction back to good times.This is confirmed by the market perception, as already mentioned above, because of partial recovery of the market value lost in 2008 and 2009.
Nuclearelectrica, the only nuclear power energy manufacturer in Romania, created before 1989, grew exponentially in value until 2008.It was, however, the only growing company in the top 25 in 2009 and resisted reduction in its value in 2010 as well. Its financial results in 2009 were pretty remarkable.In 2010 it was not much worse, even though it was affected operationally by an increase in the prices of a few specific raw materials.It was also impacted financially, by the devaluation of the local currency at reimbursements of external loans for investments.
Hidroelectrica, “the blue energy manufacturer”, by hidro centrals had a slow down curve in 2009 in its market value, but a quick partial recovery in 2010, its activity being pretty much influenced by the rainy weather across the country. Hidroelectrica is also mostly owned by the Romanian government (80%), but didn’t find financial data since 2008-2009.
CEZ Distributie decreased in value, especially in 2010 versus 2009 (by 11.6%), as confirmed by the financial results which show a decrease in assets turnover, which affected mainly ROA, and less ROE due to consistent increase of leverage. These are the results of lowering energy sales and distribution in 2009 vs 2008, and increased purchasing price of energy at a double level over the sales price growth (24 lei/MWh vs 12 lei/MWh).
GDF Suez Energy is the natural supply gas service in Southern Romania.It reduced its market value by 28% in 2009 vs 2008, but overcame partially in 2010. Aftersignificant lay-offs of employees as well as the creation of a separate entity for services during 2009, margins and profitability rapidly improved, combined with the advantage of gas prices going up steadily both for individuals and businesses. In 2008 it divided the supply from the distribution activity, and became more profitable in 2009, as shown in the table at net margin, ROA, ROE without increasing leverage.
In conclusion for the energy sector, we can say that even though minimally in one of the two years, 2009 or 2010, most of the relevant companies were affected by the crises waves, but they managed to recover quickly,

74 Building Growth through Recesison
especially those companies not belonging to the state anymore, but also because the macroeconomics in Romania showed a deep landing in 2009 vs 2008 (see data below), but then things stabilized and the energy consumption got slowly back to previous years’ levels.
Romania’s GDP (bil. Euro) 2006 2007 2008 2009 2010 2011
124.7 130.5 139.7 118.3 124.1 131.5
What about other economic sectors, besides energy?Each of thetelecom sector were strongly impacted in its company’s values, if looking at the main three
local operators, as Orange, Vodafone and Romtelecom. Romtelecom’s only good point is that being smaller in size, the former state owned telecom company managed torecover faster from its downturn, but its success can also be attributed to more professional private management and ownership than before. In similar evolution, with an end to decreasing in value was Cosmote, the cellular telephone operator with the same Greece ownership as Romtelecom. This company managed a slight recovery in value in 2010 vs 2009, from the 33% loss in 2009 vs 2008. Even RCS & RDS, a private Romanian fast developing telecom company, which is mainly on the internet and TV services supplier, after getting down in 2009 at less than half of its 2008 value,managed to rebound slightly in 2010.
AUTOMOTIVE INDUSTRYRomania has some tradition in cars’ manufacturing industry, from the late ‘60s when the French manufacturer
Renault licensed their patent and created in Romania a local car with a local historical name, ‘Dacia’. This has been successfully contributing in time at Romanian exports too. Automobile Dacia, the actual name of the local producer, finally bought by Renault in the late ‘90s, relies mainly on exports today, and during the financial crises in 2008-2009 as well, going smoothly through it, even though its value lowered in 2009 vs 2008 by 11%, but coming back in 2010 at almost the same value from 2008.
Financials Company
Net Margin (%)
Assets Turnover (x)
ROA (%)
ROE (%)
Financial Leverage (x)
Debt Equity (x)
Years 2008 2009/2010 2008 2009/
2010 2008 2009/2010 2008 2009/
2010 2008 2009/2010 2008 2009/
2010
Automobile Dacia 2.9 2.5/2.6 1.8 1.85/
2 5.2 4.62/5.2 7.5 7.2/
9 1.4 1.54/1.67 0.4 0.47/
0.61
Continental Automotive
13.8/10.8
1.82/ 1.6
25/17.3
30.6/21.4
1.2/1.26
0.22/0.26
Pirelli Tyres9.0/6.8 0.91/
0.918.2/6.2
15/13.8
1.83/2.79
0.79/1.15
If we take a look at financials, we see indeed a decline of results in 2009 vs 2008, due to lowering the margin, showing a drop in prices, but things got quickly better in 2010 due to exports in various markets, even though the Romanian cars market crashed that time.
Continental Automotive and Pirelli Tyres are new comers in the top ranking 100 most valuable companies in Romania. This is a result primarily, of new and sensitive investments in the automotive industry and cars’ components.
Continental Automotive grew in sales over 20% in 2010 vs 2009. There was not growth, however, in profitability, or in number of employees, which gave signs of further investments in the local auto components industry.
Pirelli Tyres grew also in sales in 2010 by almost 40% and slower in profitability, in number of people working, confirming the foreign investor’s intention to expand and develop their businesses in the emerging markets like Romania’s.

International Conference of the Institute for Business Administration in Bucharest, 2015 75
CONSTRUCTION AND INDUSTRIAL PRODUCERSThe construction market, actually the cement market, is shared and dominated by three multinational/
regional names, as in the other sector’s case: Lafarge Cement (French), Carpatcement (Heidelberg Cement Germany) and Holcim (Austrian). Lafarge is bigger than the other two and consequently,like other sectors, more affected by the plummeting of the real estate and construction sector, whereas Carpatcement and Holcim, after decreasing in value in 2009 vs 2008, succeeded to better conserve their values and businesses further in 2010.
On the other side, 2010 welcomed a newcomer in the top 100 valuable companies, from the construction sector, Romstrade, which engaged more in government sponsored infrastructure projects, so a real local construction company, that despite lower sales in 2010 vs 2009, improved quite a lot net margin and the profitability ratios ROA, ROE, and decreased leverage.
Financials Company Net Margin (%) Assets
Turnover (x) ROA (%) ROE (%) Financial Leverage (x)
Debt/Equity (x)
Years 2009 2010 2009 2010 2009 2010 2009 2010 2009 2010 2009 2010
Romstrade 0.8 4 0.53 0.43 0.42 1.72 1.2 4.6 2.74 2.65 1.74 1.65
Romania is still an emerging market, and a young redefined democracy. Companies, especially in the construction sector, could be divided into two categories: Those that make business with the government, and the others that don’t. There could also be those that make both, but clearly those who are on the government side, taking advantage of special links and arrangements with important decision makers, are in an unfair competition with the others. And Romstrade is one of these cases, with a high volatility of numbers from one year to another and more recently, with legal problems for the owner.
Industrial Producers are very different from each other, depending on their specific areas of business, and many of them had also problems during the recession period in Romania. Let’s see who did better out of them, if any.
FinancialsCompany
Net Margin (%)
Assets Turnover (x) ROA (%) ROE (%) Financial
Leverage (x)Debt/Equity
(x)
Years 2009 2010 2009 2010 2009 2010 2009 2010 2009 2010 2009 2010
Arctic 14.2 10.1 1.72 1.41 24.4 14.2 41 23.8 1.68 1.67 0.55 0.57
Holzindustrie Schweighofer 11.6 21.2 1.04 1.21 12 25.6 54 63 4.45 2.47 3.47 1.48
Alro 4.8 7.3 0.72 0.95 3.45 6.96 5.4 11 1.57 1.57 0.54 0.54
Johnson Controls 5.5 0.5 3.15 2.76 17.5 1.38 46.7 4.8 2.67 3.36 1.66 2.34
Yes, there are some, as seen in the table above, referring to the three out of the four industrial companies who are newcomers in the top, with excellent profitability results in this critical period. But Alro Slatina, the well-known aluminum manufacturer, after dramatic landing in 2009 vs 2008 at less than half of its market value, in 2010 succeeded to recuperate almost 25%. Here we see an example of the financials who confirm this recovery, by improving all the financial components of the profitability (margins, turnover, return, while keeping the leverage steady). It depends a lot on aluminum international prices, driven by supply and demand in the international markets.
Out of the other three manufacturers, two are in wood exploitation and processing, a very profitable area in Romania, as seen exceptional results of Holzindustrie Schweighofer (a traditional Austrian company in this sector) in 2010 vs 2009, Johnson seemed to have a problem in 2010, but still they catch the market value top 100.
Arctic, the only manufacturer of refrigerators in Romania, part of the Turkish Company Arcelik, from Koc Holding, got well into the top, even though weaker results in 2010 vs 2009, but still very good ones among the big majority of companies and industries during that period, due to exports and dominating position in Romania.

76 Building Growth through Recesison
BANKINGBanking industry’s evolution during the analyzed period was not as bad as in the US, but still it recorded
a significant contraction in value in 2009 vs 2008 (Romanian Commercial Bank – Erste Group by 30%, Raiffeisen Bank by 23%, both Austrian banks nowadays, CEC Bank, former Romanian Savings Bank, still state own, by 27%, Banca Transilvania, the only local private big bank, by 47%, Eximbank, the Romanian Import Export Government Bank, by 31%, Bancpost by 19%,Alpha Bank by 36%, Piraeus by 44%, Banca Romaneasca by 40%, all four last banks being Greece banks, Volksbank by 41%, Citibank by 45%).
BRD Group Société Générale, the second largest bank in Romania after BCR – Erste, was least affected in value in this period, probably because it was part of the biggest multinational European based (French) banking group, whichinvested heavily in Romanian market before the year 2000, both in retail and corporate areas. Citibank, in comparison with the French giant, could be bigger, but it didn’t develop the retail business, and corporate was very selective, at big local companies.Many of them were from the government utilities and energy monopolistic sectors. Banca Transilvania was the only bank growing back in value quick in 2010, reloading its aggressive expansion strategy and continuing to target small and medium size businesses. Many banks, however, slowed down the contraction of their market value in 2010, even though they continued to suffer for years with their balance sheets, where they booked many bad, non-performing loans, mostly real estate and consumer ones.
RETAILThe retail sector was, like other sectors, partially affected. The degree of impact was dependent on the stage
of the development from company to company, the long term strategy of the company, but also onneglecting step by step tactics for shorter terms as well.
The highest in value in this business was the German cash and carry, Metro. The impact was reflected in its drop in market value, which dropped by 34% in 2009 vs 2008, and even lower in 2010.Similar companies, in contrast with Kaufland, Carrefour, and Real, did much better. Selgros, a follower of Metro, prior to the time period, used a slightly different retail business format and managed better in the difficult situation in 2009, but it couldn’t finally avoid its contraction in value in 2010 by 16%.
Kaufland and Carrefour both suffered in value from 5-10% in 2009 vs 2008, but they both managed to come back in 2010, Carrefour built a higher value in 2010 than that of 2008 (!), and Kaufland succeeded in remaining steady, with just 4% fall and recover it almost 100% in 2010. Real, a new comer in top 100 in 2009, had a small growth in value in 2010 vs 2009.
Even though in a crisis period and recording financial losses, both German retailers (Kaufland and Real) continued to invest, betting on fast recovery of the economy and getting out of recessionary times, to be prepared for future profits.
FinancialsCompany
Net Margin (%)
Assets Turnover (x) ROA (%) ROE (%) Financial
Leverage (x)Debt/Equity
(x)
Years 2009 2010 2009 2010 2009 2010 2009 2010 2009 2010 2009 2010
Carrefour 2 3.5 2.18 2 4.36 7 15.8 20.2 3.67 2.81 2.69 1.83
Carrefour decreased the business volumes in 2009, but became more profitable, showing a good example of efficiency focus, in that they grew its margins and profitability, whereas reducing leverage.
CONSUMER GOODSThis sector is a large one, containing soft drink (Coca-Cola and Pepsi), breweries, cigarettes, food, and general
staff (Unilever, P&G, Henkel), which is why we need to look at them on their specific products or business lines. The US soft drink giants present in Romania were not heavily affected in their value in Romania, but it
has been respected a pattern valid in other sectors of business as well. Coca Cola is roughly three times bigger than Pepsi in market value here, and consequently got a higher hit on its value than Pepsi in 2009 (12.7%). Coke was established early in Romania after changes in 1989, beginning of ‘90s, and very aggressive, thus getting a great portion from the local soft drink market quickly. Pepsi’s strategy, even though was much better known in

International Conference of the Institute for Business Administration in Bucharest, 2015 77
Romania before 1989, was much less aggressive. This difference kept them well behind their American traditional competitor. Both companies almost stopped further falling in 2010.
The cigarettes names present in this top, British American Tobacco, Philip Morris and JT International did even better than the aforementioned soft drink companies, which isprobably normal in a difficult period, when people tend to smoke more than before. Usually smokers justify heavy smoking when they enjoy good times or on the contrary, live bad times. All the three companies managed to not reduce their value, just a little in 2009 (5-10%), and stay there in 2010 as well, or rise back at 2008 level, as BAT almost did in full.
The breweries held also by international groups, either under the local brand Ursus (held by SAB Miller) or under international names, like Heineken and Bergenbier (held by Molson Coors).These had similar evolution with many others in this sector of consumer goods, with drop in 2009 vs 2008, but they did not continue dropping anymore afterward. And again, like in other cases, the local brand Ursus survived better than its main competitors from this point of view.
And in the food category, after a severe drop of 33% in 2009, Kraft Foods remained steady in 2010, like Ursus Breweries and many others.It adjusted its strategy and businesses, according to the new paradigm.
In the general goods, another three international companies fought through the crisis, and again what we can see is that the bigger the company is, the more trouble it has in maintaining the market value non altered, at least one year (in 2009 P&G and Unilever went down by 20% and 18% respectively, and then stabilized in 2010). Henkel, much smaller in value than P&G in Romania, was less impacted in 2010.
CONCLUSIONSIn conclusion, after looking at the most relevant industries and companies that survived during the
recessionary period in Romania, between the end of 2008 and 2010, we can say the following:m There are few economic sectors that did better than others during the recent financial crisis. These include
energy, industrial, retail business, consumer goods (specifically cigarettes)m In other sectors, even though hit by the crisis, the International investors continued to further invest and
expand (automotive components, breweries, retail, telecom)m There are complete industries not mentioned in this material. This is because they mainly expected
and confirmed poor results (media & advertising, TV broadcasting, pharmaceutical industry and medical services, even though private medical services marked important investments and expansion, started even during this taught period, electronics and home appliances retail and distribution, construction and banking – these two are present in this material, but with just exceptions)
m Besides the area of dominating business, there are companies doing better than others in the same industry, due to ownership and due to their relative size;
m Generally, privately owned companies managed better than the state owned, unless the state owned took advantage of unfair and non-loyal competition
m Previous statement is valid for private companies as well, when these companies did more business with the Government than within the private sector (see Romstrade case);
m Generally, smaller sized companies did better in the same field than their bigger competitors, due to higher ability to adjust businesses and operations, payroll, etc.
COMMON CONCLUSIONThe analysis done in the two very different countries and markets, USA and Romania respectively, revealed
interesting similarities, but also specific differences, such as:mIn both markets the strongest performing actors during recessionary period are coming from few same
or similar sectors as consumer goods, retail business, utilities and to a lesser extent, energy;mTwo other sectors, industrial and health care, having slightly opposite evolution in the two markets:
Industrial is doing better in Romania, because of still emerging market conditions and future good investing perspectives in auto components spare parts, wood processing, other industrial equipment, whereas health care doing better in the US, with two representatives, one due to a new product launched on the market and the other

78 Building Growth through Recesison
being, by nature, an innovative company;mThe better represented sector in US was consumer discretionary, naming discounter, lower cost home
products and clothes, that had a similarity in the Romanian auto spare parts market, as well as the whole European and world wide low cost car market performance;
mFinancial sector faired very poorly, as expected, with just few exceptions on the both sides of the Atlantic, and was mainly due to their management inspiration in the decision making process.
This being said, we could make now two final conclusions, in return to our main purpose of this paper work:mThe 2007-2009 financial crisis and then the economic one generated similar victims, as industries and
companies, as many did the previous ones, starting with financial sector, construction, agriculture, entertainment and media, broadcasting, industrial, luxury goods, transportation, and so on;
mThere were very few sectors less affected by the crises, already mentioned above, but the most interesting part is that the impact of management and the ownership.As the size, the strategy and the inspiration, and not last, the always claimed luck. This made possible to have better performers than the average in the more affected areas and poorer performers in the less affected areas.
REFERENCESAutoZone, Inc. (n.d.). AutoZoneCom. Retrieved 07 12, 2015, from http://www.autozoneinc.com/about_us/our_
story.htmlCSIMarket Inc. (2015, 07 11). CSIMarket.com. Retrieved 07 11, 2015, from CSIMarket.com: http://csimarket.com/Dollar Tree, Inc. (n.d.). About Dollar Tree. Retrieved 07 12, 2015, from DollarTree, Inc.: http://www.dollartree.com/
custserv/custserv.jsp?pageName=AboutDrugs.com. (n.d.). Retrieved 7 18, 2015, from Drugs.com: http://www.drugs.com/history/incivek.htmlFamily DollarStores, Inc. (n.d.). About Family Dollar. Retrieved 07 12, 2015, from Family Dollar: http://corporate.
familydollar.com/pages/about-family-dollar.aspxFDA.Gov. (n.d.). Retrieved 07 18, 2015, from U.S Department of Health & Human Services: http://www.
accessdata.fda.gov/drugsatfda_docs/nda/2011/201917Orig1s000TOC.cfm Morningstar. (n.d.). Retrieved 07 18, 2015, from http://financials.morningstar.com/ratios/r.html?t=VRTX®ion=
USA&culture=en_USNational Institute for Statistics. (n.d.)Netflix, Inc. (n.d.). Netflix 2008 Annual ReportPeople’s United Financial. (n.d.). 2007 Annual ReportS&P Dow Jones Indices LLC. (n.d.). S&P 500 Fact Sheet. Retrieved 07 08, 2015, from S&P Dow Jones Indices:
https://us.spindices.com/indices/equity/sp-500Silverman, E. (2014, 8 12). From Riches to Rags: Vertex Discontinues Incivek as Sales Evaporate. The Wall
Street JournalSouthwestern Energy Company. (2004). Southwestern Energy Company 2004 Annual ReportSouthwestern Energy Company. (2008). Southwestern Energy 2008 Annual ReportSouthwestern Energy Company. (2009). Southwestern Energy Company 2009 Annual ReportStovall, S. (March 2010). Diversification: A Failure of Fact or Expectation? AAII JournalThe National Bureau of Economic Research. (2015, 07 07). US Business Cycle Expansions and Contractions.
Retrieved 07 07, 2015, from the National Bureau of Economic Research: http://www.nber.org/cycles/cyclesmain.html
Vertex Pharmaceuticals Incorporated. (2006). 2006 Annual ReportWalden, D. M. (n.d.). NC State Universtiy economic perspective. Retrieved 07 12, 2015,from http://www.ncsu.edu/
project/calscommblogs/economic/archives/2008/03/do_some_busines.htmlColection Financial Newspaper “Ziarul Financiar”The Annual Supplement of Financial Newspaper called “1000 most valuable Companiesin Romania” 2008, 2009,
2010Annual Reports 2008, 2009, 2010 for Petrom, Nuclearelectrica, GDF Suez, CEZ Distributie, Automobile Dacia,

International Conference of the Institute for Business Administration in Bucharest, 2015 79
Continental Automotive, Pirelli Tyres, Romstrade, Arctic, Holzindustrie Schweighofer, Alro, Johnson Controls, Carrefour
www.bing.com. Doing Business in Romania; Business Digest. Company FinancialReportsThe National Institute for Statistics in Romania

International Conference of the Institute for Business Administration in Bucharest, 2015 99
MACROPRUDENTIAL TOOLS AND THEIR INTERFERENCE WITH FISCAL POLICY
Ph. D. Petre BrezeanuThe Bucharest University of Economic Studies
Ph. D. Candidate Cristina VladThe Bucharest University of Economic Studies
Abstract: This paper aims to present the evolution of the macro-prudential policy, to highlight the tools used in defining the financial stability and to underline the connection between macroprudential and fiscal policy. In the first part, it is shortly presented the macro-prudential policy in a hystorical approach. We exposed the origin of this term and the evolution of its usage during time. We noticed that after each economic crisis, it started to be more and more pronounced and once the countries faced the economic crisis triggered in 2007, it started to be one of the main approach in terms of economic stability. In the next chapters, we exposed the implementation of the macro-prudential instruments in Romania and then at EU level. Further, we highlighted the connection and the interference of the macroprudential and fiscal policy, with clear examples. In the last part, we emphasized the conclusions obtained with this study.
Keywords: tax , macroprudential, fiscal policy
JEL Codes: O23, E52, H30
INTRODUCTIONThe most recent economic crisis left behind new lessons, different chalenges and lots of debates. And the
most important thing brought into the light the need of prudential Financial system needs a stable environment in order to develop the economy of each country in a healthy way.
In post-crisis time, the financial stability has a macroprudential or systemic dimension that can bot be ignored. The macroprudential tools started to take shape and the need of immplementation became mandatory. But the real challenge comes when authorities must welcome the adoption of new policy tools and place it near traditional policies: monetary and fiscal. Indeed all policies can benefit from taking a systemic view.
The conduct of macroprudential policy requires a better understanding of how the various instruments will work, and also of how they may interact with monetary and fiscal policy. Macroprudential policy cannot deliver financial stability on its own and the key it’s combining the right tools in order to achieve the main objective: a stable economic environment.
MACRO-PRUDENTIAL POLICY - HYSTORICAL APPROACHThe “macroprudential” term was first used in the late of 1970, in an unpublished document of Cooke
Comitee (the precursor of the present Basel Commitee on Banking Supervision) and it started to take shape in 2000 , through an influential speach by Andrew Crokett , at the time General Manager of the Bank of International Settlments.
Up to 1970 existed a fallacy of composition, meaning that the economists and authorities were of the opinion that microprudential approach can cover also the risks in the macroeconomic area. Basically , macro- and microprudential perspectives differ in terms of their objectives and understanding on the nature of risk17. If the goal of the microprudential policies is to keep the financial stability of individuals or of financial institutions as an individual, the macroeconomic policy uses different tools to keep and mentain the stability in the whole financial
17 Borio, C. 2003, „Towards a macro-prudential framework for financial supervision and regulation? BIS Working Papers No 128, February”

100 Building Growth through Recesison
system and to control problems that may affect and disturb the economic environoment as a whole.Lessons learned after the financial crisis triggered in 1929 primarily aimed the control of the competition
in the banking system and of the capital movements. Banks started to pay attention to interests rates and to the quality of loans portofolio. In this sense, in 1933-1960, the atmosphere in the banking system was „quiet”, without big losses but also without improvements. In this situation, central banks had not paid attention to financial stability and to macroeconomic problems. The change comes when the banking unions appeard and the market of European currencies convertible and US dollar started to develop. Banks started to borrow money from the interbank market and to raise their loans portofolio. In `70, USA banks started to borrow the Latin American countries with big amounts, but in 1970 – 1980 period, the increased interest rates, oil prices and the decrease of the materials exported by Latin American countries determined these states to be unable to pay their debts. In this situation, american banks, which were high exposed with loans on these affected countries became insolvent. After this second crisis, authorities started to be worried and they started to consider the macroprudential policy a solution of financial stbility18.
After this debt crisis, lots of agreements and measures were discussed and so appears first Basel I and then Basel II, but without favorable results because no later then 2007, triggered a new economic crisis. Starting with this year, macroprudential policy comes to the fore and countries all over the world, tries to find suitable measures to reduce risks that comes with cyclical evolution of loans and liquidity, financial innovations, capital market development, and with faillure of important financial institutions.
Basel III comes with several aspects wich reflects a macroprudential approach19. Several provisions in Basel III help to address systemic risk and interconnectedness among (global) systemic institutions by mitigating the risks arising from firm-level exposures. These include: higher capital requirements for trading and derivative activities, liquidity requirements that better address the funding risks related to the excessive reliance on wholesale short term funding and higher capital requirements for inter-financial sector exposures20.
As we can observe, the macroprudential policies started to take shape after the financial institutions passed 3 economic crisis around the world. The term “macro-prudential” has risen from virtual obscurity to an astonishing importance, especially after the recent financial crisis 21. It was accepted the fact that actions which are appropriate for a financial institution as an individual can lead to major problmes for the whole financial system. Continued efforts are needed to create a stable and coherent international framework to prevent crisis.
The aim of macro-prudential policy should definietly be about tempering the cycle and the main goal of the central banks is to curb the financial cycle, using an adequate toolkit22. Macroprudential policies are not the only policies aimed at economic (including price) and financial stability. Others include monetary, microprudential, fiscal, as well as competition policies. Macroprudential policies interact with these. Furthermore, some macroprudential policies can be motivated by the need to correct for the “distortions” introduced by other policies. Macroprudential policies can also have international spillovers, both inward and outward, and consequently there can be overlap and interrelationships with capital flow management policies. How to coordinate macroprudential policies with these other policies?23 The only way is using appropriate tools .
THE IMPLEMENTATION OF THE MACROPRUDENTIAL TOOLS IN ROMANIAIn Romania, the evolutions of the financial system from recent years made the authorities responsible for
the authorization, regulation, supervision and control of financial markets system components, work together to ensure transparency and integrity, compliance with applicable legal framework and the widening of national financial stability.
In order to implement the European Union requirements regarding the macro-prudential supervision, on
18 Isarescu, M. (2011), “Macroprudentialitatea. Reglementarea, crizele financiare si politica monetara” Isarescu, M. (2011), “Macroprudentialitatea. Reglementarea, crizele financiare si politica monetara”Isarescu, M. (2011), “Macroprudentialitatea. Reglementarea, crizele financiare si politica monetara”
19 Borio, C. (2011). Rediscovering the macroeconomic roots of financial stability policy: journey, challenges and a way forward. BIS Working Papers No 354, September.
20 Bank for International Settlments (2011), “Macroprudential policy tools and frameworks”, february
21 Orkida, I., Gentiana, G., “Financial crisis. Implementation of macro- and micro- prudential regulation”, REASER working papers, Volume 5, Issue 1/2013
22 Constancio, V. (2014), “Makink the macro-prudential work”. ECB Vice-President speech, june 2014
23 Stijn, C., “An overview of macroprudential tools”, IMF working paper 14/214, 2014

International Conference of the Institute for Business Administration in Bucharest, 2015 101
31 july 2007, was signed the „Agreement for cooperation in the field of financial stability and financial crisis management”, under which was established the National Comittee for Financial Stabillity. The members of this Comittee are: Minister of Finance, the Governor of the National Bank of Romania, President of the National Securities Commission, the Insurance Supervisory Commission President, Chairman of the Private Pension System Supervisory and Executive Director of the Deposit Guarantee Fund the Bank
We can see from this perspectives that the financial stability and in the same time the macro-prudential policy are not only Central Bank’s objectives achived through a stable monetary policy. The financial stabillity involves all the institutions that contributes at the financial system health. In this sense, the main way established at the Comittee level which leads to final objectives is promoting a permanent and effective exchange of information between authorities responsible for regulating and overseeing the different sectors of the financial system and managing financial crises at the level of individual financial institutions, financial groups or the financial market as a whole. It should be noted that co-operation is carried out under the Agreement without prejudice to the powers and responsibilities of the parties arising from the provisions of the legislation under which they operate.
Later, on 1 June 2008 was signed the „Agreement on Cooperation between the Financial Supervisory Authorities, Central Banks and Finance Ministries of the European Union on cross-border financial stability” by the National Bank of Romania, Ministry of Finance, the National Securities Commission and the Insurance Supervisory Commission of the Private Pension System Supervision. This Agreement replaced the one signed in 2005 and it provided the follwing objectives: common principles for cross-border financial crisis management, a common analytical framework for assessing the systemic implications of potential crises, to ensure a common terminology applicable to cross-border financial crisis by all relevant authorities and the creation of preconditions for making timely assessments necessary to facilitate the adoption of decisions in crisis and a practical guide for crisis management to reflect a common understanding of the steps and procedures to be implemented in a cross-border crisis situation 24.
Even if the macro-prudential strategy it’s organized according with all the mentioned institutions, National Bank of Romania remains the main pawn in appling the macro-prudential tools, especially when it comes for banking system. Considering the fact that the interest rate is the main tool for monetary policy used by NBR and it is well known that it can’t be also used in a macro-prudential purpose, NBR tried to take several mesures in order to stabilize the banking system after the economic crisis.
One of this measure is the introduction of the report loan to value (LTV) in the NBR norms in 2003. Through this report it’s established the loans value acoording with the collateral value. The value of this indicator (LTV) proved to be an important element in influencing how the debtor honors debt service and becuase of this banks should mentain a prudential level of it. According with banks statistics, loans approved to househols , with real estate collaterals that had arrears over 90 days showed higher differences betweenn the LTV value at the time the loan was disbursed comparing with the time after economic crisis (2013)25.
The percentages of LTV ratio were modified in 2011, through NBR Regulation 24/2011, regarding new rules for individual loans. This change comes after experiencing the effects of the individuals behaviour during the crisis: they became unable to pay their debts and once the real estate market crashed, the real estate collaterals couldn’t cover the loans balance. According to this, NBR established the following loan-to-value ratios: 85% for housing loans denominated in local currency, 80% for housing loans in foreign currency, but with borrowers covered to currency risk, 75% for housing loans denominated in euro and with borrowers uncoverd to currency risk and 60% for housing loan denominated in another currency and with borrowers uncovered to currency risk.
Also from 2003, NBR introduced in its reports the debt service to income (DSTI) indicator regarding the levarage of the debtors. Also because of the economic crisis effects, the leverage percentage was modified by NBR in 2011. According to the Regulation published in 2011, the maximum degree of indebtedness for consumption loans depends on the foreign exchange rate, interest rate risk and income risk. The shok values for these three factors are the local currency depreciation of 35.5 percen according to EUR, 52.6 percent to CHF and 40.9 percent to USD, the impact of 0.6 percentage points for interest rate rosk and the reduction with 6 percent
24 www.bnr.ro
25 National Bank of Romania, “Raport asupra stabilitatii financiare”, 2013

102 Building Growth through Recesison
of disponable income. These rules are extended in 2012 also for non-financial corporate sector uncovered at toe curreny risk. Through this extention, NBR is asking the lenders to use stricter conditions for the loans approved in foreign currency , taking into account the exchange rates shocks.
Also the ratio regarding the minimum reserve was used as a macro-prudential tools. In 2004-2006 period, NBR increased gradually the minimum reserve from 25% to 40% for foreign currency liabilities with maturities of more than two years. This measure was quite efficient in that period, manageing to deacrese the the loans in foreign currencies volume for a while. When the crisis began to be felt and the funds were blocked, NBR used this ratio of minimum reserve by deacreasing it in order to help the liquidity in the banking system: meintained the ratio up to 15% for the liabilities in the local currency and in 24april-23 may 2011, decreased the ratio from 25% to 20% for the liabilities in foreign currency with maturities up to two years26.
In 2009, was signed The Vienna Agreement between NBR and parent banks of the nine banking institutions with foreign owners which develop their activities in Romania and are covering around 70% of romanian banking assets. This Agreement was susteined and promoted by IMF and European Comission and it represented a macro-prudential view for romanian banking system. These instution to maintain the total exposure on romanian market , to Increase capitalization of in over 10 % and to introduce restrictions regarding dividends payments during the years of economic crisis. The goal of this agreement was to ensure the stability of the banking system in Romania. All three commitments were met, with the result that Romania decreased the crisis effects, and the government was not forced to intervene to save any bank or to ensure compensation to any depositor.
Another macro-prudential tool which is not implemented but it is taken into account is the „bridge-bank”instrument, wich was proposed in 2011 and it reffers to a possible restrusturing of the banks which may affect the proper functioning of the financial system. This „bridge-bank”should be a new institution, founded based on NBR desicion and owned by Deposit Guarantee Fund in the Banking System, wich will take over the assets and liabilities of the restructured bank in order to meintain the financial stability, ensuring protection for depositors and continuing to provide services for the clients. We have to mention that this kind of bank can not go to bankrupt.
The „bridge bank „ tool was used for the first time in 1987 by the Federal Deposit Guarantee Agency in US. Also, in response to the current global financial crisis, the” bank bridge „was included in the set of measures to stabilize in several EU countries, such as Germany, UK, Czech Republic and Ireland. In addition, the „bridge bank” is a component of the set of mechanisms for the resolution of credit institutions whose activities are deemed to affect the proper functioning of the financial system; this mechanism is being introduced in the forthcoming European directive for financial crisis management27.
It is obvious that National Bank of Romania has an important role in maintaining financial stability, given the responsibilities arising from the double position: both prudent and monetary authority. Cooperation between National Bank of Romania and other regulatory and supervisory authorities of the different sectors of the Romanian financial system had been gradually intensified as the romanian financial system as a whole had become more dynamic and complex.
THE IMPLEMENTATION OF THE MACROPRUDENTIAL TOOLS IN EUROPEAN UNIONRegarding the immplementation of the macro-prudential tools at the European Union level, the authorithies
are trying to find the best solutions and a suitable framework for all Member States in order to mitigate systemic risk on the one hand and on the other hand to stabilize the financial system. Looking back and analyzing the financial datas we can say that at the national level, Member States have made substantial progress in establishing macro-prudential authorities, but also in immplementing the macro-prudential instruments.
For example, Austria introduced the net new lending to local stable funding ratio as a monitoring ratio in december 2012, after the communication from marh 2012. Also communicated in 2012 but immplemented in 2013 were the minimum standards for the risk management and granting of foreign currency loans and loans with repayment vehicles. These standards were sustained by Financial Market Authority. In 2010, Austria implemented new principles on foreign exchange lending. Similar with Romania and also other Member States, austrian banking
26 Danila, N. (2011), “Sistemul bancar din Romania, pilon al stabilitatii financiare”, Constanta speach
27 www.bnr.ro

International Conference of the Institute for Business Administration in Bucharest, 2015 103
system had losses because of the approved loans in foreign currency during the crisis. Next year, in 2016, Austria is planing to introduce the macro-prudential instrument regarding capital surcharge for large banking groups28.
Netherlands implemented the indicator loan to value in 2013, later then Romania and the authorities are planing to introduce also the capital surcharge for large banking groups from 2016.
Norway also introduced the loan to value indicator in its national reports starting with 2010 and the loss given default floor on mortgages from last year, 2014. The Central Bank is planning to implement in 2015 the countercyclical capital buffer as a macro-prudential tool.
In 2010, Sweeden paid attention to loan to value indicator and starting with 2013, implemented another two importants macro-prudential tools: liquidity coverage ratio and risk-weight floor on mortgages.
Following the recommendation of the European authorithies, Switzerland implemented in 2013 the sectoral countercyclical buffer29.
Germany began to apply the lessons learnt from the financial crisis to its financial regulation soon after the crisis broke out, setting up individual resolution agencies for credit institutions’ non-performing assets,12 creating a fund for recapitalising and restructuring financial institutions and imposing a temporary ban on naked short selling for certain types of securities. In addition, the adoption of the Financial Stability Act, which entered into force at the beginning of 2013, was another step promoting lasting stability in Germany’s financial system30.
These are some examples of the changes brought in some European countries by the European Systemic Risk Board and by the economic crisis effects.
Starting with 1 of january 2014, in European reports regarding macro-prudential policy are published new instruments wich should represent a starting point for european countries in order to achive one of the most important objective: financial stability.
THE CONNECTION OF MACROPRUDENTIAL TOOLS WITH FISCAL POLICIESThe financial crisis has made it clear that systemic risk with its implications for financial stability was not
given enough attention in the past. We have learnt the painful lesson that we have to put the financial system on a sounder footing, and we need to draw the right conclusions from the global financial crisis. The costs of inaction have been high, and doing nothing is simply not an option31. But also we have to take in consideration that implementing the macrorpudential policy with all the exposed tools, doesn’t mean that we can rely on prudential policies in order to achieve the financial stability; other policies such as monetary or fiscal ones, also play an important role. And when we are talking about creating a generally stable economic environment, the interference of all policies a state is using, becomes a must. In general, macroprudential policies are more effective when they push in the same direction as other policies32.
A relevant example relates to real estate market. After the crisis, when in general people are affraid to make expensive investments, the role that tax incentives play in the overheating of real estate markets, for example by promoting owner-occupied housing through overly generous tax deductions for mortgage lending rates, is very pronounced.
Also, as future tax liabilities are capitalized, in principle, imposing taxes during a boom can make bubbles less likely; or the announcement of future tax relief on asset returns can support asset prices during a bust. For example, during the crisis countries have used tax measures to bolster house prices by removing stamp duties on housing transactions or extending mortgage interest relief. These kind of measures may have an important role to play when real estate prices are driven by capital inflows that by-pass the domestic financial system.
In the same time, these measures can also introduce further distortions and may ultimately increase price volatility, but their effect on house price dynamics may have benefits in reducing systemic risks. Indeed, the practical feasibility of cyclical changes in taxes could be limited due to lags in fiscal decision making and
28 European Systemic Risk Board, (2014), “Flagship report on macro-prudential policy in the banking sector”
29 European Systemic Risk Board, (2014), “Flagship report on macro-prudential policy in the banking sector”
30 Deutsche Bundesbank Monthly Report, April 2013 „Macroprudential oversight in Germany: framework, institutions and tools”
31 Speech of Dr Andreas Dombret , Member of Executive Board of the Deutsche Bundesbank, 12.02.2013
32 V Bruno, I Shim and H S Shin, “Comparative assessment of macroprudential policies”, working paper presented at the BIS-Reserve Bank of New Zealand conference on “Cross-border financial linkages”, Wellington, 22–24 October 2014

104 Building Growth through Recesison
implementation33. Choosing an appropriate fiscal policy is not an easy thing, especially when its effects have to be in accordance
with the macroprudential approach. The build-up of systemic risk depends not only on the banks behavior or on the consequences brought by the financial crisis, but also can be driven strongly by macroeconomic imbalances and distortions that affect the composition of output.
In this regard, when a consumption boom is fed by capital inflows in the presence of persistent current account deficit, macroprudential policies alone are unlikley to be effective at controlling these underlying forces and prudent fiscal and structural policies are needed to reduce these imbalances34. And how this thing can be done? By increasing or introducing new taxes in order to balance the supply-demand on the one hand and to deacrese the current account deficit on the other hand.
In the same context, it is worth to mention that prudent fiscal policies are essential to mantain the saftey of sovereign debt and to avoid adverse feedback loops between sovereign risk and the financial system35. This situaion is more likley in recessions, when the government often finances itself using foreign debt and the debt dimension depends on the stability and prudence of the fiscal instruments and taxes policies used.
After the financial crisis, several times has been brought into discussion the debt bias, which can be encouraged by the existing tax policies and can strongly contribute to systemic risk. Macroprudential authorities claim for the correction of such biases, since they represent an obstacle in their way to achive the macroprudential objectives.
The recommendation to reduce the benefits from accessing certain debts by companies came with the spread of a tax system that favors the debt financing, instead of equity financing. In this regard, most states allow deduction of interest expenses generated by borrowing, which eventually lead to the reduction of income tax, while the return to equity is not mandatory. There is evidence that this effect matters for leverage choices of non-financial companies, as well as financial institutions .
To combat this debt bias, Member States such as Spain, Malta, France, Portugal, Finland and Sweden had restricted the deductibility of interest expenses by setting a maximum threshold (eg in France and Portugal,the deduction of interest expenses is limited to 3 million Euro) or completely eliminated it.
The second case of bias is represented by the tax treatment of housing, which can make households more vulnerable to shocks and exacerbate systemic risk. Many countries do not (or only lightly) tax imputed rent, while providing generous relief for mortgage interest. This can be a source of significant distortion (and revenue loss), as households are encouraged to borrow against housing assets, either to invest in non-housing assets or to finance immediate consumption. High mortgage debt can make households more vulnerable to shocks, thus exacerbating transmission channels in the financial system leading to a crisis36.
In view of these interactions with fiscal policy, and possibly between several responsible authorities, macroprudential policy is necessarily somewhat more complex in its implementation. Coordination and ex ante clarity about roles, responsibilities and powers among the relevant authorities will be key to ensure that decision-making is timely and effective37.
CONCLUSIONSThe macro-prudential policy started to be highlighted once the economic crisis affected the financial system
and the economic environoment as a whole. The usage of this term started to pe present from the late 1970, once a liquidity crisis was felt din the USA banking system, but it made sense starting with 2000. In fact, economists and competent authorieties tried to extend the well known micro-prudential policies to a macro environoment, so that can be covered all the financial system. After 2000, countries started to sign agreements, to find a way to establish rules which should ensure a stable economic environoment during an economic crisis. But this wasn’t posible up to 2007, when the latest economic crisis affecetd financial system all over the world.
33 International Monetary Fund, ” Key aspects of macroprudential policy”, June 2013
34 International Monetary Fund, ” Key aspects of macroprudential policy”, June 2013
35 International Monetary Fund, ” Key aspects of macroprudential policy”, June 2013
36 International Monetary Fund, ” Key aspects of macroprudential policy”, June 2013
37 J Caruana, “The challenge of taking macroprudential decisions: who will press the button(s)?”, speech, 13th Annual International Banking Conference, Chicago, 24 September 2010.

International Conference of the Institute for Business Administration in Bucharest, 2015 105
After they experienced the devastating effects of the crisis, countries started to consider the macro-prudential policy as one of the main policy wich should be applied in a state, near fiscal and monetary policy. The macro-prudential policies are very useful, but their main objectiv it’s not yet well highlighted and measured like the stability of the prices in case of monetary policy for example. But if we compare the present economic period with the period before the crisis, we can observe improvements. Countries pay more attention on the macro-prudential policies and on the systemic risk importance.
The main macro-prudential instruments used in Romania are the indicators loan to value and debt service to income; they had been introduced in 2003, but reviwed in 2011. After 2007, Romania started to look for other macro-prudential instruments in order to ensure the financial stability. The ratio regarding minimun reserve was used as a tool to raise the banks liquidity. With other European countries, Romania is taking into account the instrument „bridge – bank”, wich could cushion the negative effects in the financial system caused by an economic crisis. This instrument was implemented in USA in 1987.
The European states started to pay a higher attention to macro-prudential policy also starting with 2007. Countries like Austria, Netherlands, Sweeden, Norway and Switzerland were receptive to the instruments promoted by authorieties and used them in order to establish a suitable framework for economic environoment.
Regarding the interference between macroprudential and fiscal policy, there are some cases when their connection is very important in order to reach the financial stability. In case of real estatemarket, with an appropriate fiscal policy, taxes can be applied in order to help to immplementation of macroprudential tools. Authorities can use tax measures to discourage the price increases in boom conditions or unlock the real estate market during and after the crisis. Also, increasing or introducing new taxes can balance the supply-demand on the one hand and deacrease the current deficit on the other hand. All these measures can contribute significantly to the reduction of systemic risk.
Existing tax policies encouraged before de financial crisis the debt bias, which can strongly increase the systemic risk. The fact that the reduction of the corporate tax debt bias was part of the established priorities for EU Member States,regarding fiscal policies, communicated first in 2012, in the annual growth survey by European Comission, it’s an obvious proof that fiscal policy can influence the spread of the systemic risk, helping in this way the macroprudential tools.
Another conclusion obtained with this paper reffers about sovereign debt. Prudent fiscal policies are essential to mantain the saftey of sovereign debt and to avoid adverse feedback loops between sovereign risk and the financial system.
The interaction between macroprudential and fiscal policies need to be better understood and the process regarding implementation of macro-prudential tools must continue and create an international framework to prevent other economic crisis. The European authorities and central banks have big expectations regarding the macro-prudential policy, which should interfere with other economic policies, not only with fiscal one, in order to ensure a stable financial system because the global financial crisis has demonstrated the need for fundamental reform of the financial system. The underlying structure of the international financial and monetary system is being re-evaluated. Whatever its structure, the prudential regulatory framework will need to be re-oriented to have a system-wide focus. And improvements need to be made to allow financial institutions to fail without imposing unacceptable costs on the rest of society.
REFERENCESAllen, F., Carletti, E. „Systemic risk from real estate and macro-prudential regulation”, Int. J. Banking, Accounting
and Finance, Vol. 5, Nos. 1/2, 2013Bank for International Settlements (2014), “The leverage ratio over the cucle”, Working paper no. 471Bank for International Settlments (2011), “Macroprudential policy tools and frameworks”, FebruaryBank of England, “The role of macroprudential policy”, working paper, 2009Borio, C. (2011). Rediscovering the macroeconomic roots of financial stability policy: journey, challenges and a
way forward. BIS Working Papers No 354, SeptemberCaruana, J. “The challenge of taking macroprudential decisions: who will press the button(s)?”, speech, 13th,

106 Building Growth through Recesison
Annual International Banking Conference, Chicago, 24 September 2010.Constancio, V. (2014), “Makink the macro-prudential work”. ECB Vice-President speech, june 2014Costeiu A., Neagu F., “Bridging the banking system with the real economy: a financial stability persective”, 2013Danila, N. (2011), “Sistemul bancar din Romania, pilon al stabilitatii financiare”, Constanta speachDeutsche Bundesbank Monthly Report, April 2013 „Macroprudential oversight in Germany: framework, institutions
and tools”Directive 2013/36/EU of the European Parliament and of the Council of 26 June 2013 on access to the activity of
credit institution and the prudential supervision of credit institution and investment firms, amending Directive 2002/87/EC and repealing Directives 2006/48/EC and 2006/49/EC, OJ L 176, 27.6.2013
Dragan, M. (2012) “Macro-prudential view of financial stability “, Working paperEuropean Systemic Risk Board, (2014), “Flagship report on macro-prudential policy in the banking sector”European Systemic Risk Board (2014), “The ESRB handbook on operationalising macro-prudential policy in the
banking sector”Isarescu, M. (2011), “Macroprudentialitatea. Reglementarea, crizele financiare si politica monetara”International Monetary Fund, “Key aspects of macroprudential policy”, june 2013Jordi, G. “The monetary Pillar and the great financial crisis”, june 2010Lege privind supravegherea macroprudențială a sistemului financiar naționalNational Bank of Romania, “Raport asupra stabilitatii financiare”, 2013Ojo, M. “Capital, liquidity standards and macro prudential policy tools in financial supervision: addressing sovereign
debt problems”, Lessing Trebing Bert Rechtsanw¨alte, Oxford Brookes University, 2011Orkida, I., Gentiana, G., “Financial crisis. Implementation of macro- and micro- prudential regulation”, REASER
working papers, Volume 5, Issue 1/2013Regulation (EU) No 575/2013 of the European Parliament and of the Council of 26 June 2013 on prudential
requirements for credit institutions and investment firms and amending Regulation (EU) No 648/2012, OJ L 176, 27.6.2013
Siregar R., „Macro prudential approaches to banking regulation: perspectives of seleceted Asian Central Banks”, 2011
Stijn, C., “An overview of macroprudential tools”, IMF working paper 14/214, 2014Voinea, L., “Stabilitatea financiara, riscul systemic si instrumentele macroprudentiale din perspective bancii
central”, februarie 2015W. Paczos, K. Shakhnov, “Sovereign debt issuance and selective default”, February 2014
www.bnr.rowww.bis.orgwww.imf.orgwww.eu.europa.eu

International Conference of the Institute for Business Administration in Bucharest, 2015 115
CORPORATE SOCIAL (CS) AND CORPORATE FINANCIAL PERFORMANCE (CFP):
AN EMPIRICAL EVIDENCE FROM LISTED COMPANIES IN ROMANIA
Ph. D. Candidate Liliana SimionescuThe Bucharest University of Economic Studies
Abstract: This paper aim is to empirically investigate the relationship between CSP and CFP by using both accounting-based measures, namely Return on Assets (ROA), and Return on Equity (ROE), as well as market-based measures, respectively Earnings per Share (EPS), on a sample of 21 companies listed on Bucharest Stock Exchange (BSE) over the period of 2011 to 2013. We employed OLS regression models and we found a positive and statistically significant relationship between CSP and EPS. The current paper novelty consists in consideration of mixed performance ratios and also enhanced the literature on the link between CSP-CFP. This research is important for academic as well as practitioners filed, since CSP engagements improve CFP.
Keywords: Corporate Social Performance, Corporate Social Responsibility, Accounting-based measures, Market-based measures, Romania, OLS regression models
JEL Codes: M14, C23
INTRODUCTIONCorporate social responsibility (CSR) is corporations’ idea to act and develop their business in socially
responsible ways. The father of CSR concept is Bowen (1953) but the discussion of executives and business being socially responsible (SR) began in the late 1920s (e.g. Barnard, 1938; Kreps, 1940). Since then the topic has been debated and remains even today, the subject of continuous debates. Friedman (1962), the most famous critiques of CSR concept argued that company’ socially desirable goals should not be on firms’ profitability expense. Continuing its arguments’, the author underlined that CSR activities should be disconnected from companies because reduces shareholders wealth. Thus, companies managers should use corporate resources to maximize shareholders wealth and not to cause other than profit maximization (Friedman, 1962). CSR concept gained momentum when Freeman (1984) introduced stakeholder theory. According to this theory, corporation should act responsible toward all stakeholders by meeting their interests and requirements. Stakeholders are affected differently, positively or negatively, as a result of companies’ business interests. According to Porter and Kramer (2006, 2011), companies that shift societal issues from periphery to business core strategies, ‘create shared value’. This involves creation of economic value in ways that society value is created as well. Currently, CSR has emerged as “an inescapable priority for business leaders in every country” (Porter and Kramer, 2006, p. 78). In the year of 2010, the International Organization for Standardization (ISO) released ISO 26000, meant to provide guidance for organizations and businesses to operate in socially responsible ways. Between 2011-2014 years, European Commission (EC) published an improved European Union (EU) strategy for CSR, underlining that enterprise “should have in place a process to integrate social, environmental, ethical human rights and consumer concerns into their business operations and core strategy in close collaboration with their stakeholders” (EC, 2011, p.6). OECD published as well in 2011 Guidelines for Multinational Enterprises, having also recommendations as regarding ways in which CSR should be conducted. The extent to which companies engage in CSR activities or understand these activities is strongly discussed in the literature on CSR. Some underline that CSR could be a simple window dressing; others argue that CSR activities became a trap for many business executives leading to myopia by assuming to much of the social responsibility activities or the wrong ones (Crowther, 2004; Painter-Morland, 2006). For CSR to continue to flourish it needs an economic justification; without any evident benefits for companies (Wang et al., 2008b).

116 Building Growth through Recesison
In order to find economic justification, researchers have investigated empirically the link between CSR or corporate social performance (CSP) and CFP. No consensus exists regarding the CSR concept definition. Dahlsrud (2008) acknowledged 37 definitions of CSR concept while Carroll and Shabana (2010, p.3) said that the true number of CSR definitions may be greater, “because many academically derived definitional constructs were not included”. Carroll (1991) introduced its CSR pyramid, suggesting that CSR encompasses economic, legal, ethical, and philanthropic responsibilities. While CSR is lacking in a clear definition, similar concepts have emerged in literature such as CSP, corporate citizenship (CC), and sustainable development (SD). According to Wood (1991, p.693) CSP is “a business organization’s configuration of principles of social responsibility, process of social responsiveness, and policies, programs, and observable outcomes as they relate to the firm’s societal relationships”. While several researchers use CSR and CSP interchangeably in their empirical studies (Margolis et al., 2007), others attempt to differentiate between the two concepts. Carroll (1991) said that CSR highlights obligation and accountability towards society, corporate social responsiveness stresses action and activity, while CSP highlights outcomes and results. As Chillida (2009) argued, CSR commitment is a leading measurement system performance while CSP is a lagging measure (actual, objective, and backward-looking). Similarly, Maron (2006) suggested that through CSP, CSR became applicable and be placed into practice. Visser et al. (2010) underlined that CSP can be regarded as an extension of CSR concept, as it focus on actual achieved results rather than general notion of responsibility to society or businesses’ accountability.
The link between CSP and CFP has become extensively debated amongst business executives and management theorists. Margolis and Walsh (2001) acknowledged 95 empirical studies on the relationship between CSP and CFP published since 1972. In a later study (Margolis and Walsh, 2003), identified a total of 127 research papers published on this topic. They found ‘mixed’ results on CSP-CFP relationships ranging from positive, negative, to neutral. In the Orlitzky et al. (2003) metaanalysis, the authors reported that CSP is positively correlated with CFP. This paper reveals that researchers have investigated the relationship between CSP-CFP in the context on specific background such as specific country (mostly developed countries), or a given industry. Thus, the literature is lacking in a comprehensive understanding as regarding the relation between CSR-CSP not only in developed nations but also in developing countries as well such as Romania where the empirical studies in this direction are a scarcity.
This paper aims to develop an empirical study on the relationship between CSP-CFP for the companies listed on the Bucharest Stock Exchange (BSE). As such, we try to investigate if CSP is correlated with CFP, as well as if CSP-CFP relationship completes one on each other as underlined in the literature reviewed above. The rest of the paper is structured as follow. Section two describes the study methodology and in the third section are discussed regression results. The final section presents this paper conclusions as well as further research.
RESEARCH METHODThis paper empirically analyzes the relationship between CSP and CFP for companies listed on BSE. At
BSE are listed 81 companies including, in addition to financial institutions, wholesale/retail (4), construction (8), pharmaceuticals (4), manufacturing (21), plastics (3), machinery and equipment (8), metallurgy (4), food (3), chemicals (4), basic resources (4), transportation and storage (2), tourism (3), and utilities (2). We considered for our dataset 21 companies listed on BSE from 2011 to 2013.
Whether or not CSP impacts negatively or positively CFP is still datable not only because social performance is difficult to measure but also because of CFP variable used for measurement.
Waddock and Graves (1997) found a significant and positive correlation between CSR/CSP performance and CFP when they used accounting based measure such as return on assets (ROA) in the long run. Moreover the author underlined that accounting based measures are proper measures to be used for CFP while other suggests that market measures are the right one (Alexander and Buchholz, 1978), and others considered the used of both measures as being the proper ones (McGuire et al, 1988). This paper use for the regression model both accounting and market measures. Thus, we employ in our regression model ROA, ROE and EPS as dependent variables, one independent variable and a set of control variables detailed in Table 1.

International Conference of the Institute for Business Administration in Bucharest, 2015 117
Table 1. Variable definitions and computation formula
Var Definition and computation formula
Accounting-based performance measures
ROA The return on assets ratio is the net income dividing by total assets.
ROE The return on equity ratio is the net income by dividing shareholder’s equity.
Market-based firm performance measures
EPS The earnings per share ratio, is the net income dividing by company’s total number of capital stock shares.
CSP measurements
CSP Sum allocated by companies per year for socially responsible practices published in their CSR reports or web sites
Control variables
Size Company’s total assets.
Empl The total number of company’s employees.
Risk Company’s long term debt divided by its total assets.
Source: Authors proceeding
Jones (1995) said that trust, credibility as well as cooperativeness are subsets of company’s ethical principles, and helps the organizations to accomplish a significant competitive advantage. The satisfaction of key stakeholder represents the company leverage in achieving financial performance (Orlitzky et al., 2003). This suggests a positive relationship between CSP and CFP. Therefore, the following hypothesis can be advanced:
H0. There is a positive relationship between CSP and CFP.
RESULTS DISCUSSIONIn order to test the research hypothesis, we employed OLS regression model. Table 2 reveals the Pearson
correlation matrix which show the correlations between variables used in our data set. The correlations indicate whether or not variables are related and how strong this relation is. We notice a strong correlation (r = .608) between EPS and ROA but no correlation between CSP and CFP. The correlation matrix shows a positive and statistically significance between CSP and EPS.
Table 2. The correlation matrix
Var ROA ROE EPS CSP Size Empl Risk
ROA 1.0000
ROE .420*** 1.000
EPS .608*** .139 1.000
CSP .084 .063 .087* 1.000
Size .180*** .017 .112* -.059 1.000
Empl .194*** .914*** -.015 -.050 -.0062 1.000
Risk .137** .050 .083 -.065 .152* .023 1.000
Source: Authors’ computation. Notes: p < 0.10. *p < 0.05. **p < 0.01. ***p < 0.001.
Table 3 shows the regression results regarding the relationship between CSP and CFP. We can notice that only in the case of third model when EPS is the dependent variable, our hypothesis is validated. Thus, we do not reject the null according to which there is a positive and statistically significance relationship between CSP and

118 Building Growth through Recesison
CFP when EPS is the dependent variable. An increase of 1%, in CSP, ceteris paribus, increase company EPS with approximately 7%.
Table 3. Regression results
Dependent Var →Independent Var ↓
ROA(Eq. 1)
ROE(Eq. 2)
EPS(Eq. 4)
Const. 0.073** 0.166* 3.090***
CSP 0.020 0.049 0.070*
Size 6.770 3.768 3.110***
Empl 7.950 2.720 0.004***
Risk 0.242*** 1.344*** -1.172
F-stat. 21.018*** 7.313*** 8.644***
Prob(F-stat.) 0.000 0.000 0.000
R-sq. 0.289 0.122 0.132
N 243 243 243
Source: Authors’ computation. Notes: p < 0.10. *p < 0.05. **p < 0.01. ***p < 0.001.
In the case of equation 1 and 2 where ROA and ROE are the dependent variables, the models are not statistically significant. According to R-sq., about 28%, 12% and 13% of the total variation in the dependent variable (ROA, ROE, and EPS) can be explained by the model.
CONCLUSIONS AND FURTHER RESEARCH This paper empirically investigate the relationship between CSP and CFP by using both ROA, ROE, and
EPS as depended variables, on a sample of 21 companies listed on BSE over the period of 2011 to 2013. By employing OLS regression models and considering several control variables such as company size, company’s t total number of employees, as well as indebtedness, we found a positive and statistically significant relationship between CSP and EPS. Further research needs it to be made as regarding the effects of implementing CSP practices in relation with CFP. For CSP practices to be reflected on CFP it takes time, and vice versa.
REFERENCESAlexander, G. J., Buchholz, R. A., (1978). Corporate Social Responsibility and Stock Market Performance,
Academy of Management Journal, 21(3), 479-86. Barnard, C.I., 1938. The Functions of the Executive. Harvard University Press; Cambridge, MA.Bowen, H.R., 1953. Social Responsibility of the Businessman. Harper and Row, New York.Carroll, A.B., 1991. The pyramid of corporate social responsibility: toward the moral management of organizational
stakeholders. Bus. Horizons 34, 39-48.Carroll, A.B., Shabana, K.M., 2010. The business case for corporate social responsibility: a review of concepts,
research and practice. Int. J. Manag. Rev. 12 (1), 85-105.Chillida, J.J.C., 2009. Performance Prism, a New Approach to Corporate Social Responsibility. Aarhus School of
Business, Aarhus University. Master thesis.Crowther, D., 2004. Corporate social reporting: Genuine action or window dressing? In: Crowther, D., Rayman-
Bacchus, L. (Eds.), Perspectives on Scorporate Social Responsibility. Ashgate Publishing Ltd, England.Dahlsrud, A., 2008. How corporate social responsibility is defined: an analysis of 37 definitions. Corp. Soc.
Responsib. Environ. Manag. 15 (1), 1-13European Commission, 2011. A Renewed EU strategy 2011-14 for Corporate Social Responsibility: Communication
from the Commission to the European Parliament. the Council, the European Economic and Social Committee and the Committee of the Regions.
Friedman, M., (1962). Capitalism and Freedom. University of Chicago Press.

International Conference of the Institute for Business Administration in Bucharest, 2015 119
ISO 26000 (2010). Guidance on Social Responsbility, On line at: http://www.iso.org/iso/home/standards/iso26000.htm
Jones, T., (1995). Instrumental stakeholder theory: A synthesis of ethics and economics. Academy of Management Review, 20, 404-437.
Kreps, T.J., (1940). Measurement of the social performance of business. In: An investigation of concentration of economic power for the temporary national economic committee (Monograph No. 7). U.S. Government Printing Office, Washington, DC.
Margolis, J.D., Walsh, J.P., (2001). People and Profits? the Search for a Link between a Company’s Social and Financial Performance. Lawrence Eribaum, Mahwah, NJ.
Margolis, J.D.,Walsh, J.P., (2003). Misery loves companies: rethinking social initiatives by business. Adm. Sci. Q., 268-305.
Margolis, J.D., Elfenbein, H.A., Walsh, J.P., (2007). Does it Pay to be Good? A Metaanalysis and Redirection of Research on the Relationship between Corporate Social and Financial Performance. Working paper. Harvard Business School,Cambridge MA.
Maron, I.Y., (2006). Toward a Unified Theory of the CSP e CFP Link. Journal of Business Ethics 67, 191-200.OECD (2011). Guidelines for Multinational Enterprises. On line at: http://www.oecd.org/investment/mne/48149536.
pdfOrlitzky, M., Schmidt, F.L., Rynes, S.L., (2003). Corporate social and financial performance: a meta-analysis.
Organ. Stud. 24, 403-441.Painter-Morland, M., (2006). Triple bottom-line reporting as social grammar: integrating corporate social
responsibility and corporate codes of conduct. Bus. Ethics: A Eur. Rev. 15 (4), 352-364.Porter, M.E., Kramer, M.R., (2006). Strategy and society. Harv. Bus. Rev. 84, 78-91.Porter, M.E., Kramer, M.R., (2011). Creating shared value. Harv. Bus. Rev 1 (2), 62-77. Jan/Feb 89.Visser, W., Matten, D., Pohl, M., Tolhurst, N., (2010). The A-Z of Corporate Social Responsibility. John Wiley &
Sons Ltd.Waddock, S.A., Graves, S.B., (1997). The corporate social performance e financial performance link. Strategic
Manag. J. 18 (4), 303-319.Wang, K., Sewon, O., Claiborne, M.C., (2008b). Determinants and consequences of voluntary disclosure in an
emerging market: evidence from China. J. Int. Account. Audit. Tax. 17, 14-30.Wood, D.J., (1991). Corporate social performance revisited. Acad. Manag. Rev. 16, 691-718.

International Conference of the Institute for Business Administration in Bucharest, 2015 127
AN ANALYSIS OF THE GREEK SOVEREIGN DEBT CRISIS AND OF THE POSSIBLE IMPACT OF A GREXIT
Ph. D. Candidate Ion MicuThe Bucharest University of Economic Studies
Abstrat: This paper is proposing an analysis of the Greek sovereign debt crisis and the implications a Grexit would have on the European financial markets. Despite the measures taken to reduce the exposure of the private sector to the Greek sovereign debt and the imposed austerity measures, the scenario of Greece leaving the eurozone and adopting a new national currency has almost become a reality when at the end of June 2015 it failed to make a scheduled payment to the International Monetary Fund, becoming the first developed country to do so. This paper will analyze how the capital markets responded to this event in an attempt to see if there would be a risk of contagion in such an eventuality and what where the reasons that have led to such a scenario.
Keywords: Grexit, sovereign debt crisis, Greece debt crisis, recession, financial markets
JEL Codes: G12
ACKNOWLEDGEMENT:This work was supported by the project “Excellence academic routes in doctoral and postdoctoral research
- READ” co-funded from the European Social Fund through the Development of Human Resources Operational Programme 2007-2013, contract no. POSDRU/159/1.5/S/137926.
INTRODUCTIONIn the eurozone, one of the first sovereign debt crises that was triggered in 2009 was that of Greece, which
has also came to be known in the financial media as the “Greek depression”57. By the end of 2009 new information came to light that the previous data on government debt offered by the previous Greek governments had been misreported which led to grim projections about Greece’s ability to meet its financial obligations. As a result Greek bond yield spreads and the cost of risk insurance skyrocketed compared to other European countries and culminated in 2012 when the Greek government had established a new negative record of having the largest sovereign debt default in history.
As a result financial analysts have started to paint a scenario of a possible exit of Greece from the eurozone, which came to be known as “Grexit”, a term that was coined by Citigroup’s Chief Analysts Willem H. Buiter and Ebrahim Rahbari58. This scenario almost came to fruition in mid 2015 when Greece was unable to make a loan repayment to the International Monetary Fund, becoming the first developed country to do so, after very tense negotiations with representatives from the European Union, regarding a bailout programme, came to halt.
A theoretical Grexit has sparked a lot of controversy in the financial and political world as there are supporters both for and against such a measure. While some say that if Greece renounces the euro and reinstates the drachma, in the long run, it will be better, both for Greece and for the other countries of the European Union, there are a lot more which are sure that it will have wide spread implications for all the financial world and could possibly even spark a new financial crisis. This study will focus on the impact that the Greek crisis and the shadow of the Grexit have had on the capital markets to see if it will forecast the possible outcome of an exit from the eurozone, because although the danger has been averted for now it is not completely gone.
GREEK SOVEREIGN DEBT CRISISThe depth of Greece’s debt crisis started to became apparent in 2010 when the new government of George
57 Sfakianakis, J. (2013), The Greek �epression, Foreign �olicy, http���foreignpolicy.com�2013�01�09�the�greek�depression��The Greek �epression, Foreign �olicy, http���foreignpolicy.com�2013�01�09�the�greek�depression��, Foreign �olicy, http���foreignpolicy.com�2013�01�09�the�greek�depression��
58 Buiter, W. and Rahbari, E. (2012), Rising Risks of Greek Euro Area Exit, CitigroupRising Risks of Greek Euro Area Exit, Citigroup, Citigroup

128 Building Growth through Recesison
�apandreou brought to light a flawed statistical procedure that had been used to estimate the 2009 deficit. After several revised calculations, from an initial estimated deficit for 2009 of 6%�8%, using the standardized method of Eurostat, it was finally established that the deficit was in fact 15,7% of G��.
As such, the credit rating agencies have responded by rating the investment grade of Greek bonds as high�yield bonds or also known as “junk bonds”. This affected the capacity of the private capital market to attract new capital and as such made it necessary for the use of international bailout needs. This led to the creation of the colloquially called “Troika”, formed by the European Commission, European Central Bank and the International Monetary Fund, which outlined the first financial aid programme of 110 billion euros. This was later revised several times reaching a total of approximately 250 billion euros, scheduled to be transferred at regular intervals until December 2014.
Based on data from Eurostat and the CIA World Factbook, the effects after 5 years since the sovereign debt crisis started in Greece and decline of its economy become very clear�
m the ratio of the public debt to G�� has reached 177% in 2014, which is approximately 317 billion euros�m the G�� per capita has decreased from 20.700 euros in 2009 to 17.000 euros in 2014 (an 18% decrease)�m the unemployment rate has reached 27%�m and in 2013 an estimated 44% of the Greek population lived below the poverty line
GREXIT IMPLICATIONSEconomists all over the world have theorized the effects that a Grexit would have on the eurozone and on
Greece’s economy. When the crisis had first become apparent, there were some financial analysts who supported the scenario of Greece exiting the eurozone and returning to the drachma59. The argument was that in the long term Greece can’t avoid a default and the only solution was to stall it by lending more money would only affect the other countries of the eurozone more. Some experts even penciled a plan for this scenario60,61 suggesting that it would have to happen very fast and very sudden, suggesting even that it should be done during a public holiday, so it would soften the impact. Also, it was argued that adopting the drachma would have allowed Greece to devaluate its own currency, which would allow the stimulation of exports, inhibition of imports and paying the debt cheaper.
Regarding the negative effects of adopting a new currency, in May 2012, the National Bank of Greece62 released a report63 which estimated that the income per capita would decrease by 55%, the new currency would also depreciate by 65% regarding the euro and that the recession would deepen by 22 percent. This statement came when the first effects of the austerity measures imposed by the E.U. and the International Monetary Fund as part of the preconditions of the bailout agreement have started to appear in the Greek economy consisting in very deep cuts to public spending, pensions, salaries and increased taxes that cave caused a series of bankruptcies and corporate closures which had swayed a part of the public opinion and the government to take into consideration the alternative of renouncing the euro. Even so, the conclusion of this report was that the adoption of a new national currency will lead to a severe reduction of living standards for the population.
In a study realized in 2012 by Alcidi, Giovannini & Gross(2012)64 they also appreciate that any new drachma would need to depreciate by 50%. Also their study revealed that since the start of the debt crisis in Greece, the European banks have adopted a policy to drastically cut their exposure to the Greek economy, resulting in a 50% reduction in two years (around 65 billion Euros). Also, they have discovered that even the Greek population was reducing its exposure to the banking system, outlined by a 20% yearly reduction of the deposits.
This trend has obviously continued, seeing that in 2015 the exposure of the foreign banks in the Greek debt has been reduced to only 2.4 billion Euros from the total debt of 312.7 billion Euros, according to data from the
59 Armitstead, L. (2011), EU accused of ‘head in sand’ attitude to Greek debt crisis, The Telegraph, http���www.telegraph.co.uk�finance�financialcrisis�8594698�EU�accused�of�head�in�sand�attitude�to�Greek�debt�crisis.html
60 Apps, �. (2012), Birth of new Greed drachma would be pained, rushed, Reuters, http���www.reuters.com�article�2012�05�20�us�greece�newdrachma�idUSBRE84J03Q20120520
61 Stevens, S. (2012), Who, what, Why� How would Greece switch currencies, BBC, http���www.bbc.com�news�magazine�18279522
62 should not be confused with the The Bank of Greece, which is the central bank
63 Tagaris, K. (2012), Biggest Greek bank warns of dire euro exit fallout, Reuters, http���www.reuters.com�article�2012�05�29�greece�euro�idUSL5E8GTI5320120529
64 Alcidi, C., Giovannini, A. and Gros, �.(2012), ‘Grexit’� Who would pay for it�, CE�S (Centre for European �olicy Studies), CE�S �olicy Breief no. 272, 23.05.2012‘Grexit’� Who would pay for it�, CE�S (Centre for European �olicy Studies), CE�S �olicy Breief no. 272, 23.05.2012, CE�S (Centre for European �olicy Studies), CE�S �olicy Breief no. 272, 23.05.2012

International Conference of the Institute for Business Administration in Bucharest, 2015 129
International Monetary Fund and the Greek �ublic �ebt Management Agency.
THE EFFECT OF THE AUSTERITY MEASURESThe study by Alcidi, Giovannini & Gross(2012) concluded that most of the European countries had, in 2012,
an exposure (official and private) in the Greek economy of 2�5% of their individual G��, which would make a default by Greece a bearable event, exception being �ortugal which had the biggest exposure of about 7% of its G��. They estimated that if Greece were to exit the eurozone it would certainly not be able to service its debt in the short run, but it could service its debt in 30 years, with a rate of 1.5% per annum. A bigger rate would make it unfeasible, so they concluded that the biggest factor was the “willingness” of Greece’s European partners�creditors.
Even with all the austerity measures that Greece has adopted as a condition of the bailout funds in 2015 the debt has reached the amount of 312.7 billion Euros, the majority of which is owned by the European bailout fund (EFSF) and Germany being the biggest individual public creditor, with 63.5 billion Euros. The structure of the debt is shown in the figures below.
Figure 1. Greek creditors by amount Figure 2. Greek creditors by typeSource� Eurostat, IMF, Greek �ublic �ebt Management Agency Source� Eurostat, IMF
This situation was worsened by the political strife in Greece that culminated with premature preliminary elections that led to the formation of a government by the left�wing political party, The Coalition of the Radical Left, also known as Syriza. This party’s political platform was the rejection of the strict austerity measures imposed by the Troika, a standpoint which led to tense negotiations with Greece’s creditors and the European Union.
Based on the data provided by Eurostat, it seems that the situation in Greece at the end of 2014 and the forecasts for 2015 and 2016 were encouraging, showing an improving economy, with growing exports and diminishing unemployment.
Despite the encouraging data, showed by the statistical data, there are a number of growing economists and financial analysts that are opposing the austerity measures. One of the most notable opponents of the austerity measures is Nobel laureate economist Paul Krugman65. He suggests that Greece’s creditors approach to the austerity programme, which focuses on spending cuts, is wrong because it affects growth, and he supports the alternatives proposed by the Greek government which focused more on increasing taxation. He outlines the failure of the programme imposed by Troika with an analytical comparison of the projected G�� growth of the 2010 standby agreement with the actual growth registered.
65 Krugman, �. (2015), Breaking Greece, The New �ork Times, http���krugman.blogs.nytimes.com�2015�06�25�breaking�greece���r�1 Breaking Greece, The New �ork Times, http���krugman.blogs.nytimes.com�2015�06�25�breaking�greece���r�1 , The New �ork Times, http���krugman.blogs.nytimes.com�2015�06�25�breaking�greece���r�1

130 Building Growth through Recesison
Figure 3. Greek economy evolutionSource� Eurostat
Also economist Joseph E. Stiglitz66, another Nobel laureate in economics, has harshly criticized the economical measures imposed by the European Commission, European Central Bank and the International Monetary Fund, again citing the 25% decrease of Greece’s G��. Furthermore, he blames the Euro, as a central currency, in part, for the depth of the Greek sovereign debt, because it made it impossible for Greece to set it’s own monetary policy, which it needed to achieve financial stability, because the European Central Bank focused only on inflation.
Figure 4. GDP growth, source: Krugman, P. (2015), Breaking Greece
THE EFFECTS OF A GREXITThe successive bailout programmes for Greece have undoubtedly taken a big toll on the Euro, since the
crisis began, and while the Greece only accounts for less than 2% of the E.U.’s G��, the political and economical ramifications could be tremendous.
The tense negotiations between Greece’s new government, which refused to respect the terms of the bailout programme, and the European Union, have led to a stalemate that caused the Troika to suspend the remaining scheduled payments. This resulted in Greece becoming the first developed country which, on 30 June 2015, failed
66 Stieglitz, J. E. (2015), Joseph Stiglitz� how I would vote in the Greek referendum, The Guardian, http���www.theguardian.com�business�2015�jun�29�joseph�stiglitz-how-i-would-vote-in-the-greek-referendum

International Conference of the Institute for Business Administration in Bucharest, 2015 131
to make a loan repayment to the International Monetary Fund. This crisis, which is considered to have started in Q4 2014 with the election of the new government, and is, statistically67, a new fourth recession for Greece, culminated with a referendum held on the 5th of July that resulted with over 61.31% of the total voters saying “NO” to the new bailout conditions proposed by the Troika.
This situation has made the possibility of a Grexit more real than ever. It reignited the discussion among economists and financial analysts about the pros and cons of a possible Grexit. While some U.S. analysts68 suggested that such a crisis could actually be beneficial for U.S. stocks, most argued that if an exit should happen, it should be done with great care and in an orderly fashion to reduce the “shockwaves” within the financial world.
The referendum, which drew the certainty of a Grexit, had a definite and quantifiable effect on the European financial markets, which recovered after news that, despite the referendum, the Greek government had accepted the propositions of the Troika. This is outlined in the figures below which show the evolution of the indices of the main financial markets in Europe� Germany � �AX, �oland � WIG, France � CAC40, UK � FTSE100, Italy � FTSE MIB, Austria � ATX, Spain � IBEX.
Figure 5. Evolution of the financial markets indices - 1 year; source: BLOOMBERG
As it is visible from Figure no. 5, the selected European Financial Markets have had a descending trend since the end of May, given the stalemate in negotiations which led eventually to the impossibility for Greece to meet it’s deadline for the payment scheduled on 30 June. The full effect of the crisis was seen on the 7th of July, following the referendum and the more realistic scenario of a Grexit, showed in Figure no. 6. The financial markets plummeted, with the least affected being the United Kingdom, while the most affected was Italy.
This response proved that a Grexit would have much more of an impact than the financial analysts have estimated and also that the response of the financial markets would be much faster than anticipated69. Also, this disproves, in some measure, what some were estimating70, that the financial markets were more responsive to the slowing of the Chinese economy and, in turn, to the oil and copper prices, which are closely related to China.
Following the new bailout deal that was agreed upon on the 13th July the financial markets have recovered and the danger of a Grexit has been, at least for now avoided.
67 Hellenic Statistical Authority, Press release, 29.05.2015
68 Hulbert, M. (2015), What a ‘Grexit’ would mean for U.S. stocks, Market watch, http���www.marketwatch.com�story�what�a�grexit�would�mean�for�us�What a ‘Grexit’ would mean for U.S. stocks, Market watch, http���www.marketwatch.com�story�what�a�grexit�would�mean�for�us�, Market watch, http���www.marketwatch.com�story�what�a�grexit�would�mean�for�us�stocks-2015-02-11
69 Warner, J. (2015), World stock markets face bigger threats than Grexit, The Telegraph, http���www.telegraph.co.uk�finance�economics�11679761�Are�overvalued�stock-markets-heading-for-another-crash.html
70 Coward, B. (2015), Is it Slowing China or Grexit That is �riving Financial Market �rice Changes�, Gavekal Capital, http���blog.gavekalcapital.com�is�it�slowing�china-or-grexit-that-is-driving-financial-market-price-changes/

132 Building Growth through Recesison
Figure 6. Evolution of the financial markets indices - 1 month; source: BLOOMBERG
CONCLUSIONSWhile the Greek sovereign debt is far from over, the latest crisis has been avoided as short�term financing
has been assured to help with emergency funds. However, the newest bailout has been largely criticized and there are still voices that support the idea of Greece exiting the eurozone.
The opinions on the matter of a Grexit differ largely among the political leaders and some have even come up with the new concept of a “temporary Grexit”. The arguments against the exit are not only economical, but also political. And while it’s certain that the adoption of a national currency would provide Greece with a little more leeway regarding it’s monetary policies, it would only make sense if it would come with a substantial debt re�profiling from it’s creditors.
Despite all the measures that have been taken in the last 6 years to distance the private sector from the Greek sovereign debt by limiting the exposure of the private banks, this latest scare of a Grexit has proven that there would still be a very strong impact on the European economies and the risk of contagion is still high.
This recession in Greece is one of the worst ever recorded in history and the austerity measures imposed by the Troika are falling short of their desired effect, as the Greek economy is slow to recover. It’s becoming clearer to financial analysts and political leaders that the only way for Greece to recover and to prevent a Grexit is to restructure and cut an important part of the debt it accumulated, because despite the very strict austerity measures, that were applied in the last years, the situation is getting worse.
REFERENCES Alcidi, C., Giovannini, A. and Gros, �.(2012), ‘Grexit’: Who would pay for it?, CE�S (Centre for European
�olicy Studies), CE�S �olicy Breief no. 272, 23.05.2012Arghyrou, M. G. and Tsoukalas, J. �.(2011), The Greek Debt Crisis: Likely Causes, Mechanics and
Outcomes, The World Economy, vol. 34, no. 2De Santis, R. A.(2012), The Euro area sovereign debt crisis safe haven, credit rating agencies and the
spread of the fever from Greece, Ireland and Portugal, European Central Bank, Working paper series, no. 1419Gros, �. (2015), Grexit 2015: A primer, CE�S (Centre for European �olicy Studies), CE�S Commentary,
22 January 2015Sfakianakis, J. (2013), The Greek Depression, Foreign �olicy, http���foreignpolicy.com� 2013�01�09�the�
greek-depression/

International Conference of the Institute for Business Administration in Bucharest, 2015 133
Buiter, Willem and Rahbari, Ebrahim (2012), Rising Risks of Greek Euro Area Exit, CitigroupArmitstead, L. (2011), EU accused of ‘head in sand’ attitude to Greek debt crisis, The Telegraph, http���www.
telegraph.co.uk�finance�financialcrisis�8594698�EU�accused�of�head�in�sand�attitude�to�Greek�debt�crisis.html
Taylor, P. (2015), How much Greece owes to international creditors, Reuters, http���mobile.reuters.com�article�idUSKCN0�80XW20150628
Stevens, S. (2012), Who, what, Why: How would Greece switch currencies, BBC, http���www.bbc.com�news�magazine-18279522
Apps, P. (2012), Birth of new Greed drachma would be pained, rushed, Reuters, http���www.reuters.com�article/2012/05/20/us-greece-newdrachma-idUSBRE84J03Q20120520
Tagaris, K. (2012), Biggest Greek bank warns of dire euro exit fallout, Reuters, http���www.reuters.com�article�2012�05�29�greece�euro�idUSL5E8GTI5320120529
Krugman, P. (2015), Breaking Greece, The New �ork Times, http���krugman.blogs.nytimes.com�2015�06�25�breaking�greece���r�1
Stieglitz, J. E. (2015), Joseph Stiglitz: how I would vote in the Greek referendum, The Guardian, http���www.theguardian.com/business/2015/jun/29/joseph-stiglitz-how-i-would-vote-in-the-greek-referendum
Hellenic Statistical Authority, Press release, 29.05.2015Warner, J. (2015), World stock markets face bigger threats than Grexit, The Telegraph, http���www.telegraph.
co.uk�finance�economics�11679761�Are�overvalued�stock�markets�heading�for�another�crash.htmlHulbert, M. (2015), What a ‘Grexit’ would mean for U.S. stocks, Market watch, http���www.marketwatch.com�story�
what-a-grexit-would-mean-for-us-stocks-2015-02-11Coward, B. (2015), Is it Slowing China or Grexit That is Driving Financial Market Price Changes?, Gavekal Capital,
http���blog.gavekalcapital.com�is�it�slowing�china�or�grexit�that�is�driving�financial�market�price�changes�International Monetary FundGreek �ublic �ebt Management Agency EurostatCIA World Factbook

International Conference of the Institute for Business Administration in Bucharest, 2015 143
ROMANIAN POLICY OF HEALTH CARE DURING CRISIS
Ph. D. Paul TănăsescuThe Bucharest University of Economic Studies
Abstract: According to the research, the fundamental element of every health system is represented by the institutional framework. The malfunction of institutional framework may be determined by either the political context, or the social economic context. The effects of these decisions made by the political decision makers sometimes affect hard the health policies and their pace of progress. The financial support of health sector during crisis has been affected as a consequence of arbitrary changes of the rules made by those who provide its financing. This fact has determined a sudden and major reduction of the percentage of total government expenditure for the health sector, with negative effects on the health status of Romania.
Keywords: health sector, sanitary policy, health financing, economic reform, health crisis.
STATE OF KNOWLEDGE IN HEALTH POLICY ANALYSIS IN ROMANIA The main element, fundamental to any health system is represented by the institutional framework.
Depending on it, the actual functioning of a health system of a country can be drafted. But the institutional framework is affected by numerous factors, especially political, economical and social. National specifics, traditions and customs may interfere as well with the institutional framework of health system.
The researchers consider that after 2000 we witness a change in the institutions within the Romanian medical system, especially those which contained the foundations nationwide organization.88
Besides, we have witnessed to the passing of laws which were enacted under social and political pressures, very few being the result of some internal consistency, natural in any health system. This observation is confirmed by the fact the new laws do not last in time, they need to be altered because of some alarming conditions. These institutions can hardly cope with the institutional blockages, often generated by financial blockages. It is known the fact that the lack of financial resources derive mainly from the impossibility of tax collection in a predictable and stable way.
These blockages are unfortunately understood by the abandonment of legislative initiatives or of some political decisions. Thus, the Romanian healthcare system knows oscillating developments, hard to predict or to finance.
It is obvious that the blockages in the Romanian health sector determine consequences and after-effects which amplify the costs of health policies which need to be implemented. In addition, the health status of population is affected by serious medical, economical and financial effects in the long run.
The World Bank through the Center of Political Studies and Comparative Analysis notes the existence of some serious confusion at the level of administrative structures in defining their role within the Romanian health system.89
For example, at county level, we witness a competition between the Public Health Authorities (DSP) and the County Insurance Houses (CASJ) due to their unclear roles and overlapping competences. The ongoing reform of the Romanian health system has been constantly marked with the political interference in the medical institutional system, especially during 1992, 1996 – 1999, 2001, 2005 and 2010 until nowadays.
The first steps of reform of Romanian health system were the decentralization of primary medical services as a consequence of policymakers. Parallel functioning of private medical sector was accepted, especially in the specializations which required modest initial investments (dentistry, labor medicine, dermatology, etc.). In 1997,
88 See Pop Luana Miruna – Social policies, analysis and evaluation of social policies, Economic Publishing House, Bucharest, 2005, page 80 – 82.
89 See The European Observer of health system, Transition of health system, Romania case, The World Bank, 2000. Evaluation project of Social Services provided locally, page 189.

144 Building Growth through Recesison
the organizing and financing system of health services in Romania was modified, by giving up the Semasko model, which was totally financed by the state, by means of tax system, and adopting a health insurance model, based on compulsory insurance premiums. After applying the Social Health Insurance Law no. 145/ 1997, the Ministry of Health drastically restricted its roles, especially its financial support, by keeping only the function to establish the national health policy, investment policy and personnel policy.
Later on, these duties of the Ministry of Health were drastically restricted, especially due to financial reasons.
PRESENT RESULTS OF THE HEALTH SYSTEM IN ROMANIA Romania joined the European Union in 2007. In this way, we can compare the position of our country with
the one of other EU countries. There are five categories of results of the Romanian health system. A. Financial indicators: At the end of the crisis, health budget of Romania was 5.5 billion lei, which was
approximately 4% of GDP. Although there are increases in all domains, health expenditures from the unique fund amounted nationwide will rise in 2014 at only 3.5% of estimated GDP of Romania, which is approximately half in other European countries, when it comes to health expenditures. The continued policy of underfunding both before and after the economical crisis is materialized in immobility of health indicators of population.
B. Demographic indicators: Before the economical crisis in 2008, life expectancy in Romania was 69 for men and 77 for women. This indicator has remained almost unchanged after the crisis, as a consequence of the reduction of population of our country from 22 million inhabitants to 19 million. For the first time in four decades, on 1st January 2012, the share of young population is equal to the share of elderly population (15%). The falling back of birth rate and the deterioration in overall mortality, as well as a very negative migration left their mark on the share of elderly population in the entire population of Romania. This population will be the main source of consumption of the expensive medical services. In conclusion, demographic indicators will be a negative factor, which can not be neglected in the evolution of health system of Romania.
C. Responsiveness of health system to beneficiaries: These types of problems are mentioned by means of mass media and they refer especially to large queues, dissatisfied patients, lack of medicines, poor health organization, etc. Patients denounce the fact that they are humiliated by the contract with the National Health Insurance House. The providers do not strive or they are not interested in being attractive or in coming to meet the needs of users of health services. These methods have been aggravated by the economical crisis; in 2011 only 13% of consultations took place in a private clinic while fully respecting the quality standards of care.
We can not truly speak of responsiveness in the Romanian sanitary system.D. Justice of the system: There are few profile studies about the Romanian health system equity. In the
study of 200890 regarding the household budget, we can extract a little information related to the justice of medical system in Romania:
m It is difficult for the poor population to access medical services. The situation is unchanged both before the economical crisis and at the moment.
m The economical growth during 2006 – 2008, respectively 2013 – 2015 has made possible the access of population to the health services (from 61% in 2006 to 71% in 2013). This growth is due especially to the increasing number of population with medium and high income.
m In the Government policy, subsidizing services are insisted on, although co-payment was introduced. Poor categories benefit from them, but in reality this policy is ineffective from the financial point of view.
m In many EU countries, serious diseases lead to poverty because of the high costs of medical services, but in Romania there is lack of access to the medical services rather than high financial costs.
In conclusion, although the justice of medical system is a fundamental principle of sanitary policy, in practice it is less and less taken into consideration.
E. Financial sustainability of health system: Between 2005 and 2008 the funds for the public health sector increased briskly, with an annual average rate of 23%, a growth rate well above the government revenue. The financial crisis begun in 2008 forced the government to cut public spending. At that moment the health sector
90 Constantin Anghelache and team – Study regarding the quality of life in Romania, Bucharest, 2008

International Conference of the Institute for Business Administration in Bucharest, 2015 145
did not succeed in controlling the expenses, amassing large debts against drug dealers, medical equipment and other suppliers. The deficits of National Health Insurance House (C.N.A.S.) and the Ministry of Health (M.S.) have grown bigger. Reserves were proved to be insufficient in order to cover the debts. Thereby, it was resorted to government aid in order to cover the deficits, this practice being used not only during the crisis, but also presently when there is a slight economical growth.
Therefore, a unique financial support of health is not foreseen. The system is not financially sustainable without the consistent aid of the state.
THE EFFECTS OF POLITICAL DECISIONS ON HEALTH SYSTEMS IN ROMANIA The political decision is the foundation of public management activities at state level. On this basis, all actions
meant to achieve the objectives of the system are designed and led, our case being about the sanitary system. The objectives in the health sector are interrelated with the political and administrative environment. These can be disruptive factors which can determine the failure to fulfill the healthcare objectives, with a probability determined by time horizon. We have chosen to analyze a few effects, which are less accounted for in the Romanian medical literature.
A first effect of political decisions in the health system is the formulation of decisions and accountability. Romania has adopted many regulations in the field. Thus, GD no. 775/ 2005 mentions the formulation and monitoring of public policies, and GD no. 1361/ 2006 mentions the drawing of substantiation notes. The effects of these laws are felt at the level of the Ministry of Health, causing strategic planning drawbacks. In this way, the Strategic Plan of Health for Romania for 2011 – 2013 has the effect of manifestation as a one-way channel, from the top to the bottom, developed by the Public Policy Unit (U.P.P.) within the Ministry of Health. The immediate effect and clearly seen is that this process does not encourage the exchange of ideas within the health system. As a consequence, C.N.A.S. did not contribute to the adopting of these health decisions and did not nationally negotiate the Framework – Contract. The Ministry of Health, by means of its compartments and directions does not assume any responsibility regarding data analysis of health.
As a consequence of the decentralization process of the activities in the hospital and the beginning of their privatization (understood as a political decision), the responsibilities within the health system have become even more complex. The immediate effect is data reporting which is now transmitted to the County Councils and the Town Halls they belong to, as well as to C.N.A.S. and M.S. In their turn, the reports of local authorities are meant for the Ministry of Interior and not for the M.S, as it is supposed to. In this case, it is difficult for the M.S. to assess the performance of medical services accomplished in the medical units. The cooperation between local authorities, M.S. and C.N.A.S. is scanty, with limited capacity for accountability.
The second effect of political decisions in health is strengthening financial controls as a result of political decision, an action which we appreciate to be negative, since it has not got a medical mark. The control is from a financial perspective in order to enhance economic efficiency. Emphasis is placed on the way the funds are spent for health. There are not any controls and analysis in terms of health system efficiency, which will be at least as useful. The study of healthcare indicators confirms this thing, which proves a great immobility during long periods of time or even certain deterioration.
The third effect of political decisions in health is the impact on the network of health services and the re-launching of the quality control systems of care. As well as in other countries in Eastern Europe, Romania has inherited a large healthcare infrastructure, with an old and distorted hospital sector, with limited facilities of treatment and with a weak regulatory system of quality. The progress made regarding the modernization of health system is still at the beginning.!!!!!! By firm political decisions, there might be an efficiency in the medical network, both through modernizing hospitals and their provision with medical equipment and by giving up some rural hospitals, which are not used by patients, on account of some economical and solid medical arguments. The expenses with health care are directed towards the hospitals (with high costs) and less towards the institution represented by medical doctors and the specialized services of ambulatory which have low costs and high economic effectiveness. The activity of prevention is still neglected, since it is not a priority for the health care policy in Romania. Prevention in our country is limited to anti-smoking policy and vaccination of the population.

146 Building Growth through Recesison
The fourth effect of political decisions in health is the growth on the one hand of medical services and the reduction of justice in the system, on the other hand. This process continually deepens, as the state mobilizes financial resources in order to enlarge and modernize the medical services, in the same time with the private system. In their turn, the patients, especially the poor ones who are becoming more numerous, can not access high-cost medical services. Theoretically, in Romania this protection is assured by means of exemption from payment of the poor, who are registered in the National Programme on minimum wage. In practice, this mechanism proves to be inefficient and insufficient, because the poor face problems when it comes to healthcare (high costs of medical interventions, great distance between medical centers, red-tape, queues at waiting lists, informal payments towards medical staff etc.).
In conclusion, in Romania, the problem of poverty and justice is nor solved and the political decisions are not yet directed in this direction.
CONCLUSIONSIn European countries, a high level of dissatisfaction can be seen when it comes to the quality of medical
act, to the ways of financing health and providing medical services. The accent is placed on the report between cost – effectiveness, on rationalization and optimizing health
services, on quality of health services. The common issues are included in the interests of national governments and they lead to different strategies
from country to country. While practice and healthcare technologies modernize and become more and more expensive, every country resorts to economical and political process of medical reform.
REFERENCES1. Constantin Anghelache si colectiv – Studiu privind calitatea vieții în România, București, anul 2008.2. Pop Luana Miruna – Politici sociale, analiza și evaluarea politicilor sociale, Ed. Economica, București, anul
2005.3. Tănăsescu Paul – Asigurări și protecție socială – Editura C.H.Beck, București, anul 2009.4.Tănăsescu Paul – Managementul financiar al activității sanitare – Editura Tribuna Economică, București, anul
2001.5. **** Observatorul European al de sistemului de sănătate, Tranziția sistemului de sănătate, cazul României,
Banca Mondială, anul 2000.