table of contents · web viewtable of contents introduction3 executive summary4 section 1...
TRANSCRIPT
EN EN
EUROPEAN COMMISSION
Strasbourg, 13.6.2017 COM(2017) 351 final
PART 1/2
REPORT FROM THE COMMISSION TO THE EUROPEAN PARLIAMENT, THE COUNCIL AND THE COURT OF AUDITORS
2016 Annual Management and Performance Report for the EU Budget
Table of contentsINTRODUCTION..................................................................................................................................................................................... 3
EXECUTIVE SUMMARY........................................................................................................................................................................ 4
SECTION 1 PERFORMANCE AND RESULTS.................................................................................................................................... 11
Key features of the EU budget.................................................................................................................................................. 12Summary account of progress on horizontal issues..................................................................................................................141.1. Competitiveness for Growth and Jobs (Budget Heading 1A).....................................................................................17
1.1.1. Progress of 2014-2020 programmes................................................................................................................ 181.1.2. Results of 2007-2013 programmes.................................................................................................................. 28
1.2. Economic, Social and Territorial Cohesion (Budget Heading 1B)..............................................................................291.2.1. Progress of 2014-2020 programmes................................................................................................................ 301.2.2. Results of 2007-2013 programmes.................................................................................................................. 35
1.3. Sustainable Growth: Natural Resources (Budget Heading 2)....................................................................................421.3.1. Progress of 2014-2020 programmes................................................................................................................ 431.3.2. Results of 2007-2013 programmes.................................................................................................................. 50
1.4. Security and Citizenship (Budget Heading 3).............................................................................................................531.4.1. Progress of 2014-2020 programmes................................................................................................................ 541.4.2. Results of 2007-2013 programmes.................................................................................................................. 60
1.5. Global Europe (Budget Heading 4)............................................................................................................................. 631.5.1. Progress of 2014-2020 programmes................................................................................................................ 641.5.2. Results of 2007-2013 programmes.................................................................................................................. 66
SECTION 2 INTERNAL CONTROL AND FINANCIAL MANAGEMENT ACHIEVEMENTS.................................................................67
2.1. Achievement of internal control objectives................................................................................................................. 692.1.1. Efficiency of financial management.................................................................................................................. 702.1.2. Effectiveness of managing the legality and regularity risks..............................................................................702.1.3. Cost-effectiveness of the controls.....................................................................................................................782.1.4. Anti-fraud strategies.......................................................................................................................................... 78
2.2. Management assurance and reservations..................................................................................................................812.3. Assurance obtained through the work of the Internal Audit Service (IAS)..................................................................842.4. Summary of conclusions on the work carried out by the Audit Progress Committee.................................................862.5. Follow-up of discharge and external audit recommendations....................................................................................872.6. Conclusions on internal control and financial management achievements................................................................882.7. Cross-cutting organisational management achievements..........................................................................................89
2.7.1. Robust governance arrangements.................................................................................................................... 892.7.2. Strengthened performance framework............................................................................................................. 892.7.3. Synergies and efficiencies................................................................................................................................ 89
ENDNOTES.......................................................................................................................................................................................... 91
CREDITS
2

3
IntroductionThe EU budget is a key instrument for implementing European policies. Together with regulatory instruments, it complements national budgets to deliver on the shared political priorities and respond to the challenges the EU faces.
The need to ensure that resources are allocated to priorities and that actions financed through the EU budget bring high performance and added value is at the heart of the Commission's EU Budget Focused on Results initiative. This initiative, building on the performance frameworks in the 2014–2020 programmes, promotes a coherent balance between compliance and performance.
The 2016 Annual Management and Performance Report for the EU Budget provides a comprehensive overview of the performance, management and protection of the EU budget. It explains how the EU budget supports the EU's political priorities and describes both the results achieved with the EU budget, and the role the Commission plays in ensuring the highest standards of financial management.
Demonstrating the Commission's efforts towards streamlined performance reporting, this second edition of the Annual Management and Performance Report incorporates the former Communication on the protection of the EU budget1 and, as last year, will be part of the EU budget Integrated Financial Reporting Package. This package is an essential input for the annual 'discharge procedure' by which the European Parliament and the Council scrutinise the implementation of the EU budget.
4
Executive summary The 2016 Annual Management and Performance Report for the EU Budget brings together the latest information on the results achieved with the EU budget and on how it is managed and protected.
The current Multiannual Financial Framework, which runs from 2014 till- 2020, was agreed in 2013 against the backdrop of the financial and economic crises and fiscal consolidation in the Member States. It was designed to support the objectives of the Europe 2020 growth strategy, placing a strong emphasis on investment in jobs and growth.
These objectives are reflected in the ten political priorities of the Commission as set out by President Juncker. They remain highly relevant today.
In addition, a number of new challenges have arisen, in particular the need to provide a strong and united European response to the migration crisis and to security threats resulting from global instability. The EU budget has played a key role in addressing these challenges. In 2016, high priority was given to action to boost growth, competitiveness, investment and jobs; and to the European response to global challenges. This required the Commission to make full use of the flexibility built into the Multiannual Financial Framework to ensure that funds are directed rapidly to where they are most needed.
The Commission also made important proposals in 2016 to make the current Multiannual Financial Framework work better. The Commission Communication on the Mid-term Review/Revision of the Multiannual Financial Framework 2014-20202, presented in September 2016, included an ambitious package of legislative proposals aiming to:
(i) provide additional financial means to tackle migration and security risks and foster economic growth, job creation and competitiveness;
(ii) increase the flexibility of the EU budget in order to quickly and efficiently address unforeseen circumstances; and
(iii) simplify financial rules and thus reduce the administrative burden on recipients of EU funds3.
These proposals drew on the Commission's ongoing work under the umbrella of the EU Budget Focused on Results Initiative. Other noteworthy developments in 2016 included improvements to the structure and the content of programme statements accompanying the 2017 draft budget to provide the Budget Authority with a more focused picture of programmes' performance. In addition, the Commission produced for the first time in 2016 a single Integrated Financial Reporting Package providing detailed information on revenue, expenditure, management and performance of the EU budget in line with best practices in the fields of transparency and accountability. Transparency is also ensured through the "Financial Transparency System" (FTS) publication4 which provides information about the beneficiaries of EU funding managed directly by the Commission.
Performance and results Growth, jobs and a resilient society
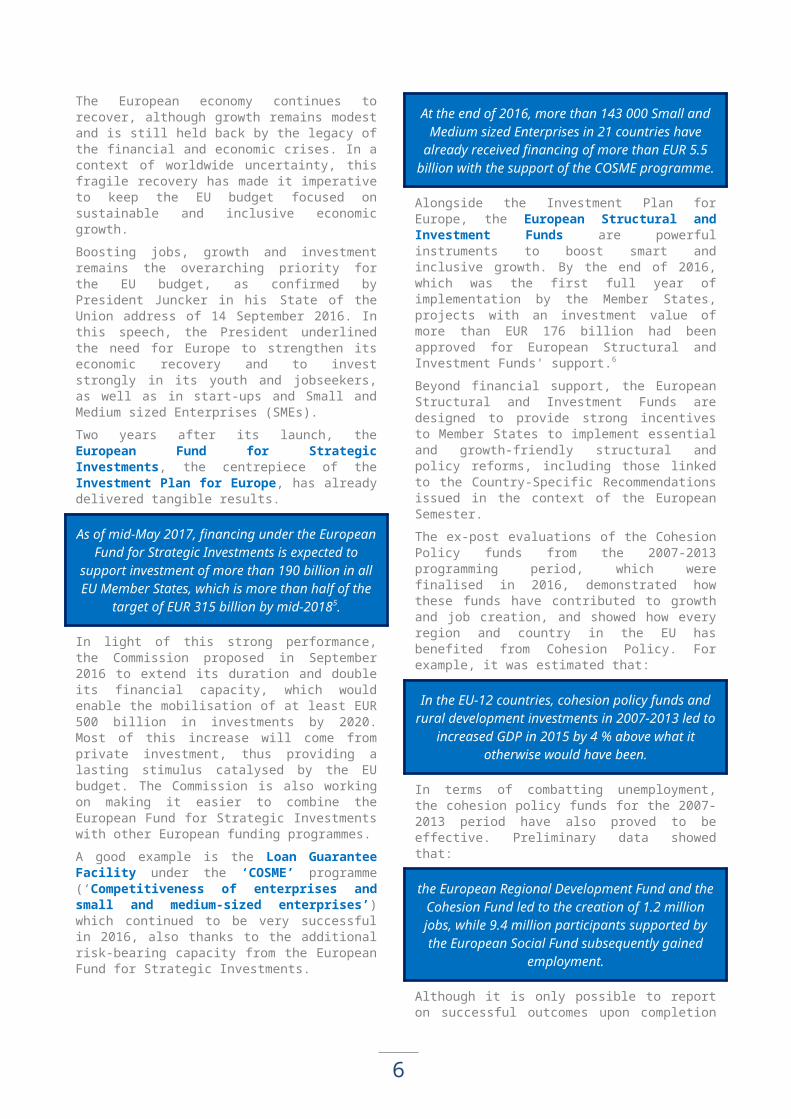
The European economy continues to recover, although growth remains modest and is still held back by the legacy of the financial and economic crises. In a context of worldwide uncertainty, this fragile recovery has made it imperative to keep the EU budget focused on sustainable and inclusive economic growth.
Boosting jobs, growth and investment remains the overarching priority for the EU budget, as confirmed by President Juncker in his State of the Union address of 14 September 2016. In this speech, the
President underlined the need for Europe to strengthen its economic recovery and to invest strongly in its youth and jobseekers, as well as in start-ups and Small and Medium sized Enterprises (SMEs).
Two years after its launch, the European Fund for Strategic Investments, the centrepiece of the Investment Plan for Europe, has already delivered tangible results.

5
As of mid-May 2017, financing under the European Fund for Strategic Investments is expected to
support investment of more than 190 billion in all EU Member States, which is more than half of the
target of EUR 315 billion by mid-20185.
In light of this strong performance, the Commission proposed in September 2016 to extend its duration and double its financial capacity, which would enable the mobilisation of at least EUR 500 billion in investments by 2020. Most of this increase will come from private investment, thus providing a lasting stimulus catalysed by the EU budget. The Commission is also working on making it easier to combine the European Fund for Strategic Investments with other European funding programmes.
A good example is the Loan Guarantee Facility under the ‘COSME’ programme (‘Competitiveness of enterprises and small and medium-sized enterprises’) which continued to be very successful in 2016, also thanks to the additional risk-bearing capacity from the European Fund for Strategic Investments.
At the end of 2016, more than 143 000 Small and Medium sized Enterprises in 21 countries have
already received financing of more than EUR 5.5 billion with the support of the COSME programme.
Alongside the Investment Plan for Europe, the European Structural and Investment Funds are powerful instruments to boost smart and inclusive growth. By the end of 2016, which was the first full year of implementation by the Member States, projects with an investment value of more than EUR 176 billion had been approved for European Structural and Investment Funds' support.6
Beyond financial support, the European Structural and Investment Funds are designed to provide strong incentives to Member States to implement essential and growth-friendly structural and policy reforms, including those linked to the Country-Specific Recommendations issued in the context of the European Semester.
The ex-post evaluations of the Cohesion Policy funds from the 2007-2013 programming period, which were finalised in 2016, demonstrated how these funds have contributed to growth and job creation, and showed how every region and country in the EU has benefited from Cohesion Policy. For example, it was estimated that:
In the EU-12 countries, cohesion policy funds and rural development investments in 2007-2013 led to
increased GDP in 2015 by 4 % above what it otherwise would have been.
In terms of combatting unemployment, the cohesion policy funds for the 2007-2013 period have also proved to be effective. Preliminary data showed that:
the European Regional Development Fund and the Cohesion Fund led to the creation of 1.2 million
jobs, while 9.4 million participants supported by the European Social Fund subsequently gained
employment.
Although it is only possible to report on successful outcomes upon completion of the intervention, Youth Employment Initiative actions, together with those of the European Social Fund are delivering first positive results on employment. By the end of 2015 2.7 million young people participated in activities organised by those actions, including 1.6 million unemployed and 700 000 inactive people.
235 000 people were back in employment, 181 000 gained a qualification and 100 000 were in
education or training following an intervention of the European Social Fund and the Youth
Employment Initiative.
In certain Member States it has however taken more time to put the necessary processes and structures in place to implement the Youth Employment Initiative.
The research and innovation programme Horizon 2020 is key for building a society and economy based on knowledge and innovation across the EU. It succeeded in reaching 49 000 participations and grant agreements were signed for a total amount of EU 20.5 billion. Over 21% of all participations were Small and Medium-sized Enterprises. In 2016, the Marie Skłodowska-Curie actions (MSCA) celebrated their 20th anniversary and funded 25 000 researchers between 2014 and 2016.
The Nobel Prize in Chemistry was awarded jointly to three laureates who have been receiving funding since the fourth research framework programme.
A number of large-scale infrastructure programmes are also contributing to the EU's jobs and growth objectives. The Galileo-programme, setting up Europe's own global satellite navigation system, transitioned from the deployment to the exploitation phase in 2016.
6
The launching of six new satellites in 2016 enabled services provision to begin.
Following the declaration of Galileo Initial Services in 2016, chipset and receiver manufacturers and application developers can use Galileo signals to develop their activities, and a number of Galileo-ready devices are already on the market7. To be noted that the implementation of projects under Horizon 2020 encouraged the development of new Galileo applications. These projects have already led to 13 innovations being brought to the market, 5 patents, 34 advanced prototypes, two products on the market and 223 published scientific papers. The global Navigation Satellite System market is expected to grow from 5.8 billion devices in use in 2017 to an estimated 8 billion by 2020.
As to the Connecting Europe Facility for Transport support has been granted to 452 projects for a total value of EUR 19.4 billion in investment across Europe. This has helped to kick off major infrastructure investments in Europe contributing to the overall Connecting Europe Facility goals, such as bridging missing transport links and removing bottlenecks. For example:
The Connecting Europe Facility for Transport contributed to the 64 km long Brenner Base
Railtunnel which will be the longest high capacity rail tunnel in the world.
The tunnel will reinforce considerably the competitiveness of railway traffic along the strategic Munich-Verona stretch and contribute to a better modal shift in the sensitive Alpine region.
With regard to education, lifelong learning, training and encouraging entrepreneurship, more than two million participants benefited from Erasmus+ by the end of 2016. It enabled around 497 000 young people to study, train, volunteer and participate in youth exchanges abroad in 2016. Its first implementation report8 underlined that:
Erasmus+ students are not only more likely to be employed (compared to their non-mobile peers),
but also to secure management positions. On average 64 % of Erasmus+ students, compared to 55 % of their non-mobile peers take up managerial positions within five to ten years from graduation.
For the Erasmus+ Master Loan Scheme five banks9
signed up to the scheme and one university implemented an innovative financing model. Despite encouraging feedback from students, the level of uptake (in terms of the number of financial intermediaries and the size of the guarantees sought) is lower than estimated initially and the Commission is seeking to expand geographical coverage and uptake.
Finally, 2016 was the first year of implementation of the new system of direct payments under the reformed Common Agricultural Policy. Member States managed direct payments for about 7 million farmers and rural development programs. Several market support measures were implemented in response to unfavourable market developments in 2015 and 2016 and have helped to rebalance the agricultural sectors. In response to falling milk prices in the EU in the first half of 2016 and the persistent supply-demand imbalance, the Commission announced an exceptional milk production reduction measure in July 2016, which contributed to the effective rebalancing of the EU dairy market. The measure financed the reduction of production of more than 850 000 tonnes in the fourth quarter 2016 (64 % of the total decrease of milk production in the Union) which supported a rise of 29 % in EU milk prices in the second half of 2016.
European agriculture showed its resilience, as evidenced by the trade statistics:
EU agri-food exports reached a value of EUR 130.7 billion, which is 1.5 % higher than in 2015.
7
A European response to global challenges
In 2016 the European response to new challenges emerging from the shifting geopolitical situation continued. The EU budget provided support to Member States in properly managing migration flows, addressing the root causes of migration and safeguarding the Schengen area. Other EU priorities in relation to global challenges, such as climate change, continued to be underpinned by the EU budget.
The implementation of Member States' national programmes under the Asylum, Migration and Integration Fund and the Internal Security Fund gathered pace in 2016.
Member States stepped up their efforts in both voluntary and forced return with support from the Asylum, Migration and Integration Fund in 2016:
Out of 37 748 returned people 26 187 were returned through voluntary return programmes.
Early data shows that the number of irregular migrants apprehended at the EU's external borders has decreased (from 1.8 million in 2015 to 0.5 million in 2016). The numbers of illegal arrivals in Greece fell dramatically owing to the implementation of the EU-Turkey Statement; however the number of illegal arrivals from Libya remains very high.
In 2016, the EU Member States received 14 205 refugees resettled in the Union via national and multilateral schemes10. This is the highest number of resettled people in a single year recorded so far in the EU11 and is a direct result of the EU-wide resettlement schemes. The increase shows the value and potential of strengthened EU-level cooperation and coordination in the area of resettlement.
The implementation of the 'hotspot' approach continued in Greece and Italy. In 2016, Greece established five hotspots with a combined capacity of 7 450 places; and Italy has put into operation four hotspots with a combined capacity of 1 600 places.
The Commission and the newly established European Border and Coast Guard Agency worked towards an effective presence at sea:
174 500 people in 2016 in the Central Mediterranean alone were rescued.
The unprecedented scale of the refugee and migration flows (in particular from Syria) also led the Commission to innovate in the type of instruments and assistance mobilised by the EU: in addition to providing humanitarian assistance outside Europe,
the EU began for the first time to fund humanitarian action within its borders, through the new Emergency Support Instrument.
In 2016 shelter was provided for over 35 000 people in Greece, from tents in the initial stage to
winterised containers and 417 safe spaces for unaccompanied minors in dedicated facilities were
created.
Moreover, humanitarian funding in Turkey through the Facility for Refugees in Turkey was considerably increased. This enabled the Commission, among other initiatives, to launch an innovative programme called the Emergency Social Safety Net, aiming to assist up to one million of the most vulnerable refugees in Turkey with regular cash allocations. This is an example of an increasing use of assistance from the EU budget as an efficient and effective way of getting aid to people in emergency situations.

8
Furthermore, aside from its humanitarian assistance, the Commission also supports the longer-term livelihoods, socio-economic and educational perspectives of refugees and their host communities in Turkey. Some first indicative results from the 'Generation Found'-project, which is a project on education, implemented with UNICEF:
60 000 children benefit from educational material and 10 392 children benefit from psychosocial and
social cohesion programmes.2 081 education personnel were trained
7 950 Syrian educational personal received incentives
The promotion of stability and sustainable development also guides the action of the EU budget outside the EU. As the world's largest humanitarian aid donor, the EU plays a central role in tackling the humanitarian challenges. In 2016, the Commission managed:
An unprecedented humanitarian aid budget of about EUR 2 billion for food, shelter, protection
and healthcare for 120 million people in over 80 countries.
Building on the successful experience of the Investment Plan for Europe, the Commission proposed in 2016 an ambitious European External Investment Plan for Africa and the European Neighbourhood as a means to address the root causes of migration. As part of the plan, the European Fund for Sustainable Development12 is expected to mobilise up to EUR 44 billion in investments with funds from the general budget of the Union.
The EU budget is also an important tool in addressing climate change, the EU has decided that at least 20 % of its budget for 2014-2020 – slightly above EUR 200 billion over the whole period − should be spent on climate measures.
In 2016 the total contribution to the climate mainstreaming was estimated at 20.9 %.
9
Commission's management and protection of the EU budgetIn addition to the results achieved through EU spending, the way in which the EU budget is managed has an important impact on its overall performance. This is why the Commission strives to
achieve the highest standards in financial management in terms of efficiency, effectiveness and cost-effectiveness.
Protection of the EU budget through its effective management
The Commission gives the highest priority to ensuring that the EU budget is well-managed and that all the necessary measures are in place to protect taxpayers' money.
Although management of the budget is the ultimate responsibility of the Commission, 74 % of expenditure is executed by Member States authorities under shared management.
The Commission protects the EU budget, i.e. EU spending, from undue or irregular expenditure via two main mechanisms:
(i) Preventive mechanisms (e.g. ex-ante controls, interruptions and suspension of payments); and
(ii) Corrective mechanisms (primarily financial corrections imposed on Member States but also recoveries from recipients of EU payments): where preventive mechanisms are not effective, the Commission, in its supervisory role, is required to apply corrective mechanisms as a last resort.
The Commission departments have made progress over the years on limiting the annual error rate. Despite the downward trend of the estimated error rate, the European Court of Auditors has not yet issued a positive Statement of Assurance on its opinion on the legality and regularity of the underlying payments, because its estimate of the Commission's annual error rate is still above the materiality threshold of 2 %13. However, while errors may be detected in any given year, they are also duly corrected in subsequent years. A multiannual analysis of those errors and corrections is thus
necessary and more appropriate. Indeed, in the context of the Multiannual Financial Framework, the Commission's spending programmes, control systems and management cycle are also multiannual by design.
In 2016, the total financial corrections and recoveries implemented amounted to EUR 3.4 billion, which is equivalent to 2.5 % of payments made. During the period 2010-2016 the average amount confirmed was EUR 3.3 billion or 2.4 % of the average amount of payments made from the EU budget, while the average amount implemented was EUR 3.2 billion or 2.3 % of payments.
The forward-looking overall amount at risk at closure, i.e. when all corrections (will) have been made, is estimated to be less than 2 % of total relevant expenditure. This implies that the Commission departments' multiannual control mechanisms in general ensure appropriate management of the risks relating to the legality and regularity of the transactions and that the financial corrections and recoveries made in subsequent years do protect the EU budget overall.
In the meantime, further actions are being taken for those programmes with persistently high levels of error to address their root causes14 and to prevent, detect and correct fraud15. In this context, the new Early Detection and Exclusion System (EDES) for the protection of EU financial interests entered into force on 1 January 2016, which strengthens the protection of the EU budget against unreliable economic operators.
Management Assurance
In their 2016 Annual Activity Reports, all 49 Authorising Officers by Delegation declared that they had reasonable assurance that the information contained in their report gives a true and fair view; the resources assigned to the activities have been used for their intended purpose and in accordance with the
principle of sound financial management; and that the control procedures put in place give the necessary guarantees concerning the legality and regularity of the underlying transactions.

10
For transparency, in the Annual Activity Reports, reservations are issued for those programmes for which the annual residual error rate has not (yet) fallen below 2 % at the time of reporting.
29 Authorising Officers by Delegation declared an unqualified assurance, while 20 declarations were qualified with a total of 37 reservations for 2016 (33 in 2015). This year's reservations concern expenditure and revenue. In all cases, the Authorising Officers by Delegation concerned have adopted action plans to address the underlying weaknesses
and mitigate the resulting risks.
Regarding the 2016 assurance building, notable progress was made through the annual clearance of accounts and a 10 % retention from each interim payment introduced by DGs REGIO16, EMPL and MARE, a differentiated materiality threshold for Horizon 2020 for the Research DGs and Executive Agencies, and the better segmentation of the assurance building per type of expenditure by DGs DEVCO and NEAR.
Efficient, effective and cost-effective internal control systems
High standards of financial management require that the measures in place to ensure the effective protection of the EU budget are cost-effective.
With this in mind, measures are taken to develop synergies and seek efficiency gains, for example by simplifying rules and procedures, improving and linking financial IT systems, and further externalising and mutualising financial expertise. This ultimately leads to a lower bureaucratic burden, proportionate costs for controls on beneficiaries, lower error rates, improved data quality, and shorter "time to grant" and "time to pay" periods.
Progress has already been made, notably on the simplification of financial rules, the digital management of procurement and grants (including the setting up of a single entry point to communicate and exchange information with stakeholders), and reducing payment times.
To further improve the efficiency of financial management, the Commission launched a review in 2016 of the main financial business processes.
Moreover, each Commission department regularly assesses the effectiveness of its internal control systems. Overall, for 2016, all Commission departments concluded that the internal control standards were working well and being implemented effectively.
By the end of 2016, all Commission departments had also assessed the cost-effectiveness of their control systems. Based on these assessments (e.g. of risk, the cost of controls, payment times), the vast majority reviewed their control systems to improve organisational fitness. Increasingly, Commission departments are taking measures to ensure that their control systems remain risk-based and cost-effective. One example of combining resources to gain economies of scale and improve the cost-effectiveness of controls is the setting up of the Common Support Centre which serves 20 departments and other entities such as executive agencies or joint undertakings having in common the execution of the research programme Horizon 2020.
11
Structure of the Annual Management and Performance ReportSection 1 of this report summarises the EU budget performance based on the latest available evidence on the results achieved with the EU budget up to end 2016. This reporting draws on information from the Programme Statements that are part of the budget proposal for 2018, the 2016 Annual Activity Reports produced by Commission departments; and other sources such as evaluations17
and implementation reports on EU programmes.
It provides an entry point to these documents where further detailed reporting on programmes' objectives and progress on indicators measured against baselines and targets are available. While the report relates to the 2016 reporting year, it draws on the latest available data, which sometimes relate to previous reporting years.
For each of the budget headings, the report provides implementation information on the progress of the 2014-2020 Multiannual Financial Framework programmes and the latest available evidence on the results of the 2007-2013 Multiannual Financial Framework programmes. As requested by the European Parliament and the European Court of Auditors, the report also presents links with the Europe 2020 Strategy and provides concrete examples of the added value of EU financing.
Section 2 describes the Commission’s internal control, financial management and protection of the EU budget in 2016. This reporting is based on the Annual Activity Reports of Commission departments, in which the internal control environment and related issues are described in detail. Where problems were encountered in the course of the year the report describes how Commission departments tackled these challenges. This section summarises information on the achievement of the internal control objectives (managing legality and regularity risks; the cost-effectiveness of controls; and anti-fraud strategies), the protection of the EU budget and the management assurance provided to the College.
This assurance is based not only on management's own conclusions (which are based on statistical and non-statistical indicators about control results and corrections), but also cross-checked against opinions from independent parties (the Internal Audit Service's audit findings and limited conclusions, the European Court of Auditors' observations) and the conclusions of the work of the Audit Progress Committee.
The conclusion reached on the basis of the management assurance received from all departments and of the assurance obtained through internal audit work, enables the Commission, by adopting this report, to take overall political responsibility for the management of the 2016 EU budget.
12
Section 1Performance and resultsThe Commission is committed to ensuring that the EU budget achieves the best outcomes for citizens by providing strong support for the EU's political priorities. In 2016, promoting jobs, growth and investment and providing a swift and comprehensive response to the multiple challenges faced by the EU were particularly high priorities.
To ensure resources are allocated to priorities and that every action brings high performance and added value, the Commission implements its EU Budget Focused on Results initiative. Building on the 2014–2020 performance framework, it promotes a better balance between compliance and performance. ‘Focus, agility and results’ are the guiding principles of the initiative, which aims at ensuring that every euro from the EU budget is spent in areas with the highest EU added value, that the performance of the EU budget is rigorously assessed, and that the results achieved are communicated clearly.
In this context, the Commission presented on 14 September 2016, a comprehensive review of the functioning of the multiannual financial framework at mid-term including a review of the EU budget's performance framework. This review was an opportunity to take stock of achievements and of the need to react to major unforeseen challenges such as the migration and security crises. This review underpinned a number of proposals, presented together with a Communication with the aim of topping up funding for the Union's main priorities and needs with approximately EUR 6 billion in the areas of jobs and growth, migration and security. The proposals also aim at creating more flexibility for the EU budget and at simplifying the financial rules for beneficiaries.
To demonstrate the Commission's commitment to providing the necessary conditions for a result-
orientated approach, and to ensure that the focus is placed on results rather than amounts spent, a number of amendments to the Financial Regulation have been proposed by the Commission. For example these would allow for payments based on conditions fulfilled, “single lump sum” payments covering all eligible costs of the action, priority given to simplified forms of grants and clarifying the scope of controls of simplified forms of grants. Simpler and more flexible rules should contribute to swifter and more efficient delivery on the ground, aiming at reducing the costs related to the implementation of EU rules as well as the error rates. The Commission's proposal for a simplified Financial Regulation aims to create a single rulebook easier to read and being 25 % shorter than the present Financial Regulation plus its Rules of Application.
Other progress in 2016 has been made under this initiative. In particular, the structure and the content of programme statements accompanying the 2017 draft budget were improved to provide the Budget Authority with a more focused picture on programme performance. In addition, 2016 was the first time the Commission reported in an integrated package detailed information on revenue, expenditure, management and performance of the EU budget in line with best practices in the field of transparency and accountability (EU budget Integrated Financial Reporting Package)18. The Commission has also actively engaged with experts from the Member States, other EU institutions and international organisations to build a common understanding on the existing performance frameworks and created a an opportunity for sharing new ideas and best practices. In 2016 three such expert group meetings took place and the second Conference on the Budget Focused on Results initiative was organised.

13
Key features of the EU budget
2014–2020 performance frameworkImplementing a robust performance framework for the EU budget is a prerequisite for more result-oriented and well-managed EU programmes. For the 2014-2020 Multiannual Financial Framework, performance frameworks have been included as a new compulsory element in the legal basis of the programmes and as a key pillar of the increased result orientation of this programming period. These frameworks require the establishment of clear and measureable objectives and indicators as well as monitoring, reporting and evaluation arrangements. The Commission considers that monitoring these indicators together with evaluations provides a good basis on which performance can be assessed to ensure that the programmes are on track to achieve the intended objectives. It also helps anticipate and resolve problems when they arise.
During the first years of programme implementation, performance information is essentially based on inputs (financial allocation) and, when possible, outputs. This first set of information gives a good indication of the EU budget spending and its contribution to the political priorities. As programme execution progresses, information on outcome and impact will become available, but this will only happen once sufficient time has elapsed for the money spent to produce an impact.
Audits from the European Court of Auditors also help improving the performance of programmes, operations, management systems and procedures of bodies and institutions that manage EU funds.19
Recent reports for instance confirm the need to simplify rules and to strengthen or streamline the performance framework. These lessons learned will feed into the Commission's preparation for the next generation of programmes.
Shared responsibilities for results
Approximately three quarters of the EU budget are implemented under shared management with the Member States. Although the Commission has the ultimate financial responsibility for the management of the EU budget, the responsibility for the results achieved with the EU budget is shared with a wide
range of actors at European, national and regional level. All have a part to play to ensure that every euro spent with the EU budget serves efficiently and effectively its intended purposes.
A strong catalytic effect
Working in conjunction with national budgets, the EU budget is a tool which complements policy and regulatory instruments to deliver on the EU priorities. Though it is relatively small in size (equivalent to approximately 2 % of overall public spending in the EU) it has strong leverage and catalytic effects. It has the ability to leverage funds through financial instruments; one prominent example of this is the European Fund for Strategic Investments. It can also help direct national public investments towards the commonly agreed EU objectives through co-financing.
Coherence with national budgets
The Commission works closely with Member States to ensure the complementarity of EU and national budgets and to strengthen coordination of economic policies between Member States. This work undertaken within the European Semester (including the country-specific recommendations) is essential to create synergies and minimise the fiscal burden where possible.
Multiannual nature
Unlike national budgets, the EU budget is multiannual in nature, making it primarily an investment budget. The Multiannual Financial Framework supports EU action in the medium and long-term and strives to provide a coherent and stable long-term vision for its beneficiaries and co-financing national authorities. However, the unpredictable nature of the recent crises within and outside Europe has shown that the EU budget needs also to be able to adjust swiftly to unforeseen events and to deliver rapidly on the ground. The right balance between predictability and the responsiveness of the EU budget needs constant re-assessment and re-adjustment.
14
2016 EU budget:
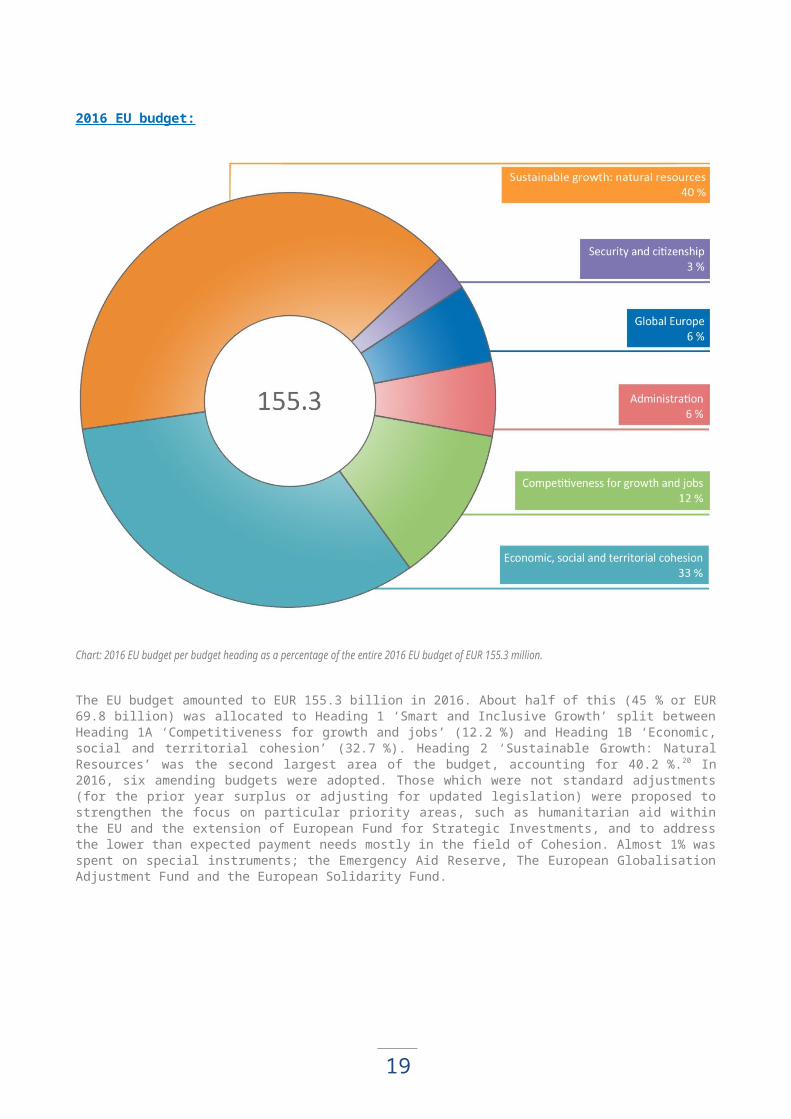
Chart: 2016 EU budget per budget heading as a percentage of the entire 2016 EU budget of EUR 155.3 million.
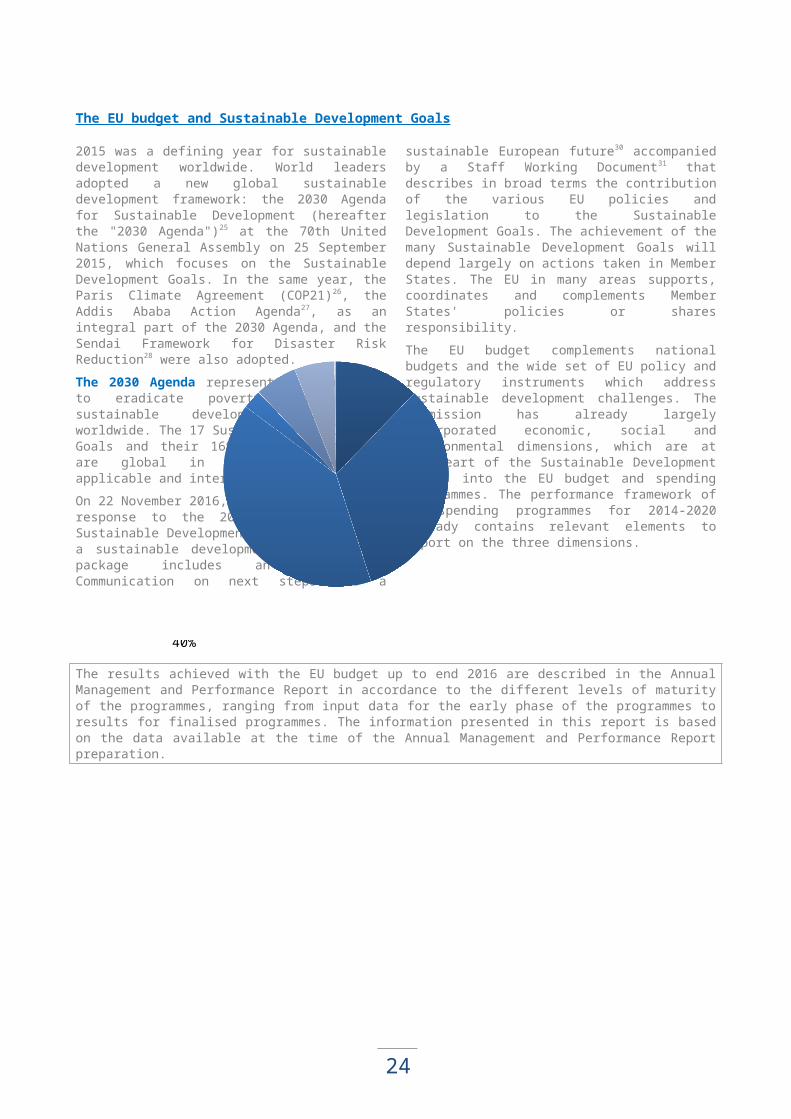
The EU budget amounted to EUR 155.3 billion in 2016. About half of this (45 % or EUR 69.8 billion) was allocated to Heading 1 ‘Smart and Inclusive Growth’ split between Heading 1A ‘Competitiveness for growth and jobs’ (12.2 %) and Heading 1B ‘Economic, social and territorial cohesion’ (32.7 %). Heading 2 ‘Sustainable Growth: Natural Resources’ was the second largest area of the budget, accounting for 40.2 %.20 In 2016, six amending budgets were adopted. Those which were not standard adjustments (for the prior year surplus or adjusting for updated legislation) were proposed to strengthen the focus on particular priority areas, such as humanitarian aid within the EU and the extension of European Fund for Strategic Investments, and to address the lower than expected payment needs mostly in the field of Cohesion. Almost 1% was spent on special instruments; the Emergency Aid Reserve, The European Globalisation Adjustment Fund and the European Solidarity Fund.

15
Summary account of progress on horizontal issues
The EU budget and the Europe 2020 strategy
The 2014-2020 Multiannual Financial Framework and its constituent programmes have been designed to help deliver on the commonly agreed goals of the Europe 2020 strategy, aiming at making the EU a smart, sustainable and inclusive economy by 2020.
The allocation of the EU budget to the different priorities shows that the overall structure of the 2014-2020 Multiannual Financial Framework reflects the objectives of the Europe 2020 strategy.
To measure progress towards the achievement of smart, sustainable and inclusive growth, the Europe 2020 strategy21 includes five headline targets on employment, research and development, climate and energy, education, and the fight against poverty and social exclusion. These headline targets have been translated by each Member State into national targets. A wide range of actions at national, EU and international levels are being carried out to deliver concrete results. The EU budget is only one of the levers contributing to the achievement of the Europe 2020 headline targets; its success depends on all the actors of the Union acting collectively.
There is a clear link between the individual targets and the triptych of Europe 2020 priorities of smart, sustainable and inclusive growth22. The targets were chosen to be mutually reinforcing and contribute together to the three dimensions of the triptych. The targets aim to highlight a selected number of key drivers for growth of relevance for all Member States, which could guide Member States' action supported by the EU budget. They are deliberately non-comprehensive and do not capture all levers for growth.
The Europe 2020 headline targets are monitored by the Commission using nine indicators. Information on progress on these indicators is regularly updated and published on Eurostat’s website.23 The following diagram presents the latest available data24 for the nine indicators. It shows the progress made since 2008 and the distance still to be covered towards the related Europe 2020 targets. The latest data indicates that indicators related to environmental targets and education are progressing towards the headline targets, while further efforts are still required in the area of employment, research and development and fight against poverty or social exclusion.
Employment rateage group 20-64
Gross domesticexpenditure on R&D
Greenhouse gasemissions
Share of renewable energyin gross final energy consumption
Primary energyconsumptionFinal energy consumption
Early leavers from education andtraining
Tertiary educational attainment
People at risk of poverty or socialexclusion
EU-28 (2015)
EU-28 (2008)
Target
Chart: Europe 2020 headline targets – base vs 2015 vs target (100 %) – source website Eurostat

16
Mainstreaming of climate action and biodiversity
The EU budget is also an important tool in the achievement of cross-cutting policy objectives such as climate action and biodiversity. To respond to challenges and investment needs related to climate change, the EU has decided that at least 20 % of its budget for 2014-2020 – as much as EUR 200 billion over the whole period − should be spent on climate change-related action. To achieve this result, mitigation and adaptation actions are being integrated into all major EU spending programmes, in particular regional development and the Cohesion fund, energy, transport, research and innovation, the common agricultural policy as well as the EU’s development policy. Starting from the 2014 draft budget, the estimates for the
climate related expenditures are monitored on an annual basis in accordance with the methodology based on the so-called Rio markers. In 2016 the total contribution to the climate mainstreaming was estimated at 20.9 %.
Similar to the mainstreaming of the climate action, the tracking procedure for biodiversity-related expenditure forecasted that 7 % of the 2015 budget and 9 % of the 2016 budget were allocated to limiting and reversing the decline of biodiversity in the EU, making an important contribution to the Europe 2020 sustainable growth objectives.
Chart: EU budget contribution to climate action between 2014 - 2017: EUR 105 589 million by EU budget area, Source Statement of Estimates 2018 - **"Other areas" includes expenditure in other programmes (and PS) in Heading 1a (Copernicus, Connecting Europe Facility, COSME), Heading 3 (Union Civil Protection Mechanism), Heading 4 (Union Civil Protection Mechanism, Instrument of Pre-accession Assistance II, EU Aid Volunteers initiative, Instrument of financial support for the Turkish Cypriot Community, European Neighbourhood Instrument, European Instrument for Democracy and Human Rights, Development Cooperation Instrument, Cooperation with Greenland, Instrument contributing to Stability and Peace, Partnership Instrument for cooperation with third countries and Humanitarian aid).
17
The EU budget and Sustainable Development Goals
2015 was a defining year for sustainable development worldwide. World leaders adopted a new global sustainable development framework: the 2030 Agenda for Sustainable Development (hereafter the "2030 Agenda")25 at the 70th United Nations General Assembly on 25 September 2015, which focuses on the Sustainable Development Goals. In the same year, the Paris Climate Agreement (COP21)26, the Addis Ababa Action Agenda27, as an integral part of the 2030 Agenda, and the Sendai Framework for Disaster Risk Reduction28 were also adopted.
The 2030 Agenda represents a commitment to eradicate poverty and achieve sustainable development by 2030 worldwide. The 17 Sustainable Development Goals and their 169 associated targets are global in nature, universally applicable and interlinked.
On 22 November 2016, the EU presented its response to the 2030 Agenda and the Sustainable Development Goals and adopted a sustainable development package29.This package includes an overarching
Communication on next steps for a sustainable European future30 accompanied by a Staff Working Document31 that describes in broad terms the contribution of the various EU policies and legislation to the Sustainable Development Goals. The achievement of the many Sustainable Development Goals will depend largely on actions taken in Member States. The EU in many areas supports, coordinates and complements Member States' policies or shares responsibility.The EU budget complements national budgets and the wide set of EU policy and regulatory instruments which address sustainable development challenges. The Commission has already largely incorporated economic, social and environmental dimensions, which are at the heart of the Sustainable Development Goals, into the EU budget and spending programmes. The performance framework of EU spending programmes for 2014-2020 already contains relevant elements to report on the three dimensions.
1 a. Competitiveness for growth and jobs
19.0112%
1 b. Economic, social and territorial cohe-
sion50.831150263
33%2. Sustainable growth: natural
resources62.469514833
40%
3. Security and cit -izenship
4.2920666983%
4. Global Europe9.377427936
6%
5. Administration8.95101604
6%
9. Special Instruments0.345692491
0%
The results achieved with the EU budget up to end 2016 are described in the Annual Management and Performance Report in accordance to the different levels of maturity of the programmes, ranging from input data for the early phase of the programmes to results for finalised programmes. The information presented in this report is based on the data available at the time of the Annual Management and Performance Report preparation.

18
1.1. Competitiveness for Growth and Jobs (Budget Heading 1A)32
EUR 19 billion was allocated to the programmes for Competitiveness for Growth and Jobs (commitments in Heading 1A) in 2016. This represents 12.2 % of total annual budget expenditure.
The main programmes under the budget heading ‘Competitiveness for growth and jobs’ are:
the Horizon 2020 Framework Programme for research and innovation;
large infrastructure projects (Galileo, International Thermonuclear Experimental Reactor (ITER), Copernicus);
the Erasmus+ programme funding education, training, youth and sport actions;
the Connecting Europe Facility funding interconnections in trans-European transport, energy and ICT networks; and
the European Fund for Strategic Investments, part of the Investment Plan for Europe.33
Chart: Bottom: Share for Heading 1A in the entire 2016 budget. / Top: Main programmes financed in 2016 under Heading 1A. Category 'Other programmes' include among others EU programme for Employment and Social Innovation (EASI), Customs and Fiscalis. Category 'Large infrastructure projects' includes among others Galileo, European Geostationary Navigation Overlay Service (EGNOS), Copernicus, ITER. All amounts in EUR million.
19
Programmes' support to the Commission priorities
The programmes under this budget heading contribute mainly to the Juncker Commission priorities of ‘Jobs, Growth and Investment,’ ‘Digital Single Market,’ ‘Energy Union and Climate,’ and ‘Deeper and Fairer Economic and Monetary Union.’ They contribute to the Europe 2020 priorities of ‘smart and sustainable growth’ and to ‘inclusive growth’ mainly through the job creation and employability effects of Horizon 2020 and Erasmus+. The programmes under this budget heading also contribute to Europe 2020 by boosting research and innovation, improving skills levels and (life-long) education, fostering entrepreneurship, facilitating the use of smart networks and the digital economy, building interconnected trans-European networks, investing in pan-European infrastructures, and aiming at greater energy and resource efficiency.
1.1.1. Progress of 2014-2020 programmes
The budget under heading 1A 'Competitiveness for growth and jobs' contributed to the Europe 2020 priorities of Smart and Sustainable Growth. The main programmes stimulated investment and job creation in a context of modest growth forecasts and a slowly recovering European economy.
With the aim to overcome the current investment gap in the EU, the European Fund for Strategic Investments, in close partnership with the European Investment Bank, continued to mobilize private financing for strategic investments in innovative and strategic projects. The EU budget supports the European Fund for Strategic Investments through the EU Guarantee Fund34.
Other main programmes financed initiatives building networks and know-how across the EU, such as the research and innovation programme Horizon 2020; the programme for the Competitiveness of enterprises and small and medium-sized enterprises (COSME); and the Connecting Europe Facility.
In addition, large-scale projects such as Galileo, Copernicus and ITER, contributed to ensuring a leading European role in the space sector and to proving that fusion can be a sustainable energy source.
To ensure that citizens can fully benefit from the opportunities created by Europe, programmes such as Erasmus+, help develop key skills for future job-seekers.
20
The European Fund for Strategic Investments (EFSI) – backed by the EU Guarantee Fund
As of end December 2016, i.e. half of the way into its investment period, the implementation of the European Fund for Strategic Investments was on track. The volume of investment expected to be mobilised by the approved European Fund for Strategic Investments operations stood at EUR 163.9 billion (and as of mid-May 2017 went up to more than 190 billion in all EU Member States), which is more than half of the target of EUR 315 billion by mid-201835. It is distributed across its two strands as follows:
- In the Infrastructure and Innovation Window, the European Investment Bank approved 175 projects of around EUR 94.4 billion in investment value, with European Investment Bank financing supported by the EU guarantee under the European Fund for Strategic Investments expected to amount to EUR 22.4 billion. These projects are situated in 25 Member States and thereby exceed the 2016 milestone of 20 countries.
- In the Small and Medium-sized Enterprises Window, 244 operations have been approved by the European Investment Fund for a total investment value of EUR 69.5 billion. More than 380 000 small and medium-sized companies and mid-caps in all Member States are expected to benefit.
Projects financed by the European Fund for Strategic Investments vary from backing; i) an affordable housing plan in Poland, which provides for the construction of 1300 affordable houses, ii) the construction of fourteen primary care centers across Ireland, iii) the construction of two biomass-fired combined heat and power plants, which will improve energy security and supply of electricity and iv) the roll out of a new ultra-high-speed broad band network in about 700 communes in Alsace, France. All projects can be found at the European Fund for Strategic Investments' projects map: http://www.eib.org/efsi/map/index.htm
The evaluation of the first year of experience with the European Fund for Strategic Investments36 indicated that the EU guarantee has been an efficient and effective way of increasing the volume of European Investment Bank special activities and European Investment Fund guarantees in favour of small and medium-sized companies and mid-caps. However, new models of cooperation with national promotional banks or financial intermediaries should be developed to facilitate the deployment of risk-sharing instruments and subordinated financing under the Infrastructure and Innovation Window. While the EU guarantee has enabled the European Investment Bank to undertake riskier activities, the evaluation found that the European Fund for Strategic Investments is not designed to support first-loss pieces in investment platforms addressing serious market failures. Thus, the European Investment Bank

21
has been less able to deliver long-term fixed rate financing in certain non-euro countries with less developed financial markets.
The Commission is also working on making combinations of the European Fund for Strategic Investments with other European funding.
One example is the Connecting Europe Facility Debt Instrument. This piloted new financial products for sustainable transport, such as the Green Shipping Guarantee Programme37 launched in 2016, to be
scaled up by the European Fund for Strategic Investments, which will potentially mobilize EUR 3 billion of investment in equipping vessels with clean technologies. The pilot phase of the programme - expected amount of up to EUR 250 million - will be supported by the Connecting Europe Facility Debt Instrument while the balance of the programme of up to EUR 500 million i supported by the European Fund for Strategic Investments.

22
Horizon 2020
Progress in implementationFollowing calls for proposals, interested parties can submit a proposal for financing, which is evaluated by independent experts.
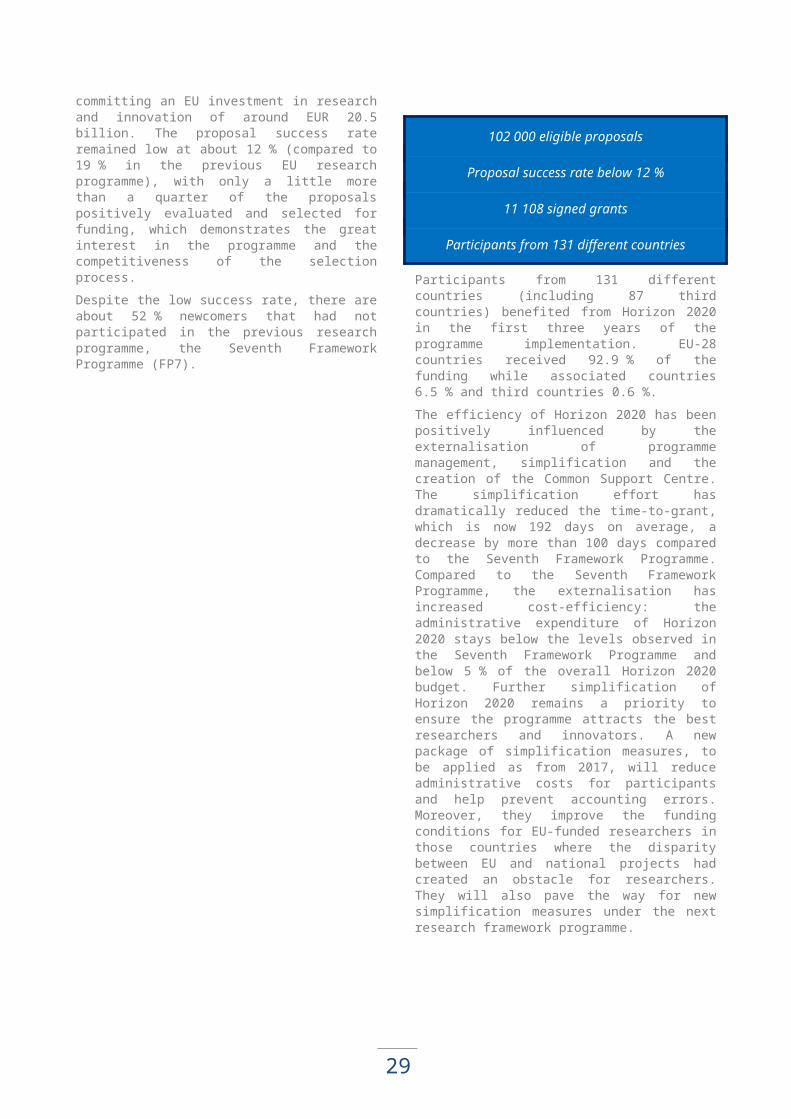
By the end of 2016, over 102 000 eligible proposals had been submitted to Horizon 2020 calls. Over 11 000 grant agreements with 49 000 participations had been signed, committing an EU investment in research and innovation of around EUR 20.5 billion. The proposal success rate remained low at about 12 % (compared to 19 % in the previous EU research programme), with only a little more than a quarter of the proposals positively evaluated and selected for funding, which demonstrates the great interest in the programme and the competitiveness of the selection process.
Despite the low success rate, there are about 52 % newcomers that had not participated in the previous research programme, the Seventh Framework Programme (FP7).
102 000 eligible proposals
Proposal success rate below 12 %
11 108 signed grants
Participants from 131 different countries
Participants from 131 different countries (including 87 third countries) benefited from Horizon 2020 in the first three years of the programme implementation. EU-28 countries received 92.9 % of the funding while associated countries 6.5 % and third countries 0.6 %.
The efficiency of Horizon 2020 has been positively influenced by the externalisation of programme management, simplification and the creation of the Common Support Centre. The simplification effort has dramatically reduced the time-to-grant, which is now 192 days on average, a decrease by more than 100 days compared to the Seventh Framework Programme. Compared to the Seventh Framework Programme, the externalisation has increased cost-efficiency: the administrative expenditure of Horizon 2020 stays below the levels observed in the Seventh Framework Programme and below 5 % of the overall Horizon 2020 budget. Further simplification of Horizon 2020 remains a priority to ensure the programme attracts the best researchers and innovators. A new package of simplification measures, to be applied as from 2017, will reduce administrative costs for participants and help prevent accounting errors. Moreover, they improve the funding conditions for EU-funded researchers in those countries where the disparity between EU and national projects had created an obstacle for researchers. They will also pave the way for new simplification measures under the next research framework programme.
ResultsAs Horizon 2020 was launched in 2014, the first projects were only signed towards the end of 2014. This implies that a meaningful volume of data concerning the activities of the projects under implementation will only be available in 2017. Notwithstanding this, some results show the good state of implementation of Horizon 2020 and that the performance is well on track to meet the objectives of Horizon 2020.

23
Contribute to climate action, biodiversity and sustainable developmentThe contribution to climate action and sustainable development has significantly increased in Horizon 2020 compared to the Seventh Framework Programme. The preliminary results 2014-2016 indicate that the 60 % expenditure objective for sustainable development is achievable, but expenditure for climate action currently falls below the 35 % target. Particular attention - and budget – will be devoted to this objective in the work programme 2018-2020.
Chart: Climate-related and sustainability-related expenditure in Horizon 2020 (cumulative figures)
24
25
PROMOTioN
The project PROMOTioN ('Progress on Meshed HVDC Offshore Transmission Networks') investigates the benefits to the European electricity market of a meshed offshore transmission grid and it will develop HVDC (high-voltage direct current) technologies that will link off-shore wind parks in the North Sea and on-shore grids electricity in different countries. Currently it is the biggest energy project in Horizon 2020 with an EU contribution of EUR 39.3 million over four years. The project includes 34 partners from 11 countries, including all major HVDC manufacturers, Transmission System Operators (TSO’s) linked to the North Sea, several wind turbine suppliers, offshore wind developers, leading academics and industry.
Effectiveness: The project addresses a trans-national challenge: linking off-shore wind parks to on-shore grids in different European countries.
Efficiency: A 2014 study38 showed that an EU-coordinated approach on this issue will result in significant lower overall infrastructure costs and CO2 emissions. The project is expected to realise some of this potential. It has an environmental impact because it enables an increased wind energy integration which minimizes the impact on the marine environment. In addition, innovations on component level, the reduced size and weight of offshore converter stations, and bio-degradable insulation liquids further reduce the environmental impact of the grid.
Synergy: The big players in the European HVDC industry are represented in the PROMOTioN consortium. The project will further strengthen the European leadership as knowledge center for HVDC in the world by bringing new HVDC technology innovations to a higher technology readiness levels (TRL) and thereby create jobs in Europe.
https://www.promotion-offshore.net/
Leverage and boost engagement of industrySmall and medium-sized enterprises have so far received over EUR 3 billion of funding. The target set by the European Parliament and Council, which stated that at least 20 % of the 'Societal Challenges' and 'Leadership in Enabling and Industrial Technologies (LEIT)' should go to small and medium-sized companies was exceeded by almost 4 percentage points. Horizon 2020 has introduced a new funding instrument specifically designed for innovative small and medium-sized companies. The attractiveness of this instrument in many of the smaller Member States proves its accessibility. In line with the target of 7 % for the overall period (as established by the co-legislators), 5.6 % of this combined budget has already been devoted to direct support to small and medium-sized enterprises through the Small and Medium-sized Enterprises instrument39. Across Horizon 2020, about 21 % of all participations were participations of this category of enterprises.
Chart: the share allocated through the SME instrument out of share of funds allocated to small and medium-sized enterprises in the Horizon 2020 societal challenges and LEIT
Industry participation – both in terms of involvement in submitted proposals and in selected projects – has shown a very encouraging trend over the past two years. 5 399 grants with at least one industry participant have already been signed40 representing an EU financial contribution of EUR 45.7 billion.
2014 2015 2016 20200.0%
5.0%
10.0%
15.0%
20.0%
25.0%
30.0%
5.0% 5.1% 5.6%Target (7.0%)
22.8% 23.7% 23.9%
Target (20.0%)
Share of the EU financial contribution to LEIT and Societal chal-lenges going to SME'sof which share of the EU financial contribution allocated through SME instrument

26
The Fast Track to Innovation pilot – a pilot launched in 2015 to bring close-to-market innovation by consortia to the market - has received a positive response from industry: 46 projects and 204 entities were selected for funding, with an EU contribution of EUR 98.7 million. Around 75 % of the entities selected were from industry, among which 63 % were small and medium-sized enterprises. However, with a proposal success rate of 5 % a continuation of the Fast Track to Innovation would need to consider the need for additional funding.
Finally, the role of Financial Instruments has already increased due to their leverage effect on public investment resources, their capacity to combine different forms of public and private resources, and their longer-term financial sustainability. More than 5 700 innovative companies, mainly small and medium-sized companies and small midcaps, have received funding of more than EUR 8 billion from Horizon 2020 financial instruments. This financial support has triggered more than EUR 20 billion of additional investment across the EU and associated countries. The quick build-up of the Horizon 2020
financial instruments was made possible due to a strong demand from innovative companies and through synergies with the Investment Plan for Europe/ European Fund for Strategic Investments, which provides additional resources to innovation and research activities. Out of the European Fund for Strategic Investments transactions approved by the European Investment Bank so far, 21 % are in the Research & Development and Innovation sector and two thirds of these projects have a strong Research & Development and Innovation element.
The Knowledge and Innovation Communities (KICs) funded by the European Institute of Innovation and Technology brought together around 1 000 education, business and research organisations.
They created more than 300 new start-ups, which employ around 5 500 people and attracted more than EUR 500 million from external investors.
Reinforce and extend the excellence of the EU’s scienceIn 2016, the Marie Skłodowska-Curie actions (MSCA) celebrated their 20th anniversary and the 100 000th
MSCA fellows. Between 2014 and 2016, the programme funded 25 000 researchers (approximately 11 000 PhD candidates).
In 2015, more than 33 000 researchers41 had access to research infrastructures, including e-infrastructures, through Union support. The Pan-European Research Infrastructures offers increasingly sophisticated technologies that can only be hosted in large-scale platforms that combine Research with Development and integration with validation.
In addition, the Nobel Prize in Chemistry has been awarded jointly to 3 laureates (Jean-Pierre Sauvage, Sir J. Fraser Stoddart and Bernard L. Feringa) who previously had been involved in several EU funded projects since the 4th research framework programme (FP4), including Marie Skłodowska-Curie actions and European Research Council grants.
25 000 MSCA researchers (including 11 000 PhD candidates)
Nobel Prize in Chemistry awarded jointly to 3 laureates who have been receiving funding since
the fourth research framework programme
More than 33 000 researchers had access to research infrastructures supported by the EU
Horizon 2020 is also implemented through partnerships aiming to tackle the biggest challenges, support competitiveness of sectors that deliver high quality jobs, encourage greater private investment in research and innovation and develop closer synergies with national and regional programmes.
Seven Public-Private Partnerships (PPPs) address strategic technologies that underpin growth and jobs in key European sectors in fields such as innovative medicine, fuel cells and hydrogen, electronics, aeronautics and bio-based industries. A tangible metric for assessing the EU added value of the Joint Undertaking is the "leverage effect.42, The first estimates demonstrate that the joint undertakings are well on track to achieving and, in some cases, exceeding the legally minimum foreseen leverage effect. As the number of signed grant agreements increases, a more detailed reporting on the leverage effect will be possible. It has to be stressed, however, that the overall leverage effect can only be assessed at the end of the programme. Further investment is leveraged through contractual Public-Private Partnerships working in areas such as factories of the future, robotics and green vehicles, and also cybersecurity, for which the partnership was signed in the beginning of July 2016.

27
New leveraging opportunities: 5 700 innovative companies received more than EUR 8 billion from financial instruments. This has triggered more than EUR 20 billion investment in innovative projects.
COSME
COSME aims to strengthen the competitiveness and sustainability of the Union’s enterprises, particularly small and medium-sized enterprises, by facilitating access to finance (60 % of budget) and access to markets (21.5 % of budget). The remaining 18.5 % is targeted to encourage an entrepreneurial culture and to promote the creation and growth of small and medium-sized companies.
Access to finance for small and medium-sized enterprises:
The COSME financial instruments build on the success of the financial instruments set up under the Competitiveness and Innovation Framework Programme (CIP) 2007-2013, which helped to mobilise more than EUR 21 billion of loans and EUR 3 billion of venture capital to over 387 000 small and medium-sized companies in Europe43.
COSME provides a loan guarantee facility for financial intermediaries when they finance riskier small and medium-sized enterprises which would otherwise not be able to obtain funding. Its implementation is well on track. As of the end of 2016, a total of 67 agreements for loan guarantees have been signed for EUR 612 million.
Thanks to these agreements, on 31 December 2016, more than 143 000 small and medium-sized companies have already received financing for more than EUR 5.5 billion under the enhanced Loan Guarantee Facility44. Out of these small and medium-sized enterprises, 91 % have less than 10 employees and around 40 % were created less than five years ago. These Small and Medium-sized Enterprises are located in 21 countries.

28
As illustrated in the table below, current estimations show that foreseen 2017 milestones will be exceeded, thanks in part to the support provided under the European Fund for Strategic Investment:.
Number of small and medium-sized companies benefitting from
debt financing
Financing mobilised from guarantees
Milestone for 31/12/2017 108 000-161 000 EUR 7- 10.5 billion
Situation 31/12/201645 143 000 EUR 5.5 billion
Apart from loan guarantees COSME also provides an equity facility. Due to the specificities of the risk and venture capital market, the equity facility had a slower start, with first fund agreements signed end of 2015. At the end of 2016, nine fund agreements have been signed (out of which one conditional). Under these agreements, a total amount of EUR 471 million will be invested into small and medium-sized enterprises in their growth and expansion stage. Currently, EUR 64 million has been invested into twelve small and medium-sized companies located in seven Member States.
Facilitating internationalisation of small and medium-sized enterprises and access to market:
More than two thirds of the COSME budget for access to markets is devoted to the Enterprise Europe Network (EEN), which helps small and medium-sized companies to internationalise in particular by finding business and technology partners abroad. The Network now comprises 479 organisations within the EU and 85 in eight COSME participating countries. Out of these, 20 % are new organisations. With 5 088 partnerships signed
between small and medium-sized enterprises, the Network achieved beyond its targets in the first two years. The Network also actively helps small and medium-sized companies making the most of the internal market by providing information, advice and brokerage: 56 244 advisory services were delivered and 21 676 clients attended brokerage events and company missions.
The Erasmus for young entrepreneurs' (EYE) scheme, under COSME, has reached 4 600 exchanges between new and experienced entrepreneurs since the start of the programme.
The evaluation of the programme performed in 2014 already concluded that the overall concept of the programme proved to be successful in addressing the needs of entrepreneurs in the European market. About 36.5 % of 'Erasmus for young entrepreneurs' participants started a business in the reference period and 30 % of new entrepreneurs46 and 56 % of host entrepreneurs47 replying to the survey recruited persons after the completion of Erasmus for young entrepreneurs.
Galileo and EGNOS - the EU satellite navigation programmesThe Galileo and the European Geostationary Navigation Overlay Service (EGNOS) programmes develop Europe's own global navigation satellite system and provide a highly accurate global positioning service under civilian control. As the new generations of high-performance satellite navigation services offer considerable economic opportunities, the programmes contribute to job creation and growth by ensuring that EU industry increases its market
29
share in the worldwide Global Navigation Satellite System (GNSS) downstream market.
Progress on implementationRegarding space infrastructure deployment, six Galileo satellites were launched successfully in 2016. In particular, for the first time, four navigation satellites were launched at the same time. This is an excellent achievement for Galileo and it its rapid deployment pace is relatively new for the satellite navigation world. Progress can be illustrated through the below chart which compares the planned and actual progress as regards the development of the Galileo infrastructure.48
Chart: Number of Galileo satellites fully operational
By the end of 2016 the Galileo initial services were declared operational and all necessary conditions for providing the services were met.
The services of Galileo:
- Open Service (OS) is free of charge to the users, providing positioning and synchronisation information intended mainly for high-volume satellite navigation applications for mass-market applications;
- Contribution by the means of Galileo OS to integrity-monitoring services aimed at users of safety-of-life applications in compliance with international standards;
- Commercial Service (CS) for the development of applications for professional or commercial use by means of improved performance and data with greater added value than those obtained through the OS;
- Public Regulated Service (PRS) restricted to government-authorised users, for sensitive applications which require a high level of service continuity;
- Contribution to the Search and Rescue (SAR) support service of COSPAS-SARSAT system by detecting distress signals transmitted by beacons and relaying messages to them.
It is now ensured that the European system Galileo is positioned on the global satellite navigation market in a context where USA and Russian systems are being strengthened and the Chinese system is rapidly building up. This is the first step towards reaching full operational capability. Galileo initial services are fully interoperable with GPS, and their combined use will
2014 2015 201602468
10121416
Number of Galileo satellites fully oper-ational
planned
achieved

30
bring many benefits to the end user. With more satellites available, more accurate and reliable positioning will be available to end users. Navigation in cities, where satellite signals can often be blocked by tall buildings, will particularly benefit from increased positioning accuracy.
The uptake of Galileo greatly benefitted from the declaration of initial services. A range of products are now on the market which are Galileo enabled49. Following the declaration of Galileo Initial Services in 2016, chipset and receiver manufacturers and application developers can use Galileo signals to develop their activities, and a number of Galileo-ready devices are already on the market50. These projects have already led to 13 innovations being brought to the market, 5 patents, 34 advanced prototypes, two products on the market and 223 published scientific papers. The global Navigation Satellite System market is expected to grow from 5.8 billion devices in use in 2017 to an estimated 8 billion by 2020. In 2016, detailed assessment of market uptake continued. In terms of technology penetration, the number of receiver models offering Galileo compatibility increased from 25 % in 2012 to 35 % in
2014 and today stands at nearly 40 %.
For EGNOS the rate stood at 63 % in 2015 and increased to 75 % in 2016. In the agriculture domain 80 % of Global Navigation Satellite System enabled tractors were EGNOS enabled51. At the end of 2016 there were 219 EGNOS enabled airports and 401 EGNOS based procedures in 20 countries in Europe. In road transport the number of trucks using EGNOS for tolling was 1.1 million.
The three services of EGNOS
Open service (OS): open and free of charge service for positioning and timing services (since 2009).
Safety of Life (SoL): service for safety-critical transport applications such as civil aviation which require an integrity warning system (since 2011).
EGNOS Data Access Service (EDAS): terrestrial commercial service to provide the EGNOS signal through the internet to registered users that are not in sight of the EGNOS satellites (since 2012).
CopernicusCopernicus aims to address gaps in European Earth observation capabilities and utilisation, and to guarantee European Institutions and industry with independent access to Earth observation data and information. To achieve this, three components are financed:
1. The Space Component – including the procurement, the launch, the operations of the Sentinel satellites and the operation of the Ground Segment.
2. The In-situ component – supporting the space component and offering access to data generated by a network of national Earth observation assets to produce Copernicus products for the services component.
3. The Services component - delivering data and products freely available tailored to the needs of a wide variety of users.
Regarding infrastructure deployment, 5 Sentinel satellites have been successfully launched and are currently in orbit: Sentinels 1A and 1B (polar-orbiting, all-weather, day-and-night radar imaging), Sentinels 2A and 2B (polar-orbiting, multispectral optical, high-resolution imaging) and Sentinel 3A (optical and altimeter mission monitoring sea and land parameters). In parallel, the Ground Segments for the reception, processing, distribution and archiving of
data have been reinforced, so as to handle effectively the unprecedented amounts of data.
To better reach end-users, six different core services were developed or are currently being developed in different areas. The implementation of the six core Copernicus services provides a direct benefit to the service provider sector (European small and medium-sized enterprises) and creates growth and jobs. Moreover, Copernicus continued to produce substantial direct benefits for Europe’s space industry in 2016, as currently more than 230 suppliers, including 48 small and medium-sized companies benefit from EUR 530 million in contracts financed by the EU.
In 2016, the Commission launched a comprehensive user uptake strategy to foster the use of Copernicus data and to stimulate new economic opportunities enabled by space data. In parallel, the Commission pursued its cooperation with international partners to promote the uptake of Copernicus globally. Arrangements on Copernicus data access and data sharing have already been signed with the United States and Australia.
Copernicus has already been providing observation data in cases of natural disasters. In 2016, a total of
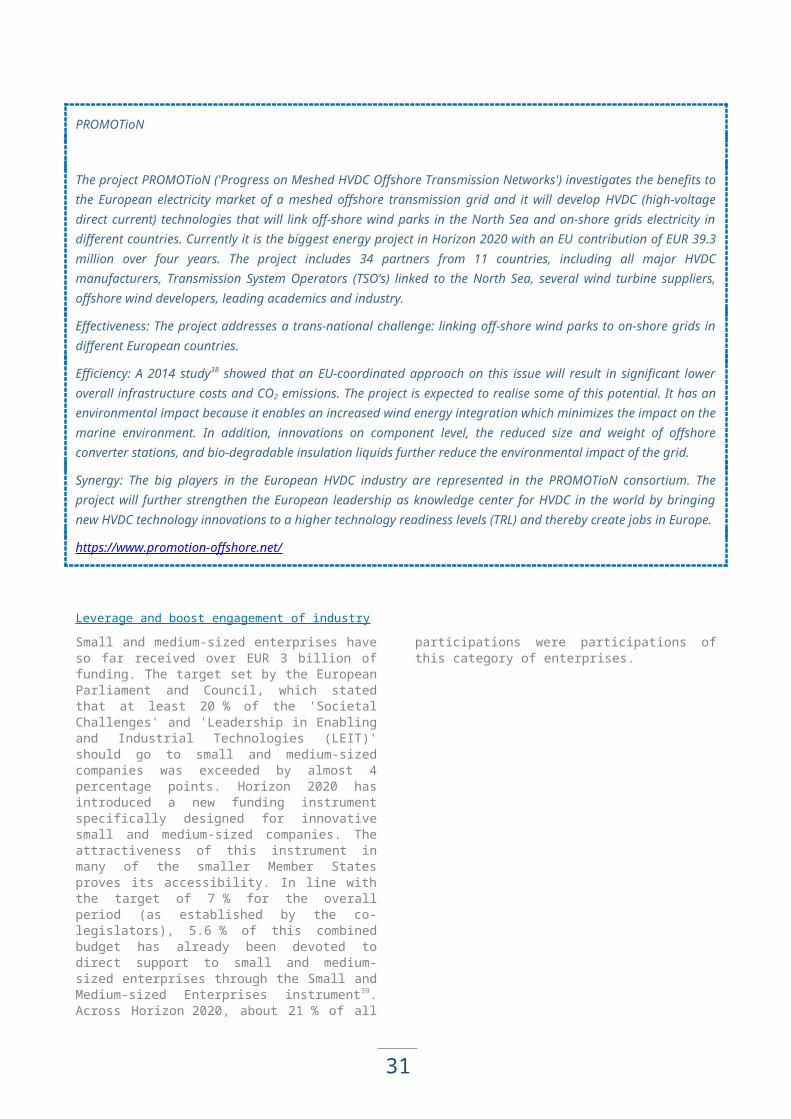
31
38 activations of the Emergency Management Service were made, requesting 33 Rapid Mapping responses and 5 Risk & Recovery Mappings. Floods and fires across Europe dominated the activation picture. Examples of international activations during major disasters were the earthquakes in Ecuador (April 2016) and Cap Verde (August 2016), mud floods in Tajikistan (May 2016) and the tropical cyclones in Fiji (February 2016) and Taiwan (July and September 2016).
Other notable achievements relate to the Copernicus Marine Environment Monitoring Service (CMEMS) becoming fully operational and supplying high value added products for example through its contribution to marine renewable energy development, the sustainable use of marine resources (fisheries, biodiversity) and the fight against pollution. The number of users regularly accessing the products offered by the Copernicus Marine Environment Monitoring Service has steadily grown and has now reached the milestone of 8 600 registered users (vs 5 000 in 2015), for the most part from the EU’s coastal countries but also from 120 other countries
from around the world.
Sentinel-2B is boosting EU agricultural policy
The free imagery provided by Copernicus will reveal changes over time, including the possibility to look at past records with 100 % territorial coverage. By analysing crop types, the administration can check whether a farmer benefiting from 'green payments' kept his permanent grassland or diversified his crops. The Copernicus data offers opportunities to move from on-the-spot compliance checks to remote and automated policy performance monitoring, thereby contributing to simplification, cost efficiency and better policy performance.
Moreover up and downstream sectors and Non-Governmental Organisations will have free access to the open source data for business prospects or independent policy monitoring.
ITERITER is an international project aiming at advancing fusion science. The EU is part of this project. The risks and complications encountered by the project, in particular in terms of delays, risk of cost-overruns and overall governance are largely linked to the inherent first-of-its-kind nature of the project which goes beyond the current state-of-the-art of fusion technology, and to the complex governance set-up of the global consortium leading the project.
In 2015 the ITER Council approved an action plan of the ITER Organization to address the project challenges. One of the major actions of this plan was the revision of the long term schedule of the project and its associated costs, which was successfully completed in November 2016. The new schedule follows the so-called staged approach, recommended by independent experts in April 2016, which focuses first on the construction of the components essential to achieving First Plasma in 2025, followed by successive series of installation and testing phases before starting the full performance phase (Deuterium-Tritium operation) in 2035.
The ITER construction involves over 10 million components being built around the world. About 75 % of the investment in ITER is spent on the creation of new knowledge and cutting-edge materials and technology, offering European industries and Small and Medium-sized Enterprises a major opportunity to innovate and develop 'spin off' products in sectors outside ITER remit such as the broader energy sector, aviation and hi-tech instruments like the
nuclear magnetic resonance – scanners. An example of this is the successful fabrication of the superconductors and the winding packs in Europe for the ITER Toroidal Field Coils, which have never been manufactured with such size before and are therefore a major technological progress.
A total of 108 out of 136 procurement arrangements have been signed by the ITER Organisation for the different work packages of the construction of the ITER reactor. This represents 91.1 % of the project’s total in-kind value. This means that a significant part of ITER activity is now in the hands of the ITER members who will deliver the ITER components. The European Joint Undertaking for ITER (F4E), in charge of delivering the EU contribution to the ITER Organisation, has now placed most of the large value contracts (more than EUR 100 million). As of 31 December 2016, European Joint Undertaking for ITER (F4E) has signed 1 015 operational procurement contracts and 156 grants for a total of about EUR 3.1 billion (2008 value).
Parallel to the action plan of the ITER Organisation, the Governing Board of European Joint Undertaking (F4E) approved in March 2015 an action plan to improve its functioning and also addressing the observations raised by the European Parliament and the Court of Auditors in their reports on the 2013 discharge. This action plan is currently being implemented.
In addition, in response to an audit of the Commission
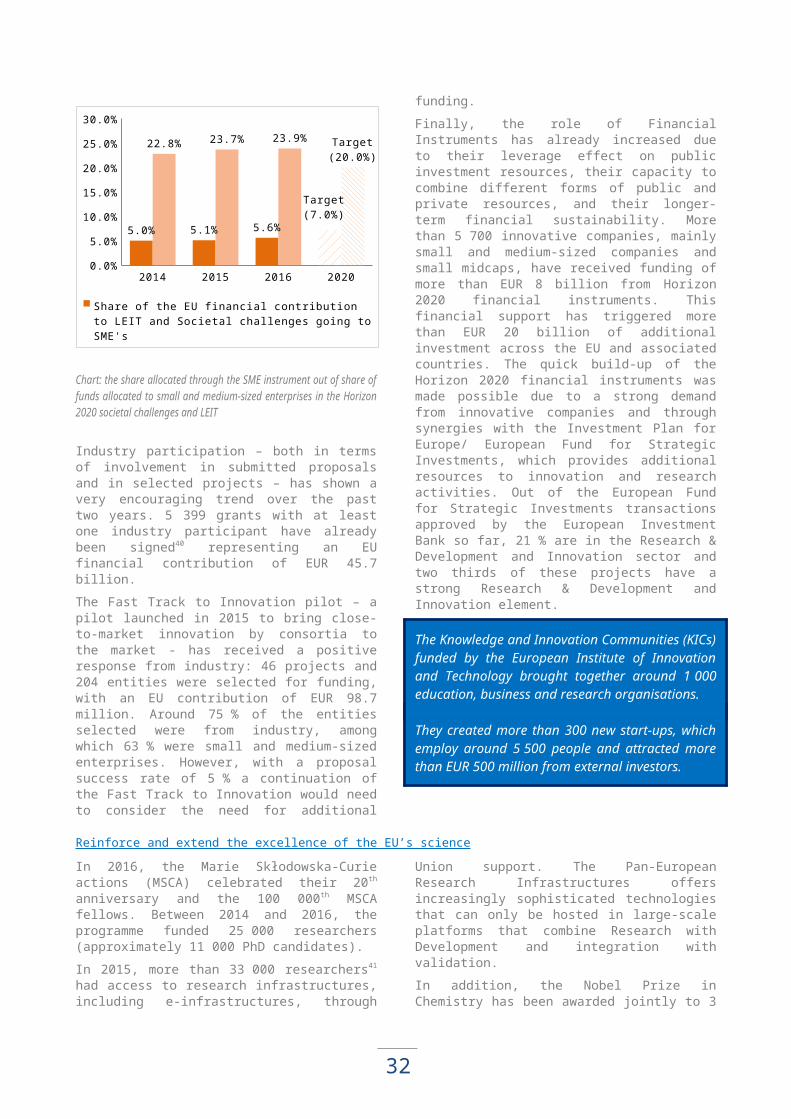
32
Internal Audit Service performed in 2016 on the supervision of ITER by the Commission, the responsible Commission service established an action plan that aims at strengthening its participation in the governance and supervision of the ITER project
as a whole, and in particular at further developing the supervision of the European Joint Undertaking for ITER (F4E).
Erasmus +In its third year of implementation, the Erasmus+ programme entered into a phase of greater stability compared to previous years. Changes to the programme rules were minimised to allow potential stakeholders to become further acquainted with the architecture of the programme, so that they are better able to fully exploit all the opportunities offered by Erasmus+.
Erasmus+ is well on track to meet its target of 4 million participants by 2020. By the end of 2016, most of the projects (87 %) were still ongoing with more than 2 million participants and 168 000 organisations engaged in the projects52. It enabled around 497 000 young people to study, train, volunteer and participate in youth exchanges abroad. The positive impact of this EU programme has been assessed: Commission reports53 underlined that Erasmus students are not only more likely to be employed compared to their non-mobile peers, but also more likely to secure management positions. On average, 64 % of Erasmus students, compared to 55 % of their non-mobile peers hold such positions within 5-10 years from graduation. This holds even more true for
Erasmus students from Central and Eastern Europe, where around 70 % of them end up in managerial jobs54.
Five banks55 and one university have so far signed up to the Erasmus+ Master Loan Scheme56, involving the European Investment Fund. By the end of 2016 a total of EUR 159 million in student loans is available for some 11 500 master student loans, enabled through EUR 25.9 million in guarantee agreements. Although numbers surveyed were small, the feedback among beneficiaries in 2015 was encouraging with high satisfaction levels (70 %). Also 70 % noted they could not have taken on a master abroad without the support of the loan scheme; about half of the respondents were the first in their families to take a higher education degree. In this early stage of the scheme, the level of uptake is not yet meeting expectations, the European Investment Fund and the Commission are therefore seeking to expand the geographical coverage among intermediaries (banks and universities), as well as the uptake among mobile master students.
Connecting Europe Facility (CEF)
The Connecting Europe Facility (CEF) funds projects of common interest supporting interconnections in trans-European transport, energy and Information and Communication Technologies networks.
In the area of Transport, support has been granted to 452 projects for a total of EUR 19.4
billion in investments across Europe.
The grant funding to the Trans-European Network-Transport (TEN-T) projects has helped to kick off
major infrastructure investments in Europe contributed to the overall Connecting Europe Facility goals, such as bridging missing transport links and removing bottlenecks. Examples are:
In July 2016, the first Connecting Europe Facility rail project to be completed was the Improvement of safety on the Central Railway Line in Poland, which was realised under the Safe and Secure Infrastructure priority. It consisted of eliminating two level crossings with local roads located on the railway. This railway is part of the Baltic-Adriatic Core Network Corridor in Central Poland. This project has contributed to improving safety and eliminating bottlenecks and allowed for the speed increase to 200 km/h on the given sections of the line. This project is a perfect example how a relatively small action (total value: EUR 4.1 million, Connecting Europe Facility grant EUR 3.5 million) can contribute to the achievement of the policy objectives.
33
The Connecting Europe Facility contribution to Brenner Base Railunnel - With a length of 64 km the Brenner Base rail tunnel between Innsbruck in Austria and Fortezza in Italy will be the longest high capacity rail tunnel in the world. The tunnel will reinforce considerably the competitiveness of railway traffic along the strategic Munich-Verona stretch and contribute to a better modal shift in the sensitive Alpine region.
In the area of Energy EUR 1.18 billion has been allocated to 75 actions.
The following example financed under the first call for proposals in 2016 is illustrative of how Connecting Europe Facility key policy priorities and cross-border issues are addressed.
Construction of the first gas interconnector between Finland and Estonia to end the energy isolation (Balticconnector) - The Balticconnector and the gas pipeline between Poland and Lithuania to be completed in 2020 will allow Finland and the Baltic States to diversify their gas sources and routes. It will safeguard them against possible supply disruptions from their current single supplier. The pipeline will consist of three sections: 22 km Finnish onshore, 80 km offshore and 50 km Estonian onshore. It enables the transport of 7.2 million cubic metres of gas per day with flows running in both directions. The grant of EUR 187 million covers 75 % of the construction costs.
In the area of Telecom, the Connecting Europe Facility helps to deploy Digital Service Infrastructures and broadband across the EU. These digital service infrastructures will allow all citizens, businesses and administrations across the EU to fully benefit from living in a digital single market. For example, when travelling abroad a citizen will be able to enjoy the continuity of care by using cross border services to access his or her clinical information. In 2016, support in the digital services infrastructure continued. Four calls for proposals were launched with EUR 26.2 million of financing already allocated to 40 proposals under the first call.
1.1.2. Results of 2007-2013 programmes
The previous edition of the Annual Management and Performance Report reported on the main ex-post
evaluations57 for the 2007-2013 programmes of budget heading 1A.
34
1.2. Economic, Social and Territorial Cohesion (Budget Heading 1B)58 EUR 50.8 billion was allocated to the programmes under Heading 1B for 2016, which represents 32.7 % of the total 2016 EU budget.
Chart: Top: Main programmes financed in 2016 under Heading 1B/Bottom: Share for Heading 1B in the entire budget. All figures in EUR million.
This heading covers the ‘European Regional Development Fund’ (ERDF), the ‘Cohesion Fund’ (CF), the ‘European Social Fund’ (ESF)59 — including the ‘Youth Employment Initiative’ (YEI) (a specific top-up allocation), and the ‘Fund for European Aid to the Most Deprived’ (FEAD). All these programmes are delivered under shared management.
Programmes' support to the Commission priorities:
The European Regional Development Fund, Cohesion Fund and European Social Fund constitute the Cohesion Policy of the EU with a budget of EUR 351.8 billion for 2014-2020. The Cohesion Policy is the most important EU investment instrument for the delivery of the Europe 2020 objectives supporting growth and job creation at EU level and structural reforms at national level. Cohesion Policy interventions contribute to the attainment of several of the priorities of the Juncker Commission notably ‘Jobs, Growth and Investment,’ ‘Digital Single Market’ and ‘Energy Union and Climate.’ Cohesion Policy also contributes to the development of the internal market as well as a number of actions relating to the response to the refugee crisis and migration policy.

35
The 2014-2020 Cohesion Policy is fully aligned with the Europe 2020 strategy for ‘smart, sustainable and inclusive growth’. The Cohesion Policy invests strategically in research and innovation, supports smart specialisation, small businesses and digital technologies, thereby contributing to the EU's smart growth objectives. It is also essential for EU's sustainable growth and significantly contributes to steering Europe on the path to a low-carbon economy through financing investments in energy, environment, climate and sustainable transport. In addition to investments in key infrastructures in broadband, transport or water supply, to name a few, and in addition to investments in education and training, social inclusion and professional adaptability of Europe's workforce, Cohesion Policy directly supports enterprises throughout Europe to increase their competitiveness and help them develop innovative products and create new jobs. Cohesion funding represents more than 60 % of the public investment budget in a number of Member States and it has continued to play a pivotal role in supporting long-term investment strategies, supporting structural reforms, encouraging private sector financing, addressing market failures and improving the investment climate.
Throughout 2016 efforts to strengthen the links between the EU economic governance mechanisms and Cohesion policy continued. The 2014-2020 Cohesion Policy programmes address relevant country-specific recommendations (CSRs)60 in the context of the European Semester. The analysis carried out by the Commission in 2016 led to 66 "investment relevant" country-specific recommendations (an increase from 32 in the 2015 exercise). These country-specific recommendations related to updating and adjusting recommendations made in the 2015 semester exercises or revisiting country-specific recommendations previously made. None of the 2016 recommendations required modifications to the recently adopted 2014-2020 programmes.
In 2016 a number of proposals and adjustment have been presented in this area. For example, the Commission has carried out an adjustment of cohesion policy allocations by Member State for the years 2017 to 2020, with a total increase of EUR 4.6 billion for 2017-2020, with Greece, Italy and Spain being the main beneficiaries. This additional allocation should target youth employment, the growing challenges of the refugee and migration crisis, and investment in combination with the European Fund for Strategic Investments, taking account of the specific needs and relevance of those priorities for each Member State.
Besides this adjustment, given the ongoing economic and social challenges faced by several Member States, proposals have been presented such as: i) to the extension of the eligibility of the 10 % top-up for Member States facing temporary budgetary difficulties has been adopted in 2016 and the 85 %
co-financing rate applicable to all operational programmes supported by the European Regional Development Fund (ERDF) and European Social Fund (ESF) in Cyprus beyond the previous deadline of 30 June 2017 until programme closure, ii) the possibility to introduce a separate priority axis within a European Regional Development Fund operational programme for reconstruction operations. European Regional Development Fund support will complement the assistance provided by the EU Solidarity Fund (EUSF) for reconstruction works in response to major or regional natural disasters and iii) the establishment of the new Structural Reform Support Programme (SRSP) which will constitute an integrated instrument for providing support to Member States for the implementation of reforms across a wide range of thematic areas related to EU economic governance process and EU law, and including support for reforms identified by Member States as their own priorities.
1.2.1. Progress of 2014-2020 programmes
The Partnership Agreements introduced in the 2014-2020 period have proven to be an effective instrument for ring-fencing funding for EU investment priorities. The European Court of Auditors concluded that the new Partnership Agreements show that the Commission and the Member States have better focused the funds on growth and jobs, identified investment needs and successfully translated them into objectives and results sought61.
2016 has been the first full year of implementation - by the Member States - for the Cohesion Policy operational programmes of the 2014-2020 programming period. In these early stages of
implementation, the selection of projects is a key step towards a successful implementation of investments.
In 2016 the rhythm of project selection by the Member States accelerated with an overall selection rate reaching 26.1 % (from 4.6 % in 2015) of the European Regional Development Fund-Cohesion Fund total allocation. By the end of 2016, EUR 67 billion of European Regional Development Fund and EUR 19.1 billion of Cohesion Fund were already granted. Thanks to this investment, 59 000 European Regional Development Fund and 2 500 Cohesion Fund concrete projects are being implemented on the ground. Including national co-financing, over EUR 48

36
billion European Regional Development Fund and EUR 16 billion Cohesion Fund are being invested in the real economy for supporting the EU 2020 objective on jobs and growth. The level of project selection is however uneven across programmes and Member States.
Similarly for the European Social Fund, despite a low level of certified expenditure by end 2015, the average project selection rate had exceeded 13 %. By end 2016 the project selection level had more than doubled (with over 30 %), which shows a strong acceleration of projects on the ground.
This accelerated selection of projects has not yet translated into a high absorption rate in terms of
payments by the Commission62. The absorption rate at the end of 2016 is lower than anticipated with overall figures of 3.7 % for European Regional Development Fund-Cohesion Fund, 2.37 % for the European Social Fund and 9.87 % for Youth Employment Initiative. The reasons for this delay are manifold: the main ones relates to the delayed designation of programme authorities and bodies, the time-lag between the selection of projects and the actual generation of first payment claims to the Commission, the prudent approach taken by some authorities in view of the strengthened requirements concerning legality and regularity and annual accounts, the responsible authorities' work on the closure process of 2007-2013 programmes.
Chart:2014-2020 European Regional Development Fund Project selection and expenditure declared per Member State as of 3 January 2017
Pre-conditions for implementation63
The ex-ante conditionalities64 (ExACs) are one of the key new elements of the 2014-2020 European Structural and Investment Funds, aiming at increasing the effectiveness of the funds. They aim at making sure that adequate regulatory and policy frameworks are in place and that there is sufficient administrative capacity before investments are made, thus improving the effectiveness and efficiency of investment supported by the European Structural and Investment Funds as well as other public and private investments.
37
Member States had until 31 December 2016 to fulfil all ex ante conditionalities and will have to report to the Commission on their fulfilment at the latest by June 2017 in the Annual Implementation Reports or August 2017 in the Progress Reports foreseen in the legal basis. Where ExACs were not fulfilled at the moment of programme adoption, Member States should achieve a timely implementation of an action plan designed to ensure their fulfilment. A large share of the 660 distinct action plans applicable to European Regional Development Fund and Cohesion Fund priorities have been reported as completed by Member States by the beginning of 2017: as of 25 January 2017, 358 were completed and 115 were reported as completed but pending the Commission’s assessment. 89 % of ex-ante conditionalities action plans affecting European Social Fund investments were assessed by the Commission as completed or about to be completed at the beginning of February 2017.
The relatively short timeframe of ex-ante conditionalities implementation has not allowed to fully assess their effectiveness so far. However, on the basis of a preliminary assessment of the ex-ante conditionalities mechanism, ex-ante conditionalities have contributed to improving the framework within which the EU budget operates. They ensured a direct link between the investments co-financed by the European Structural and Investment Funds and EU level policies. They contributed to the transposition and implementation of the relevant Union legislation, helped to tackle barriers to investment in the EU and supported climate change policy objectives.
Ex-ante conditionalities have triggered strategic, regulatory and institutional and administrative changes. They have also triggered policy reforms and delivery on relevant country-specific recommendations at national and regional level that should lead to more effective and efficient spending of the European Structural and Investment Funds. These benefits are not limited to the European Structural and Investment Funds, but have a positive impact on the delivery of structural changes and on improving the investment environment in the EU.65
First data on the implementation of Cohesion Policy programmes for 2014 and 2015 were transmitted by the Member States to the Commission at the end of May 2016 and synthesised by the Commission in the European Structural and Investment Funds 2016 Annual Summary Report66 which was the first in a series of annual reports to the EU institutions on the implementation of the European Structural and Investment Funds. Also the European Structural and Investment Funds Open Data Platform67 has been upgraded to show the financial volume of project selection and the forecasts and achievements for common indicators as reported by the programmes in 2016.
The Open Data Platform covers more than 40 % of the EU budget and received the first European
Ombudsman award for excellence in open administration in early 2017.
In the area of smart growth, the EUR 3.4 billion allocated to specific research and innovation projects under European Regional Development Fund represents 5.7 of the 2014-2020 total planned. By end 2015, the projects selected for support under the European Regional Development Fund schemes promoting cooperation with research institute aim at supporting more than 19 000 firms (15 of the target), and 5 000 researchers benefiting from improved Research & Development infrastructure (7 of the target)68.
Number of cooperation projects of enterprises with research institutions
36 421Project selection in the areas contributing to the Digital Single Market is in full swing. Up to end 2016, around 1 200 projects were selected on the ground to support the achievement of a connected Digital Single Market, corresponding to EUR 2.6 billion of total investment (European Regional Development Fund plus national co-financing). Through these projects, close to 80 000 additional households will obtain broadband coverage, thereby contributing to increasing the competitiveness and economic growth of concerned areas.
EU support of EUR 7.5 billion was allocated to specific European Regional Development Fund projects boosting competitiveness of small and medium-sized enterprises by end-2015 (8.9 % of the total planned). European Regional Development Fund financing was granted to projects supporting 113 000 small and medium-sized companies69. Eight Member States (Germany, Spain, Finland, France, Ireland, Portugal, Sweden, United Kingdom) and several Interreg programmes provide 95 % of these forecasts; 85 000 of those companies will be supported with advice and counselling; 25 000 start-ups are forecasted; at this early stage 65 000 jobs are expected to be directly created in the supported firms. Based on the projects that were already fully
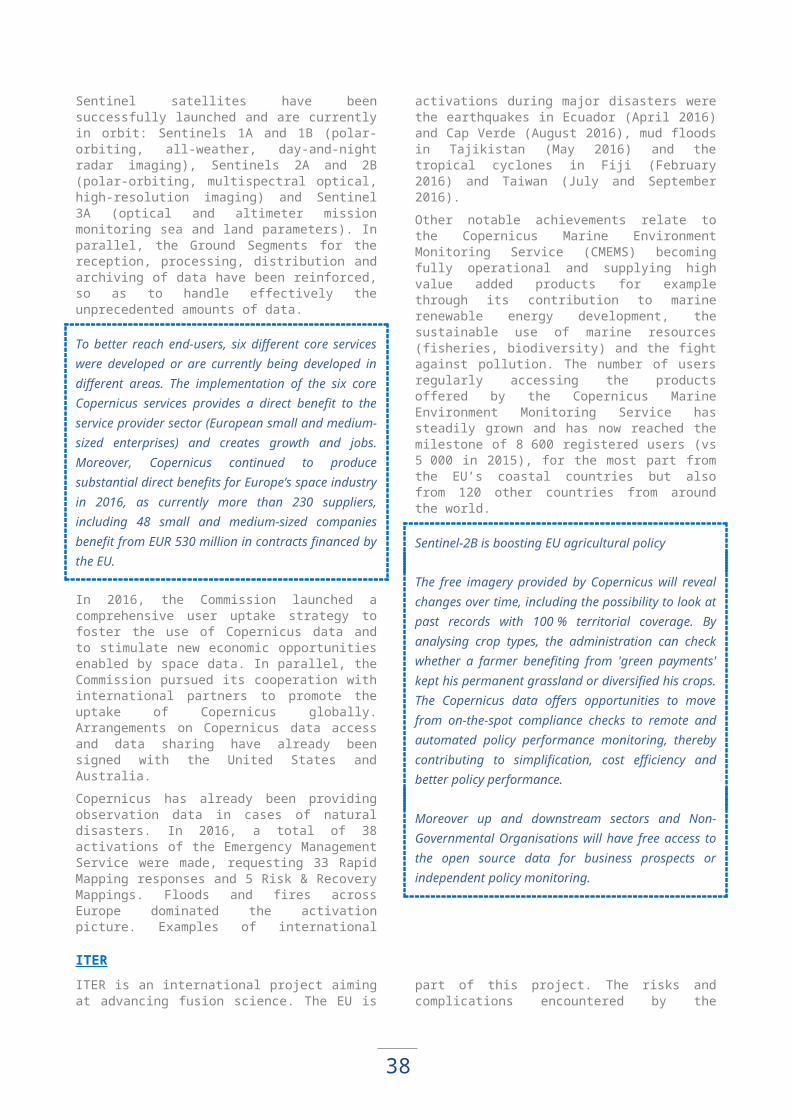
38
implemented, reported achievements show 36 379 supported enterprises (3 238 of which were start-ups) and more than 2 500 direct jobs already created(174 of which researchers).
Financial Instruments (FIs) have become increasingly important delivery tools for Cohesion Policy objectives and a significant share of resources has been progressively delivered through these instruments. Current planning shows that EUR 20.1 billion of European Regional Development Fund and Cohesion Fund, equivalent to 8 % of the total allocations, is planned to go to financial instruments. The European Regional Development Fund is increasingly implemented via financial instruments that obtain high leverage effects on public and private investments. Not only small and medium-sized enterprises started benefitting from this (around 50 % of the European Regional Development Fund support to small and medium-sized companies will be delivered via financial instruments), but also transport and energy and circular economy related projects. Concretely, latest data shows that thanks to European Regional Development Fund interventions implemented via financial instruments EUR 43 million of private investment has already been leveraged, matching public support to enterprises delivered in the form of grants and additional EUR 35.5 million of private investment has been leveraged, matching non-grants public support to enterprises.
In relation to sustainable growth, climate change mitigation and adaptation receives significant support from European Structural and Investment Funds in the 2014-2020 programming period amounting to more than EUR 114 billion of which almost half, about EUR 55 billion, comes from the European Regional Development Fund and Cohesion Fund.
Main types of investments include:
energy efficiency investments, particularly on the energy efficiency of buildings and small and medium-sized companies;
renewable energy and smart distribution grids, as well as for smart energy transmission and storage infrastructure and energy-efficient, decarbonised transport;
climate change adaptation and risk prevention, supporting a broad range of measures, including flood prevention and ecosystem-based measures such as green infrastructure.
Investments are being decided at a steady pace in this area, with more than 5 000 projects already selected on the ground, corresponding to a project selection rate of around 20 % at end 2016. The decided amounts represent more than EUR 10 billion of total investment (European Regional Development Fund and Cohesion Fund plus national co-financing).
In aggregate terms the European Regional Development Fund-Cohesion Fund actions in this field delivered:
Improved energy consumption classification for over 17 000 households;
294 197 kWh/year of decrease of annual primary energy consumption of public buildings;
13 227 Tonnes of CO2 equivalent of estimated annual decrease of greenhouse gas emissions;
Flood protection measures for 6 020 additional people;
Over 13 400 hectares of habitats supported to attain a better conservation status.
Under European Regional Development Fund and Cohesion Fund no significant values were yet reported for the common indicators measuring waste recycling capacity, improved wastewater treatment or improved water supply outputs, though programmes have reported values for specific indicators. This is because the related investments - as all infrastructure interventions - have a longer programme cycle, which requires more time for the actual achievements to become visible.
In relation to investment in strategic networks, significant TEN-T and other transport investments are planned under the European Regional Development Fund and Cohesion Fund: e.g. total length of new railway lines planned: 1 136 km (out of which 571 km TEN-T); total length of reconstructed or upgraded railway lines planned 8 610 km (out of which 4 636 km TEN-T); total length of newly built roads planned 3 414 km (out of which 2 022 km TEN-T); total length of reconstructed or upgraded roads planned 9 742 km (out of which 798 km TEN-T).70 Overall project selection by end 2015 was EUR 4.1 billion (6.2 % of planned)71. As is the case with environment infrastructure, the specific programme cycle of transport investments explains the fairly modest physical progress reported so far (3 km of new roads built and 26 km of reconstructed or upgraded roads out of which 24 km TEN-T)72.
In the area of inclusive growth, the European Social Fund is the main fund under budget heading 1B investing in employment, social inclusion and education. Over EUR 168 billion in support is planned in this area, particularly from the European Social Fund, with European Regional Development Fund also investing. Projects amounting to more than 12 % of this amount (more than EUR 11.5 billion) were selected and many had already delivered support to people at the end of 201573.

39
In October 2016 the Commission adopted a Communication and an accompanying Staff Working Document that highlight the main achievements of the Youth Guarantee and Youth Employment Initiative (YEI) since their launch in 201374. The Communication shows that although youth unemployment remains a key concern in many Member States, young people's labour market performance in the EU has overall surpassed expectations since 2013. As regards YEI implementation, it has significantly progressed in the second half of 2015 and especially in 2016. By end 2016, the total eligible cost of YEI operations selected for support was over EUR 4.7 billion and over EUR 1.1 billion had been declared by beneficiaries. By the end of 2016, the Commission had received around EUR 839 million in YEI payment applications from the Member States. By end of November 2016, around 1.6 million young people had been included in YEI-supported measures. According to data from November 2016, larger Member States and main recipients of the YEI have managed to engage thousands of young people each - Italy (around 640 000 contacted or already in measures), France (162 000), Spain (277 000) and Greece (39 000).
In certain Member States however it has taken more time for getting the necessary processes and structures in place. Eight Member States had to return their YEI pre-financing to the Commission following an insufficient amount of payment applications. Evidence from the national YEI evaluations suggests that there are implementation challenges which risk inhibiting the success of the YEI, particularly in terms of the quality of delivery, effectiveness and monitoring. These challenges include: the shorter timeframe for YEI implementation compared to the European Social Fund actions; insufficient capacity of some Public Employment Services or other intermediary organisations to deliver the programme; difficulties in identifying inactive or administratively excluded people who are not in employment, education or training (NEET) (a number of Member States are addressing this by working more actively with the Non-Governmental Organisations sector and launching specific outreach measures); delays in the implementation of integrated monitoring systems for the European Social Fund operational programmes, as well as the sustainability of the offers made as a result of YEI-supported measures – in particular in a context of still very reduced labour demand in many Member States75.
In aggregate terms, by end 2015, the European Social Fund and YEI actions delivered:
2.7 million participants, including 1.6 million unemployed and 700 000 inactive;
Amongst those participants 235 000 were in employment following a European Social Fund or YEI operation, 181 000 had gained a qualification upon benefiting from an European Social Fund or YEI operation;
100 000 participants were in education or training thanks to European Social Fund or YEI support;
275 000 disadvantaged participants in European Social Fund or YEI-funded operations were engaged in job searching, education/training, gained a qualification or were in employment, including self-employment.
Progress can be witnessed also in the area of social inclusion where the data on early implementation of European Social Fund interventions is promising. Out of the 631 000 European Social Fund participants by end 2015, 39.8 % were coming from jobless households and 32.1 % were migrants, with a foreign background or belonged to a minority – showing the focus on those most in need of support. 55 000 participants already found a job76.
2015/2016 saw the rollout of Fund for European Aid to the Most Deprived (FEAD) operational programmes on the ground. By the end of 2016 the Fund for European Aid to the Most Deprived was operational in the vast majority of Member States both in terms of provision of material assistance, as well as carrying out social inclusion activities for the most deprived persons. In June 2016 Member States submitted their annual implementation reports for 2015, which show acceleration in the implementation of programmes compared to 2014. It is estimated that
40
22.4 million people benefitted from the Fund for European Aid to the Most Deprived's food and material assistance cumulatively until end of 2015, out of which 50 % women, 30 % of end-recipients were children, 9 % persons aged 65 years or above, 12 % migrants, participants with a foreign background, minorities (including marginalised communities such as the Roma), 4 % persons with disabilities and 6 % were homeless persons. Over 560 000 tonnes of food were distributed cumulatively until end of 2015.
European Regional Development Fund interventions in the social inclusion area include investments in social, health, education, housing and childcare infrastructure; regeneration of deprived urban areas; actions to reduce spatial and educational isolation of migrants; business start-ups. Project selection rate for these European Regional Development Fund interventions is around 12 % at end 2016, with close to 1 000 projects already selected and being implemented. Reported progress in supporting health infrastructure is still marginal, as achievements values provided by Member States only refer to situation at end 2015. Support to selected integrated urban development strategies covers 1.7 million people (5 % of the target set)77.
Overall around EUR 6 billion has been programmed to support the strengthening of institutional capacity and efficient public administration
purpose mainly from the European Social Fund with support also planned from the European Regional Development Fund. Over 11 % of the total budget was allocated to projects by end 2015. The operations selected by end 2015 have a total value of EUR 680 million. The projects are Interreg projects in Bulgaria, Estonia, France, Croatia, Italy and Poland. 97 000 public administration staff members had been supported by European Social Fund with and 31 projects targeting public administrations or public services at national, regional or local level been reported by the Member States. Under planned European Regional Development Fund support the Interreg programmes had made significant progress in selecting projects for support with a financial volume of EUR 900 million of selected projects by end 2015 (7.4 % of planned)78.
While the information reported above is based on partial data, it is already considered as indicative and worth being mentioned. This data will be further developed. The programme reporting cycle in 2017, involving programme reports to be submitted by the Member States to the Commission by end June 2017 and national progress reports by end August 2017, will provide a fuller picture of implementation, progress towards investment and policy objectives and will bring more qualitative reporting. Those reports from the Member States will be synthesised by the Commission in a strategic report by end 201779.
1.2.2. Results of 2007-2013 programmes
Implementation aspectsA total of 440 operational programmes (322 for European Regional Development Fund-Cohesion Fund and 118 for European Social Fund) benefited from Cohesion Policy funding in the 2007-2013 programming period for a total budget allocation of EUR 346.5 billion. National and regional public contributions – together with private contributions – brought the total investment to EUR 477.1 billion80. Programme implementation was carried out between January 2007 and December 2015.
Implementation of the European Regional Development Fund-Cohesion Fund programmes started slowly81, picking up speed in 2012 or so in
most countries (see next chart). However, by the end of March 2016, just over 90 % of the funding82
available from the European Regional Development Fund and Cohesion Fund for the 2007-2013 period had been paid to Member States, with a slightly larger share being paid to EU-12 countries83 (92 %) than to EU-15 ones84 (89 %). A similar time profile is evident for both the European Regional Development Fund and Cohesion Fund, though the latter built up more slowly (as might be expected, given the fact that large infrastructure projects tend to take longer to complete) and caught up in the later years of the period.
The rate of implementation varied considerably between countries. In Romania, only 37 % of the funding for the period had been claimed by the end of 2013 and in Slovenia, only 40 %, while in Italy, Slovakia, Bulgaria, the Czech Republic and Malta, the proportion was less than 50 % (see chart below).

41

42
Chart: Payments relative to total funding available, European Regional Development Fund plus Cohesion Fund 85 Source: DG REGIO, Infoview database. Figures do not include ETC ("Interreg") where funding cannot easily be attributed by Member State.
In all of the countries where implementation was lagging, payments increased over the following years, and for most countries this means (taking account of the lag in payments and the fact that they are capped at 95 % until closure) that they had reached their financial implementation targets by end 2016, with only Italy, Czech Republic and Romania still experiencing some delays.
The evaluation of the European Regional Development Fund-Cohesion Fund delivery system traced these implementation delays to several key problems, particularly common in the newer Member States for which 2007-2013 was the first full period of Cohesion Policy86:
Problems setting up systems for project preparation and selection:
Insufficiencies in the public procurement systems;
Setting up systems for managing and following up projects, leading to a constantly high discrepancy between contracted amounts and payments to beneficiaries; and
High turnover among key staff in the EU-12 countries.
These issues were tackled thanks notably to specific actions put in place by the Commission and aimed at supporting Member States in their implementation efforts. The work of the Task Force for Better Implementation (TFBI) played a big role in this respect. The Task Force was set up in November 2014 with the mandate to help countries with significantly lower-than-average absorption rates to improve and accelerate implementation, with a specific focus on Member States with weaker administrative capacity.
Certain conclusions can be drawn as regards the European Regional Development Fund-Cohesion Fund implementation rates87:
there were considerable differences across Member States. While some (Lithuania, Estonia, Latvia, Finland, Portugal) reached the 95 % transfer limit, for others (particularly Romania, but also Slovakia, Malta and Croatia) implementation rates remained comparatively low;
overall differences between less developed (convergence) and more developed (competitiveness) regions were relatively limited, with rates of 78.5 % and 80.4 % respectively;
implementation rates for social inclusion, access to employment and human capital (ranging from 83.7 % to 78.1 %) were significantly higher than for strengthening institutional capacity (69 %) and promoting partnerships (64.2 %). This can be explained by the fact that for the latter areas many projects focused on the longer term and ran through the entire programming period; and
technical assistance budgets had not been fully used, with an average implementation rate across the EU of 67.9 %. This may be explained by the fact that activities aimed at system-level changes were slower, scheduled towards the end of the period and/or more challenging to implement due to their complexity.
The implementation pattern was similar for the European Social Fund. By March 2017, expenditure amounting to 99.17 % of the overall European Social Fund 2007-2013 budget had been declared to the Commission.
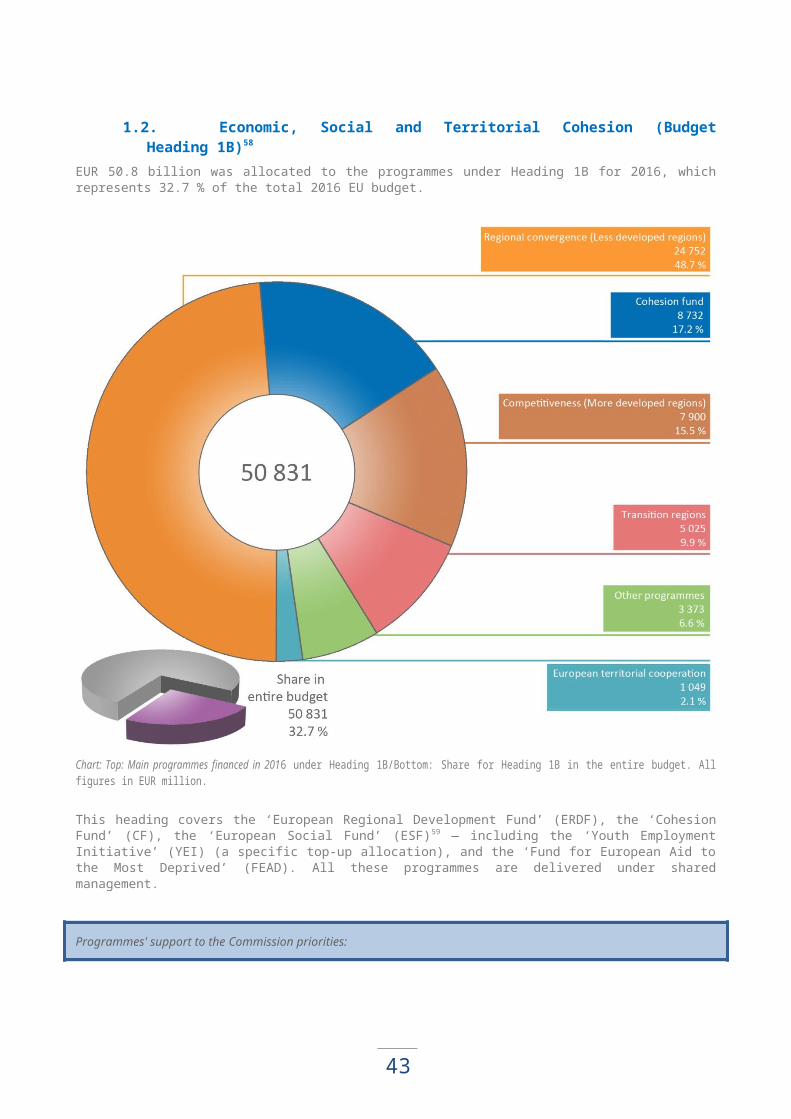
43
Contribution to policy achievementsIn 2016 the Commission finalised its ex-post evaluations of the 2007-2013 European Regional Development Fund-Cohesion Fund88 and European Social Fund programmes89. These two evaluations assessed the achievements of Cohesion Policy interventions in all 28 Member States and their contribution to the EU political priorities. The sections below present the results of these evaluations as well as final results based on monitoring data reported by the Member States by end March 2017 in their closure declarations90.
Macroeconomic impact
Every region and country in the EU benefits from Cohesion Policy, also the net payers. The European Regional Development Fund-Cohesion Fund ex-post evaluation estimated that, in the EU-12 countries, the cohesion policy funds and rural development investments led to increased GDP in 2015 by 4 % above what it otherwise would have been, and in Hungary, by over 5 %. This impact is sustained (and in some cases even increases) in the longer term. In Poland, for example, by 2023, GDP is estimated to be almost 6 % above what it would be without Cohesion Policy investment in the 2007-2013 period. In regions of more developed Member States, the impact is smaller but remains positive even taking into account the fact that these Member States are net contributors to the policy.
The European Regional Development Fund-Cohesion Fund ex-post evaluation showed that one euro of Cohesion Policy investment in the period 2007-2013 is estimated to generate EUR 2.74 of additional GDP by 2023, with a total estimated return of nearly EUR 1 trillion of additional GDP by 2023. This GDP effect is of a similar scale to the entire EU budgets for 2007-2013 (EUR 975.8 billion) and 2014-2020 (EUR 908.4 billion).
Smart GrowthResults in the smart growth area are delivered both by mobilising financial resources and by contributing to the improvement of investment conditions. Programmes boost jobs, growth and investment across Europe, while focusing on the least developed areas and sectors with growth potential.
Support from the European Regional Development Fund-Cohesion Fund to small and medium-sized enterprises over the period was concentrated on research and innovation. Some 400 000 small and medium-sized companies across
the EU received direct support and over 130 000 new businesses were helped to start up. Although this is only 2 % of firms in the EU, support focussed on strategic enterprises – in the manufacturing sector, an estimated 15 % of small firms and over a third of medium sized firms received direct financial support. Monitoring data also indicates that this support led directly to the creation of over 1.2 million jobs – to put this into perspective, a net total of 3 million jobs were created in the EU economy over the 2007-2013 period.
1.2 million jobs created
thanks to the support of the European Regional Development and Cohesion Funds
over 2007-2013.
The major result of support was helping small and medium-sized companies withstand the effects of the crisis by providing credit when other sources of finance had dried up. It enabled small and medium-sized companies to invest in modernising or expanding plant and equipment. In addition and as part of Cohesion Policy's response to the economic crisis, eligibility rules were changed to allow the financing of working capital – this enabled firms to remain in business and to maintain employment. At the same time, European Regional Development Fund also provided support for innovation and for the adoption of more technologically advanced methods of production as well as for the development of new products. It also led to observable behavioural changes, such as small and medium-sized enterprises' owners and managers being more willing to take risks and to innovate.
Some of the programmes used European Regional Development Fund support as a test-bed for experimental and innovative policy measures instead of replicating traditional national schemes. This happened, for example, with the focus on research and innovation in Denmark, Sweden and Finland, the ‘Living Labs’ experiment in Puglia (Italy) or the Inno-voucher scheme in Lithuania. The evaluation concluded that this experimental approach – using European Regional Development Fund as a test-bed, instead of replicating national funding – could be more widely followed in the future since it is a way in which the European Regional Development Fund can give rise to a distinct stream of added-value for the EU which exceeds the relatively small amounts of funding involved, at least in more developed (Competitiveness) regions.
44
Added value of Pan-European project "Extreme Light Infrastructure – nuclear physics "Phase II of the pan-European project "Extreme Light Infrastructure – nuclear physics" in Magurele, Romania has been selected for EUR 140 million support from the European Regional Development Fund. This research project on high intensity lasers is open to researchers from public and private bodies worldwide with 100 researchers already working there and a further 100 researchers expected to join on completion. The project also brings socio-economic benefits and creates added value for the region (new jobs, modern infrastructure, business development and increased the visibility and development potential). Romania is implementing this project with two other Member States – Hungary and the Czech Republic, showing the synergy effects and efficiency gains leveraged with the contribution of EU co-financing.
An estimated EUR 6.1 billion from the European Regional Development Fund was allocated to large enterprise support – roughly 20 % of the total direct support to enterprise under the European Regional Development Fund. This took the form of some 6 000 projects, with an average project size of EUR 1 million. In total, roughly 3 700 individual large firms were supported bringing new technology and improved productivity to the region they operate in as well as generating spill overs to small and medium-sized companies, the human capital base and social infrastructure.
The use of financial instruments (FIs) increased considerably, going from EUR 1 billion in 2000-2006 to EUR 11.5 billion of European Regional Development Fund allocated in 2007-2013. Because of delays in funds being set up and monitoring systems established, it was difficult to quantify the achievements of financial instruments or assess their effectiveness compared to grants. The European Regional Development Fund-Cohesion Fund ex-post evaluation did however find that Financial Instruments played a crucial role in providing funding to small and medium-sized companies during the credit crunch of the economic crisis – this certainly contributed to many firms staying in business. The change of regulations as a response to the economic crisis, allowing Financial Instruments to finance working capital gave them a distinct advantage over grants. In Lithuania, in particular, the Managing Authority estimated that around 60 % of loans went to support working capital, keeping business afloat during the crisis. Financial Instruments also helped to maintain investment in new technology and in improving production processes more generally. The ex-post
evaluation concluded that Financial Instruments have the potential to be a more efficient means of funding investment across many policy areas, but the legal provisions were not detailed enough in 2007-2013. This, together with the inexperience of many implementing bodies, led to delays in implementation. A further challenge is spreading financial instruments beyond enterprise support, where over 90 % of 2007-2013 financial instrument funding was concentrated.
For European Social Fund, despite the difficulty of establishing any statistically significant correlation between changes in the employment rate, education indicators and the proportion of European Social Fund investments, the European Social Fund ex-post evaluation confirmed that the European Social Fund played a positive role in helping to improve Member States’ performance in achieving the Europe 2020 targets for smart growth. Considerable improvements were seen over the period in the area of education at EU-28 level: in 2014, the rates of early school leaving decreased by 3 percentage points compared to 2008, higher education attainment rates increased by 7 percentage points over the same period and gender gaps in the key education and training indicators narrowed. In addition, expenditure on Research & Development increased, albeit minimally (by 0.2 percentage points).
Sustainable Growth In the 2007-2013 period Cohesion Policy also made a significant contribution to the environment. The entry of the EU-12 countries into the EU in 2004 and 2007 further increased the need for investment and a substantial proportion of the European Regional Development Fund and Cohesion Fund amounts allocated to these countries went to support of such investment. Thanks primarily to European Regional Development Fund/Cohesion Fund, convergence countries in particular saw a significant shift in the disposal of waste away from landfill towards recycling. A substantial number of landfill sites which did not comply with EU standards were closed down. In the Czech Republic, Hungary, Lithuania, Poland and Slovenia, as well as Croatia, the proportion of waste which was recycled was increased by over 10 percentage points. Much of this shift was co-financed by the European Regional Development Fund and Cohesion Fund91. More specifically, in Poland, the share of municipal waste going to landfills was reduced from 90 % to 53 %, while the share of waste going to recycling increased from 6 % to 16 % and the share composted rose from 6 % to 13 %. In Bulgaria the proportion of waste which was landfilled was reduced from 80 % to 70 % between 2007 and 2013.
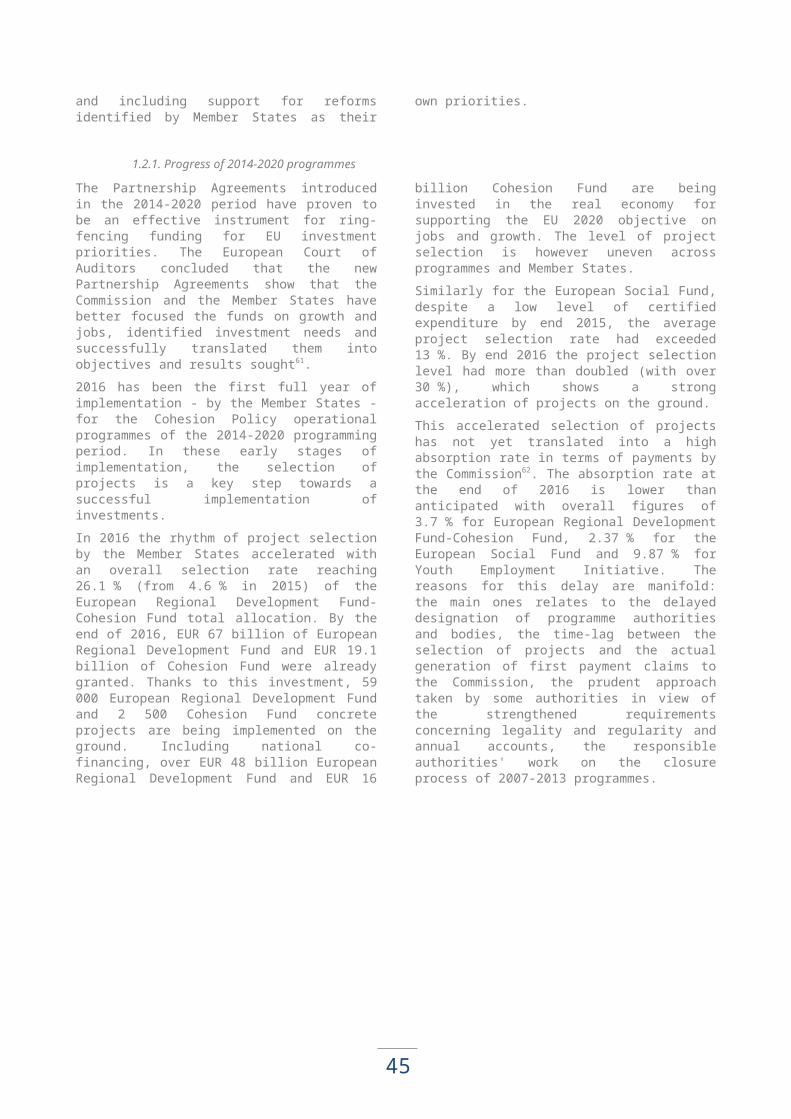
45
Likewise, the European Regional Development Fund/Cohesion Fund greatly contributed to improving water and waste water treatments primarily in Convergence regions, as well supply of clean drinking water.
Over 9 million people were connected to a new or improved supply of clean drinking water, while 11
million people were connected to new or upgraded wastewater treatment facilities.
The European Regional Development Fund-Cohesion Fund ex-post evaluation reviewed 27 operational programmes and found an overall reduction of 2904 GWh per year (enough to light the city of Stuttgart for a year) up to the end of 2013 for all energy efficiency measures, including 1438 GWh as a result of the measures to increase energy efficiency in residential and public buildings. To give a specific example, in Lithuania energy efficiency measures in 864 public buildings reduced consumption 236 GWh a year by end 2014, which implies a cut of almost 3 % in overall annual energy consumption in the country92.
To put the above achievements into context, the reduction in respect of buildings amounts to an estimated cut of some 0.2 % in total yearly energy consumption in the countries and regions concerned, not large but significant given the relatively small amount of funding involved. The magnitude of these achievements is even bigger taking into account that by the end of 2013 only around 55 % of the total funding available for energy efficiency had been spent.
Energy efficiency thanks to European Regional Development Fund resulted in overall energy
reduction of
2904 GWhA large number of projects carried out with the support of the European Regional Development Fund to increase electricity-generating capacity from renewables, a significant part of which in less
developed regions. In particular, the additional capacity of renewable energy production reported by Member States directly resulting from supported interventions is close to reaching 5 000 MW.
Investment in transport has always been a major focus of support for both the European Regional Development Fund and Cohesion Fund. This continued to be the case in the 2007-2013 period, to a large extent because of the entry into the EU of the 10 Central and Eastern European Member States (along with Cyprus and Malta) in 2004 and 2007 and the need to improve their transport infrastructure. With the contribution of the European Regional Development Fund and Cohesion Fund, transport bottlenecks have been removed, travel times reduced and urban trams and metros supported. Vital to economic development and often contributing to environmental quality, this includes the construction of close to 5 800 km of roads, mostly motorways (of which 2 700 km on the TEN-T). It also includes the construction or upgrading to necessary standards of 2 600 km of TEN-T railway93. A number of public transport projects were supported over the 2007-2013 period which had the effect of reducing congestion in cities and improving the urban environment as well as reducing travel times. During the public consultation carried out as part of the European Regional Development Fund-Cohesion Fund ex-post evaluation Member States highlighted the important role of cohesion policy funding in supporting large, complex projects, which were particularly evident in the rail sector. In their opinion, such projects may not have been undertaken in the absence of Cohesion
Policy funding. With regard to the development of sustainable transport measures, Cohesion Policy was viewed by stakeholders as a key enabler.
Added value of Cross-border transport facilities
In the tri-lateral border area between Germany, the Netherlands and Belgium, cooperation among public transport providers has been significantly stepped up thanks to Interreg. A common platform has been created (http://mobilitv-euregio.com) and services are now developed in an integrated manner - with combined timetables, joint pricing and a modernized ticketing system.
In the Franco-Italian land border programme (ALCOTRA), several projects have improved local cross-border mobility via investments in joint passenger information systems, integrated bus timetables and the introduction of transport "on demand" in less populated border area.
Inclusive GrowthIn this area the European Regional Development Fund and European Social Fund work together by investing both in infrastructure and in human capital in the field of education and training, active labour market policies and the inclusion of disadvantaged groups into the labour market and society.
In 2007-2013 the European Social Fund played an important role in mitigating the negative effects of the crisis and responding effectively to the associated emerging challenges. It is important to
46
bear in mind that the socio-economic context in which the European Social Fund Operational Programmes were designed (between 2005 and 2007) was very different from the circumstances of their implementation which were dominated by the economic and financial crisis. Nevertheless, interventions under European Social Fund 2007-2013 have been generally effective in reaching the right target groups, integrating people into the labour market and improving their skills, and generating changes in systems. In particular, the European Social Fund helped to support the most vulnerable groups in society which were especially affected by the crisis and allowed Member States to engage in a counter cyclical policy response. The European Social Fund played more important role in the less developed regions, contributing to the regional and social cohesion of the EU. The most important contribution of European Social Fund was in the area of Active Labour Market Policies, while it was more limited compared to the national expenditures in other fields, such as education and social inclusion.
The European Social Fund ex-post evaluation confirmed that the European Social Fund was highly relevant in addressing the main policy challenges towards achieving the Europe 2020 headline targets and contributing to the EU guidelines defined for labour market policies, social policies and education, while also contributing to the development of the institutional capacity to deliver policies and reforms. The European Social Fund 2007-2013 has also been an important instrument contributing to the social Open Method of Co-ordination and the Education and Training 2020 strategy. The evaluation also confirmed that the specific challenges identified by the Country Specific Recommendations were well reflected in the operational programmes co-financed by the European Social Fund.
By the end of 2014, at least 9.4 million participants found a job with support from the European Social Fund, 8.7 million obtained a qualification or certificate and other positive results, such as increased skills levels, were
reported by 13.7 million participants.
Other key quantitative achievements identified by the ex-post evaluation include:
Based on macroeconomic simulations, the investments in human capital are estimated to have had a positive impact on GDP (0.25 % increase) and productivity. These effects are much stronger in the EU-12 countries (1.5 % increase), but they are also positive for EU-15 countries (0.2 % increase).
The European Social Fund has registered 98.7
million participations of individuals, evenly spread between the inactive (36 % of participants), the employed (33 %) and the unemployed (30 %).
Key target groups such as low-skilled people (40 %), young people (30 %), and the disadvantaged in general (at least 21 %) were supported.
51.2 million participations of women were recorded in European Social Fund interventions, showing a relatively balanced participation by gender (52 % women versus 48 % of men) at EU level.
At least 31.8 million positive results were achieved (i.e. improved skills and competences, increased chances in the labour market, continued education, etc.).
At least 276 000 entities were supported and at least 109 000 products reported (i.e. online administrative services).
The European Social Fund has provided significant support to the modernisation, strengthening and widening of the scope of public services such as Public Employment Services and other institutions responsible for active labour market actions.
Regarding performance in relation to targets set, the examination of the extent to which targets have been achieved shows a good performance, since by the end of 2014 targets have been met to a satisfactory level for about 64 % of the relevant indicators. By 2015 55 % of the 1 992 result indicators for which targets had been set and monitored had reached or exceeded the targets set, while another 8 % performed between 90 % and 100 %.
Overall, the achievement of the targets varied depending on the robustness of the target setting, the nature of the activities and the characteristics of the target groups as well as the nature of the objectives set. The crisis provoked a higher than expected initial demand for support for some types of activities while at the same time it made the integration of the most disadvantaged into the labour market more challenging, leading to underperformance in some cases.
47
The European Social Fund ex-post evaluation showed that European Social Fund 2007-2013 provided added value by broadening the scope of existing national interventions. By making use of European Social Fund interventions, Member States were able to offer more tailored and intensive services to specific target groups such as people with disabilities, young people at risk of early school leaving, or unemployed with low qualifications. These would otherwise not have had access to such services or would only have access to mainstream services. As a follow-up, some successful European Social Fund interventions were taken up into mainstream national policy, e.g. in Belgium, France, Italy, and Sweden.
As regards the European Regional Development Fund, a wide range of interventions in the area of education (close to 27 000 investments in infrastructure) and of social inclusion (more than 3 500 projects) have also been carried out, thus contributing towards the achievement of the related Europe 2020 headline targets. The main
achievements identified by the European Regional Development Fund-Cohesion Fund ex-post evaluation included: improvement of social infrastructure facilities with modernisation of equipment and increase of efficiency of services such as ambulances or care services (e.g. Hungary); improvement of education system in some Member States where a significant budget was deployed for education infrastructure (e.g. Portugal); improvement of health systems with the aim to improve health outcomes (Hungary and Czech Republic); improvement of lifelong learning services in combination with labour services to better adapt the workforce in target areas to labour market and business needs (e.g. Spain, Poland, Czech Republic or Lithuania). Some programmes used social infrastructure investments for improving the security of urban areas or for expanding and enhancing cultural heritage related education. Other social infrastructure was used in combination with various urban development actions to support cultural, sports or training facilities, as well as the establishment of support centres for different disadvantaged groups94.