tabulation - saarcstat · be rounded up but the method of rounding should be ... recording the data...
TRANSCRIPT
Tabulation
By
…………………………………..
Objectives of Data Tabulation
To carry out investigations
To do comparisons
To locate omissions and errors in the data
To use space economically
To study the trends
To simplify data
To use it as future references
Sessio
n 01
Importance of Tabulation
Under tabulation, data is divided into various parts and for each part there are totals and sub totals. Therefore, relationship between different parts can be easily known.
Since data are arranged in a table with a title and a number so these can be easily identified and used for the required purpose
Tabulation makes the data brief. Therefore, it can be easily presented in the form of graphs.
Tabulation presents the numerical figures in an attractive form.
Sessio
n 01
Importance of Tabulation
Tabulation makes complex data simple
and as a result of this, it becomes easy to
understand the data.
This form of the presentation of data is
helpful in finding mistakes.
Tabulation is useful in condensing the
collected data.
Sessio
n 01
Importance of Tabulation
Tabulation makes it easy to analyze the data
from tables.
Tabulation is a very cheap mode to present
the data. It saves time as well as space.
Tabulation is a device to summaries the large
scattered data. So, the maximum information
may be collected from these tables.
Sessio
n 01
Rules of Tabulation
The table should suit the size of the paper and,
therefore, the width of the column should be decided
before hand.
Number of columns and rows should neither be too
large nor too small.
As far as possible figures should be approximated
before tabulation. This would reduce unnecessary
details.
There are no hard and fast rules for the tabulation of data but for constructing good table, following general rules should be observed while tabulating statistical data.
Sessio
n 01
Rules of Tabulation
Items should be arranged either in alphabetical,
chronological or geographical order or according to size.
The sub-total and total of the items of the table must be written.
Percentages are given in the tables if necessary.
Ditto marks should not be used in a table because sometimes it create confusion.
Table should be simple and attractive.
Sessio
n 01
Rules of Tabulation
A table should be logical, well-balanced in length and
breadth and the comparable columns should be placed
side by side.
Light/heavy/thick or double rulings may be used to
distinguish sub columns, main columns and totals.
For large data more than one table may be used.
Sessio
n 01
Parts of an Ideal Table
Table number:
A number must be allotted to the table for
identification, particularly when there are many tables in
a study.
Title:
The title should explain what is contained in the table. It
should be clear, brief and set in bold type on top of the
table. It should also indicate the time and place to which
the data refer.
Sessio
n 01
Parts of an Ideal Table
Date:
The date of preparation of the table should be given.
Stubs or Row designations:
Each row of the table should be given a brief heading. Such designations of rows are called “stubs”, or, “stub items” and the entire column is called “stub column”.
Column headings or Captions:
Column designation is given on top of each column to explain to what the figures in the column refer. It should be clear and precise. This is called a “caption”, or, “heading”. columns should be numbered if there are four, or, more columns.
Sessio
n 01
Parts of an Ideal Table
Body of the table:
The data should be arranged in such a way that any figure can be located easily. Various types of numerical variables should be arranged in an ascending order, i.e., from left to right in rows and from top to bottom in columns. Column and row totals should be given.
Unit of measurement:
If the unit of measurement is uniform throughout the table, it is stated at the top right-hand corner of the table along with the title. If different rows and columns contain figures in different units, the units may be stated along with “stubs”, or, “captions”. Very large figures may be rounded up but the method of rounding should be explained.
Sessio
n 01
Parts of an Ideal Table
Source:
At the bottom of the table a note should be added
indicating the primary and secondary sources from
which data have been collected.
Footnotes and references:
If any item has not been explained properly, a separate
explanatory note should be added at the bottom of the
table.
Sessio
n 01
Limitation of Tabulation
Tables contain only numerical data. They do not contain
details.
qualitative expression is not possible through tables.
Tables can be used by experts only to draw conclusions.
Common men do not understand them properly.
Sessio
n 01
Methods of Tabulation
Simple tabulation
Simple tabulation is when the data are
tabulated to one characteristic. For
example, the survey that determined the
frequency or number of employees of a
firm owning different brands of mobile
phones like Blackberry, Nokia, Iphone, etc.
Sessio
n 02
Methods of Tabulation
Double tabulation
Double tabulation is when two characteristics of data
are tabulated. For example, frequency or number of
male and female employees in the firm owning different
brand of mobile phones like Blackberry, Nokia, Iphone,
etc.
Sessio
n 02
Methods of Tabulation
Complex tabulation
Complex tabulation of data that includes more than
two characteristics. For example, frequency or number
of male, female and the total employees owning
different brand of mobile phones like Blackberry, Nokia,
Iphone, etc. Crosstabulations, is also a sub-type of
complex tabulation that includes cross-classifying
factors to build a contingency table of counts or
frequencies at each combination of factor levels. A
contingency table is a display format used to analyze and
record the possible relationship between two or more
categorical variables
Sessio
n 02
Frequency Tables
Simple frequency tables
Grouped frequency tables
Cumulative frequency tables
Sessio
n 03
Simple Frequency Tables
If the value of a variable, e.g., height, weight, etc.
(continuous), number of students in a class,
readings of a taxi-meter (discrete) etc., occurs twice or
more in a given series of observations,
then
the number of occurrence of the value is termed as the
“frequency” of that value.
Sessio
n 03
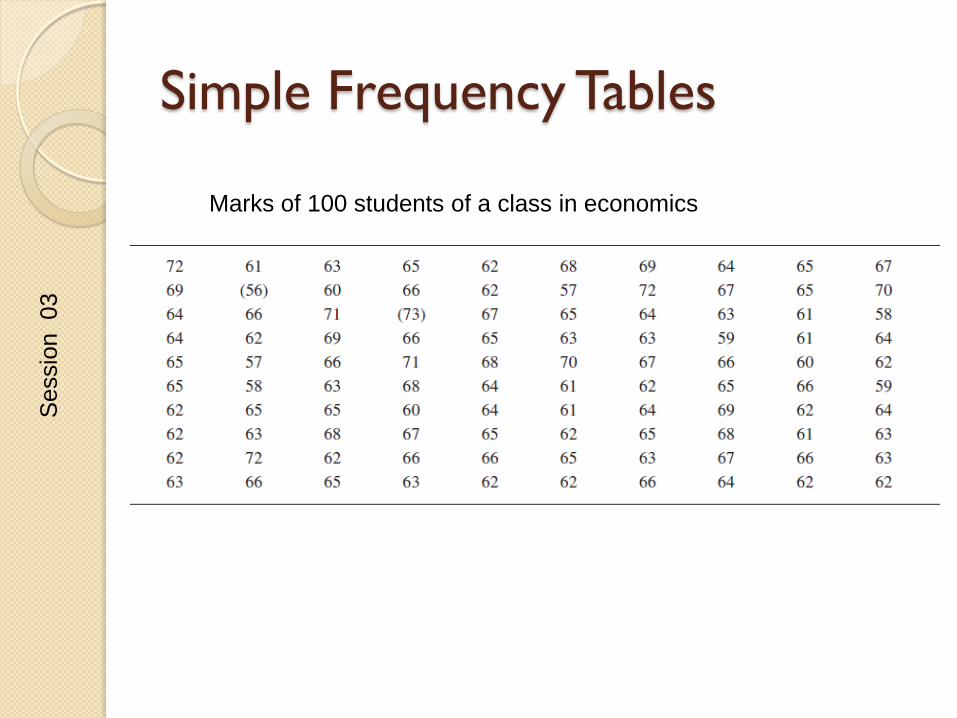
Simple Frequency Tables
Marks of 100 students of a class in economics
Sessio
n 03
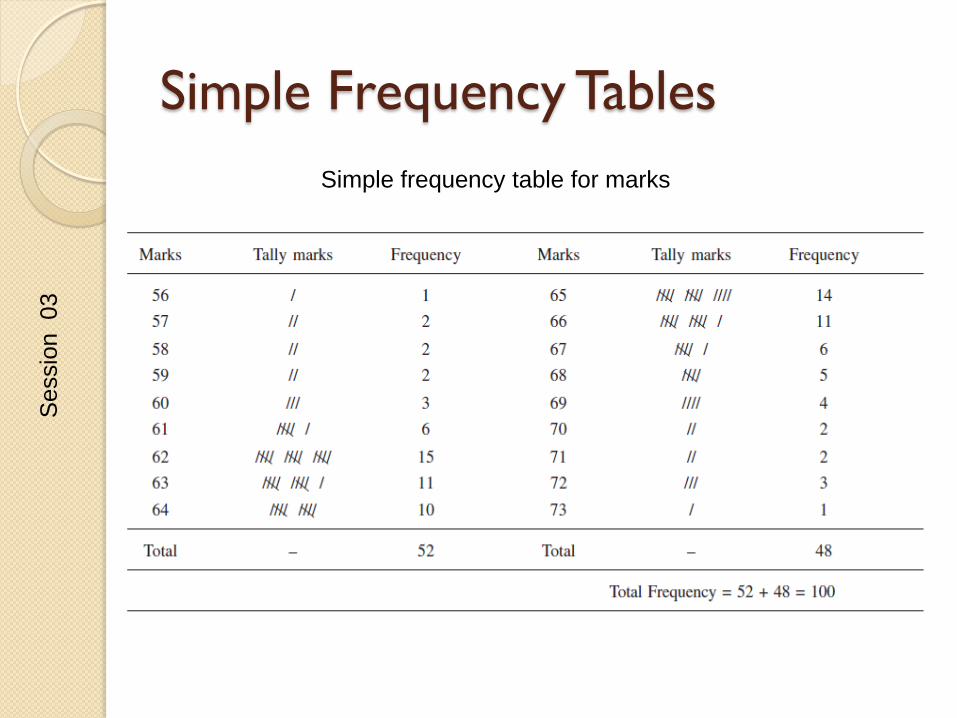
Simple Frequency Tables
Simple frequency table for marks
Sessio
n 03
Grouped Frequency Tables
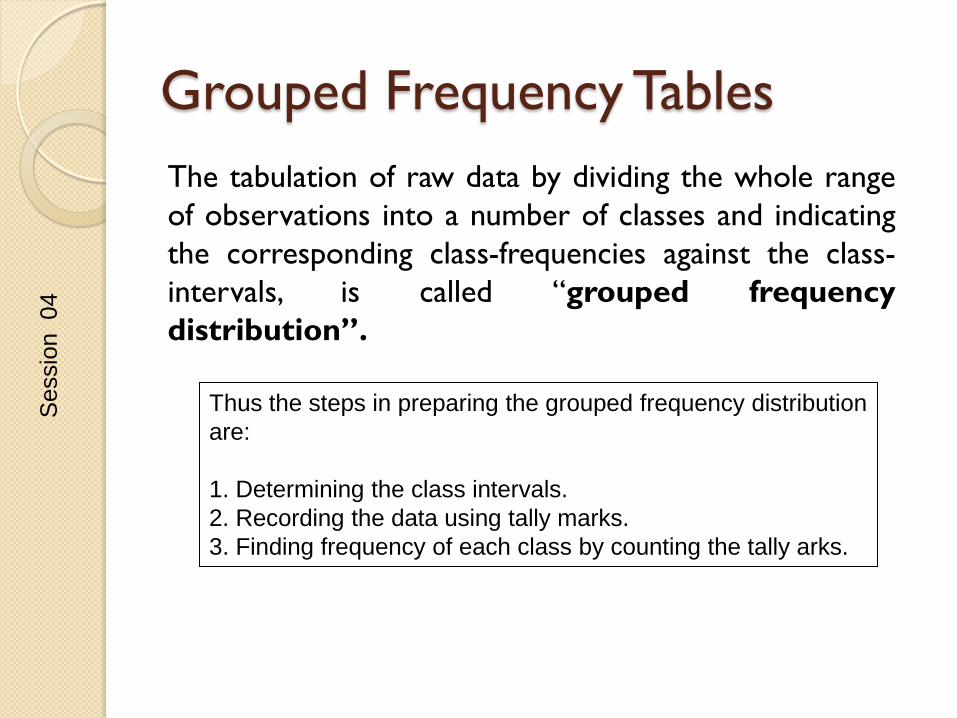
The tabulation of raw data by dividing the whole range
of observations into a number of classes and indicating
the corresponding class-frequencies against the class-
intervals, is called “grouped frequency
distribution”.
Thus the steps in preparing the grouped frequency distribution
are:
1. Determining the class intervals.
2. Recording the data using tally marks.
3. Finding frequency of each class by counting the tally arks.
Sessio
n 04
Grouped Frequency Tables
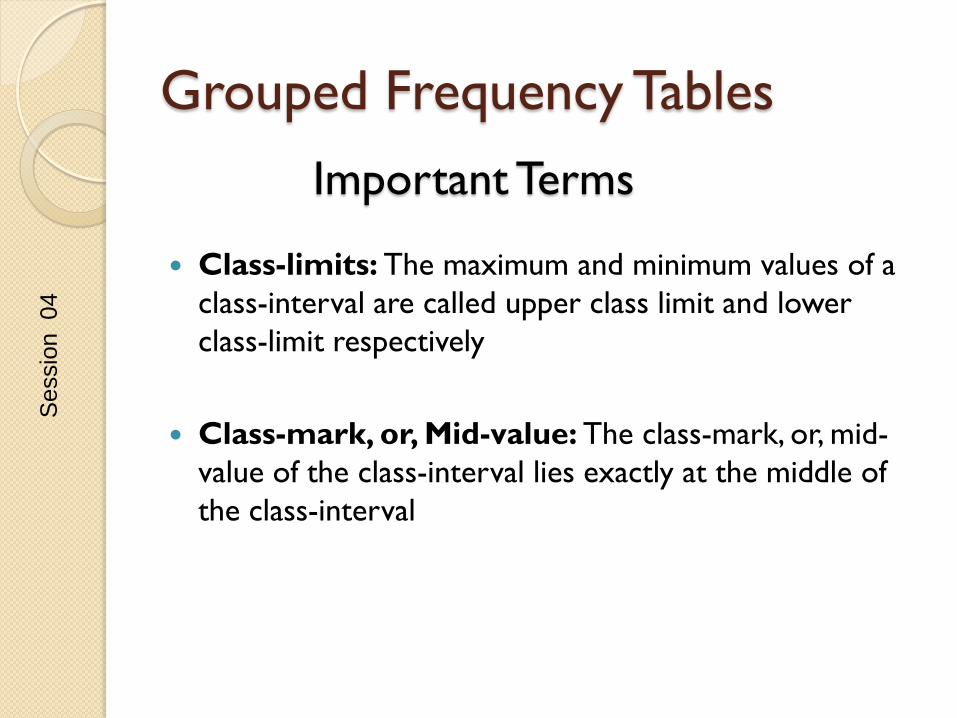
Class-limits: The maximum and minimum values of a
class-interval are called upper class limit and lower
class-limit respectively
Class-mark, or, Mid-value: The class-mark, or, mid-
value of the class-interval lies exactly at the middle of
the class-interval
Important Terms
Sessio
n 04
Grouped Frequency Tables
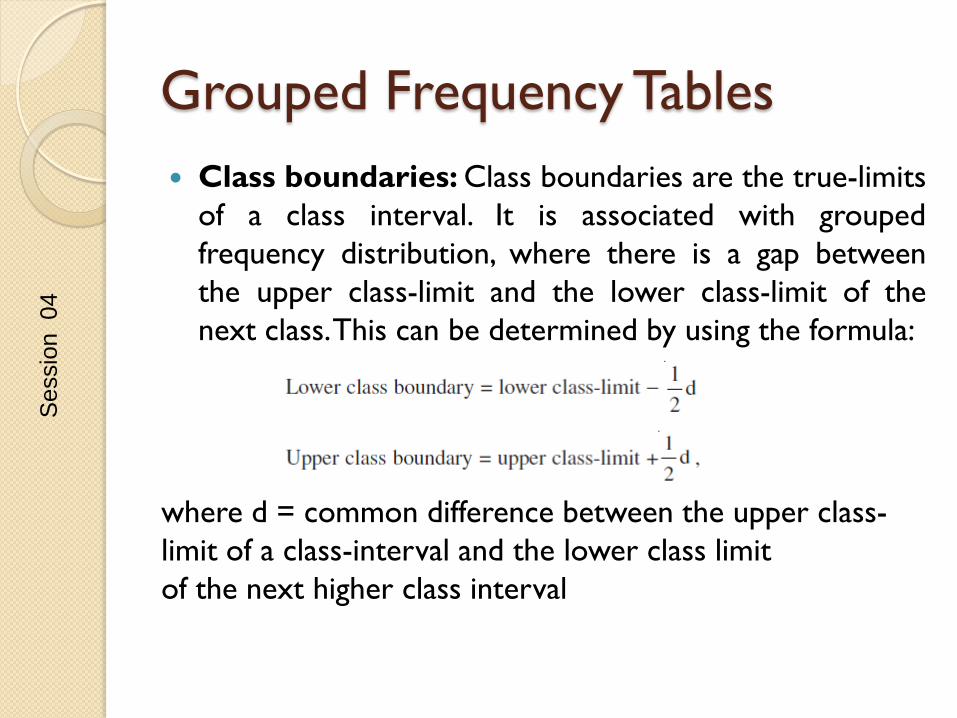
Class boundaries: Class boundaries are the true-limits
of a class interval. It is associated with grouped
frequency distribution, where there is a gap between
the upper class-limit and the lower class-limit of the
next class. This can be determined by using the formula:
where d = common difference between the upper class-
limit of a class-interval and the lower class limit
of the next higher class interval
Sessio
n 04

Grouped Frequency Tables
Width or Length (or size) of a Class-interval:
Width of a class-interval = Upper class boundary −
Lower class-boundary
Relative frequency:
Sessio
n 04
Grouped Frequency Tables
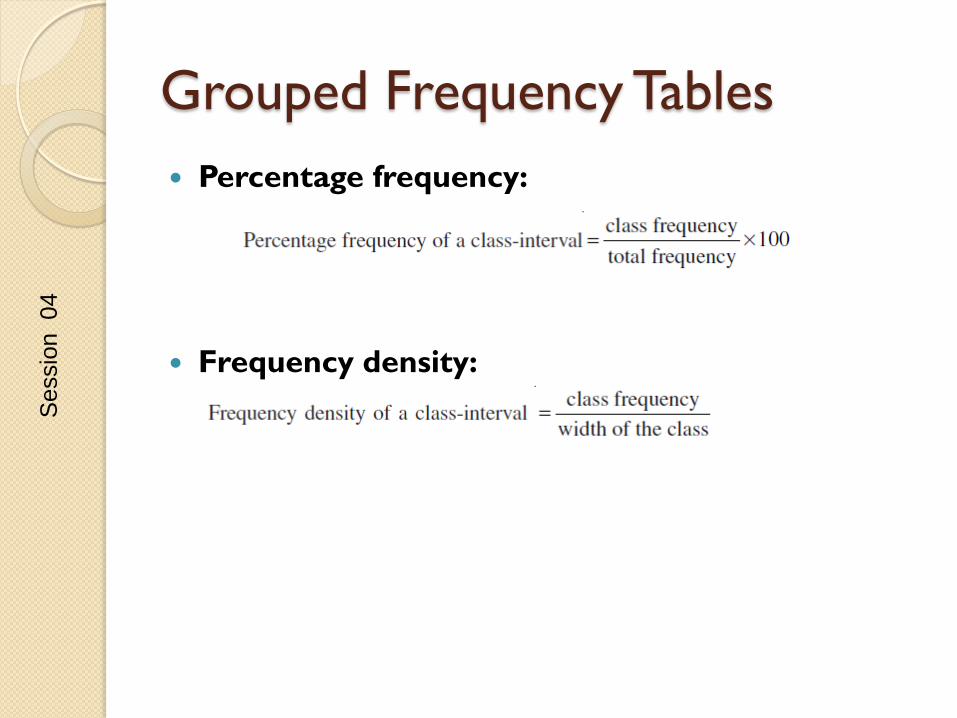
Percentage frequency:
Frequency density:
Sessio
n 04
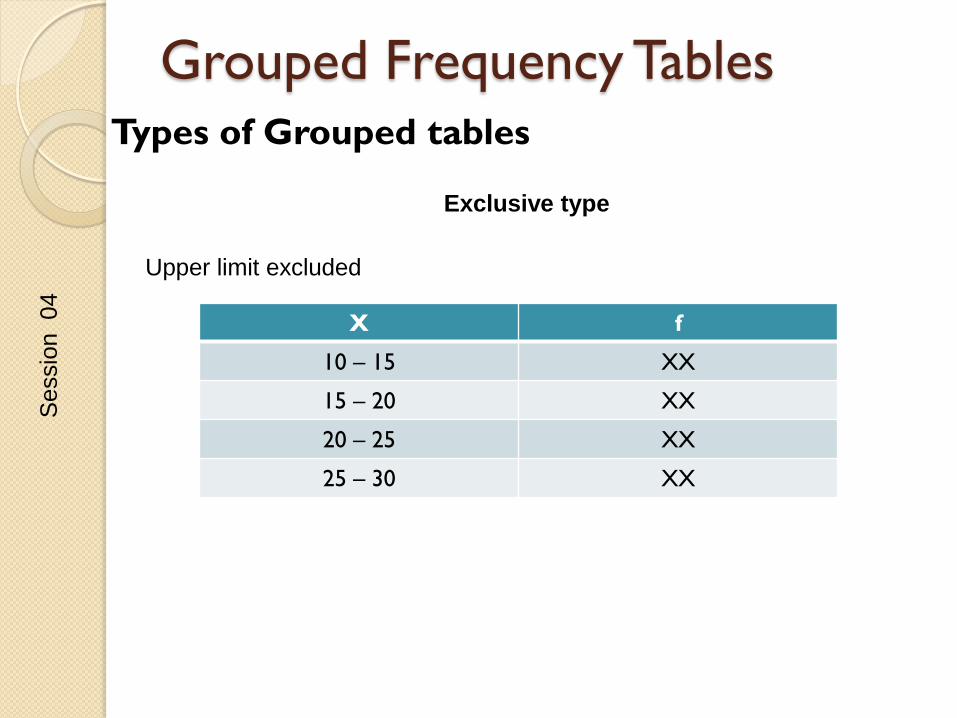
Grouped Frequency Tables Types of Grouped tables
Exclusive type
X f
10 – 15 XX
15 – 20 XX
20 – 25 XX
25 – 30 XX
Upper limit excluded
Sessio
n 04
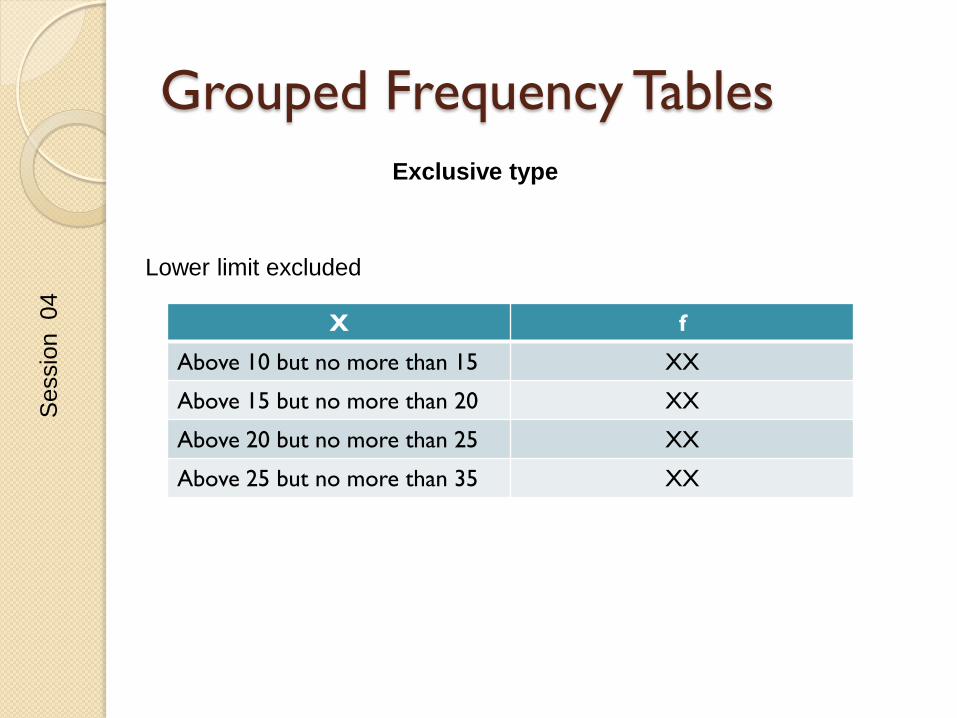
Grouped Frequency Tables
Exclusive type
X f
Above 10 but no more than 15 XX
Above 15 but no more than 20 XX
Above 20 but no more than 25 XX
Above 25 but no more than 35 XX
Lower limit excluded
Sessio
n 04
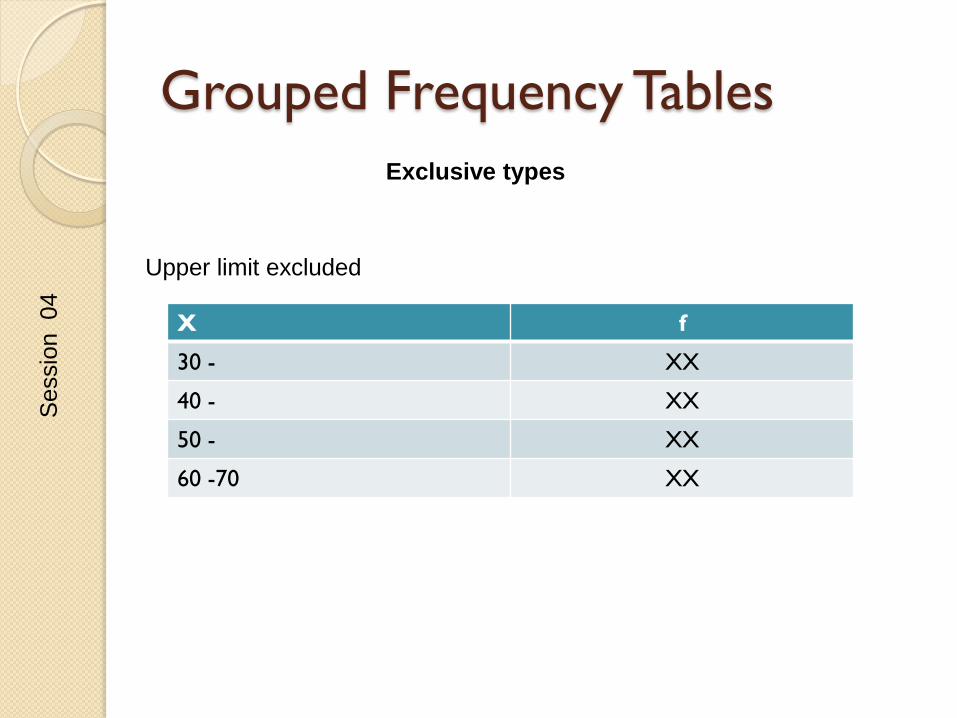
Grouped Frequency Tables
Exclusive types
Upper limit excluded
X f
30 - XX
40 - XX
50 - XX
60 -70 XX
Sessio
n 04
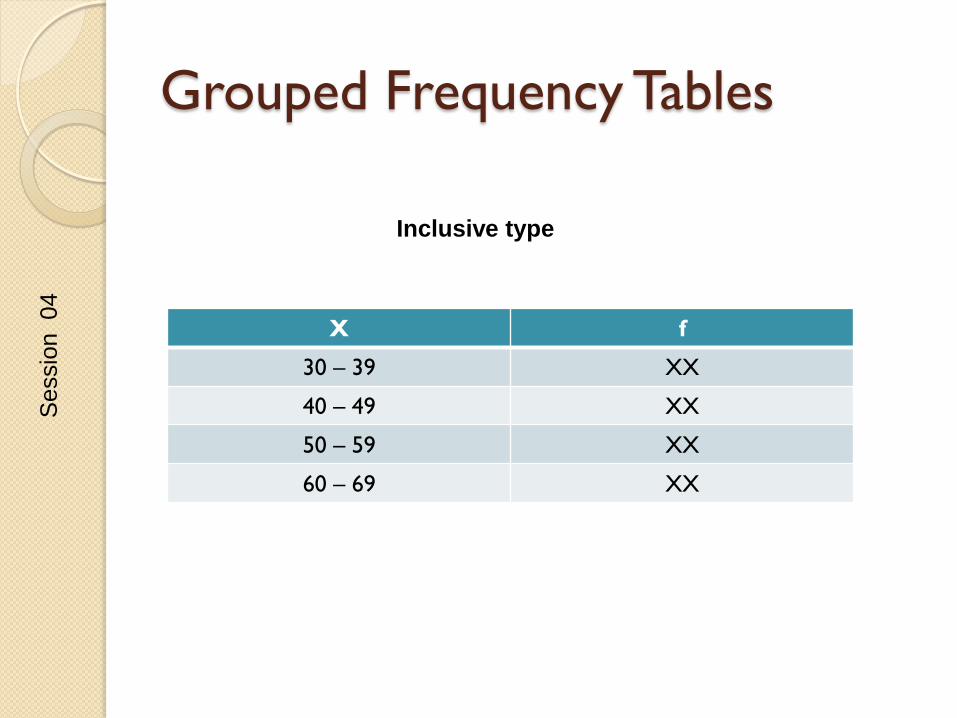
Grouped Frequency Tables
Inclusive type
X f
30 – 39 XX
40 – 49 XX
50 – 59 XX
60 – 69 XX
Sessio
n 04
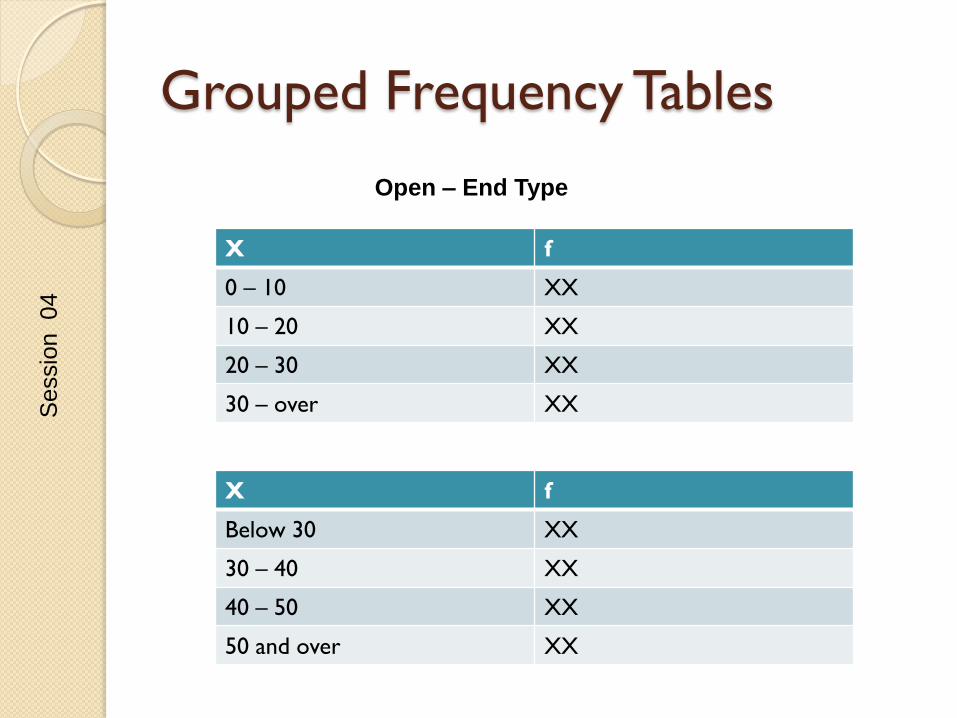
Grouped Frequency Tables
Open – End Type
X f
0 – 10 XX
10 – 20 XX
20 – 30 XX
30 – over XX
X f
Below 30 XX
30 – 40 XX
40 – 50 XX
50 and over XX
Sessio
n 04
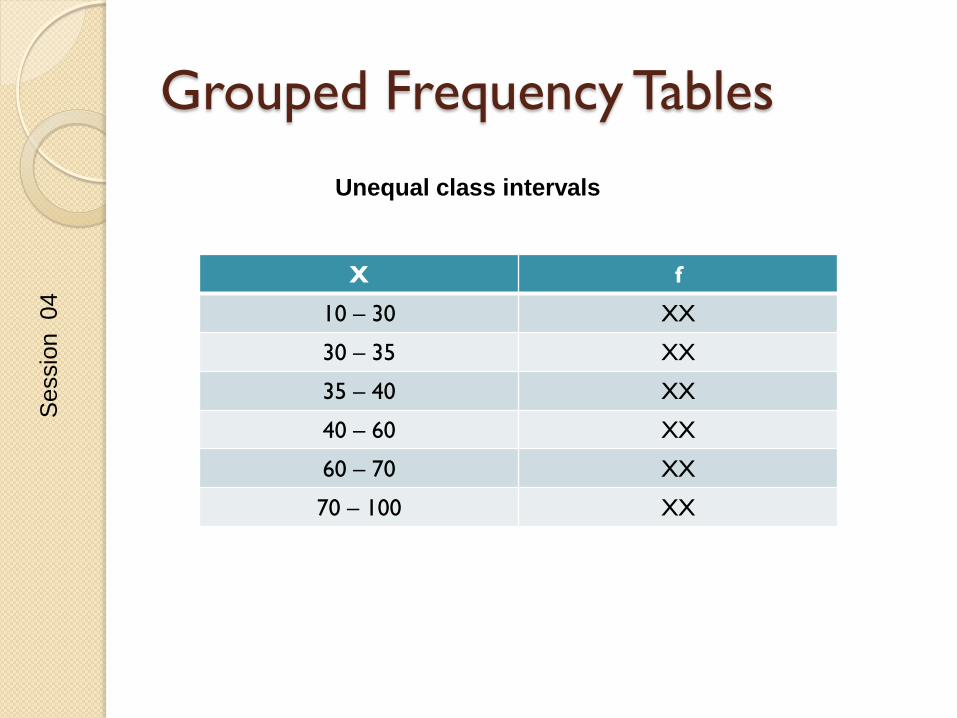
Grouped Frequency Tables
Unequal class intervals
X f
10 – 30 XX
30 – 35 XX
35 – 40 XX
40 – 60 XX
60 – 70 XX
70 – 100 XX
Sessio
n 04
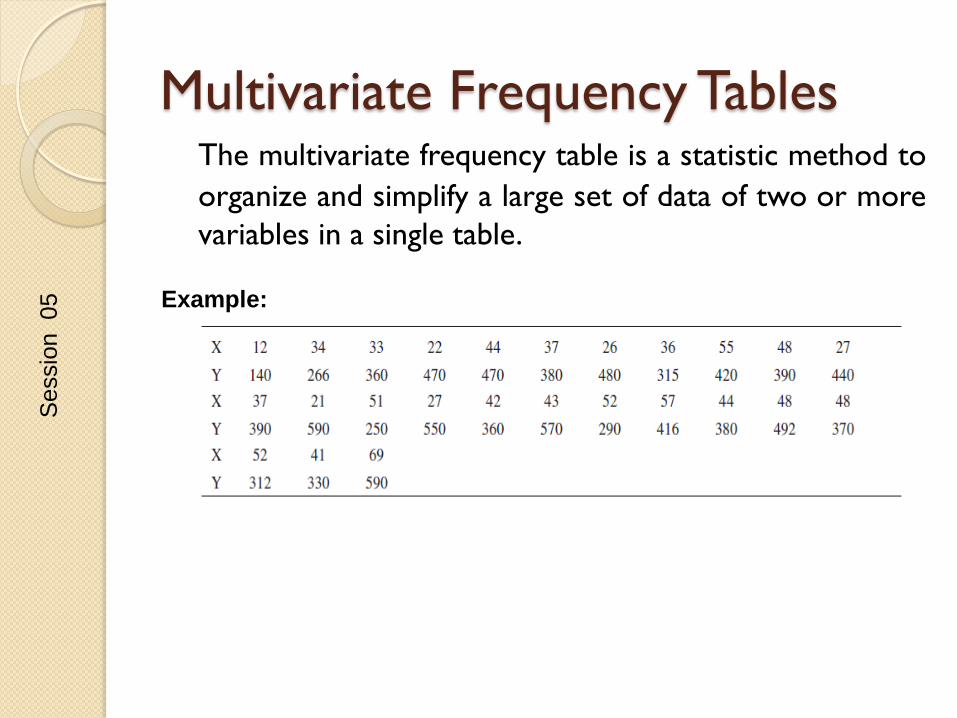
Multivariate Frequency Tables The multivariate frequency table is a statistic method to
organize and simplify a large set of data of two or more
variables in a single table.
Example:
Sessio
n 05
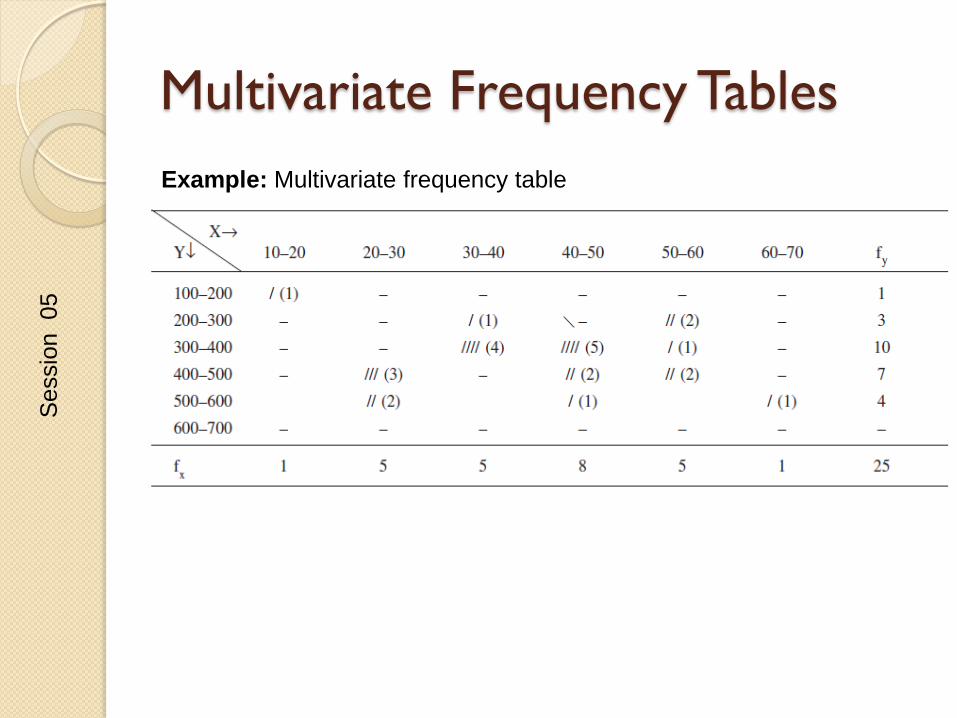
Multivariate Frequency Tables
Example: Multivariate frequency table
Sessio
n 05
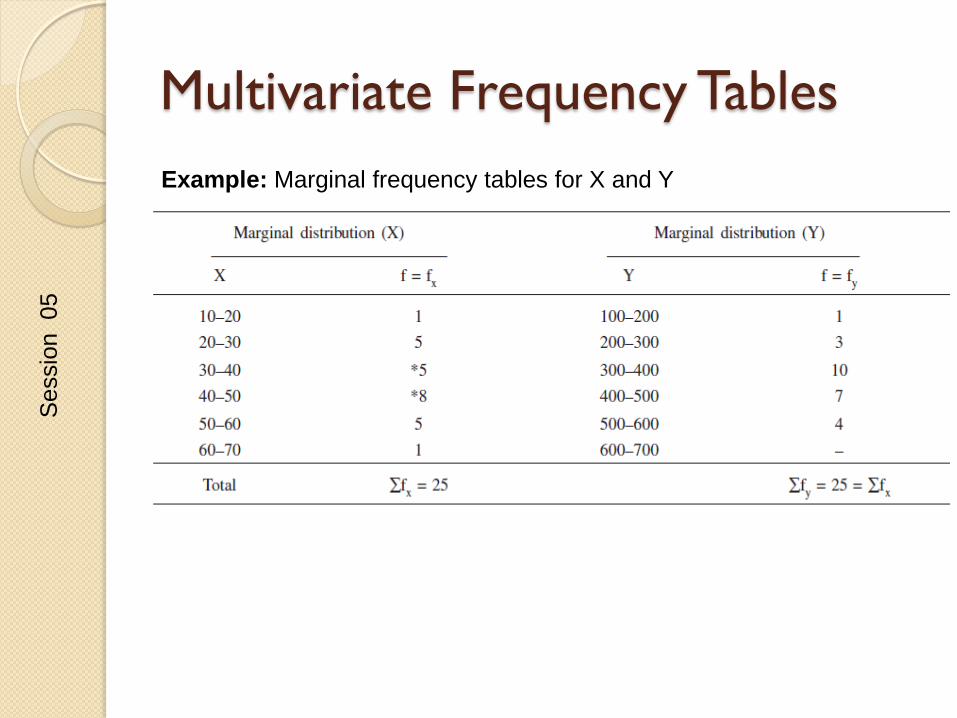
Multivariate Frequency Tables
Example: Marginal frequency tables for X and Y
Sessio
n 05
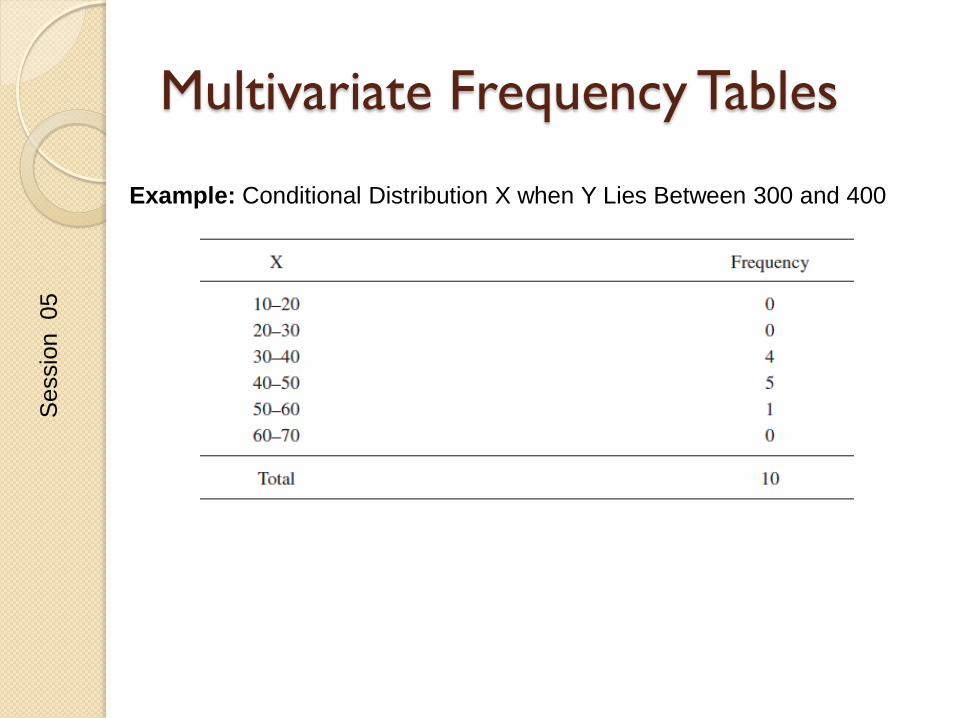
Multivariate Frequency Tables
Example: Conditional Distribution X when Y Lies Between 300 and 400
Sessio
n 05
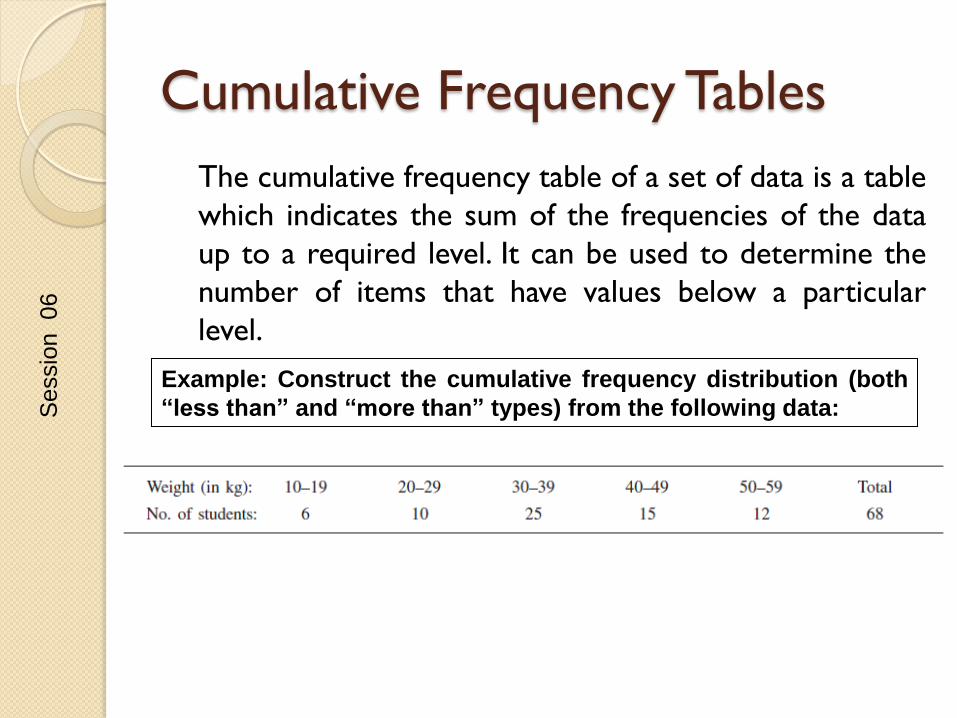
Cumulative Frequency Tables
The cumulative frequency table of a set of data is a table
which indicates the sum of the frequencies of the data
up to a required level. It can be used to determine the
number of items that have values below a particular
level.
Example: Construct the cumulative frequency distribution (both
“less than” and “more than” types) from the following data: Sessio
n 06
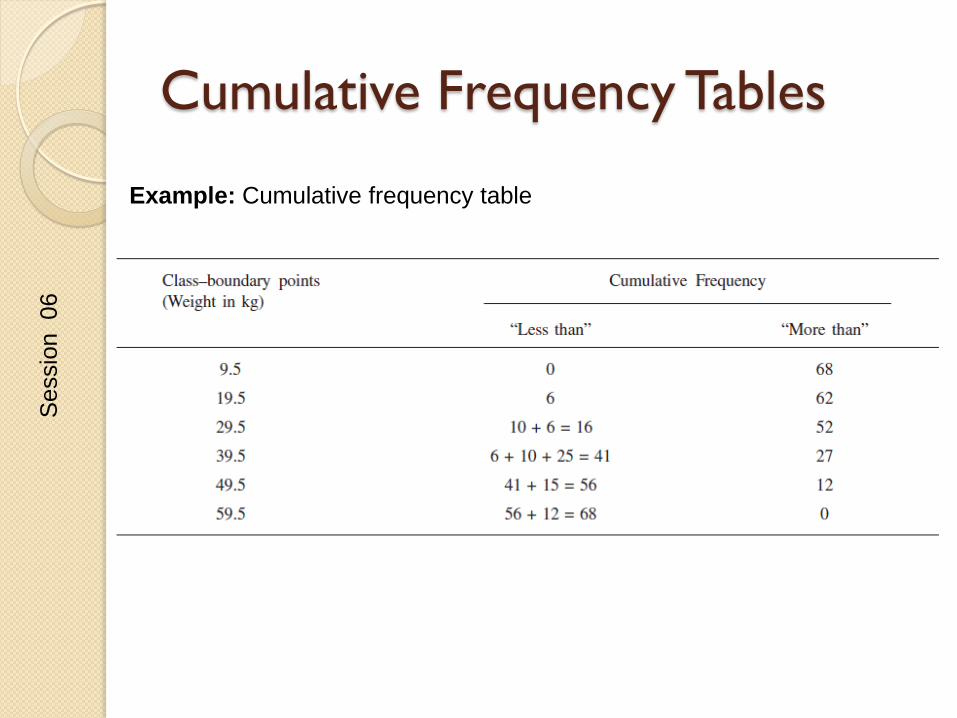
Cumulative Frequency Tables
Example: Cumulative frequency table
Sessio
n 06
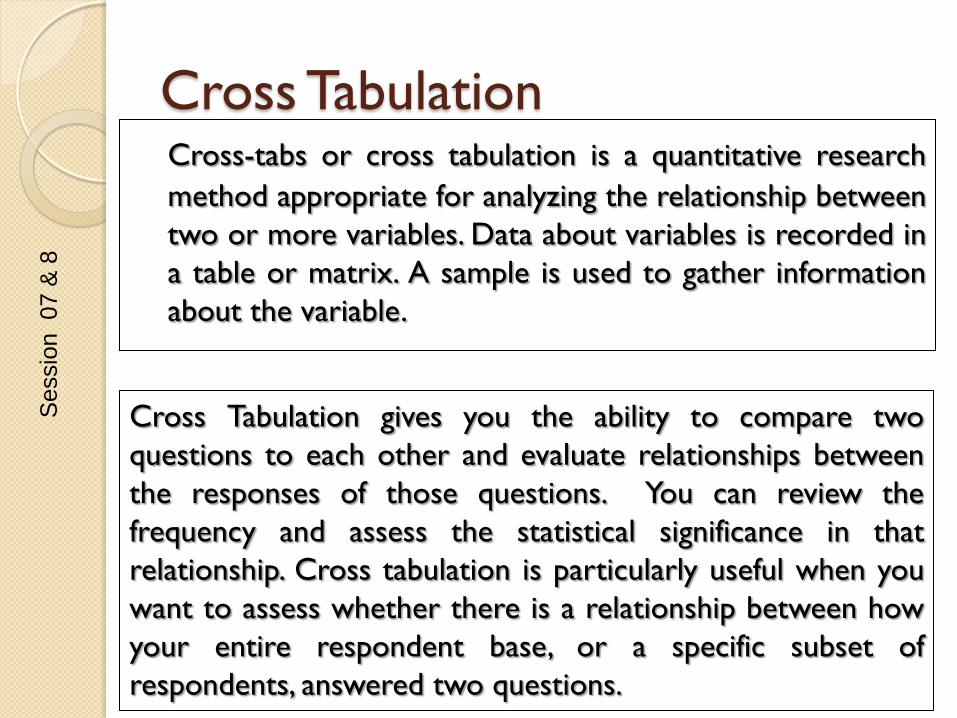
Cross Tabulation Cross-tabs or cross tabulation is a quantitative research
method appropriate for analyzing the relationship between
two or more variables. Data about variables is recorded in
a table or matrix. A sample is used to gather information
about the variable.
Cross Tabulation gives you the ability to compare two
questions to each other and evaluate relationships between
the responses of those questions. You can review the
frequency and assess the statistical significance in that
relationship. Cross tabulation is particularly useful when you
want to assess whether there is a relationship between how
your entire respondent base, or a specific subset of
respondents, answered two questions.
Sessio
n 07 &
8
Cross Tabulation
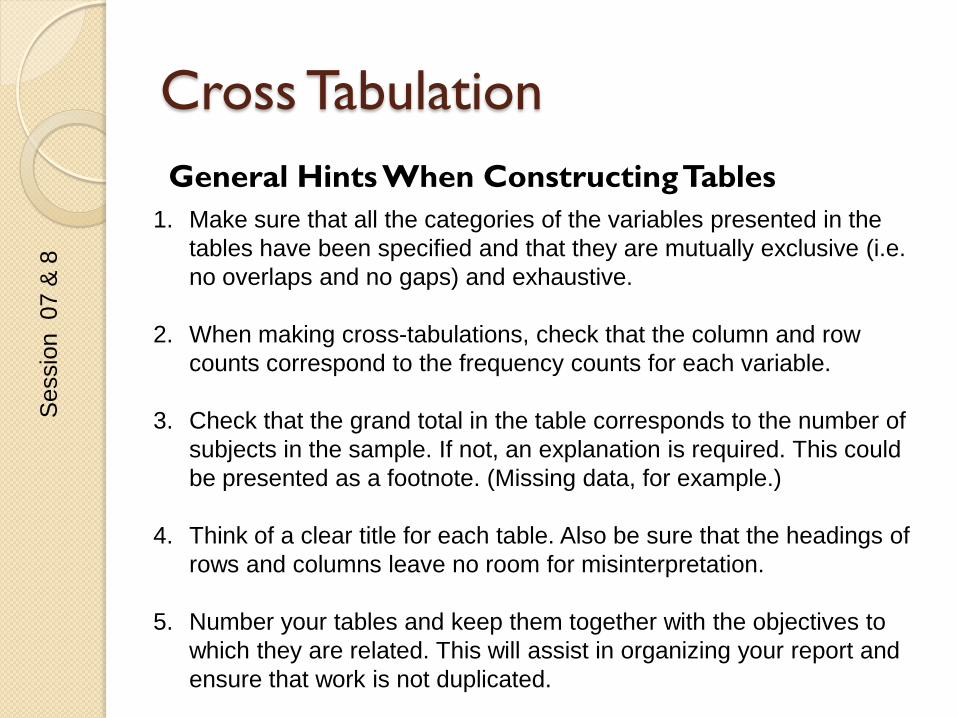
General Hints When Constructing Tables
1. Make sure that all the categories of the variables presented in the
tables have been specified and that they are mutually exclusive (i.e.
no overlaps and no gaps) and exhaustive.
2. When making cross-tabulations, check that the column and row
counts correspond to the frequency counts for each variable.
3. Check that the grand total in the table corresponds to the number of
subjects in the sample. If not, an explanation is required. This could
be presented as a footnote. (Missing data, for example.)
4. Think of a clear title for each table. Also be sure that the headings of
rows and columns leave no room for misinterpretation.
5. Number your tables and keep them together with the objectives to
which they are related. This will assist in organizing your report and
ensure that work is not duplicated.
Sessio
n 07 &
8
Cross Tabulation - Descriptive Cross Tabulation
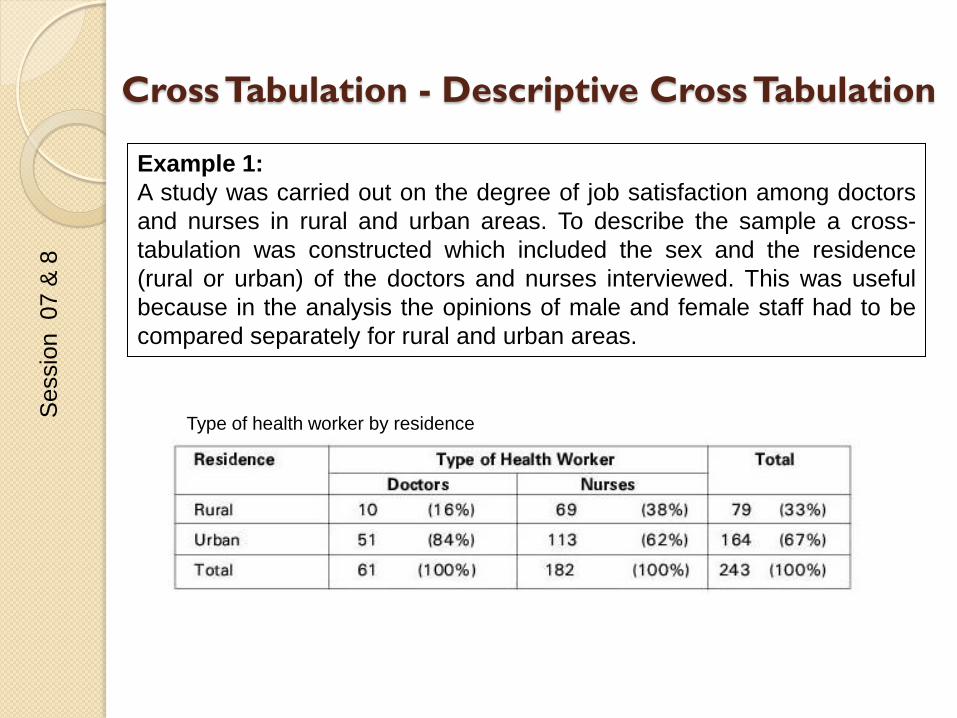
Example 1:
A study was carried out on the degree of job satisfaction among doctors
and nurses in rural and urban areas. To describe the sample a cross-
tabulation was constructed which included the sex and the residence
(rural or urban) of the doctors and nurses interviewed. This was useful
because in the analysis the opinions of male and female staff had to be
compared separately for rural and urban areas.
Type of health worker by residence
Sessio
n 07 &
8
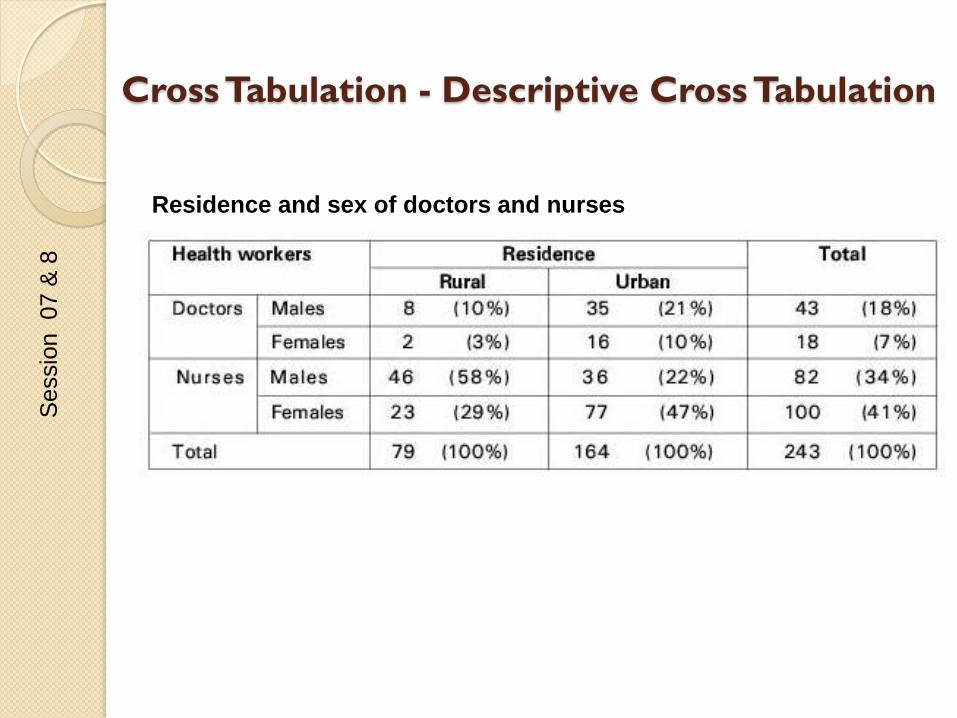
Cross Tabulation - Descriptive Cross Tabulation
Residence and sex of doctors and nurses
Sessio
n 07 &
8
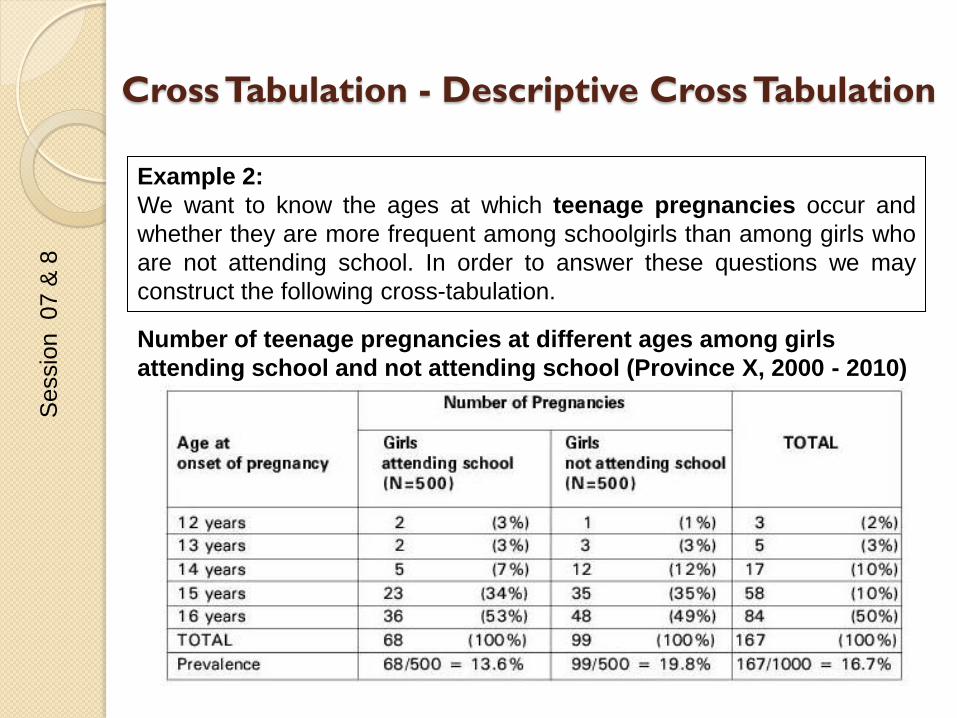
Example 2:
We want to know the ages at which teenage pregnancies occur and
whether they are more frequent among schoolgirls than among girls who
are not attending school. In order to answer these questions we may
construct the following cross-tabulation.
Number of teenage pregnancies at different ages among girls
attending school and not attending school (Province X, 2000 - 2010)
Cross Tabulation - Descriptive Cross Tabulation
Sessio
n 07 &
8
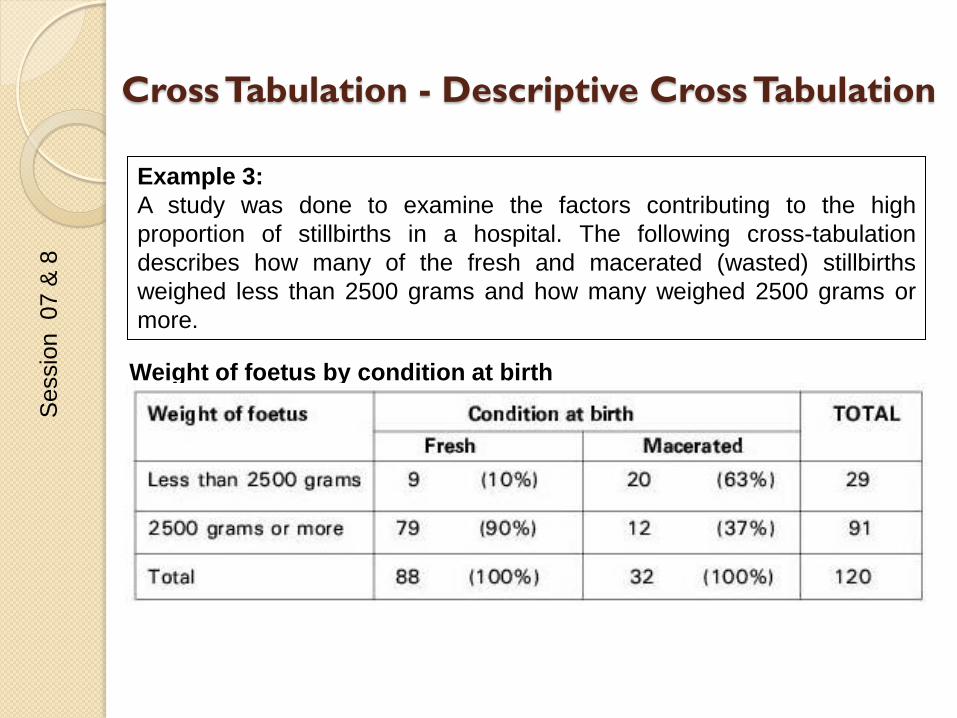
Example 3:
A study was done to examine the factors contributing to the high
proportion of stillbirths in a hospital. The following cross-tabulation
describes how many of the fresh and macerated (wasted) stillbirths
weighed less than 2500 grams and how many weighed 2500 grams or
more.
Weight of foetus by condition at birth
Cross Tabulation - Descriptive Cross Tabulation
Sessio
n 07 &
8
Example 4:
In a cross-sectional survey on malnutrition, for example, relationships
could be tested between the duration of breastfeeding and the mothers’
age, or the mothers’ working status (answering previously formulated
research questions, but sometimes new questions that crop up during
analysis of the material).
Note that in such tables it is allowed to calculate your percentages both horizontally and vertically as all
variables have a similar chance of appearing in the survey. However, we will usually put the variable that is
assumed to influence the other one in rows, while the ‘dependent’ variable will be put in columns
Cross Tabulation - Descriptive Cross Tabulation
Sessio
n 07 &
8
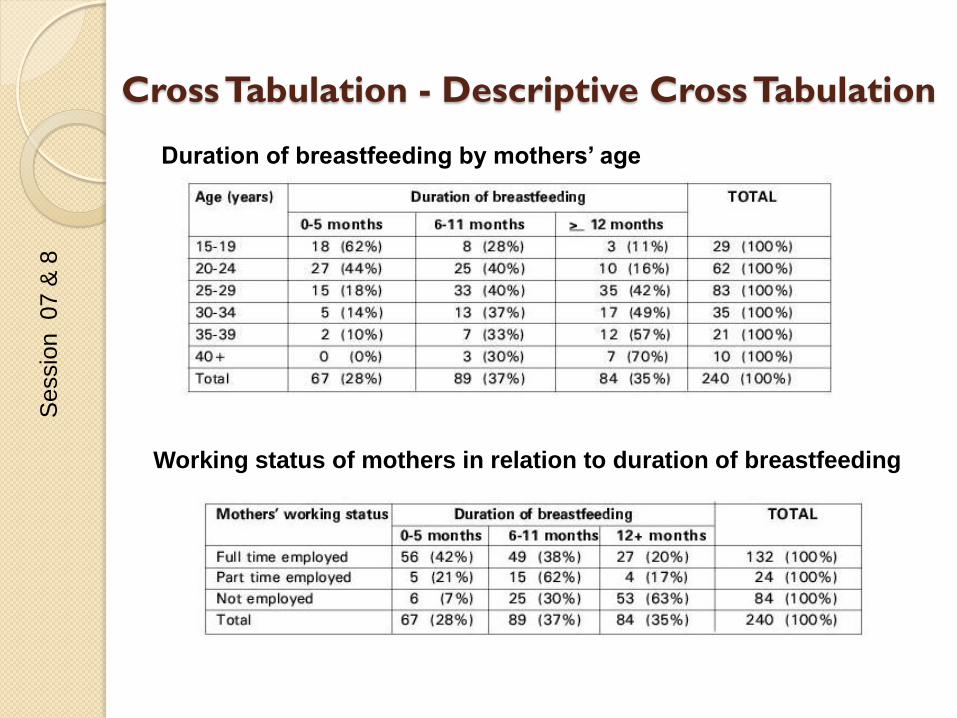
Duration of breastfeeding by mothers’ age
Working status of mothers in relation to duration of breastfeeding
Cross Tabulation - Descriptive Cross Tabulation
Sessio
n 07 &
8
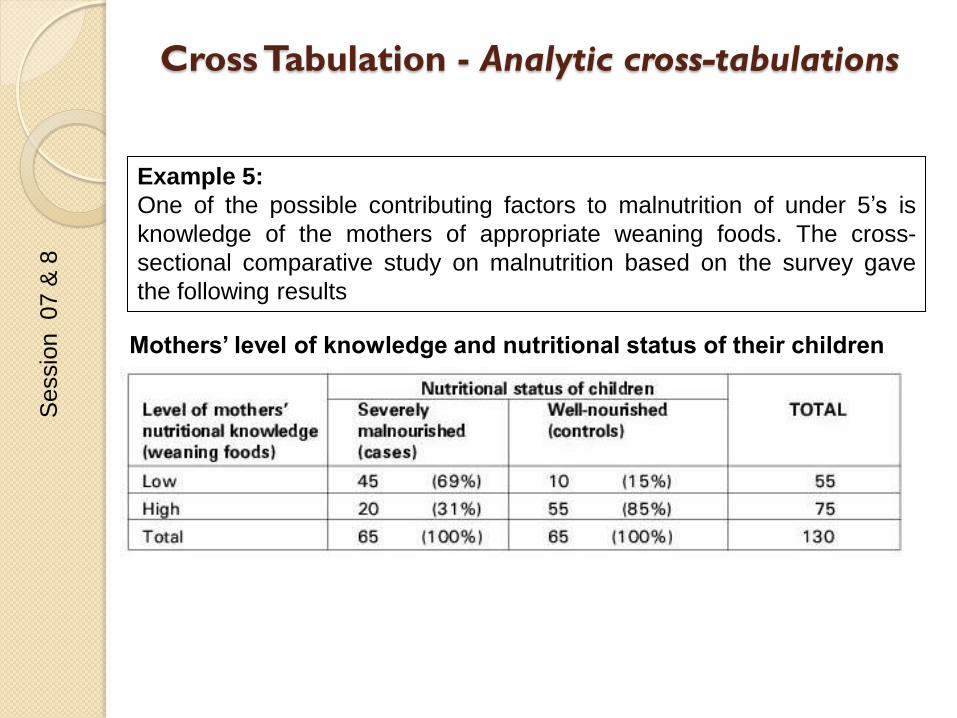
Cross Tabulation - Analytic cross-tabulations
Example 5:
One of the possible contributing factors to malnutrition of under 5’s is
knowledge of the mothers of appropriate weaning foods. The cross-
sectional comparative study on malnutrition based on the survey gave
the following results
Mothers’ level of knowledge and nutritional status of their children
Sessio
n 07 &
8