tag ranking - eprints
TRANSCRIPT
Tag Ranking∗
Dong LiuSchool of Computer Sci.& Tec.Harbin Institute of Technology
Harbin, 150001, [email protected]
Xian-Sheng HuaMicrosoft Research Asia
49 Zhichun RoadBeijing, 100190, P.R.China
Linjun YangMicrosoft Research Asia
49 Zhichun RoadBeijing, 100190, P.R.China
Meng WangMicrosoft Research Asia
49 Zhichun RoadBeijing, 100190, P.R.China
Hong-Jiang ZhangMicrosoft Adv. Tech. Center
49 Zhichun RoadBeijing, 100190, P.R.China
ABSTRACT
Social media sharing web sites like Flickr allow users to an-notate images with free tags, which significantly facilitateWeb image search and organization. However, the tags as-sociated with an image generally are in a random order with-out any importance or relevance information, which limitsthe effectiveness of these tags in search and other applica-tions. In this paper, we propose a tag ranking scheme, aim-ing to automatically rank the tags associated with a givenimage according to their relevance to the image content.We first estimate initial relevance scores for the tags basedon probability density estimation, and then perform a ran-dom walk over a tag similarity graph to refine the relevancescores. Experimental results on a 50, 000 Flickr photo col-lection show that the proposed tag ranking method is botheffective and efficient. We also apply tag ranking into threeapplications: (1) tag-based image search, (2) tag recommen-dation, and (3) group recommendation, which demonstratesthat the proposed tag ranking approach really boosts theperformances of social-tagging related applications.
Categories and Subject Descriptors
H.3.1 [Information Storage and Retrieval]: ContentAnalysis and Indexing
General Terms
Algorithms, Experimentation, Performance
Keywords
Flickr, tag ranking, random walk, recommendation, search
1. INTRODUCTIONRecent years have witnessed an explosion of community-
contributed multimedia content available online (e.g. Flickr,Youtube, and Zooomr). Such social media repositories allowusers to upload personal media data and annotate content
∗This work was performed at Microsoft Research Asia.
Copyright is held by the International World Wide Web Conference Com-mittee (IW3C2). Distribution of these papers is limited to classroom use,and personal use by others.WWW 2009, April 20–24, 2009, Madrid, Spain.ACM 978-1-60558-487-4/09/04.
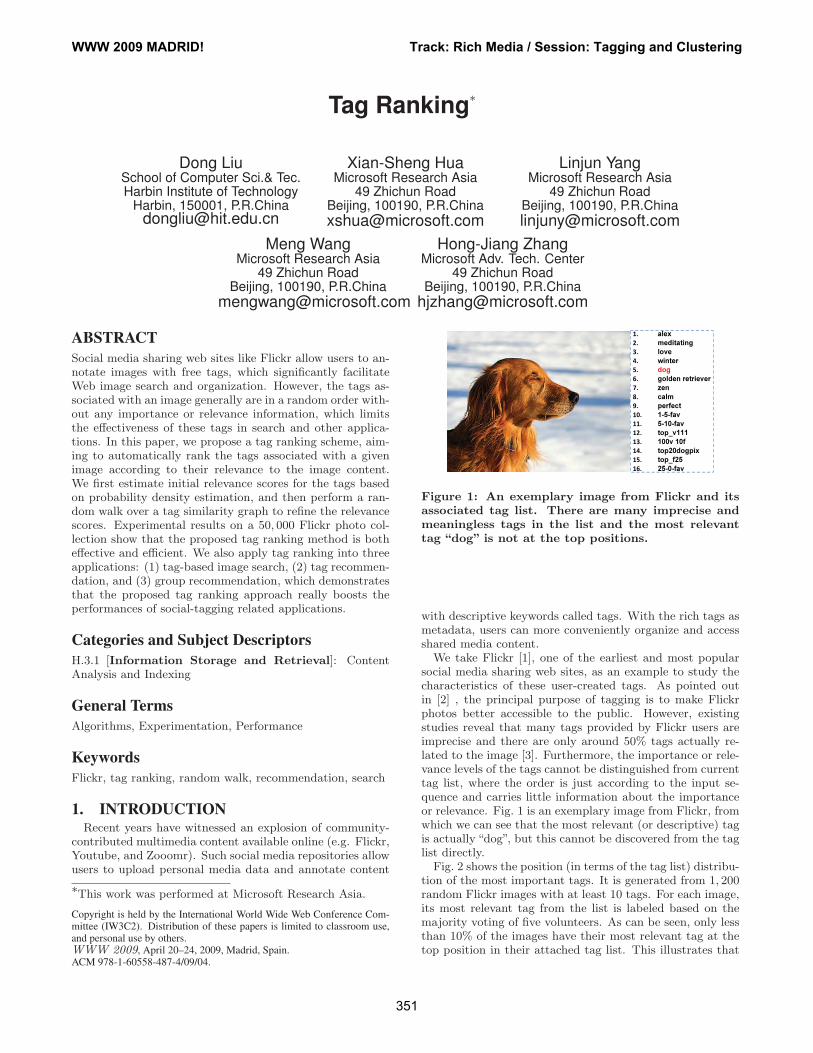
1. alex 2. meditating 3. love 4. winter 5. dog 6. golden retriever 7. zen 8. calm 9. perfect 10. 1-5-fav 11. 5-10-fav 12. top_v111 13. 100v 10f 14. top20dogpix 15. top_f25 16. 25-0-fav
Figure 1: An exemplary image from Flickr and itsassociated tag list. There are many imprecise andmeaningless tags in the list and the most relevanttag “dog” is not at the top positions.
with descriptive keywords called tags. With the rich tags asmetadata, users can more conveniently organize and accessshared media content.
We take Flickr [1], one of the earliest and most popularsocial media sharing web sites, as an example to study thecharacteristics of these user-created tags. As pointed outin [2] , the principal purpose of tagging is to make Flickrphotos better accessible to the public. However, existingstudies reveal that many tags provided by Flickr users areimprecise and there are only around 50% tags actually re-lated to the image [3]. Furthermore, the importance or rele-vance levels of the tags cannot be distinguished from currenttag list, where the order is just according to the input se-quence and carries little information about the importanceor relevance. Fig. 1 is an exemplary image from Flickr, fromwhich we can see that the most relevant (or descriptive) tagis actually “dog”, but this cannot be discovered from the taglist directly.
Fig. 2 shows the position (in terms of the tag list) distribu-tion of the most important tags. It is generated from 1, 200random Flickr images with at least 10 tags. For each image,its most relevant tag from the list is labeled based on themajority voting of five volunteers. As can be seen, only lessthan 10% of the images have their most relevant tag at thetop position in their attached tag list. This illustrates that
WWW 2009 MADRID! Track: Rich Media / Session: Tagging and Clustering
351
the tags are almost in a random order in terms of relevanceto the associated image1.
1st 2nd 3rd 4th 5th 6th 7th 8th 9th 10th0
2
4
6
8
10
12
Position of Most Relevant Tag
Perc
en
tag
e(%
)
Figure 2: Percentage of images that have their mostrelevant tag at the n-th position in the associatedtag list, where n = 1, 2, 3 . . . , 10.
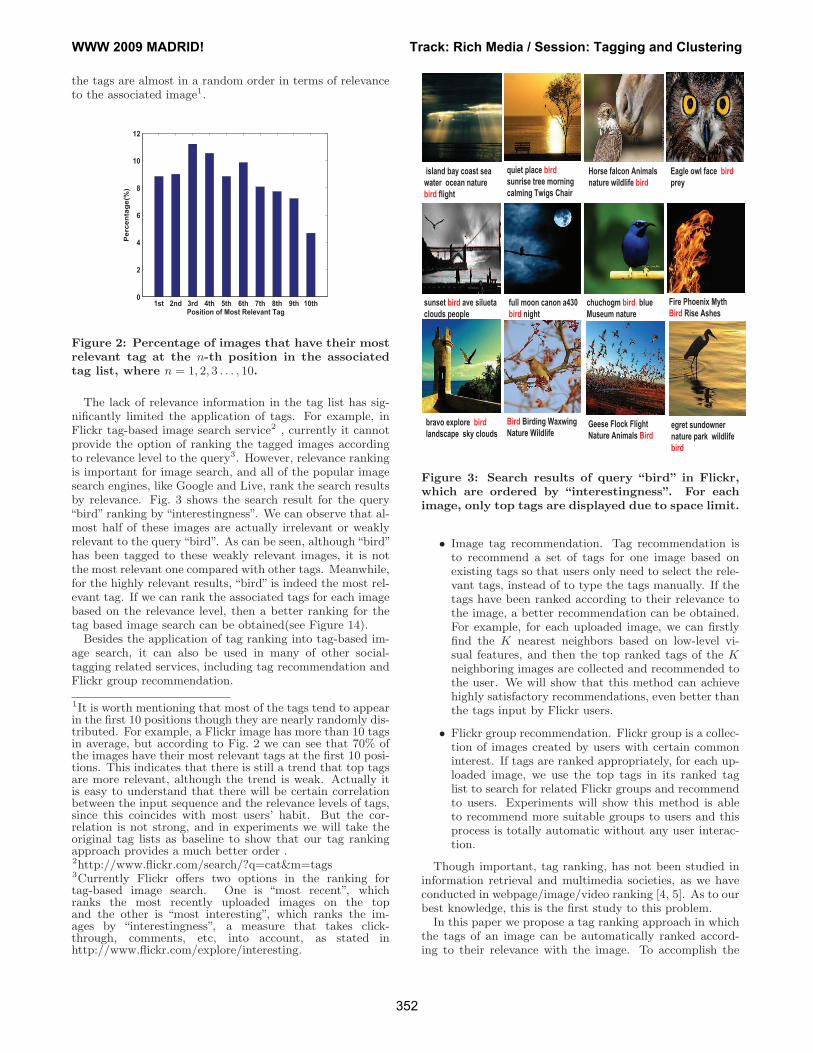
The lack of relevance information in the tag list has sig-nificantly limited the application of tags. For example, inFlickr tag-based image search service2 , currently it cannotprovide the option of ranking the tagged images accordingto relevance level to the query3. However, relevance rankingis important for image search, and all of the popular imagesearch engines, like Google and Live, rank the search resultsby relevance. Fig. 3 shows the search result for the query“bird” ranking by “interestingness”. We can observe that al-most half of these images are actually irrelevant or weaklyrelevant to the query“bird”. As can be seen, although“bird”has been tagged to these weakly relevant images, it is notthe most relevant one compared with other tags. Meanwhile,for the highly relevant results, “bird” is indeed the most rel-evant tag. If we can rank the associated tags for each imagebased on the relevance level, then a better ranking for thetag based image search can be obtained(see Figure 14).
Besides the application of tag ranking into tag-based im-age search, it can also be used in many of other social-tagging related services, including tag recommendation andFlickr group recommendation.
1It is worth mentioning that most of the tags tend to appearin the first 10 positions though they are nearly randomly dis-tributed. For example, a Flickr image has more than 10 tagsin average, but according to Fig. 2 we can see that 70% ofthe images have their most relevant tags at the first 10 posi-tions. This indicates that there is still a trend that top tagsare more relevant, although the trend is weak. Actually itis easy to understand that there will be certain correlationbetween the input sequence and the relevance levels of tags,since this coincides with most users’ habit. But the cor-relation is not strong, and in experiments we will take theoriginal tag lists as baseline to show that our tag rankingapproach provides a much better order .2http://www.flickr.com/search/?q=cat&m=tags3Currently Flickr offers two options in the ranking fortag-based image search. One is “most recent”, whichranks the most recently uploaded images on the topand the other is “most interesting”, which ranks the im-ages by “interestingness”, a measure that takes click-through, comments, etc, into account, as stated inhttp://www.flickr.com/explore/interesting.
island bay coast sea
water ocean nature
bird flight
quiet place bird
sunrise tree morning
calming Twigs Chair
Horse falcon Animals
nature wildlife bird
Eagle owl face bird
prey
sunset bird ave silueta
clouds people
full moon canon a430
bird night
chuchogm bird blue
Museum nature
Bird Birding Waxwing
Nature Wildlife
Fire Phoenix Myth
Bird Rise Ashes
bravo explore bird
landscape sky cloudsGeese Flock Flight
Nature Animals Birdegret sundowner
nature park wildlife
bird
Figure 3: Search results of query “bird” in Flickr,which are ordered by “interestingness”. For eachimage, only top tags are displayed due to space limit.
• Image tag recommendation. Tag recommendation isto recommend a set of tags for one image based onexisting tags so that users only need to select the rele-vant tags, instead of to type the tags manually. If thetags have been ranked according to their relevance tothe image, a better recommendation can be obtained.For example, for each uploaded image, we can firstlyfind the K nearest neighbors based on low-level vi-sual features, and then the top ranked tags of the Kneighboring images are collected and recommended tothe user. We will show that this method can achievehighly satisfactory recommendations, even better thanthe tags input by Flickr users.
• Flickr group recommendation. Flickr group is a collec-tion of images created by users with certain commoninterest. If tags are ranked appropriately, for each up-loaded image, we use the top tags in its ranked taglist to search for related Flickr groups and recommendto users. Experiments will show this method is ableto recommend more suitable groups to users and thisprocess is totally automatic without any user interac-tion.
Though important, tag ranking, has not been studied ininformation retrieval and multimedia societies, as we haveconducted in webpage/image/video ranking [4, 5]. As to ourbest knowledge, this is the first study to this problem.
In this paper we propose a tag ranking approach in whichthe tags of an image can be automatically ranked accord-ing to their relevance with the image. To accomplish the
WWW 2009 MADRID! Track: Rich Media / Session: Tagging and Clustering
352
flower tree bird sky
(1) bird (0.36)
(2) flower (0.28)
(3) sky (0.21)
(4) tree (0.15)
bird tree
flower sky
S(bird)
S(flower) S(sky)
S(tree)
Exemplar Similarity
Concurrence Similarity
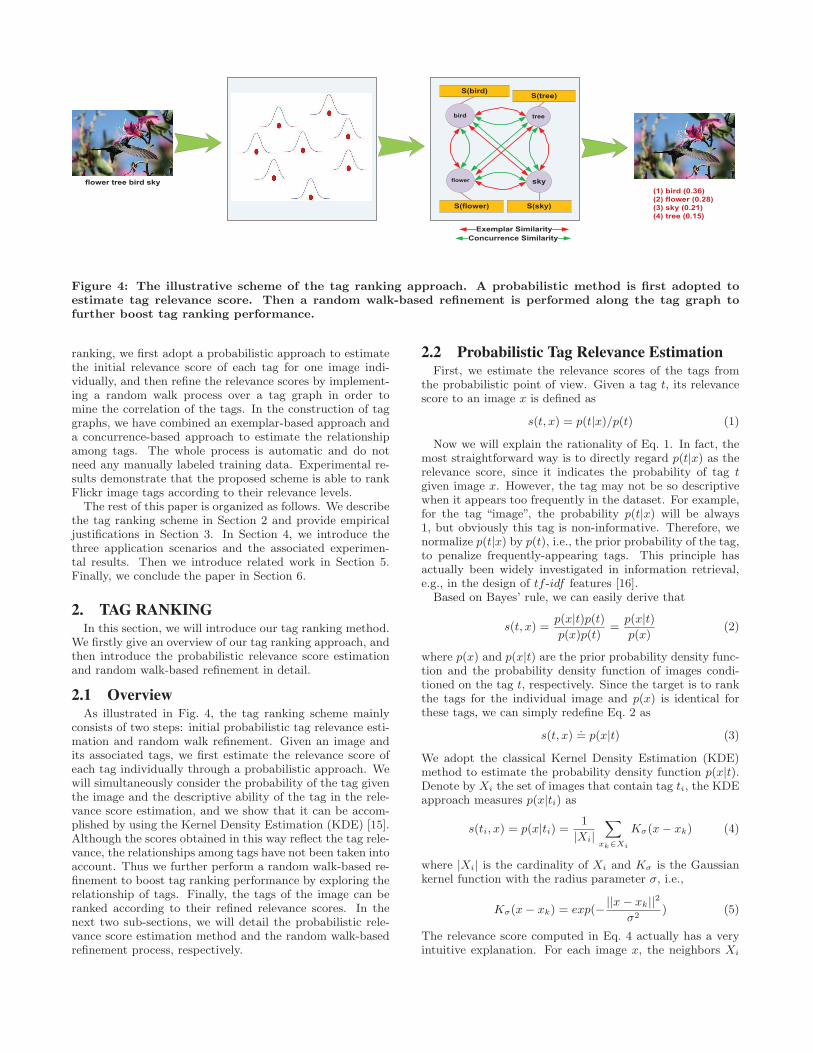
Figure 4: The illustrative scheme of the tag ranking approach. A probabilistic method is first adopted toestimate tag relevance score. Then a random walk-based refinement is performed along the tag graph tofurther boost tag ranking performance.
ranking, we first adopt a probabilistic approach to estimatethe initial relevance score of each tag for one image indi-vidually, and then refine the relevance scores by implement-ing a random walk process over a tag graph in order tomine the correlation of the tags. In the construction of taggraphs, we have combined an exemplar-based approach anda concurrence-based approach to estimate the relationshipamong tags. The whole process is automatic and do notneed any manually labeled training data. Experimental re-sults demonstrate that the proposed scheme is able to rankFlickr image tags according to their relevance levels.
The rest of this paper is organized as follows. We describethe tag ranking scheme in Section 2 and provide empiricaljustifications in Section 3. In Section 4, we introduce thethree application scenarios and the associated experimen-tal results. Then we introduce related work in Section 5.Finally, we conclude the paper in Section 6.
2. TAG RANKINGIn this section, we will introduce our tag ranking method.
We firstly give an overview of our tag ranking approach, andthen introduce the probabilistic relevance score estimationand random walk-based refinement in detail.
2.1 OverviewAs illustrated in Fig. 4, the tag ranking scheme mainly
consists of two steps: initial probabilistic tag relevance esti-mation and random walk refinement. Given an image andits associated tags, we first estimate the relevance score ofeach tag individually through a probabilistic approach. Wewill simultaneously consider the probability of the tag giventhe image and the descriptive ability of the tag in the rele-vance score estimation, and we show that it can be accom-plished by using the Kernel Density Estimation (KDE) [15].Although the scores obtained in this way reflect the tag rele-vance, the relationships among tags have not been taken intoaccount. Thus we further perform a random walk-based re-finement to boost tag ranking performance by exploring therelationship of tags. Finally, the tags of the image can beranked according to their refined relevance scores. In thenext two sub-sections, we will detail the probabilistic rele-vance score estimation method and the random walk-basedrefinement process, respectively.
2.2 Probabilistic Tag Relevance EstimationFirst, we estimate the relevance scores of the tags from
the probabilistic point of view. Given a tag t, its relevancescore to an image x is defined as
s(t, x) = p(t|x)/p(t) (1)
Now we will explain the rationality of Eq. 1. In fact, themost straightforward way is to directly regard p(t|x) as therelevance score, since it indicates the probability of tag tgiven image x. However, the tag may not be so descriptivewhen it appears too frequently in the dataset. For example,for the tag “image”, the probability p(t|x) will be always1, but obviously this tag is non-informative. Therefore, wenormalize p(t|x) by p(t), i.e., the prior probability of the tag,to penalize frequently-appearing tags. This principle hasactually been widely investigated in information retrieval,e.g., in the design of tf -idf features [16].
Based on Bayes’ rule, we can easily derive that
s(t, x) =p(x|t)p(t)
p(x)p(t)=
p(x|t)
p(x)(2)
where p(x) and p(x|t) are the prior probability density func-tion and the probability density function of images condi-tioned on the tag t, respectively. Since the target is to rankthe tags for the individual image and p(x) is identical forthese tags, we can simply redefine Eq. 2 as
s(t, x).= p(x|t) (3)
We adopt the classical Kernel Density Estimation (KDE)method to estimate the probability density function p(x|t).Denote by Xi the set of images that contain tag ti, the KDEapproach measures p(x|ti) as
s(ti, x) = p(x|ti) =1
|Xi|
∑
xk∈Xi
Kσ(x − xk) (4)
where |Xi| is the cardinality of Xi and Kσ is the Gaussiankernel function with the radius parameter σ, i.e.,
Kσ(x − xk) = exp(−||x − xk||
2
σ2) (5)
The relevance score computed in Eq. 4 actually has a veryintuitive explanation. For each image x, the neighbors Xi
can be regarded as its friends. The sum of the similarities es-timated based on Gaussian kernel function can be regardedas the soft voting from the friends. Therefore, such relevanceis actually estimated based on “collective intelligence” fromfriend images.
2.3 Random Walk-Based RefinementThe probabilistic tag relevance estimation, which takes
the image “friends” into consideration, has not taken intoaccount the relationship among tags which will be helpful.For example, consider the image which has a lot of closelyrelated tags, such as “cat”, “animal” and “kitten”, and anisolated tag such as “Nikon”. In this case, intuitively we caninfer that the isolated tag “Nikon” is less descriptive thanthe others.
To investigate the relationship between tags, we performrandom walk over the tag graph for each image to propagatethe relevance scores among tags. The nodes of the graphare the tags of the image and the edges are weighted withpairwise tag similarity. Here we propose two tag similar-ity measurements, i.e., exemplar similarity and concurrencesimilarity, and combine them in the tag graph construction.
2.3.1 Tag graph construction
We estimate the tag exemplar similarity and concurrencesimilarity and then combine them to form the weights of taggraph edges.
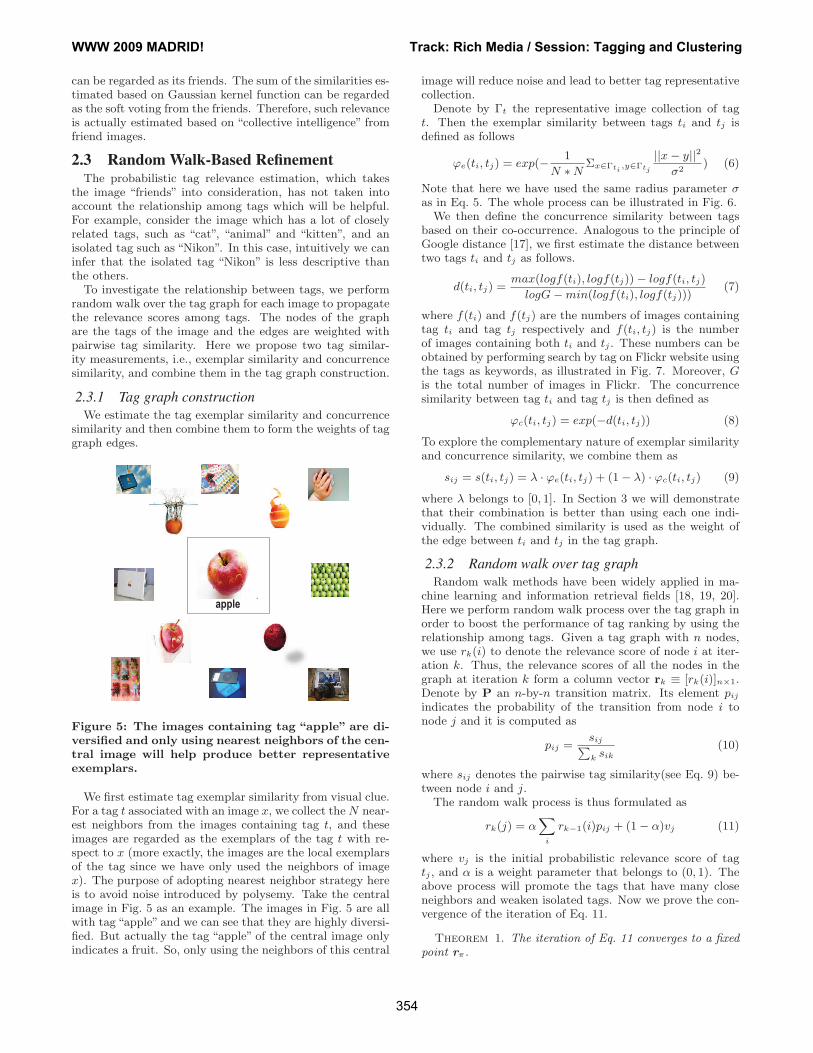
apple
Figure 5: The images containing tag “apple” are di-versified and only using nearest neighbors of the cen-tral image will help produce better representativeexemplars.
We first estimate tag exemplar similarity from visual clue.For a tag t associated with an image x, we collect the N near-est neighbors from the images containing tag t, and theseimages are regarded as the exemplars of the tag t with re-spect to x (more exactly, the images are the local exemplarsof the tag since we have only used the neighbors of imagex). The purpose of adopting nearest neighbor strategy hereis to avoid noise introduced by polysemy. Take the centralimage in Fig. 5 as an example. The images in Fig. 5 are allwith tag “apple” and we can see that they are highly diversi-fied. But actually the tag “apple” of the central image onlyindicates a fruit. So, only using the neighbors of this central
image will reduce noise and lead to better tag representativecollection.
Denote by Γt the representative image collection of tagt. Then the exemplar similarity between tags ti and tj isdefined as follows
ϕe(ti, tj) = exp(−1
N ∗ NΣx∈Γti
,y∈Γtj
||x − y||2
σ2) (6)
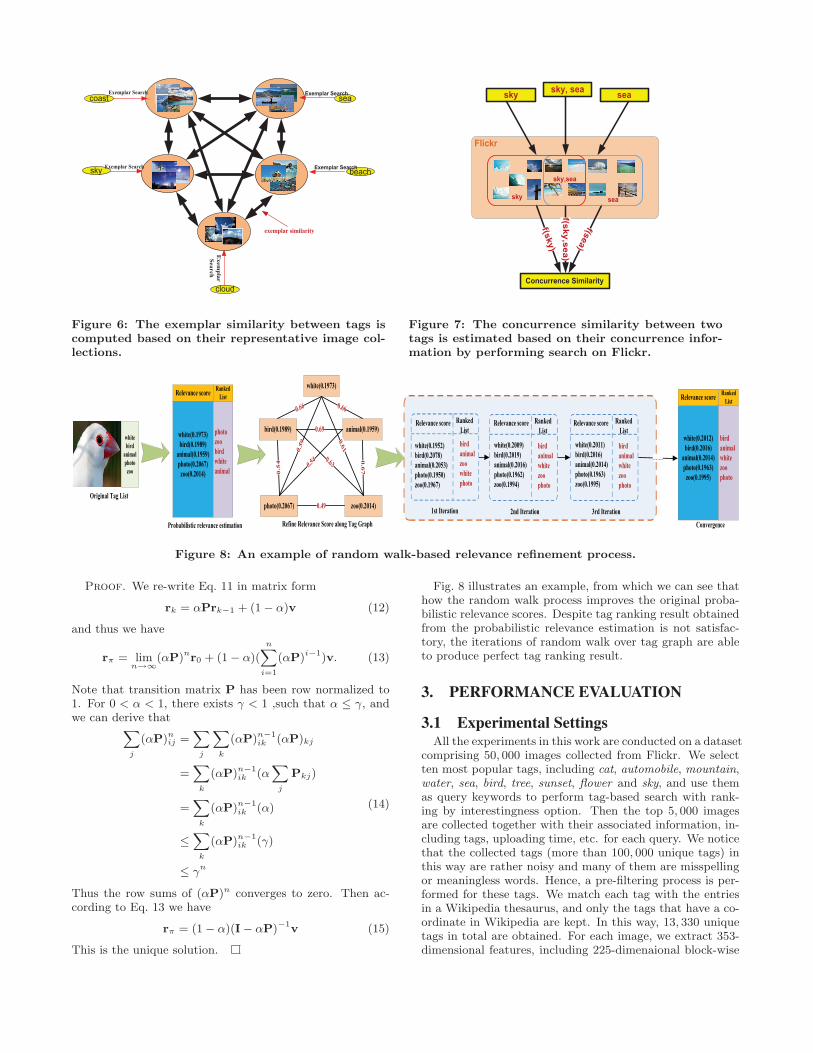
Note that here we have used the same radius parameter σas in Eq. 5. The whole process can be illustrated in Fig. 6.
We then define the concurrence similarity between tagsbased on their co-occurrence. Analogous to the principle ofGoogle distance [17], we first estimate the distance betweentwo tags ti and tj as follows.
d(ti, tj) =max(logf(ti), logf(tj)) − logf(ti, tj)
logG − min(logf(ti), logf(tj)))(7)
where f(ti) and f(tj) are the numbers of images containingtag ti and tag tj respectively and f(ti, tj) is the numberof images containing both ti and tj . These numbers can beobtained by performing search by tag on Flickr website usingthe tags as keywords, as illustrated in Fig. 7. Moreover, Gis the total number of images in Flickr. The concurrencesimilarity between tag ti and tag tj is then defined as
ϕc(ti, tj) = exp(−d(ti, tj)) (8)
To explore the complementary nature of exemplar similarityand concurrence similarity, we combine them as
sij = s(ti, tj) = λ · ϕe(ti, tj) + (1 − λ) · ϕc(ti, tj) (9)
where λ belongs to [0, 1]. In Section 3 we will demonstratethat their combination is better than using each one indi-vidually. The combined similarity is used as the weight ofthe edge between ti and tj in the tag graph.
2.3.2 Random walk over tag graph
Random walk methods have been widely applied in ma-chine learning and information retrieval fields [18, 19, 20].Here we perform random walk process over the tag graph inorder to boost the performance of tag ranking by using therelationship among tags. Given a tag graph with n nodes,we use rk(i) to denote the relevance score of node i at iter-ation k. Thus, the relevance scores of all the nodes in thegraph at iteration k form a column vector rk ≡ [rk(i)]n×1.Denote by P an n-by-n transition matrix. Its element pij
indicates the probability of the transition from node i tonode j and it is computed as
pij =sij∑k
sik
(10)
where sij denotes the pairwise tag similarity(see Eq. 9) be-tween node i and j.
The random walk process is thus formulated as
rk(j) = α∑
i
rk−1(i)pij + (1 − α)vj (11)
where vj is the initial probabilistic relevance score of tagtj , and α is a weight parameter that belongs to (0, 1). Theabove process will promote the tags that have many closeneighbors and weaken isolated tags. Now we prove the con-vergence of the iteration of Eq. 11.
Theorem 1. The iteration of Eq. 11 converges to a fixedpoint rπ.
WWW 2009 MADRID! Track: Rich Media / Session: Tagging and Clustering
354
Exemplar Search
coast sea
beachsky
cloud
Exemplar
Search
exemplar similarity
Exemplar Search Exemplar Search
Exemplar Search
Figure 6: The exemplar similarity between tags iscomputed based on their representative image col-lections.
Flickr
Concurrence Similarity
f(sk
y,s
ea)
sky seasky, sea
f(sky)
f(sea)
seasky
sky,sea
Figure 7: The concurrence similarity between twotags is estimated based on their concurrence infor-mation by performing search on Flickr.
���������������
���������������������������������
�������������
���������� �� !��������"�
�����������#�����$�����%��
�� ��
�� �
��#"
��"�
��#�
�� �
�� �
�� ���#"
&�'����&���������(��������������)����
�����
���$
������
�����
!��
�������������
���$�����%��
�����������#��
���������� ��
!��������"�
�����
!��
���$
�����
������
&��������������&��*�$�
���
�������������
���$������ �
������������"�
���������� ��
!��������#�
���$
������
�����
!��
�����
&��������������&��*�$�
���
���
����+�������� ��$�+�������� ��$�+��������
,����������
&�������������� &��*�$�
���
�������������
���$��������
������������ �
���������� ��
!��������"�
���$
������
�����
!��
�����
&�������������� &��*�$�
���
�������������
���$������ �
������������"�
���������� ��
!��������#�
���$
������
�����
!��
�����
&�������������� &��*�$�
���
����������#��
���$������%�
�����������#��
����������#��
!������� ��
���$
������
!��
�����
�����
Figure 8: An example of random walk-based relevance refinement process.
Proof. We re-write Eq. 11 in matrix form
rk = αPrk−1 + (1 − α)v (12)
and thus we have
rπ = limn→∞
(αP)nr0 + (1 − α)(n∑
i=1
(αP)i−1)v. (13)
Note that transition matrix P has been row normalized to1. For 0 < α < 1, there exists γ < 1 ,such that α ≤ γ, andwe can derive that
∑
j
(αP)nij =
∑
j
∑
k
(αP)n−1ik (αP)kj
=∑
k
(αP)n−1ik (α
∑
j
Pkj)
=∑
k
(αP)n−1ik (α)
≤∑
k
(αP)n−1ik (γ)
≤ γn
(14)
Thus the row sums of (αP)n converges to zero. Then ac-cording to Eq. 13 we have
rπ = (1 − α)(I − αP)−1v (15)
This is the unique solution.
Fig. 8 illustrates an example, from which we can see thathow the random walk process improves the original proba-bilistic relevance scores. Despite tag ranking result obtainedfrom the probabilistic relevance estimation is not satisfac-tory, the iterations of random walk over tag graph are ableto produce perfect tag ranking result.
3. PERFORMANCE EVALUATION
3.1 Experimental SettingsAll the experiments in this work are conducted on a dataset
comprising 50, 000 images collected from Flickr. We selectten most popular tags, including cat, automobile, mountain,water, sea, bird, tree, sunset, flower and sky, and use themas query keywords to perform tag-based search with rank-ing by interestingness option. Then the top 5, 000 imagesare collected together with their associated information, in-cluding tags, uploading time, etc. for each query. We noticethat the collected tags (more than 100, 000 unique tags) inthis way are rather noisy and many of them are misspellingor meaningless words. Hence, a pre-filtering process is per-formed for these tags. We match each tag with the entriesin a Wikipedia thesaurus, and only the tags that have a co-ordinate in Wikipedia are kept. In this way, 13, 330 uniquetags in total are obtained. For each image, we extract 353-dimensional features, including 225-dimenaional block-wise
color moment features generated from 5-by-5 partition ofthe image and a 128-dimensional wavelet texture features.
We use NDCG [21] as the performance evaluation mea-sure. 10, 000 images are randomly selected from our Flickrset for labeling by five persons. For each image, each of itstags is labeled as one of the five levels: Most Relevant (score5), Relevant (score 4), Partially Relevant (score 3), WeaklyRelevant (score 2), and Irrelevant (score 1). Given an imagewith ranked tag list t1, t2, . . . , tn, the NDCG is computedas
Nn = Zn
n∑
i=1
(2r(i) − 1)/log(1 + i) (16)
where r(i) is the relevance level of the ith tag and Zn is anormalization constant that is chosen so that the optimalranking’s NDCG score is 1. After computing the NDCGmeasures of each image’s tag list, we can average them toobtain an overall performance evaluation of the tag rankingmethod. The radius parameter σ in Eq. 5 and Eq. 6 is setto the median value of all pair-wise Euclidean distances be-tween images, and the parameter N in exemplar similaritycomputation in Eq. 6 is empirically set to 50. The param-eters λ and α in Eq. 9 and Eq. 12 are set to 0.8 and 0.5respectively and their sensitivities will be analyzed in detailin section 3.2.
3.2 Experimental ResultsWe compare our proposed tag ranking strategy with the
following two methods in terms of average NDCG.
1. Probabilistic Tag Ranking (PTR). In this method, weuse the relevance score obtained in Eq. 4 without im-plementing random walk among tags;
2. Random Walk-based Tag Ranking (RWTR). We con-duct random walk along the tag correlation graph withvi = 1/n, i.e., do not utilize probabilistic relevance es-timations.
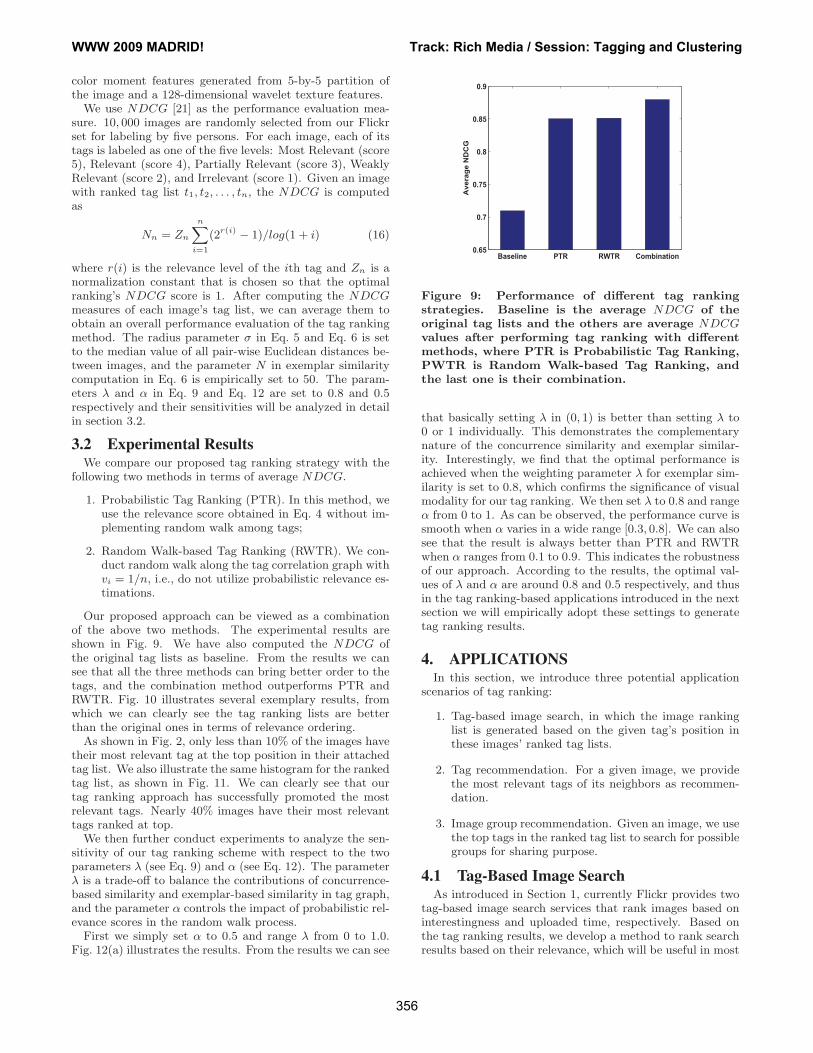
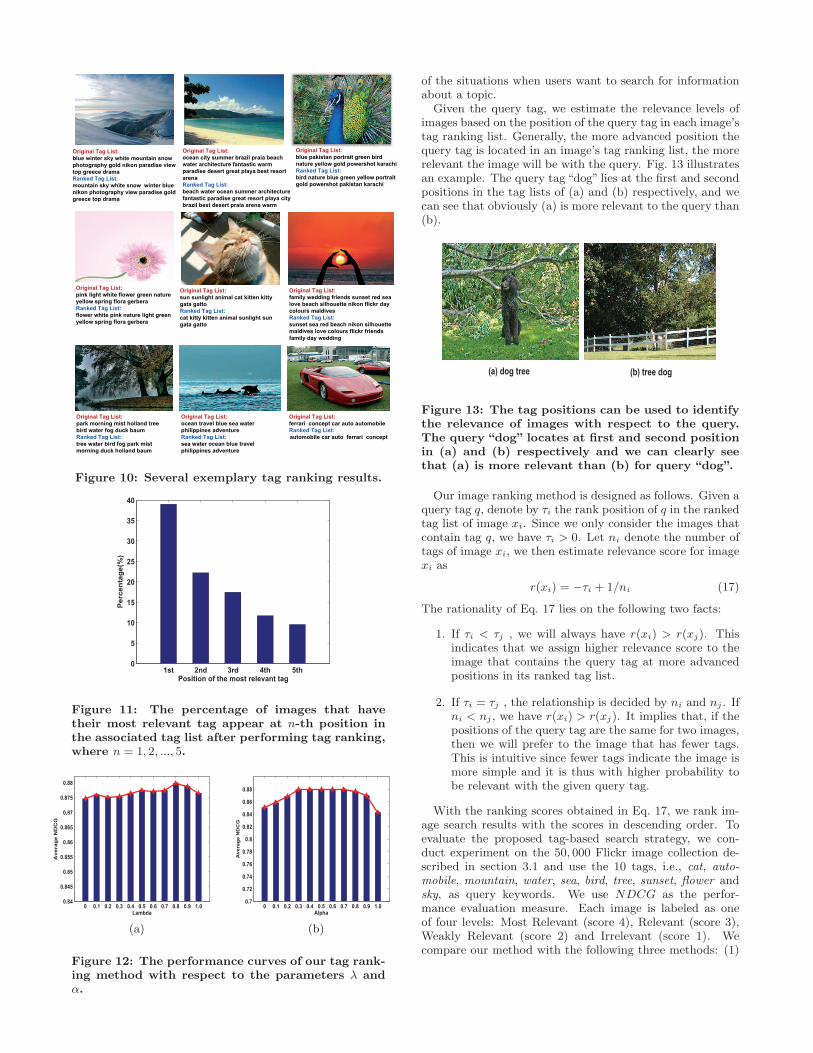
Our proposed approach can be viewed as a combinationof the above two methods. The experimental results areshown in Fig. 9. We have also computed the NDCG ofthe original tag lists as baseline. From the results we cansee that all the three methods can bring better order to thetags, and the combination method outperforms PTR andRWTR. Fig. 10 illustrates several exemplary results, fromwhich we can clearly see the tag ranking lists are betterthan the original ones in terms of relevance ordering.
As shown in Fig. 2, only less than 10% of the images havetheir most relevant tag at the top position in their attachedtag list. We also illustrate the same histogram for the rankedtag list, as shown in Fig. 11. We can clearly see that ourtag ranking approach has successfully promoted the mostrelevant tags. Nearly 40% images have their most relevanttags ranked at top.
We then further conduct experiments to analyze the sen-sitivity of our tag ranking scheme with respect to the twoparameters λ (see Eq. 9) and α (see Eq. 12). The parameterλ is a trade-off to balance the contributions of concurrence-based similarity and exemplar-based similarity in tag graph,and the parameter α controls the impact of probabilistic rel-evance scores in the random walk process.
First we simply set α to 0.5 and range λ from 0 to 1.0.Fig. 12(a) illustrates the results. From the results we can see
Baseline PTR RWTR Combination0.65
0.7
0.75
0.8
0.85
0.9
Avera
ge N
DC
G
Figure 9: Performance of different tag rankingstrategies. Baseline is the average NDCG of theoriginal tag lists and the others are average NDCGvalues after performing tag ranking with differentmethods, where PTR is Probabilistic Tag Ranking,PWTR is Random Walk-based Tag Ranking, andthe last one is their combination.
that basically setting λ in (0, 1) is better than setting λ to0 or 1 individually. This demonstrates the complementarynature of the concurrence similarity and exemplar similar-ity. Interestingly, we find that the optimal performance isachieved when the weighting parameter λ for exemplar sim-ilarity is set to 0.8, which confirms the significance of visualmodality for our tag ranking. We then set λ to 0.8 and rangeα from 0 to 1. As can be observed, the performance curve issmooth when α varies in a wide range [0.3, 0.8]. We can alsosee that the result is always better than PTR and RWTRwhen α ranges from 0.1 to 0.9. This indicates the robustnessof our approach. According to the results, the optimal val-ues of λ and α are around 0.8 and 0.5 respectively, and thusin the tag ranking-based applications introduced in the nextsection we will empirically adopt these settings to generatetag ranking results.
4. APPLICATIONSIn this section, we introduce three potential application
scenarios of tag ranking:
1. Tag-based image search, in which the image rankinglist is generated based on the given tag’s position inthese images’ ranked tag lists.
2. Tag recommendation. For a given image, we providethe most relevant tags of its neighbors as recommen-dation.
3. Image group recommendation. Given an image, we usethe top tags in the ranked tag list to search for possiblegroups for sharing purpose.
4.1 Tag-Based Image SearchAs introduced in Section 1, currently Flickr provides two
tag-based image search services that rank images based oninterestingness and uploaded time, respectively. Based onthe tag ranking results, we develop a method to rank searchresults based on their relevance, which will be useful in most
WWW 2009 MADRID! Track: Rich Media / Session: Tagging and Clustering
356
���������������
������������������������������������
�������������������������������������
����������������
�������������
�������������������������������������
�������������������������������������
����������������
���������������
�������������������������������������
����������������������������������
����������������������������������������
�����
�������������
��������������������������������������
�������������������������������������������
�����������������������������������
���������������
����������������������������������
������������������������������������
�������������
���������������������������������������
�������������������������������
���������������
�������������������������������������
���������������������������
�������������
�������������������������������������
���������������������������
���������������
�������������������������������������
����������
�������������
�������������������������������������
����������
���������������
��������������������������������������
���������������������������������������
����������������
�������������
��������������������������������������
�������������������������������������
������������������
���������������
�������������������������������
������������������������
�������������
������������������������������
�������������������������
���������������
����������������������������
���������������������
�������������
����������������������������
���������������������
���������������
������������������������������������
�������������
�������������������������������������
Figure 10: Several exemplary tag ranking results.
1st 2nd 3rd 4th 5th0
5
10
15
20
25
30
35
40
Position of the most relevant tag
Perc
en
tag
e(%
)
Figure 11: The percentage of images that havetheir most relevant tag appear at n-th position inthe associated tag list after performing tag ranking,where n = 1, 2, ..., 5.
0 0.1 0.2 0.3 0.4 0.5 0.6 0.7 0.8 0.9 1.00.84
0.845
0.85
0.855
0.86
0.865
0.87
0.875
0.88
Lambda
Av
era
ge
ND
CG
(a)
0 0.1 0.2 0.3 0.4 0.5 0.6 0.7 0.8 0.9 1.00.7
0.72
0.74
0.76
0.78
0.8
0.82
0.84
0.86
0.88
Alpha
Avera
ge N
DC
G
(b)
Figure 12: The performance curves of our tag rank-ing method with respect to the parameters λ andα.
of the situations when users want to search for informationabout a topic.
Given the query tag, we estimate the relevance levels ofimages based on the position of the query tag in each image’stag ranking list. Generally, the more advanced position thequery tag is located in an image’s tag ranking list, the morerelevant the image will be with the query. Fig. 13 illustratesan example. The query tag “dog” lies at the first and secondpositions in the tag lists of (a) and (b) respectively, and wecan see that obviously (a) is more relevant to the query than(b).
(a) dog tree (b) tree dog
Figure 13: The tag positions can be used to identifythe relevance of images with respect to the query.The query “dog” locates at first and second positionin (a) and (b) respectively and we can clearly seethat (a) is more relevant than (b) for query “dog”.
Our image ranking method is designed as follows. Given aquery tag q, denote by τi the rank position of q in the rankedtag list of image xi. Since we only consider the images thatcontain tag q, we have τi > 0. Let ni denote the number oftags of image xi, we then estimate relevance score for imagexi as
r(xi) = −τi + 1/ni (17)
The rationality of Eq. 17 lies on the following two facts:
1. If τi < τj , we will always have r(xi) > r(xj). Thisindicates that we assign higher relevance score to theimage that contains the query tag at more advancedpositions in its ranked tag list.
2. If τi = τj , the relationship is decided by ni and nj . Ifni < nj , we have r(xi) > r(xj). It implies that, if thepositions of the query tag are the same for two images,then we will prefer to the image that has fewer tags.This is intuitive since fewer tags indicate the image ismore simple and it is thus with higher probability tobe relevant with the given query tag.
With the ranking scores obtained in Eq. 17, we rank im-age search results with the scores in descending order. Toevaluate the proposed tag-based search strategy, we con-duct experiment on the 50, 000 Flickr image collection de-scribed in section 3.1 and use the 10 tags, i.e., cat, auto-mobile, mountain, water, sea, bird, tree, sunset, flower andsky, as query keywords. We use NDCG as the perfor-mance evaluation measure. Each image is labeled as oneof four levels: Most Relevant (score 4), Relevant (score 3),Weakly Relevant (score 2) and Irrelevant (score 1). Wecompare our method with the following three methods: (1)
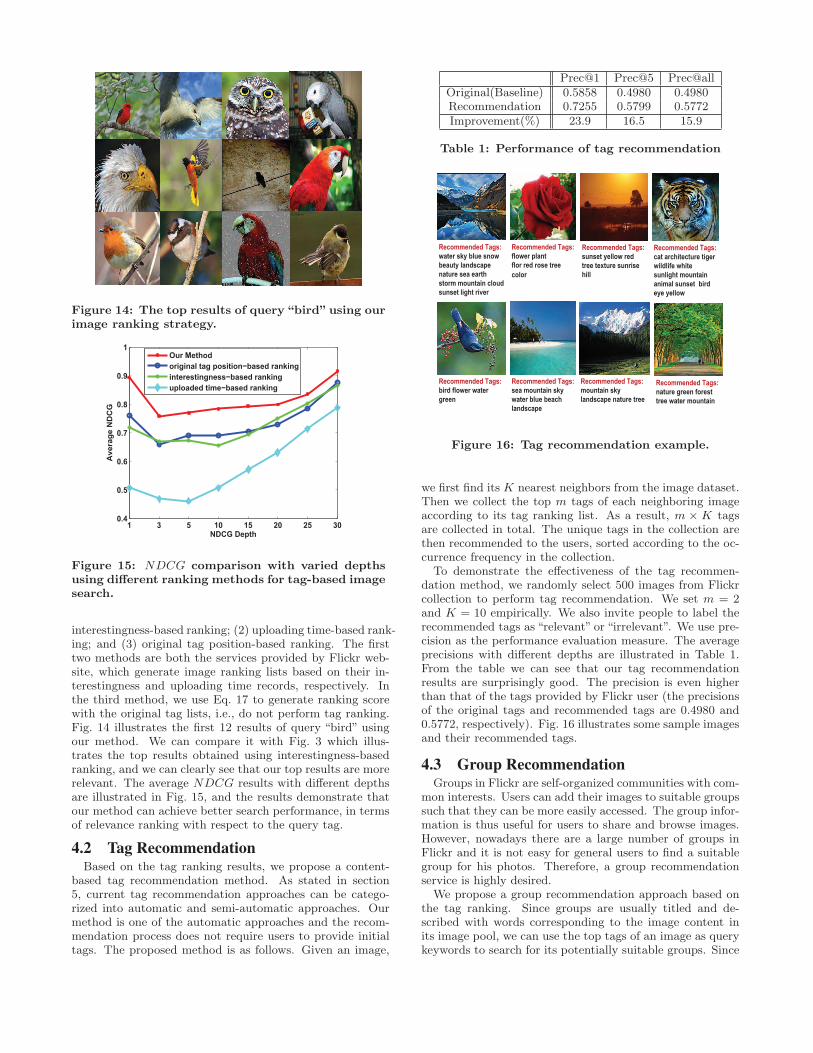
Figure 14: The top results of query“bird”using ourimage ranking strategy.
1 3 5 10 15 20 25 300.4
0.5
0.6
0.7
0.8
0.9
1
NDCG Depth
Avera
ge N
DC
G
Our Method
original tag position−based ranking
interestingness−based ranking
uploaded time−based ranking
Figure 15: NDCG comparison with varied depthsusing different ranking methods for tag-based imagesearch.
interestingness-based ranking; (2) uploading time-based rank-ing; and (3) original tag position-based ranking. The firsttwo methods are both the services provided by Flickr web-site, which generate image ranking lists based on their in-terestingness and uploading time records, respectively. Inthe third method, we use Eq. 17 to generate ranking scorewith the original tag lists, i.e., do not perform tag ranking.Fig. 14 illustrates the first 12 results of query “bird” usingour method. We can compare it with Fig. 3 which illus-trates the top results obtained using interestingness-basedranking, and we can clearly see that our top results are morerelevant. The average NDCG results with different depthsare illustrated in Fig. 15, and the results demonstrate thatour method can achieve better search performance, in termsof relevance ranking with respect to the query tag.
4.2 Tag RecommendationBased on the tag ranking results, we propose a content-
based tag recommendation method. As stated in section5, current tag recommendation approaches can be catego-rized into automatic and semi-automatic approaches. Ourmethod is one of the automatic approaches and the recom-mendation process does not require users to provide initialtags. The proposed method is as follows. Given an image,
Prec@1 Prec@5 Prec@allOriginal(Baseline) 0.5858 0.4980 0.4980Recommendation 0.7255 0.5799 0.5772Improvement(%) 23.9 16.5 15.9
Table 1: Performance of tag recommendation
Recommended Tags:
water sky blue snow
beauty landscape
nature sea earth
storm mountain cloud
sunset light river
Recommended Tags:
flower plant
flor red rose tree
color
Recommended Tags:
sunset yellow red
tree texture sunrise
hill
Recommended Tags:
cat architecture tiger
wildlife white
sunlight mountain
animal sunset bird
eye yellow
Recommended Tags:
bird flower water
green
Recommended Tags:
sea mountain sky
water blue beach
landscape
Recommended Tags:
mountain sky
landscape nature tree
Recommended Tags:
nature green forest
tree water mountain
Figure 16: Tag recommendation example.
we first find its K nearest neighbors from the image dataset.Then we collect the top m tags of each neighboring imageaccording to its tag ranking list. As a result, m × K tagsare collected in total. The unique tags in the collection arethen recommended to the users, sorted according to the oc-currence frequency in the collection.
To demonstrate the effectiveness of the tag recommen-dation method, we randomly select 500 images from Flickrcollection to perform tag recommendation. We set m = 2and K = 10 empirically. We also invite people to label therecommended tags as “relevant” or “irrelevant”. We use pre-cision as the performance evaluation measure. The averageprecisions with different depths are illustrated in Table 1.From the table we can see that our tag recommendationresults are surprisingly good. The precision is even higherthan that of the tags provided by Flickr user (the precisionsof the original tags and recommended tags are 0.4980 and0.5772, respectively). Fig. 16 illustrates some sample imagesand their recommended tags.
4.3 Group RecommendationGroups in Flickr are self-organized communities with com-
mon interests. Users can add their images to suitable groupssuch that they can be more easily accessed. The group infor-mation is thus useful for users to share and browse images.However, nowadays there are a large number of groups inFlickr and it is not easy for general users to find a suitablegroup for his photos. Therefore, a group recommendationservice is highly desired.
We propose a group recommendation approach based onthe tag ranking. Since groups are usually titled and de-scribed with words corresponding to the image content inits image pool, we can use the top tags of an image as querykeywords to search for its potentially suitable groups. Since
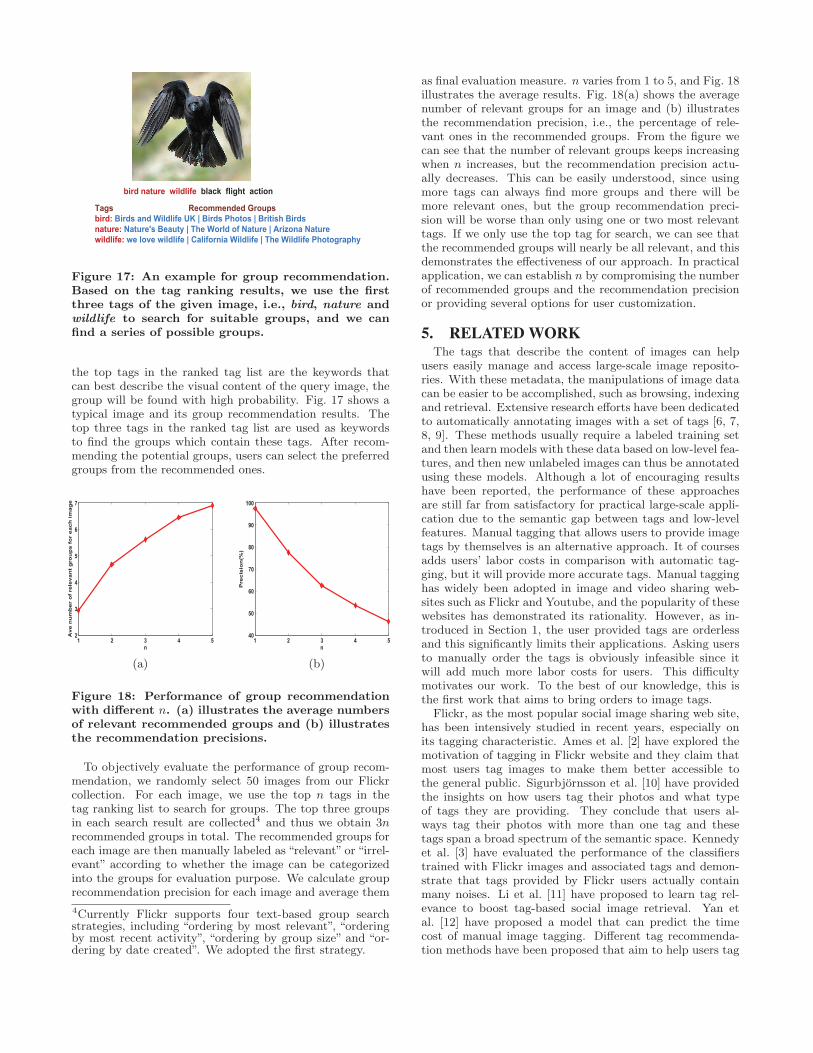
bird nature wildlife black flight action
Tags Recommended Groups
bird: Birds and Wildlife UK | Birds Photos | British Birds
nature: Nature's Beauty | The World of Nature | Arizona Nature
wildlife: we love wildlife | California Wildlife | The Wildlife Photography
Figure 17: An example for group recommendation.Based on the tag ranking results, we use the firstthree tags of the given image, i.e., bird, nature andwildlife to search for suitable groups, and we canfind a series of possible groups.
the top tags in the ranked tag list are the keywords thatcan best describe the visual content of the query image, thegroup will be found with high probability. Fig. 17 shows atypical image and its group recommendation results. Thetop three tags in the ranked tag list are used as keywordsto find the groups which contain these tags. After recom-mending the potential groups, users can select the preferredgroups from the recommended ones.
1 2 3 4 52
3
4
5
6
7
n
Av
e n
um
be
r o
f re
lev
an
t g
ro
up
s f
or e
ac
h i
ma
ge
(a)
1 2 3 4 540
50
60
70
80
90
100
n
Pre
cis
ion
(%)
(b)
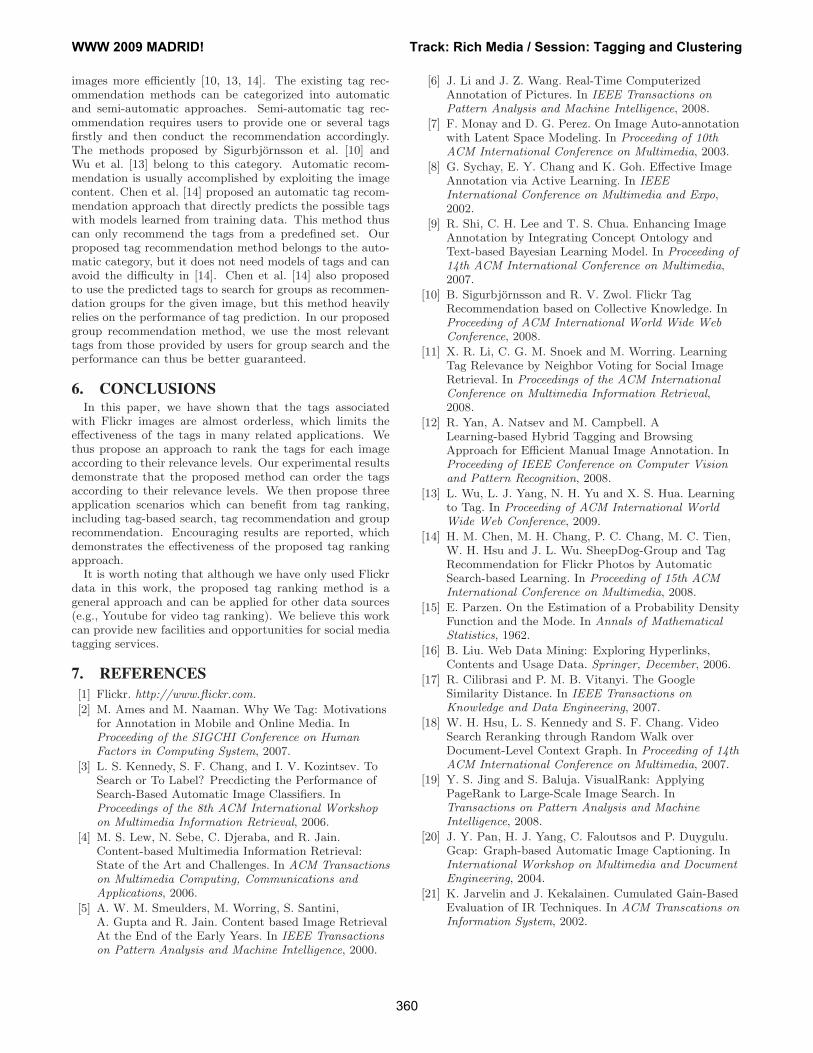
Figure 18: Performance of group recommendationwith different n. (a) illustrates the average numbersof relevant recommended groups and (b) illustratesthe recommendation precisions.
To objectively evaluate the performance of group recom-mendation, we randomly select 50 images from our Flickrcollection. For each image, we use the top n tags in thetag ranking list to search for groups. The top three groupsin each search result are collected4 and thus we obtain 3nrecommended groups in total. The recommended groups foreach image are then manually labeled as “relevant” or “irrel-evant” according to whether the image can be categorizedinto the groups for evaluation purpose. We calculate grouprecommendation precision for each image and average them
4Currently Flickr supports four text-based group searchstrategies, including “ordering by most relevant”, “orderingby most recent activity”, “ordering by group size” and “or-dering by date created”. We adopted the first strategy.
as final evaluation measure. n varies from 1 to 5, and Fig. 18illustrates the average results. Fig. 18(a) shows the averagenumber of relevant groups for an image and (b) illustratesthe recommendation precision, i.e., the percentage of rele-vant ones in the recommended groups. From the figure wecan see that the number of relevant groups keeps increasingwhen n increases, but the recommendation precision actu-ally decreases. This can be easily understood, since usingmore tags can always find more groups and there will bemore relevant ones, but the group recommendation preci-sion will be worse than only using one or two most relevanttags. If we only use the top tag for search, we can see thatthe recommended groups will nearly be all relevant, and thisdemonstrates the effectiveness of our approach. In practicalapplication, we can establish n by compromising the numberof recommended groups and the recommendation precisionor providing several options for user customization.
5. RELATED WORKThe tags that describe the content of images can help
users easily manage and access large-scale image reposito-ries. With these metadata, the manipulations of image datacan be easier to be accomplished, such as browsing, indexingand retrieval. Extensive research efforts have been dedicatedto automatically annotating images with a set of tags [6, 7,8, 9]. These methods usually require a labeled training setand then learn models with these data based on low-level fea-tures, and then new unlabeled images can thus be annotatedusing these models. Although a lot of encouraging resultshave been reported, the performance of these approachesare still far from satisfactory for practical large-scale appli-cation due to the semantic gap between tags and low-levelfeatures. Manual tagging that allows users to provide imagetags by themselves is an alternative approach. It of coursesadds users’ labor costs in comparison with automatic tag-ging, but it will provide more accurate tags. Manual tagginghas widely been adopted in image and video sharing web-sites such as Flickr and Youtube, and the popularity of thesewebsites has demonstrated its rationality. However, as in-troduced in Section 1, the user provided tags are orderlessand this significantly limits their applications. Asking usersto manually order the tags is obviously infeasible since itwill add much more labor costs for users. This difficultymotivates our work. To the best of our knowledge, this isthe first work that aims to bring orders to image tags.
Flickr, as the most popular social image sharing web site,has been intensively studied in recent years, especially onits tagging characteristic. Ames et al. [2] have explored themotivation of tagging in Flickr website and they claim thatmost users tag images to make them better accessible tothe general public. Sigurbjornsson et al. [10] have providedthe insights on how users tag their photos and what typeof tags they are providing. They conclude that users al-ways tag their photos with more than one tag and thesetags span a broad spectrum of the semantic space. Kennedyet al. [3] have evaluated the performance of the classifierstrained with Flickr images and associated tags and demon-strate that tags provided by Flickr users actually containmany noises. Li et al. [11] have proposed to learn tag rel-evance to boost tag-based social image retrieval. Yan etal. [12] have proposed a model that can predict the timecost of manual image tagging. Different tag recommenda-tion methods have been proposed that aim to help users tag
images more efficiently [10, 13, 14]. The existing tag rec-ommendation methods can be categorized into automaticand semi-automatic approaches. Semi-automatic tag rec-ommendation requires users to provide one or several tagsfirstly and then conduct the recommendation accordingly.The methods proposed by Sigurbjornsson et al. [10] andWu et al. [13] belong to this category. Automatic recom-mendation is usually accomplished by exploiting the imagecontent. Chen et al. [14] proposed an automatic tag recom-mendation approach that directly predicts the possible tagswith models learned from training data. This method thuscan only recommend the tags from a predefined set. Ourproposed tag recommendation method belongs to the auto-matic category, but it does not need models of tags and canavoid the difficulty in [14]. Chen et al. [14] also proposedto use the predicted tags to search for groups as recommen-dation groups for the given image, but this method heavilyrelies on the performance of tag prediction. In our proposedgroup recommendation method, we use the most relevanttags from those provided by users for group search and theperformance can thus be better guaranteed.
6. CONCLUSIONSIn this paper, we have shown that the tags associated
with Flickr images are almost orderless, which limits theeffectiveness of the tags in many related applications. Wethus propose an approach to rank the tags for each imageaccording to their relevance levels. Our experimental resultsdemonstrate that the proposed method can order the tagsaccording to their relevance levels. We then propose threeapplication scenarios which can benefit from tag ranking,including tag-based search, tag recommendation and grouprecommendation. Encouraging results are reported, whichdemonstrates the effectiveness of the proposed tag rankingapproach.
It is worth noting that although we have only used Flickrdata in this work, the proposed tag ranking method is ageneral approach and can be applied for other data sources(e.g., Youtube for video tag ranking). We believe this workcan provide new facilities and opportunities for social mediatagging services.
7. REFERENCES
[1] Flickr. http://www.flickr.com.
[2] M. Ames and M. Naaman. Why We Tag: Motivationsfor Annotation in Mobile and Online Media. InProceeding of the SIGCHI Conference on HumanFactors in Computing System, 2007.
[3] L. S. Kennedy, S. F. Chang, and I. V. Kozintsev. ToSearch or To Label? Precdicting the Performance ofSearch-Based Automatic Image Classifiers. InProceedings of the 8th ACM International Workshopon Multimedia Information Retrieval, 2006.
[4] M. S. Lew, N. Sebe, C. Djeraba, and R. Jain.Content-based Multimedia Information Retrieval:State of the Art and Challenges. In ACM Transactionson Multimedia Computing, Communications andApplications, 2006.
[5] A. W. M. Smeulders, M. Worring, S. Santini,A. Gupta and R. Jain. Content based Image RetrievalAt the End of the Early Years. In IEEE Transactionson Pattern Analysis and Machine Intelligence, 2000.
[6] J. Li and J. Z. Wang. Real-Time ComputerizedAnnotation of Pictures. In IEEE Transactions onPattern Analysis and Machine Intelligence, 2008.
[7] F. Monay and D. G. Perez. On Image Auto-annotationwith Latent Space Modeling. In Proceeding of 10thACM International Conference on Multimedia, 2003.
[8] G. Sychay, E. Y. Chang and K. Goh. Effective ImageAnnotation via Active Learning. In IEEEInternational Conference on Multimedia and Expo,2002.
[9] R. Shi, C. H. Lee and T. S. Chua. Enhancing ImageAnnotation by Integrating Concept Ontology andText-based Bayesian Learning Model. In Proceeding of14th ACM International Conference on Multimedia,2007.
[10] B. Sigurbjornsson and R. V. Zwol. Flickr TagRecommendation based on Collective Knowledge. InProceeding of ACM International World Wide WebConference, 2008.
[11] X. R. Li, C. G. M. Snoek and M. Worring. LearningTag Relevance by Neighbor Voting for Social ImageRetrieval. In Proceedings of the ACM InternationalConference on Multimedia Information Retrieval,2008.
[12] R. Yan, A. Natsev and M. Campbell. ALearning-based Hybrid Tagging and BrowsingApproach for Efficient Manual Image Annotation. InProceeding of IEEE Conference on Computer Visionand Pattern Recognition, 2008.
[13] L. Wu, L. J. Yang, N. H. Yu and X. S. Hua. Learningto Tag. In Proceeding of ACM International WorldWide Web Conference, 2009.
[14] H. M. Chen, M. H. Chang, P. C. Chang, M. C. Tien,W. H. Hsu and J. L. Wu. SheepDog-Group and TagRecommendation for Flickr Photos by AutomaticSearch-based Learning. In Proceeding of 15th ACMInternational Conference on Multimedia, 2008.
[15] E. Parzen. On the Estimation of a Probability DensityFunction and the Mode. In Annals of MathematicalStatistics, 1962.
[16] B. Liu. Web Data Mining: Exploring Hyperlinks,Contents and Usage Data. Springer, December, 2006.
[17] R. Cilibrasi and P. M. B. Vitanyi. The GoogleSimilarity Distance. In IEEE Transactions onKnowledge and Data Engineering, 2007.
[18] W. H. Hsu, L. S. Kennedy and S. F. Chang. VideoSearch Reranking through Random Walk overDocument-Level Context Graph. In Proceeding of 14thACM International Conference on Multimedia, 2007.
[19] Y. S. Jing and S. Baluja. VisualRank: ApplyingPageRank to Large-Scale Image Search. InTransactions on Pattern Analysis and MachineIntelligence, 2008.
[20] J. Y. Pan, H. J. Yang, C. Faloutsos and P. Duygulu.Gcap: Graph-based Automatic Image Captioning. InInternational Workshop on Multimedia and DocumentEngineering, 2004.
[21] K. Jarvelin and J. Kekalainen. Cumulated Gain-BasedEvaluation of IR Techniques. In ACM Transcations onInformation System, 2002.
WWW 2009 MADRID! Track: Rich Media / Session: Tagging and Clustering
360