taking the pulse at work : an employment relations
TRANSCRIPT
This is a repository copy of Taking the pulse at work : an employment relations scorecard for Australia.
White Rose Research Online URL for this paper:https://eprints.whiterose.ac.uk/151435/
Version: Accepted Version
Article:
Wilkinson, A. orcid.org/0000-0001-7231-2861, Barry, M., Gomez, R. et al. (1 more author) (2018) Taking the pulse at work : an employment relations scorecard for Australia. Journal of Industrial Relations, 60 (2). pp. 145-175. ISSN 0022-1856
https://doi.org/10.1177/0022185617748990
Wilkinson, A., Barry, M., Gomez, R., & Kaufman, B. E. (2018). Taking the pulse at work: Anemployment relations scorecard for Australia. Journal of Industrial Relations, 60(2), 145–175. © The Authors. https://doi.org/10.1177/0022185617748990. Article available under the terms of the CC-BY-NC-ND licence (https://creativecommons.org/licenses/by-nc-nd/4.0/).
[email protected]://eprints.whiterose.ac.uk/
Reuse
This article is distributed under the terms of the Creative Commons Attribution-NonCommercial-NoDerivs (CC BY-NC-ND) licence. This licence only allows you to download this work and share it with others as long as you credit the authors, but you can’t change the article in any way or use it commercially. More information and the full terms of the licence here: https://creativecommons.org/licenses/
Takedown
If you consider content in White Rose Research Online to be in breach of UK law, please notify us by emailing [email protected] including the URL of the record and the reason for the withdrawal request.
1
Taking the Pulse at Work: An Employment Relations Scorecard for Australia
INTRODUCTION
The need to understand and resolve the many “labour problems” that emerged across industrialised nations in the late
nineteenth/early twentieth century was central to the birth of the field of industrial relations (Feldman, 1928; Derber,
1967; Ackers and Wilkinson, 2003; Kaufman, 1993, 2004). Although the origins of industrial relations/employment
relations (IR/ER)1 analysis and theory date back more than 100 years in Britain to the Webbs (1897) and even further
back to Adam Smith, a series of related events give us cause to see the period leading up to the 1920s as the starting
point for industrial relations as a field of active research and investigation (Commons 1935; Kaufman, 2010). While
academic industrial relations departments were being created in the US, chiefly in Wisconsin in 1920 by the likes of
John Commons, it was Woodrow Wilson’s nine-member Commission on Industrial Relations that first attempted to
comprehensively assess the health of the employment relationship. The Commission’s rationale was reproduced in its Final Report which stated:
That the commission shall inquire into the general conditions of labor in the principal industries of the United States,
[and]…. into existing relations between employers and employees…. The commission shall seek to discover the underlying causes of dissatisfaction in the industrial situation and report its conclusions thereon (CoIR, 1916:6).
The report was commissioned in 1916 to prevent labour-management conflict and to stem deteriorating industrial
relations, which included a violent escalation of the dispute at Colorado Iron and Fuel, dubbed the Ludlow Massacre.
The events surrounding this tragedy induced owner/industrialist, and notable welfare capitalist, J.D. Rockefeller to
employ his own IR counsellor, McKenzie King (later Canadian Prime Minister). It was McKenzie King who
persuaded Rockefeller to create the first corporate industrial relations department at Standard Oil in New Jersey in
1918. This experiment was a testing ground for the welfare capitalism movement and spawned a near-century long
search for company-led systems that could simultaneously improve employee morale and boost workplace
performance.
This study, and the project behind it, are an attempt 100 years later to comprehensively assess the health of the IR/ER
system by “taking the pulse” of the employment relationship. If, as we argue, the relative health and performance of
the employment relationship remains the key dependent variable of the field of ER today, there have been remarkably
few attempts to audit and measure its critical dimensions. This study, founded on a large representative survey of
workers and managers across Australia, the United States, the United Kingdom, and Canada, attempts to do just that,
and produces in this paper, results of those survey questions for Australia. The paper is novel since this kind of
employment diagnostic is based on a unique nationally representative survey of employers and employees. The study
is also innovative, in that it presents the results of the health of the system in the form of an employment relations
scorecard and is the first such attempt to do so in IR.
The significance and relevance of attempting to gauge the relative heath of employment relations is indicated in an
article in the Australian Financial Review (October 24, 2011: 55) that remarks that a “limiting factor [in Australian economic performance] is not necessarily unions, but the difficulties experienced by management in structuring their
relationship with workforces in a positive and collaborative way.” Of worry, since 2000, economic performance as measured by productivity growth has faltered and one suggested explanation is a decline in “unmeasured labour quality” (Dolman, 2009: 257). A number of factors contributing to unmeasured labour quality are included in this project, such as the quality of management, the extent of positive feelings and cooperation between managers and
workers, the work ethic and commitment of employees, and the relative flexibility of trade union practices and labour
law.
A growing body of empirical research has shown (Black and Lynch, 2001; Gittell 2004) that the effect of poor
employment relations also creates many other problems that handicap business and imposes significant costs on
2
workers and society (e.g., labour turnover, absenteeism, workplace injuries, and industrial disputation). However,
getting managers and workers energised and actively partnering together is sufficiently complex and ill-understood
that HRM scholars call the process the “black box” of employment relations research (Becker and Huselid, 2006). By collecting extensive data from workers and managers across all sectors on a wide range employment relationship
dimensions, we hope to shed new light on a number of these issues.
Our paper is, therefore, important and relevant because the topic: (1) is prominent in current-day business, economic,
and policy-making discussions in Australia; (2) has, by some accounts , recently worsened in Australia relative to
major trading partners and consequently threatens the nation’s continued economic growth and prosperity; (3) still remains a poorly understood ‘black box’ in the research literature; and (4) is timely given that current employment relations are accompanied by unprecedented change, pressure, and stress in the workplace (Findlay and Thompson,
2017).
LITERATURE REVIEW
That there has been significant change to Australian employment relations is both undeniable and well documented.
Overall, there has been a shift toward a market-driven model, underpinned by the principles of neo-liberalism (Bray
and Underhill, 2009; Isaac and Lansbury, 2007, Wilkinson et al., 2009). This is most visible in once heavily-unionised
and protected industries, with extensive collective bargaining coverage, which have declined dramatically in recent
decades (Australian Bureau of Statistics, 2014; Pekarek and Gahan, 2016). In an effort to promote increased
competitiveness, regulation through arbitrated awards has been progressively eroded in favour of extensive
decentralisation of bargaining (Mitchell et al., 2010). The IR change process and the proliferation of non-standard
employment arrangements has produced greater disparity across the labour market, and there remains (or indeed we
have seen intensified) evidence of inequality, of which gender inequity has featured prominently in labour market
analysis. Although expected to deliver gains to workers as well as firms, evidence suggests that many of the “returns” from market-driven IR reforms have been captured by employers. For employees, particularly outside the neo-liberal
heartlands and especially those subject to casualization, there is growing wage disparity and employment insecurity
(Watson, 2016).
While there is an extensive literature examining the “structural/institutional” changes to the employment relationship in Australia, our focus is on the state or health of “employment relations” itself. Our study seeks to examine the views of workers and managers, respectively, about current workplace issues and problems. In doing so, our study is one of
a small number of major, nationally representative surveys of Australian employment relations, and builds on other
studies such as those conducted by the Fair Work Commission, and the Australia at Work (AaW) project. Seeking to
fill the data gap on Australian workplace characteristics left after the final AWIRS survey, FWA commissioned its
own Australian Workplace Relations Survey (AWRS). The AWRS results produced in the FWC (2015) First
Findings Report were derived from data on a wide range of employment characteristics and a survey of the views of
employees. In addition, FWA reported, albeit somewhat parenthetically, on management views about issues such as
‘why employers favour certain types of agreements and rosters rather than others’, and ‘whether labour productivity has improved’. Part 6 of the Report contained employee experience indicators, including measures of job satisfaction.
Here the report finds, broadly, that managing work and non-work responsibilities is a key driver of employee job
satisfaction, especially for females who, consistent with the findings of AaW, report higher overall levels of
satisfaction than males. The report also found that quality of work is central to the satisfaction of professional,
scientific and technical employees, compared to employees in mining, construction, and rental, hiring and real estate,
where explicit rewards figure more prominently.
The Australia at Work (AaW) project collected data over five years on labour market and employment characteristics
and outcomes (for example, wages, work hours, job tenure and union status). A short set of questions probed attitudes
about relations between employers and employees. As reported in the project’s Benchmark Report (Van Wanrooy,
Oxenbridge and Buchanan, 2007; also see Fact Sheet No. 15 on the AaW website), conflicting trends are evident.
Overall, the report notes “workers are generally happy with their work and work environment” (p. 85). Underneath
3
this positive picture, however, lies a significant minority of employees who give negative grades to both objective
features of the workplace (for example, work schedules) and subjective features (for example, managers can be
trusted). The report also notes that the employees’ rating of their relationship with the company deteriorates with greater perceived job insecurity, a worrisome finding given the new employment relationship trends noted above.
DATA AND METHODS
The State of the Workplace Employment Relations Survey (SWERS)
The preceding summary provides context for a discussion of the current state of employer-employee relations
in Australia. In assessing the state of ER, we decided to focus on the workplace level, and developed a custom-
designed survey instrument and data set, the State of the Workplace Employment Relations Survey (SWERS), which
collected data in 2016. The SWERS research agenda complements but is different from the AWRS and AaW in
several respects. Whereas AaW surveys a broad and diverse range of labour market and workplace topics (for
example, in the Benchmark Report see Chapter 1, “Awards, Agreements and Contracts at Work”; Ch. 4, “Earnings at Work;” and Ch. 7, “Unions at Work”), our research focusses on a specific subset of topics only modestly covered by
AaW (for example, portions of Ch. 6, “Employees’ Attitudes at Work”). That is, we probe more deeply into the state
of employer-employee relations in Australian workplaces and then go beyond AaW by examining (1) determinants of
these relations, (2) problems that contribute to and grow out of these relations, and (3) consequences of these
problems and relations for firm performance and worker wellbeing.
Similarly, while FWC examines the incidence of arrangements such as flexible work practices and pay structures, and
demonstrates how these vary according to employee demographics such as gender or firmographics such as firm size,
it does not determine how these practices reflect the quality of employment relationships. Therefore, left largely
unanswered is how managers and employees feel about the degree of workplace flexibility or the current method(s) of
payment. Other than by presumption, we cannot ascertain the extent to which low vs. high flexibility reflect employer
prerogative or employee preferences, or whether differences in employee reporting of how pay is determined (either
negotiated with employer vs. set by an award) reflects choice as to the method of payment, or is simply a function of
prevailing practice.
While we seek to probe more deeply into the views of managers and employees about their relationship, another
feature of this study that is novel is the attempt to score the responses to give an overall assessment of the state or
‘health’ of the ER system in Australia. There is no accepted method to do so in ER, so we have borrowed from the balanced scorecard (BSC) approach developed by (Kaplan and Norton, 2001, 2007, 2010). 2 BSC was originally
designed to track the performance of a range of measures linked to business strategy by collecting and evaluating
financial, customer and business processes data. Within the BSC framework there was no specific category for
employee. Instead they figured principally within the learning and growth perspective - in terms of the strategic skills
and knowledge of the workforce to support strategy, and in the cultural shifts required to motivate, empower and align
the workforce behind the strategy (Boxall and Purcell, 2011). Later, Huselid and Becker modified the BSC to produce
an HRM scorecard (Becker and Huselid, 2006) but importantly in this schema, the worker perspective is captured by
examining worker “success” rather than worker “satisfaction”. On this the HR scorecard approach is quite specific: it argues that a strategic choice (or value proposition) should be articulated, such that the workforce can understand and
embrace how the employer intends to be successful in its chosen market (Beattie, Huselid and Schneier, 2003: 109).
In other words, the balanced scorecard does not specifically suggest that employees are stakeholders in their own
right, but only in so far as they can enhance customer satisfaction and financial performance through their ability to
support business strategy – not through any moral perspective.
While acknowledging the usefulness of integrating key HR performance drivers into the strategic management
framework, Boxall and Purcell (2011) are concerned that the balanced scorecard approach does not go far enough in
4
relation to ER. The major concern is that ER is not just about satisfying corporate objectives but also relates to social
legitimacy in terms of compliance with labour laws and the provision of policies that build long-run succession and
development opportunities for managers and workers. As such, it [traditional scorecard measures] continue to reflect
management and organisational interests primarily rather than those of all stakeholders (Marchington et al., 2015).
Accordingly, we have developed an ER scorecard that is designed to test both worker and manager interests within
the employment relationship.
Data Collection.
Data generated from this study comes from a broader project funded by the Australian Research Council
(ARC), Social Science and Humanities Research Council (SSHRC in Canada) and Industrial Relations Counselors
(IRC in the USA) examining ER in Australia, the USA, the UK and Canada including nationally representative
surveys of employees and managers. 3 In assessing the state of ER, we decided to focus on the workplace level, and
developed a custom-designed survey instrument and data set, the State of the Workplace Employment Relations
Survey (SWERS). Unlike the employee voice surveys of Freeman et al. (2007), or the FWC survey, we include both
employees (EME) and employers (EMR) in order to get a wider perspective on the state of the ER, as well as
broadening the focus to the entirety of the employment relationship rather than simply representation and
participation. ‘Employer’ in this case is a manager who, in legal terms, is the employer’s agent.
The employer and employee surveys were given to separate panels of respondents pre-assembled by a professional
organisation survey company, Opinion Research Corporation (ORC), who conducted the survey on our behalf. The
survey research firm, considered the world leader in this technique, has a large panel of employees and managers in
Australia drawing from a sample of HR/personnel managers and based on characteristics of the positive responders
(industry, firm size, etc.). It then blends in requests to other panel members having the needed characteristics until an
(approximately) nationally representative sample is obtained over key observables, which in our case were standard
demographics for employees (age, gender, marital status, immigrant status, education) and for employers
encompassed industry and workplace size. This is in effect a form of ‘quota sampling’ with online (as opposed to telephone) respondents. Quota sampling (Dodge, 2006: 428) does not have a sampling frame and as such does not
generate a response rate since there is no randomly drawn target sample from which a proportion of valid responses
can be drawn. Given that quota sampling is designed to ensure a representative sample across various key
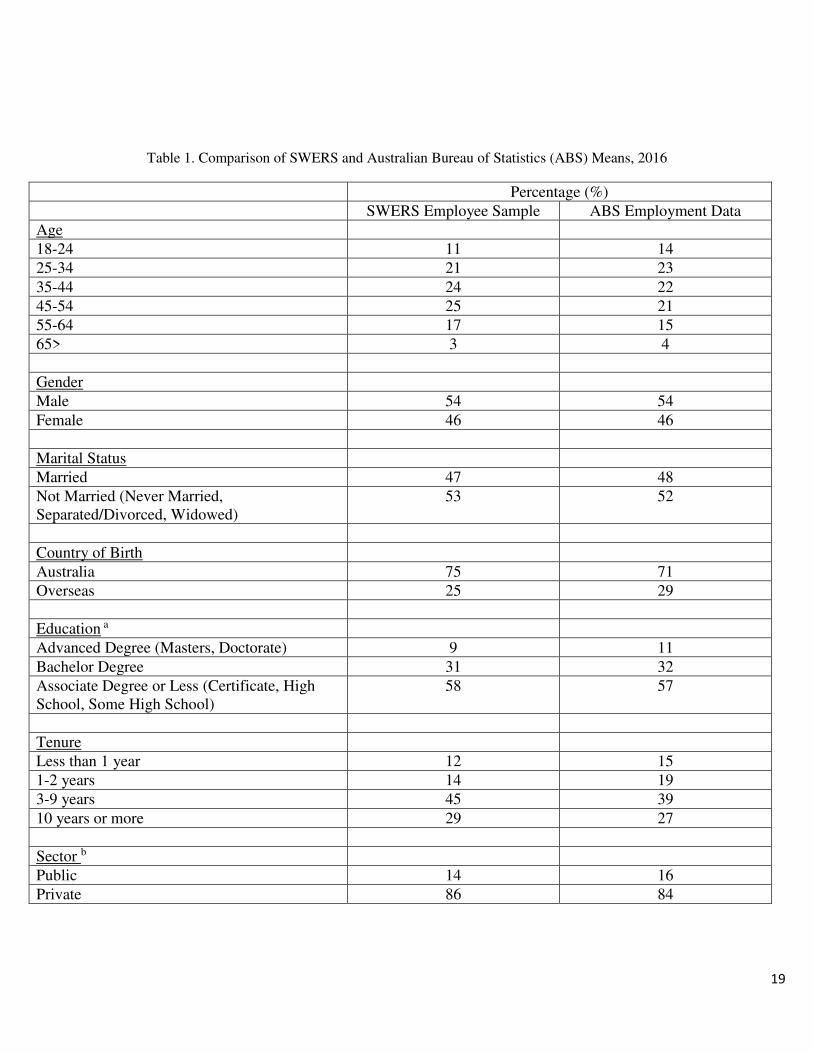
characteristics, it is not surprising – as seen in Table 1 -- that the survey characteristics match very closely the
employee population characteristics as given by the Australian Bureau of Statistics (ABS) figures for 2016.
[Insert Table 1 here]
Each selected respondent then answers our survey online with questions that are as identical as possible to those in the
employee survey with one distinction: the employee questions are typically framed in terms of the person’s workplace while the manager questions are typically framed in terms of the company/organisation, although in both cases
respondents are told if they cannot knowledgeably answer at this level, to drop down to the level where they have
sufficient knowledge about employment practices/relations. The company/workplace distinction introduces some non-
comparability between report cards but employees cannot be expected to give reliable answers beyond their
immediate workplace while upper-level managers and executives should have sufficient knowledge at a higher level
(e.g., entire company for a small-medium sized enterprise; a separate business unit such as a store, plant or office; or
for a business division in a large, multi-facility company).
The surveys were completed in early 2016 with a sample of roughly 1996 employees and 400 employers. Only
workplaces with more than 20 employees were included. This paper uses only the Australian data from SWERS, with
its scores for thirty-nine ER report card performance indicators. The mean and median values of these indicators are
then used to derive a summary numerical score and letter grade indicating the state of the Australian employment
relation on a low-to-high performance scale.
5
Our aim is to obtain far more specific and detailed information than contained in AWIRS and AaW. Thus, rather than
ask employees with one broadly framed question to rate employer-employee relations on a five-point scale, we
construct an employment relations (ER) climate index as a weighted average of responses to nine questions probing
alternative dimensions of employer-employee relations. This index ranks the employing companies from low to high.
We follow this approach with other questions as well.
One issue in getting employees to do rankings relates to their knowledge of business operations. While employees are
unlikely to know hard data on profits, sales, or productivity, our questions probe on qualitative measures of
organisational performance such as operational efficiency, competitive position and whether management has
optimised performance. Confidence in these subjective-type measures is provided by Forth and McNabb (2008) who
find, using WERS data, that they have suitably high correlation with objective data and, indeed, are in some respects
preferred because they capture intangible aspects of performance.4
Assessing the State of the Employment Relation: The ER Scorecard Approach
There is no universally agreed ER assessment framework so our scorecard attempts to develop one. We note that the
first findings report (Fair Work Commission, 2015), provides descriptive data on employee/management practices but
not employer-employee relations as such, or an assessment of overall ER performance. Table 1 therefore presents the
first ER scorecard for Australia. The answers to nearly all the questions in this part of the survey were solicited on a
1-7 scale, typically with 1= lowest/worst and 7 = highest/best (e.g., 1 = lowest quality management, 7 = highest
quality). Thus, we converted the 1-7 numeric answers to an F-to-A letter grade, with grades above F also
distinguished into minus and plus categories (e.g., C-, C, C+). The conversion scale from numeric to letter grade is
made to be as symmetric as possible using the following: 1-2.59 = F; 2.6-3.59 = D, 3.6-4.59 = C, 4.6-5.59 = B, and
5.6-7 = A. In-between letter grades are further defined using the same symmetric approach (e.g., 3.6-3.93=C-, 3.94-
4.26=C, 4.27-4.59=C+). Negatively-framed questions were inverted so they follow the positive 1-7 scale.
Our report card purports to measure the state of the ER with a set of thirty-nine diagnostics (thirty-three of which are
common across the EME and EMR surveys with six unique to one or the other) covering seven performance areas.
The seven performance areas include: i) Organisational Outcomes; ii) Employee Outcomes; iii) Management Inputs;
iv) Employee Inputs; v) Employer-Employee Relations Climate; vi) Employee Relations Management Practices; and
vii) Community Outcomes. These seven areas are common to both the employer and employee surveys thus giving us
access to both employer and employee perspectives.
As an example of how the 39 diagnostics intersect with our seven performance areas, we will detail how the last three
performance areas are measured beginning with Employer-Employee Relations (EER) climate. Nine of the thirty-nine
dimensions are used to capture the EER climate. These include measures for whether: i) employees are treated fairly
and humanely (EME survey only); ii) management’s receptivity to hearing employees gripes and problems; iii) relations between managers and employees; iv) organisation has a family/partnership feeling; v) organisation has little
conflict and infighting; vi) level of employee morale; vii) the employees’ connection and interest with what management says and does; viii) employees collaborate/cooperate with managers (EMR only); and (ix) the
organisation is a good place to work for women, minority, and LGBT employees (EME only, average of two separate
questions).
Next is Employee Relations Management practices which are captured using seven of the thirty-nine items and
include measures of: i) employee voice; ii) employee listening and opinion methods; iii) effective dispute resolution;
iv) effective/extensive internal communication with employees; v) management style is collaborative/commitment;
vi) management uses positive motivation that emphasises hope of gain over fear of negative consequences; and vii)
there is a perception by employees that HR is a value-added function at the workplace (EMR only).
Finally, Community Outcomes attempts to capture social stakeholder performance on groups such as customers,
families, and the local community. Three diagnostic measures are used including: i) the organisation has
6
happy/satisfied customers; ii) organisation provides employees with flexible working arrangements; and iii)
organisation ranks high in community involvement and social responsibility.
Report card mean and median values are reported across all 39 individual diagnostic areas given that means and
medians can diverge for distributions having considerable skewness. The individual means and medians are then
averaged for the seven areas to provide sub-section scores as well as an overall average score (our eighth section).
Based on the numerical scores, and using the conversion scale described earlier, corresponding report card letter
grades are also listed for each question, section, and the overall report.
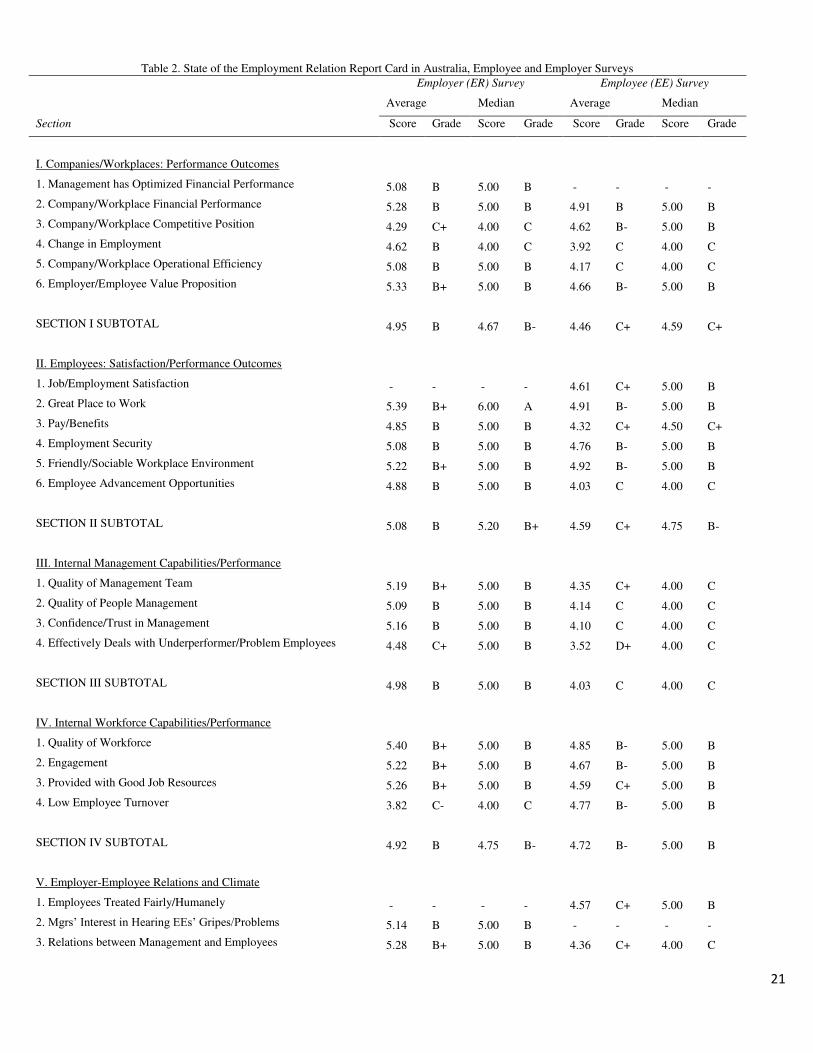
The overall numerical score and letter grade at the bottom of Table 2 provides our project’s summary diagnostic measure of the health and performance of the Australian employment relationship, as rated respectively by employers
and employees. The overall scores and grades are the average of the mean and median responses across all thirty-nine
individual components and, thus, in effect assign equal weights to each item.
Before we go into the key findings, it is worth noting that for all individual scores and the overall score, we focus on
mean results and only discuss selected cases where median scores diverge.
[Insert Table 2 here]
RESULTS AND FINDINGS
What is evident from Table 2 is that employers and employees have rather different perspectives on the state of ER.
Of the thirty-three individual indicators spanning both EMR and EME columns, employer and employee mean letter
grades are not the same in ANY cases. For twenty-eight indicators, the mean score given by employers is at least one
plus/minus grade higher than given by the employees, and in only four cases is the employers’ mean score lower (company competitive position, employee turnover, conflict and infighting, and employee connection with what
management says/does). So, employers have a more positive assessment of the state of the ER than do employees.
The largest gap is for Section VI. Item 5 “collaborative/commitment management style” where employer rating is B
and employee rating is C-. Looking over the grades in the entire table, thirty-one of the thirty-five employer grades
are in the B or A range while for employees only 11 grades are in the B or A range and disturbingly almost all (10)
are a B minus.
The overall score for the state of ER from employers is 4.97, which translates into a report card grade of B. The score
from employees is 4.40, which comes in as a C plus. When we look at the overall scores measured by the median
instead of mean response (the median numerical score for each question cumulated and then averaged), neither of the
grades change.
If one compares the EE and EMR scores in Table 2, two features of the table stand out; respectively, the higher mean
scores given by employer respondents and, second, the larger dispersion in EE scores which range from 3.08 to 5.62
compared to EMR scores of 3.98 to 6.06. Using the employer data, the overall mean grade is B and only employer
respondents in the top (90th) percentile have scores in the A range. The overall mean for employees is C+ with a more
pronounced low end where scores in the bottom 30th percentile are in the D range.
These features are clearly evident when we plot the percentile distributions of overall scores for employers and
employees. In Figure 1 (available in the Online Appendix5), by comparing the bar graphs for employers and
employees, we see the positive employer skew in scores relative to the employee responses. It is not until the 40th
percentile of the employee scores, for example, that average employee scores surpass those of the employer’s bottom 10th percentile score. This is graphic evidence that employers and employees do not see the Australian employment-
relationship in the same way.
One note of caution in these preliminary findings is that our employer responses, because they are solicited by senior
management, may be based on their assessment of the “core” workforce for whom better workplace relations and
7
practices are more common. That is, it may be that by construction the survey has found a divergence between
employees and their employers due to the fact that key employee groups are treated better than others, so one would
expect higher manager ratings (consistent with the results presented here). In practice, however, the wording of each
sectional survey descriptor actually varied between asking senior managers/owners for assessments of the
organization as a whole versus focusing on the largest most representative employee group.6
So although the source of the employer-employee divergence in scores is definitely a legitimate issue, the fact that
there were actually a greater number of scorecard questions that asked the senior manager to report on the company as
a whole (Sections I, III, V and VII) versus modulating answers for the largest group of applicable employees (Section
II ,IV, VI) lends some credence to the notion that there are ‘real’ perceptual differences between employers and employees as to the state of health of the Australian workplace. The possibility that these differences are reflective of
real differences in treatment amongst employees within an organization is equally not negated and is perhaps one
reason why we see such noticeable differences employers and employees.
ER Scorecard Differences by Individual Respondent Characteristics (Gender, Education, Occupation,
and Union Status).
An important question is whether evaluations of the state of ER differ according to some key categories. Table 3
reports (available in the Online Appendix7), results on socio-demographic differences by gender, education,
occupation, and union status.
For each of the thirty-nine measures, a multiple-regression estimation was conducted with the item score as the
dependent variable and a binary 0/1 variable as the key independent variable with 0 = respondents in the base group
and 1 = respondents in the comparison group.8 For gender, base = female and comparison = male; for education, base
= high school degree or less and comparison = above high school; for occupation, base = blue collar/service and
comparison = white collar and for union status base = not covered by collective bargaining contract and comparison =
covered by collective bargaining contract.9
Table 3 vertically displays the thirty-nine report card questions with three different entries for each cell: NA (not
applicable because the question is not asked in the survey), a dash (-) indicating no statistical difference in means
across base/comparison groups (at 95% confidence level), and a number expressed at two decimal points which
represents the difference in mean scores between comparison and base groups when the difference is statistically
different at the 5% level. Thus, for example, the male-female entry for Section 1, Question 5 under employee survey
column means the average score given to this question is -0.23 lower when the respondent is male relative to female.
In other words, female employees are significantly more likely to respond positively than men when asked about the
operational efficiency of their workplace or company.
More generally, amongst the four respondent attribute columns, the number of statistically significant differences in
mean scores on a high-low scale starts with occupation at top (32 out of 35 questions), union status second (18 out of
35) gender (11out of 35), and education lowest (4 out of 35). The differences between each comparison grouping
(e.g., male vs female; HS or above vs Below HS; White Collar vs Blue Collar; and Union vs Non-Union) are
generally what would be expected.
Of the thirty-two numerical scores in the occupation column, only one is negative meaning that most white-collar
workers view their workplaces and mangers more favourably than do blue-collar/service workers. Thus, white-collar
respondents reports, on average, higher job/work satisfaction, job security, trust in management, engagement, and ER
climate than blue collar counterparts. Similarly, union workers report higher pay and benefits and job security, as one
might expect, but lower quality of management, confidence in management, fair treatment, and ER climate scores
than non-union respondents. In the employee and employer survey, men give more positive scores for most questions
(where statistically different) but in the employer survey (column 1 of Table 4), gender makes an impact on fewer
measures.
8
And while we feel it is appropriate not to focus on differences that are statistically insignificant, Table 3 results
implicitly suggest that any statistically significant differences are meaningful from a practical perspective. For
example, is a -0.18 coefficient (found between male v. female for great place to work in Column 2 Table 3) a
meaningful difference in practice? Is it large enough for managers to be concerned with? We think, as a guide, a 0.18
difference is meaningful as it represents a 3 percent change in score relative to the 7 point scale responses and we
think this meets a minimum standard of importance. For example the 0.45 difference between white collar and blue
collar workers is reflective of a 7 percent difference with respect to the 7 point scale. These examples are perhaps at
the low end of the importance spectrum since we also see differences (when looking at firm characteristics in Table 4
below) greater than 1, which are reflective of a full point (or 15 percent change) in the 7 point scale used.
ER Scorecard Differences by Firm Characteristics (firm size, industry, type and presence of worker
representation).
Perhaps an even more compelling question is whether evaluations of the state of employment relations differs
according to some key workplace characteristics. This was, after all, the finding of Bryson and Freeman (2013) when
they estimated perceived workplace problems on the part of employees. In their study, workplace characteristics were
the more important predictor of whether a worker thought their employer was ‘good’ or ‘bad’. We report scorecard results by firm size, industry, firm type and presence of collective representation for employers and employees
respectively.
Table 4 reports (available in the Online Appendix10), on each of the thirty-nine questions asked of employers, where
we again (as in Table 3) conducted a statistical test to determine if the mean score reported by respondents differs
according to each of the four firm/workplace attributes. For each question, a multiple-regression was estimated with
the individual’s score as the dependent variable and a binary 0/1 variable as the independent variable with 0 = respondents in the base group and 1 = respondents in the comparison group. For firm size, base = small (fewer than
500 employees) and comparison = large (500 or more employees); for industry, base = all non-manufacturing
industries and comparison = manufacturing; for type of firm, base = all not for profit enterprises and comparison =
private for profit.
In terms of worker representation, several measures across the EMR and EME surveys are available. In the employer
survey, because we asked managers whether their workplace was unionised, we have as base = no union present and
comparison = union present. For employees, we have a question capturing the presence of a non-union employee
consultative committee, so our base is = no non-union consultative committee and comparison = a non-union
consultative committee is present. It should be noted that the question concerning the presence of internal consultation
was asked of employers and employees and was not mutually exclusive of the presence of a union. In other words
some unionised firms have joint consultative committees that function independently of the collective bargaining
process and this question was designed to pick that up. This facet of the survey is exploited more fully in our
regression results (See Tables 8-11). 11
What did we find for employers?
In Table 4, we see that firm size is generally not a significant differentiator, but where it is significant, the coefficients
are negative meaning that managers in large employers are less positive about the items on the scorecard than
respondents in smaller enterprises. For example, the employee connection with what management says/does (item 7
under Section V) is highly negative (-0.45), suggesting that larger employers are having a harder time convincing
employees that they are on the same page.
Unlike firm size, a column with a lot of significant results was firm-type (Column 3). Here we divided firms into
private, for-profit firms and the rest, which included not-for-profit, government agencies and broader public sector
employers like hospitals, schools and so on. Here the clear result is that employers in the private, for-profit sector are
much more positive about the state of ER than employers elsewhere. Apart from worrying more about the company’s competitive position (-0.28), experiencing higher turnover and employee retention concerns (-0.50 and -0.58
9
respectively), and again sensing that there is a lack of connection/interest with what management says does (-0.43), all
other responses tilted positive.
In the last column of Table 4 the results were mixed. Union presence was associated with the strongest negative
relationship between management getting employees to connect with what management says and does (-1.04). It was
also the most highly related to conflict (-1.02), and unionised employers were much more concerned about their
competitive position (-0.20). On the other hand, employers in unionised firms were reporting higher positive
employment growth (0.70), had more positive employee advancement opportunities (0.43) and felt (perhaps because
of internal grievance procedures) that they had a better handle on dealing with problem employees.
What did we find for employees?
In Table 5 (available in the Online Appendix12), we find that employees, not surprisingly, see the world in a much
different way than their employers. For example, taking firm size (our first column) we find many more significant
differences between large (500+ employees) and smaller (<500 employees) firms. This column is almost exclusively
negative, suggesting that for most items, employees in large firms perceive management and company outcomes more
negatively than similar employees in smaller firms. The one area where large firms “outperform” smaller firms is in the last item on pay, larger firms pay more than smaller firms. Of note, as seen in Table 4, this is one area of
congruence between management and employees.
As in Table 4, firm type for employees was the most meaningful category, only this time the findings were completely
the opposite of what senior management perceived. Recall that employer respondents in for-profit companies had a
much rosier picture of the health of their workplaces than those in the non-profit and government sector. Not so for
employees, in that respondents working in the private for-profit sector scored significantly lower than employee
respondents in the non-profit and government sectors on almost all items, which is why the column entries are
practically all negative.
Finally in the last column, a really striking result - employees that had a non-union consultative committee were more
positive on almost every aspect of the ER scorecard. The presence of a consultative employee system was by far the
strongest (positive) correlate of scorecard success and merits further investigation. Indeed, we have a particularly
interesting opportunity to look within the union and non-union sectors in order to move beyond simple union/non-
union comparisons. Increasingly, researchers (see Black and Lynch 2001; Gittell et al., 2004) have recognized that
variations within each sector matter in this sense that it is the quality of union and non-union relationships that might
be more important than the average effect of union presence per se.
Multivariate Estimates of the Seven ER Scorecard Outcomes
Since the differences noted in Tables 3 through 5 are based on separate regression equations for each individual
survey item, we do not display the independent relationships between size of firm, profit/non-profit and any other
relevant variables with our outcome measures. Thus, we have obscured the net effects of different variables once
others are controlled for. This is now done in Tables 6 and 7 below. In both tables we create an average (unweighted)
score based on all the items listed under each of the seven ER scorecard sections. So for example, under Section 1
Table 3 of the scorecard (e.g., Company/workplace Performance Outcomes) we have 6 items, each based on a
question asked of employees and all measured on a 7 point scale. We now take those 6 items and estimate the average
(unweighted) sectional score and call this “Company Performance”. This is now our single dependent measure of
Company/workplace Performance, which is regressed against a series of independent variables that include the
categories already employed in Tables 3 through 5 plus additional variables of interest. We do this for all seven
scorecard sections.
[Insert Table 6 here]
10
In Table 6, using employee data only, we see seven columns, each representing a regression conducted for one of the
seven summary scorecard measures. Most independent variables were explained in Tables 3 through 5 and are self-
explanatory but at least two require some elaboration: Private sector actually refers to binary variable capturing all
non-federal, state and local government employees; and Major disruption refers to whether the company/workplace
experienced a major disruptive change over the last several years, such as a restructuring, downsizing, merger-
acquisition, or bankruptcy.
What do we find of interest in our regression estimates of summary employee scorecard outcomes?
The major news is that two workplace/company level variables – Major disruption and Consultative Committee --
have a significant and meaningful association in every regression. The presence of a consultative committee is
uniformly positive with respect to all seven outcomes. There is a positive association with company economic
performance (column 1) through to community performance (column 7). The strongest association is linked to
progressive employment practices (column 6) with a coefficient 1.132 (or 30 percent higher relative to the mean score
of 4.10). This means that employees with consultative committees scored 1.132 higher on employment practices than
observably similar employees without them. Equally strong were the coefficients associated with employment
relations climate (column 5) and employee satisfaction (column 2), each with score coefficients of 0.820 and 0.874
respectively, corresponding to a 20% higher score for employees with consultative committees versus those without.
Interestingly there is even a noticeable association between consultative committees and company performance
(column 1), with a coefficient of 0.443 corresponding to an 11 percent higher performance rating for employees with
committees present versus those without.
The reverse association across all seven scorecard outcomes was found with employees experiencing a major
disruption (e.g., restructuring, downsizing, merger-acquisition, or bankruptcy) at their company/workplace. All
associations were negative and strongly so, with company performance (column 1) being -0.422 (or 11 percent lower
relative to the mean company performance score); employee satisfaction (column 2) being -0.322 (or 8 percent
lower); employment relations climate (column 5) being -0.489 (or 11 percent lower); and assessments of progressive
employment practices (column 6) being -0.341 (or 8 percent lower) for employee respondents facing a major
disruption.
Apart from those two variables all other variables were less uniformly associated (positively or negatively) with the
seven outcome measures. The next most significant predictor was working for a large organization (employing 500 or
more employees), which had four out of seven significant negative relationships -- it seems large organizations (after
controlling for observable characteristics of workers and workplaces) generate a negative association with
employment scorecard outcomes especially employment relations climate (column 5).
Being a union member was associated negatively with most scorecard outcomes, though only two outcomes were
significant (i.e., assessment of management performance (column 3) and employment relations climate (column 5)).
Tenure (i.e., more than 10 years with the same company) and age (i.e., greater than 45 years of age) were negatively
associated with scorecard outcomes, but only significantly so in the case of tenure in terms of assessments of
company performance (column 1), management performance (column 3), employment relations climate (column 5),
and progressive employment practices (column 6). For older workers, employee satisfaction (column 2) and
employment practices (column 6) were negatively associated with age. More experienced workers perhaps have
greater expectations of what an employer can do and/or simply have a more jaundiced view of their employers than
younger workers.
Lastly, for-profit companies were (perhaps unsurprisingly) associated positively with company performance (column
1) but almost nothing else. Private sector firms were significantly associated with community performance (column 7)
but only marginally so (a coefficient of 0.121 or 3 percent more than a public sector organization).
In Table 7 (available in the Online Appendix13), using employer data only, we see the same seven columns, each
representing a regression conducted for one of the seven summary scorecard measures. Most independent variables
11
were explained in Tables 3 through 5 and are self-explanatory, but at least one new variable requires some
elaboration: Top management refers to only the highest level and CEO/Owner designations in our sample of senior
managers. If a manager responded to the employer questions and self-identified as middle-to-lower level
management, we coded them as 0 for the purposes of this analysis. This was done to see if there was any variation
within the management respondents based on level in the organization.
What significant variables of interest emerge in regression estimates of our employer scorecard outcomes?
It turns out where management sits in the organizational hierarchy seems to have a large and positive correlation with
respect to the way it perceives the workplace and its outcomes. Uniformly, top management is associated positively
with all seven ER scorecard outcomes relative to lower level management. The coefficients range from 0.286 for
company performance (column 1) to 0.458 for employment practices (column 6).
The second largest predictor of ER outcomes was private sector with five significantly positive coefficients. Next was
being a for profit employer, which was positive and significantly associated with company performance (column 1),
employee satisfaction (column 2), and management performance (column 3). Large organizations, which had a
modestly negative association amongst employee responses on a number of outcomes, was only significantly
negatively associated with one outcome, employment relations climate (column 5).
Finally, and perhaps most interestingly, union presence was not seen by employers as a significantly negative
predictor of scorecard outcomes. In fact, three important outcomes (company performance, management performance,
and employment practices) were all positively and significantly associated with union presence. This is in keeping
with some well-known findings from the employment relations literature showing that managers familiar with unions
tend to have less of negative view of unions than managers with no contact or experience with unions (Campolieti,
Gomez and Gunderson, 2013). Perhaps, as noted by previous IR scholarship (Verma, 2005), unionised employers’ more positive impressions of unions are rooted in real evaluations of how a company performs with a union in place.
Examining the “Quality” of Union and Non-Union Employment Relationships
In Table 5 it was clear that the presence of some employee representation was by far the strongest (positive) correlate
of scorecard success. It would appear, based on these findings that we have a particularly interesting opportunity to
look within the union and non-union sectors a bit more closely in order to expand upon the simple union/no- union
comparison. Increasingly, researchers (see Black and Lynch 2001; Gittell et al., 2004) have recognized that variations
within each sector matter, in this sense that it is the quality of union and non-union relationships that might be more
important than the average effects of each category.
We approach this question in two ways. First we make use of the consultative committee question present in both
EME and EMR surveys to identify presence of a non-union voice channel at work. For employees, we know whether
they are covered by a union collective agreement. We do not know if the company is entirely unionised but we infer
from the employee union membership/coverage question that there is some form of bargaining present at that
workplace/company. So we can therefore code four mutually exclusive categories of employee voice for each
respondent: i) non-union x no-consultative committee; ii) non-union x consultative committee; iii) union x no
consultative committee; and iv) union x consultative committee. We can think of this as one categorical variable that
scales essentially from little or no formal voice (e.g., no union x no committee) to most formal voice (union x
committee). In-between are the intermediate categories of moderate formal voice provided by just having the
committee or the union present.
For the employer respondents a similar categorical variable is constructed using the same non-union consultative
committee question present in the EMR survey. With regards to union presence in the employer survey, we have
knowledge of whether a union is present or not. We ask employers to estimate whether none or some positive number
of the company is unionised. For those responding “0” we code these as non-union employers and 1 otherwise.
12
We then regress this new four category workplace voice measure (with no union x no consultative committee as the
excluded reference or “base” category) against the seven aggregated ER outcome measures used in regressions found
in Tables 6 and 7 and with the same controls.
Our expectation would be that moving from no voice (No union x No consultative committee) to most voice (Union x
Consultative committee) would engender rising positive coefficient estimates. The question of quality however is
likely answered in our in-between categories of either having a union or consultative committees but not both. We can
also evaluate whether presence of a consultative committee acts as ‘moderator’ of union presence or vice versa.
In Table 8 we report the employee findings.
It is important to compare these results with those found for unionisation and consultative committees found at the
bottom of Table 6, as those initial estimates represent the ‘average’ effect of having each of these institutions present at the workplace, without taking account of the interactions between the two. Take columns (3) and (5), which
estimate employee evaluations of managerial performance and ER climate respectively. In both cases these outcomes
were significantly and negatively related to unionisation. These were in fact the only two outcomes that were
significantly related to union presence. In Table 8 the presence of a union (alone) is again significantly and negatively
associated with managerial performance and ER climate only now, after controlling for the simultaneous presence of
union and a non-union committee, the co-efficient turns even more strongly negative (-0.120 in Table 6 versus -0.169
in Table 8 for management performance and -0.252 in Table 6 versus -0.331 in Table 8).
[Insert Table 8 here]
The reason for these negative results is that the “average union” effect being picked up in Table 6 was actually
masking two effects: the highly negative relationship between being unionised with no formal consultative system,
and the highly positive effect of being unionised in a workplace that has a consultative committee system. This is
picked up in the last row of Table 8 which shows that across the seven ER categories, the effect of having a union and
a consultative committee is strongly positive and significant. This is all being measured against the base category of
no formal voice (i.e., No union x No committee). Interestingly non-union firms with a committee seem to have
equivalent coefficients to those employees responding from workplaces with both voice systems, suggesting that the
presence of consultative committees has a strongly positive moderation effect on union presence.
One can interpret this in several ways but it seems plausible that we are picking up “deep” organizational features in
the workplace-voice variables captured here. In other words, firms offering up voice on their own volition (No Union
x Committee) and in combination (Union x Committee) are likely a “good high-performing employer” even in the
absence of these two intuitions, whereas a unionised workplace that offers up no consultative system is perhaps
emblematic of the “bad performing employer” that is only being held in-check by union presence. Bryson and
Freeman (2013) found that the accumulation of workplace problems was the strongest predictor of desired
unionisation amongst workers. This would explain why employee assessments of management and climate are most
negative in the union only category as compared to the no-voice reference category (No Union x No Committee).
In Table 9 (available in the Online Appendix14) we report the employer findings.
In the equivalent employer Table 7 findings, where we only measured the average effect of union presence with
respect to the seven ER scorecard outcomes, union presence was associated positively with all seven ER scorecard
outcomes. Here the positive relationship between unionisation and ER outcomes continues, but significance is lost in
all but one outcome estimate (company performance). However, by examining the complete set of union and
consultative committee categorizations – with No union x No committee set as the reference category – we see that the
“quality” of union-management relations seems to definitely matter. Workplaces with unions and consultative
committees are associated significantly and positively across all seven outcome measures. The positive association is
also present in workplaces without unions but which have consultee committees. This is an indication that union
13
presence is moderated strongly by the presence of consultative committees, which themselves may be proxies for the
“health and quality’ of the union-management relationship at the firm.
Table 9 results indicate that Australian workplaces lacking in any formal voice score the poorest on key elements of
ER scorecard health. Since employers in the survey are reporting “factually” to the presence (or lack therefor) of these
institutions at the workplace and then separately in the survey on their perception of the ER health and performance of
the organization, it seems plausible to conclude that this lack of employee voice is “causally” linked with negative ER
outcomes, rather than just an association being made in the minds of our employer respondents.
We also mentioned there were two ways to look at the “quality of employment relations” in union and non-union
workplaces. The second approach is to look at the category VI scorecard measures (i.e., Employee Relations
Practices) and create something akin to a high-performance (i.e., transformed/high-road employment relationship)
measure. We do this by taking the seven practices listed under category VI and estimating the median score for this
category. Respondents with scores above the median are placed into a high-performance category and those below
into a low performance/low road work system category. We then create a four way categorical variable that is
combined with union and non-union status. Our excluded reference category is Non-union x Low performance HRM.
In Table 10 we show the employee estimates for two outcomes; one of direct interest to employers (company
performance) and one for employees (employee satisfaction). Here again we find that it matters whether a unionised
employee is responding from a workplace that has employment practices that are considered ‘high road’ versus an employment situation that is stuck in the ‘low road ‘approach. A unionised employee in a low performance workplace
is significantly associated with negative company performance (relative to the respondent in a non-union x low
performance system). However, being unionised is strongly and positively associated with company performance and
employee satisfaction when combined with high-performance employment systems. There is no statistical difference
between union and non-union high-performance workplaces, suggesting that unions are not inhibitors of high
performance effects but neither are they capable, on their own, of reversing the ill associations of a “low road”
employer with respect to key employment relations outcomes.
[Insert Table 10 here]
In Table 11 (available in the Online Appendix15) we show the employer respondent estimates for the same outcomes
above. The difference is that we create our union variable from the employer response to the presence of unionised
employees at the workplace/company; i.e., those employers responding with 0 union members were treated as non-
union and the non-zero estimates assigned a value of 1 and treated as having union presence at the workplace. We
find that the interaction of unions and high-performance employment systems is strongly and significantly associated
with company performance and employee satisfaction. It should be noted that these associations are some of the
largest in the analyses undertaken. So for example, the Union x High Performance HRM coefficient for employee
satisfaction (with all controls included) is 1.415 or 30 percent greater (relative to the mean satisfaction score) than the
excluded reference category of no union presence and low road employment practices.
THE STATE OF AUSTRALIAN ER: HEALTHY OR NEEDING A BOOST?
First, it should be no surprise to students of industrial relations that different parties assess the overall state of ER
differently. Unlike unitarist approaches (i.e., managerial analyses) to the study of work, a long line of critical and
pluralistic ER scholarship has acknowledged that the employment relationship engenders differing interests and can
sometimes produce conflict. It is also probably not a surprise to find that on nearly all measures, senior managers
(employers) gave higher scores on ER than employees. It is true that managers would tend to believe they are good
leaders and communicate well (illusory superiority principle), however, the rating is not just about themselves but
about relations with employees where one might expect to see a less rosy picture. One perspective might put greater
trust in managerial views given their broader perspective, but another might say that ER is only part of their overall
14
set of responsibilities, and a second order one at that, whereas employees’ lived experience provides more accurate
ratings. Any explanation about the underlying cause(s) of differences between manager and worker ratings is
necessarily speculative. However, one possibility is that lower employee ratings reflect changes to the nature of work
and its regulation discussed earlier. The interaction of neo-liberalism and changes in the institutional ER regulatory
environment, which are supportive of employer interests, have been felt broadly in Australia and have been shown to
diminish employee power and create wage and working-condition disadvantages (Watson, 2016). Casualization has
become an undesirable, yet entrenched feature of employment (Watson, 2013).
A striking feature of our scorecard is what the grades are. We found scores from the D to A range across individual
indicators; however, the mean and median scores/grades for the seven main ER functional dimensions were
consistently in the B range for employers and C range for employees. It is also worth noting that the areas where
employees give the lowest grades relate to employee connection and interest in what management says (C-),
management listening/opinion methods (C-) and collaborative/commitment management style (C-). Meanwhile on the
employer side, lowest grades were given to employee connection with what management says/does (D+), little
conflict or infighting (C) and low employee turnover (C-). These grades are cause for concern, for they surely point to
a strong level of disconnect in certain areas of the employment relationship. If, as Boxall (2014) argues, building
alignment with workers is the key strategic imperative to gaining competitive advantage, then these results are
troubling from a performance-management standpoint.
In our scorecard we also provided a bottom line assessment. The employers rating of the health and performance of
the employment relation is, on average, a B (mean /median), while employee’s rate it as a C+ (mean/median). If both
EE and EMR bottom line grades were combined and equally weighted, we would be left with a B minus result. This is
a somewhat uninspiring scorecard for Australian workplaces, which we are told need to move up the value chain
given the proximity to regional markets with low labour costs. If “high performance work systems” are here in
Australia, they are clearly not a significant enough part of the market in terms of boosting these overall numbers. That
said, in our regression estimates, which provide a picture of what is significantly associated with our ER scorecard
measures, we do find considerable variation within union and non-union sectors. Specifically, we find that high
performance work systems (where they exist) are associated –even in the presence of a union-- with higher employee
satisfaction and company performance scores. This is in keeping with what some in the literature have stressed is the
key takeaway from looking inside the ‘black box’; namely that variations within multiple sectors are likely to be more
important than the average effects within a single group.
CONCLUSION
This paper reports the findings from nationally representative surveys of Australian employers and employees. The
results offer mixed evidence and implications for the state of the employment relationship in Australian workplaces.
Some companies and workplaces rate relatively high and others relatively low on ER health and performance, while
the bulk cluster in a middle category rated at a B level by employers and C level by employees. By traditional grading
standards, a C is average and a B is modestly above average, which by the very meaning of ‘average,’ is where we might well expect organisations to cluster. On the other hand, grades of C and B are not encouraging because of the
large gap between the reality of just ‘average’ health and performance and the potential of high health and
performance in the A range. In a world of global competition, average or modestly above-average performance in
employer-employee relations may signal danger ahead for all stakeholders. Our paper also provided some detailed
evidence showing that the presence of formal voice at the workplace matters and that the quality of that workplace
voice – be it union or non-union – plays by far the most significant and important role in determining employee and
employer perceptions of the state of ER health and self-reported performance. We hope that our scorecard measures
and our findings regarding voice will be seen as having wide applicability and a robust measure of employment
relations to be tested in other contexts.

15
16
ACKNOWLEDGMENTS
We would like to thank Guenther Lomas for his excellent RA support and we gratefully acknowledge the support and funding
from the ARC (DP140100194) and from the Industrial Relations Counselors, Inc. (IRC)
REFERENCES
Ackers, P, and A Wilkinson.(2003). Understanding Work and Employment: Industrial Relations in Transition.
Oxford: Oxford University Press.
Australian Bureau of Statistics (2014) Employee, benefits and trade union membership, Australia, August 2013.
Canberra: Australian Bureau of Statistics.Australian Financial Review, 22 October, 55
Beatty RW, Huselid MA and Schneier CE (2003) New HR Metrics: Scoring on the Business
Scorecard. Organizational Dynamics, 32(2):107-121.
Becker BE and Huselid MA (2006) Strategic human resources management: where do we go from here? Journal of
management, 32(6): 898-925.
Black, S.E. and Lynch, L.M. (2001). ‘How to Compete: The Impact of Workplace Practices and Information Technology on Productivity.’ Review of Economics and Statistics, August vol. 83(3), pp. 434-45
Boxall P (2014) The future of employment relations from the perspective of human resource management, Journal of
Industrial Relations 56(4): 578-593.
Boxall ,P and Purcell .J (2011) Strategy and Human Resource Management. New York: Palgrave Macmillan.
Bray M and Underhill E (2009) Industry differences in the neoliberal transformation of Australian industrial relations.
Industrial Relations Journal 40: 372-392.
Bryson, Alex, and Richard B. Freeman. 2013. “Employee Perceptions of Working Conditions and the Desire for Worker Representation in Britain and the US.” Journal of Labor Research 34 (1):1–29.
Campolieti, M., Gomez, R. & Gunderson, M. 2013. “Managerial Hostility and Attitudes Towards Unions: A Canada-
US Comparison” Journal of Labor Research. 34(1): 99-119.
Commission on Industrial Relations, 1916. Final Report and Testimony, Vol. 1. Washington: GPO
Commons, John. 1934a. Myself. Madison, University of Wisconsin Press.
Commons, John .1935. "Communism and Collective Democracy." American Economic Review, Vol. 25, No. 2, pp.
212-23.
Derber, Milton. 1967. Research on Labor Problems in the United States. New York: Random House.
Dodge, Y. 2006. The Oxford Dictionary of Statistical Terms. 6th edition. Oxford: Oxford University Press.
17
Dolman, B. 2009. “What Happened to Australia’s Productivity Surge?” The Australian Economic Review 42(3): 243-
63.
Fair Work Commission (2015) Annual Report 2014–15. Melbourne: Commonwealth of Australia.
Feldman, Herman. 1928. Survey of Research in the Field of Industrial Relations. New York: Social Science
Research Council.
Findlay P and Thompson P (2017) Contemporary work: Its meanings and demands. Journal of Industrial
Relations, 59(2): 122-138.
Forth J and McNabb R (2008) Workplace performance: a comparison of subjective and objective measures in the
2004 Workplace Employment Relations Survey. Industrial Relations Journal 39: 104-123.
Freeman RB Boxall PF and Haynes P (2007) What Workers Say: Employee voice in the Anglo-American workplace,
Ithaca: Cornell University Press.
Gittell, Jody Hoffer, Andrew VonNordenflycht and Thomas A. Kochan, (2004). “Mutual Gains or Zero Sum? Labor Relations and Firm Performance in the Airline Industry” Industrial Labor Relations Review Vol. 57, No. 2, pp.
163-180
Isaac J and Lansbury R (2005) Labour market deregulation: Rewriting the Rules, Sydney: Federation Press.
Kaplan, R. and D.Norton (2001) The Strategy-focused Organisation: how balanced scorecard companies thrive in the
new business environment. Boston: Harvard Business School Press.
Kaplan, R. and D.Norton (2007) “Using the balanced scorecard as a strategic management system” Harvard Business
Review, July/August, pp.150-61.
Kaplan, R. and D.Norton (2010) Kaplan and Norton on Strategic Management. Harvard: Harvard Business
Publishing.
Kaufman, B. (1993). The Origins and Evolution of the Field of Industrial Relations in the United States. Ithaca: ILR
Press.
Kaufman, B. (2004a). The Global Evolution of Industrial Relations. Geneva: ILO.
Kaufman, B (2004b). Theoretical Perspectives on Work and the Employment Relationship. Urbana-Champaign:
LERA.
Kaufman, B. (2010). “The Theoretical Foundation of Industrial Relations and its Implications for Labor Economics and Human Resource Management”, Industrial and Labor Relations Review, 64, 1: 74-108
Marchington, M, Wilkinson, A, Donnely, R and Kynighou, A (2016). Human Resource Management at Work. 6th
edition, London: Chartered Institute of Personnel and Development.
Mitchell R, Gahan P, Stewart A, Cooney S and Marshall S (2010) “The evolution of labour law in Australia:
Measuring the change.” Australian Journal of Labour Law 23: 61-93.
Pekarek A and Gahan P (2016) Unions and collective bargaining in Australia in 2015, Journal of Industrial Relations,
58(3) 356–371.
18
Van Wanrooy B, Oxenbridge S, Buchanan J and Jakubauskas M (2007) Australia at work: The benchmark report.
Workplace Research Centre, Sydney.
Verma, A. (2005) “What do unions do to the workplace? Union effects on management and HRM policies” Journal
of Labor Research 26(3): 415-449
Watson I (2013) “Bridges or traps? Casualisation and labour market transitions in Australia.” Journal of Industrial
Relations 55(1): 6-37.
Watson I (2016) “Wage inequality and neo-liberalism: the Australian experience.” Journal of Industrial Relations.
58(1): 131-149.
Webb, Sidney, and Beatrice Webb. 1897. Industrial Democracy, London, Longman, Greens.
Wilkinson A, Bailey,J and M. Mourell (2009) “Australian Industrial Relations in Transition”, Industrial Relations
Journal, 40:5, pp. 358-371.
19
Table 1. Comparison of SWERS and Australian Bureau of Statistics (ABS) Means, 2016
Percentage (%)
SWERS Employee Sample ABS Employment Data
Age
18-24 11 14
25-34 21 23
35-44 24 22
45-54 25 21
55-64 17 15
65> 3 4
Gender
Male 54 54
Female 46 46
Marital Status
Married 47 48
Not Married (Never Married,
Separated/Divorced, Widowed)
53 52
Country of Birth
Australia 75 71
Overseas 25 29
Education a
Advanced Degree (Masters, Doctorate) 9 11
Bachelor Degree 31 32
Associate Degree or Less (Certificate, High
School, Some High School)
58 57
Tenure
Less than 1 year 12 15
1-2 years 14 19
3-9 years 45 39
10 years or more 29 27
Sector b
Public 14 16
Private 86 84

20
Source: Authors calculations from State of the Workplace Employment Relations Survey (SWERS), 2016. Australia Bureau of
Statistics, 6333.0-Characteristics of Employment, Data Cube 6, August 2016. Downloaded:
http://www.abs.gov.au/AUSSTATS/[email protected]/DetailsPage/6333.0August%202016?OpenDocument
Notes: (a) In SWERS 2 percent of sample did not list educational level so column does not sum to 100 (b) Public sector refers to
federal, state and local government employees only and not public institutions such as schools or public utility while private is
all other categories.
21
Table 2. State of the Employment Relation Report Card in Australia, Employee and Employer Surveys Employer (ER) Survey Employee (EE) Survey
Average Median Average Median
Section Score Grade Score Grade Score Grade Score Grade
I. Companies/Workplaces: Performance Outcomes
1. Management has Optimized Financial Performance 5.08 B 5.00 B - - - -
2. Company/Workplace Financial Performance 5.28 B 5.00 B 4.91 B 5.00 B
3. Company/Workplace Competitive Position 4.29 C+ 4.00 C 4.62 B- 5.00 B
4. Change in Employment 4.62 B 4.00 C 3.92 C 4.00 C
5. Company/Workplace Operational Efficiency 5.08 B 5.00 B 4.17 C 4.00 C
6. Employer/Employee Value Proposition 5.33 B+ 5.00 B 4.66 B- 5.00 B
SECTION I SUBTOTAL 4.95 B 4.67 B- 4.46 C+ 4.59 C+
II. Employees: Satisfaction/Performance Outcomes
1. Job/Employment Satisfaction - - - - 4.61 C+ 5.00 B
2. Great Place to Work 5.39 B+ 6.00 A 4.91 B- 5.00 B
3. Pay/Benefits 4.85 B 5.00 B 4.32 C+ 4.50 C+
4. Employment Security 5.08 B 5.00 B 4.76 B- 5.00 B
5. Friendly/Sociable Workplace Environment 5.22 B+ 5.00 B 4.92 B- 5.00 B
6. Employee Advancement Opportunities 4.88 B 5.00 B 4.03 C 4.00 C
SECTION II SUBTOTAL 5.08 B 5.20 B+ 4.59 C+ 4.75 B-
III. Internal Management Capabilities/Performance
1. Quality of Management Team 5.19 B+ 5.00 B 4.35 C+ 4.00 C
2. Quality of People Management 5.09 B 5.00 B 4.14 C 4.00 C
3. Confidence/Trust in Management 5.16 B 5.00 B 4.10 C 4.00 C
4. Effectively Deals with Underperformer/Problem Employees 4.48 C+ 5.00 B 3.52 D+ 4.00 C
SECTION III SUBTOTAL 4.98 B 5.00 B 4.03 C 4.00 C
IV. Internal Workforce Capabilities/Performance
1. Quality of Workforce 5.40 B+ 5.00 B 4.85 B- 5.00 B
2. Engagement 5.22 B+ 5.00 B 4.67 B- 5.00 B
3. Provided with Good Job Resources 5.26 B+ 5.00 B 4.59 C+ 5.00 B
4. Low Employee Turnover 3.82 C- 4.00 C 4.77 B- 5.00 B
SECTION IV SUBTOTAL 4.92 B 4.75 B- 4.72 B- 5.00 B
V. Employer-Employee Relations and Climate
1. Employees Treated Fairly/Humanely - - - - 4.57 C+ 5.00 B
2. Mgrs’ Interest in Hearing EEs’ Gripes/Problems 5.14 B 5.00 B - - - -
3. Relations between Management and Employees 5.28 B+ 5.00 B 4.36 C+ 4.00 C
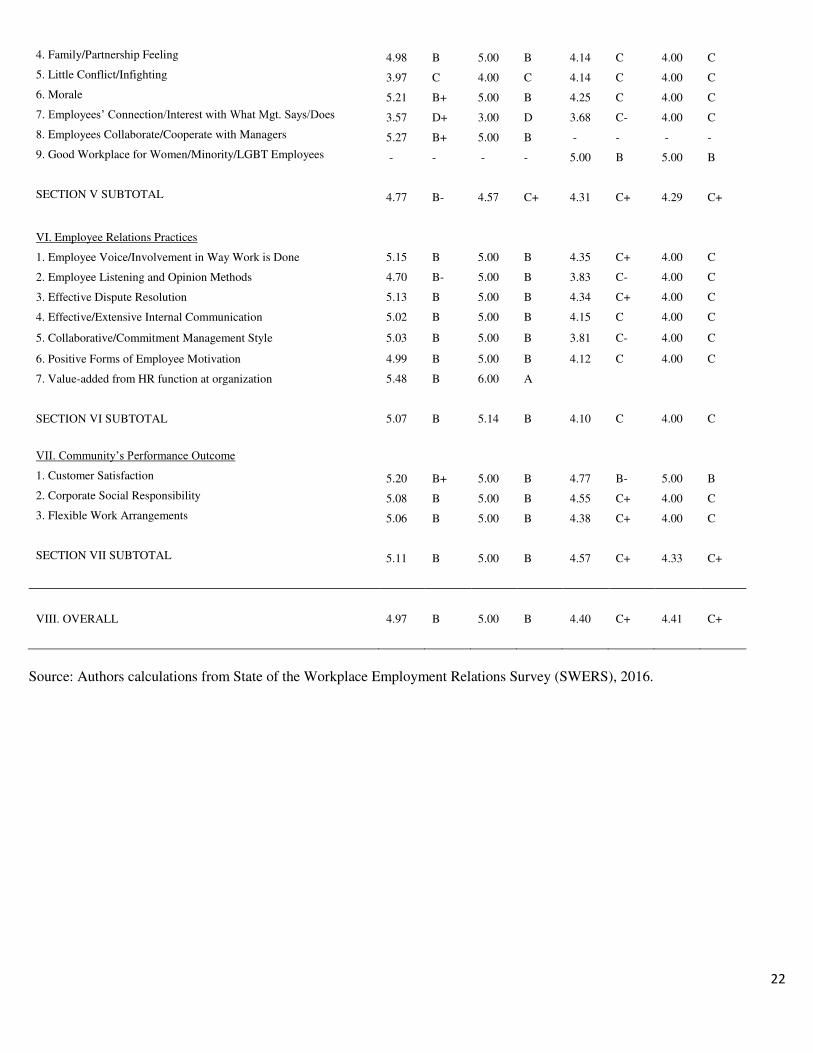
22
4. Family/Partnership Feeling 4.98 B 5.00 B 4.14 C 4.00 C
5. Little Conflict/Infighting 3.97 C 4.00 C 4.14 C 4.00 C
6. Morale 5.21 B+ 5.00 B 4.25 C 4.00 C
7. Employees’ Connection/Interest with What Mgt. Says/Does 3.57 D+ 3.00 D 3.68 C- 4.00 C
8. Employees Collaborate/Cooperate with Managers 5.27 B+ 5.00 B - - - -
9. Good Workplace for Women/Minority/LGBT Employees - - - - 5.00 B 5.00 B
SECTION V SUBTOTAL 4.77 B- 4.57 C+ 4.31 C+ 4.29 C+
VI. Employee Relations Practices
1. Employee Voice/Involvement in Way Work is Done 5.15 B 5.00 B 4.35 C+ 4.00 C
2. Employee Listening and Opinion Methods 4.70 B- 5.00 B 3.83 C- 4.00 C
3. Effective Dispute Resolution 5.13 B 5.00 B 4.34 C+ 4.00 C
4. Effective/Extensive Internal Communication 5.02 B 5.00 B 4.15 C 4.00 C
5. Collaborative/Commitment Management Style 5.03 B 5.00 B 3.81 C- 4.00 C
6. Positive Forms of Employee Motivation 4.99 B 5.00 B 4.12 C 4.00 C
7. Value-added from HR function at organization 5.48 B 6.00 A
SECTION VI SUBTOTAL 5.07 B 5.14 B 4.10 C 4.00 C
VII. Community’s Performance Outcome
1. Customer Satisfaction 5.20 B+ 5.00 B 4.77 B- 5.00 B
2. Corporate Social Responsibility 5.08 B 5.00 B 4.55 C+ 4.00 C
3. Flexible Work Arrangements 5.06 B 5.00 B 4.38 C+ 4.00 C
SECTION VII SUBTOTAL 5.11 B 5.00 B 4.57 C+ 4.33 C+
VIII. OVERALL 4.97 B 5.00 B 4.40 C+ 4.41 C+
Source: Authors calculations from State of the Workplace Employment Relations Survey (SWERS), 2016.
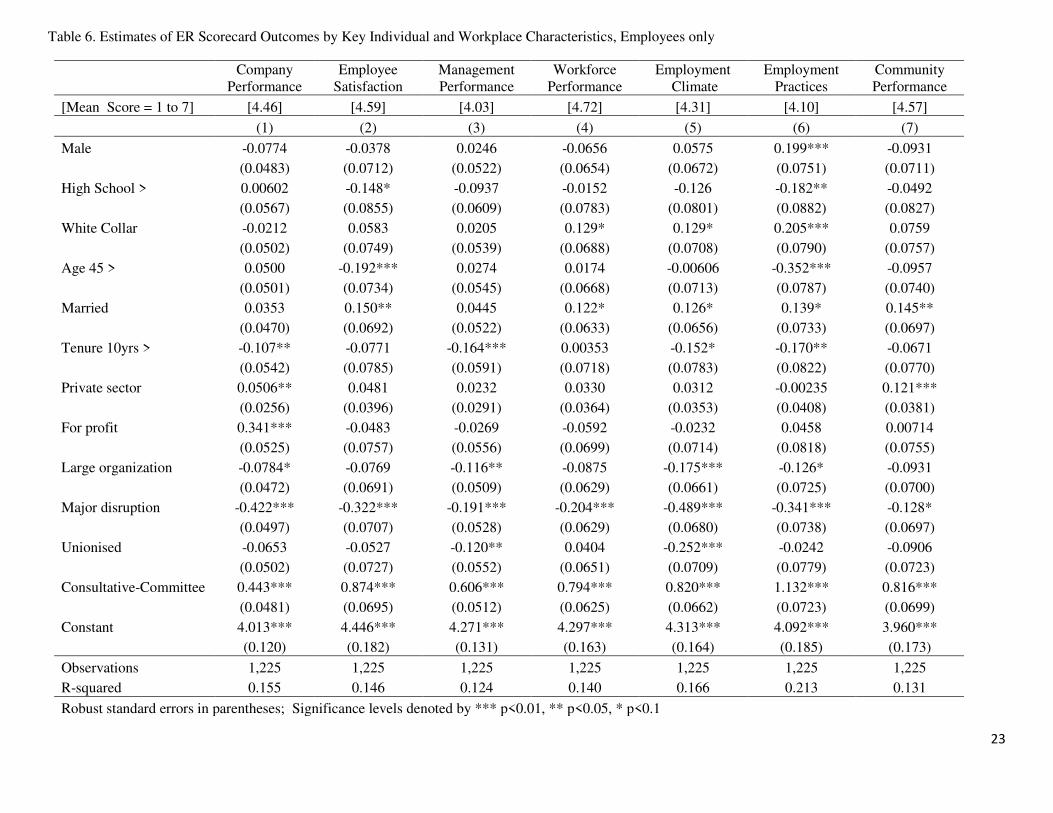
23
Table 6. Estimates of ER Scorecard Outcomes by Key Individual and Workplace Characteristics, Employees only
Company
Performance
Employee
Satisfaction
Management
Performance
Workforce
Performance
Employment
Climate
Employment
Practices
Community
Performance
[Mean Score = 1 to 7] [4.46] [4.59] [4.03] [4.72] [4.31] [4.10] [4.57]
(1) (2) (3) (4) (5) (6) (7)
Male -0.0774 -0.0378 0.0246 -0.0656 0.0575 0.199*** -0.0931
(0.0483) (0.0712) (0.0522) (0.0654) (0.0672) (0.0751) (0.0711)
High School > 0.00602 -0.148* -0.0937 -0.0152 -0.126 -0.182** -0.0492
(0.0567) (0.0855) (0.0609) (0.0783) (0.0801) (0.0882) (0.0827)
White Collar -0.0212 0.0583 0.0205 0.129* 0.129* 0.205*** 0.0759
(0.0502) (0.0749) (0.0539) (0.0688) (0.0708) (0.0790) (0.0757)
Age 45 > 0.0500 -0.192*** 0.0274 0.0174 -0.00606 -0.352*** -0.0957
(0.0501) (0.0734) (0.0545) (0.0668) (0.0713) (0.0787) (0.0740)
Married 0.0353 0.150** 0.0445 0.122* 0.126* 0.139* 0.145**
(0.0470) (0.0692) (0.0522) (0.0633) (0.0656) (0.0733) (0.0697)
Tenure 10yrs > -0.107** -0.0771 -0.164*** 0.00353 -0.152* -0.170** -0.0671
(0.0542) (0.0785) (0.0591) (0.0718) (0.0783) (0.0822) (0.0770)
Private sector 0.0506** 0.0481 0.0232 0.0330 0.0312 -0.00235 0.121***
(0.0256) (0.0396) (0.0291) (0.0364) (0.0353) (0.0408) (0.0381)
For profit 0.341*** -0.0483 -0.0269 -0.0592 -0.0232 0.0458 0.00714
(0.0525) (0.0757) (0.0556) (0.0699) (0.0714) (0.0818) (0.0755)
Large organization -0.0784* -0.0769 -0.116** -0.0875 -0.175*** -0.126* -0.0931
(0.0472) (0.0691) (0.0509) (0.0629) (0.0661) (0.0725) (0.0700)
Major disruption -0.422*** -0.322*** -0.191*** -0.204*** -0.489*** -0.341*** -0.128*
(0.0497) (0.0707) (0.0528) (0.0629) (0.0680) (0.0738) (0.0697)
Unionised -0.0653 -0.0527 -0.120** 0.0404 -0.252*** -0.0242 -0.0906
(0.0502) (0.0727) (0.0552) (0.0651) (0.0709) (0.0779) (0.0723)
Consultative-Committee 0.443*** 0.874*** 0.606*** 0.794*** 0.820*** 1.132*** 0.816***
(0.0481) (0.0695) (0.0512) (0.0625) (0.0662) (0.0723) (0.0699)
Constant 4.013*** 4.446*** 4.271*** 4.297*** 4.313*** 4.092*** 3.960***
(0.120) (0.182) (0.131) (0.163) (0.164) (0.185) (0.173)
Observations 1,225 1,225 1,225 1,225 1,225 1,225 1,225
R-squared 0.155 0.146 0.124 0.140 0.166 0.213 0.131
Robust standard errors in parentheses; Significance levels denoted by *** p<0.01, ** p<0.05, * p<0.1
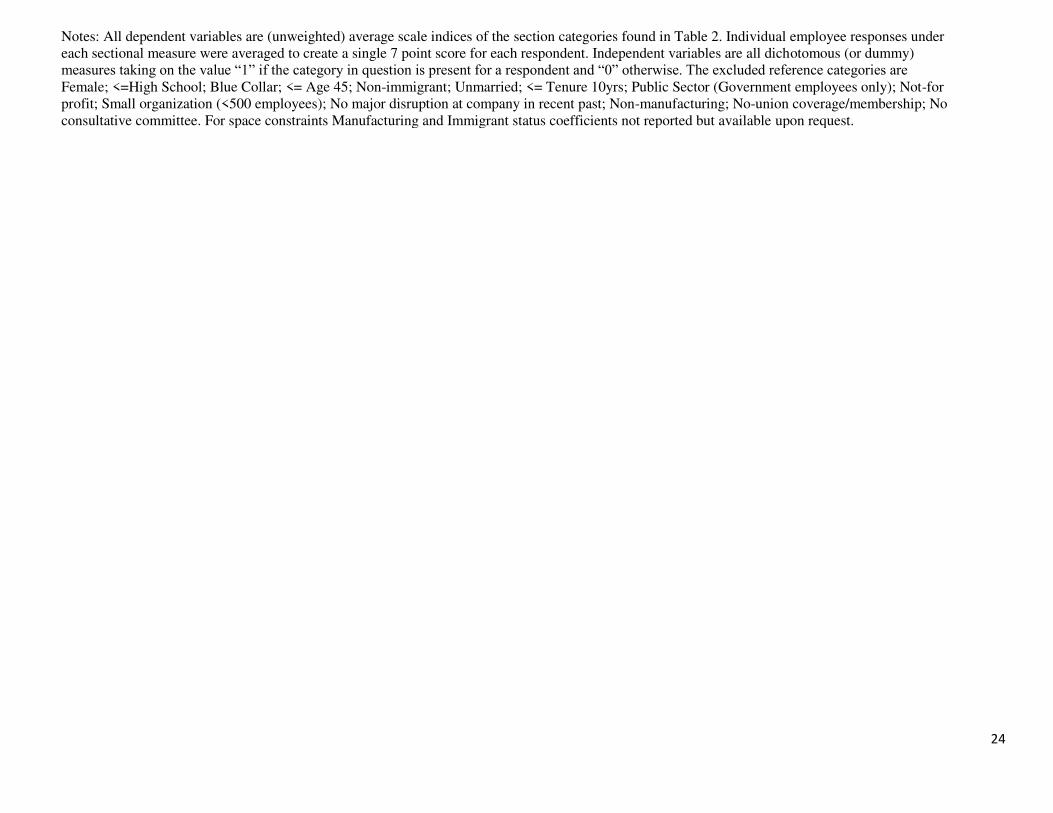
24
Notes: All dependent variables are (unweighted) average scale indices of the section categories found in Table 2. Individual employee responses under
each sectional measure were averaged to create a single 7 point score for each respondent. Independent variables are all dichotomous (or dummy)
measures taking on the value “1” if the category in question is present for a respondent and “0” otherwise. The excluded reference categories are Female; <=High School; Blue Collar; <= Age 45; Non-immigrant; Unmarried; <= Tenure 10yrs; Public Sector (Government employees only); Not-for
profit; Small organization (<500 employees); No major disruption at company in recent past; Non-manufacturing; No-union coverage/membership; No
consultative committee. For space constraints Manufacturing and Immigrant status coefficients not reported but available upon request.
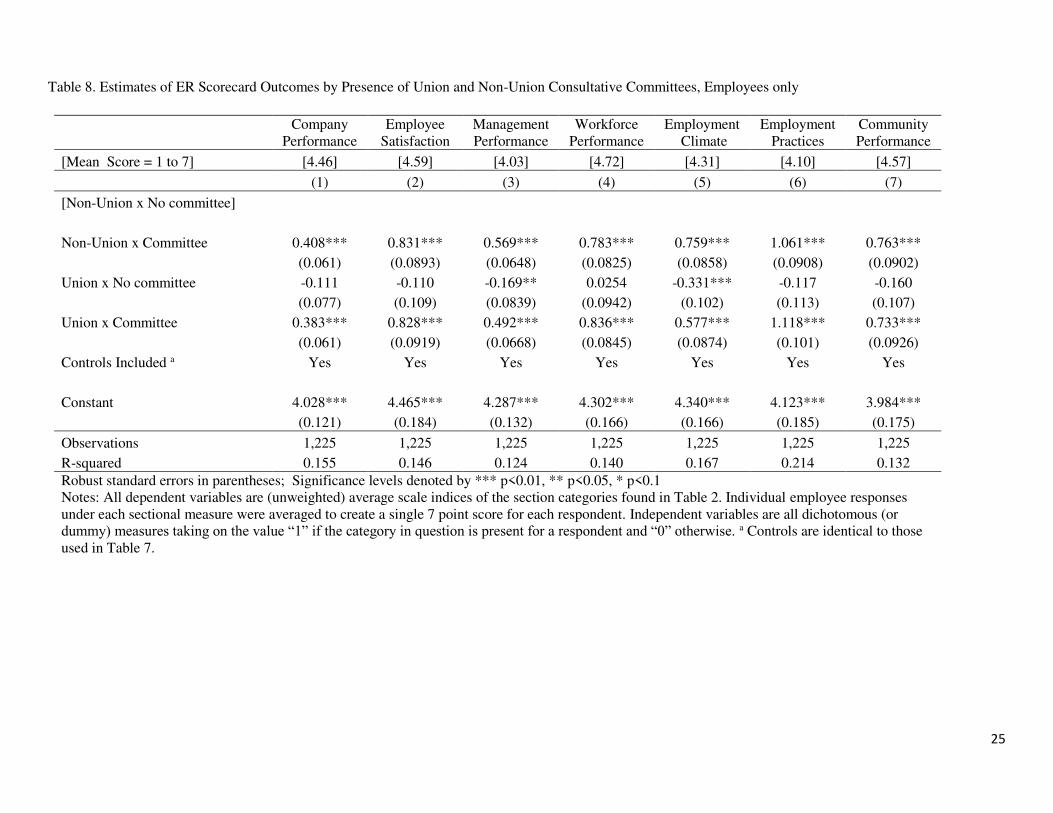
25
Table 8. Estimates of ER Scorecard Outcomes by Presence of Union and Non-Union Consultative Committees, Employees only
Company
Performance
Employee
Satisfaction
Management
Performance
Workforce
Performance
Employment
Climate
Employment
Practices
Community
Performance
[Mean Score = 1 to 7] [4.46] [4.59] [4.03] [4.72] [4.31] [4.10] [4.57]
(1) (2) (3) (4) (5) (6) (7)
[Non-Union x No committee]
Non-Union x Committee 0.408*** 0.831*** 0.569*** 0.783*** 0.759*** 1.061*** 0.763***
(0.061) (0.0893) (0.0648) (0.0825) (0.0858) (0.0908) (0.0902)
Union x No committee -0.111 -0.110 -0.169** 0.0254 -0.331*** -0.117 -0.160
(0.077) (0.109) (0.0839) (0.0942) (0.102) (0.113) (0.107)
Union x Committee 0.383*** 0.828*** 0.492*** 0.836*** 0.577*** 1.118*** 0.733***
(0.061) (0.0919) (0.0668) (0.0845) (0.0874) (0.101) (0.0926)
Controls Included a Yes Yes Yes Yes Yes Yes Yes
Constant 4.028*** 4.465*** 4.287*** 4.302*** 4.340*** 4.123*** 3.984***
(0.121) (0.184) (0.132) (0.166) (0.166) (0.185) (0.175)
Observations 1,225 1,225 1,225 1,225 1,225 1,225 1,225
R-squared 0.155 0.146 0.124 0.140 0.167 0.214 0.132
Robust standard errors in parentheses; Significance levels denoted by *** p<0.01, ** p<0.05, * p<0.1
Notes: All dependent variables are (unweighted) average scale indices of the section categories found in Table 2. Individual employee responses
under each sectional measure were averaged to create a single 7 point score for each respondent. Independent variables are all dichotomous (or
dummy) measures taking on the value “1” if the category in question is present for a respondent and “0” otherwise. a Controls are identical to those
used in Table 7.
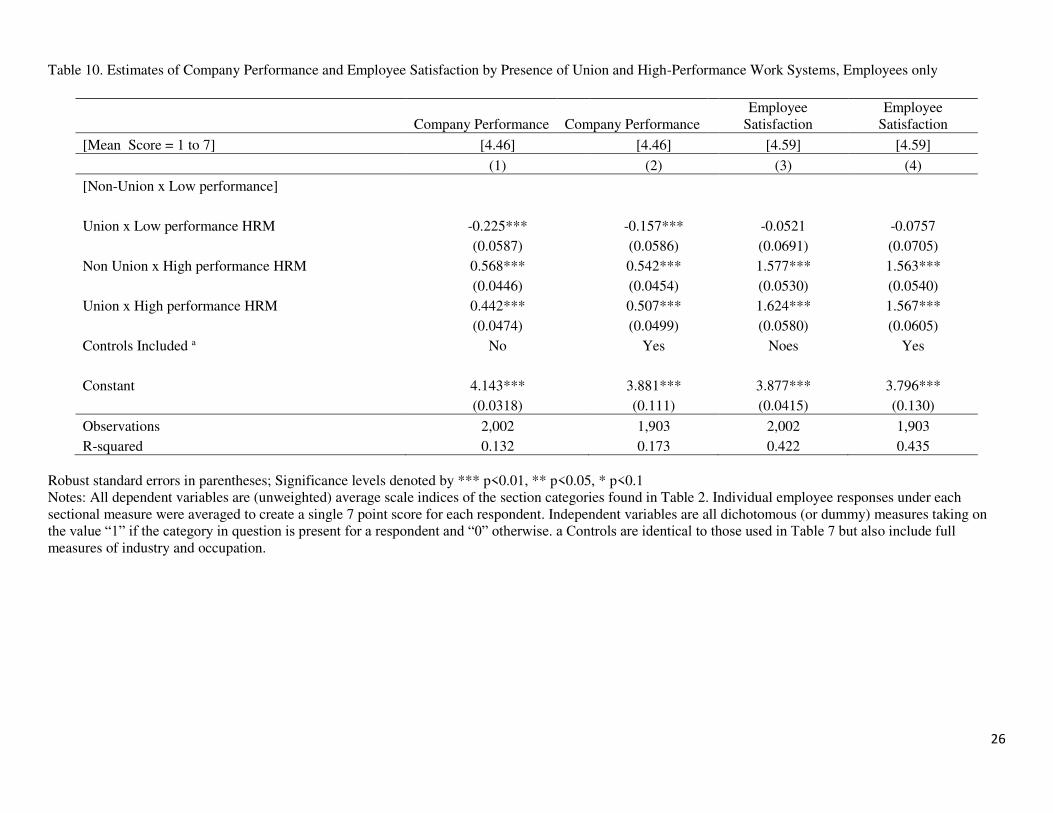
26
Table 10. Estimates of Company Performance and Employee Satisfaction by Presence of Union and High-Performance Work Systems, Employees only
Company Performance Company Performance
Employee
Satisfaction
Employee
Satisfaction
[Mean Score = 1 to 7] [4.46] [4.46] [4.59] [4.59]
(1) (2) (3) (4)
[Non-Union x Low performance]
Union x Low performance HRM -0.225*** -0.157*** -0.0521 -0.0757
(0.0587) (0.0586) (0.0691) (0.0705)
Non Union x High performance HRM 0.568*** 0.542*** 1.577*** 1.563***
(0.0446) (0.0454) (0.0530) (0.0540)
Union x High performance HRM 0.442*** 0.507*** 1.624*** 1.567***
(0.0474) (0.0499) (0.0580) (0.0605)
Controls Included a No Yes Noes Yes
Constant 4.143*** 3.881*** 3.877*** 3.796***
(0.0318) (0.111) (0.0415) (0.130)
Observations 2,002 1,903 2,002 1,903
R-squared 0.132 0.173 0.422 0.435
Robust standard errors in parentheses; Significance levels denoted by *** p<0.01, ** p<0.05, * p<0.1
Notes: All dependent variables are (unweighted) average scale indices of the section categories found in Table 2. Individual employee responses under each
sectional measure were averaged to create a single 7 point score for each respondent. Independent variables are all dichotomous (or dummy) measures taking on
the value “1” if the category in question is present for a respondent and “0” otherwise. a Controls are identical to those used in Table 7 but also include full
measures of industry and occupation.
27
Author Descriptions
Adrian Wilkinson is Professor and Director of the Centre for Work, Organisation and Wellbeing at Griffith University, Australia. Prior to
his 2006 appointment, Adrian worked at Loughborough University in the UK where he was Professor of Human Resource Management from
1998, and Director of Research for the Business School.
Michael Barry is Professor of Employment Relations in the Griffith Business School. Michael was Foundation Head of the Department of
Employment Relations and Human Resources at Griffith, from 2010-2016..
Rafael Gomez is Professor of Employment Relations at the University of Toronto and since 2015 has been the Director of the Centre for
Industrial Relations and Human Resources.
Bruce E. Kaufman is Professor Emeritus at Georgia State University and Principal Research Fellow, Griffith Business School. Kaufman is
co-editor of the annual research volume Advances in Industrial and Labor Relations. In 2009 he received the “Excellence in Teaching” award from the Andrew Young School; he also received the “Alumni Distinguished Professor” award – the highest honor given each year to a GSU
faculty member.
28
ENDNOTES
1 In the paper we refer to industrial and employment relations interchangeably and do so noting the ‘broad’ definition of the field as
articulated in Kaufman (2010:75) which includes “….the study the employment relationship [which means] not only collective bargaining
and union studies but also in equal measure the study of personnel/human resource management and labor/employment law.”
2 The scorecard approach is clearly not the only method employed by IR scholars. Bryson and Freeman (2013) develop a single scalar
measure of employee perceptions of poor working conditions in order to examine the workplace and demographic correlates of those
perceptions, and analyze their relationship with the desire for unions. The scalar measure allows the authors to compare perceptions across
two countries (UK and US) despite differences in the specific questions in the surveys. The authors find that the distribution of perceptions of
poor working conditions looks similar in both countries: it is skewed to the left with many workers reporting ‘zero’ poor conditions and with
a few reporting many. Using linked employer-employee data for Britain the authors show that much of the variation in employee perceptions
of poor working conditions arises from their workplace, some of which can be traced to specific workplace practices.
3 Employee respondents were required to meet the following qualifications to participate: i) ≥18 years old; ii) be employed and work at least 20 hours per week; iii) no higher status than lower management; and iv) work for an organization with more than 20 employees. The
employee survey achieved representativeness according to targets set for age, gender and industry. The employer survey employed similar
qualifications to the employee survey in terms of age and organization size but added requirements for: Middle-Level management or higher;
Manage a minimum of 11 employees; and Rate themselves as somewhat or more knowledgeable of the employee-employer relationships at
their organization. The representativeness of the survey was achieved for employers on the basis of targets for company size and industry.
4 The individual performance indicators in our study are aggregated into an organizational performance outcome index.
5 Online Appendix available online first at: http://journals.sagepub.com/home/jir
6 For sections I, III, V and VII the sectional wording was as follows: “The questions that follow ask about your company/organization. We
recognize, however, that you may not have information or knowledge for the entire company/organization if it is large, diversified, or has
multiple locations. So, please use your best judgment and answer the questions for the largest part/slice of your company/organization for
which you can provide reasonably accurate and knowledgeable answers concerning employees. If you are knowledgeable about employees
for the entire company/organization, then please answer for it.” For sections II, IV and VI the wording was: “So we get meaningful
responses, we need you to answer the questions in this section for the largest group of employees (non-management) you are knowledgeable
about who are reasonably comparable with each other in terms of jobs/skills AND representative of the main part of the workforce.”
7 Online Appendix available online first at: http://journals.sagepub.com/home/jir
8 Responses collected on all four attributes were included in the EE survey but only on the respondent’s gender in the EMR survey since questions on education, occupation, and union status were not applied in the employer sample. We restricted socio-demographic controls to
gender, age and managerial level on the employer survey.
9 The union membership question on the employee survey was designed to pick up all employees that are members and/or covered by a
collective agreement at their existing workplace so the actual wording includes both categories. We have shortened it here to indicate that we
have all covered employees which therefore includes covered workers that are dues and non-dues paying members as well.
10 Online Appendix available online first at: http://journals.sagepub.com/home/jir
11 The employee consultation question was asked in the same way to employers and employees: “Has the company/organization put in place
for employee consultation and voice some kind of internal joint consultative committee, staff advisory association, plant council, or
workplace employee forum so managers and elected/selected employee representatives can meet and discuss issues of relevance?”
12 Online Appendix available online first at: http://journals.sagepub.com/home/jir
13 Online Appendix available online first at: http://journals.sagepub.com/home/jir
14 Online Appendix available online first at: http://journals.sagepub.com/home/jir
15 Online Appendix available online first at: http://journals.sagepub.com/home/jir