taks review objective 2. african american population in selected cities, 1910-1930...
TRANSCRIPT

TAKS ReviewTAKS Review
Objective 2Objective 2

African American Population in Selected Cities, 1910-1930African American Population in Selected Cities, 1910-1930
19101910 19201920 19301930 IncreaseIncrease
1910-19301910-1930
ChicagoChicago 44,10344,103 109,458109,458 233,903233,903 430%430%ClevelandCleveland 8,4488,448 34,45134,451 71,89971,899 751%751%DetroitDetroit 5,7415,741 40,83840,838 120,066120,066 1,991%1,991%New York New York CityCity
91,70991,709 152,467152,467 327,706327,706 257%257%
PhiladelphiaPhiladelphia 84,45984,459 134,229134,229 219,599219,599 160%160%PittsburghPittsburgh 25,62325,623 37,72637,726 54,98354,983 115%115%
According to the table, the northern city that experienced the largest percentageGrowth of African American population from 1910 to 1930 was—A. Cleveland B. New York City C. Pittsburg D. Detroit

Correct answer: DCorrect answer: D
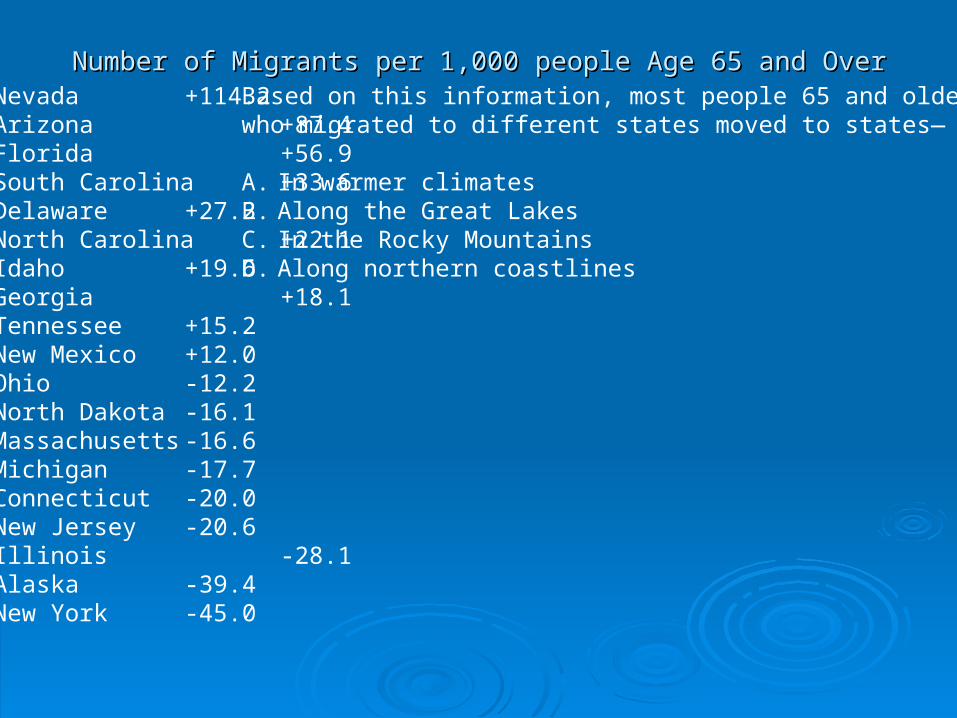
Number of Migrants per 1,000 people Age 65 and OverNumber of Migrants per 1,000 people Age 65 and OverNevada +114.2Arizona +87.4Florida +56.9South Carolina +33.6Delaware +27.2North Carolina +22.1Idaho +19.6Georgia +18.1Tennessee +15.2New Mexico +12.0Ohio -12.2North Dakota -16.1Massachusetts -16.6Michigan-17.7Connecticut -20.0New Jersey -20.6Illinois -28.1Alaska -39.4New York -45.0
Based on this information, most people 65 and olderwho migrated to different states moved to states—
A. In warmer climatesB. Along the Great LakesC. In the Rocky MountainsD. Along northern coastlines

Correct answer: ACorrect answer: A

Many US farmers from the Great Plains left their Many US farmers from the Great Plains left their farms and migrated to California in the 1930s farms and migrated to California in the 1930s because of--because of--
A.A. The excessively high cost of new farm The excessively high cost of new farm machinerymachinery
B.B. Federal and state assistance programs Federal and state assistance programs available in Californiaavailable in California
C.C. Drought and dust storms that destroyed their Drought and dust storms that destroyed their cropscrops
D.D. The availability of factory jobs in CaliforniaThe availability of factory jobs in California

Correct answer: CCorrect answer: C

Hay-PauncefortTreaty
authorized itsconstruction
Hay-PauncefortTreaty
authorized itsconstruction
A series oflocks built
to raise andlower ships
A series oflocks built
to raise andlower ships
Swamps drainedin the 10-mile-wide
strip leased toThe U. S.
Swamps drainedin the 10-mile-wide
strip leased toThe U. S.
Aprimary goal of
President TheodoreRoosevelt
Aprimary goal of
President TheodoreRoosevelt
??????
Which of the following best completesthe diagram?
A. Hoover DamB. Golden Gate BridgeC. Panama CanalD. Transcontinental
Railroad

Correct answer: CCorrect answer: C

One social effect of the large migration of One social effect of the large migration of African-Americans to US industrial centersAfrican-Americans to US industrial centersbetween 1940-1950 was—between 1940-1950 was—A.A. Increased racial tensionIncreased racial tensionB.B. The peaceful integration of southern The peaceful integration of southern
schoolsschoolsC.C. A 20A 20thth century renaissance in the arts century renaissance in the artsD.D. Improved public transportation systemsImproved public transportation systems

Correct answer: ACorrect answer: A

What was one result of the rapid growth of What was one result of the rapid growth of US cities in the early 20US cities in the early 20thth century? century?
A.A. Fewer educational opportunities were Fewer educational opportunities were
availableavailable
B.B. Prices for consumer goods became Prices for consumer goods became unstableunstable
C.C. Farm production declined significantlyFarm production declined significantly
D.D. The population in slums increasedThe population in slums increased

Correct answer: DCorrect answer: D

The migration of thousands of African The migration of thousands of African Americans to the North in the early 20Americans to the North in the early 20thth century can best be by explained by—century can best be by explained by—
A.A. The availability of cheap farmland in the The availability of cheap farmland in the NorthNorth
B.B. The closing of factories in southern The closing of factories in southern statesstates
C.C. Decreased availability of government Decreased availability of government land for sharecropping in the Southland for sharecropping in the South

Correct answer: DCorrect answer: D

Which of the following Which of the following themes does the themes does the photograph above photograph above illustrate?illustrate?
A.A. The US closes its The US closes its borders to immigrantsborders to immigrants
B.B. Americans are resistant Americans are resistant to Asian businessesto Asian businesses
C.C. Immigration leads to Immigration leads to ethnic neighborhoods in ethnic neighborhoods in US citiesUS cities
D.D. The US experiences a The US experiences a decline in Asian decline in Asian immigrationimmigration

Correct answer: CCorrect answer: C

Which of the following Which of the following best completes the best completes the diagram below?diagram below?
A.A. IntegrationIntegration
B.B. ProgressivismProgressivism
C.C. ImperialismImperialism
D.D. ImmigrationImmigrationResulted in a
housing shortagein major cities
Resulted in the establishment
of ethnicneighborhoods
Introduced newlanguages, foods,
and religions
Led to increased acts of prejudice
and discrimination
?

Correct answer: DCorrect answer: D
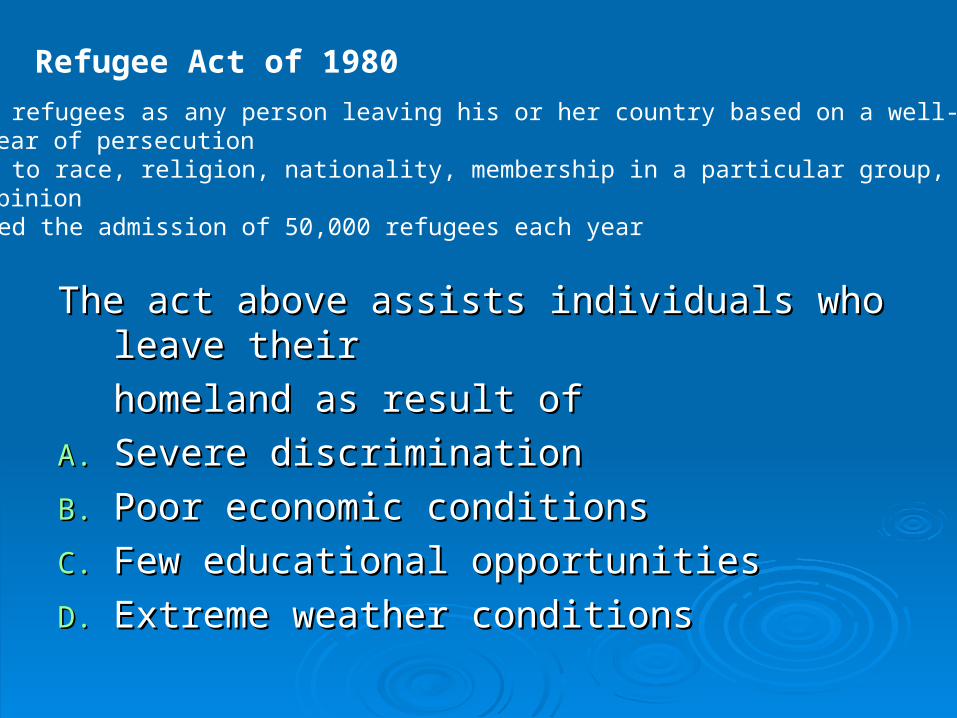
The act above assists individuals who leave theirThe act above assists individuals who leave their
homeland as result of homeland as result of
A.A. Severe discriminationSevere discrimination
B.B. Poor economic conditionsPoor economic conditions
C.C. Few educational opportunitiesFew educational opportunities
D.D. Extreme weather conditionsExtreme weather conditions
Refugee Act of 1980Defines refugees as any person leaving his or her country based on a well-founded
fear of persecutionApplies to race, religion, nationality, membership in a particular group, or political
opinionPredicted the admission of 50,000 refugees each year

Correct answer: ACorrect answer: A

Which of the following Which of the following best completes the best completes the diagram?diagram?
A.A. Population growthPopulation growth
B.B. US Trade PoliciesUS Trade Policies
C.C. Supply-side Supply-side EconomicsEconomics
D.D. Immigration Immigration RestrictionsRestrictions
Dwindling resources
LimitedWaterSupply
AirPollution
Overcrowded Cities
?

Correct answer: ACorrect answer: A

As a result of the passage of the Homestead Act in As a result of the passage of the Homestead Act in 1862, the Great Plains1862, the Great Plains
A.A. Became the most populated region of the USBecame the most populated region of the US
B.B. Became the location of the country’s largest Became the location of the country’s largest urban centersurban centers
C.C. Preserved through conservation measuresPreserved through conservation measures
D.D. Was developed into a major agricultural areaWas developed into a major agricultural area

Correct answer: DCorrect answer: D

One reason the earliest civilization developed at One reason the earliest civilization developed at the eastern end of the Fertile Crescent in the eastern end of the Fertile Crescent in present-day Iraq was that—present-day Iraq was that—
A.A. Crops grew well in desert conditionsCrops grew well in desert conditions
B.B. Game for hunting had become too scarce Game for hunting had become too scarce elsewhereelsewhere
C.C. The rivers in the area provided favorable The rivers in the area provided favorable conditions for agricultureconditions for agriculture
D.D. Many people migrated into the area from IndiaMany people migrated into the area from India

Correct answer: CCorrect answer: C

One of the main reasons that many people One of the main reasons that many people relocated from Europe to North America relocated from Europe to North America during the 17during the 17thth and 18 and 18thth centuries was the centuries was the availability ofavailability of
A.A. Inexpensive ship faresInexpensive ship fares
B.B. Fertile farmland in new coloniesFertile farmland in new colonies
C.C. Cheap labor from native sourcesCheap labor from native sources
D.D. Government sponsored loansGovernment sponsored loans

Correct answer: BCorrect answer: B
Which event is an example of geography Which event is an example of geography playing an important role in the defeat of an playing an important role in the defeat of an invading army?invading army?
A.A. The North Korean invasion of South Korea in The North Korean invasion of South Korea in 19501950
B.B. The Japanese invasion of Manchuria in 1931The Japanese invasion of Manchuria in 1931
C.C. The German invasion of the Soviet Union in The German invasion of the Soviet Union in 19411941
D.D. The US invasion of Cuba in 1898The US invasion of Cuba in 1898

Correct answer: CCorrect answer: C

What pattern can be What pattern can be deduced from the deduced from the information in the information in the chart?chart?
A.A. The plague spread The plague spread primarily from north to primarily from north to southsouth
B.B. The plague spread The plague spread primarily from west to primarily from west to easteast
C.C. The plague spread The plague spread primarily from coastal primarily from coastal areas to inland onesareas to inland ones
D.D. The plague spread The plague spread primarily from primarily from Christian countries to Christian countries to Muslim onesMuslim ones
YearYear RegionsRegions
AffectedAffected
13471347 Black Sea coastBlack Sea coast
Aegean Sea coastAegean Sea coast
Southern French coastSouthern French coast
Western Italian coastWestern Italian coast
13481348 (in addition to above)(in addition to above)
N. African coastN. African coast
E. Mediterranean coastE. Mediterranean coast
Aegean PeninsulaAegean Peninsula
E. and N. SpainE. and N. Spain
S. and W. FranceS. and W. France
Central and N. ItalyCentral and N. Italy
S. British coastS. British coast
13491349 (in addition to above)(in addition to above)
W. SpainW. Spain
Central and E. FranceCentral and E. France
Central Britain, IrelandCentral Britain, Ireland
Norway/Denmark coastsNorway/Denmark coasts
Spread of Bubonic Plague,1347-1349

Correct answer: CCorrect answer: C

17th centuryefforts to limittobaccoconsumption
Austria and Russia jailed, fined or tortured individualswho smoked in public
King James I of England wrote about tobacco’s addictivePowers and increased taxes on the sale of tobacco
Tobacco was prohibited in Japan
Turkey, Mongolia, and China instituted the death penaltyfor the use of tobacco
Christopher Columbus is credited with introducing tobacco to Europe after his voyage in 1492. Based on the diagram above, it can be supported that tobacco consumption—A. Resulted in restrictive trade policies between European
powersB. Led to the economic policy of mercantilismC.Extended to many areas of the worldD.Emerged from the development of representative government

Correct answer: CCorrect answer: C

The information to the The information to the left supports the idea left supports the idea that the use of that the use of piñatas during piñatas during celebrations is a celebrations is a result of result of
A.A. Free tradeFree trade
B.B. Conservation Conservation measuresmeasures
C.C. Cultural diffusionCultural diffusion
D.D. Technological Technological innovationsinnovations
History of the Piñata
Piñata comes from the Italian word pignatta,
which means “fragile pot”
Piñatas were originallymade of clay pots
Piñatas spread from Italyto Spain
Spanish missionaries Brought piñatas to
Mexico

Correct answer: CCorrect answer: C
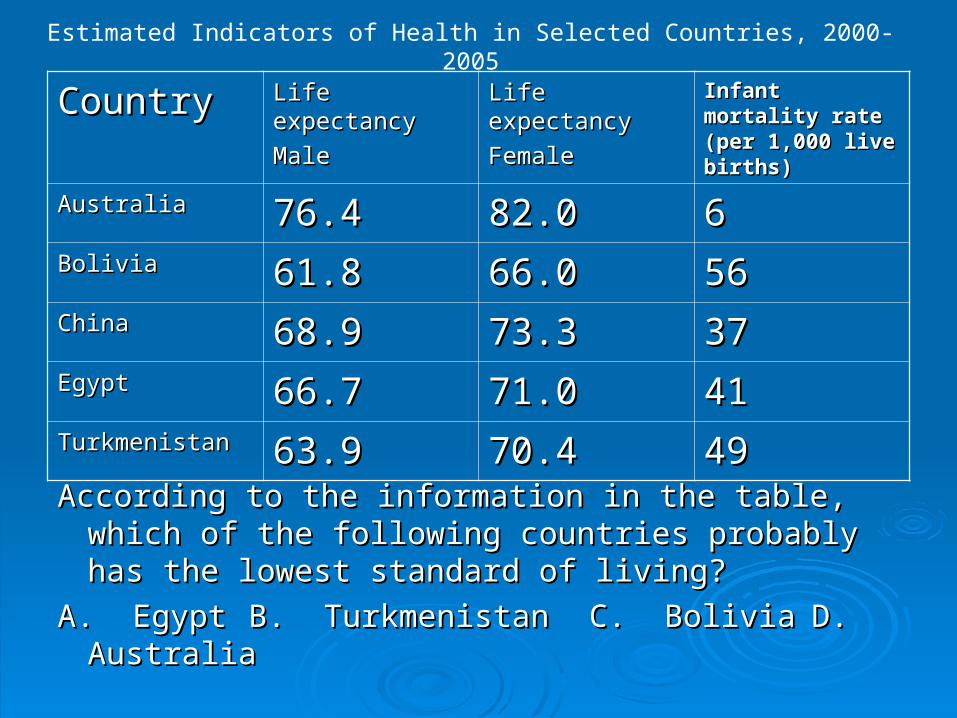
According to the information in the table, which of the According to the information in the table, which of the following countries probably has the lowest standard of following countries probably has the lowest standard of living?living?
A. EgyptA. Egypt B. TurkmenistanB. Turkmenistan C. Bolivia C. Bolivia D. AustraliaD. Australia
CountryCountry Life expectancyLife expectancy
MaleMale
Life expectancyLife expectancy
FemaleFemale
Infant mortality Infant mortality rate (per 1,000 live rate (per 1,000 live births)births)
AustraliaAustralia 76.476.4 82.082.0 66BoliviaBolivia 61.861.8 66.066.0 5656ChinaChina 68.968.9 73.373.3 3737EgyptEgypt 66.766.7 71.071.0 4141TurkmenistanTurkmenistan 63.963.9 70.470.4 4949
Estimated Indicators of Health in Selected Countries, 2000-2005

Correct answer: CCorrect answer: C

It can be concluded from the It can be concluded from the diagram that the voyage diagram that the voyage of Christopher of Christopher Columbus to the West Columbus to the West Indies set in motion—Indies set in motion—
A.A. A series of trade A series of trade agreements between agreements between the seafaring nations of the seafaring nations of AsiaAsia
B.B. Pattern of cultural Pattern of cultural diffusion that still affect diffusion that still affect the way people livethe way people live
C.C. Decreased interaction Decreased interaction between Europe and the between Europe and the AmericasAmericas
D.D. Business practices that Business practices that favored an isolationist favored an isolationist policy abroadpolicy abroad
The Columbian ExchangeOLD WORLD
SugarcaneBananasWheatRice
HorsesChickens
Cattle Pigs
SmallpoxMeasles
Common coldChicken pox
NEW WORLDCorn
PotatoesSquashPeppersTurkeysLlamas
Guinea pigsAlpacasSyphilisTobaccoCacao Chicle

Correct answer: BCorrect answer: B
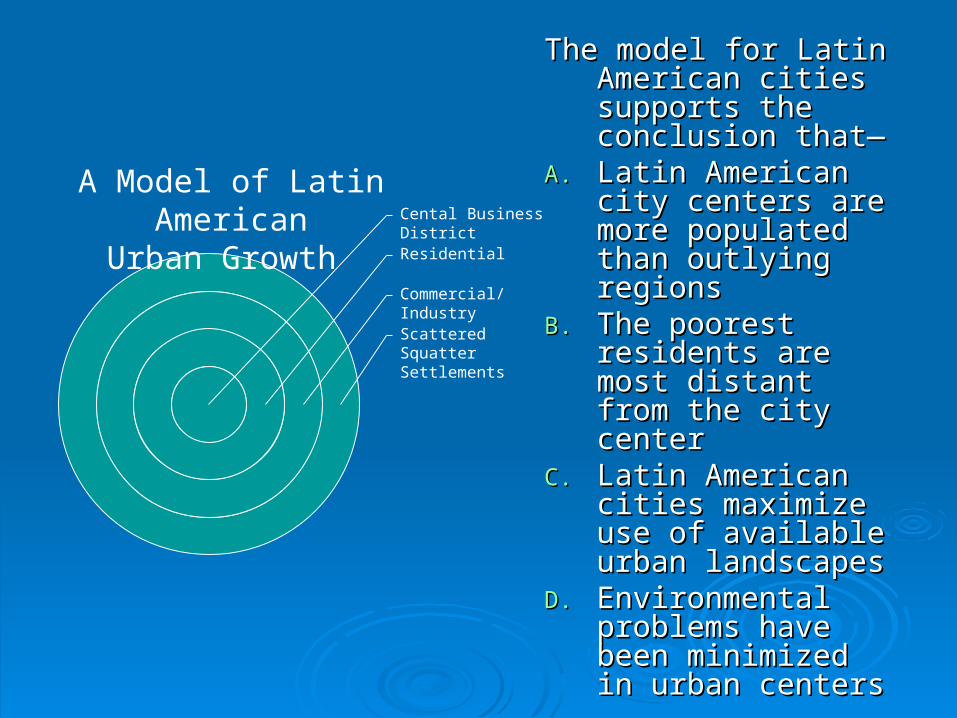
The model for Latin The model for Latin American cities American cities supports the supports the conclusion that—conclusion that—
A.A. Latin American city Latin American city centers are more centers are more populated than populated than outlying regionsoutlying regions
B.B. The poorest The poorest residents are most residents are most distant from the city distant from the city centercenter
C.C. Latin American cities Latin American cities maximize use of maximize use of available urban available urban landscapeslandscapes
D.D. Environmental Environmental problems have been problems have been minimized in urban minimized in urban centerscenters
ScatteredSquatterSettlements
Commercial/Industry
Residential
Cental Business District
A Model of Latin AmericanUrban Growth

Correct answer: BCorrect answer: B

In 1860, all U S cities with populations greater than250,000 were located
A. South of the Mason-Dixon lineB. West of the territoriesC.Near the Great Lakes
D. In the Northeast

Correct answer: DCorrect answer: D

How did the introduction of the assembly line How did the introduction of the assembly line affect the US automobile industry in the early affect the US automobile industry in the early 2020thth century? century?
A.A. There was an increase in federal regulation of There was an increase in federal regulation of automobile productionautomobile production
B.B. The US began to import large numbers of carsThe US began to import large numbers of carsC.C. There was a decrease in demand for unskilled There was a decrease in demand for unskilled
laborlaborD.D. The demand for cars increased as they The demand for cars increased as they
became affordable for the average personbecame affordable for the average person

Correct answer: DCorrect answer: D

The opening of the Erie Canal in 1825—The opening of the Erie Canal in 1825—
A. Ended the use of natural waterways for A. Ended the use of natural waterways for tradetrade
B. Increased trade between the Midwest B. Increased trade between the Midwest and the East Coastand the East Coast
C. Diminished the importance of railroadsC. Diminished the importance of railroads
D. Improved the delivery of cotton and D. Improved the delivery of cotton and rice to markets in the Southrice to markets in the South

Correct answer: BCorrect answer: B
The invention of the light bulb contributed to The invention of the light bulb contributed to industrial growth in the US by making it industrial growth in the US by making it possible forpossible for
A.A. Production to continue at nightProduction to continue at night
B.B. Workers to light their homesWorkers to light their homes
C.C. Electric companies to raise their pricesElectric companies to raise their prices
D.D. Cities to reduce crime by lighting city Cities to reduce crime by lighting city streetsstreets

Correct answer: ACorrect answer: A

The intellectual ideas of Renaissance The intellectual ideas of Renaissance thinkers spread throughout Europe thinkers spread throughout Europe largely as a result of thelargely as a result of the
A.A. Voyages of explorationVoyages of exploration
B.B. Invention of the printing pressInvention of the printing press
C.C. Opening of the first universitiesOpening of the first universities
D.D. Teachings of the Roman Catholic ChurchTeachings of the Roman Catholic Church

Correct answer: BCorrect answer: B

Which statement can best be Which statement can best be supported from the supported from the information in the table about information in the table about the population change of the population change of these cities?these cities?
A.A. The ranking of the 10 most The ranking of the 10 most populous cities remained populous cities remained constant form 1990 to 2000constant form 1990 to 2000
B.B. The ranking for Phoenix, AZ The ranking for Phoenix, AZ remained the sameremained the same
C.C. Three cities in TX are ranked Three cities in TX are ranked among the 10 most populous among the 10 most populous citiescities
D.D. The city that showed the The city that showed the greatest percent change greatest percent change from 1990 to 2000 was from 1990 to 2000 was Philadelphia, PAPhiladelphia, PA
Population Change for the 10 Most Populous US Cities
City and City and
StateState
19901990
PopulationPopulation
2000 2000
PopulationPopulation
Percent Percent
ChangeChange
New York,New York,
New YorkNew York
7,322,5647,322,564 8,008,2788,008,278 9.49.4Los Los Angeles, Angeles, CACA
3,485,3983,485,398 3,694,8203,694,820 6.06.0
Chicago,Chicago,
ILIL
2,783,7262,783,726 2,896,0162,896,016 4.04.0Houston,Houston,
TXTX
1,630,5531,630,553 1,953,6311,953,631 19.819.8Philadel-Philadel-
phia, PAphia, PA
1,585.5771,585.577 1,517,5501,517,550 -4.3-4.3Phoenix,Phoenix,
AZAZ
983,403983,403 1,321,0451,321,045 34.334.3San DiegoSan Diego
CACA
1,110,5491,110,549 1,223,4001,223,400 10.210.2Dallas,Dallas,
TXTX
1,006,8771,006,877 1,188,5801,188,580 18.018.0San San Antonio,TXAntonio,TX
935,933935,933 1,144,6461,144,646 22.322.3Detroit,Detroit,
MIMI
1,027,9741,027,974 951,270951,270 -7.5-7.5

Correct answer: CCorrect answer: C